Embed Size (px)
Citation preview
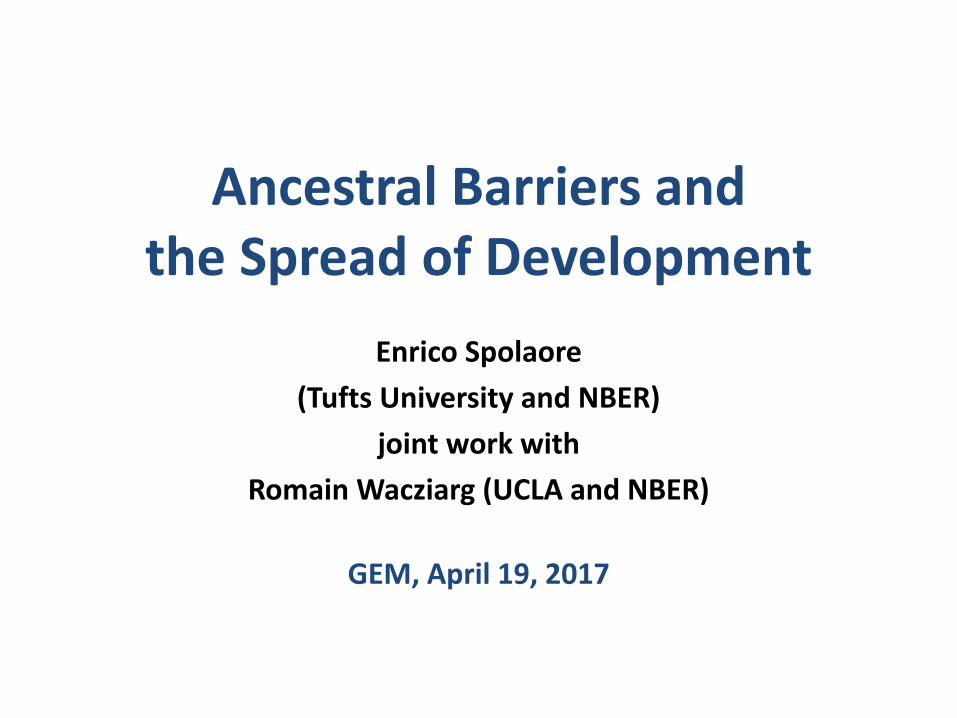
Ancestral Barriers and the Spread of Development
Enrico Spolaore (Tufts University and NBER)
joint work with Romain Wacziarg (UCLA and NBER)
GEM, April 19, 2017
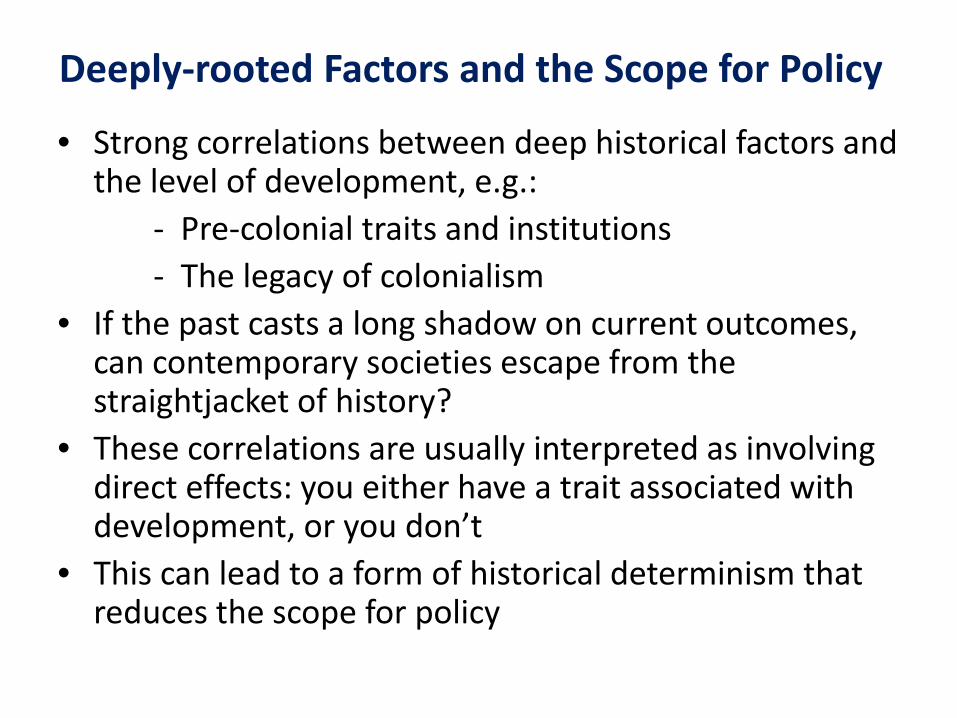
Deeply-rooted Factors and the Scope for Policy
• Strong correlations between deep historical factors and the level of development, e.g.:
- Pre-colonial traits and institutions - The legacy of colonialism • If the past casts a long shadow on current outcomes,
can contemporary societies escape from the straightjacket of history?
• These correlations are usually interpreted as involving direct effects: you either have a trait associated with development, or you don’t
• This can lead to a form of historical determinism that reduces the scope for policy
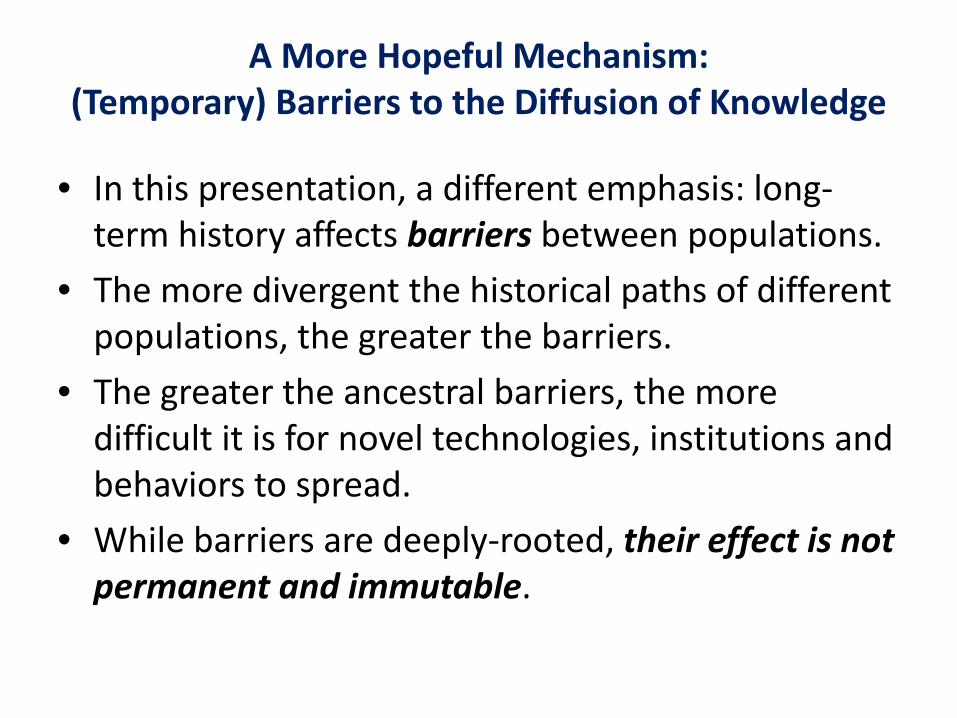
A More Hopeful Mechanism: (Temporary) Barriers to the Diffusion of Knowledge
• In this presentation, a different emphasis: long-term history affects barriers between populations.
• The more divergent the historical paths of differentpopulations, the greater the barriers.
• The greater the ancestral barriers, the moredifficult it is for novel technologies, institutions andbehaviors to spread.
• While barriers are deeply-rooted, their effect is notpermanent and immutable.
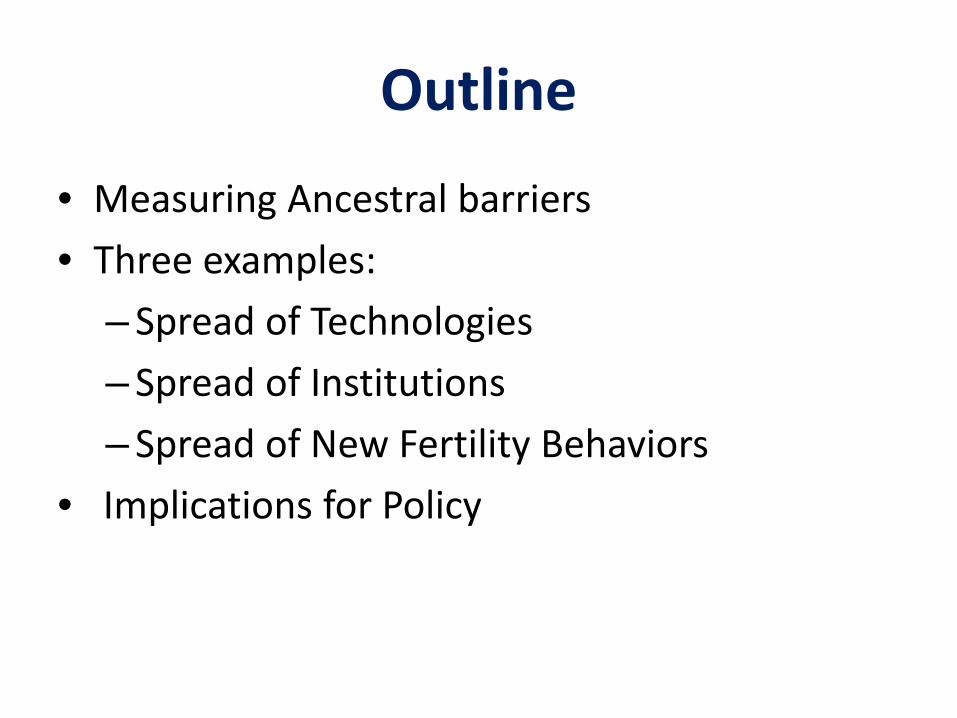
Outline
• Measuring Ancestral barriers • Three examples:
– Spread of Technologies – Spread of Institutions – Spread of New Fertility Behaviors
• Implications for Policy
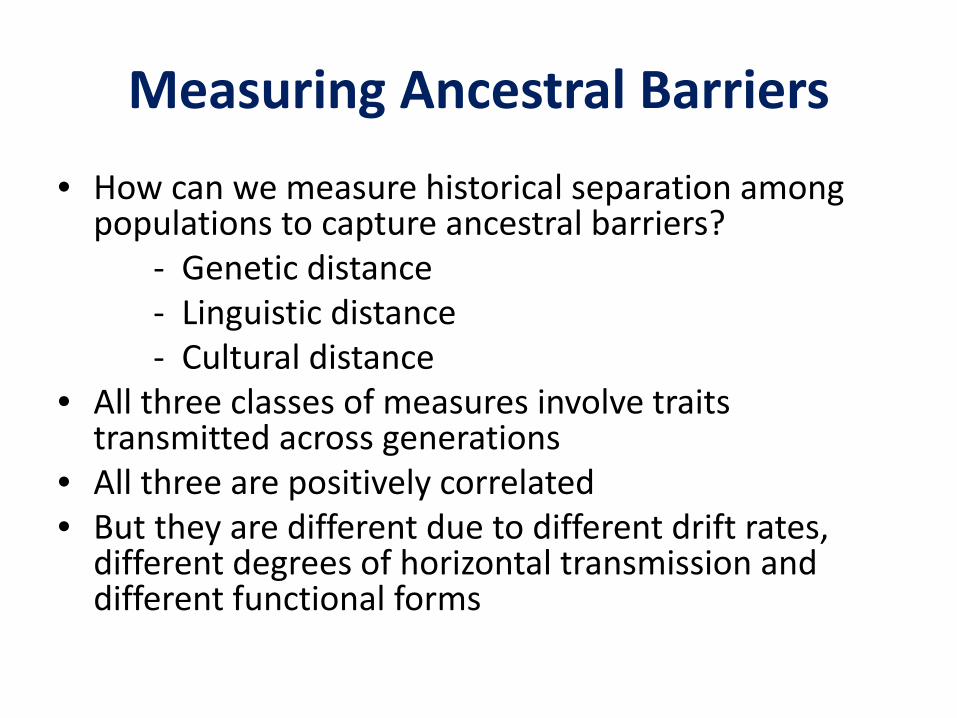
Measuring Ancestral Barriers • How can we measure historical separation among
populations to capture ancestral barriers? - Genetic distance
- Linguistic distance - Cultural distance • All three classes of measures involve traits
transmitted across generations • All three are positively correlated • But they are different due to different drift rates,
different degrees of horizontal transmission and different functional forms
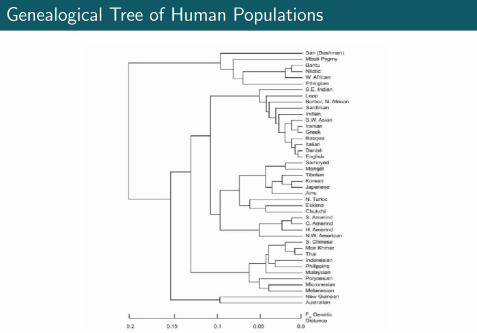
Genealogical Tree of Human Populations
Romain Wacziarg (2016) Barriers & Development December 16, 2016 6 / 10
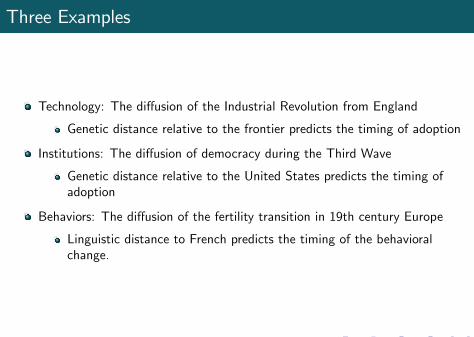
Three Examples
Technology: The di¤usion of the Industrial Revolution from England
Genetic distance relative to the frontier predicts the timing of adoption
Institutions: The di¤usion of democracy during the Third Wave
Genetic distance relative to the United States predicts the timing ofadoption
Behaviors: The di¤usion of the fertility transition in 19th century Europe
Linguistic distance to French predicts the timing of the behavioralchange.
Romain Wacziarg (2016) Barriers & Development December 16, 2016 7 / 10
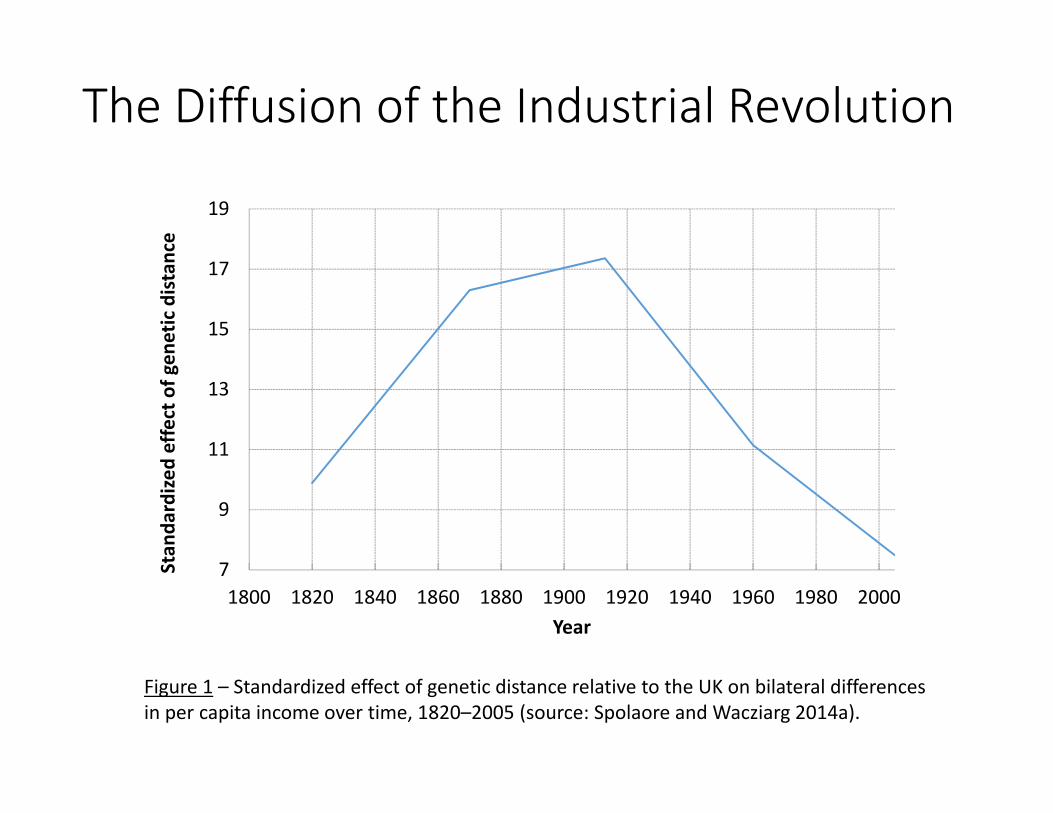
The Diffusion of the Industrial Revolution
7
9
11
13
15
17
19
1800 1820 1840 1860 1880 1900 1920 1940 1960 1980 2000
Stan
dardize
d effect of g
enetic distance
Year
Figure 1 – Standardized effect of genetic distance relative to the UK on bilateral differences in per capita income over time, 1820–2005 (source: Spolaore and Wacziarg 2014a).
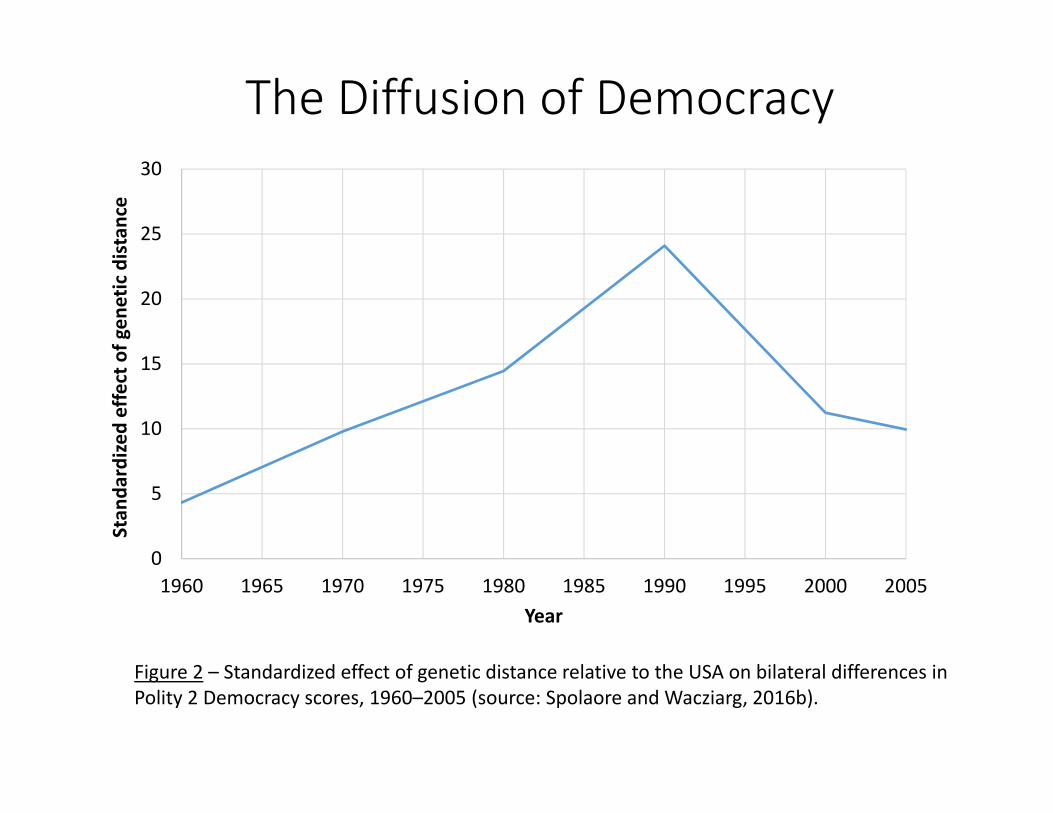
The Diffusion of Democracy
0
5
10
15
20
25
30
1960 1965 1970 1975 1980 1985 1990 1995 2000 2005
Stan
dardize
d effect of g
enetic distance
Year
Figure 2 – Standardized effect of genetic distance relative to the USA on bilateral differences in Polity 2 Democracy scores, 1960–2005 (source: Spolaore and Wacziarg, 2016b).
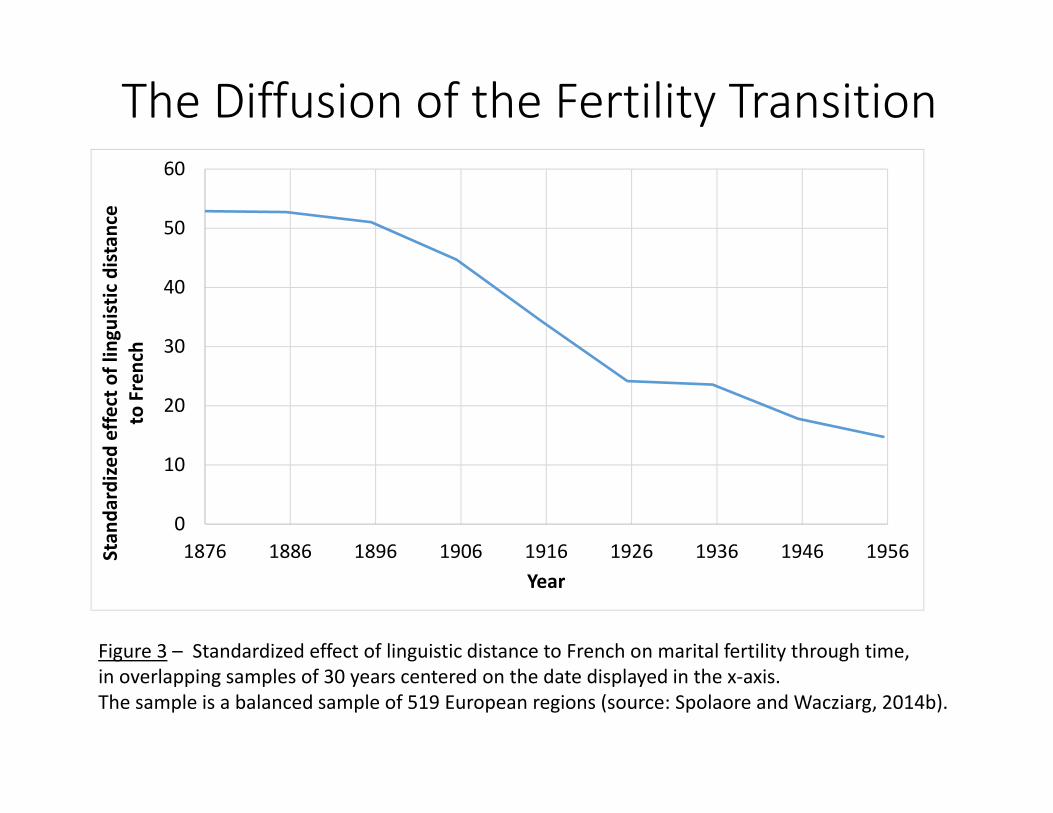
The Diffusion of the Fertility Transition
0
10
20
30
40
50
60
1876 1886 1896 1906 1916 1926 1936 1946 1956Stan
dardize
d effect of lingu
istic
distance
to French
Year
Figure 3 – Standardized effect of linguistic distance to French on marital fertility through time, in overlapping samples of 30 years centered on the date displayed in the x‐axis. The sample is a balanced sample of 519 European regions (source: Spolaore and Wacziarg, 2014b).
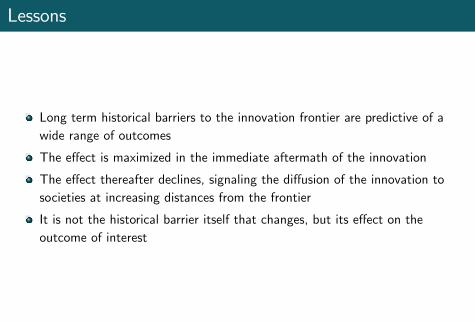
Lessons
Long term historical barriers to the innovation frontier are predictive of awide range of outcomes
The e¤ect is maximized in the immediate aftermath of the innovation
The e¤ect thereafter declines, signaling the di¤usion of the innovation tosocieties at increasing distances from the frontier
It is not the historical barrier itself that changes, but its e¤ect on theoutcome of interest
Romain Wacziarg (2016) Barriers & Development December 16, 2016 8 / 10
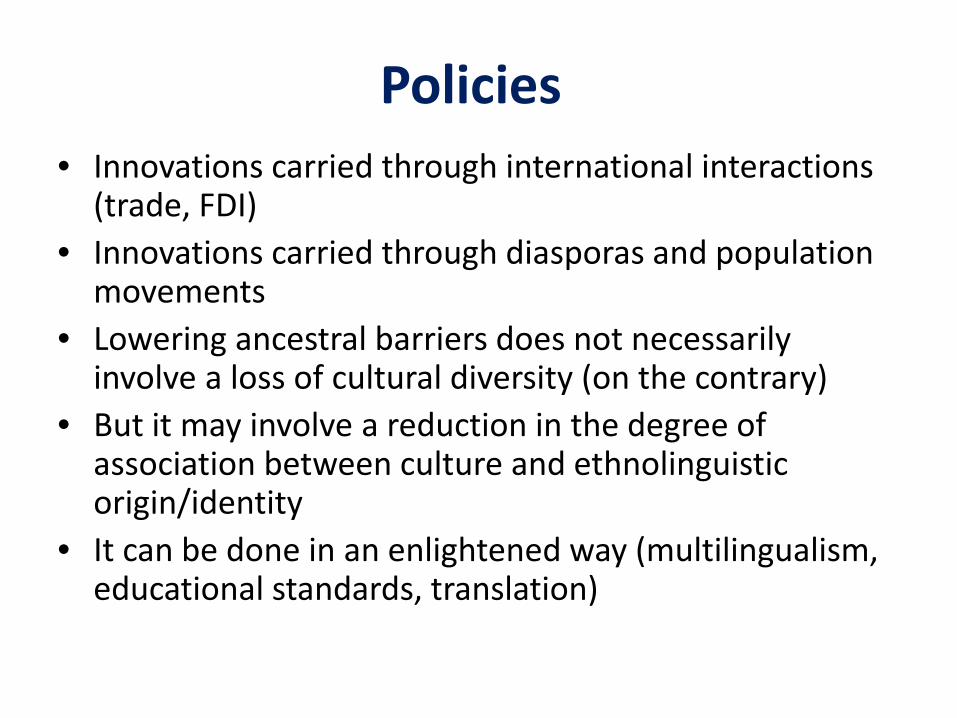
Policies • Innovations carried through international interactions
(trade, FDI) • Innovations carried through diasporas and population
movements • Lowering ancestral barriers does not necessarily
involve a loss of cultural diversity (on the contrary) • But it may involve a reduction in the degree of
association between culture and ethnolinguistic origin/identity
• It can be done in an enlightened way (multilingualism, educational standards, translation)

Global Migration of Talent GEM 2017
Sari Pekkala Kerr
Wellesley College & MIT
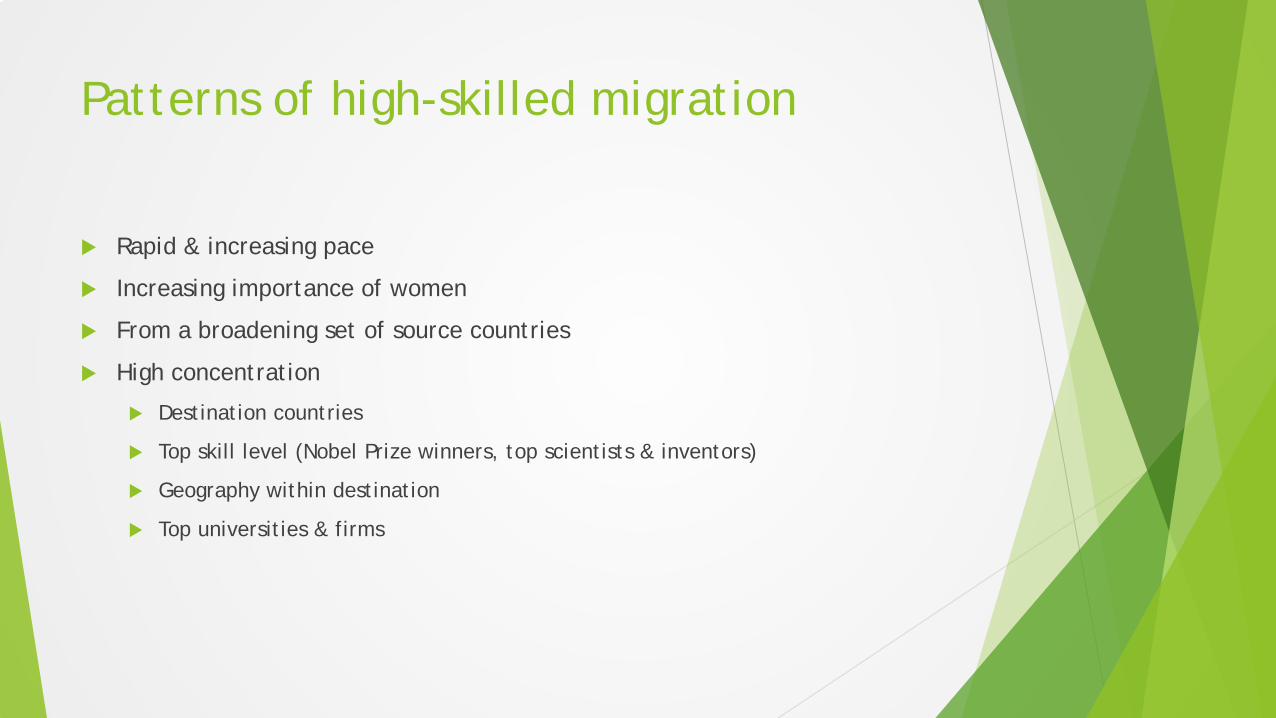
Patterns of high-skilled migration
Rapid & increasing pace
Increasing importance of women
From a broadening set of source countries
High concentration
Destination countries
Top skill level (Nobel Prize winners, top scientists & inventors)
Geography within destination
Top universities & firms
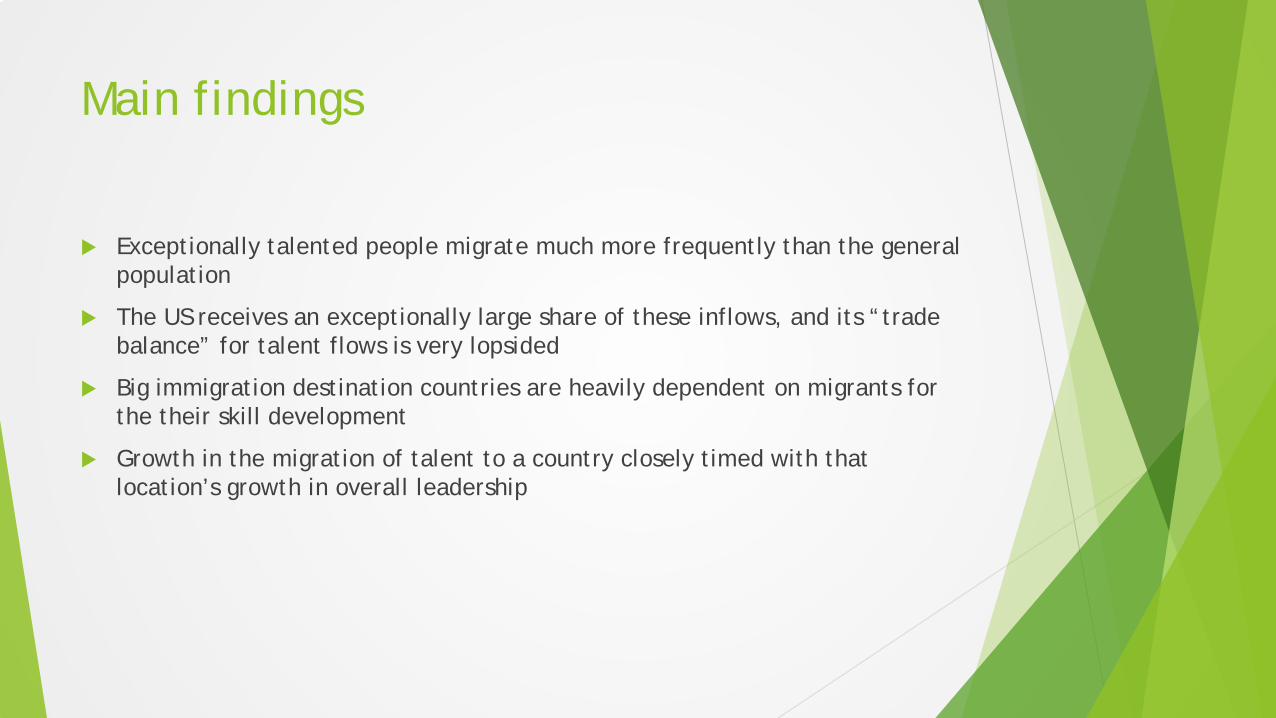
Main findings
Exceptionally talented people migrate much more frequently than the generalpopulation
The US receives an exceptionally large share of these inflows, and its “tradebalance” for talent flows is very lopsided
Big immigration destination countries are heavily dependent on migrants forthe their skill development
Growth in the migration of talent to a country closely timed with thatlocation’s growth in overall leadership
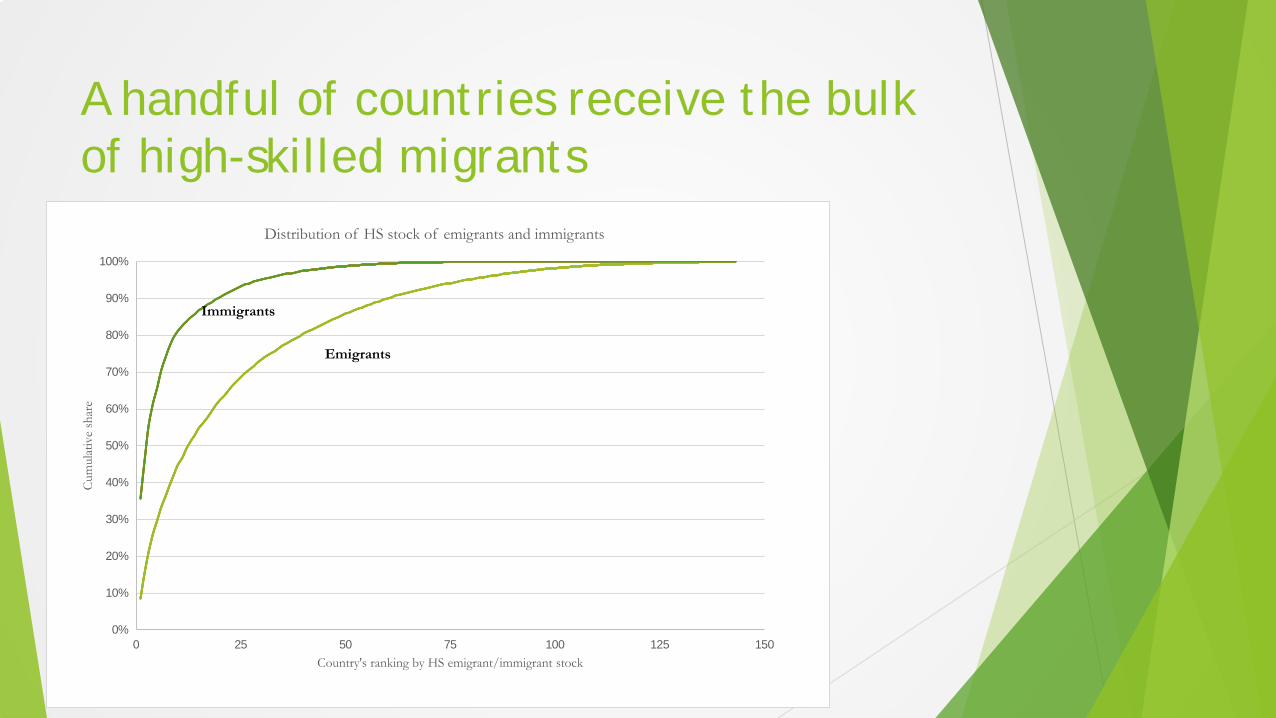
A handful of countries receive the bulk of high-skilled migrants
0%
10%
20%
30%
40%
50%
60%
70%
80%
90%
100%
0 25 50 75 100 125 150
Cum
ulat
ive
shar
e
Country's ranking by HS emigrant/immigrant stock
Distribution of HS stock of emigrants and immigrants
Immigrants
Emigrants
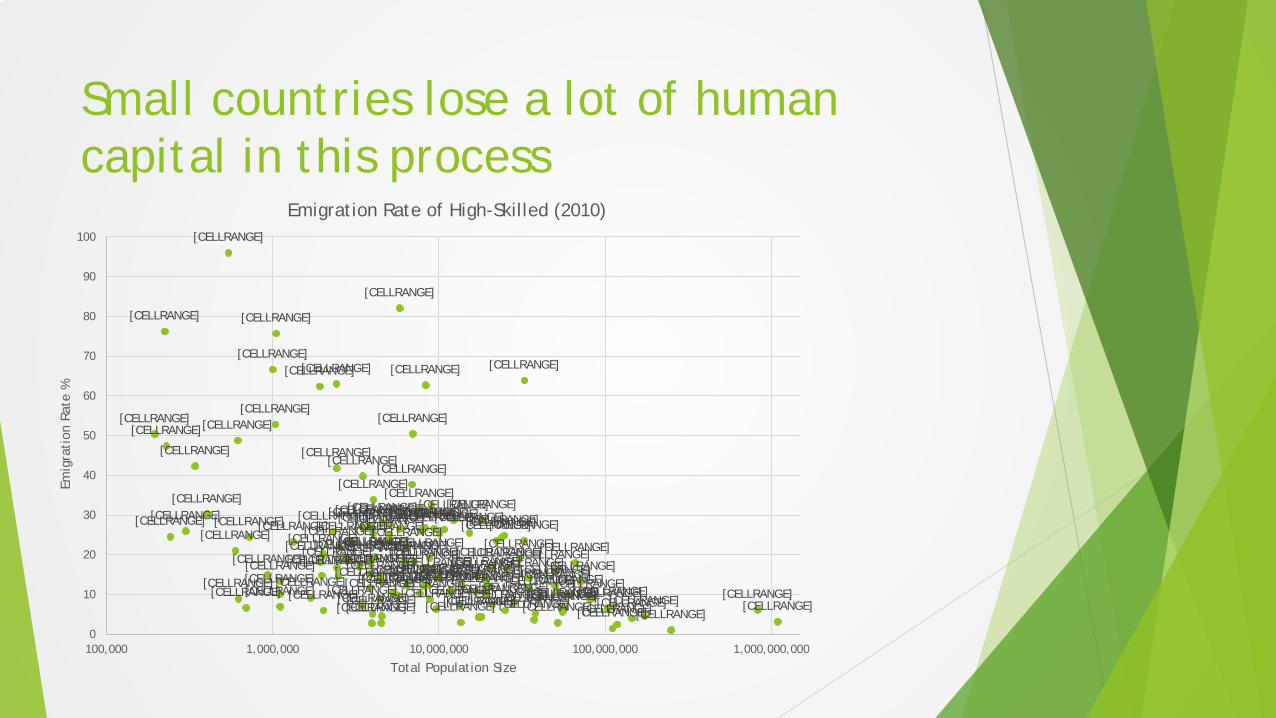
Small countries lose a lot of human capital in this process
[CELLRANGE]
[CELLRANGE]
[CELLRANGE]
[CELLRANGE]
[CELLRANGE]
[CELLRANGE]
[CELLRANGE]
[CELLRANGE] [CELLRANGE] [CELLRANGE]
[CELLRANGE] [CELLRANGE]
[CELLRANGE]
[CELLRANGE]
[CELLRANGE]
[CELLRANGE]
[CELLRANGE]
[CELLRANGE]
[CELLRANGE]
[CELLRANGE]
[CELLRANGE]
[CELLRANGE] [CELLRANGE]
[CELLRANGE]
[CELLRANGE]
[CELLRANGE]
[CELLRANGE]
[CELLRANGE] [CELLRANGE]
[CELLRANGE]
[CELLRANGE] [CELLRANGE] [CELLRANGE]
[CELLRANGE] [CELLRANGE]
[CELLRANGE]
[CELLRANGE] [CELLRANGE]
[CELLRANGE] [CELLRANGE]
[CELLRANGE]
[CELLRANGE]
[CELLRANGE]
[CELLRANGE]
[CELLRANGE]
[CELLRANGE] [CELLRANGE]
[CELLRANGE]
[CELLRANGE]
[CELLRANGE]
[CELLRANGE]
[CELLRANGE]
[CELLRANGE]
[CELLRANGE]
[CELLRANGE]
[CELLRANGE] [CELLRANGE]
[CELLRANGE]
[CELLRANGE]
[CELLRANGE]
[CELLRANGE]
[CELLRANGE] [CELLRANGE]
[CELLRANGE]
[CELLRANGE]
[CELLRANGE]
[CELLRANGE] [CELLRANGE]
[CELLRANGE]
[CELLRANGE] [CELLRANGE]
[CELLRANGE]
[CELLRANGE]
[CELLRANGE] [CELLRANGE]
[CELLRANGE]
[CELLRANGE]
[CELLRANGE]
[CELLRANGE] [CELLRANGE]
[CELLRANGE]
[CELLRANGE]
[CELLRANGE]
[CELLRANGE]
[CELLRANGE]
[CELLRANGE]
[CELLRANGE]
[CELLRANGE]
[CELLRANGE] [CELLRANGE]
[CELLRANGE] [CELLRANGE] [CELLRANGE]
[CELLRANGE]
[CELLRANGE]
[CELLRANGE] [CELLRANGE]
[CELLRANGE]
[CELLRANGE]
[CELLRANGE] [CELLRANGE]
[CELLRANGE] [CELLRANGE]
[CELLRANGE] [CELLRANGE]
[CELLRANGE]
[CELLRANGE]
[CELLRANGE]
[CELLRANGE]
[CELLRANGE] [CELLRANGE]
[CELLRANGE]
[CELLRANGE]
[CELLRANGE]
[CELLRANGE]
[CELLRANGE]
[CELLRANGE]
[CELLRANGE]
[CELLRANGE] [CELLRANGE]
[CELLRANGE]
[CELLRANGE]
[CELLRANGE] [CELLRANGE]
[CELLRANGE]
[CELLRANGE] [CELLRANGE] [CELLRANGE]
[CELLRANGE] [CELLRANGE]
[CELLRANGE]
[CELLRANGE]
[CELLRANGE]
[CELLRANGE]
0
10
20
30
40
50
60
70
80
90
100
100,000 1,000,000 10,000,000 100,000,000 1,000,000,000
Emig
rati
on R
ate
%
Total Population Size
Emigration Rate of High-Skilled (2010)
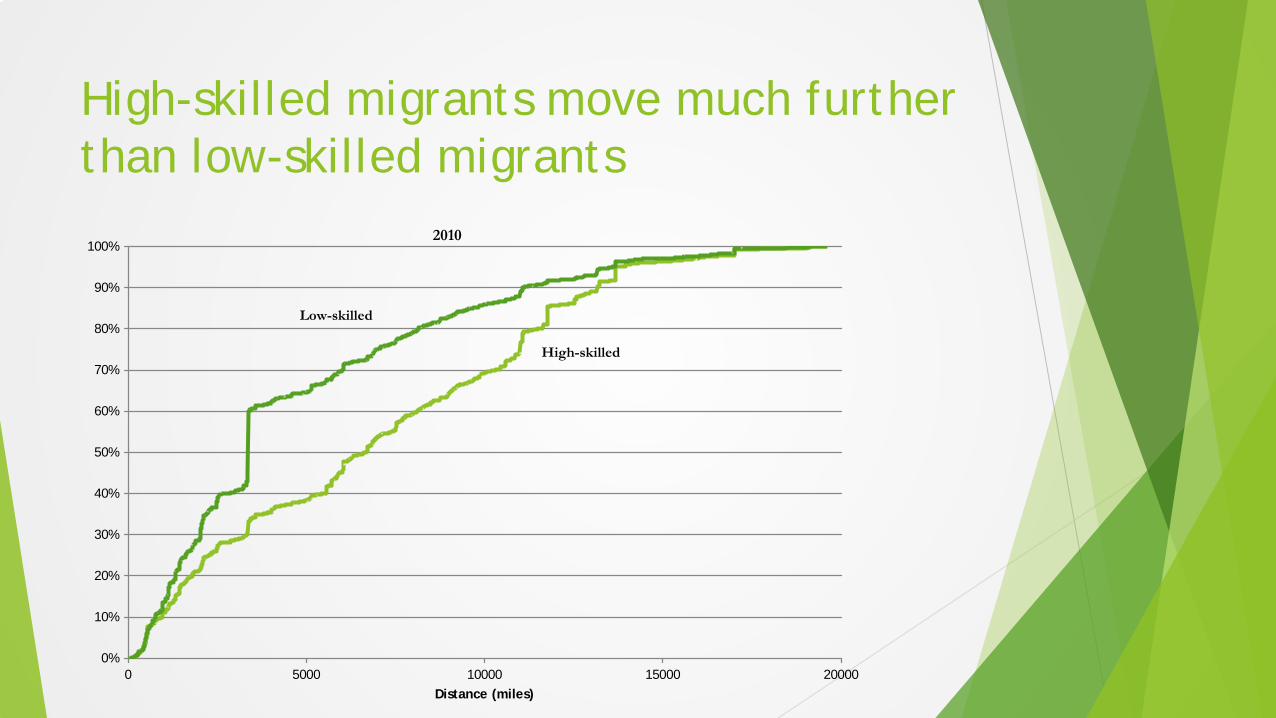
High-skilled migrants move much further than low-skilled migrants
0%
10%
20%
30%
40%
50%
60%
70%
80%
90%
100%
0 5000 10000 15000 20000Distance (miles)
2010
Low-skilled
High-skilled
Specific lessons for the U.S.
Immigrants account for a large share of United States’ accumulated talent, growing in the quality level of the contribution
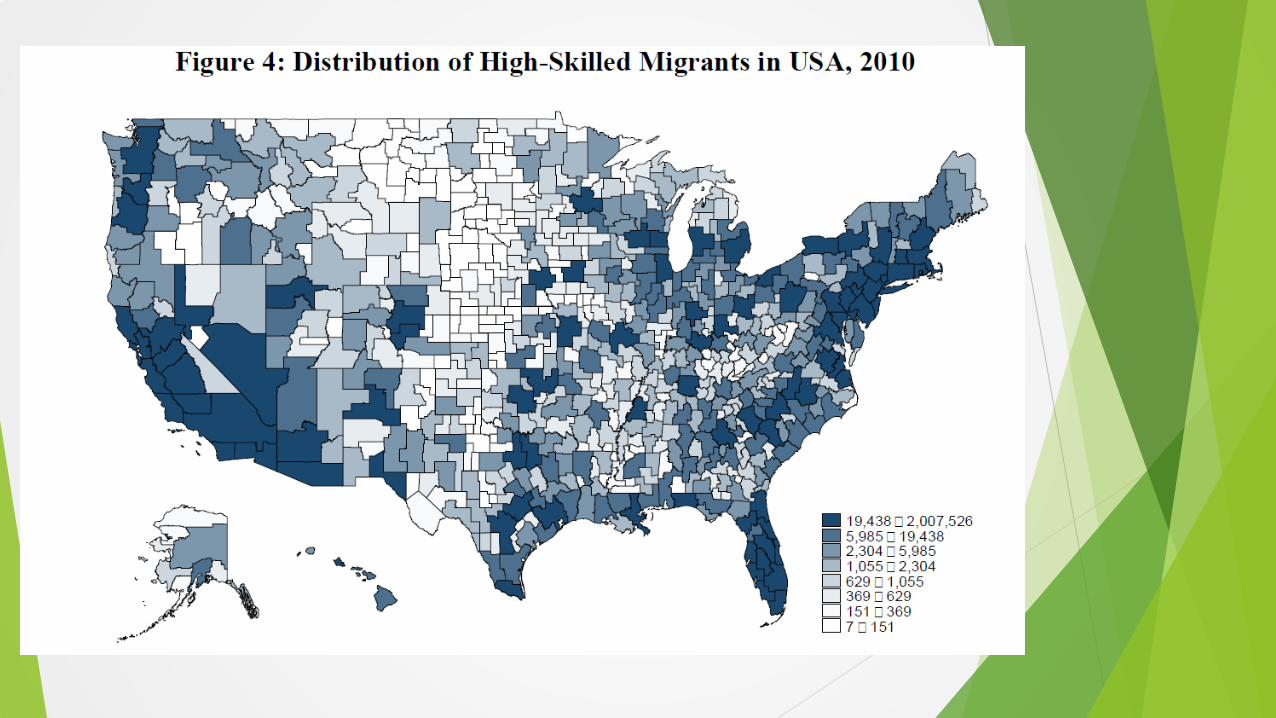
Vast regional differences in high-skill immigrant concentration
Agglomeration effects are a major driver
Competition for global talent is intensifying and attracting migrants in the top skill groups is becoming harder
Immigration policy matters greatly…
LEARNING FROM MIGRANTS Ljubica Nedelkoska, CID at Harvard University
Presenting the work of many GEM, April 19, 2017
1
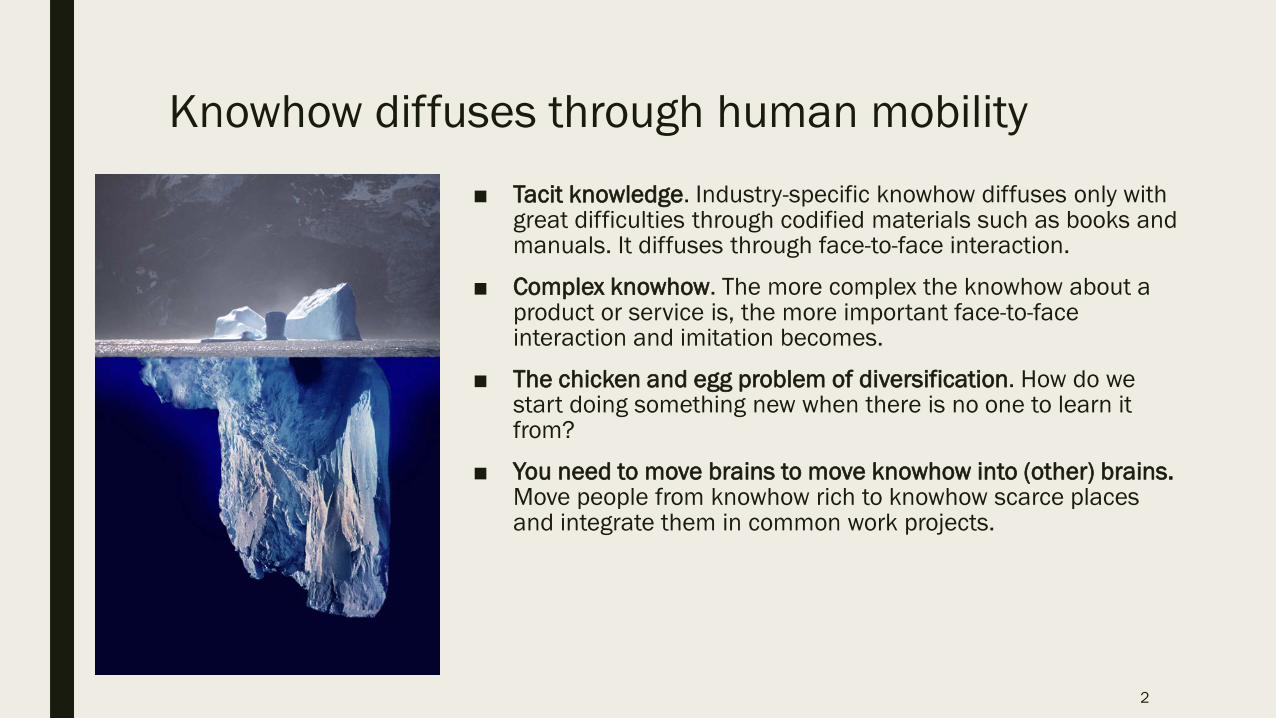
Knowhow diffuses through human mobility ■ Tacit knowledge. Industry-specific knowhow diffuses only with
great difficulties through codified materials such as books and manuals. It diffuses through face-to-face interaction.
■ Complex knowhow. The more complex the knowhow about a product or service is, the more important face-to-face interaction and imitation becomes.
■ The chicken and egg problem of diversification. How do we start doing something new when there is no one to learn it from?
■ You need to move brains to move knowhow into (other) brains. Move people from knowhow rich to knowhow scarce places and integrate them in common work projects.
2
4 country stories
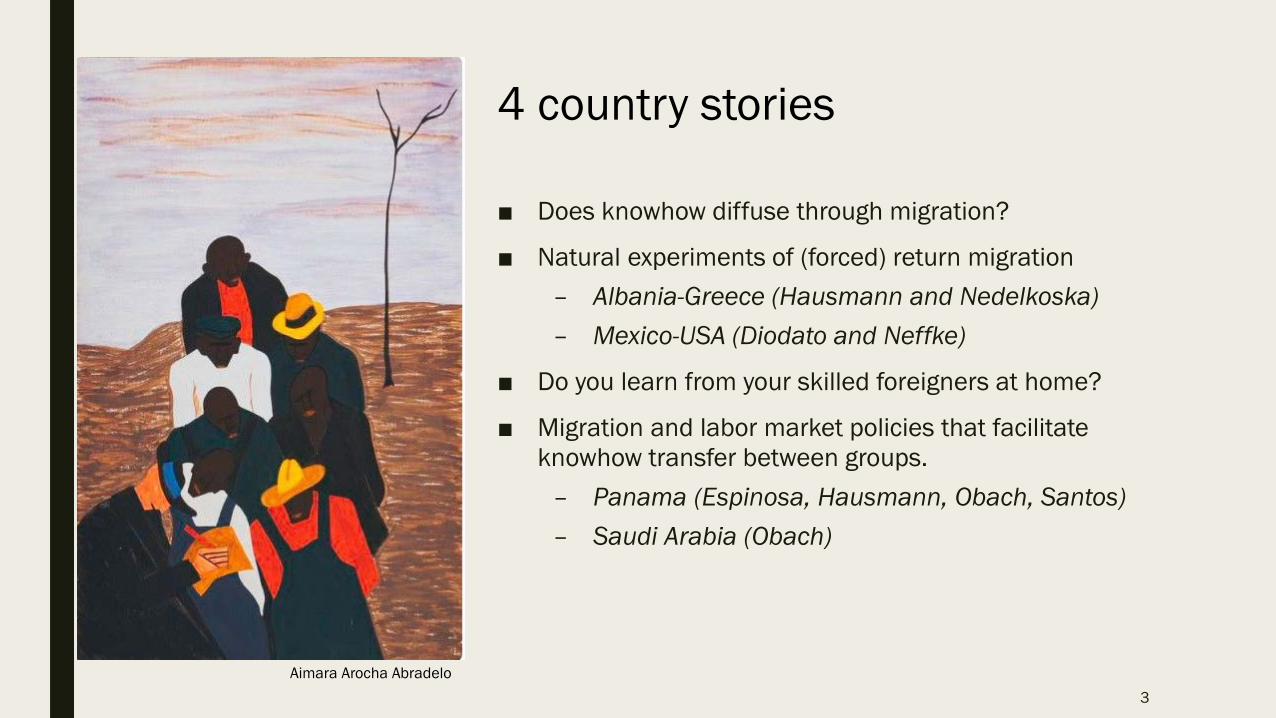
■ Does knowhow diffuse through migration?
■ Natural experiments of (forced) return migration – Albania-Greece (Hausmann and Nedelkoska) – Mexico-USA (Diodato and Neffke)
■ Do you learn from your skilled foreigners at home?
■ Migration and labor market policies that facilitate knowhow transfer between groups.
– Panama (Espinosa, Hausmann, Obach, Santos) – Saudi Arabia (Obach)
3 Aimara Arocha Abradelo
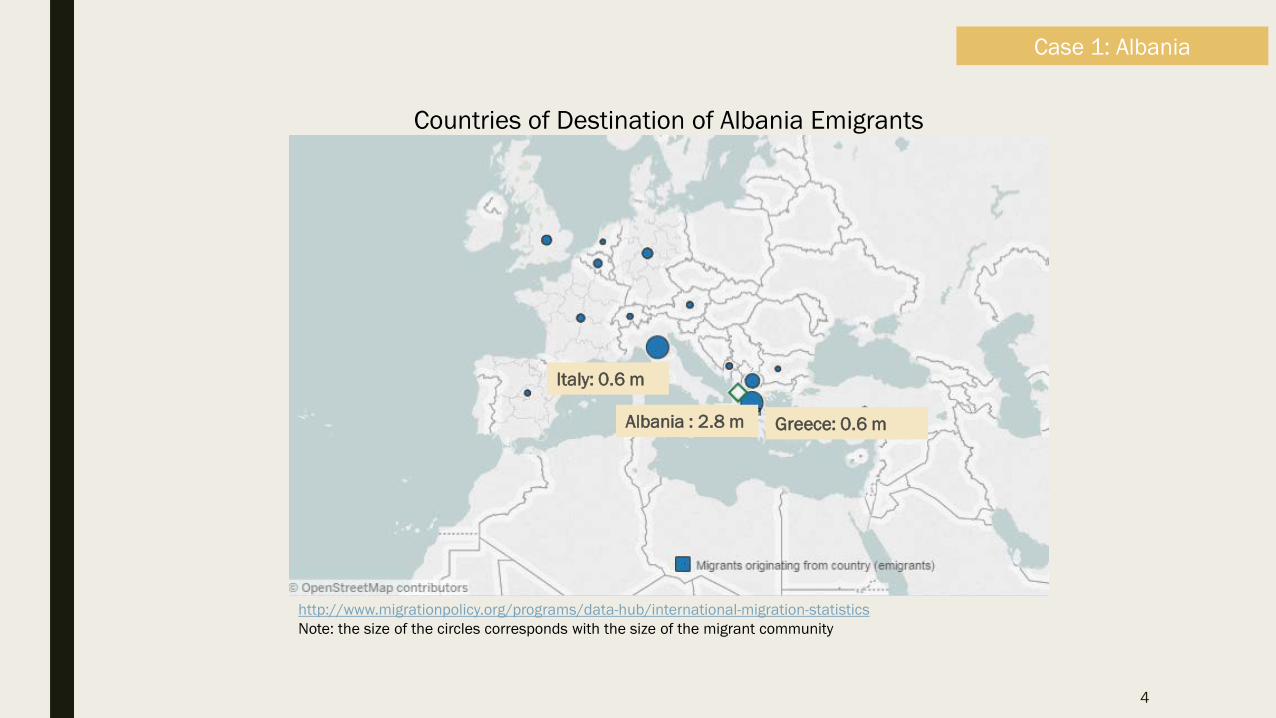
4
Greece: 0.6 m
Italy: 0.6 m
Case 1: Albania
Albania : 2.8 m
http://www.migrationpolicy.org/programs/data-hub/international-migration-statistics Note: the size of the circles corresponds with the size of the migrant community
Countries of Destination of Albania Emigrants
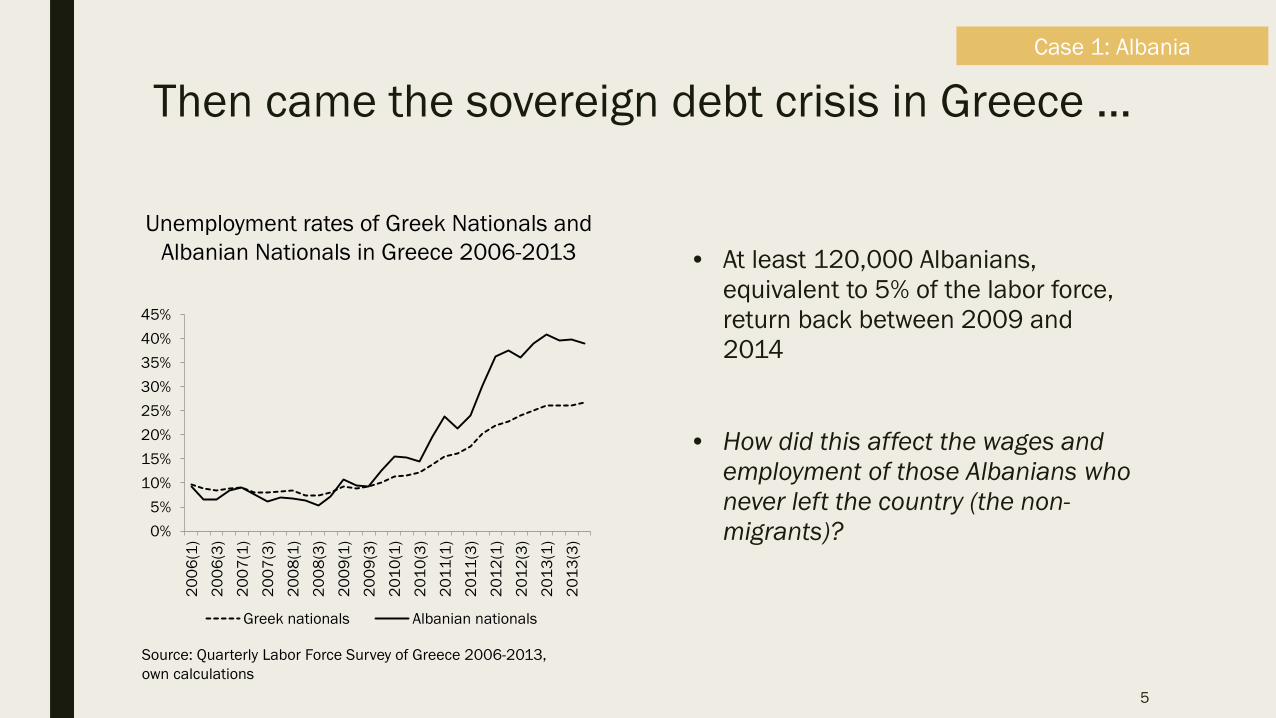
Then came the sovereign debt crisis in Greece …
• At least 120,000 Albanians, equivalent to 5% of the labor force, return back between 2009 and 2014
• How did this affect the wages and employment of those Albanians who never left the country (the non-migrants)?
5
Source: Quarterly Labor Force Survey of Greece 2006-2013, own calculations
Unemployment rates of Greek Nationals and Albanian Nationals in Greece 2006-2013
0%5%
10%15%20%25%30%35%40%45%
2006
(1)
2006
(3)
2007
(1)
2007
(3)
2008
(1)
2008
(3)
2009
(1)
2009
(3)
2010
(1)
2010
(3)
2011
(1)
2011
(3)
2012
(1)
2012
(3)
2013
(1)
2013
(3)
Greek nationals Albanian nationals
Case 1: Albania
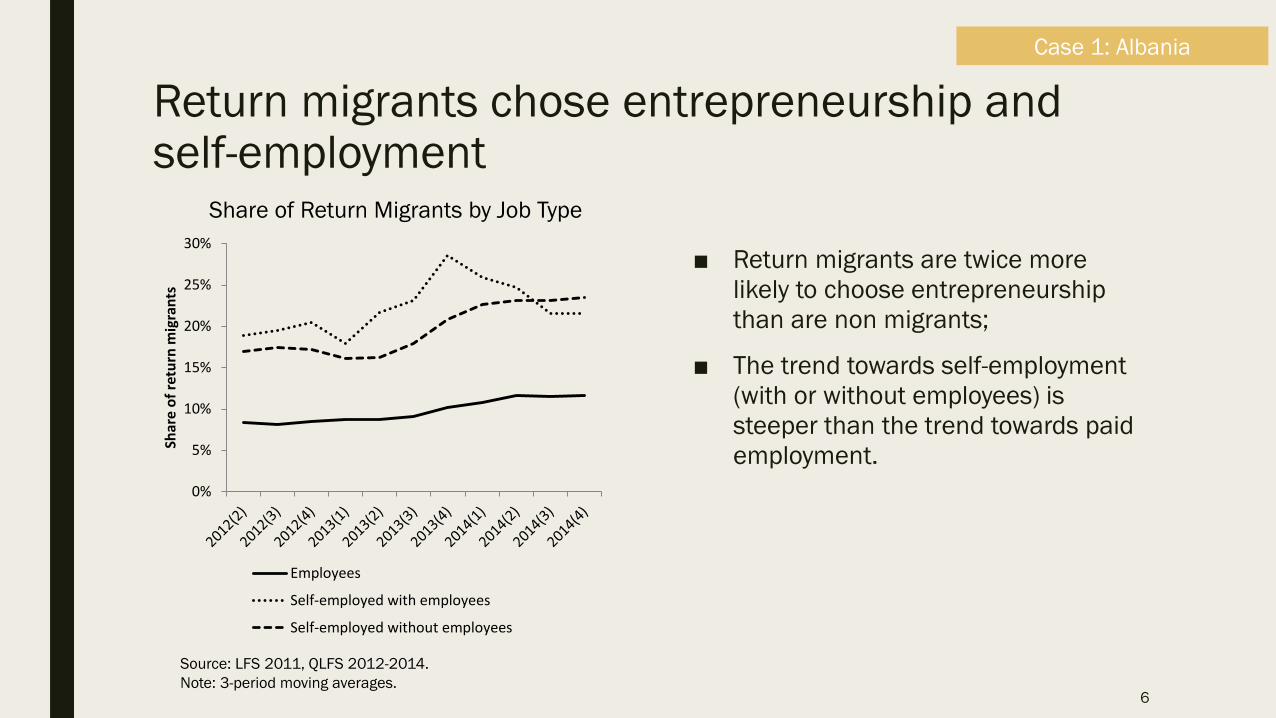
Return migrants chose entrepreneurship and self-employment
0%
5%
10%
15%
20%
25%
30%
Shar
e of
retu
rn m
igra
nts
Employees
Self-employed with employees
Self-employed without employees
■ Return migrants are twice more likely to choose entrepreneurship than are non migrants;
■ The trend towards self-employment (with or without employees) is steeper than the trend towards paid employment.
6
Source: LFS 2011, QLFS 2012-2014. Note: 3-period moving averages.
Case 1: Albania
Share of Return Migrants by Job Type
0.98
0.99
1.00
1.01
1.02
Haza
rd ra
tio
Participation
0.98
0.99
1.00
1.01
1.02
Haza
rd ra
tio
Employment
-2.0%-1.0%0.0%1.0%2.0%3.0%4.0%5.0%6.0%
Wages
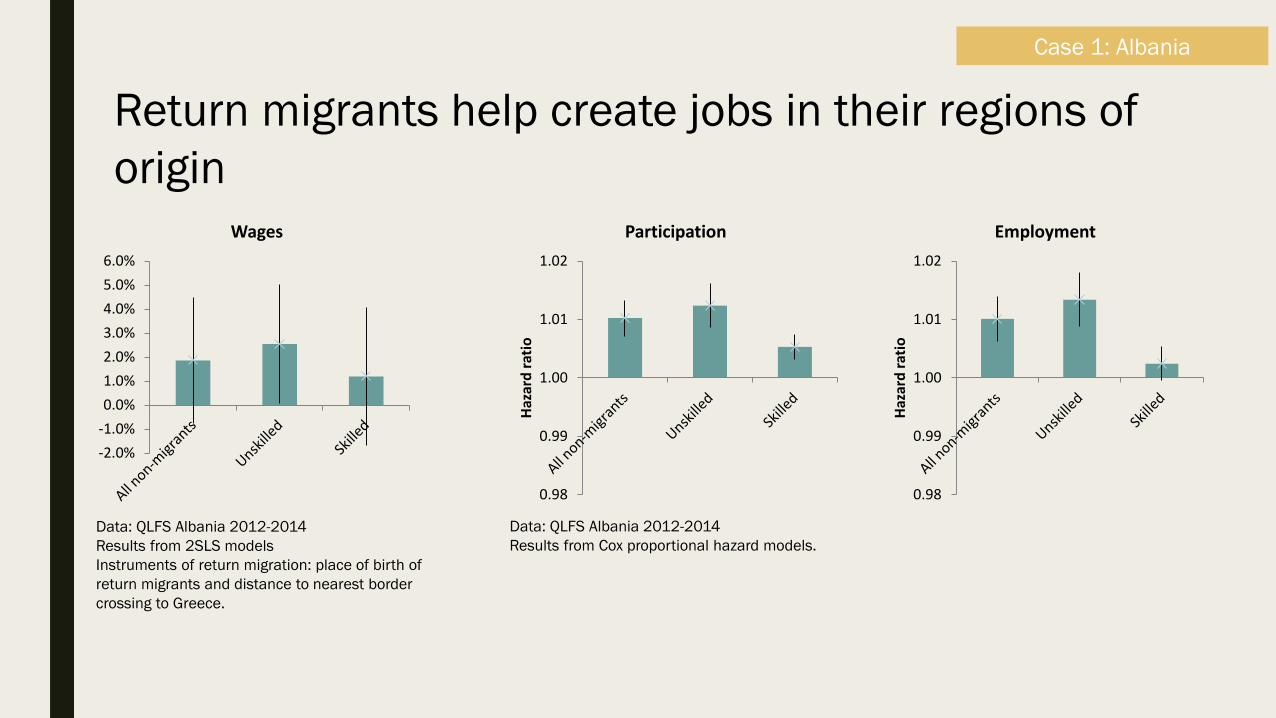
Data: QLFS Albania 2012-2014 Results from Cox proportional hazard models.
Case 1: Albania
Data: QLFS Albania 2012-2014 Results from 2SLS models Instruments of return migration: place of birth of return migrants and distance to nearest border crossing to Greece.
Return migrants help create jobs in their regions of origin
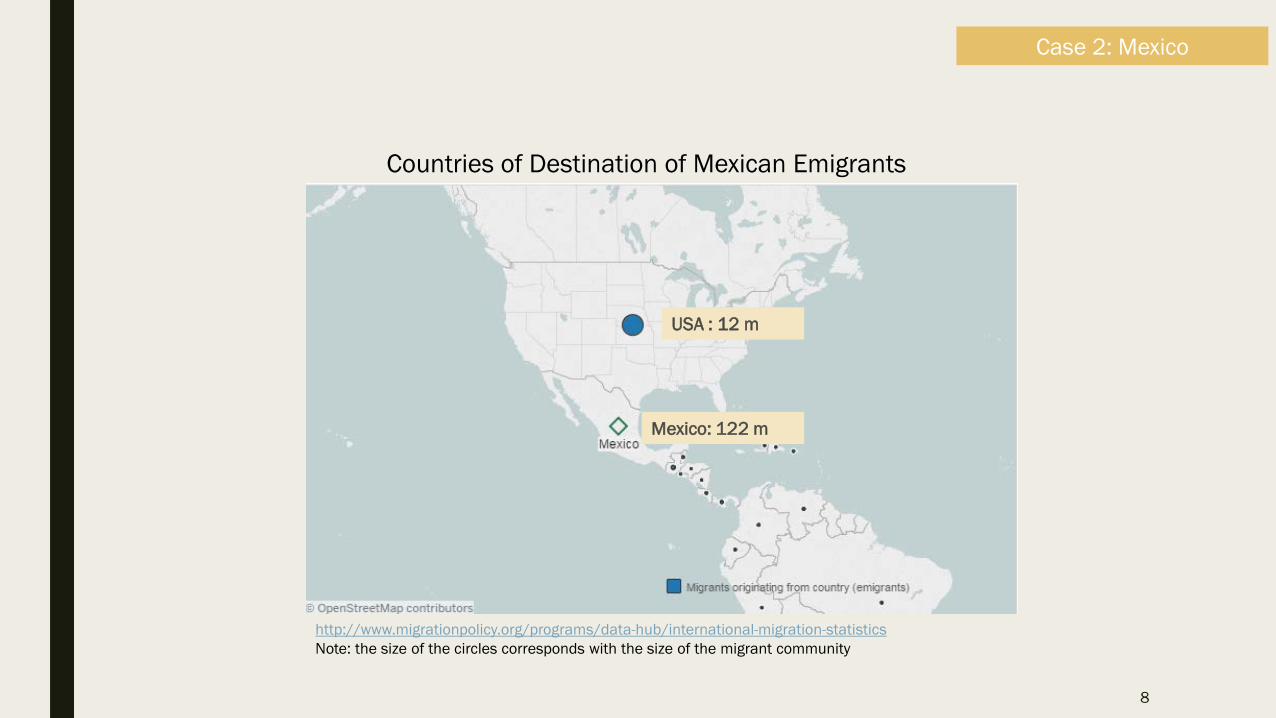
Case 2: Mexico
8
Mexico: 122 m
USA : 12 m
http://www.migrationpolicy.org/programs/data-hub/international-migration-statistics Note: the size of the circles corresponds with the size of the migrant community
Countries of Destination of Mexican Emigrants
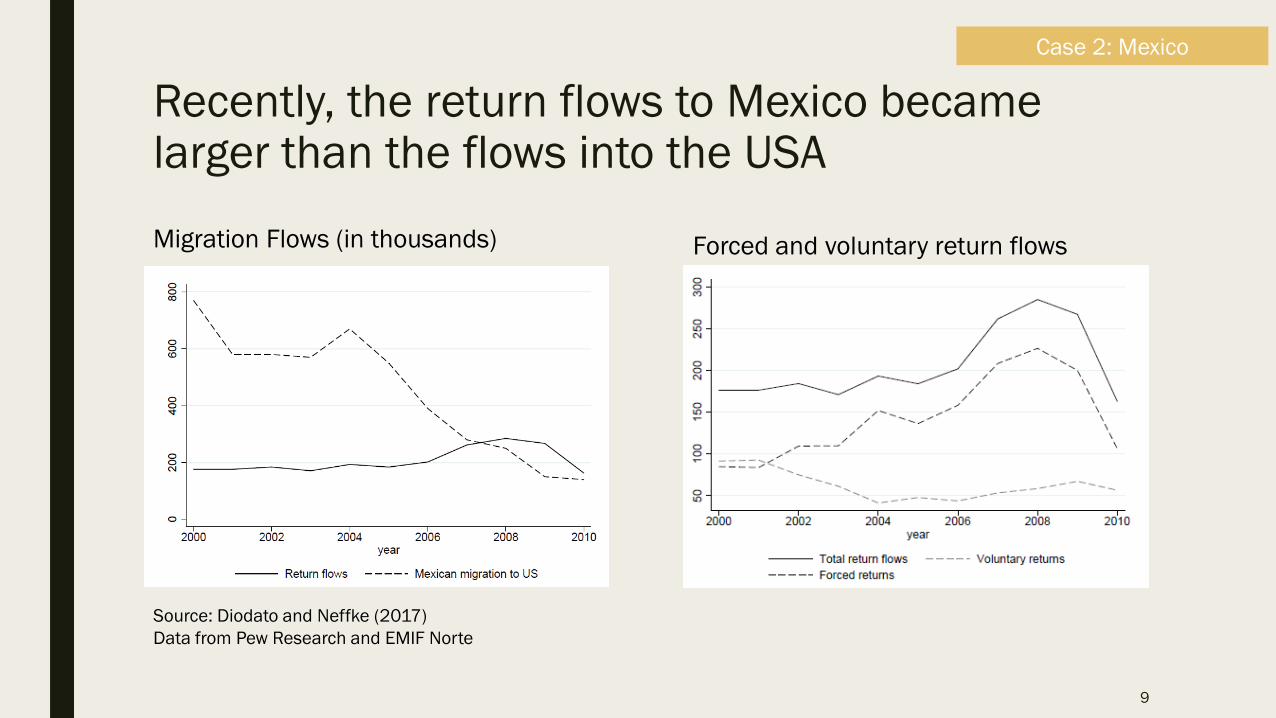
Recently, the return flows to Mexico became larger than the flows into the USA
9
Source: Diodato and Neffke (2017) Data from Pew Research and EMIF Norte
Migration Flows (in thousands) Forced and voluntary return flows
Case 2: Mexico
Main findings
■ Mexican return migrants bring about structural change in Mexico – Mexican migrants in the US work in different sectors than at home – When they return to Mexico, the total employment in the sector-city they choose
experiences a boost
■ Doubling the number of returnees increases employment growth by 9%
10
Case 2: Mexico

PANAMA AND SAUDI ARABIA Knowhow arrives home. How do you make the best use of it?
11
12
Case 3: Panama
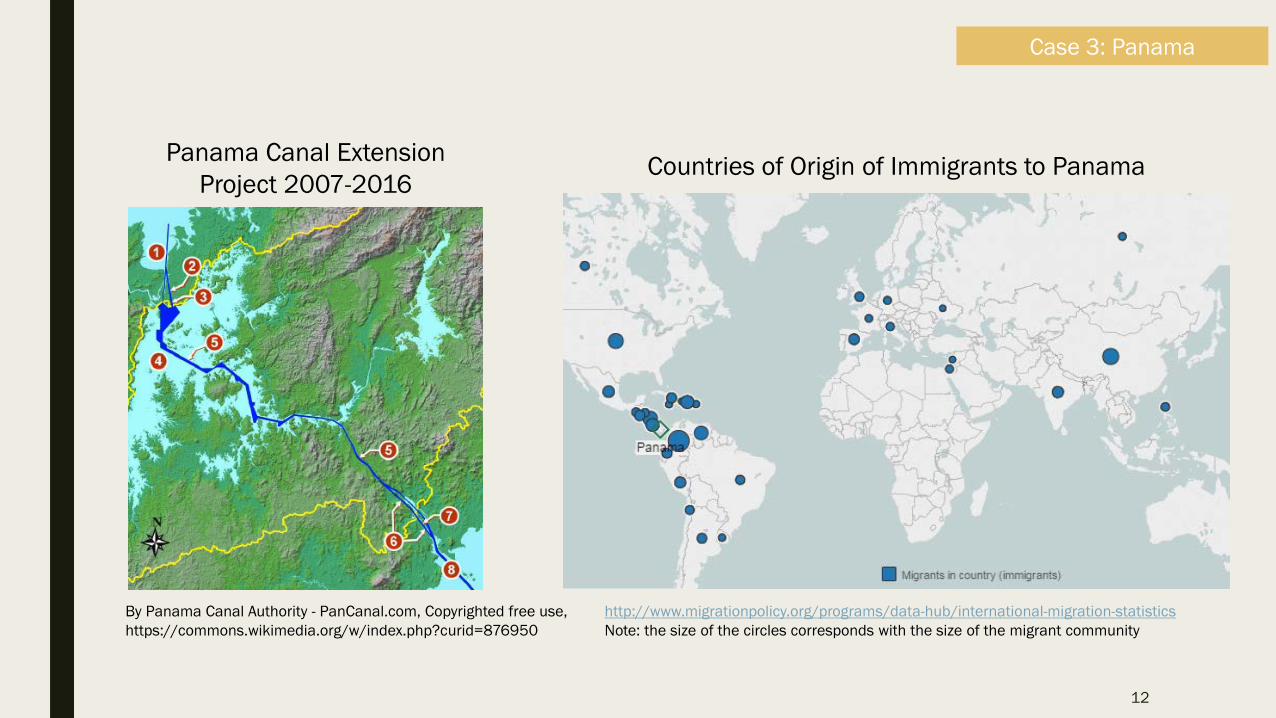
By Panama Canal Authority - PanCanal.com, Copyrighted free use, https://commons.wikimedia.org/w/index.php?curid=876950
http://www.migrationpolicy.org/programs/data-hub/international-migration-statistics Note: the size of the circles corresponds with the size of the migrant community
Countries of Origin of Immigrants to Panama Panama Canal Extension Project 2007-2016
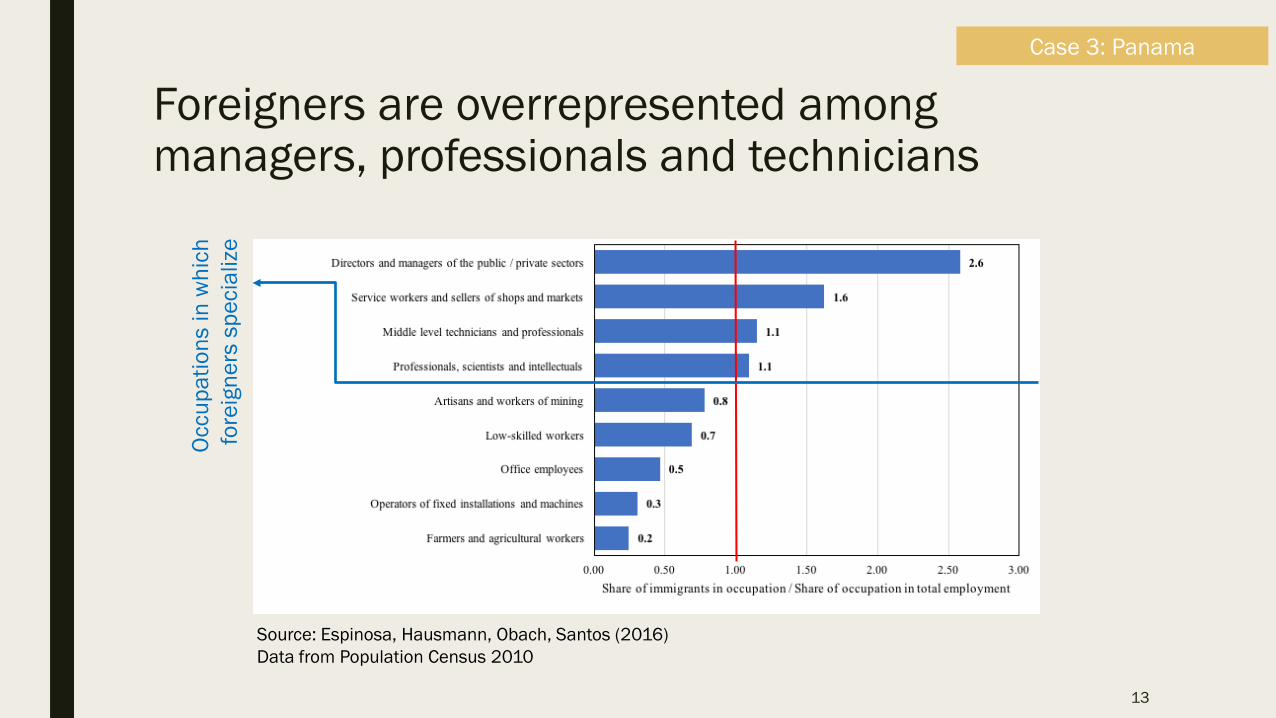
Foreigners are overrepresented among managers, professionals and technicians
13
Case 3: Panama
Source: Espinosa, Hausmann, Obach, Santos (2016) Data from Population Census 2010
Occu
patio
ns in
whi
ch
fore
igne
rs s
peci
aliz
e
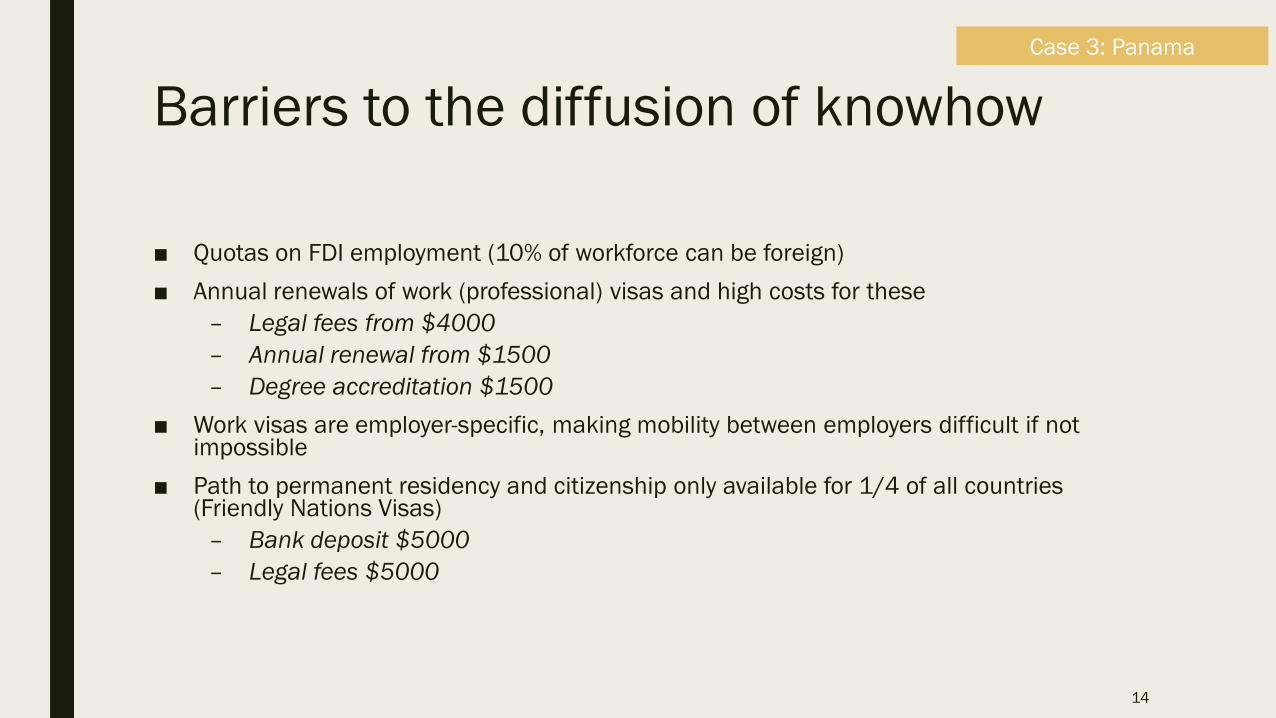
Barriers to the diffusion of knowhow
■ Quotas on FDI employment (10% of workforce can be foreign) ■ Annual renewals of work (professional) visas and high costs for these
– Legal fees from $4000 – Annual renewal from $1500 – Degree accreditation $1500
■ Work visas are employer-specific, making mobility between employers difficult if not impossible
■ Path to permanent residency and citizenship only available for 1/4 of all countries (Friendly Nations Visas)
– Bank deposit $5000 – Legal fees $5000
14
Case 3: Panama
15
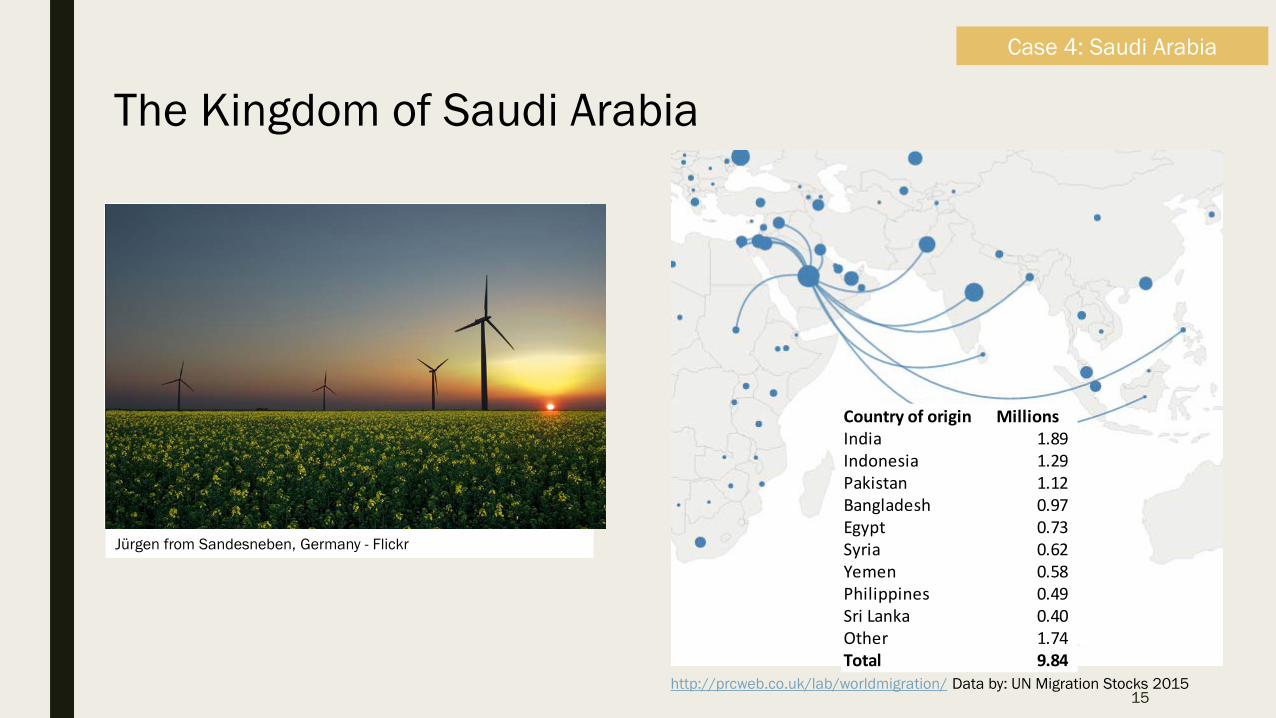
Case 4: Saudi Arabia
http://prcweb.co.uk/lab/worldmigration/ Data by: UN Migration Stocks 2015
http://atlas.cid.harvard.edu Data by: COMTRADE 2014
The Kingdom of Saudi Arabia
Jürgen from Sandesneben, Germany - Flickr
Country of origin MillionsIndia 1.89 Indonesia 1.29 Pakistan 1.12 Bangladesh 0.97 Egypt 0.73 Syria 0.62 Yemen 0.58 Philippines 0.49 Sri Lanka 0.40 Other 1.74 Total 9.84
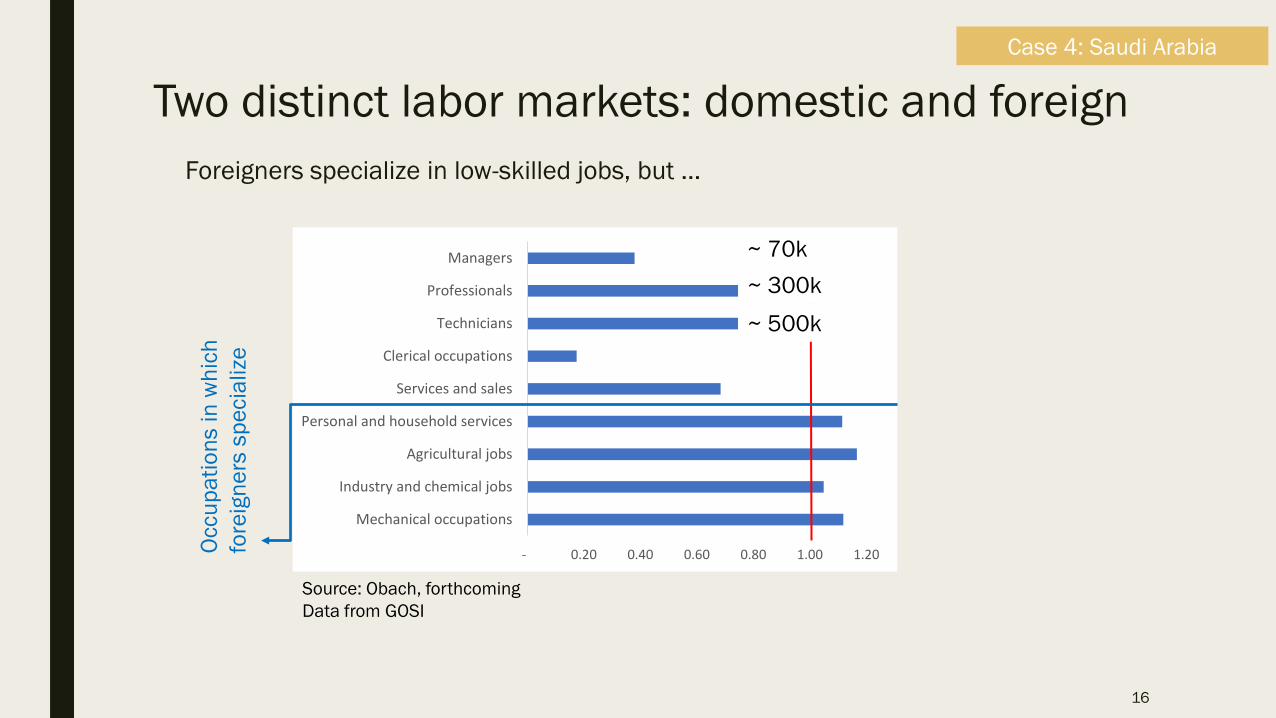
Two distinct labor markets: domestic and foreign Foreigners specialize in low-skilled jobs, but …
16
Case 4: Saudi Arabia
- 0.20 0.40 0.60 0.80 1.00 1.20
Mechanical occupations
Industry and chemical jobs
Agricultural jobs
Personal and household services
Services and sales
Clerical occupations
Technicians
Professionals
Managers
Occu
patio
ns in
whi
ch
fore
igne
rs s
peci
aliz
e
Source: Obach, forthcoming Data from GOSI
~ 70k ~ 300k ~ 500k
Conclusions
■ Migration is a channel of knowhow diffusion from knowledge-rich to knowledge-poor countries
■ To make full use of migration as a channel of knowhow diffusion, countries need to make it easy for people to:
– Come and move between jobs – Integrate and aspire to become permanent residents and citizens
17