Embed Size (px)
Citation preview

ORIGINAL RESEARCHpublished: 15 April 2016
doi: 10.3389/fpls.2016.00452
Frontiers in Plant Science | www.frontiersin.org 1 April 2016 | Volume 7 | Article 452
Edited by:
Nirala Ramchiary,
Jawaharlal Nehru University, India
Reviewed by:
Elisabetta Mazzucotelli,
Consiglio per la Ricerca in Agricoltura
e l’Analisi dell’Economia Agraria, Italy
Daniela Marone,
Consiglio per la Ricerca in Agricoltura
e l’Analisi dell’Economia Agraria, Italy
*Correspondence:
Yehoshua Saranga
Specialty section:
This article was submitted to
Crop Science and Horticulture,
a section of the journal
Frontiers in Plant Science
Received: 18 January 2016
Accepted: 22 March 2016
Published: 15 April 2016
Citation:
Merchuk-Ovnat L, Barak V, Fahima T,
Ordon F, Lidzbarsky GA, Krugman T
and Saranga Y (2016) Ancestral QTL
Alleles from Wild Emmer Wheat
Improve Drought Resistance and
Productivity in Modern Wheat
Cultivars. Front. Plant Sci. 7:452.
doi: 10.3389/fpls.2016.00452
Ancestral QTL Alleles from WildEmmer Wheat Improve DroughtResistance and Productivity inModern Wheat CultivarsLianne Merchuk-Ovnat 1, Vered Barak 1, Tzion Fahima 2, Frank Ordon 3,
Gabriel A. Lidzbarsky 2, Tamar Krugman 2 and Yehoshua Saranga 1*
1 The Robert H. Smith Institute of Plant Sciences and Genetics in Agriculture, The Hebrew University of Jerusalem, Rehovot,
Israel, 2 Institute of Evolution and Department of Evolutionary and Environmental Biology, University of Haifa, Haifa, Israel,3 Federal Research Centre for Cultivated Plants, Julius Kuehn-Institute, Institute for Resistance Research and Stress
Tolerance, Quedlinburg, Germany
Wild emmer wheat (Triticum turgidum ssp. dicoccoides) is considered a promising
source for improving stress resistances in domesticated wheat. Here we explored
the potential of selected quantitative trait loci (QTLs) from wild emmer wheat,
introgressed via marker-assisted selection, to enhance drought resistance in elite
durum (T. turgidum ssp. durum) and bread (T. aestivum) wheat cultivars. The resultant
near-isogenic lines (BC3F3 and BC3F4) were genotyped using SNP array to confirm
the introgressed genomic regions and evaluated in two consecutive years under
well-watered (690–710mm) and water-limited (290–320mm) conditions. Three of the
introgressed QTLs were successfully validated, two in the background of durum wheat
cv. Uzan (on chromosomes 1BL and 2BS), and one in the background of bread wheat
cvs. Bar Nir and Zahir (chromosome 7AS). In most cases, the QTL x environment
interaction was validated in terms of improved grain yield and biomass—specifically
under drought (7AS QTL in cv. Bar Nir background), under both treatments (2BS
QTL), and a greater stability across treatments (1BL QTL). The results provide a first
demonstration that introgression of wild emmer QTL alleles can enhance productivity and
yield stability across environments in domesticated wheat, thereby enriching the modern
gene pool with essential diversity for the improvement of drought resistance.
Keywords: interspecific introgression, marker-assisted selection, near-isogenic line, Triticum turgidum ssp.
dicoccoides, quantitative trait locus, water stress, wheat, yield
INTRODUCTION
Wheat (Triticum spp.) is one of the world’s major food sources, providing about 20% of the caloriesconsumed by mankind (FAO, 2011). The germplasm of semi-dwarf spring habit bread wheat,distributed by the International Maize andWheat Improvement Center (CIMMYT) from the early
Abbreviations: Chr., chromosome; CL, culm length; DP–H, days from planting to heading; G/Sp, grain number per spike;
GY, grain yield; HI, harvest index; NIC, near-isogenic control; NIL, near-isogenic line; OA, osmotic adjustment; OP, osmotic
potential; PCA, principal component analysis; QTL, quantitative trait loci; S, drought susceptibility index; SNP, single
nucleotide polymorphism; Sp/P, fertile spikes per plan; SSR, single sequence repeat; TGW, thousand grain weight; TotDM,
total dry matter; WL, water-limited; WW, well-watered.

Merchuk-Ovnat et al. Ancestral QTLs Improve Drought Resistance
1960s to late 1980s along with advanced agronomic practices,led to substantial and rapid advances in yield (Fischer et al.,1998). This genetic improvement was mainly associated with anincreased harvest index (HI) and a shift toward photoperiod-insensitivity rather than increased total biomass (Sayre et al.,1997; Ortiz et al., 2008). However, recent reviews suggest thatthe rate of yield progress in spring wheat has been slowing downfor the last three decades (Fischer and Edmeades, 2010; Challinoret al., 2014; Curtis and Halford, 2014).
Drought, the major stress factor limiting crop productivityworldwide (Boyer, 1982; Araus et al., 2008), is expected toincrease due to global climate change (Wheeler and VonBraun, 2013). Developing crop cultivars with improved droughtresistance is considered a sustainable and an economically viableapproach to enhance crop productivity and ensure food securityfor the growing human population. Past efforts to developdrought-resistant crop cultivars by traditional breeding werehampered by low heritability of traits such as yield, particularlyunder drought, and by large “genotype × environment”interactions (Blum, 1988; Passioura, 2012; Langridge andReynolds, 2015). However, recent advances in molecular andgenomic tools have enabled the identification of quantitative traitloci (QTLs) and diagnostic DNA markers in a wide range ofcrops, with the promise of accelerating crop improvement towardfuture challenges (Salvi and Tuberosa, 2015).
The available genetic diversity in crop plants has beenconsiderably eroded compared with their wild ancestors, due tobottlenecks imposed by plant domestication (e.g., founder effect)and modern breeding (Tanksley andMcCouch, 1997; Ladizinsky,1998), thusmaking current crop germplasm vulnerable to variousbiotic and abiotic stresses. Therefore, amajor objective ofmodernbreeding is to enrich the domesticated gene pool by reintroducingvaluable wild alleles that were “left behind” (Aaronsohn, 1910;Tanksley and McCouch, 1997; Gur and Zamir, 2004).
Wild emmer wheat, Triticum turgidum ssp. dicoccoides[Körn.] Thell., is the tetraploid (2n = 4x = 28; genome BBAA)progenitor of the domesticated tetraploid (2n= 4x= 28; BBAA)durum wheat [T. turgidum ssp. durum (Desf.) MacKey] andhexaploid (2n = 6x = 42; BBAADD) bread wheat (T. aestivumL.; Feldman, 2001). Wild emmer wheat evolved in the NearEastern Fertile Crescent under a wide range of ecogeographicalconditions (Peleg et al., 2005, 2008a) and harbors rich allelicdiversity for numerous important traits, including agronomiccharacteristics, grain quality and resistance to biotic and abioticstresses (Peng et al., 2012 and references therein). A largenumber of genes and QTLs that are valuable for wheatimprovement have been identified in the wild emmer genepool and mapped (Xie and Nevo, 2008). However, this genepool has not been widely exploited in wheat breeding (Jaradat,2011), possibly due to the complexity and long duration of geneintrogression from wild germplasm. Marker-assisted selectionhas been shown effective for the introgression of favorablegenes/QTLs, conferring primarily disease resistances (reviewedby Peng et al., 2012) from wild emmer wheat to domesticatedgermplasm. Marker assisted selection has also been used totransfer genes/QTLs conferring several agronomic traits to thedomesticated gene pool, including Na+ exclusion (Munns et al.,
2012), plant height (Lanning et al., 2012), tillering (Moeller et al.,2014), spike branching (Zhang et al., 2012), epicuticular wax(Miura et al., 2002), heading time (Tanio and Kato, 2007), andkernel hardness (Lesage et al., 2012). Nevertheless, we are notaware of any prior report on the transfer of genes/QTLs for grainyield (GY) or drought resistance in wheat from either wild ordomesticated donor lines.
The potential of wild emmer wheat for improving droughtresistance in domesticated wheat has been explored in previousstudies in our lab. A wide collection of wild emmer wheatpopulations, originating from across an aridity gradient in Israel,revealed extensive genetic diversity for drought responses interms of productivity and related drought-adaptive traits (Peleget al., 2005), as well as high DNA polymorphism (Peleg et al.,2008a). A considerable number of wild accessions exhibitedsuperior performance under drought as compared to durumwheat control cultivars. The greatest allelic diversity and highestdrought-resistance potential were observed in wild emmerpopulations from intermediate aridity levels exposed to thewidest climatic fluctuations. Subsequently, a recombinant inbredline population derived from a cross between durum wheat (cv.Langdon) and wild emmer (acc. G18-16) was used to map QTLsconferring drought resistance and related traits (Peleg et al.,2009). Out of 110mapped QTL, in 58 QTLs the wild emmer alleleshowed an advantage over the domesticated one. Several QTLsinteracted with the environmental conditions and accounted forproductivity and related traits under either drought treatment (20QTLs) or a well-watered control treatment (15 QTLs), or in termsof drought-susceptibility index (S) (22 QTLs).
In the current study, we examined the hypothesis thatintrogression of selected genomic regions from wild emmerwheat can enhance drought resistance in modern durum andbread wheat cultivars. Our result provide the first evidence thatintrogression of QTL alleles fromwild emmer wheat can enhanceproductivity and drought resistance in domesticated wheat.
MATERIALS AND METHODS
Development of Near-Isogenic LinesA marker-assisted backcross program (Figure S1) was employedfor the introgression of the target regions into elite Israeli durumwheat (cvs. Inbar and Uzan) and bread wheat (cvs. Bar Nirand Zahir). Genomic regions in which the wild QTL allelesshowed an advantage over the domesticated alleles in plantproductivity, particularly under drought, or in susceptibilityindices, were selected based on a previous mapping study (Peleget al., 2009) for introgression. No significant two-locus epistasiswas found between any of the QTLs controlling any of themapped traits. Marker-assisted backcrossing was based on SSRmarkers flanking and within each of the target QTL regions(Table 1). In cases where markers were not polymorphic betweenthe recurrent parent and the wild donor or in cases of DArTmarkers, additional SSR markers were selected from our map(Peleg et al., 2008b) or from other published maps (Somerset al., 2004; Zhang et al., 2008) and integrated into our targetregion using genetic mapping package MultiPoint (MultiQTLLtd. Haifa, Israel). The length of the target regions varied from 41
Frontiers in Plant Science | www.frontiersin.org 2 April 2016 | Volume 7 | Article 452

Merchuk-Ovnat et al. Ancestral QTLs Improve Drought Resistance
TABLE 1 | Drought-related QTL regions targeted for introgression from wild emmer wheat acc. G18-16 into bread and durum wheat cultivars, SSR
markers used for selection, and recurrent backgrounds of the introgression lines.
Chromosome and flanking markers (cM) Details of target regiona Markers used for selectionc Recurrent backgrounds
QTLb LOD PEV
Chr.1BL Xgwm18 (74.0), Xgwm806 (130.7) GY-S 3.3 9.9 Xgwm18 (74.0), Xgwm748(107), Xgwm806 (130.7) Inbar, Uzan
Chr.2BS XwPt-8097 (38.4), XwPt-6576 (81.9) GY 11.9 13.1 Xgwm1128 (24.8), Xwmc35 (64.6), Xgwm1177 (78.9) Inbar, Uzan
HI 19.4 12.8
Chr.7AS Xgwm60 (0), XtPt-1755 (46) SpDM-d 4.4 7.3 Xgwm60 (0), Xwmc422 (51.0) / Xwmc596 (48.0)d BarNir, Zahir, Inbar
TotDM-d 3.3 9.0
Chr.7BS (XwPt-8920 (0), Xgwm537 (40.7) GY-d 8.6 12.7 Xgwm569 (0), Xgwm537 (61.12) Inbar
SpDM 9.0 12.5
HI 14.1 22.4
aTarget region locations, QTLs, Log of likelihood (LOD) and percent of variation explained (PEV) are based on Peleg et al. (2009).bQTLs conferred grain yield (GY), harvest index (HI), spike dry matter (SpDM) and total dry matter (TotDM) under drought (−d), as a susceptibility index (−S), or across the two treatments
(no letter appended).cSSR markers selected from our map (Peleg et al., 2008b) or from other published maps (Somers et al., 2004; Zhang et al., 2008) were used for selection.dMarker Xwmc422 was not polymorphic between the wild donor and cv. Zahir, Xwmc596 was used as replacement.
to 57 cM, whereas the flanking markers used for selection were48–61 cM apart. Extraction of genomic DNA was based on Doyleand Doyle (1990). PCR amplification of SSR markers followedPeleg et al. (2008b), fragment analysis was conducted usingan automated sequencer (3130XL, Applied Biosystems, FosterCity, CA) and analyzed with Peak Scanner Software version 2.1(Applied Biosystems).
For the development of near-isogenic lines (NILs), selectedrecombinant inbred lines containing wild donor (G18-16) allelesin the target regions with ∼50% domesticated backgrounds(cv. Langdon) were crossed as female parents with therecurrent cultivars (Figure S1). The resultant F1 plants weresubsequently backcrossed as male parents with the recurrentcultivars as females to restore the recurrent cytoplasmic genomes.BC1F1 (and subsequently BC2F1) plants with heterozygousgenotype in the target regions were selected by SSR markersand then backcrossed as female lines with the recurrentparent to produce BC3F1 plants, expected to contain ∼6%of the donor recombinant inbred line chromatin (∼3% wildchromatin). BC3F1 with heterozygous genotype in the targetregions were self-fertilized to produce BC3F2 progenies fromwhich homozygous genotypes for the wild allele were selectedusing molecular markers and selfed to produce BC3F3 NILs.In addition, BC3F2 progenies homozygous for the recurrentparent alleles in the target region were selfed to obtain near-isogenic controls (NICs). The developed lines were designatedas: NIL/NIC-P-Chr-#, where P is the first letter of the recurrentparent’s name (B, I, U, or Z), Chr is the chromosome containingthe introgression, and # is the line number.
Finally, the parental lines and most NILs and NICswere genotyped using the 15K array (TraitGenetics GmbH,Gatersleben, Germany) containing ∼13,000 markers that havebeen selected from the wheat 90K array (Wang et al.,2014). The genotypes of our lines were aligned with therecently published high density tetraploid wheat consensus mapintegrating SSR, DArT, and SNP markers (Maccaferri et al.,2015).
Growth ConditionsThe resultant NILs and NICs, as well as their recurrent parents,the wild donor line (G18-16) and domesticated parent of themapping population (cv. Langdon), were evaluated for theirdrought responses during the winters of 2012–13 (Year 1, BC3F3)and 2013–14 (Year 2, BC3F4). Most of the genotypes wereexamined across the two years, excluding a few that were availableand tested only in Year 2. Seeds were placed in moist germinationpaper for two weeks in a dark cold room (4◦C), followed by 3days acclimation at room temperature (22◦C). The seedlings werethen transplanted into an insect-proof screen house protectedby a polyethylene top at the experimental farm of The HebrewUniversity of Jerusalem in Rehovot, Israel (31◦54′N, 34◦47′E;54m above sea level). The soil at this location is brown-reddegrading sandy loam (Rhodoxeralf), composed of 76% sand,8% silt, and 16% clay (w/w). A split-plot factorial (genotype xirrigation regime) block design with five replicates was employed;each block consisted of two main plots (for the two irrigationregimes), splited into subplots for genotypes. Each subplotconsisted of a single row, with five plants, 10 cm apart (50-cmlong plots). Two 40-cm spaced rows were planted on each bed,with 100 cm between each pair of rows. The field was treated withfungicides and pesticides as needed, and was weeded manuallyonce a week. Two irrigation regimes were applied via a dripsystem: well-watered control (WW) and water-limited (WL). Tomimic the natural pattern of rainfall in the easternMediterraneanregion, water was applied during the winter months starting fromplanting (23 December 2012 and 19 December 2013 for Years1 and 2, respectively) and ending in early spring (31 March2013 and 23 March 2014, respectively) for the WL treatment,or later (28 Apr 2013 and 20 Apr 2014, respectively) for theWW treatment. The WW treatment was irrigated twice a week,whereas the WL treatment was irrigated twice every other week.The total seasonal water application was 710 and 670 mm forthe WW treatment, and 360 and 290 mm for the WL treatment,in Years 1 and 2, respectively. Weekly average temperatures inthe screen house varied between a minimum of 4–18◦C and a
Frontiers in Plant Science | www.frontiersin.org 3 April 2016 | Volume 7 | Article 452

Merchuk-Ovnat et al. Ancestral QTLs Improve Drought Resistance
maximum 24–47◦C (Figure 1). The number of hot days (>40◦C)recorded in Year 1 was 12 with the first occurrence in March, and23 in Year 2 with first occurrence in January.
Phenotypic MeasurementsHeading time, defined as the date at which the first spike of 50%of the plants in a plot was fully exposed, was recorded basedon daily inspection and used to calculate days from planting toheading (DP–H). Culm length (CL) was measured at maturityfrom the soil surface to the base of the three first spikes perplot. Osmotic potential (OP) was measured on 7 March and16 February for Years 1 and 2, respectively. Flag-leaf bladeswere sampled at dawn, placed in plastic tubes with their basesdipped in distilled water and kept for 6 h in a dark cold room(4◦C) for full rehydration. Leaves were removed from the water,blotted with a paper towel, placed in plastic test tubes, frozen inliquid nitrogen and kept at−18◦C until measurement. The leaveswere defrosted, the tube was pierced with hot needle, placedin a bigger test tube and centrifuged (15 min, 10,0000RPM)to obtain leaf sap. OP of the leaf sap was assessed using avapor pressure osmometer (model 5520; Wescor Inc., Logan, UT,USA). Osmotic adjustment (OA) was calculated as the differencebetween OP in the individual WL plots and the genotypic meanin the WW treatment (Blum, 1989). At full grain maturity, allaboveground biomass was harvested; spikes were counted toassess the number of fertile spikes per plant (Sp/P), separatedfrom the vegetative organs (stems and leaves), and both wereoven-dried (80◦C or 38◦C for 48 h for vegetative organs andspikes, respectively) and weighed. Spike dry matter and totaldry matter (TotDM) were determined. Samples (20 and 40 g forYears 1 and 2, respectively) of spikes from each plot were thenthreshed and used to calculate grain yield (GY), harvest index(HI=GY/TotDM), grain number per spike (G/Sp) and thousandgrain weight (TGW).
Statistical AnalysesDrought susceptibility index (S) was calculated for TotDMand GY according to Fischer and Maurer (1978) as: S =
(1−YWL/YWW)/(1−XWL/XWW), where YWL and YWW are the
FIGURE 1 | Average weekly minimum and maximum temperatures
measured in the screen house in Year 1 and Year 2.
mean performances of a specific genotype under the respectivetreatments, and XWL and XWW are the mean performances of allgenotypes under those treatments.
The JMP version 7.0 statistical package (SAS Institute, Cary,NC, USA) was used for statistical analyses. A factorial modelwas employed for the analysis of variance (ANOVA), conductedseparately for each recurrent parent and its derivative lines, withblocks as random effects and irrigation regime and genotype asfixed effects. Mean values of each NIL were compared with thoseof its recurrent parent and NIC (where available). The wild donorline (G18-16) and the mapping population domesticated parent(cv. Langdon) were presented as references without a statisticalanalyses.
The associations among the traits reflecting productivity anddrought responses were examined using correlation analysesand principal component analysis (PCA). Two componentswere extracted using eigenvalues >1 to ensure meaningfulimplementation of the data by each factor.
Heritability estimates (h2) were calculated for each trait undereach irrigation treatment using a linear regression coefficient (b)between BC3F3 (Year 1) and their BC3F4 progenies (Year 2)(Cahaner and Hillel, 1980).
RESULTS
Main Effects of Genotypes, WaterRegimes, and YearsFour genomic regions (Table 1) were successfully introgressed(out of six initially targeted regions), three of them into oneor two durum genetic backgrounds and one into two breadwheat and one durum background, resulting in a total of eighttarget x background combinations, with two to four sister NILsper combination. Out of the ∼13,000 SNP markers used togenotype the introgression lines and their parents, 7880 markerswere aligned with the two sub-genomes of the high densitytetraploid wheat consensus map (Maccaferri et al., 2015). Outof these, 4400–4800 (56–61%) SNPs exhibited polymorphismbetween the donor parental lines (G18-16 and Langdon) andtheir respective recurrent parent. In accordance with the expectedrate of donor chromatin (6%), between 3.3% and 9.5% ofpolymorphic markers were identified as introgressed fromeither G18-16 or Langdon, including the targeted genomicregions. The results of the SNP genotyping provided a highresolution confirmation for the introgressed genomic regions.SNP genotyping of selected NILs, containing the 2BS QTL inthe background of durum wheat cv. Uzan and 7AS QTL in thebackground of bread wheat cv. Bar Nir, as well as their respectiveparental genotypes are presented in Table S1.
ANOVA carried out separately for each of the recurrentcultivars and their derivative lines revealed highly significanteffects of genotype (G) and irrigation treatment (I) on mosttraits in both years (Tables S2, S3). GxI interactions were onlysignificant in a few cases, at a lower significance levels than thoseof the main effects. Potential plant productivity, averaged acrossall genotypes under WW treatment, was 25.6 g for GY and 50.6 gfor TotDM in Year 1, and 17.9 and 38.5 g, respectively, in Year 2.
Frontiers in Plant Science | www.frontiersin.org 4 April 2016 | Volume 7 | Article 452

Merchuk-Ovnat et al. Ancestral QTLs Improve Drought Resistance
The lower productivity in Year 2 presumably reflects the impactof higher temperatures (Figure 1) and abundance of heat spellsin that year. The average GY and TotDM production under theWL treatment was ∼51 and ∼50% of the WW control in Year 1and Year 2, respectively, suggesting a similar magnitude of waterstress in both years.
Heritability estimates were calculated based on parent–offspring correlation (between years) for durum and bread wheatseparately; about half of the estimates were found statisticallysignificant and varied between 0.53 and 0.99 (Table 2), indicatinga stable genotypic ranking across the 2 years. The highestheritability estimates across the two treatments were obtained forGY, TotDM, and DP–H in both bread and durum wheat.
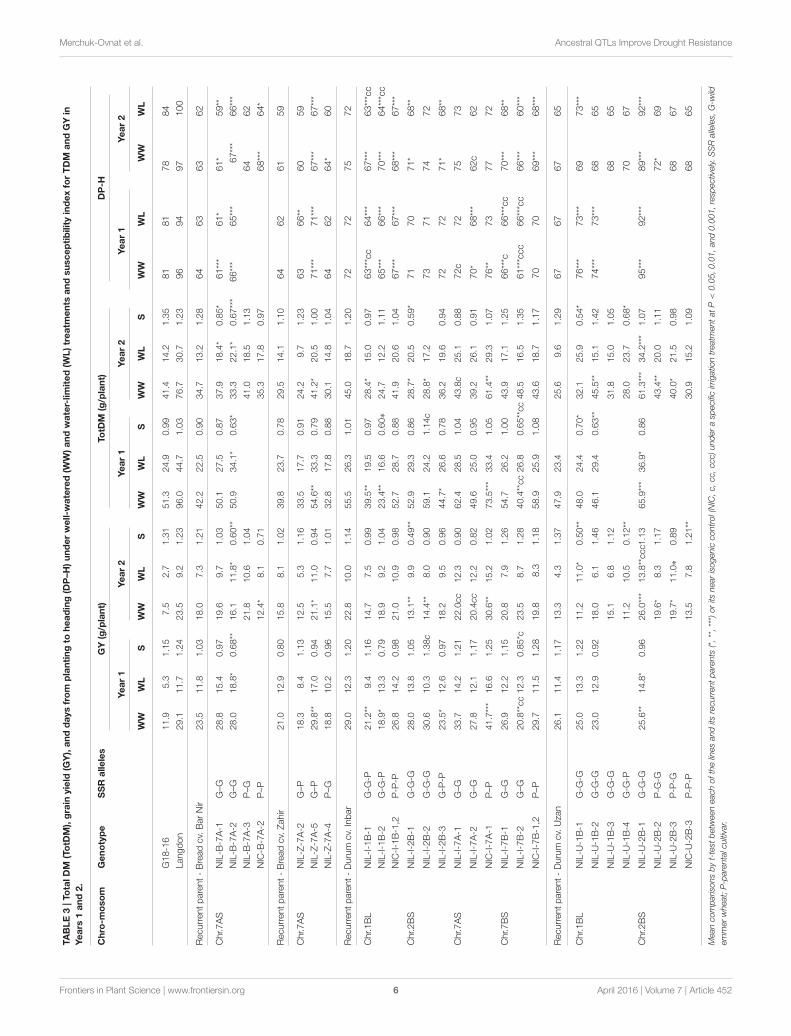
Performance of NILs by GeneticBackgroundThe wild donor line (G18-16) exhibited TotDM similar tothe recurrent cultivars, ∼50% lower GY and 8–18 days laterheading (Table 3, Figure 2A), whereas domesticated parent ofthe mapping population (cv. Langdon) exhibited about doubleTotDM, similar GY and 24–34 days delayed heading comparedto the recurrent parents.
Bread Wheat cv. Bar Nir and Derivatives
NILs that carry the introgression from wild emmer on Chr 7ASin the background of bread wheat cv. Bar Nir showed the mostpromising results. NIL-B-7A-2 exhibited a significant advantage(60%) consistently across the 2 years over the recurrent parentfor both GY and TotDM under the WL treatment (Table 3,Figure 2B). Zooming in on yield components of NIL-B-7A-2under drought showed an advantage over the recurrent parentin Sp/P and G/Sp (Table S4, Figure 3) across the two years,although it did not meet the common statistical threshold(Table S4). Similar trends were observed in NIL-B-7A-1 and
TABLE 2 | Estimated heritability for the measured traits: total dry matter
(TotDM), grain yield (GY), harvest index (HI), spikes per plant (Sp/P), grains
per spike (G/Sp), thousand grain weight (TGW), days from planting to
heading (DP–H), culm length (CL), and osmotic potential (OP), for each
ploidy level under WW, well-watered; WL, water-limited treatments.
Trait Heritability estimates
Bread wheat (n = 7) Durum wheat (n = 17)
WW WL WW WL
GY 0.85* 0.99*** 0.45 0.72***
TotDM 0.92** 0.91** 0.64** 0.72**
HI 0.35 −0.39 0.56* 0.69**
Sp/P 0.88** 0.89** 0.42 0.44
G/Sp 0.50 0.68 0.17 0.61**
TGW 0.25 0.82* 0.81*** 0.53*
DP–H 0.80* 0.73 0.82*** 0.92***
CL 0.96*** 0.95** −0.14 0.10
OP 0.20 0.66 0.37 0.50*
*, **, ***P < 0.05, 0.0,1 and 0.001, respectively, for the calculated linear regression
coefficient (b).
NIL-B-7A-3 (the latter containing a partial introgression),although in most cases they were not statistically significant.NIC-B-7A-2, a sister line of NIL-B-7A-2, did not differ fromthe recurrent parent, “Bar Nir,” thus supporting the assumptionthat the superior performance of the latter (NIL-B-7A-2) isgoverned by the introgressed region. The phenology (DP-H) ofthese NILs and NIC was slightly and inconsistently modified(significant; Table 3), whereas CL exhibited higher values in mostlines, with the exception of NIL-B-7A-3, which was similar to therecurrent parent (Table S5). Interestingly, NIL-B-7A-2 exhibitedalso a significantly lower OP under drought and greater OA, withsimilar trends observed in NIL-B-7A-3.
Bread Wheat cv. Zahir and Derivatives
Three NILs were introgressed with the Chr 7AS target regionfrom wild emmer in the background of bread wheat cv. Zahir,each containing a segment of the target region. NIL-Z-7A-5,which was introgressed with the upper segment of the 7AStarget region, exhibited between 32 and 45% advantage overthe recurrent parent in GY and TotDM (significant for WWand nearly significant for WL) coupled with 6–9 days delayedDP-H, consistently across the two years (Table 3, Figure 2C).NIL-Z-7A-2, also introgressed with the upper segment of the7AS target region, as well as NIL-Z-7A-4, introgressed with thelower segment, largely resembled the recurrent parent both inproductivity and phenology.
Durum Wheat cv. Inbar and Derivatives
Four target regions (on Chr 1BL, 2BS, 7AS, 7BS) were successfullyintrogressed into the background of durum wheat cv. Inbar.Nevertheless, none of these introgressions was associated withimproved productivity in the resultant NILs (Table 3). On thecontrary, in several cases, significantly lower productivity, interms of GY or TotDM, was recorded. Surprisingly, NIC-I-7A-1, which according to the SNP genotyping contains a small(8cM) unintentional introgression at the lower end of the 7AStarget region (and beyond), presented significantly higher GYand TotDM in both years under WW conditions.
Among the three yield components studied, in most cases,G/Sp was significantly reduced relative to the recurrent parent(Table S4). Introgression of the Chr 1BL and 7BS QTLs induced5- to 10-day earlier heading in the resultant NILs, as well as inthe respective NICs, albeit to a lesser extent (Table 3). The NILsintrogressed with Chr 2BS QTLs exhibited lower OP under theWL treatments and greater OA capacity in Year 2.
Durum Wheat cv. Uzan and Derivatives
Two target regions (on Chr 1BL and 2BS) were successfullyintrogressed into the background of durum wheat cv. Uzan, andboth showed significantly improved performance relative to therecurrent parent (Table 3).
Among the NILs carrying the 1BL target region introgressedin the background of cv. Uzan, NIL-U-1B-1 exhibited greater GYand TotDM under drought and a lower S (greater stability acrossenvironments) for both variables in Year 2, whereas NIL-U-1B-4exhibited similar trends which were only significant for S values.In these two lines, the improved GY in Year 2 was associated with
Frontiers in Plant Science | www.frontiersin.org 5 April 2016 | Volume 7 | Article 452
Merchuk-Ovnat et al. Ancestral QTLs Improve Drought Resistance
TABLE3|To
talDM
(TotD
M),grain
yield
(GY),anddaysfrom
plantingto
heading(D
P–H
)underwell-w
atered(W
W)andwater-limited(W
L)treatm
ents
andsusceptibilityindexforTDM
andGYin
Years
1and2.
Chro-m
osom
Genotype
SSR
alleles
GY(g/plant)
TotD
M(g/plant)
DP-H
Year1
Year2
Year1
Year2
Year1
Year2
WW
WL
SWW
WL
SWW
WL
SWW
WL
SWW
WL
WW
WL
G18-16
11.9
5.3
1.15
7.5
2.7
1.31
51.3
24.9
0.99
41.4
14.2
1.35
81
81
78
84
Langdon
29.1
11.7
1.24
23.5
9.2
1.23
96.0
44.7
1.03
76.7
30.7
1.23
96
94
97
100
Recurrentparent-Breadcv.BarNir
23.5
11.8
1.03
18.0
7.3
1.21
42.2
22.5
0.90
34.7
13.2
1.28
64
63
63
62
Chr.7AS
NIL-B
-7A-1
G–G
28.8
15.4
0.97
19.6
9.7
1.03
50.1
27.5
0.87
37.9
18.4*
0.85*
61***
61*
61*
59**
NIL-B
-7A-2
G–G
28.0
18.8*
0.68**
16.1
11.8*
0.60**
50.9
34.1*
0.63*
33.3
22.1*
0.67***
66***
65***
67***
66***
NIL-B
-7A-3
P–G
21.8
10.6
1.04
41.0
18.5
1.13
64
62
NIC-B
-7A-2
P–P
12.4*
8.1
0.71
35.3
17.8
0.97
68***
64*
Recurrentparent-Breadcv.Zahir
21.0
12.9
0.80
15.8
8.1
1.02
39.8
23.7
0.78
29.5
14.1
1.10
64
62
61
59
Chr.7AS
NIL-Z-7A-2
G–P
18.3
8.4
1.13
12.5
5.3
1.16
33.5
17.7
0.91
24.2
9.7
1.23
63
66**
60
59
NIL-Z-7A-5
G–P
29.8**
17.0
0.94
21.1*
11.0
0.94
54.6**
33.3
0.79
41.2*
20.5
1.00
71***
71***
67***
67***
NIL-Z-7A-4
P–G
18.8
10.2
0.96
15.5
7.7
1.01
32.8
17.8
0.88
30.1
14.8
1.04
64
62
64*
60
Recurrentparent-Durum
cv.Inbar
29.0
12.3
1.20
22.8
10.0
1.14
55.5
26.3
1.01
45.0
18.7
1.20
72
72
75
72
Chr.1BL
NIL-I-1B-1
G-G
-P21.2**
9.4
1.16
14.7
7.5
0.99
39.5**
19.5
0.97
28.4*
15.0
0.97
63***cc
64***
67***
63***cc
NIL-I-1B-2
G-G
-P18.9*
13.3
0.79
18.9
9.2
1.04
23.4**
16.6
0.60∗
24.7
12.2
1.11
65***
66***
70***
64***cc
NIC-I-1B-1,2
P-P
-P26.8
14.2
0.98
21.0
10.9
0.98
52.7
28.7
0.88
41.9
20.6
1.04
67***
67***
68***
67***
Chr.2BS
NIL-I-2B-1
G-G
-G28.0
13.8
1.05
13.1**
9.9
0.49**
52.9
29.3
0.86
28.7*
20.5
0.59*
71
70
71*
68**
NIL-I-2B-2
G-G
-G30.6
10.3
1.38c
14.4**
8.0
0.90
59.1
24.2
1.14c
28.8*
17.2
73
71
74
72
NIL-I-2B-3
G-P
-P23.5*
12.6
0.97
18.2
9.5
0.96
44.7*
26.6
0.78
36.2
19.6
0.94
72
72
71*
68**
Chr.7AS
NIL-I-7A-1
G–G
33.7
14.2
1.21
22.0cc
12.3
0.90
62.4
28.5
1.04
43.8c
25.1
0.88
72c
72
75
73
NIL-I-7A-2
G–G
27.8
12.1
1.17
20.4cc
12.2
0.82
49.6
25.0
0.95
39.2
26.1
0.91
70*
68***
62c
62
NIC-I-7A-1
P–P
41.7***
16.6
1.25
30.6**
15.2
1.02
73.5***
33.4
1.05
61.4**
29.3
1.07
76**
73
77
72
Chr.7BS
NIL-I-7B-1
G–G
26.9
12.2
1.15
20.8
7.9
1.26
54.7
26.2
1.00
43.9
17.1
1.25
66***c
66***cc
70***
68**
NIL-I-7B-2
G–G
20.8**cc12.3
0.85*c
23.5
8.7
1.28
40.4**cc26.8
0.65**cc48.5
16.5
1.35
61***ccc
66***cc
66***
60***
NIC-I-7B-1,2
P–P
29.7
11.5
1.28
19.8
8.3
1.18
58.9
25.9
1.08
43.6
18.7
1.17
70
70
69***
68***
Recurrentparent-Durum
cv.Uzan
26.1
11.4
1.17
13.3
4.3
1.37
47.9
23.4
25.6
9.6
1.29
67
67
67
65
Chr.1BL
NIL-U
-1B-1
G-G
-G25.0
13.3
1.22
11.2
11.0*
0.50**
48.0
24.4
0.70*
32.1
25.9
0.54*
76***
73***
69
73***
NIL-U
-1B-2
G-G
-G23.0
12.9
0.92
18.0
6.1
1.46
46.1
29.4
0.63**
45.5**
15.1
1.42
74***
73***
68
65
NIL-U
-1B-3
G-G
-G15.1
6.8
1.12
31.8
15.0
1.05
68
65
NIL-U
-1B-4
G-G
-P11.2
10.5
0.12**
28.0
23.7
0.68*
70
67
Chr.2BS
NIL-U
-2B-1
G-G
-G25.6**
14.8*
0.96
26.0***
13.8**ccc1
.13
65.9***
36.9*
0.86
61.3***
34.2***
1.07
95***
92***
89***
92***
NIL-U
-2B-2
P-G
-G19.6*
8.3
1.17
43.4**
20.0
1.11
72*
69
NIL-U
-2B-3
P-P
-G19.7*
11.0∗
0.89
40.0*
21.5
0.98
68
67
NIC-U
-2B-3
P-P
-P13.5
7.8
1.21**
30.9
15.2
1.09
68
65
Meancomparisonsbyt-testbetweeneachofthelinesanditsrecurrentparents(*,**,***)oritsnearisogeniccontrol(NIC,c,cc,ccc)underaspecificirrigationtreatmentatP
<0.05,0.01,and0.001,respectively.SSRalleles,G-wild
emmerwheat;P-parentalcultivar.
Frontiers in Plant Science | www.frontiersin.org 6 April 2016 | Volume 7 | Article 452

Merchuk-Ovnat et al. Ancestral QTLs Improve Drought Resistance
FIGURE 2 | Photographs of typical experimental plots of mapping population parental lines (A), recurrent parents and their derivative NILs (B–D) in
Year 1 under the well-watered (WW) and water limited (WL) treatments.
greater Sp/P, G/Sp (Figure 3) and TGW, although these effectswere only significant in a few cases (Table S4). Compared to therecurrent parent, heading time of NIL-U-1B-1 was delayed by∼6days (averaged across the two years and treatments), whereas itwas not significantly delayed in NIL-U-1B-4 (Table 3). Both NILsexhibited a slight increase in CL, which was significant in only acouple of cases.
For the 2BS target region, three NILs were developed (NIL-U-2B-1, 2, and 3), each containing a different segment of the target(3, 2, and 1 markers, respectively), as well as one NIC. NIL-U-2B-1, containing the entire target region (3 markers), consistentlyexhibited the highest GY and TotDM among the three NILsacross years and treatments, accompanied by a 25 day-delayedheading time (Table 3, Figure 2D), which makes it unsuitable formeaningful comparison to the recurrent parent. The two otherNILs, tested only in Year 2, also exhibited improved productivityacross the two treatments without a major modification in theirphenology. NIC-U-2B-3, a sister line of NIL-U-2B-3 and alsorelated to the other two NILs, did not differ from the recurrentparent, ‘Uzan,’ thus validating the effects of the introgressed QTLregion. All three NILs exhibited greater (and usually significant)Sp/P and TGW compared to the recurrent parent (Table S4).
Association between Productivity andRelated TraitsThe PCA analyses of the introgression lines and recurrent parents(n = 25 and 32 in Years 1 and 2, respectively) extracted twomajor principal components (eigenvalues >1) that accounted,
collectively between 58.7 and 63.5% of the variance for eachtreatment x year combination (Figure 4). All four PCAs revealeda fairly clear separation between the durum wheat genotypes (inblue or green) and the bread wheat genotypes (in orange or red).Under the WW treatment, PCAs exhibited similar trends acrossyears (Figures 4A,C); PC1 (X-axis) was positively loaded withTotDM, GY, Sp/P, and DP–H, whereas PC2 (Y-axis) was loadedwith G/Sp and at the opposite direction with TGW and OP. Incontrast, under the WL treatment, mixed trends were observedacross years.
Correlation analyses of GY vs. yield components andphysiological traits were conducted separately for durum andbread genotypes in each of the four environments. In mostcases, GY exhibited highly significant positive correlations withboth TotDM and Sp/P (Table 4) in agreement with the similardirections of these traits’ vectors in all four PCAs (Figure 4).Among the two other yield components, G/Sp correlatedpositively with GY only in two cases in the durum genotypes,whereas TGW did not show any significant correlation to GY.
DISCUSSION
QTL mapping is a widely accepted approach to dissectquantitative traits into their single genetic determinants andrelating phenotypic differences to their genetic basis (Paterson,1995; Tuberosa and Salvi, 2006; Collins et al., 2008). A largenumber of QTL studies have been published in the last fewdecades on various traits in crop plants, including wheat.
Frontiers in Plant Science | www.frontiersin.org 7 April 2016 | Volume 7 | Article 452

Merchuk-Ovnat et al. Ancestral QTLs Improve Drought Resistance
FIGURE 3 | Three first spikes of the wild emmer wheat donor acc. G18-16 (articulated) the recurrent parents bread wheat Bar Nir and durum wheat Uzan and
their derivative NILs, grown under water-limited treatment, 2013-14.
TABLE 4 | Correlation of various traits with grain yield (GY) under the different treatments and years.
Trait Confidents of correlation with GY
Bread wheat Durum wheat
Year 1 (n = 7) Year 2 (n = 9) Year 1 (n = 17) Year 2 (n = 22)
WW WL WW WL WW WL WW WL
TotDM 0.99*** 0.98*** 0.81** 0.96*** 0.86*** 0.67 0.89*** 0.90***
HI −0.13 0.50 0.43 0.08 0.04 0.05 0.33 0.38
Sp/P 0.66 0.82* 0.68* 0.83** 0.74*** 0.57* 0.86*** 0.92***
G/Sp 0.63 0.70 −0.03 0.22 0.51* 0.32 0.37 0.60**
TGW 0.20 −0.13 0.06 0.15 0.10 0.48 0.12 0.04
DP–H 0.43 0.30 0.05 0.66 0.29 0.47 0.46* 0.53*
CL 0.70 −0.14 −0.11 0.19 0.38 0.25 0.69*** 0.73***
OP −0.52 0.61 0.34 −0.57 −0.17 0.21 0.49* 0.55**
OA −0.27 −0.29 0.44 0.45 −0.15 −0.21 −0.15 −0.47*
*, **, ***P < 0.05, 0.01, and 0.001, respectively.
Nevertheless, the number of studies attempting to validatemapped QTLs and explore their potential for crop breeding isvery small, particularly with respect to complex polygenic traitssuch as yield and responses to abiotic-stresses (Cattivelli et al.,
2008; Levi et al., 2009; Salvi and Tuberosa, 2015). Therefore,the current study provides a unique opportunity to evaluate thepotential of QTL introgression via marker assisted selection forthe improvement of such traits.
Frontiers in Plant Science | www.frontiersin.org 8 April 2016 | Volume 7 | Article 452

Merchuk-Ovnat et al. Ancestral QTLs Improve Drought Resistance
FIGURE 4 | Principal component analysis (PCA) based on correlation matrix of traits: (TotDM), total dry matter; (GY), grain yield; (HI), harvest index;
(Sp/P), spikes per plant; (G/Sp), grains per spike; (TGW), thousand grain weight; (DP–H), days from planting to heading; (CL), culm length; fertile
spikes per plant, (OP), osmotic potential; recorded on 25 and 32 genotypes in Year 1 (A,B) and Year 2 (C,D), respectively, under well-watered (WW),
and water-limited (WL) irrigation regimes. Biplot vectors are trait factor loadings for PC1 and PC2. Each of the recurrent cultivar groups is colored differently (cv.
Inbar–blue, cv. Uzan–green, cv. Bar Nir–orange, cv. Zahir–red). Recurrent cultivars are indicated by open symbols.
Validation of the Introgressed QTL AllelesThe Chr 7AS target region, in which the wild allele conferred, inour previous mapping study (Peleg et al., 2009), higher GY andTotDM exclusively under WL conditions (inductive QTLs), wasintrogressed into three genetic backgrounds. NILs introgressedwith this region in the background of durum wheat cv. Inbardid not manifest improved productivity (Table 3). Nevertheless,NIC-I-7A-1, containing a small unintentional introgression atthe lower end of the 7AS target region, exhibited improvedproductivity in both years under WW conditions. This findingsuggests that cv Inbar can be improved by wild emmer alleleintrogressions, which is however subjected toQTL× backgroundand G× E interactions.
In the background of bread wheat cv. Bar Nir, SNP genotypingshowed two separate introgressions within the Chr 7AS targetregion (Table S1), which might have resulted from a doublerecombination that was not identified due to absence ofcentral marker for selection. Nevrtheless, NILs introgressedwith this regions into the background of Bar Nir exhibited a
pronounced improvement in GY and TotDM production, whichwas found to be significant only under WL treatment (Table 3,Figure 2B), thus validating the QTL X environment interaction.Introgression of the upper part of this genomic region intothe background of cv. Zahir (NIL-Z-7A-5) also improvedplant productivity, which was found to be significant underWW treatment and somewhat below significance thresholdin WL treatment (Figure 2C). NIL-Z-7A-2, selected for thesame introgression did not exhibit such advantage, presumablybecause of a modified introgression which was not traced (SNPgenotyping not available).
The 7AS genomic region seems to play a major role withrespect to productivity and stress responses in wheat. A largenumber of studies, using a wide variety of genetic materialsand populations, have found a large number of QTLs fornumerous traits in the 7AS chromosome arm, including plantproductivity, yield components, phenology, morphology,physiology and metabolites (Table S6 and referencestherein).
Frontiers in Plant Science | www.frontiersin.org 9 April 2016 | Volume 7 | Article 452

Merchuk-Ovnat et al. Ancestral QTLs Improve Drought Resistance
QTLs for drought (Quarrie et al., 2006; Bennett et al., 2012;Hill et al., 2013) and salinity (Shavrukov et al., 2011) tolerance,two related abiotic stresses (Munns, 2002), were also mappedto the 7AS chromosome arm, thus expanding the scope ofthis region for improving abiotic-stress resistance in wheat.QTLs associated with several tricarboxylic acid (TCA) cycleintermediates were mapped on 7AS (Hill et al., 2013). ModifiedTCA-cycle intermediate levels have been associated with OA anddrought resistance in cotton (Gossypium spp.; Levi et al., 2011).Thus, it is possible that a change in TCA intermediates (notmeasured in the current study) contributed to the superior OAfound in NIL-B-7A-2 and 3 (Table S5).
QTLs for time to heading were previously mapped withinthe chromosome 7AS target region as well as somewhat aboveit (Maccaferri et al., 2014 and references therein). It is possiblethat an introgression of such QTL(s) is responsible for thelater time to heading (higher DP-H) observed in several ofour 7AS NILs. Nevertheless, heading time of the NILs in thebackgrounds of Bar-Nir was only 2–4 days delayed, which enablestheir comparison to the parental genotypes. Moreover, NIL-B-7A-2 and NIC-B-7A-2 had the same DP-H and yet onlythe NIL exhibited superior productivity under drought, thusconfirming the effect of the introgression regardless of the laterphenology.
The Chr 7BS target region, in which the wild allele conferred, inour previousmapping study (Peleg et al., 2009), greater GY underdrought, higher spike dry matter and HI under both treatments,was introgressed into the background of durum wheat cv. Inbar.The respective NILs (NIL-I-7B-1 and NIL-I-7B-2) exhibited noimprovement in yield (Table 3), thus failing to validate the QTLeffect. Both NILs exhibited earlier DP-H than their recurrentparent, validating the phenology QTLs mapped in this region byPeleg et al. (2009).
The Chr 1BL target region, in which the wild allele conferred,in our previous mapping study (Peleg et al., 2009), lower GY-S(higher stability across environments), was introgressed into twodurum wheat backgrounds.
NILs introgressed with this QTL into the background ofdurum cv. Inbar did not validate the expected phenotype. Inthe background cv. Uzan, out of the four NILs introgressedwith the 1BL target region, two lines (NIL-U-1B-1 and NIL-U-1B-4) exhibited remarkable stability across environments, thusvalidating the QTL phenotype (Table 3). Moreover, under WLconditions, these two NILs also presented higher productivityin terms of GY and TotDM with no modification in plantphenology, as compared to their recurrent parent, demonstratingthis QTL’s potential for enhancing wheat performance underdrought conditions in certain genetic contexts. This advantagewas associated with a greater number of Sp/P and G/Sp, whilemaintaining a stable TGW (Table S4).
The Chr 2BS target region, in which the wild allele wasresponsible for a higher GY and HI (Peleg et al., 2009), wasintrogressed into two durum wheat backgrounds (Inbar andUzan).
In the background of durum cv. Inbar, no improvement inGY or HI was recorded in most cases, whereas in a few cases,significantly lower productivity was observed (Table 3).
In the background of durum wheat cv. Uzan, the set ofNILs introgressed with various segments of the 2BS QTLregion (Table S1) provide an opportunity to break down theintrogressed QTL. NIL-U-2B-1, containing the entire QTLregion, exhibited a pronounced advantage in productivity overthe parental cultivar (Table 3, Figure 2D), which may reflect theconsiderably later heading date of the NIL. QTLs for phenology(Hanocq et al., 2004; Maccaferri et al., 2008, 2010) as well asthe gene PPD-B1, responsible for a photoperiod-insensitivity(Maccaferri et al., 2014) have been previously mapped in the 2BSchromosome arm using various populations. Such QTLs werenot mapped in our previous study (Peleg et al., 2009), suggestingthe absence of polymorphism in the respective loci between thetwo late-heading parental lines (Table 3), in contrast to the earlierheading of the recurrent parent.
Interestingly, both NIL-U-2B-2 and NIL-U-2B-3, which donot contain the wild allele in the upper part of the targetregion, also exhibited superior performance over the recurrentparent with a similar phenology (Tables 3). The superior yieldexhibited by NIL-U-2B-3, containing only the lowest part of thetarget region, highlights this segment as the locus of interest.The performance of the near-isogenic control (NIC-U-2B-3) wassimilar to that of the parental genotype and inferior to the threeNILs (significant only for NIL-U-2B-1), thus further validatingthe QTL effect.
The current study validated the Chr 2BS QTLs for GY and CLwhich were mapped in the same population (Peleg et al., 2009),in agreement with a published QTL for GY (Verma et al., 2004).The respective NILs also exhibited greater TotDM and TGW,the latter in agreement with a published QTL (Kumar et al.,2006).
Environmental and PhysiologicalConsiderationsFour genomic regions carrying QTLs conferring droughtresistance (Peleg et al., 2009) were introgressed from the wildemmer wheat donor line into elite durum or bread wheatcultivars. Three of these introgressions were validated in a specificgenetic background: two in the background of durum cultivarUzan, and the third in the backgrounds of two high-yieldingbread wheat cultivars. Moreover, in most of these cases, theQTL X environment interaction (Peleg et al., 2009) was alsovalidated, i.e., an inductive effect specifically expressed underdrought for the 7AS QTL, a constitutive effect expressed underboth treatments for the 2BS QTL, and a greater stability acrossthe two treatments for the 1BL QTL. The phenotypic effects ofthe QTL introgressions were usually consistent across the twoyears, thus lending further support to the validation of the QTLeffects. In our previous mapping studies in cotton (Saranga et al.,2001) and wheat (Peleg et al., 2009), partially different sets ofQTLs accounted for plant productivity under contrasting watertreatments (i.e., WW and WL), suggesting that adaptation toboth conditions can be combined in the same genotype. Thecurrent validation of QTL X environment interaction reinforcesthe importance of these results and their applicability. Therelatively high heritability estimates of TotDM and GY (Table 2)
Frontiers in Plant Science | www.frontiersin.org 10 April 2016 | Volume 7 | Article 452

Merchuk-Ovnat et al. Ancestral QTLs Improve Drought Resistance
reflect a high degree of consistency between the two years and ahigh potential for improvement through selection.
Among the three yield components recorded in our study,Sp/P exhibited the highest correlation with GY consistentlyacross all years, treatments and ploidy levels (Table 4). Moreover,NILs that exhibited an advantage in GY compared to theirrecurrent parent (Tables 3) also exhibited higher Sp/P (althoughnot always significant, Table S4), a trait that seems to havebeen contributed by wild donor acc. G18-16 (Figure 2A). Anoptimal balance between sowing rates and plant tillering can beachieved when using restricted tillering lines in a predictableenvironment (Donald, 1968); however, results from the current(Table 4) as well as other studies (Reynolds et al., 2000; Naruokaet al., 2011) indicate that plasticity in terms of fertile Sp/P orper area is a very important attribute for yield progress. Free-tillering lines are better able to respond to the environment,thus shaping yield components in accordance with dynamicenvironmental cues such as precipitation, temperature, nutrientavailability and plant competition (Assuero and Tognetti, 2010;Evers and Vos, 2013; Moeller et al., 2014). Therefore, highertillering capacity may be beneficial in semi-arid Mediterranean-type environments, particularly under the projected increasinglyerratic climate conditions (Wheeler and Von Braun, 2013).
Prospects for Wheat ImprovementEmpirical selection has largely improved drought adaptationin wheat through earlier flowering, reduced plant height andincreased HI (Richards et al., 2010). Once the major genesfor these traits have been fixed in the modern germplasmand exploited, there is a crucial need to identify and deploygenes or alleles conferring genuine improvement of the plants’physiological capacity to tolerate drought stress (Curtis andHalford, 2014; Lopes et al., 2014). Harnessing QTL alleles fromwild relatives is essential for enhancing drought tolerance andother important traits (Tuberosa and Salvi, 2006). Nevertheless,most mapping studies utilize domesticated materials, while therehas been hardly any attempt to map QTLs originated from wildgermplasm (e.g., Table S6 and references therein). Therefore,the current study provides a unique opportunity to identify andreintroduce genes or alleles that were “left behind” during cropdomestication and breeding, thereby enriching the modern genepool with essential allelic diversity.
Tuberosa and Salvi (2006) argued that a major pitfall of mostQTL studies lies in the selection of parental lines based ondifferences in target traits, rather than on their overall agronomicvalue. High drought resistance and water-use efficiency areoften associated with reduced yield potential (Blum, 2009), andtherefore selection of parental lines based mainly on the formercriteria can lead to a mapping population that is characterizedby poor productivity. A different approach was employed in ourprevious study (Peleg et al., 2005), in which we identified sevenwild emmer natural populations with the greatest potential forwheat improvement based on a combination of high productivityand low susceptibility. One of these populations, included acc.G18-16, the parental line of ourmapping study (Peleg et al., 2009)and the donor of the current introgression study. The use of ahigh-yielding cultivar (Langdon, Figure 2A) as the domesticated
parent possibly eliminated from our genetic map QTL allelesfor yield potential that are already available in the domesticatedgene pool (that could have been identified with a less productivedomesticated parent), thus highlighting the most beneficial wildalleles. Finally, the QTLs targeted for introgression in this workwere chosen specifically for improvement of production capacityparticularly under drought and for their stability across wateravailabilities, a strategy that proved successful across the twoexperiments in this study.
The current introgression lines were developed based on ourprevious mapping study, in which a total of 152 recombinantinbred lines were genotyped by a set of 690 SSR and DArTmarkers (Peleg et al., 2009), yielding a relatively low resolutionQTL map. As a result, relatively large genomic regions weretargeted for introgression. These large chromosomal segmentscontain hundreds of genes, many of which may have negativeeffects on the performance of the resultant lines, on their own orin interaction with either other genes or environmental factors(Salvi and Tuberosa, 2015). It is possible that the NILs thatfailed to validate the QTL effects in all or specific backgroundsreflected such negative effects. Moreover, elite cultivars presentan optimal balance between all plant systems and gene networks,which might have been interrupted by such large introgressions.Modern high-throughput genotyping (e.g., SNP marker chips)and phenotyping (e.g., remote sensing) technologies, which haverecently become more readily available and affordable, enable theuse of large plant populations with thousands of genetic markers,and are thus expected to improve map resolution and enablemore focused introgression studies, paving the way to a betterexploration of genetic resources.
The introgression of favorable traits from wild relatives wasrecognized as a potential pathway for wheat improvement longago (Aaronsohn, 1910). Nevertheless, a recent genome-widediversity study of landraces and modern cultivars of hexaploidwheat suggests that past efforts have not notably altered thegenetic composition of elite cultivars (Cavanagh et al., 2013).It was also noted that the contribution of advanced genomics-assisted technologies to develop drought-resistant cultivars hasbeen limited so far (Tuberosa and Salvi, 2006; Salvi and Tuberosa,2015).
CONCLUDING REMARKS
The current study provides first evidence that introgressionof ancestral QTL alleles from wild emmer wheat can enhanceproductivity and drought resistance in domesticated wheat.A number of NILs exhibited significant advantage over theirrecurrent parents under the test environment, i.e., drip irrigatedsmall plots in a rain protected facility. However, undercommercial open field conditions competition and genotypex environment interactions might affect plant performances.Preliminary results from an ongoing study suggest that selectedNILs maintain their advantage over the parental genotypes alsoin larger field plots, though to a smaller extent. Other currentstudies in our lab deal with physiological mechanisms underlyingdrought responses in selected NILs and fine mapping of selected
Frontiers in Plant Science | www.frontiersin.org 11 April 2016 | Volume 7 | Article 452

Merchuk-Ovnat et al. Ancestral QTLs Improve Drought Resistance
genomic regions. The novel results obtained thus far and thefindings of our current studies may pave the way to improvingwheat productivity in arid regions, thereby enhancing global foodsecurity under climate change toward increasing aridity.
AUTHOR CONTRIBUTIONS
LM student, marker assisted selection for development of nearisogenic lines, phenotyping, data analysis and interpretation,manuscript preparation. VB, marker assisted selection fordevelopment of near isogenic lines, phenotyping, manuscriptreview. TF co-principle investigator, coordination, and guidanceof marker assisted selection for development of near isogeniclines, manuscript review. FO, SNP genotyping of near isogeniclines, manuscript review. GL marker assisted selection fordevelopment of near isogenic lines, manuscript review. TK co-principle investigator, coordination, and guidance of markerassisted selection for development of near isogenic lines,manuscript review. YS principle investigator, coordination,supervision and guidance of marker assisted selection fordevelopment of near isogenic lines, phenotyping, data analysisand interpretation, manuscript preparation.
ACKNOWLEDGMENTS
This study was supported by The Israel Ministry of Agricultureand Rural Development, Chief Scientist Foundation (Grants 837-0079-10, 837-0162 - 14. and the German FederalMinistry of Foodand Agriculture (FKZ: 2813IL03) LM is indebted to the R.H.Smith Foundation for a doctoral fellowship award. We thankZ. Peleg for fruitful discussions and assistance with genetic mapconstruction. We thank Ronen Livni for the photographic work.Finally, we thank Shiran Ben-Zeev, Jajaw Bimro, Roni Gafni,Noya Ruth Itzhak, Ben Mansfeled, Shebolet Muntz, and YannaiZausmer for their excellent assistance in the field and in thelaboratory. YS is the incumbent of the Haim Gvati Chair inAgriculture.
SUPPLEMENTARY MATERIAL
The Supplementary Material for this article can be foundonline at: http://journal.frontiersin.org/article/10.3389/fpls.2016.00452
Figure S1 | Pedigree of the developed near-isogenic lines and
near-isogenic controls. G and P designate the wild and domesticated alleles at
the target region. Genotypes indicated by strikeout line were excluded from the
backcross program.
Table S1 | SNP genotyping of selected NILs, NICs and parental lines for
chromosomes 7A and 2B, aligned with the high density tetraploid wheat
consensus map (Maccaferri et al., 2015, Table S2). Yellow highlighted cells
indicate the target genomic regions (columns A & R) and the estimated
introgressed segments (columns M-P & AD-AG); markers used for selection or
alternative co-located markers are highlighted in Red . (1) A, G, C, and T indicate
the respective nucleotides; (2) G, L, P, and NP indicate wild donor G18-16,
Langdon and recurrent parent alleles, or non-polymorphic SNP,
respectively.
Table S2 | Analysis of variance for total dry matter (TotDM), grain yield
(GY), their susceptibility (TotDM-s and GY-s), days from planting to
heading (DP–H), spike number per plant (Sp/P), grain number per spike
(G/Sp), 1000 grain weight (TGW), harvest index (HI), culm length (CL),
osmotic potential (OP), and osmotic adjustment (OA) in the 2012–13
experiment (Year 1). In parentheses, degrees of freedom for S and OA values.
Table S3 | Analysis of variance for total dry matter (TotDM), grain yield
(GY), their susceptibility (TotDM-s and GY-s), days from planting to
heading (DP–H), spike number per plant (Sp/P), grain number per spike
(G/Sp), 1000 grain weight (TGW), harvest index (HI), culm length (CL),
osmotic potential (OP) and osmotic adjustment (OA) in the 2013–14
experiment (Year 2). In parentheses, degrees of freedom for S and OA
values.
Table S4 | Spike per plant (Sp/P), grains per spike (G/Sp) and 1000 grain
weight (TGW) under the well-watered (WW) and water-limited (WL)
treatments in Year 1 and Year 2.
Table S5 | Harvest index (HI), culm length (CL) and osmotic potential (OP)
under the well-watered (WW) and water-limited (WL) treatments, and
calculated osmotic adjustment (OA) in Year 1 and Year 2.
Table S6 | Summary of published QTLs or genes for productivity and
drought-related traits, mapped to chromosome 7AS in durum and bread
wheat: GY, grain yield; Sp/P, spikes per plant; TGW, 1000 grain weight;
DP–H, days from planting to heading; WW, well-watered; WL,
water-limited.
REFERENCES
Aaronsohn, A. (1910).Agricultural and Botanical Explorations in Palestine. Bulletin
No. 180. Washington, D.C: U.S. Department of Agriculture, Bureau of Plant
Industry.
Araus, J. L., Slafer, G. A., Royo, C., and Serret, M. D. (2008). Breeding for yield
potential and stress adaptation in cereals. Crit. Rev.Plant Sci. 27, 377–412. doi:
10.1080/07352680802467736
Assuero, S. G., and Tognetti, J. A. (2010). Tillering regulation by endogenous and
environmental factors and its agricultural management. Am. J. Plant Sci. Biol.
4, 35–48.
Bennett, D., Reynolds, M., Mullan, D., Izanloo, A., Kuchel, H., Langridge, P.,
et al. (2012). Detection of two major grain yield QTL in bread wheat (Triticum
aestivum L.) under heat, drought and high yield potential environments. Theor.
Appl. Genet. 25, 1473–1485. doi: 10.1007/s00122-012-1927-2
Blum, A. (1988). Plant Breeding for Stress Environments. Boca Raton, FL: CRC
Press
Blum, A. (1989). Osmotic adjustment and growth of barley genotypes under
drought stress. Crop Sci. 29, 230–233.
Blum, A. (2009). Effective use of water (EUW) and not water-use efficiency (WUE)
is the target of crop yield improvement under drought stress. Field Crops Res.
112, 119–123. doi: 10.1016/j.fcr.2009.03.009
Boyer, J. S. (1982). Plant productivity and environment. Science 218, 443–448.
Cahaner, A., and Hillel, J. (1980). Estimating heritability and genetic correlation
between traits from generations F2 and F3 of self-fertilizing species:
a comparison of three methods. Theor. Appl. Genet. 58, 33–38. doi:
10.1007/BF00264666
Cattivelli, L., Rizza, F., Badeck, F.-W., Mazzucotelli, E., Mastrangelo, A. M.,
Francia, E., et al. (2008). Drought tolerance improvement in crop plants: an
integrated view from breeding to genomics. Field Crops Res. 105, 1–14. doi:
10.1016/j.fcr.2007.07.004
Cavanagh, C. R., Chao, S., Wang, S., Huang, B. E., Stephen, S., Kiani, S.,
et al. (2013). Genome-wide comparative diversity uncovers multiple targets of
selection for improvement in hexaploid wheat landraces and cultivars. Proc.
Natl. Acad. Sci. U.S.A. 110, 8057–8062. doi: 10.1073/pnas.1217133110
Challinor, A., Watson, J., Lobell, D., Howden, S., Smith, D., and Chhetri, N. (2014).
A meta-analysis of crop yield under climate change and adaptation. Nat. Clim.
Chang. 4, 287–291. doi: 10.1038/nclimate2153
Frontiers in Plant Science | www.frontiersin.org 12 April 2016 | Volume 7 | Article 452

Merchuk-Ovnat et al. Ancestral QTLs Improve Drought Resistance
Collins, N. C., Tardieu, F., and Tuberosa, R. (2008). Quantitative trait loci and
crop performance under abiotic stress: where do we stand? Plant Physiol. 147,
469–486. doi: 10.1104/pp.108.118117
Curtis, T., and Halford, N. (2014). Food security: the challenge of increasing wheat
yield and the importance of not compromising food safety. Ann. App. Biol. 164,
354–372. doi: 10.1111/aab.12108
Donald, C. M. (1968). The breeding of crop ideotypes. Euphytica 17, 385–403.
Doyle, J. L., and Doyle, J. (1990). A rapid total DNA preparation procedure for
fresh plant tissue. Focus 12, 13–15.
Evers, J. B., and Vos, J. (2013). Modeling branching in cereals. Front. Plant Sci.
4:399. doi: 10.3389/fpls.2013.00399
FAO, I. (2011). The State of Food Insecurity in the World. Addressing Food
Insecurity in Protracted Crises. Vol. 2011. Rome: Food and Agriculture
Organization of the United Nations.
Feldman, M. (2001).The Origin of Cultivated Wheat. Paris: Lavoisier Publishing.
Fischer, R., and Edmeades, G. O. (2010). Breeding and cereal yield progress. Crop
Sci. 50, S85–S98.
Fischer, R., and Maurer, R. (1978). Drought resistance in spring wheat cultivars. I.
Grain yield responses. Crop Pasture Sci. 29, 897–912.
Fischer, R., Rees, D., Sayre, K., Lu, Z.-M., Condon, A., and Saavedra, A. L.
(1998).Wheat yield progress associated with higher stomatal conductance and
photosynthetic rate, and cooler canopies. Crop Sci. 38, 1467–1475.
Gur, A., and Zamir, D. (2004). Unused natural variation can lift yield barriers in
plant breeding. Biology 2, 1610–1615. doi: 10.1371/journal.pbio.0020245
Hanocq, E., Niarquin, M., Heumez, E., Rousset, M., and Le Gouis, J. (2004).
Detection and mapping of QTL for earliness components in a bread wheat
recombinant inbred lines population. Theor. Appl.Genet. 110, 106–115. doi:
10.1007/s00122-004-1799-1
Hill, C. B., Taylor, J. D., Edwards, J., Mather, D., Bacic, A., Langridge, P.,
et al. (2013). Whole-genome mapping of agronomic and metabolic traits to
identify novel quantitative trait loci in bread wheat grown in a water-limited
environment. Plant Physiol. 162, 1266–1281. doi: 10.1104/pp.113.217851
Jaradat, A. A. (2011). Ecogeography, genetic diversity, and breeding value of wild
emmer wheat (‘Triticum dicoccoides’ korn ex Asch. and Graebn.) Thell. Aust. J.
Crop Sci. 5, 1072–1086.
Kumar, N., Kulwal, P. L., Gaur, A., Tyagi, A. K., Khurana, J. P., Khurana, P.,
et al. (2006). QTL analysis for grain weight in common wheat. Euphytica. 151,
135–144. doi: 10.1007/s10681-006-9133-4
Ladizinsky, G. (1998). Plant Evolution Under Domestication. Dordrecht: Kluwer
Academic Publishers.
Langridge, P., and Reynolds, M. P. (2015). Genomic tools to assist
breeding for drought tolerance. Curr. Opin. Biotechnol. 32, 130–135. doi:
10.1016/j.copbio.2014.11.027
Lanning, S., Martin, J., Stougaard, R., Guillen-Portal, F., Blake, N., Sherman,
J., et al. (2012). Evaluation of near-isogenic lines for three height-
reducing genes in hard red spring wheat. Crop Sci. 52, 1145–1152. doi:
10.2135/cropsci2011.11.0625
Lesage, V. S., Merlino, M., Chambon, C., Bouchet, B., Marion, D., and Branlard, G.
(2012). Proteomes of hard and soft near-isogenic wheat lines reveal that kernel
hardness is related to the amplification of a stress response during endosperm
development. J. Exp. Bot. 63, 1001–1011. doi: 10.1093/jxb/err330
Levi, A., Paterson, A. H., Barak, V., Yakir, D., Wang, B., Chee, P. W., et al.
(2009). Field evaluation of cotton near-isogenic lines introgressed with QTLs
for productivity and drought related traits. Mol. Breeding. 23, 179–195. doi:
10.1007/s11032-008-9224-0
Levi, A., Paterson, A. H., Cakmak, I., and Saranga, Y. (2011). Metabolite and
mineral analyses of cotton near-isogenic lines introgressed with QTLs for
productivity and drought-related traits. Physiol. Plant. 141, 265–275. doi:
10.1111/j.1399-3054.2010.01438.x
Lopes, M. S., Rebetzke, G. J., and Reynolds, M. (2014). Integration of phenotyping
and genetic platforms for a better understanding of wheat performance under
drought. J. Exp. Bot. 65, 6167–6177. doi: 10.1093/jxb/eru384
Maccaferri, M., Cane, M. A., Sanguineti, M. C., Salvi, S., Colalongo, M. C.,
Massi, A., Clarke, F., et al. (2014). A consensus framework map of durum
wheat (Triticum durum Desf.) suitable for linkage disequilibrium analysis and
genome-wide association mapping. BMC Genom. 15:873. doi: 10.1186/1471-
2164-15-873
Maccaferri, M., Ricci, A., Salvi, S., Milner, S. G., Noli, E., Martelli, P. L., et al. (2015).
A high-density, SNP-based consensus map of tetraploid wheat as a bridge to
integrate durum and bread wheat genomics and breeding. Plant Biotechnol. J.
13, 648–663. doi: 10.1111/pbi.12288
Maccaferri, M., Sanguineti, M. C., Corneti, S., Ortega, J. L. A., Salem, M. B., Bort,
J., et al. (2008). Quantitative trait loci for grain yield and adaptation of durum
wheat (Triticum durumDesf.) across a wide range of water availability.Genetics
178, 489–511. doi: 10.1534/genetics.107.077297
Maccaferri, M., Sanguineti, M. C., Demontis, A., El-Ahmed, A., Del Moral, L. G.,
Maalouf, F., et al. (2010). Association mapping in durum wheat grown across a
broad range of water regimes. J. Exp. Bot. 62, 409–438. doi: 10.1093/jxb/erq287
Miura, H., Wickramasinghe, M., Subasinghe, R., Araki, E., and Komae, K.
(2002). Development of near-isogenic lines of wheat carrying different
null Wx alleles and their starch properties. Euphytica 123, 353–359. doi:
10.1023/A:1015042322687
Moeller, C., Evers, J. B., and Rebetzke, G. (2014). Canopy architectural and
physiological characterization of near-isogenic wheat lines differing in the tiller
inhibition gene tin. Front. Plant Sci. 5:617. doi: 10.3389/fpls.2014.00617
Munns, R. (2002). Comparative physiology of salt and water stress. Plant Cell
Environ. 25, 239–250. doi: 10.1046/j.0016-8025.2001.00808.x
Munns, R., James, R. A., Xu, B., Athman, A., Conn, S. J., Jordans, C., et al. (2012).
Wheat grain yield on saline soils is improved by an ancestral Na+ transporter
gene. Nat. Biotechnol. 30, 360–364. doi: 10.1038/nbt.2120
Naruoka, Y., Talbert, L., Lanning, S., Blake, N., Martin, J., and Sherman, J. (2011).
Identification of quantitative trait loci for productive tiller number and its
relationship to agronomic traits in spring wheat. Theor. App. Genet. 123,
1043–1053. doi: 10.1007/s00122-011-1646-0
Ortiz, R., Braun, H.-J., Crossa, J., Crouch, J. H., Davenport, G., Dixon, J.,
et al. (2008).Wheat genetic resources enhancement by the International Maize
and Wheat Improvement Center (CIMMYT). Genet. Resour. Crop Ev. 55,
1095–1140. doi: 10.1007/s10722-008-9372-4
Passioura, J. (2012). Phenotyping for drought tolerance in grain crops: when is it
useful to breeders? Funct. Plant Biol. 39, 851–859. doi: 10.1071/fp12079
Paterson, A. H. (1995). Molecular dissection of quantitative traits: progress and
prospects. Genome Res. 5, 321–333.
Peleg, Z., Fahima, T., Abbo, S., Krugman, T., Nevo, E., Yakir, D., et al.
(2005). Genetic diversity for drought resistance in wild emmer wheat
and its ecogeographical associations. Plant Cell Environ. 28, 176–191. doi:
10.1111/j.1365-3040.2005.01259.x
Peleg, Z., Fahima, T., Krugman, T., Abbo, S., Yakir, D., and Korol, A. B. (2009).
Genomic dissection of drought resistance in durum wheat×wild emmer wheat
recombinant inbreed line population. Plant Cell Environ. 32, 758–779. doi:
10.1111/j.1365-3040.2009.01956.x
Peleg, Z., Saranga, Y., Krugman, T., Abbo, S., Nevo, E., and Fahima, T.
(2008a). Allelic diversity associated with aridity gradient in wild emmer
wheat populations. Plant Cell Environ. 31, 39–49. doi: 10.1111/j.1365-
3040.2007.01731.x
Peleg, Z., Saranga, Y., Suprunova, T., Ronin, Y., Röder, M. S., Kilian, A., et al.
(2008b). High-density genetic map of durum wheat× wild emmer wheat
based on SSR and DArT markers. Theor. App. Genet. 117, 103–115. doi:
10.1007/s00122-008-0756-9
Peng, J., Sun, D., Peng, Y., and Nevo, E. (2012). Gene discovery in Triticum
dicoccoides, the direct progenitor of cultivated wheats. Cereal Res. Commun.
41, 1–22. doi: 10.1556/CRC.2012.0030
Quarrie, S. A., Quarrie, S. P., Radosevic, R., Rancic, D., Kaminska, A., Barnes,
J. D., et al. (2006). Dissecting a wheat QTL for yield present in a range of
environments: from the QTL to candidate genes. J. Exp. Bot. 57, 2627–2637.
doi: 10.1093/jxb/erl026
Reynolds, M., Skovmand, B., Trethowan, R., and Pfeiffer, W. (2000). Evaluating
a Conceptual Model for Drought Tolerance. Mexico: CYMMYT. International
Maize and Wheat Improvment Center.
Richards, R. A., Rebetzke, G. J., Watt, M., Condon, A. G., Spielmeyer, W., and
Dolferus, R. (2010). Breeding for improved water productivity in temperate
cereals: phenotyping, quantitative trait loci, markers and the selection
environment. Funct. Plant Biol. 37, 85–97. doi: 10.1071/FP09219
Salvi, S., and Tuberosa, R. (2015). The crop QTLome comes of age. Curr. Opin.
Biotechnol. 32, 179–185. doi: 10.1016/j.copbio.2015.01.001
Frontiers in Plant Science | www.frontiersin.org 13 April 2016 | Volume 7 | Article 452

Merchuk-Ovnat et al. Ancestral QTLs Improve Drought Resistance
Saranga, Y., Menz, M., Jiang, C.-X., Wright, R. J., Yakir, D., and Paterson, A. H.
(2001). Genomic dissection of genotype× environment interactions conferring
adaptation of cotton to arid conditions. Genome Res. 11, 1988–1995. doi:
10.1101/gr.157201
Sayre, K. D., Rajaram, S., and Fischer, R. A. (1997). Yield potential progress in short
bread wheats in Northwest Mexico. Crop Sci. 37, 36–42.
Shavrukov, Y., Shamaya, N., Baho, M., Edwards, J., Ramsey, C., Nevo, E., et al.
(2011). Salinity tolerance and Na+ exclusion in wheat: variability, genetics,
mapping populations and QTL analysis. Czech J. Genet. Plant Breed. 47,
S85–S93.
Somers, D. J., Isaac, P., and Edwards, K. (2004). A high-density microsatellite
consensus map for bread wheat (Triticum aestivum L.). Theor. App. Genet. 109,
1105–1114. doi: 10.1007/s00122-004-1740-7
Tanio, M., and Kato, K. (2007). Development of near-isogenic
lines for photoperiod-insensitive genes, Ppd-B1 and Ppd-D1,
carried by the Japanese wheat cultivars and their effect on
apical development. Breeding Sci. 57, 65–72. doi: 10.1270/jsbbs.
57.65
Tanksley, S. D., and McCouch, S. R. (1997). Seed banks and molecular maps:
unlocking genetic potential from the wild. Science 277, 1063–1066.
Tuberosa, R., and Salvi, S. (2006). Genomics-based approaches to improve
drought tolerance of crops. Trends Plant Sci. 11, 405–412. doi:
10.1016/j.tplants.2006.06.003
Verma, V., Foulkes, M., Worland, A., Sylvester-Bradley, R., Caligari, P., and
Snape, J. (2004). Mapping quantitative trait loci for flag leaf senescence as
a yield determinant in winter wheat under optimal and drought-stressed
environments. Euphytica 135, 255–263. doi: 10.1023/B:EUPH.0000013255.3
1618.14
Wang, S., Wong, D., Forrest, K., Allen, A., Chao, S., Huang, B. E., et al. (2014).
Characterization of polyploid wheat genomic diversity using a high-density 90
000 single nucleotide polymorphism array. Plant Biotechnol. J. 12, 787–796. doi:
10.1111/pbi.12183/pdf
Wheeler, T., and Von Braun, J. (2013). Climate change impacts on global food
security. Science 341, 508–513. doi: 10.1126/science.1239402
Xie, W., and Nevo, E. (2008). Wild emmer: genetic resources, gene mapping
and potential for wheat improvement. Euphytica 164, 603–614. doi:
10.1007/s10681-008-9703-8
Zhang, W., Chao, S., Manthey, F., Chicaiza, O., Brevis, J., Echenique, V., et al.
(2008). QTL analysis of pasta quality using a composite microsatellite and SNP
map of durumwheat. Theor. Appl. Genet. 117, 1361–1377. doi: 10.1007/s00122-
008-0869-1
Zhang, W., Li, A., Tian, J., and Zhao, L. (2012). Development of near isogenic
lines of wheat carrying different spike branching genes and their agronomic
and spike characters. J. Agric. Sci. 4:215. doi: 10.5539/jas.v4n8p215
Conflict of Interest Statement: The authors declare that the research was
conducted in the absence of any commercial or financial relationships that could
be construed as a potential conflict of interest.
Copyright © 2016 Merchuk-Ovnat, Barak, Fahima, Ordon, Lidzbarsky, Krugman
and Saranga. This is an open-access article distributed under the terms of
the Creative Commons Attribution License (CC BY). The use, distribution or
reproduction in other forums is permitted, provided the original author(s) or licensor
are credited and that the original publication in this journal is cited, in accordance
with accepted academic practice. No use, distribution or reproduction is permitted
which does not comply with these terms.
Frontiers in Plant Science | www.frontiersin.org 14 April 2016 | Volume 7 | Article 452