Embed Size (px)
Citation preview
Anchor dragging simulation for safety evaluation of a tunnel-type
structure used to protect submarine power cable
Jinho Woo1), Dongha Kim2), and *Won-Bae Na3)
1), 2), 3) Department of Ocean Engineering, Pukyong National University, Busan, Korea
ABSTRACT
Recent development in offshore wind farm and other ocean renewable energies accelerate the deployment of submarine power cables. Among several natural and manmade loading conditions, anchor dragging is considered a severe threat to the protecting structures and sequentially submarine power cables. This study presents the transient dynamic analysis of a target protective structure (a tunnel type) under anchor dragging. For the purpose, the following works are implemented. First, the tunnel-type and stockless anchor were modeled through the finite element method. Second, anchor dragging scenarios were developed, and uploaded on the target structure. Third, during the transient dynamic analysis, design parameters were selected to obtain their effects on the structural behaviors. Finally, the design recommendations were reported based on the safety analysis, which characterized by von-Mises stress, displacement, and tensile force. As a result, it was found that the dragging velocity is critical to the dynamic responses and accordingly the safety. It was also observed that the dragging with a relatively high speed makes the anchor overpass the tunnel and accordingly gives a collision effect. 1. INTRODUCTION
According to the ICPC (International Cable Protection Committee, 2009), the causes of submarine cable faults around the world include fishing (67%), anchors (8%), dredging (2%), and other activities (23%) from 1958 to 2007. These percentages were changed in the years of 2007 and 2008 – fishing (33%), anchors (48%), dredging (0%), and others (19%). Thus, the significance of anchor activities to the submarine power cables has been increased in recent years. According to Worzyk (2009), a study on subsea power cable failures was carried out by CIGRÉ (Conference International des Grandes Reseaux Electriques), and the study indicated a typical failure rate of 0.32 failures/year/100 km and also pointed out 82% and 18% of the failures occurred in the
1)
BK21 Plus Post Doc Fellow 2)
Graduate Student 3)
Professor
cables and joints, respectively (Reda et al., 2016). These reports support the fact that the submarine power cables are not free from failures and anchor activities became the largest cause of the faults of submarine power cables. For examples, submarine power cable faults were reported by Wang and Fan (2012) and Woo et al. (2009), which described the faults in the submarine power cable link between Shanghai and Shengsi Island, Zhejiang and one submarine power cable connecting the main Korean peninsula to Jeju Island, respectively.
There have been works to figure out the causes of submarine power cable faults and accordingly to improve cable protection. As a result, most works have been concentrated on the potential causes, monitoring techniques, new protective structures. These works include safety monitoring system by the basis of AIS (automatic identification system) and radar technology (Wang and Fan, 2012), field tests for flexible concrete mattresses in the events of anchor collision and dragging (Yoon and Na, 2013a, 2013b), numerical simulation of submerged rock-berm structures under anchor dragging (Woo et al., 2015a) and collision (Woo, et al., 2015b), damage assessment of a tunnel-type structure during anchor collision (Woo et al., 2015c), safety analysis of rock berms under anchor collision (Woo, et al., 2015d), anchor collision analysis of stone-filled bags (Woo et al., 2016), collision characteristics of an arch-type protector (Woo and Na, 2011; Woo et al., 2009), maximum response analyses of cylinders under anchor collision and dragging (Woo and Na, 2010), and drag coefficients of stock and stockless anchors (Woo and Na, 2014). Similar studies have been also carried out such as outlining a recent cable joint onshore testing regime to ensure the cable joint integrity (Reda et al. 2016) and calculating the maximum embedded depth of a dragged hall anchor when passing through a rock berm (Yan et al., 2015). Other works are all focused on electrical power transmission and systems of submarine power cables (e.g., Yamabuki and Kubori, 2012).
Consequently, the studies concerning of physical responses of submarine power cables and their protective structures can be summarized into two categories – the design of existing and/or new protective structures and their performance assessment in the events of anchor collision and dragging. The structures include rock-berms, tunnel-type structures, cylinders, and stone-filled bags, which have been frequently used or newly-considered as the protective structures of submarine power cables. Among the structural types, rock-berms and stone-filled bags cannot be simulated by the conventional finite element methods because of the discrete behaviors of rocks and stones. Hence, the so-called smoothed particle hydrodynamics method (SPH method) has been used (e.g., Woo et al., 2016). It should be noted here that the studies above do not provide a wide and general design guideline for submarine power cable protection. Those are all specifically-designed research results for specific purposes. Based on the literature survey, the only widely-known practice guideline of submarine power cables was published by DNV (2014), the so-called “subsea power cables in shallow water renewable energy applications”. This recommended practice provides guidance for all phases of the life cycle of subsea power cable projects, with a focus on static service in shallow water renewable energy applications. According to the report, the submarine power cable protection methods can be categorized into burial and non-burial cable protections, as illustrated in Fig. 1 and Fig. 2, respectively.
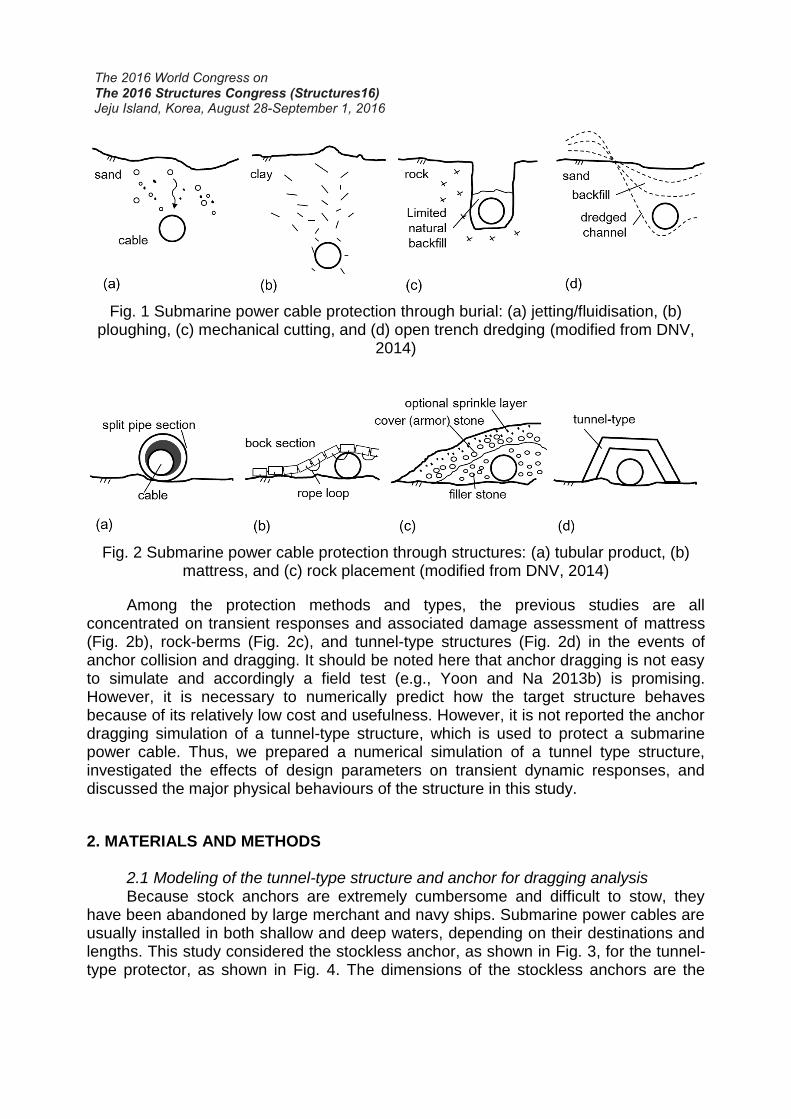
Fig. 1 Submarine power cable protection through burial: (a) jetting/fluidisation, (b)
ploughing, (c) mechanical cutting, and (d) open trench dredging (modified from DNV, 2014)
Fig. 2 Submarine power cable protection through structures: (a) tubular product, (b)
mattress, and (c) rock placement (modified from DNV, 2014)
Among the protection methods and types, the previous studies are all concentrated on transient responses and associated damage assessment of mattress (Fig. 2b), rock-berms (Fig. 2c), and tunnel-type structures (Fig. 2d) in the events of anchor collision and dragging. It should be noted here that anchor dragging is not easy to simulate and accordingly a field test (e.g., Yoon and Na 2013b) is promising. However, it is necessary to numerically predict how the target structure behaves because of its relatively low cost and usefulness. However, it is not reported the anchor dragging simulation of a tunnel-type structure, which is used to protect a submarine power cable. Thus, we prepared a numerical simulation of a tunnel type structure, investigated the effects of design parameters on transient dynamic responses, and discussed the major physical behaviours of the structure in this study.
2. MATERIALS AND METHODS
2.1 Modeling of the tunnel-type structure and anchor for dragging analysis
Because stock anchors are extremely cumbersome and difficult to stow, they have been abandoned by large merchant and navy ships. Submarine power cables are usually installed in both shallow and deep waters, depending on their destinations and lengths. This study considered the stockless anchor, as shown in Fig. 3, for the tunnel-type protector, as shown in Fig. 4. The dimensions of the stockless anchors are the
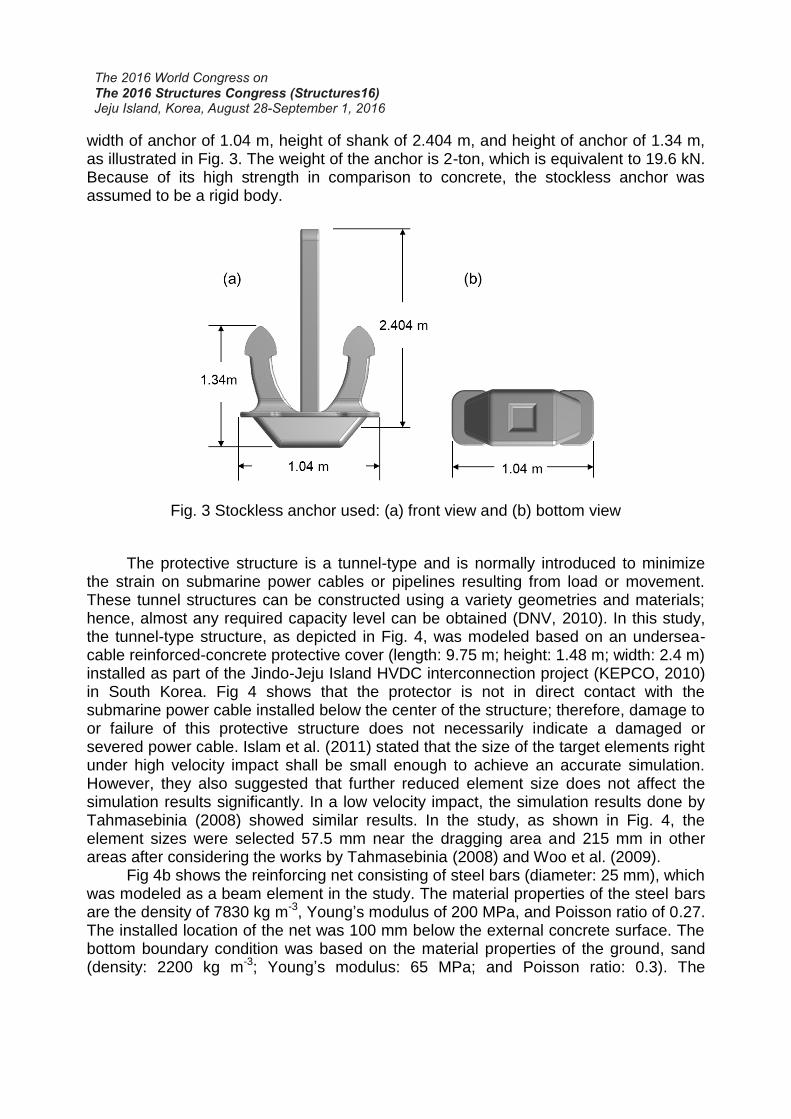
width of anchor of 1.04 m, height of shank of 2.404 m, and height of anchor of 1.34 m, as illustrated in Fig. 3. The weight of the anchor is 2-ton, which is equivalent to 19.6 kN. Because of its high strength in comparison to concrete, the stockless anchor was assumed to be a rigid body.
Fig. 3 Stockless anchor used: (a) front view and (b) bottom view
The protective structure is a tunnel-type and is normally introduced to minimize
the strain on submarine power cables or pipelines resulting from load or movement. These tunnel structures can be constructed using a variety geometries and materials; hence, almost any required capacity level can be obtained (DNV, 2010). In this study, the tunnel-type structure, as depicted in Fig. 4, was modeled based on an undersea-cable reinforced-concrete protective cover (length: 9.75 m; height: 1.48 m; width: 2.4 m) installed as part of the Jindo-Jeju Island HVDC interconnection project (KEPCO, 2010) in South Korea. Fig 4 shows that the protector is not in direct contact with the submarine power cable installed below the center of the structure; therefore, damage to or failure of this protective structure does not necessarily indicate a damaged or severed power cable. Islam et al. (2011) stated that the size of the target elements right under high velocity impact shall be small enough to achieve an accurate simulation. However, they also suggested that further reduced element size does not affect the simulation results significantly. In a low velocity impact, the simulation results done by Tahmasebinia (2008) showed similar results. In the study, as shown in Fig. 4, the element sizes were selected 57.5 mm near the dragging area and 215 mm in other areas after considering the works by Tahmasebinia (2008) and Woo et al. (2009). Fig 4b shows the reinforcing net consisting of steel bars (diameter: 25 mm), which was modeled as a beam element in the study. The material properties of the steel bars are the density of 7830 kg m-3, Young’s modulus of 200 MPa, and Poisson ratio of 0.27. The installed location of the net was 100 mm below the external concrete surface. The bottom boundary condition was based on the material properties of the ground, sand (density: 2200 kg m-3; Young’s modulus: 65 MPa; and Poisson ratio: 0.3). The
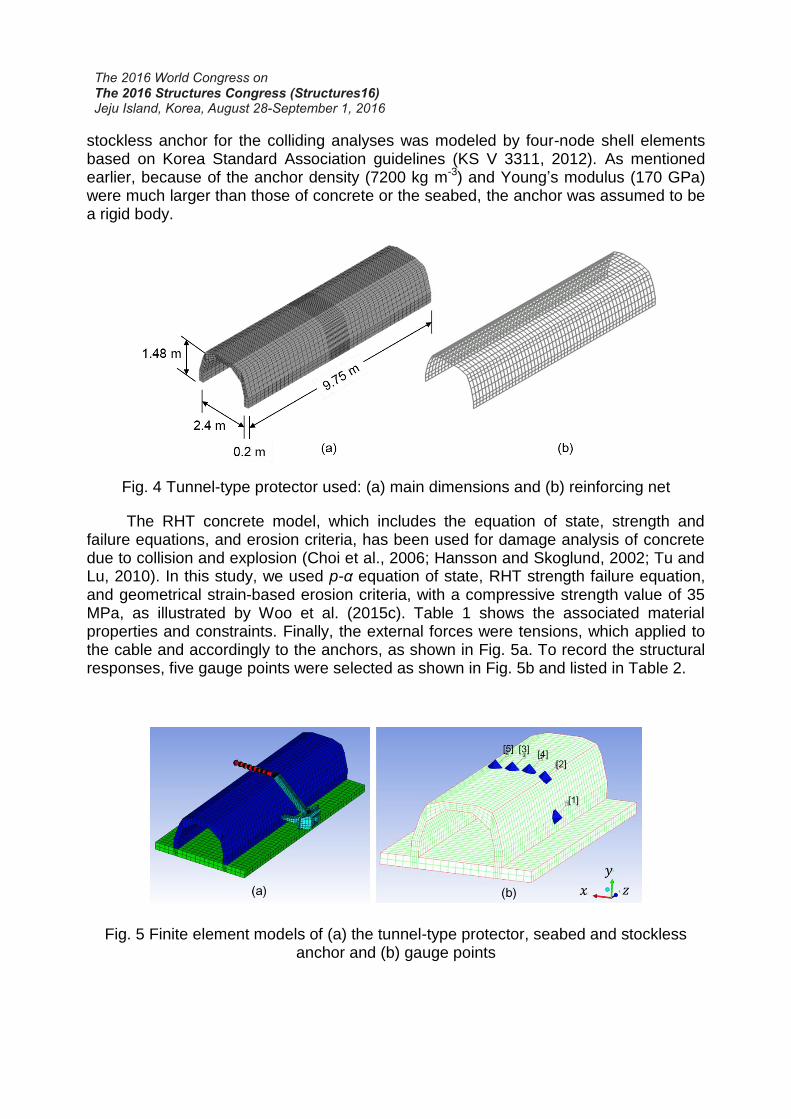
stockless anchor for the colliding analyses was modeled by four-node shell elements based on Korea Standard Association guidelines (KS V 3311, 2012). As mentioned earlier, because of the anchor density (7200 kg m-3) and Young’s modulus (170 GPa) were much larger than those of concrete or the seabed, the anchor was assumed to be a rigid body.
Fig. 4 Tunnel-type protector used: (a) main dimensions and (b) reinforcing net
The RHT concrete model, which includes the equation of state, strength and failure equations, and erosion criteria, has been used for damage analysis of concrete due to collision and explosion (Choi et al., 2006; Hansson and Skoglund, 2002; Tu and Lu, 2010). In this study, we used p-α equation of state, RHT strength failure equation, and geometrical strain-based erosion criteria, with a compressive strength value of 35 MPa, as illustrated by Woo et al. (2015c). Table 1 shows the associated material properties and constraints. Finally, the external forces were tensions, which applied to the cable and accordingly to the anchors, as shown in Fig. 5a. To record the structural responses, five gauge points were selected as shown in Fig. 5b and listed in Table 2.
Fig. 5 Finite element models of (a) the tunnel-type protector, seabed and stockless anchor and (b) gauge points
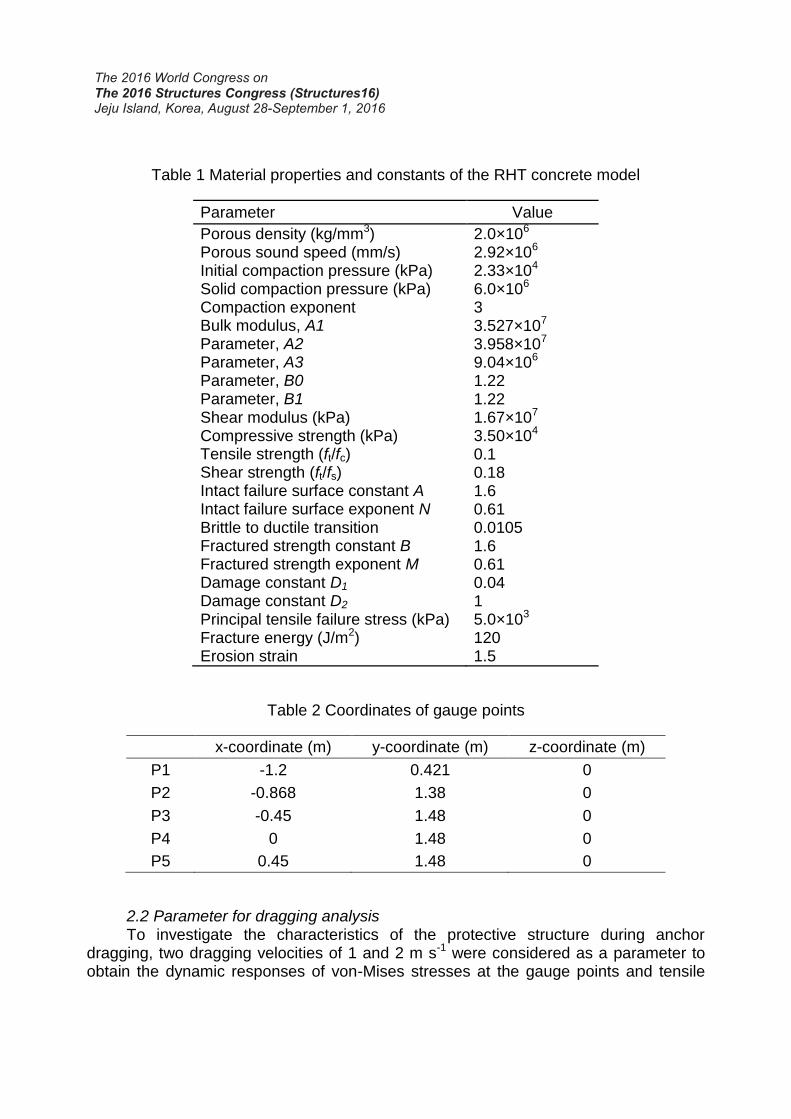
Table 1 Material properties and constants of the RHT concrete model
Parameter Value
Porous density (kg/mm3) Porous sound speed (mm/s) Initial compaction pressure (kPa) Solid compaction pressure (kPa) Compaction exponent Bulk modulus, A1 Parameter, A2 Parameter, A3 Parameter, B0 Parameter, B1 Shear modulus (kPa) Compressive strength (kPa) Tensile strength (ft/fc) Shear strength (ft/fs) Intact failure surface constant A Intact failure surface exponent N Brittle to ductile transition Fractured strength constant B Fractured strength exponent M Damage constant D1 Damage constant D2 Principal tensile failure stress (kPa) Fracture energy (J/m2) Erosion strain
2.0×10⁶ 2.92×10⁶ 2.33×10⁴ 6.0×10⁶ 3 3.527×10⁷ 3.958×10⁷ 9.04×10⁶ 1.22 1.22 1.67×10⁷ 3.50×10⁴ 0.1 0.18 1.6 0.61 0.0105 1.6 0.61 0.04 1 5.0×10³ 120 1.5
Table 2 Coordinates of gauge points
x-coordinate (m) y-coordinate (m) z-coordinate (m)
P1 -1.2 0.421 0
P2 -0.868 1.38 0
P3 -0.45 1.48 0
P4 0 1.48 0
P5 0.45 1.48 0
2.2 Parameter for dragging analysis To investigate the characteristics of the protective structure during anchor dragging, two dragging velocities of 1 and 2 m s-1 were considered as a parameter to obtain the dynamic responses of von-Mises stresses at the gauge points and tensile
forces of the cable. It should be noted here that the dragging velocities were selected arbitrary because it is hard to estimate the dragging velocity of the 2-ton stockless anchor considered in the study. The dragging velocity is related to dragging force, nature of the seabed, and fluke area. 3. RESULTS AND DISCUSSIONS
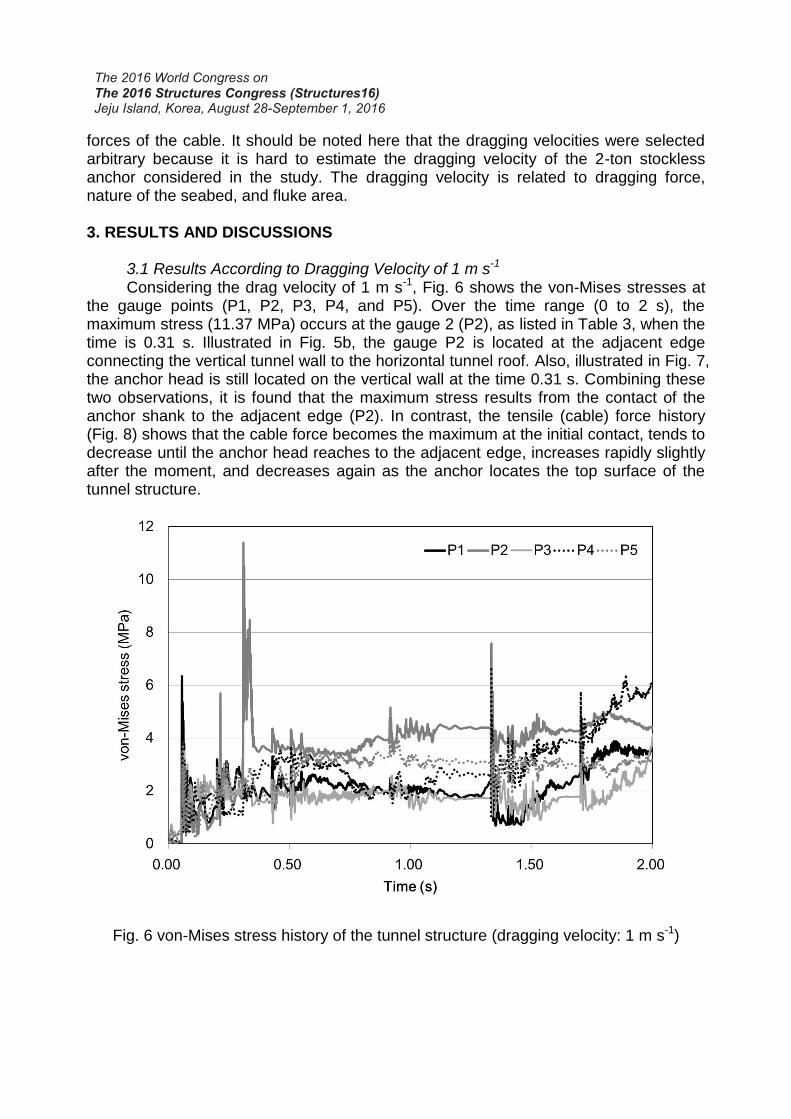
3.1 Results According to Dragging Velocity of 1 m s-1 Considering the drag velocity of 1 m s-1, Fig. 6 shows the von-Mises stresses at
the gauge points (P1, P2, P3, P4, and P5). Over the time range (0 to 2 s), the maximum stress (11.37 MPa) occurs at the gauge 2 (P2), as listed in Table 3, when the time is 0.31 s. Illustrated in Fig. 5b, the gauge P2 is located at the adjacent edge connecting the vertical tunnel wall to the horizontal tunnel roof. Also, illustrated in Fig. 7, the anchor head is still located on the vertical wall at the time 0.31 s. Combining these two observations, it is found that the maximum stress results from the contact of the anchor shank to the adjacent edge (P2). In contrast, the tensile (cable) force history (Fig. 8) shows that the cable force becomes the maximum at the initial contact, tends to decrease until the anchor head reaches to the adjacent edge, increases rapidly slightly after the moment, and decreases again as the anchor locates the top surface of the tunnel structure.
Fig. 6 von-Mises stress history of the tunnel structure (dragging velocity: 1 m s-1)
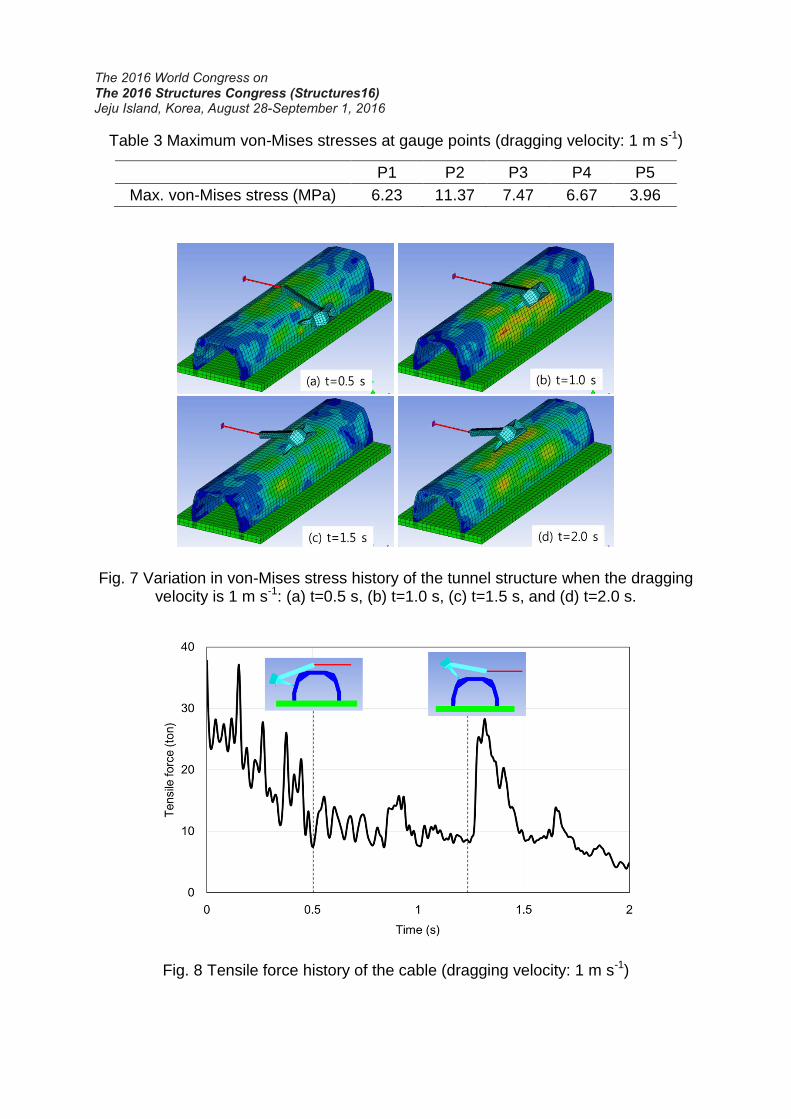
Table 3 Maximum von-Mises stresses at gauge points (dragging velocity: 1 m s-1)
P1 P2 P3 P4 P5
Max. von-Mises stress (MPa) 6.23 11.37 7.47 6.67 3.96
Fig. 7 Variation in von-Mises stress history of the tunnel structure when the dragging velocity is 1 m s-1: (a) t=0.5 s, (b) t=1.0 s, (c) t=1.5 s, and (d) t=2.0 s.
Fig. 8 Tensile force history of the cable (dragging velocity: 1 m s-1)
3.2 Results According to Dragging Velocity of 2 m s-1
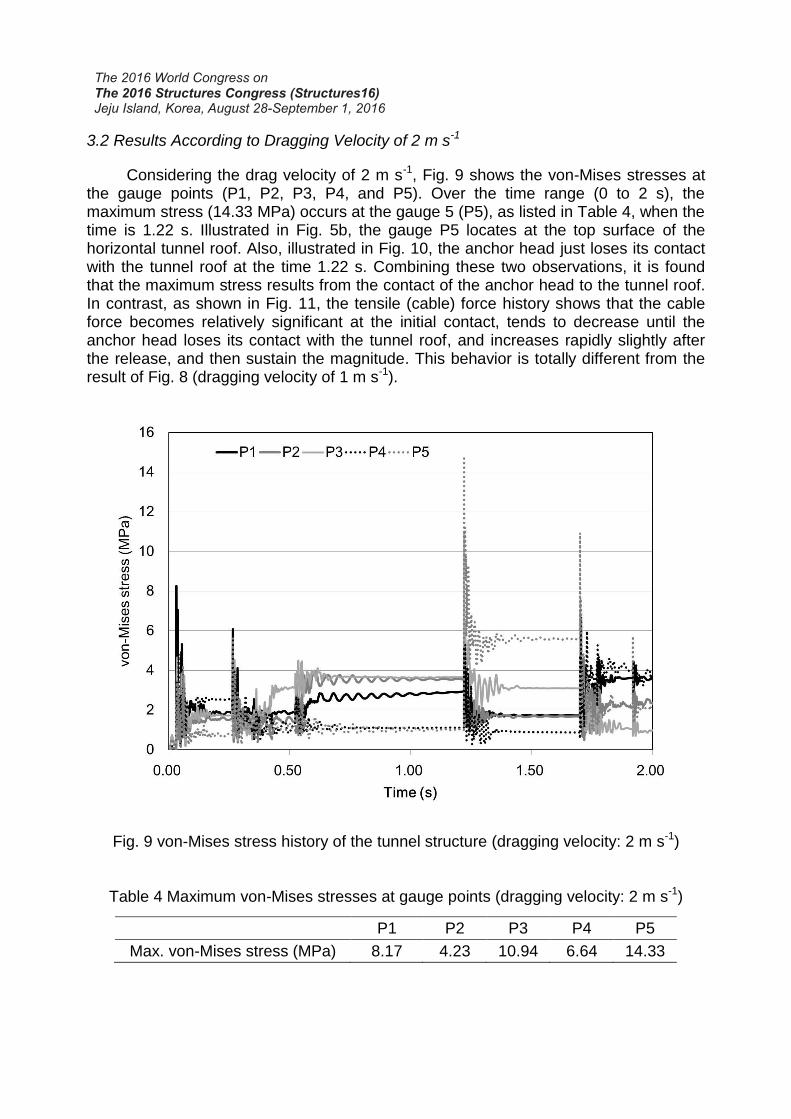
Considering the drag velocity of 2 m s-1, Fig. 9 shows the von-Mises stresses at the gauge points (P1, P2, P3, P4, and P5). Over the time range (0 to 2 s), the maximum stress (14.33 MPa) occurs at the gauge 5 (P5), as listed in Table 4, when the time is 1.22 s. Illustrated in Fig. 5b, the gauge P5 locates at the top surface of the horizontal tunnel roof. Also, illustrated in Fig. 10, the anchor head just loses its contact with the tunnel roof at the time 1.22 s. Combining these two observations, it is found that the maximum stress results from the contact of the anchor head to the tunnel roof. In contrast, as shown in Fig. 11, the tensile (cable) force history shows that the cable force becomes relatively significant at the initial contact, tends to decrease until the anchor head loses its contact with the tunnel roof, and increases rapidly slightly after the release, and then sustain the magnitude. This behavior is totally different from the result of Fig. 8 (dragging velocity of 1 m s-1).
Fig. 9 von-Mises stress history of the tunnel structure (dragging velocity: 2 m s-1)
Table 4 Maximum von-Mises stresses at gauge points (dragging velocity: 2 m s-1)
P1 P2 P3 P4 P5
Max. von-Mises stress (MPa) 8.17 4.23 10.94 6.64 14.33
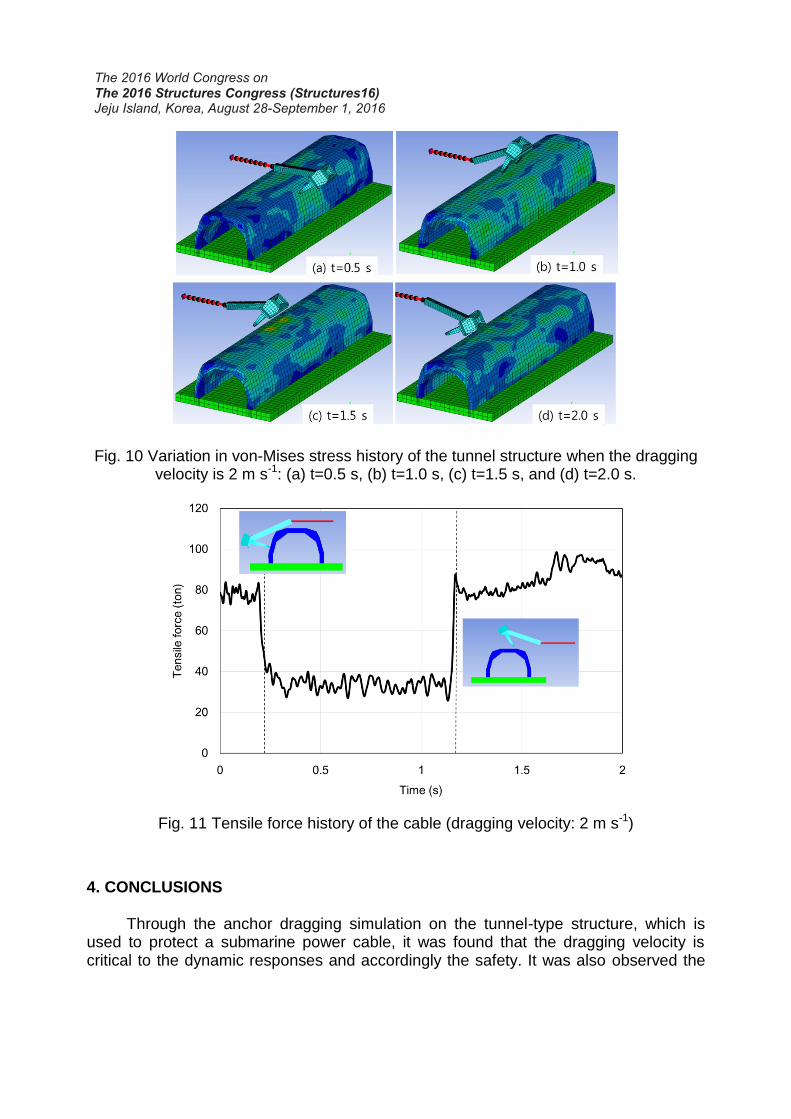
Fig. 10 Variation in von-Mises stress history of the tunnel structure when the dragging velocity is 2 m s-1: (a) t=0.5 s, (b) t=1.0 s, (c) t=1.5 s, and (d) t=2.0 s.
Fig. 11 Tensile force history of the cable (dragging velocity: 2 m s-1)
4. CONCLUSIONS
Through the anchor dragging simulation on the tunnel-type structure, which is used to protect a submarine power cable, it was found that the dragging velocity is critical to the dynamic responses and accordingly the safety. It was also observed the
dragging with a relatively high speed makes the anchor overpass the tunnel and consequently gives a collision effect rather than a dragging effect. This observation is based on the von-Mises stress history of the tunnel structure and tensile force history of the stockless anchor. Considering the two dragging velocities (i.e., 1 and 2 m s-1), the maximum stress responses are 11.37 and 14.33 MPa, respectively, which indicate the high speed dragging gives the maximum collision effect on the top of the structure. ACKNOWLEDGEMENT
This research was a part of the project titled “Development on the Guidelines of Safety Assessment for Submarine Cable Protection Facilities in Shallow Water” funded by the Ministry of Land, Transport and Maritime Affairs, Korea (KIMT – 2013 – 20120018) REFERENCES
Choi, S., Wang, J., Munfakh, G., Dwyre, E. (2006), “3D nonlinear blast model analysis for underground structures,” Geocongress 2006, 1-6.
DNV (2010), “Risk assessment of pipeline: protection recommended practice,” DNV-RP-F107, Det Norske Veritas, Norway.
DNV (2014), “Subsea power cables in shallow water renewable energy applications,” DNV-RP-J301, Det Norske Veritas, Norway.
ICPC (International Cable Protection Committee), 2009, “Damage to submarine cables caused by anchors,” Loss Prevention Bulletin.
Islam, M.J., Liu, Z., Swaddiwudhipong, S. (2011), “Numerical study on concrete penetration/perforation under high velocity impact by ogive-nose steel projectile,” Computers and Concrete, 8(1), 111-123.
KEPCO (2010), “Field test report for installation of rock berm in the shallow water of Jindo-Jeju Island HVDC interconnection project,” Korea Electric Power Corporation.
KS V 3311 (2012), “Anchors, Korea,” Korean Standard Association. Hansson, H., Skoglund, P. (2002), “Simulation of concrete penetration in 2D and 3D
with RHT material model,” FOI-R-0720-SE, Swedish Defense Research Agency. Reda, A.M., Al-Yafei, A.M., Howard, I.M., Forbes, G.L., McKee, K.K. (2016), “Simulated
in-line deployment of offshore rigid field joint – a testing concept,” Ocean Engineering, 112, 153-172.
Tahmasebinia, F. (2008), “Finite element simulation of reinforced concrete structures under impact accident,” Structure Survey, 26(5), 445-454.
Tu, Z., Lu, Y. (2010), “Modification of RHT material model for improved numerical simulation of dynamic response of concrete,” International Journal of Impact Engineering, 37(10), 1072-1082.
Wang, J., Fan, Y.T. (2012), “Study on safety monitoring system for submarine power cable on the basis of AIS and radar technology,” Physics Procedia, 24, 961-965.
Woo, J., Kim, D., Na, W.B. (2015a), “Anchor dragging analysis of rock-berm using smoothed particle hydrodynamics method,” Shock and Vibration, 2015, ID 687623,
8p. Woo, J., Kim, D., Na, W.B. (2015b), “Application of numerical simulation of submersed
rock-berm structure under anchor collision for structural health monitoring of submersed power cables,” Smart Structures and Systems, 15(2), 299-314.
Woo, J., Kim, D., Na, W.B. (2015c), “Damage assessment of a tunnel-type structure to protect submersible power cables during anchor collisions,” Marine Structures, 44, 19-42.
Woo, J., Kim, D., Na, W.B. (2015d), “Safety analysis of rock berms that protect of submarine power cables in the event of an anchor collision,” Ocean Engineering, 107, 204-211.
Woo, J., Kim, D., Na, W.B. (2016), “Anchor collision analysis of stone-filled bags for submarine power cable prediction using a smoothed particle hydrodynamics method,” J. Coastal Research, SI75, 720-724.
Woo, J., Na, W.B. (2011), “Collision characteristics of arch-type submarine cable protector-effect of material models,” J. of the Computational Structural Engineering Institute of Korea, 24, 609-616.
Woo, J., Na, W.B. (2014), “Drag coefficients of stock and stockless anchors,” Marine Technology Society J., 48(3), 138-145.
Woo, J., Na, W.B. (2010), “Maximum response analyses of cylinders-connected protector under anchor colliding and dragging,” J. of Ocean Engineering and Technology, 24(5), 81-87..
Woo, J., Na, W.B., Kim, H.T. (2009), “Numerical simulation of arch-type submarine cable protector under anchor collision,” J. of Ocean Engineering and Technology, 23(1), 96-103.
Worzyk, T. (2009), “Accessories, submarine power cables: design, installation, repair, environmental aspects,” Springer-Verlag Berlin Heidelberg, Berlin.
Yamabuki, K., Kubori, K. (2012), “A transient analysis of a scaled model for a submarine cable connected with an offshore wind farm,” Electric Power System Research, 85, 59-63.
Yan, S., Guo, B., Sun, L., Guo, W., Lei, Z. (2015), “Analytical and experimental studies of dragging hall anchors through rock berm,” Ocean Engineering, 108, 529-538.
Yoon, H.S., Na, W.B. (2013a), “Anchor drop tests for a submarine power-cable protector,” Marine Technology Society J., 47(3), 72-80.
Yoon, H.S., Na, W.B. (2013b), “Safety assessment of submarine power cable protectors by anchor dragging field tests,” Ocean Engineering, 65, 1-9.