Embed Size (px)
Citation preview

Anchoring and Property Prices: The Influence of Echelle Des Crus Ratings on Land Sales in
the Champagne Region of France
Olivier GERGAUDKEDGE – Bordeaux Business School
Andrew J. PLANTINGAUniversity of California, Santa Barbara
Aurélie RINGEVAL-DELUZEUniversity of Reims Champagne-Ardenne
AAWE Conference – MendozaMay 26 – 30, 2015
Motivation
• We analyze vineyard sales and grape prices in the Champagne region.
• Determine whether Echelle Des Crus (EDC) ratings are an anchor in the land market and the market for grapes
• EDC = set of numerical quality scores for villages in the region used as part of price-setting system for wine grapes
2
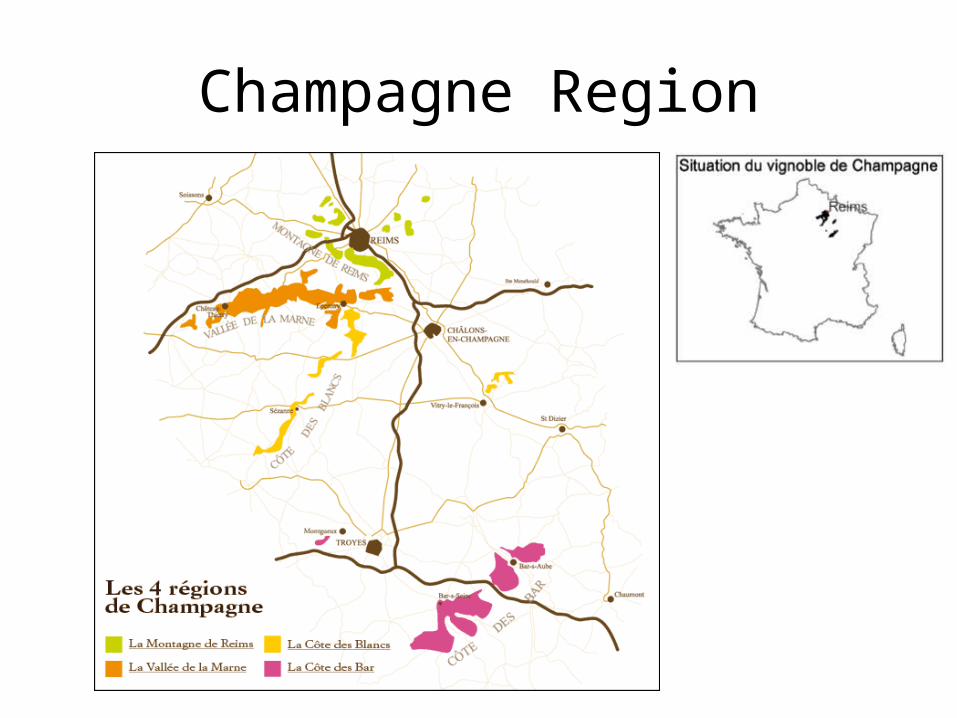
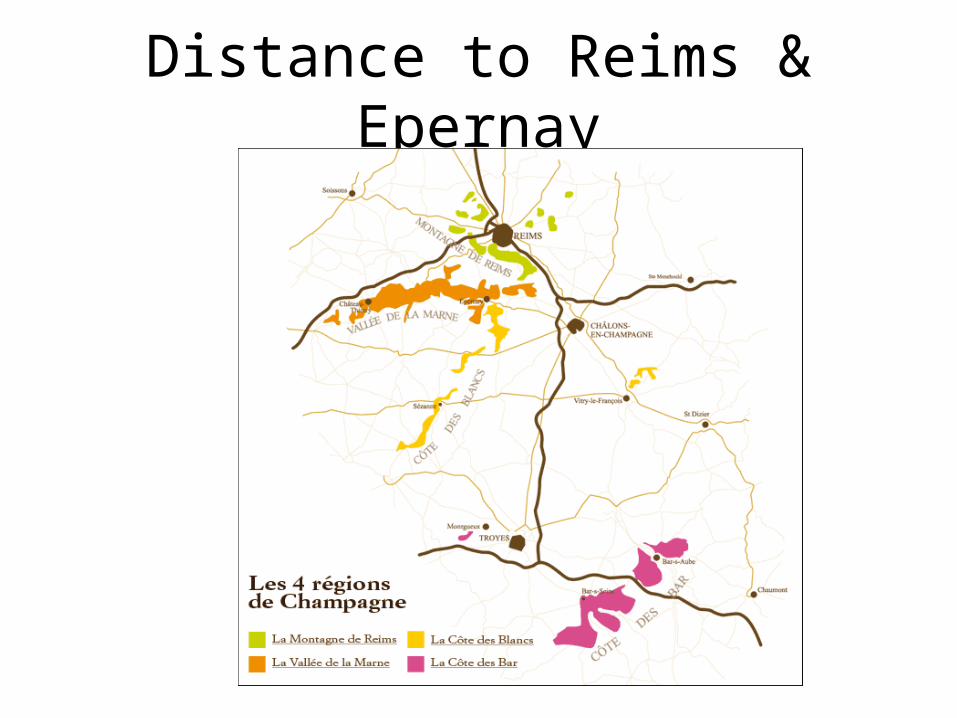
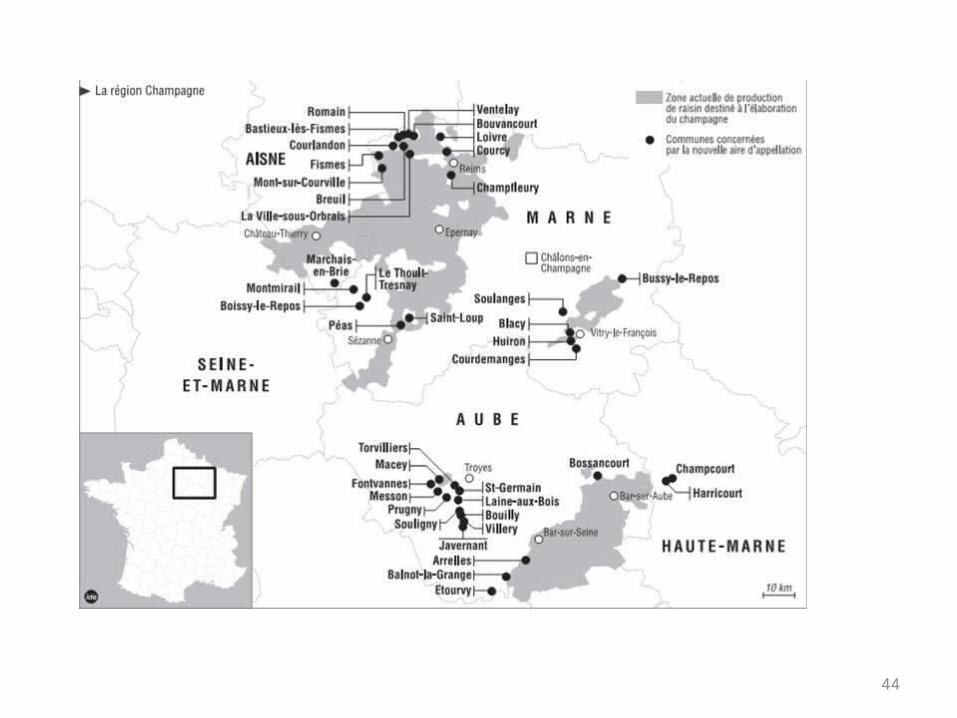
Champagne Region
Echelle Des Crus
• Began in 1919 and persisted until 1990 when it was abandoned in favor of a free market system for establishing grape prices.
• Currently, the EDC no longer plays a role in determining grape prices and, therefore, should have no influence on any prices.
• However, given its importance throughout the 20th century, it is possible that the EDC is an anchor for participants in the land market and/or the market for grapes. 4
Market for grapes
• Two-thirds of all champagne are produced by négociants like Moët & Chandon (Epernay), Mumm (Reims)
• Négociants purchase grapes from growers in the surrounding area (within the appellation area)
• In 1990: 241,430 tons of grapes traded5

Echelle Des Crus
• Before 1990, the price paid for a kilogram of grapes was:
Regulated price × EDC/100 6
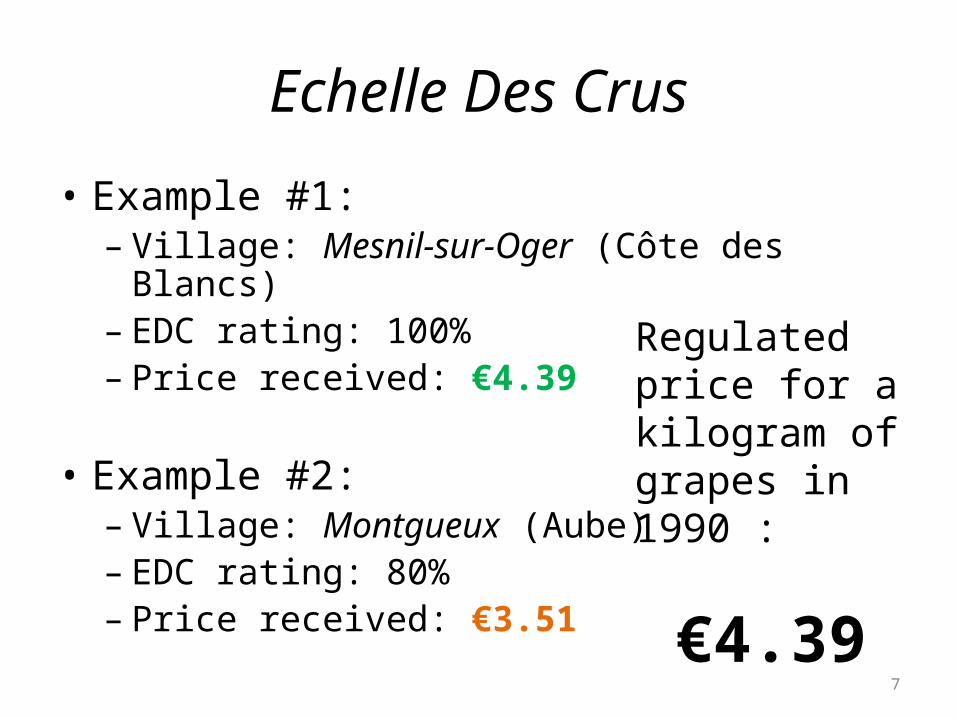
Echelle Des Crus
• Example #1:– Village: Mesnil-sur-Oger (Côte des Blancs)– EDC rating: 100%– Price received: €4.39
• Example #2:– Village: Montgueux (Aube)– EDC rating: 80%– Price received: €3.51
7
Regulated price for a kilogram of grapes in 1990 :
€4.39
Echelle Des Crus
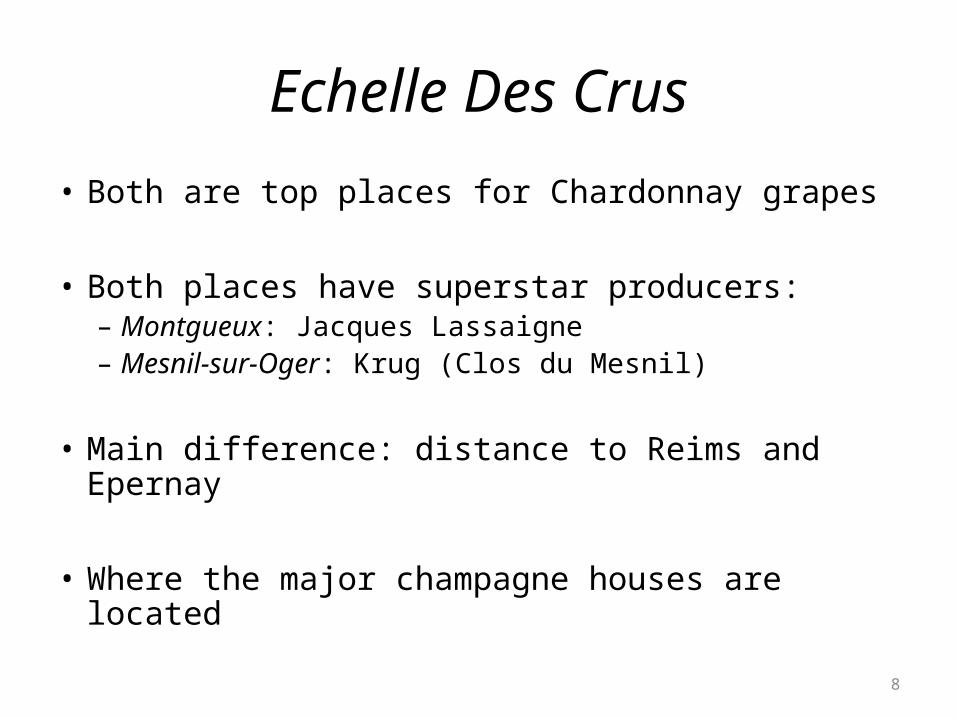
• Both are top places for Chardonnay grapes
• Both places have superstar producers: – Montgueux: Jacques Lassaigne– Mesnil-sur-Oger: Krug (Clos du Mesnil)
• Main difference: distance to Reims and Epernay
• Where the major champagne houses are located
8
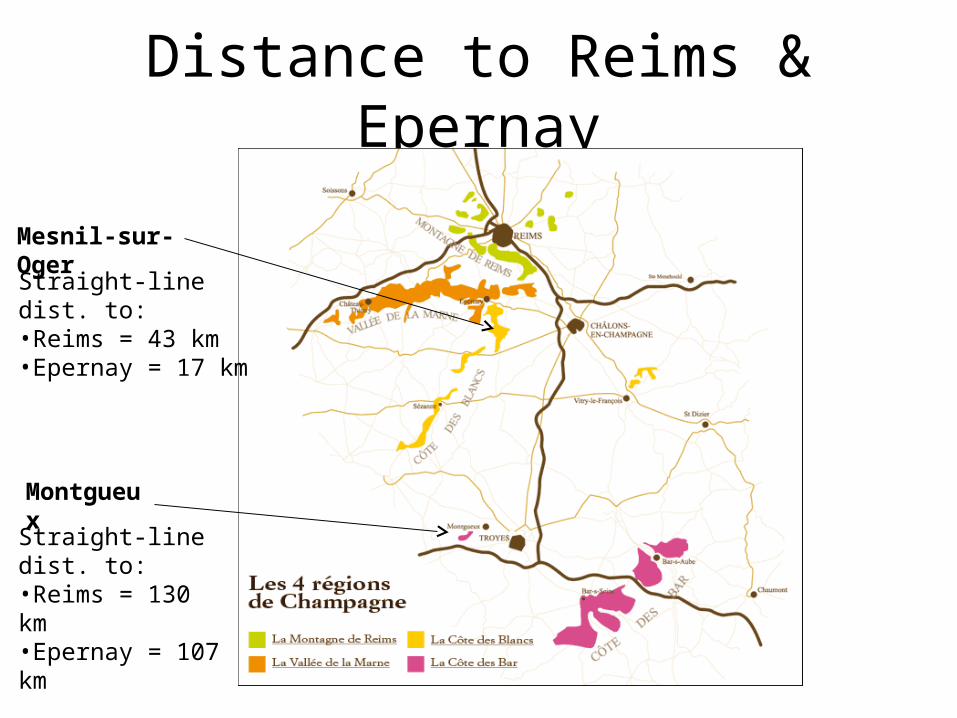
Distance to Reims & Epernay
Montgueux
Straight-line dist. to:•Reims = 130 km•Epernay = 107 km
Mesnil-sur-Oger
Straight-line dist. to:•Reims = 43 km•Epernay = 17 km

Echelle Des Crus
10
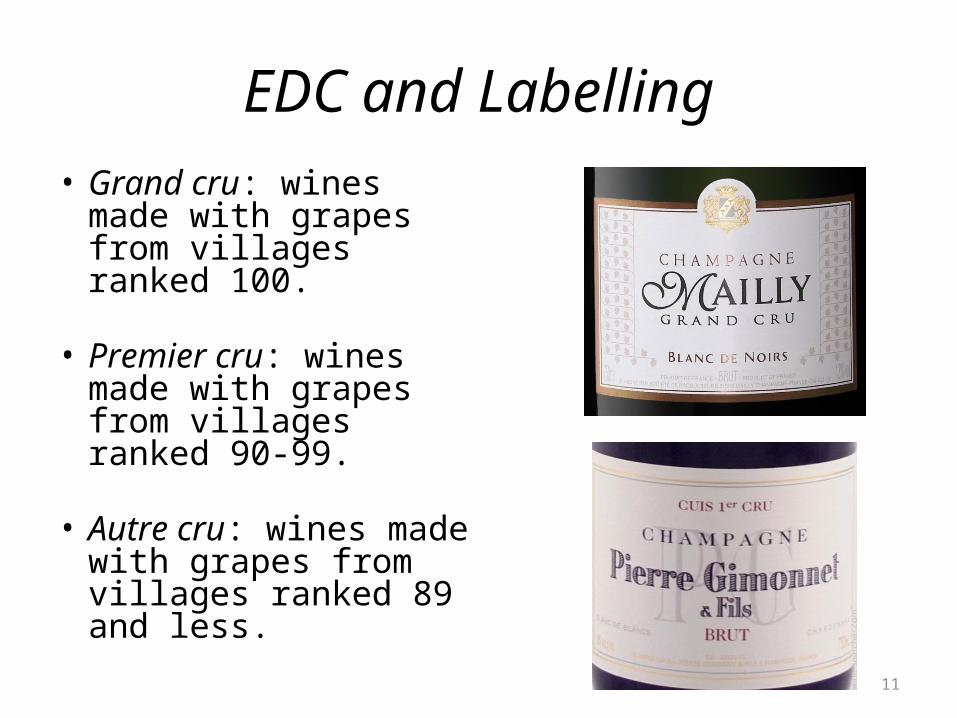
EDC and Labelling• Grand cru: wines made
with grapes from villages ranked 100.
• Premier cru: wines made with grapes from villages ranked 90-99.
• Autre cru: wines made with grapes from villages ranked 89 and less.
11
EDC and Labelling
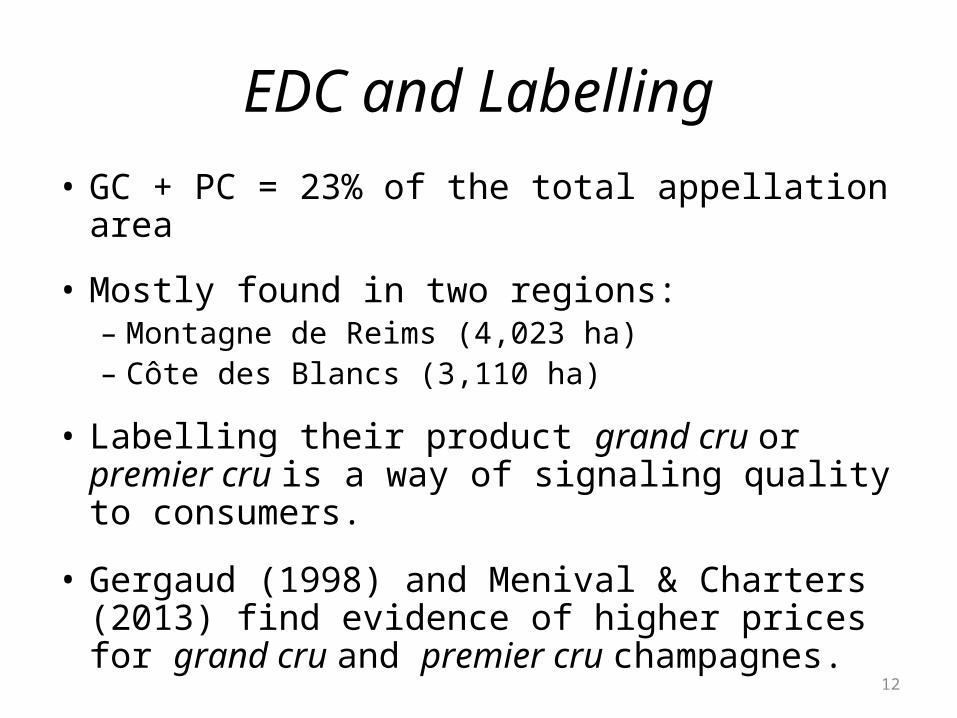
• GC + PC = 23% of the total appellation area
• Mostly found in two regions:– Montagne de Reims (4,023 ha)– Côte des Blancs (3,110 ha)
• Labelling their product grand cru or premier cru is a way of signaling quality to consumers.
• Gergaud (1998) and Menival & Charters (2013) find evidence of higher prices for grand cru and premier cru champagnes.
12
Is EDC a smart rating system???
13
Is EDC a naive rating system???
14
Echelle Des Crus
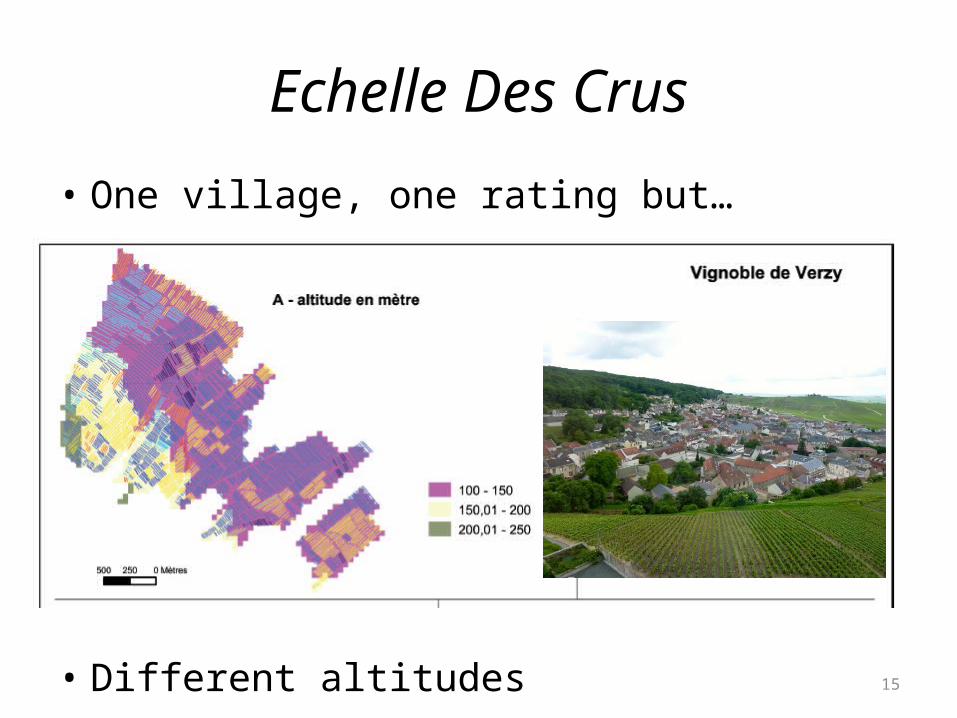
• One village, one rating but…
• Different altitudes15
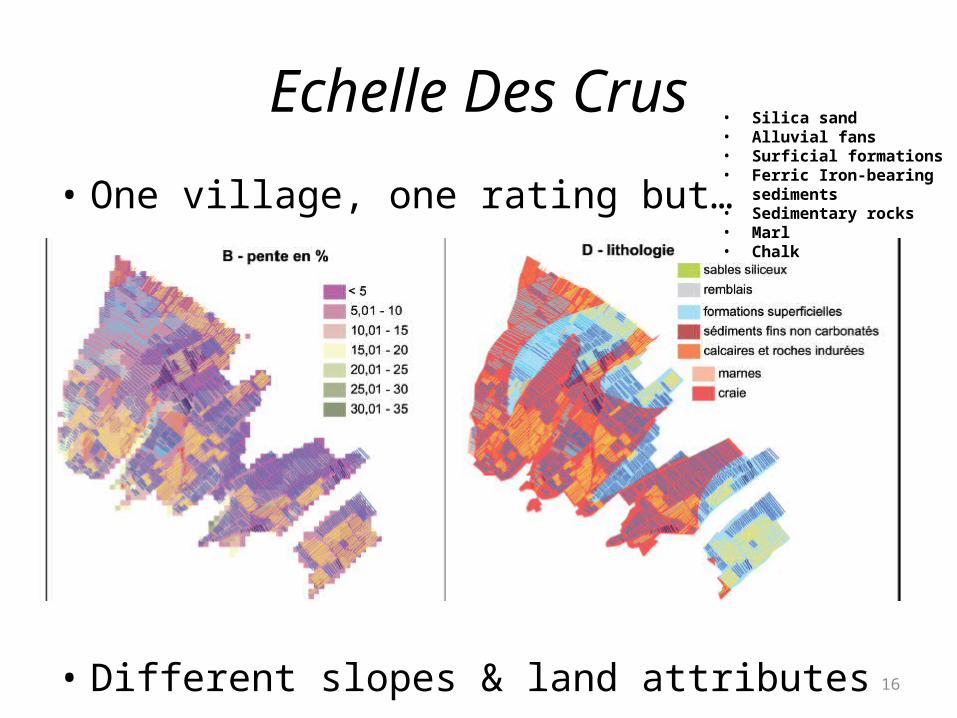
Echelle Des Crus
• One village, one rating but…
• Different slopes & land attributes16
• Silica sand• Alluvial fans• Surficial formations• Ferric Iron-bearing sediments• Sedimentary rocks• Marl• Chalk
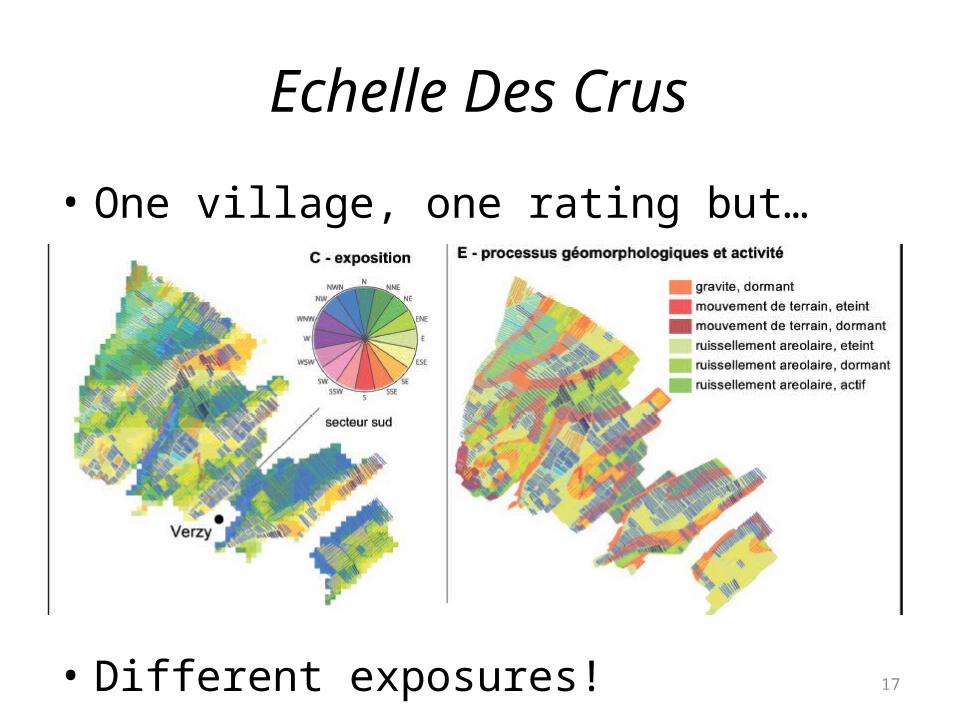
Echelle Des Crus
• One village, one rating but…
• Different exposures! 17

Champagne Boulard (Murgiers)
18
EDC = 84.33%
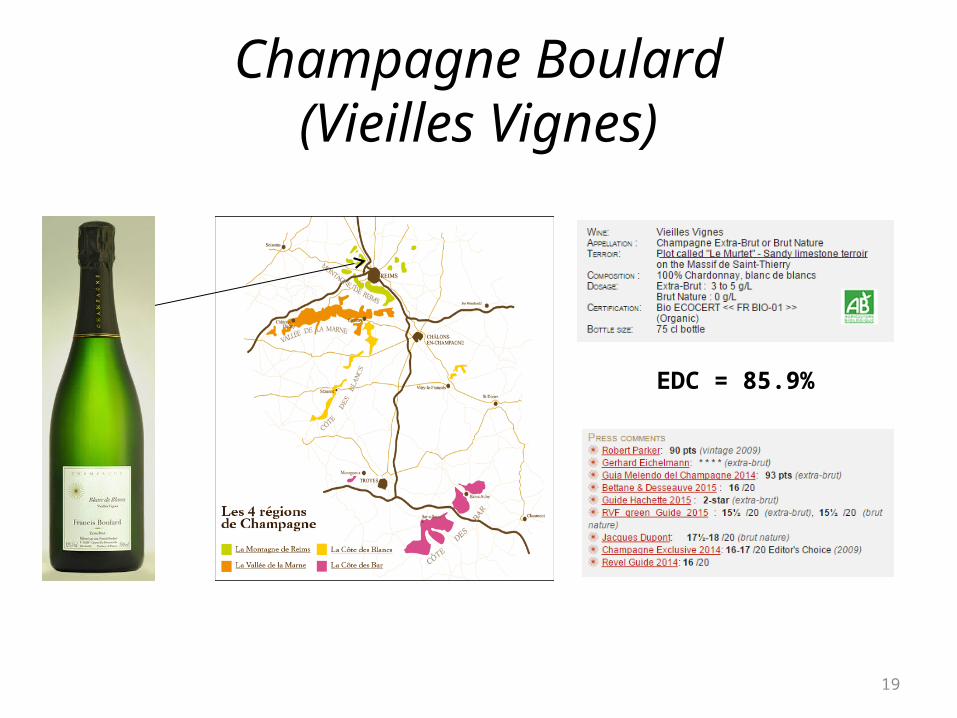
Champagne Boulard(Vieilles Vignes)
19
EDC = 85.9%
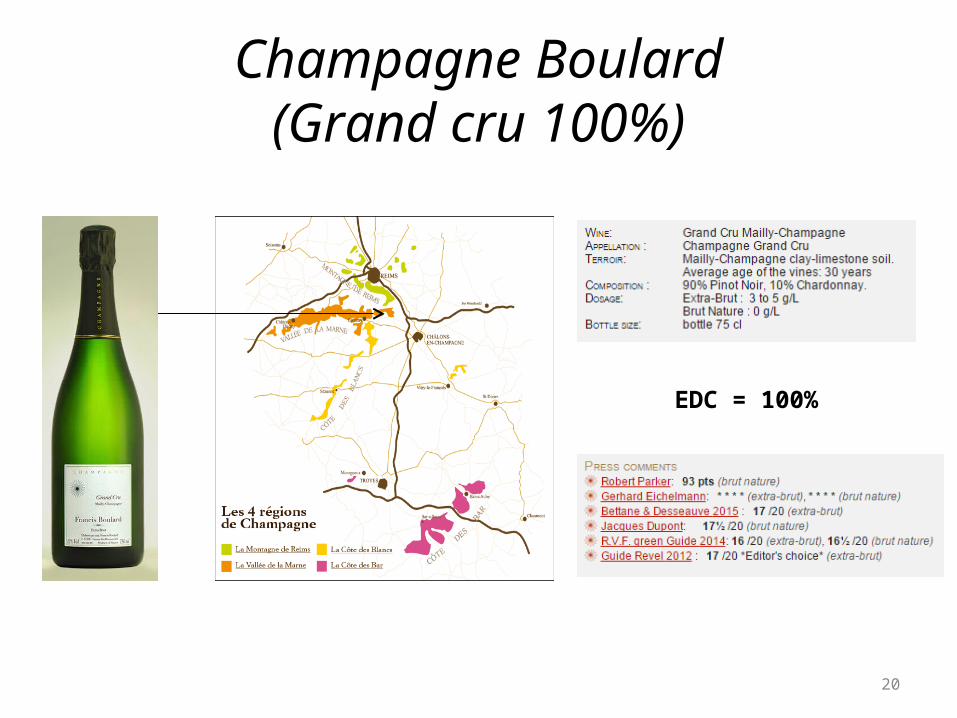
Champagne Boulard(Grand cru 100%)
20
EDC = 100%

Main objectives
• Test whether the EDC is still used as an anchor by champagne producers
• Estimates based on:– Vineyard prices– Grape prices
• Model:– Price = f (land, weather, EDC)– EDC is endogenous and depends on land & weather– Instrument used: distance to Reims
21
Why distance to Reims?
• Exogenous:– The decision by champagne houses to locate in
Reims in the 18th century, was determined by factors other than proximity to high quality vineyards.
• …
22
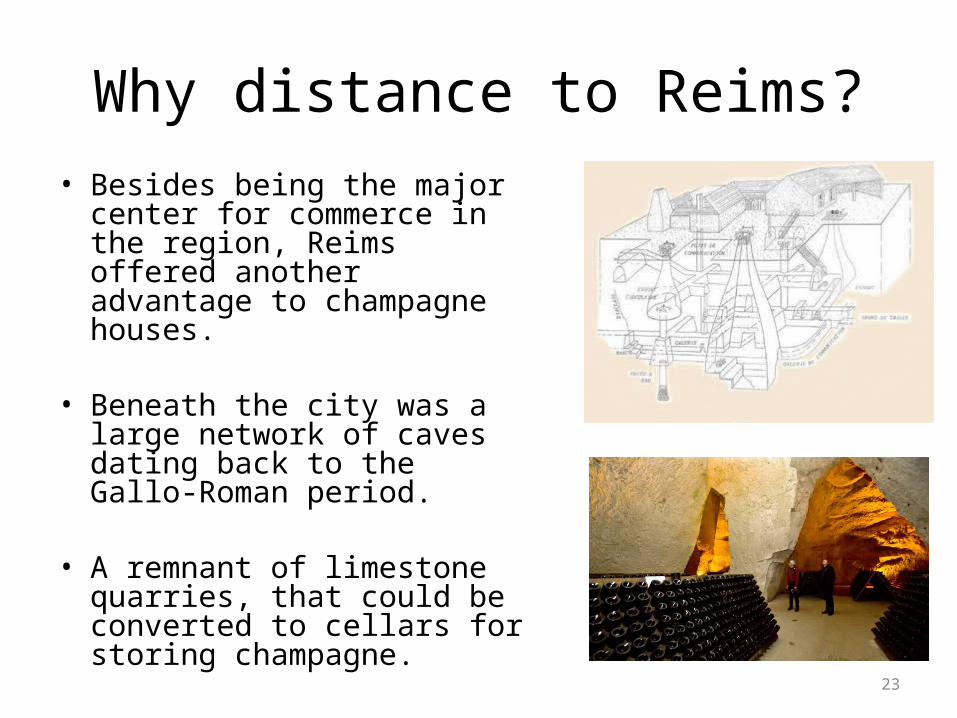
Why distance to Reims?• Besides being the major center
for commerce in the region, Reims offered another advantage to champagne houses.
• Beneath the city was a large network of caves dating back to the Gallo-Roman period.
• A remnant of limestone quarries, that could be converted to cellars for storing champagne.
23
Why distance to Reims?
• Relevant:– The latest versions of the EDC still depend, to a
certain extent, on a distance factor.
• …
24

EDC – Main Determinants (1) (2)
Distance to Reims -0.05*** -0.03*** (-16.96) (-5.53)Limestone (prop.) 6.62*** (5.66)Silica sand (prop.) -3.85*** (-3.88)Sedimentary rocks -3.83** (-2.56)10% < Slope coeff. < 20% -1.85** (-2.07)20% < Slope coeff. < 30% -2.87*** (-3.05)Slope coeff. > 30% -2.07* (-1.71)Av. annual Rainfall (in cm) -0.46*** (-2.69)Av. annual frost days (in days per year) -3.61*** (-3.63)North-East orientation 2.47** (2.11)Constant 88.14*** 102.66*** (204.83) (29.28)Observations 298 220R-squared 32% 65%
• Model (1) : R² = 32% !
• Model (2) :– + 100 km = -3 pts– + 10% limestone = +6,6 pts– + 10% silica sand = -3.85 pts– + 10% sedimentary rocks = -3.83 pts– …
• Model (2) explains 65% of the EDC
• The rest is probably… Politics?
25
Cost of transporting grapes
• The cost of transporting grapes to Reims – was an important consideration when the EDC ratings
were first established in 1911 (Nollevalle 1961) – but no longer has an appreciable effect on returns to
grape production
• (Transp. cost / Total value):– 0.13% from Marne– 0.21% from Aisne – 0.46% from Aube
26
Distance to Reims & Epernay
Anchoring effects
• Laboratory experiments show that final estimates will often be systematically related to initial values.
• Even when these starting points are arbitrarily chosen (Northcraft and Neale 1987, Ariely et al. 2003, Maniadis et al. 2014).
• This phenomenon is referred to as anchoring
28
Empirical Evidence
• Fine art auctions:– Beggs and Graddy (2009)– Find that the previous sale price for a painting has a
strong influence on the current sale price.
• Prediction markets:– McAlvanah and Moul (2013)– Show that Australian horseracing bookies fail to make
sufficient adjustments to betting odds after a late withdrawal of a horse, thus anchoring on the original odds .
29
Empirical Evidence
• Real estate transactions:– Bokhari and Geltner (2011) – Bucchianeri and Minson (2013) – Found that higher listing prices for single-family
homes are associated with higher final selling prices
• Rental prices:– Simonsohn and Loewenstein (2006) – Migrants to a city rent more expensive apartments if
their previous city had higher-priced housing, and vice-versa
30
Sources
• Vineyard transactions:– Parcel-level data (12,433 obs.)– Sample period: 2002 – 2012– Sociétés d’aménagement foncier et
d’établissement rural (SAFER)
• Grape prices:– Village-level data (10,853 obs.)– Sample period: 1991 to 2012, except
for 1992 – Comité Champagne
31
Sources
• Weather data:– Village-level data– Sample period: 1994 – 2011– Daily information (temp., rainfall, frost days)– 33 stations spread across the Champagne
region– Comité Champagne
• Soil data:– Parcel-level data– Orientation, Slope, Altitude, Soil type– BRGM
32
Grape prices
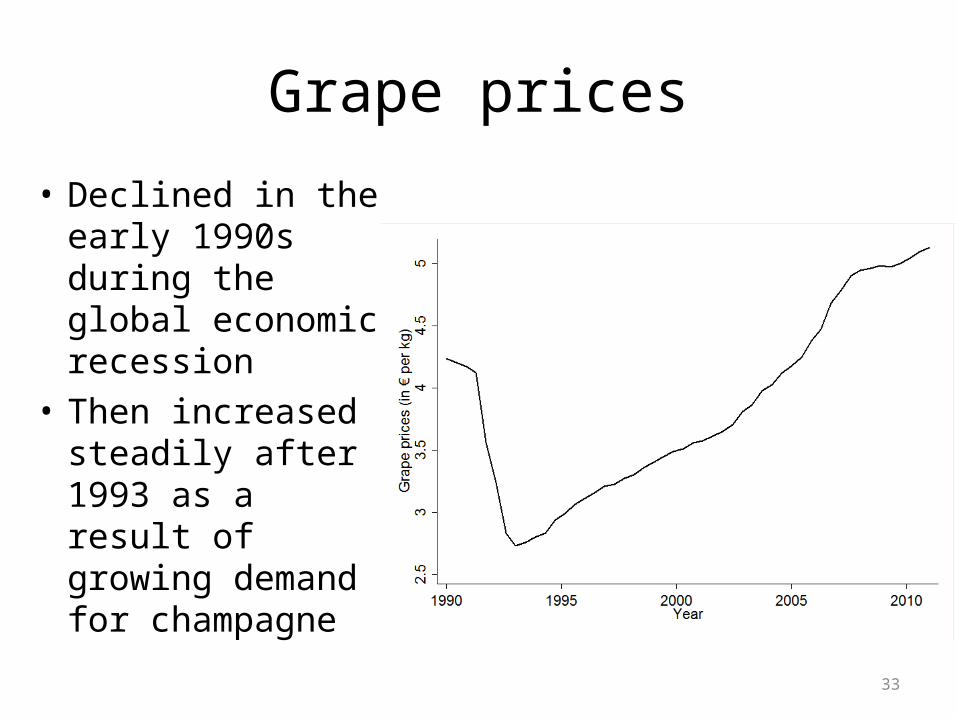
• Declined in the early 1990s during the global economic recession
• Then increased steadily after 1993 as a result of growing demand for champagne
33
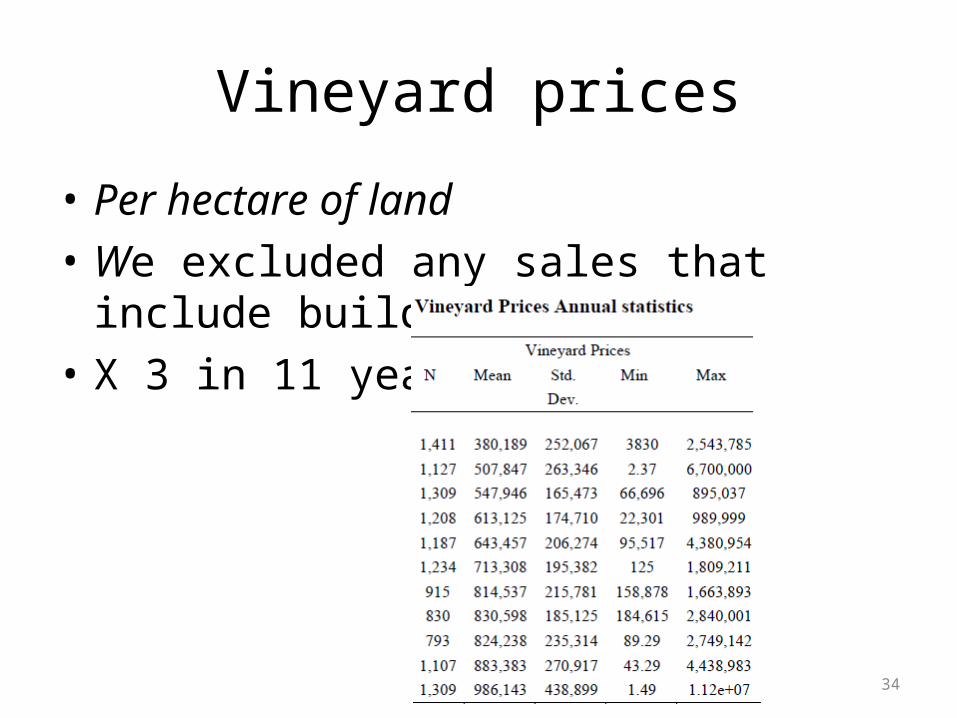
Vineyard prices
• Per hectare of land • We excluded any sales that include buildings• X 3 in 11 years
34
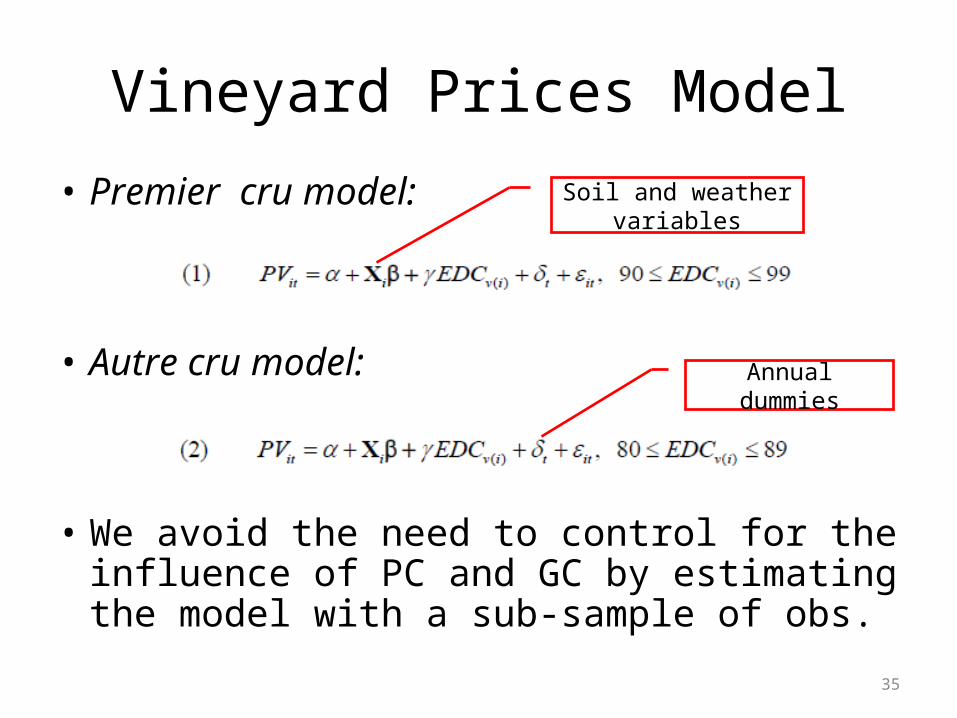
Vineyard Prices Model
• Premier cru model:
• Autre cru model:
• We avoid the need to control for the influence of PC and GC by estimating the model with a sub-sample of obs.
35
Soil and weather variables
Annual dummies
IV results
• Autre cru: a one-unit in the EDC the price of vineyards by 7.1%.
• Premier cru: a one-unit in the EDC the price of vineyards by 9.4%.
• Prices are increasing in the size of the parcel
• Strong upward trend in the nominal price of vineyards
36
IV results
• Several of the soil variables have significant effects.
• Altitude affects the price of AC parcels negatively.
• Differences in slope and aspect have limited influence.
37
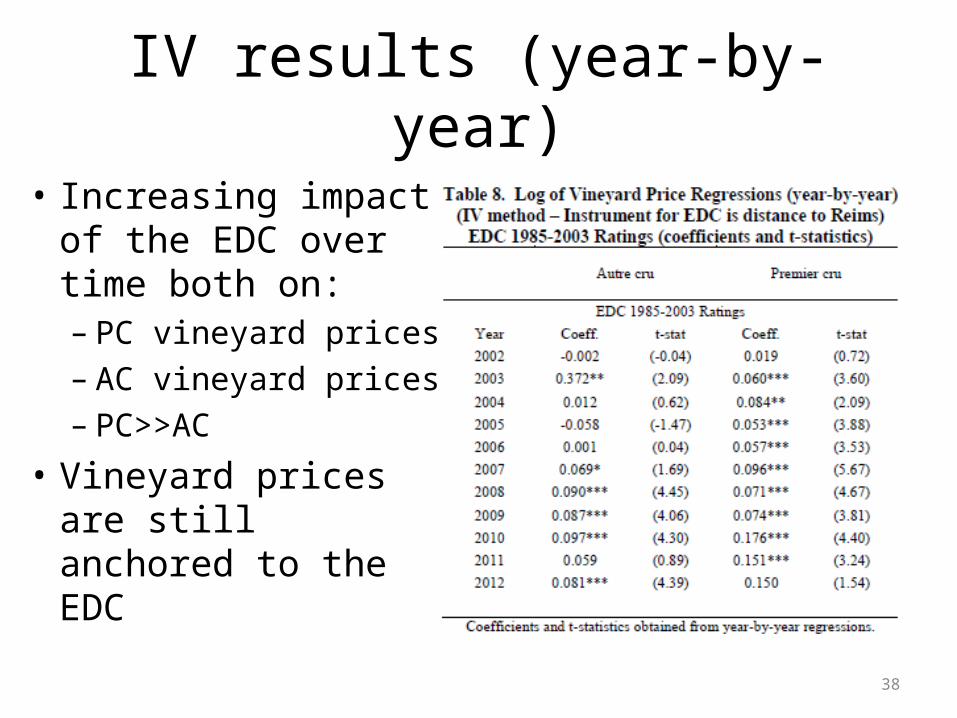
IV results (year-by-year)
• Increasing impact of the EDC over time both on:– PC vineyard prices– AC vineyard prices– PC>>AC
• Vineyard prices are still anchored to the EDC
38
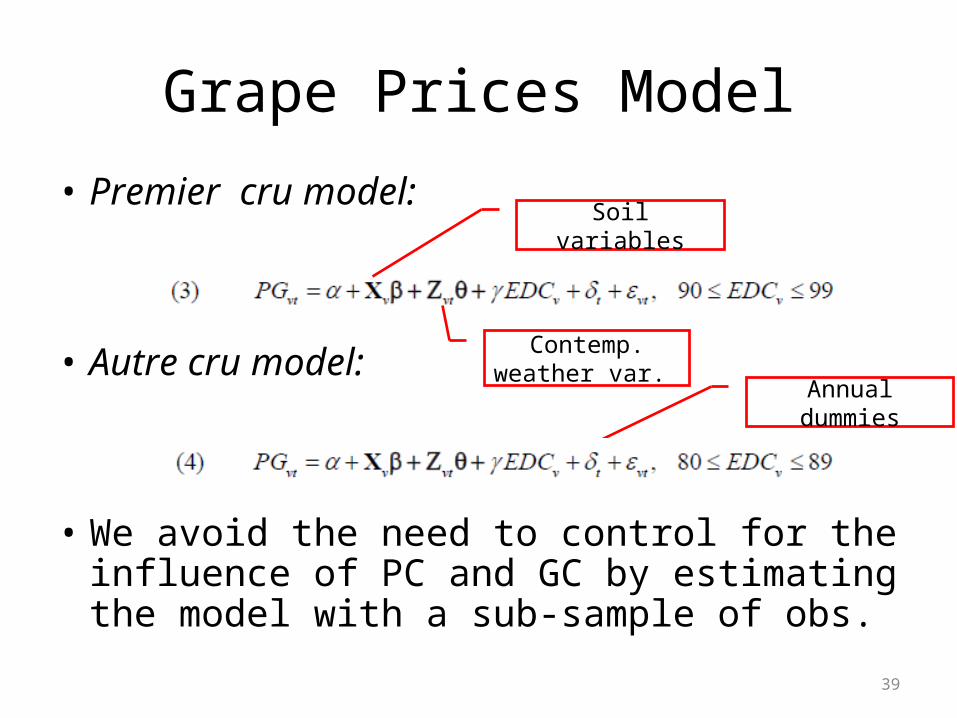
Grape Prices Model
• Premier cru model:
• Autre cru model:
• We avoid the need to control for the influence of PC and GC by estimating the model with a sub-sample of obs.
39
Annual dummies
Contemp. weather var.
Soil variables
IV results
40
• Autre cru: a one-unit in the EDC the price of grapes by 2%
• Premier cru: a one-unit in the EDC the price of vineyards by 0.7%
• Effect is smaller than for the vineyard prices (capitalized value of the stream of profits from grape production)
IV results
41
• EDC was officially abandoned in the recent past
• Despite this EDC still had an
– increasing impact on PC grape prices– significant but decreasing impact on AC grape
prices
• Overall, we find strong evidence for anchoring.
• In all of the IV specifications we tested, the EDC is found to have a positive and significant effect on grape or vineyard prices.
• The effects of anchoring are large in magnitude
Conclusions
42

• The role of the EDC in determining prices for grapes officially ended in 1990.
• Yet, our results indicate that it continues to have a strong influence on grape and vineyard prices!
• Main reasons for this is probably an increased uncertainty due to:– Climate change– Upcoming extension of the appellation area ( AC
vineyards)
Conclusions
43
Appendix
44
Echelle Des Crus: History
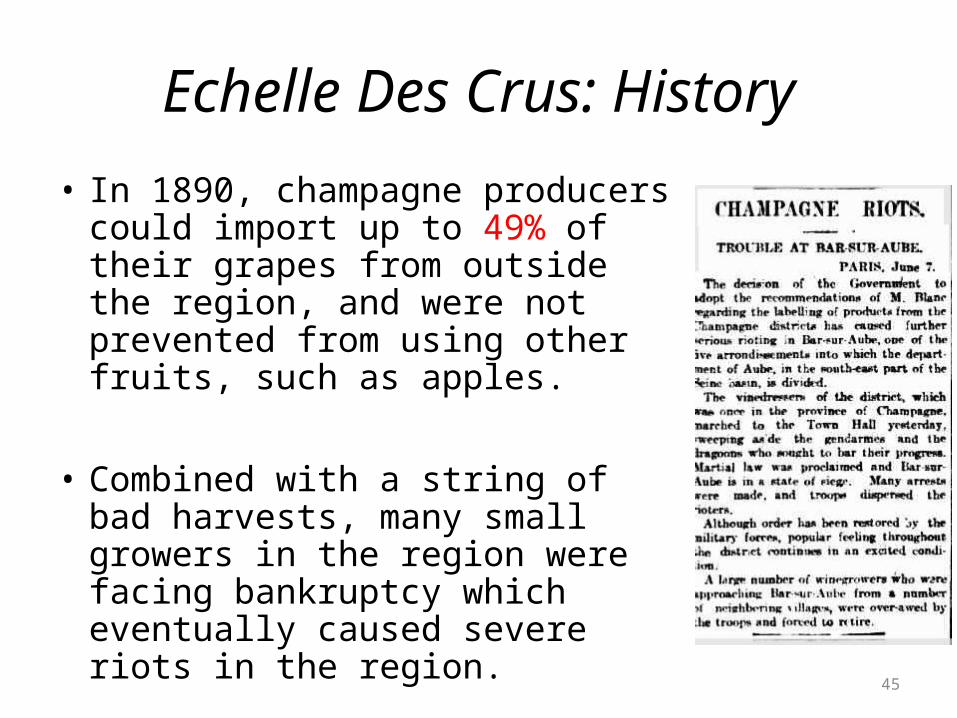
• In 1890, champagne producers could import up to 49% of their grapes from outside the region, and were not prevented from using other fruits, such as apples.
• Combined with a string of bad harvests, many small growers in the region were facing bankruptcy which eventually caused severe riots in the region.
45
Echelle Des Crus: History
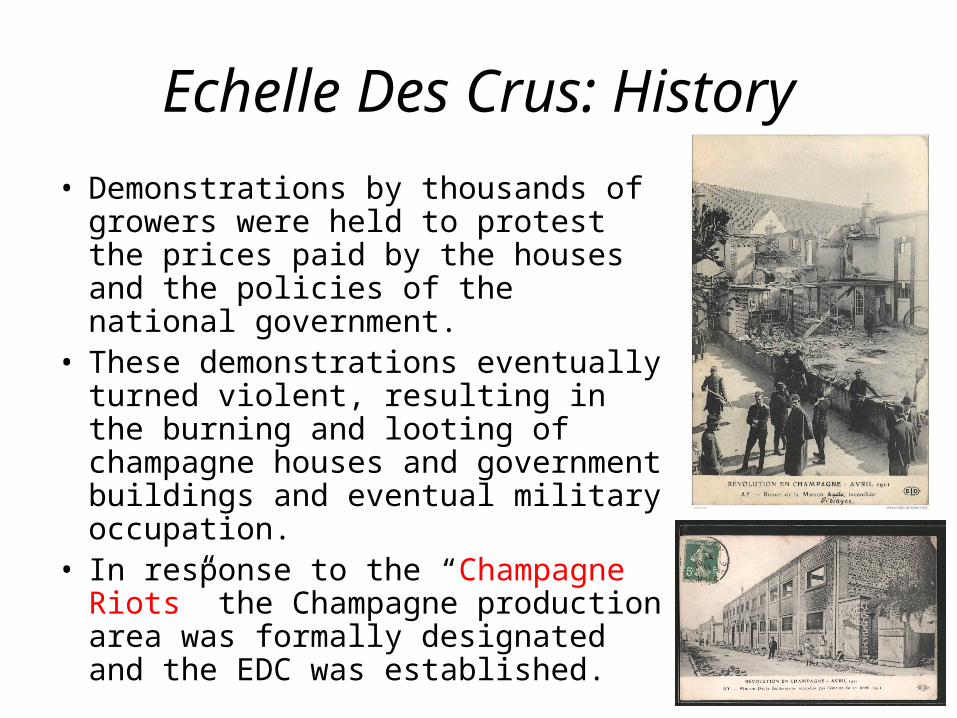
• Demonstrations by thousands of growers were held to protest the prices paid by the houses and the policies of the national government.
• These demonstrations eventually turned violent, resulting in the burning and looting of champagne houses and government buildings and eventual military occupation.
• In response to the “Champagne Riots” the Champagne production area was formally designated and the EDC was established. 46


![[Gokigenyou] Hon Crus C.11](https://img.pdfslide.net/doc/110x75/577cdf651a28ab9e78b121ed/gokigenyou-hon-crus-c11.jpg)


![[Gokigenyou] Hon Crus C.10](https://img.pdfslide.net/doc/110x75/577cdf651a28ab9e78b121e9/gokigenyou-hon-crus-c10.jpg)


