Embed Size (px)
Citation preview
University of Nebraska - LincolnDigitalCommons@University of Nebraska - LincolnMechanical (and Materials) Engineering --Dissertations, Theses, and Student Research
Mechanical & Materials Engineering, Departmentof
11-2017
Anchoring and Stiffening Techniques for PortableConcrete BarriersSurajkumar BhaktaUniversity of Nebraska-Lincoln, [email protected]
Follow this and additional works at: http://digitalcommons.unl.edu/mechengdiss
Part of the Applied Mechanics Commons, and the Other Mechanical Engineering Commons
This Article is brought to you for free and open access by the Mechanical & Materials Engineering, Department of at DigitalCommons@University ofNebraska - Lincoln. It has been accepted for inclusion in Mechanical (and Materials) Engineering -- Dissertations, Theses, and Student Research by anauthorized administrator of DigitalCommons@University of Nebraska - Lincoln.
Bhakta, Surajkumar, "Anchoring and Stiffening Techniques for Portable Concrete Barriers" (2017). Mechanical (and Materials)Engineering -- Dissertations, Theses, and Student Research. 131.http://digitalcommons.unl.edu/mechengdiss/131

ANCHORING AND STIFFENING TECHNIQUES FOR PORTABLE CONCRETE
BARRIERS
by
Surajkumar Bhakta
A THESIS
Presented to the Faculty of
The Graduate College at the University of Nebraska
In Partial Fulfillment of Requirements
For the Degree of Master of Science
Major: Mechanical Engineering and Applied Mechanics
Under the Supervision of Professor John D. Reid
Lincoln, Nebraska
November, 2017

ANCHORING AND STIFFENING TECHNIQUES FOR PORTABLE CONCRETE
BARRIERS
Surajkumar Bhakta, M.S.
University of Nebraska, 2017
Advisor: John D. Reid
Portable concrete barrier (PCB) systems are utilized on federal and state highways
in circumstances such as placing adjacent to vertical drop-offs and in construction zones.
PCB systems are most commonly used in a free-standing configuration, which are known
to have relatively large deflections when impacted. Large deflections are undesirable when
dealing with limited space. In order to allow PCBs to be used in space restricted locations,
seven PCB anchoring and stiffening techniques were tested and evaluated as per Manual
for Assessing Safety Hardware (MASH) testing standards. Results will allow the New
Jersey Department of Transportation to update guidance for their use and installation of
PCBs.
Techniques that restrict deflections included the use of anchorage and stiffeners on
the PCBs. Pin and bolt anchor rods were used to anchor PCBs to road surfaces, and box
beam rails and non-shrink grout wedges were used as stiffeners. Box beam rails were
mounted on the back side of the system and non-shrink grout wedges were placed between
barrier sections.
Full-scale crash tests indicated that anchoring of PCBs limits barrier deflection
when impacted. Box beam stiffening of free-standing systems reduced dynamic barrier
deflections from 40.7 in. to 33.0 in. The bolt anchored version of the PCB system had 4.9
in. of dynamic deflection, by far the least amount; additionally the vehicle was more stable
than the pin anchorage systems.

iii
ACKNOWLEDGEMENTS
First, I would like to thank Dr. John Reid for giving me opportunity to succeed in
graduate school. You have helped make this experience invaluable by challenging me and
demanding high quality work and thinking outside the box. Moreover, I deeply appreciate
your guidance, support, and advice. You always made time to ensure that all of my
questions were answered no matter how busy your schedule was.
I would also like to thank the member of my graduate committee, Dr. Cody Stolle,
and Dr. Carl Nelson. It has been pleasure working with you and I am thankful for all your
efforts on my thesis. Dr. Stolle, I wish that I had the opportunity to take your Vehicle
Dynamics class because I know that you are very knowledgeable, and it would have been
interesting to learn several things. I would like to thank Karla and Dr. Faller for all of your
assistance. Thank you for all of your help, time, and patience working with me on this
project. I cannot imagine doing any of this without your help.
I would also like to thank all of the MwRSF employees. There are so many people
to list who have made my time here so enjoyable, and thank you for your guidance. I would
also like to thank my fellow colleagues for making graduate school so enjoyable. Thank
you my friends for allowing me to forget about the stresses of graduate school and
remember to still enjoy life along the way.
Finally, I would like to thank my family. To my parents, thank you for your support
and motivating me to always achieve more. This opportunity could not be possible without
your love and care every day of my life. I would to thank special people in my life for
instilling a sense of curiosity in me.

iv
TABLE OF CONTENTS
ACKNOWLEDGEMENTS ............................................................................................... iii
TABLE OF CONTENTS ................................................................................................... iv
LIST OF FIGURES ........................................................................................................... vi
LIST OF TABLES ............................................................................................................ vii
CHAPTER 1. INTRODUCTION .......................................................................................1 1.1 Research Statement ........................................................................................... 1 1.2 Background ....................................................................................................... 3
CHAPTER 2. LITERATURE REVIEW ............................................................................5 2.1 New Jersey Shaped PCBs ................................................................................. 6
2.1.1 Free-standing and Unanchored System for New York State’s PCBs 6 2.1.2 Box-Beam Stiffening of NYSDOT PCBs.......................................... 7
2.1.3 New York State’s PCBs in Pin Anchored Configurations................. 9 2.2 F-Shape PCBs in Free-Standing Configurations ............................................ 11
2.2.1 Development of MwRSF F-Shape PCB .......................................... 11
2.2.2 Modified Virginia DOT F-Shape PCBs ........................................... 12 2.2.3 F-Shape PCB Evaluation under Update to NCHRP Report 350 ..... 13
2.3 Anchorage of F-Shape PCBs .......................................................................... 14 2.3.1 Tie-Down System for F-Shape PCBs .............................................. 14
2.3.2 Tie-Down System for Redesigned F-Shape PCBs........................... 15 2.3.3 Tie-Down System for F-Shape PCBs on Asphalt Road Surfaces.... 16
2.3.4 PCB System for Off-Road Applications .......................................... 17
CHAPTER 3. SYSTEM DETAILS ..................................................................................19 3.1 Pin Anchorage ................................................................................................. 21
3.2 Bolt Anchorage ............................................................................................... 22 3.3 Box-Beam Rail as Stiffener ............................................................................ 23
3.4 Non-Shrink Grout ........................................................................................... 24
CHAPTER 4. EVALUATION CRITERIA ......................................................................25
CHAPTER 5. NEW JERSEY PCB TESTS ......................................................................28 5.1 Test No. NJPCB-1 .......................................................................................... 28
5.1.1 Test Description and Vehicle Behavior ........................................... 29 5.1.2 Barrier Deflections ........................................................................... 29 5.1.3 Barrier Damage ................................................................................ 30 5.1.4 Vehicle Damage ............................................................................... 30
5.2 Test No. NJPCB-2 .......................................................................................... 31
5.2.1 Test Description and Vehicle Behavior ........................................... 32 5.2.2 Barrier Deflections ........................................................................... 32 5.2.3 Barrier Damage ................................................................................ 33
5.2.4 Vehicle Damage ............................................................................... 33 5.3 Test No. NJPCB-3 .......................................................................................... 34

v
5.3.1 Test Description and Vehicle Behavior ........................................... 35 5.3.2 Barrier Deflections ........................................................................... 35 5.3.3 Barrier Damage ................................................................................ 36 5.3.4 Vehicle Damage ............................................................................... 36
5.4 Test No. NJPCB-4 .......................................................................................... 37 5.4.1 Test Description and Vehicle Behavior ........................................... 38 5.4.2 Barrier Deflections ........................................................................... 38 5.4.3 Barrier Damage ................................................................................ 39 5.4.4 Vehicle Damage ............................................................................... 39
5.5 Test No. NJPCB-5 .......................................................................................... 40 5.5.1 Test Description and Vehicle Behavior ........................................... 41 5.5.2 Barrier Deflections ........................................................................... 41
5.5.3 Barrier Damage ................................................................................ 42 5.5.4 Vehicle Damage ............................................................................... 42
5.6 Test No. NJPCB-6 .......................................................................................... 43
5.6.1 Test Description and Vehicle Behavior ........................................... 44 5.6.2 Barrier Deflections ........................................................................... 44
5.6.3 Barrier Damage ................................................................................ 45 5.6.4 Vehicle Behavior ............................................................................. 45
5.7 Test No. NJPCB-7 .......................................................................................... 46
5.7.1 Test Description and Vehicle Behavior ........................................... 47 5.7.2 Barrier Deflections ........................................................................... 47
5.7.3 Barrier Damage ................................................................................ 48 5.7.4 Vehicle Behavior ............................................................................. 48
CHAPTER 6. DISCUSSION AND ANALYSIS..............................................................49 6.1 Free-standing Systems .................................................................................... 51
6.2 Pin Anchorage Systems .................................................................................. 51 6.3 Bolt Anchorage System .................................................................................. 52
CHAPTER 7. CONCLUSION AND FUTURE WORK ..................................................53
CHAPTER 8. REFERENCES ..........................................................................................58

vi
LIST OF FIGURES
Figure 1. New Jersey Barrier (left) and F-Shape Barrier (right) profiles ...................4 Figure 2. PCBs with Box-Beam Stiffener...................................................................8
Figure 3. Initial Prototype of F-Shaped PCB segment .............................................11 Figure 4. Updated design of F-Shaped PCB .............................................................12 Figure 5. Steel Tie-Down Strap ................................................................................15 Figure 6. Tie-Down System for Redesigned F-Shaped PCBs ..................................16 Figure 7. Tie-Down System for Asphalt Surface ......................................................17
Figure 8. PCB ski design ..........................................................................................18 Figure 9. Barrier System ...........................................................................................19 Figure 10. Connection between barriers ...................................................................20
Figure 11. Pin Anchors on Barriers ..........................................................................21 Figure 12. Bolt Anchors on Barriers .........................................................................22 Figure 13. Box Beam Stiffeners................................................................................23
Figure 14. Non-Shrink Grout between barriers ........................................................24 Figure 15. Impact Condition and Location ...............................................................26
Figure 16. Results Summary of full-scale crash test – NJPCB-1 .............................28 Figure 17. Sequential View of Vehicle Behavior – NJPCB-1 ..................................29 Figure 18. Barrier Deflection (Impact location, during impact, and Post Impact) ...29
Figure 19. Barrier Damage – Barrier 4 (Top) and Barrier 5 (Bottom) .....................30 Figure 20. Results Summary of full-scale crash test – NJPCB-2 .............................31
Figure 21. Sequential View of Vehicle Behavior – NJPCB-2 ..................................32 Figure 22. Barrier Deflection (Impact location, during impact, and Post Impact) ...32
Figure 23. Barrier Damage – Barrier 4 (Top) and Barrier 5 (Bottom) .....................33 Figure 24. Results Summary of full-scale crash test – NJPCB-3 .............................34
Figure 25. Sequential View of Vehicle Behavior – NJPCB-3 ..................................35 Figure 26. Barrier Deflection (Impact location, during impact, and Post Impact) ...35 Figure 27. Barrier Damage – Barrier no. 4 (Top) and Barrier no. 5 (Bottom) .........36
Figure 28. Results Summary of full-scale crash test – NJPCB-4 .............................37 Figure 29. Sequential View of Vehicle Behavior – NJPCB-4 ..................................38
Figure 30. Barrier Deflection (Impact location, during impact, and Post Impact) ...38 Figure 31. Barrier Damage – Barrier no. 4 (Top) and Barrier no. 5 (Bottom) .........39
Figure 32. Results Summary of full-scale crash test – NJPCB-5 .............................40 Figure 33. Sequential View of Vehicle Behavior – NJPCB-5 ..................................41 Figure 34. Barrier Deflection (Impact location, during impact, and Post Impact) ...41
Figure 35. Barrier Damage – Barrier 4 (Top) and Barrier 5 (Bottom) .....................42 Figure 36. Results Summary of full-scale crash test – NJPCB-6 .............................43 Figure 37. Sequential View of Vehicle Behavior – NJPCB-6 ..................................44 Figure 38. Barrier Deflection (Impact location, during impact, and Post Impact) ...44
Figure 39. Barrier Damage – Barrier 4 (Top) and Barrier 5 (Bottom) .....................45 Figure 40. Results Summary of full-scale crash test – NJPCB-7 .............................46 Figure 41. Sequential View of Vehicle Behavior – NJPCB-7 ..................................47 Figure 42. Barrier Deflection (Impact location, during impact, and Post Impact) ...47 Figure 43. Barrier Damage – Barrier 4 (Top) and Barrier 5 (Bottom) .....................48 Figure 44. Dynamic Deflection and Permanent Set Deflection – NJPCB-2 ............52

vii
LIST OF TABLES
Table 1. NJDOT Roadway Design Manual – PCB guidance .....................................1 Table 2. NJDOT PCBs in various configurations .......................................................2
Table 3. System Performance of New Jersey Shaped PCBs ......................................5 Table 4. System Performance of F-Shaped PCBs in accordance with NCHRP 350 3-
11.................................................................................................................................6 Table 5. MASH 2016 TL-3 Crash Test Conditions for Longitudinal Barriers .........25 Table 6. Full-Scale Crash Tests Results – Barrier Deflections and Impact
Severities ...................................................................................................................50 Table 7. Full-Scale Crash Tests Results – Vehicle Behavior ...................................50 Table 8. PCB guidance – Change in Allowable Movements....................................54
Table 9. PCB guidance – Change in Joint Treatments with dynamic deflections ....55 Table 10. PCB guidance – Change in Joint Treatments with Permanent set
deflections .................................................................................................................56
1
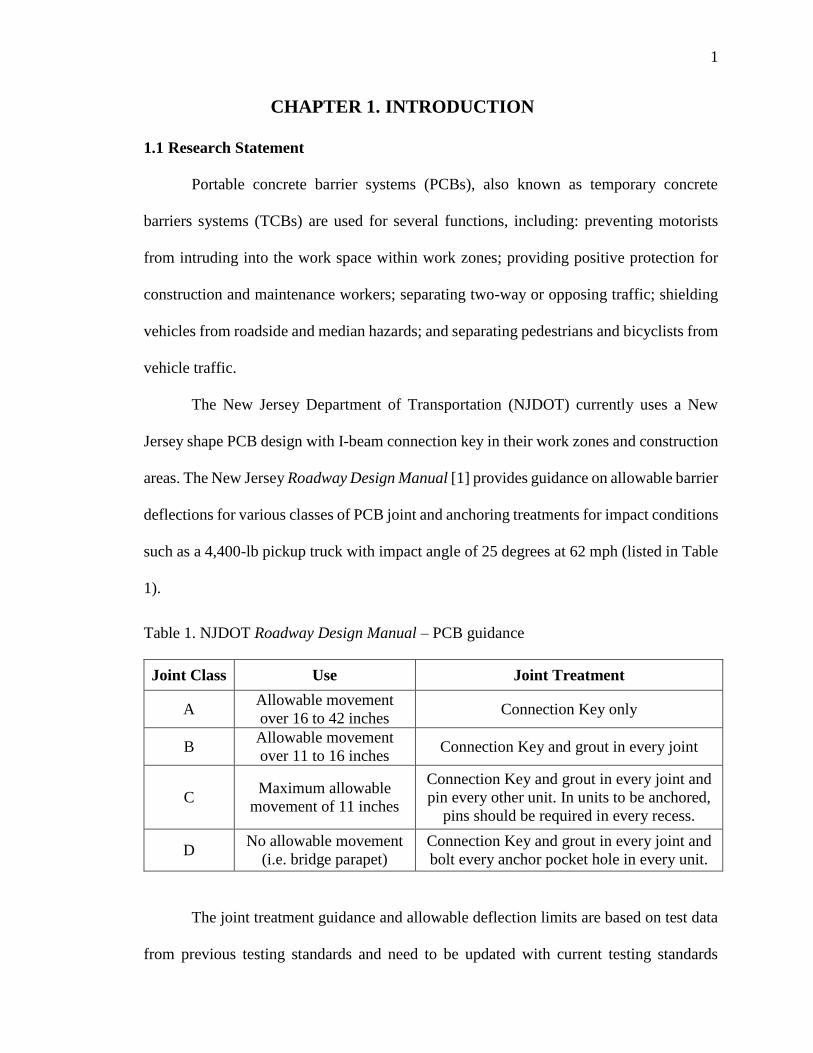
CHAPTER 1. INTRODUCTION
1.1 Research Statement
Portable concrete barrier systems (PCBs), also known as temporary concrete
barriers systems (TCBs) are used for several functions, including: preventing motorists
from intruding into the work space within work zones; providing positive protection for
construction and maintenance workers; separating two-way or opposing traffic; shielding
vehicles from roadside and median hazards; and separating pedestrians and bicyclists from
vehicle traffic.
The New Jersey Department of Transportation (NJDOT) currently uses a New
Jersey shape PCB design with I-beam connection key in their work zones and construction
areas. The New Jersey Roadway Design Manual [1] provides guidance on allowable barrier
deflections for various classes of PCB joint and anchoring treatments for impact conditions
such as a 4,400-lb pickup truck with impact angle of 25 degrees at 62 mph (listed in Table
1).
Table 1. NJDOT Roadway Design Manual – PCB guidance
Joint Class Use Joint Treatment
A Allowable movement
over 16 to 42 inches Connection Key only
B Allowable movement
over 11 to 16 inches Connection Key and grout in every joint
C Maximum allowable
movement of 11 inches
Connection Key and grout in every joint and
pin every other unit. In units to be anchored,
pins should be required in every recess.
D No allowable movement
(i.e. bridge parapet)
Connection Key and grout in every joint and
bolt every anchor pocket hole in every unit.
The joint treatment guidance and allowable deflection limits are based on test data
from previous testing standards and need to be updated with current testing standards

2
specified in Manual for Assessing Safety Hardware (MASH) [2]. Testing of other PCB
systems has indicated that dynamic barrier deflections can increase significantly when
compared to deflections based on older crash test data.
To reduce dynamic deflections and maximize barrier crashworthiness, the
anchoring and stiffening techniques used in New Jersey shaped PCBs were evaluated with
full-scale crash testing. The results would allow the NJDOT to develop and update
guidance for the installation and use of PCBs.
Only crash tests at Test Level 3 (TL3) that would maximize lateral deflections and
vehicle instability were considered. Thus, the MASH small car was omitted from the
research due to its low mass relative to the 2270P pickup truck (5,000 lb) test vehicle. Each
test utilized a separate configuration of either bolts or pins anchoring some or all of the
barriers to a concrete tarmac, as listed in Table 2. The configurations were then crash tested
and evaluated in accordance with MASH TL-3 test 3-11.
Table 2. NJDOT PCBs in various configurations
Test No. Type of
Anchors System Configuration
Joint
Class
NJPCB-1 Pin Barriers 1, 3, 5, 7, 9, and 10 pin anchored to concrete
tarmac C
NJPCB-2 Bolt All ten barrier segments bolt anchored to concrete
tarmac D
NJPCB-3 Pin Free-standing system with barriers 1 and 10 pin
anchored to concrete tarmac A
NJPCB-4 Pin Free-standing system with barriers 1 and 10 pin
anchored to concrete tarmac B
NJPCB-5 Pin
Box-Beam Stiffened to all nine joints between barrier
segments, and barriers 1 and 10 pin anchored to
concrete tarmac
B
(modified)
NJPCB-6 Pin
Barriers 1 and 10 pinned on both sides, and barriers 2
through 9 pin anchored on back side to concrete
tarmac
C
(modified)
NJPCB-7 Pin
Barriers 1 and 10 pinned on both sides, and barriers 2
through 9 pin anchored on traffic side to concrete
tarmac
C
(modified)

3
Note that the joint class treatments mentioned in Table 2 also contains modified
joint classes based on anchoring techniques. The updated PCB guidance will be based on
the maximum system deflection for Test Level 3, and to get maximum deflections small
car full-scale crash tests were not considered, as they produce low system deflections.
1.2 Background
Whenever a traffic control plan is developed that utilizes PCB system, it is
important to define acceptable barrier deflection criteria. The acceptable deflection criteria
can be expected to vary, depending on the application. The deflection criteria should be
selected to reduce the propensity of the barrier being displaced too far. The best example
of such a situation is when the barrier is used on the edge of a bridge deck. A conventional
PCB can be pulled off of the bridge by a single segment that is pushed off of the deck,
endangering workers and traffic below the bridge. Therefore, deflections that could lead to
such behavior should be avoided. Under this situation it is generally accepted that barriers
should be designed to contain almost all impacts without allowing the center of gravity of
any barrier segment to extend beyond the edge of the bridge. PCBs are more frequently
used in applications where lateral deflections are less catastrophic, but still must be
controlled.
There are many PCB designs in use, varying widely in terms of steel reinforcement,
joint connection, and segment length. The most common barriers used on federal and state
roadways are the New Jersey shape and F-shape barriers (see Figure 1). The F-shape
barriers were developed in the 1970s, while the New Jersey shape was developed in the
1950s. Width at the top of a New Jersey shaped barrier is narrower than F-shaped barriers,
while specific dimensions (length, height, and width), connection joints, reinforcements,

4
materials and other features differ from state to state. The focus of this study is primarily
on New Jersey shape PCBs.
Figure 1. New Jersey Barrier (left) and F-Shape Barrier (right) profiles
Several anchoring and stiffening techniques have been incorporated into selected
PCB systems to reduce barrier deflections and allow their use in restricted work zones with
confined space behind the barrier system. Some of these systems have included the use of
stiffening beams placed on the back side of the barriers and across the joints, the placement
of vertical pins or rods through either the front toe or both toes of the barrier and into the
pavement or bridge deck surface, as well as the use of an anchorage system that connects
the joint hardware to the deck surface.

5
CHAPTER 2. LITERATURE REVIEW
A literature search was conducted in order to review (1) previous PCB systems
barrier deflections, and (2) barrier anchoring and stiffening techniques. A brief summary
of relevant research studies is provided herein and include test descriptions, test conditions,
dynamic deflections and maximum lateral permanent sets. Performance summaries of a
few New Jersey shaped and F-Shaped PCB systems are listed in Tables 3 and 4. Data
reported in SI units in their respective reports were converted to English units herein.
Table 3. System Performance of New Jersey Shaped PCBs
Test No. Dynamic
Deflection (in.)
Permanent Set
Deflection (in.) System Configuration
473220-7 184.7 Penetrated Free-standing configuration with
connection keys
473220-14 50 50 Free-standing configuration with
connection keys
NYTCB-1 27.6 26
Box-Beam stiffener used between
barrier nos. 4 through 7, and
connection keys
NYTCB-2 40.3 39½ Free-standing configuration with
connection keys
NYTCB-3 30.9 26
Box-Beam stiffener used between
barrier nos. 2 through 9, and
connection keys
NYTCB-4 64.8 53½
Barrier nos. 1, 3, 5, 7, and 9
pinned on back side, and
connection keys
NYTCB-5 20.5 9 All barrier segments pinned on
backside, and connection keys
Note: (i) Test Nos. 473220-7 and 473220-14 were conducted by TTI, and the remaining tests
were conducted by Midwest Roadside Safety Facility (MwRSF)
(ii) Test Nos. 473220-7 and 473220-14 were conducted in accordance with NCHRP 350
3-11, and the remaining tests were according to MASH.
(iii) All tests were conducted on Concrete Tarmac

6
Table 4. System Performance of F-Shaped PCBs in accordance with NCHRP 350 3-11
Test No. Dynamic
Deflection (in.)
Permanent Set
Deflection (in.) System Configuration
ITMP-1 - 39 Pin and Loop connection
ITMP-2 45.3 44⅞ Pin and Loop connection
402041-1 72 67¼ Pin and Loop connection
2214TB-1 56.7 56¾ Free-Standing
2214TB-2 79.7 73 Free-Standing
ITD-1 37.8 33½ Tie-down
KTB-1 11.3 3½ Tie-down
FTB-1 21.8 11⅛ Pinned on traffic side, and asphalt
as support surface Note: (i) Test No. 402041-1 was conducted by TTI, all others were conducted by MwRSF
(ii) Test Nos. 2214TB-1 and 2214TB-2 were conducted in accordance with Update to
NCHRP 350 3-11, which is now known as MASH.
(iii) Test No. FTB-1 was conducted on asphalt, all others were conducted on Concrete
Tarmac
2.1 New Jersey Shaped PCBs
2.1.1 Free-standing and Unanchored System for New York State’s PCBs
In 1999, a free-standing version of the NYSDOT PCBs with unpinned ends was
tested by the Texas Transportation Institute (TTI) [3]. The full-scale crash test consisted of
ten 20-ft long, New Jersey shape PCB segments with a total system length of 200 ft. The
PCB system utilized an I-beam key barrier-to-barrier connection. In test no. 473220-7, a
4,575-lb pickup truck impacted the system at a speed of 60.9 mph and at an angle of 26.3
degrees. During impact, three of the barrier joints failed, causing the barrier at the point of
impact to overturn. Subsequently, the vehicle overrode the barrier and rolled over. The test
was determined to be unacceptable according to the NCHRP Report 350 test criteria. The
joint failure was due to substandard welding in the connection joints.
7
In 2001, TTI tested a redesigned New Jersey shaped PCB (termed as NYDOT PCB)
in free-standing configuration [4]. The full-scale crash test consisted of ten 20-ft long, New
Jersey shape PCB segments with a total system length of 200 ft. The PCB system utilized
an I-beam key barrier-to-barrier connection. In test no. 473220-14, a 4,577-lb pickup truck
impacted at a speed of 62.6 mph and at an angle of 25.6 degrees. During the impact, the
vehicle was redirected smoothly, and the test was determined to be acceptable according
to the NCHRP Report 350 requirements. The barrier system experienced 50 in. of
maximum lateral dynamic deflection and 50 in. of permanent set. During the test, the
upstream end was pulled 513/16 in. longitudinally downstream, while the downstream end
displaced 3/16 in. longitudinally upstream. The noted lateral barrier deflections would be
correlated to the unpinned section ends. Concerns over the relatively large barrier
deflection caused NYSDOT to contract with MwRSF to conduct barrier stiffening
research.
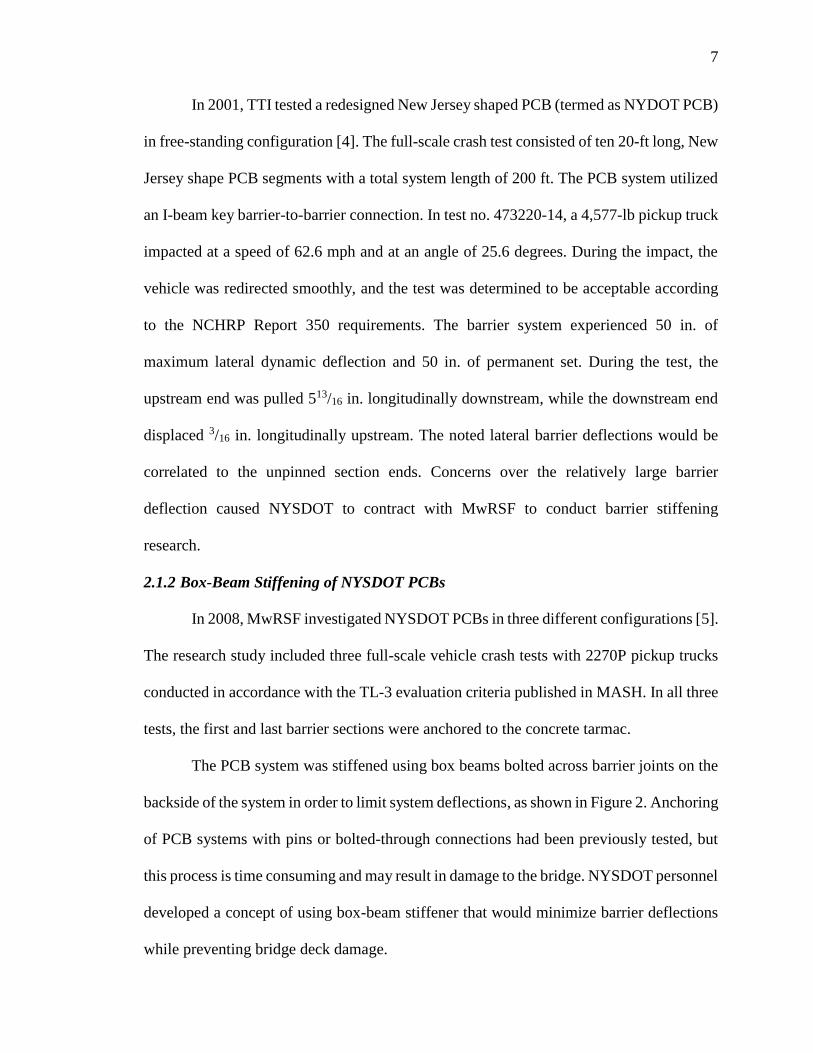
2.1.2 Box-Beam Stiffening of NYSDOT PCBs
In 2008, MwRSF investigated NYSDOT PCBs in three different configurations [5].
The research study included three full-scale vehicle crash tests with 2270P pickup trucks
conducted in accordance with the TL-3 evaluation criteria published in MASH. In all three
tests, the first and last barrier sections were anchored to the concrete tarmac.
The PCB system was stiffened using box beams bolted across barrier joints on the
backside of the system in order to limit system deflections, as shown in Figure 2. Anchoring
of PCB systems with pins or bolted-through connections had been previously tested, but
this process is time consuming and may result in damage to the bridge. NYSDOT personnel
developed a concept of using box-beam stiffener that would minimize barrier deflections
while preventing bridge deck damage.

8
Figure 2. PCBs with Box-Beam Stiffener
The first test installation consisted of ten 20-ft long, New Jersey shape PCB
segments for a total system length of 200 ft. The PCB system was free-standing with both
end segments pin anchored to the tarmac with nine 1-in. diameter × 15½-in. long, A36 steel
rods – five anchors on the traffic side and four anchors on the back side. Each anchor rod
was driven into a hole drilled in the concrete to an embedment depth of 5 in. The PCB
system utilized an I-beam key barrier-to-barrier connection. The three joints between
barrier nos. 4 and 7 were stiffened with box beams. Each box beam stiffener consisted of
a 6-in. × 6-in. × 3/16-in. ASTM A500 Grade C box beam, which was 12 ft long. The box
beams were connected to the barriers with ¾-in. diameter × 17-in. long, Grade 5
continuously threaded rod. During test no. NYTCB-1, a 5,016-lb pickup truck impacted
the system at a speed of 61.8 mph and at an angle of 24.6 degrees. The vehicle was
redirected smoothly, and the test was determined to be acceptable according to MASH
requirements. The barrier system experienced maximum lateral dynamic deflection of 27.6
in. and permanent set deflection of 26 in.

9
The second test, test no. NYTCB-2, consisted of an unstiffened version of the
NYSDOT PCBs with pin anchored ends. In this test, a 5,024-lb pickup truck impacted the
system at a speed of 61.2 mph and at an angle of 25.8 degrees. The vehicle redirected
smoothly and the test was determined to be acceptable according to MASH requirements.
The barrier system experienced 40.3 in. of maximum lateral dynamic deflection and 39½
in. of permanent set deflection.
The third full-scale crash test utilized a system that was identical to test no.
NYTCB-1, except with a more robust box-beam stiffener. Test no. NYTCB-3 consisted of
stiffening six joints between barrier nos. 2 and 8 with 6-in. × 8-in. × ¼-in. box beam
sections. In addition, this system was installed with the back side of the barrier sections
placed 12 in. away from a simulated bridge deck edge. In this test, a 5,001-lb pickup truck
impacted the system at a speed of 63.5 mph and at an angle of 24.4 degrees. The vehicle
was redirected smoothly, and the test was determined to be acceptable according to MASH
requirements. This system experienced 30.9 in. of dynamic deflection and 26 in. of
permanent set deflection.
2.1.3 New York State’s PCBs in Pin Anchored Configurations
In 2009 and 2010, two different versions of NYSDOT’s TCB system were
evaluated [6-7]. The research study included two full-scale vehicle crash tests with 2270P
pickup trucks conducted in accordance to the TL-3 evaluation criteria published in MASH.
For PCBs located adjacent to vertical drop-offs, NYSDOT found it desirable to utilize
vertical pins through the back-side toe of the PCBs in order to reduce barrier deflections as
well as to reduce the need for workers to be positioned on the traffic-side face of the system
when installing anchors.

10
Test no. NYTCB-4 was a pinned version of the NYSDOT PCB system [6]. The
system consisted of ten 20-ft long, New Jersey shaped PCBs with a total system length of
200 ft, with barriers 1, 3, 5, 7, and 9 pinned on the back side to the concrete tarmac with
steel rods placed through the pin anchor recesses of the barrier sections and set into drilled
holes in the concrete tarmac. A 5,172-lb pickup truck impacted the system at a speed of
62.3 mph and at an angle of 24.3 degrees. During impact, the joint between barrier nos. 4
and 5 completely separated at approximately the same time that the vehicle exited the
barrier system. The barrier system experienced 64.8 in. of maximum lateral dynamic
deflection and 53½ in. of permanent set deflection. This significant increase of dynamic
deflection was the result of the separation of the joint. However, the vehicle was contained
and smoothly redirected. Although complete joint separation occurred and is generally
undesirable, the test was determined to be acceptable according to MASH requirements.
For test NYTCB-5 every PCB segment was pin anchored on the back side to the
concrete surface. The test installation consisted of ten 20-ft long, New Jersey shape PCB
segments with a total system length of 200 ft. The PCB system utilized an I-beam key
barrier-to-barrier connection, and the system was placed 12 in. laterally from the edge of a
simulated bridge deck. A 5,124-lb pickup truck impacted the system at a speed of 64.3 mph
and at an angle of 26.2 degrees. The vehicle was redirected smoothly, and the test was
determined to be acceptable according to MASH requirements. The maximum lateral
dynamic barrier deflection was 20.5 in. and the permanent set of the barrier system was 9
in.

11
2.2 F-Shape PCBs in Free-Standing Configurations
2.2.1 Development of MwRSF F-Shape PCB
In 1996, an F-Shape PCB was developed and tested by the MwRSF for the Midwest
States Regional Pooled Fund program [9]. Before this, PCB configurations varied
significantly from state to state. Therefore, a need existed to develop, test, and evaluate one
standardized PCB design which met TL-3 impact safety standards set forth in NCHRP
Report 350. The redesigned F-Shaped PCB is shown in Figure 3.
Figure 3. Initial Prototype of F-Shaped PCB segment
This system consisted of sixteen 12 ft – 5½ in. long, F-Shape PCB segments for a
total system length of 203 ft – 3¾ in. The PCB system was free-standing on a concrete
surface and utilized a pin and loop barrier-to-barrier connection. In test no. ITMP-1, a
4,409-lb pickup truck impacted the PCB system at a speed of 64.1 mph and at an angle of
27.6 degrees. Upon impact, the vehicle climbed and overrode the system, and the test was
deemed unsuccessful as per NCHRP Report 350.
Upon inspection of the damaged barrier system, it was discovered that considerable
damage occurred at the barrier joints. It was determined that this damage was likely caused

12
by the weakened recessed areas located at the top end of each barrier segment. The recessed
areas were incorporated for future use in implementing a rigid joint for permanent barrier
installations. In order to reduce joint rotations and prevent barrier uplift, it was necessary
to strengthen the barrier ends by eliminating the recessed areas. Hence, the F-shape barriers
were redesigned, as shown in Figure 4.
Figure 4. Updated design of F-Shaped PCB
The redesigned system consisted of twenty one 12 ft – 5½ in. long, F-shape PCB
segments for a total system length of 267 ft – 5½ in. The PCB system was free-standing on
a concrete surface and utilized a pin and loop barrier-to-barrier connection. In test no.
ITMP-2, a 4,420-lb pickup truck impacted the PCB system at a speed of 62.3 mph and at
an angle of 27.1 degrees. The system contained and redirected the vehicle with maximum
lateral dynamic and permanent set deflections of 45.3 in. and 44⅞ in., respectively, and
was determined to be successful according to TL-3 of NCHRP Report 350.
2.2.2 Modified Virginia DOT F-Shape PCBs
In 1998, a modified Virginia Department of Transportation (VDOT) PCB was
tested and evaluated by TTI according to specifications of NCHRP Report 350 test level 3
(TL-3) [10]. The test no. 402041-1 consisted of five 20 ft – 5/32 in long, modified VDOT

13
PCB segments for a total system length of 100 ft – 15/16 in. The PCB system was free-
standing on a concrete surface and utilized a pin and loop barrier-to-barrier connection. In
test no. 402041-1, a 4,480-lb pickup truck impacted the PCB system at a speed 62.5 mph
and at an angle of 24.6 degrees. The system contained and redirected the vehicle with
maximum lateral dynamic and permanent set deflections of 72 in. and 67¼ in.,
respectively, and was determined to be successful according to TL-3 of NCHRP Report
350.
2.2.3 F-Shape PCB Evaluation under Update to NCHRP Report 350
With constant changes and upgrades to vehicles, standards for tests and evaluations
of roadside safety hardware must also change. Thus, NCHRP Report 350 was updated to
include heavier vehicles with higher centers of gravity. In 2006, MwRSF researchers
conducted another crash test under the impact conditions outlined in the update to NCHRP
Report 350 (now known as MASH) on the F-shaped PCB system that had been previously
tested [11].
The system consisted of sixteen 12 ft – 6 in. long, F-shape PCB segments for a total
system length of 204 ft – 6 in. The PCB system was free-standing on a concrete surface
and utilized a pin and loop barrier-to-barrier connection. In test no. 2214TB-1, a 5,000-lb
pickup truck impacted the system at a speed of 61.8 mph and at an angle of 25.7 degrees.
The system contained and redirected the vehicle with maximum lateral dynamic and
permanent set deflections of 56.7 in. and 56¾ in. respectively. The test vehicle utilized for
2214TB-1 was a ¾-ton 2-door pickup truck, rather, subsequent investigation revealed that
an alternative vehicle was preferred in the update to NCHRP Report 350. Hence, test no.
2214TB-2 was conducted with the recommended vehicle.

14
The system consisted of sixteen 12 ft – 6 in. long, F-shape PCB segments for a total
system length of 204 ft – 6 in. The PCB system was free-standing on a concrete surface
and utilized a pin and loop barrier-to-barrier connection. During test no. 2214TB-2, a
5,000-lb pickup truck impacted the system at a speed of 61.9 mph and at an angle of 25.4
degrees. The system contained and redirected the vehicle with maximum lateral dynamic
and permanent set deflections of 79.7 in. and 73 in., respectively, and was found to be
successful according to the TL-3 safety criteria published in the update to NCHRP Report
350.
2.3 Anchorage of F-Shape PCBs
2.3.1 Tie-Down System for F-Shape PCBs
In 2002, a tie-down system for PCBs was developed and tested by MwRSF [12].
Free-standing PCB systems near vertical drop-offs are at risk of being displaced off of the
bridge deck when impacted by an errant vehicle. In order to decrease this risk, MwRSF
developed a steel tie-down strap that could be placed on the connection pin at the PCB
joints and anchored to the bridge deck using drop-in anchors. The design consisted of a 3-
in. wide × ¼-in. thick × 36-in. long piece of ASTM A36 steel bent into a trapezoidal shape.
The straps were attached to the bridge deck using two ¾-in. diameter drop-in anchors and
¾-in. diameter × 2¼-in. long ISO Class 8.8 bolts, as shown in Figure 5.

15
Figure 5. Steel Tie-Down Strap
The test installation consisted of sixteen 12 ft – 6 in. long, F-shape PCB segments
placed 12 in. away from a bridge deck edge. In test no. ITD-1, a 4,435-lb pickup truck
impacted the system at a speed of 60.6 mph and at an angle of 24.3 degrees. The PCB
system contained and redirected the vehicle with maximum lateral dynamic and permanent
set barrier deflections of 37.8 in. and 33½ in., respectively. In test no. ITD-1, only one PCB
segment was displaced completely off the bridge deck with two PCB segments partially
displaced off the bridge deck. Thus, the results from test no. ITD-1 were successful
according to TL-3 of NCHRP Report 350.
2.3.2 Tie-Down System for Redesigned F-Shape PCBs
In 2003, MwRSF developed a tie-down system for redesigned F-shape PCBs that
incorporated a bolt-through detail [13]. The redesigned F-shape PCBs incorporated a three
loop connection that provided double shear at two locations on each pin. The bolt-through,
tie-down system consisted of three 1⅛-in. diameter ASTM A307 anchor bolts with heavy
hex nuts and 3-in. × 3-in. × ½-in. thick washers spaced evenly across the traffic side of

16
each PCB segment, as shown in Figure 6. Each anchor bolt was epoxied into the concrete
with an embedment depth of 12 in.
Figure 6. Tie-Down System for Redesigned F-Shaped PCBs
The test installation consisted of sixteen 12 ft – 6 in. long, redesigned F-shape PCB
segments were placed adjacent to a bridge deck edge with a total system length of 204 ft.
In test no. KTB-1, a 4,448-lb pickup truck impacted the system at a speed of 62.0 mph and
at an angle of 25.3 degrees. The system contained and redirected the vehicle with maximum
lateral dynamic and permanent set deflections of 11.3 in. and 3½ in., respectively, and was
considered successful according to TL-3 of NCHRP Report 350.
2.3.3 Tie-Down System for F-Shape PCBs on Asphalt Road Surfaces
In 2006, MwRSF developed a tie-down system for PCBs on an asphalt road surface
[14]. Previously developed tie-down systems had been only tested on concrete surfaces.
The tie-down system consisted of F-shape PCB segments placed on a 2-in. thick asphalt
pad with three 1½-in. diameter × 36-in. long, A36 steel pins installed through the holes on
the traffic-side toe of the PCB segments, as shown in Figure 7.

17
Figure 7. Tie-Down System for Asphalt Surface
The test installation consisted of sixteen 12 ft – 6 in. long, F-shape PCB segments
placed 6 in. from a 3-ft wide × 3-ft deep trench. The tie-down pins were installed on the
middle ten PCB segments. During test no. FTB-1, a 4,434-lb pickup truck impacted the
system at a speed of 61.3 mph and at an angle of 25.4 degrees. The tie-down PCB system
contained and redirected the vehicle with maximum lateral dynamic and permanent set
barrier deflections of 21.8 in. and 11⅛ in., respectively. A portion of the soil and asphalt
fractured and separated away from the road surface beneath the PCB system due to loading
of the tie-down pins. This separation did not adversely affect the performance of the
system, and was deemed successful according to TL-3 of NCHRP Report 350.
2.3.4 PCB System for Off-Road Applications
In 1996, MwRSF developed a PCB system for placement on a soil foundation [15].
PCB systems are typically placed on concrete or bituminous surfaces, but it is often
impractical and costly to follow this practice. Therefore, it was determined that
development of a PCB system capable of placement on soil foundations or native fill with

18
slopes 10H:1V or flatter would be economical. In order to mitigate the potential of barrier
tipping, a ski system was developed. The design called for two ski systems to be attached
to each PCB segment. The maximum overturning moment of a PCB during a crash test
was estimated to be 3.3 kip-ft and each ski system was designed to resist half of this
moment. A 2-ft × 2-ft square piece of ¾-in. thick plywood was placed under the ski to
prevent it from gouging into the soil. The ski was attached to the plywood with ¼-in. long
wood screw, as shown in Figure 8.
Figure 8. PCB ski design
The test installation consisted of seventeen 12 ft – 6 in. long, F-shape PCB segments
for a total system length of 203 ft – 5½ in. In test no. KTS-1, a 4,405-lb pickup truck
impacted the PCB system at a speed of 61.9 mph and at an angle of 26.9 degrees. The
system contained and redirected the vehicle with a permanent set deflection of 4511/16 in.
and was considered successful according to TL-3 of NCHRP Report 350.

19
CHAPTER 3. SYSTEM DETAILS
A 32-in. tall New Jersey shape PCB was chosen for this research study, which is
representative of the typical PCB used by NJDOT to create work zones and construction
areas (see Figure 9). Each PCB segment measured 20 ft long and utilized an I-beam
connection key for the barrier-to-barrier connection, as shown in Figure 10. This research
study was focused on the evaluation of NJDOT PCBs, as mentioned in NJDOT’s Roadway
Design Manual [1]. Brief system details are provided herein, more details is in respective
test reports [20-26].
Back Side Traffic Side
Figure 9. Barrier System

20
Figure 10. Connection between barriers
Each test installation consisted of ten 20-ft long NJDOT PCBs. The concrete used
for the barrier sections consisted of a concrete mix with a minimum 28-day compressive
strength of 3,700 psi. A minimum concrete cover of 1½ in. was used along all rebar in the
barrier. All of the steel reinforcement in the barrier was ASTM A615 Grade 60 rebar and
consisted of four No. 6 longitudinal bars, eight No. 4 bars for the vertical stirrups, four No.
6 lateral bars, and nine No. 4 bars for the pin anchor hole reinforcement loops. No steel
reinforcement was used for the bolt anchor pockets.
The connection key assembly consisted of ½-in. thick ASTM A36 steel plates
welded together to form the key shape. A connection socket was configured at each end of
the PCB, consisting of three ASTM A36 steel plates welded on the sides of ASTM A500
Grade B or C steel tube. The connection key was inserted into the steel tubes of two
adjoining PCBs to form the connection.

21
Two anchoring techniques and two stiffening techniques are studied. Anchoring
techniques include use of pins and bolts. Stiffening techniques include use of box beam
rails and non-shrink grout wedges placed between barrier sections.
3.1 Pin Anchorage
Each barrier section of NJDOT PCBs consists of five pin anchor recesses on traffic
side (also called front side) and four pin anchor recesses on the back side, as shown in
Figure 11. Pin anchors are of 1-in. diameter by 15-in. long, ASTM A36 steel pins, and are
inserted into 1¼-in. diameter holes in the road surface. During installation, the barrier
segments were connected and then pulled in a direction parallel to longitudinal axis,
removing slack in the joints. Next, 1¼-in. diameter holes were drilled on road surface using
pin anchor recesses as guides. Finally, the steel pins were embedded to a depth of 5 in.
Pin Anchor Rod
Figure 11. Pin Anchors on Barriers

22
3.2 Bolt Anchorage
Each barrier section consists of five bolt anchor recesses (pockets) on the traffic
side and five bolt anchor pockets on the back side, as shown in Figure 12. Bolt anchors are
made of 1-in. diameter ASTM F1554 Grade 36 threaded rods epoxied into 1⅛-in. diameter
holes on road surface. During installation, the barrier segments were connected and then
pulled in a direction parallel to the longitudinal axis, removing slack in the joints. Next,
1⅛-in. diameter holes were drilled on road surface using bolt anchor recesses as guides.
Then, the anchor rods were embedded to a depth of 7 in. The bond strength of the epoxy
used to anchor rods to road surface was 1,461 psi [21]. Bolts were nutted and had washers
beneath the nuts.
Bolt Anchor Rods
Figure 12. Bolt Anchors on Barriers

23
3.3 Box-Beam Rail as Stiffener
Box beam rail stiffeners were mounted on the back face of the system at each joint,
as shown in Figure 13 [24]. Box beam stiffeners are believed to be capable of reducing
lateral deflections and preventing separation of the barriers when deflected and suspended
over the edge of a bridge deck [5]. This is due to the high tensile capacity of the steel,
which allows the barrier and the box beam to act as a composite bending member, with the
concrete in compression on the traffic face of the barrier and the steel in tension. Each box
beam stiffener consisted of a 6-in. × 6-in. × 3/16-in. ASTM A500 Grade C box beam. The
box beam rails were mounted on barriers with ¾ in. diameter by 17 in. long ASTM A307
Grade A bolts. Box Beam rails mounting details are in test report.
Figure 13. Box Beam Stiffeners

24
3.4 Non-Shrink Grout
Non-shrink grout is a construction material with a high compressive strength
commonly used to fill voids in areas of high concentrated loads. Grout was used to limit
the rotation within the connection between barriers. Grout wedges between barriers allow
the entire barrier system to act as a continuous element, so that the load disperses
throughout all barrier segments rather than being concentrated on those in the impact zone.
Non-shrink grout wedges were placed at the toe between adjacent barriers, as shown in
Figure 14. Non-shrink grout wedges consisted of a grout mix with a minimum 1-day
compressive strength of 1,000 psi.
Grout
Figure 14. Non-Shrink Grout between barriers

25
CHAPTER 4. EVALUATION CRITERIA
The different anchorage and stiffening techniques were evaluated using full-scale
crash testing, specifically using Test Level 3 (TL-3) criteria of the Manual for Assessing
Safety Hardware, Second Edition (MASH 2016) [2]. According to TL-3 of MASH 2016,
longitudinal barrier systems (such as PCBs) must be subjected to two full-scale vehicle
crash tests, as summarized in Table 5.
Table 5. MASH 2016 TL-3 Crash Test Conditions for Longitudinal Barriers
Test
Article
Test Designation
No.
Test
Vehicle
Vehicle
Weight
(lb)
Impact Conditions
Speed
(mph)
Angle
(degrees)
Longitudinal
Barrier
3-10 1100C 2,425 62 25
3-11 2270P 5,000 62 25
Of the two tests, only test no. 3-11 (hereafter referred as 3-11) fell within the scope
of the research, as the low mass of the 1100C small car test vehicle used in test no. 3-10
makes it unlikely to cause large barrier deflections or damage. Reports FHWA-RD-77-4
and FHWA/RD-86/153 catalogue the successful testing of the small car according to test
3-10 under NCHRP 350 [16-17], and report TRP-03-177-06 demonstrated that the small
car could pass MASH 2009 [18]. The successful tests demonstrate that the car is unlikely
to cause significant damage to the barrier as outlined in the objective. Further, research has
shown that New Jersey shape PCBs experience only slight barrier deflections when
impacted by small cars [19]. Finally, MASH safety performance criteria for small cars were
not changed in the revisions between 2009 and 2016, which reduces the need for further
evaluation under test 3-10.
26
The combination of the successful tests and the low deflections means that the
1100C test vehicle may be reasonably excluded from investigation. In contrast, a 2270P
vehicle has the highest center of gravity (c.g.) and the highest mass of the TL-3 vehicles.
As a high c.g. makes a vehicle more prone to high roll and pitch movement in this type of
impact, the 2270P vehicle is thus at the greatest risk of vehicle instability within the TL-3
group. Similarly, its high mass relative to the other test vehicles produces greater forces
during impact and increases the likelihood of large deflections and severe damage to the
barrier. Thus, the pickup truck test 3-11, was deemed to be the most critical to evaluate
performance of the different PCB anchorage configurations.
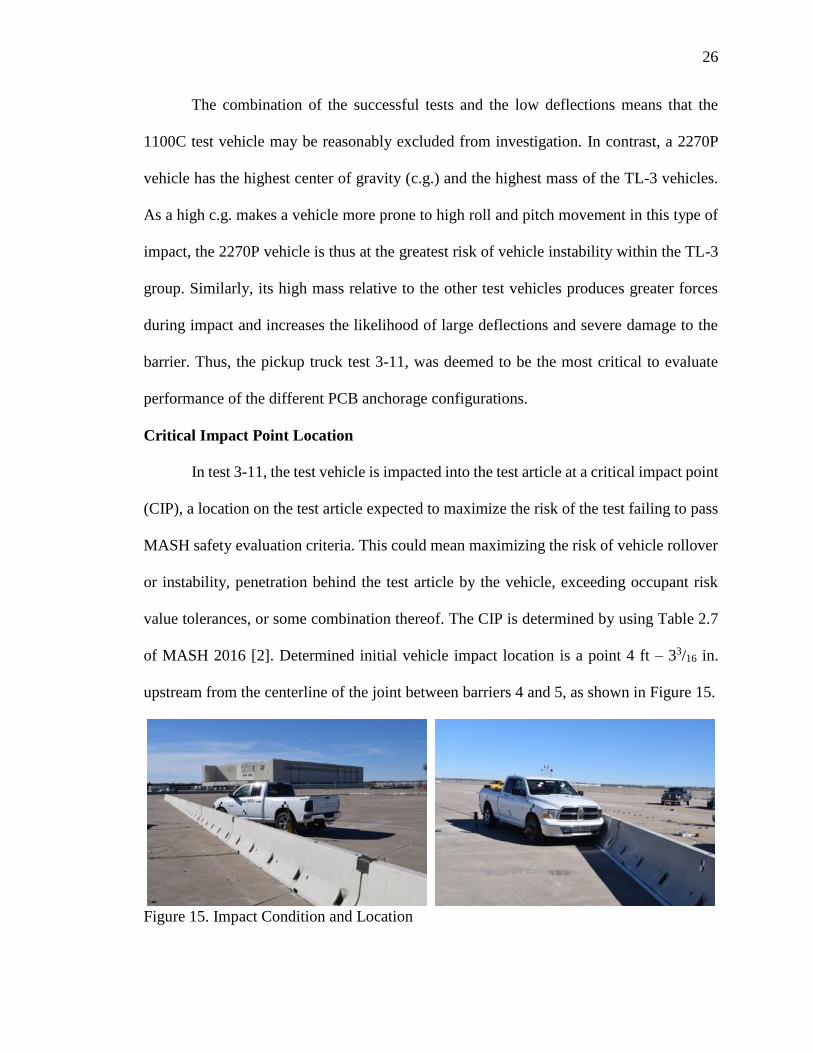
Critical Impact Point Location
In test 3-11, the test vehicle is impacted into the test article at a critical impact point
(CIP), a location on the test article expected to maximize the risk of the test failing to pass
MASH safety evaluation criteria. This could mean maximizing the risk of vehicle rollover
or instability, penetration behind the test article by the vehicle, exceeding occupant risk
value tolerances, or some combination thereof. The CIP is determined by using Table 2.7
of MASH 2016 [2]. Determined initial vehicle impact location is a point 4 ft – 33/16 in.
upstream from the centerline of the joint between barriers 4 and 5, as shown in Figure 15.
Figure 15. Impact Condition and Location

27
Under MASH 2016, tests were required to meet a minimum impact severity, and
required not to exceed Occupant Risk values and Euler Angular movements. Impact
severity is the amount of kinetic energy acting perpendicular to the longitudinal axis of
barrier systems as found in equation 4.1.
𝐼. 𝑆. =1
2𝑀 ∗ (𝑉 ∗ sin[θ])2 (4.1)
Where
𝐼. 𝑆. = Impact Severity, kip − ft 𝑀 = Vehicle mass, kips
𝑉 = Vehicle impact velocity, ft/s) θ = Angle of impact, radians
Occupant Risk values are in terms of longitudinal and lateral Occupant Impact
Velocities (OIVs) and Occupant Ridedown Accelerations (ORAs), which are velocities
and accelerations experienced by occupants in the occupant compartment during impact.
Euler Angular movements are Roll, Pitch and Yaw experienced by the vehicle during the
impact.

28
CHAPTER 5. NEW JERSEY PCB TESTS
5.1 Test No. NJPCB-1
Test no. NJPCB-1 (herein after referred to as NJPCB-1) was conducted with
barriers 1, 3, 5, 7, 9, and 10 pinned to concrete tarmac with non-shrink grout wedges, a
class C joint. Summary of the Results are provided in Figure 16, details of NJPCB-1 are in
test report [20]. NJPCB-1 was determined to be successful according to MASH
requirements.
Vehicle Kinematics
t = 0 msec t = 104 msec t = 210 msec t = 1688 msec
Schematic View
Impact Conditions and Results
Test Number ..................................................... NJPCB-1
Test Article ............................................New Jersey PCB
Total Length ........................................................... 200 ft
Key Component – Anchor Pins
Pin Size ............................. 1-in. diameter unthreaded rod
Pin Length .............................................................. 15 in.
Embedment Depth .................................................... 5 in.
Pinned Barriers .................................. 1, 3, 5, 7, 9, and 10
Vehicle Model ........ 2010 Dodge Ram 1500 pickup truck
Test Inertial......................................................... 5,013 lb
Impact Conditions
Speed ................................................................ 62.6 mph
Angle ........................................................... 24.7 degrees
Impact Location ........... 491/16 in. upstream from joint 4-5
Exit Conditions
Speed ................................................................ 50.7 mph
Angle ............................................................. 9.2 degrees
Vehicle Stability ........................................... Satisfactory
Test Article Damage ......................................... Moderate
Vehicle Damage ................................................ Moderate
Maximum Test Article Deflections
Permanent Set ........................................................ 6¼ in.
Dynamic ............................................................... 13.5 in.
Occupant Risk Values
Occupant Risk Value MASH
Limit
OIV
(ft/s)
Longitudinal -14.27 ± 40
Lateral 19.33 ± 40
ORA
(g’s)
Longitudinal -9.97 ± 20.49
Lateral 7.17 ± 20.49
Maximum
Angular
Displacement
(degrees)
Roll -39.9 ± 75
Pitch -12.8 ± 75
Figure 16. Results Summary of full-scale crash test – NJPCB-1

29
5.1.1 Test Description and Vehicle Behavior
A 5,013-lb pickup truck impacted the system at a speed of 62.6 mph and at an angle
of 24.7 degrees, resulting in an impact severity of 114.9 kip-ft. Vehicle experienced roll of
-39.9 degrees and pitch of -12.8 degrees. Longitudinal and Lateral Occupant Ridedown
Acceleration (ORA) were -9.97 g’s and 7.17 g’s respectively, and Longitudinal and Lateral
Occupant Impact Velocity (OIV) were -14.27 ft/s and 19.33 ft/s respectively. All occupant
risk values were found to be within limits, and the occupant compartment deformations
were also deemed acceptable as per MASH recommended values. Sequential views of the
vehicle kinematics during the test from a downstream perspective are shown in Figure 17.
t = 0 msec t = 116 msec t = 752 msec t = 996 msec
Figure 17. Sequential View of Vehicle Behavior – NJPCB-1
5.1.2 Barrier Deflections
The barrier system experienced a maximum lateral dynamic deflection of 13.5 in.
and a permanent set deflection of 6¼ in., as shown in Figure 18.
Figure 18. Barrier Deflection (Impact location, during impact, and Post Impact)

30
5.1.3 Barrier Damage
Scuff marks, cracks, and spalling near the barrier toe occurred on barriers 3, 4, 5
and 6. Barriers 3 and 6 had minor cracks and spalling, which would make them reusable
with minor repairs. Severe damage occurred to barriers 4 and 5 rendering them non-
reusable (see Figure 19). Barrier 4 had major spalling on ends at the barrier toe and below
connection key, damage near connection key meant the steel reinforcement is no longer
intact, and was deemed non-reusable. Barrier 5 experienced a fracture extending through
its entire height and exposing its steel reinforcement near the top.
Figure 19. Barrier Damage – Barrier 4 (Top) and Barrier 5 (Bottom)
5.1.4 Vehicle Damage
Majority of the vehicle damage was concentrated on the impact left-front corner
and left side. Denting, scraping, and gouging were observed on the entire left side of the
vehicle. The windshield had cracks, and left-front window was shattered due to deployment
of airbags and occupant head impacting the window. The occupant compartment
experienced minor deformations, all within MASH allowable limits.
Fracture
Spalling

31
5.2 Test No. NJPCB-2
NJPCB-2 was conducted with Barriers 1 through 10 bolted to concrete tarmac, and
non-shrink grout wedges between barriers, a class D joint. Summary of the results are
provided in Figure 20, details of NJPCB-2 are in test report [21]. NJPCB-2 was determined
to be successful according to MASH requirements.
Vehicle Kinematics
t = 0 msec t = 74 msec t = 570 msec t = 1468 msec
Schematic View
Impact Conditions and Results
Test Number ...................................................... NJPCB-2
Test Article ............................................. New Jersey PCB
Total Length ............................................................ 200 ft
Key Component – Bolt Anchors
Bolt Size ................................. 1-in. diameter threaded rod
Bolt Length ............................................................... 14 in.
Embedment Depth ...................................................... 7 in.
Bolted Barriers ............................................. 1 through 10
Epoxy Minimum Bond Strength ..................1,461 psi [21]
Vehicle Model ............... 2011 Dodge Ram 1500 Quadcab
Test Inertial........................................................... 4,992 lb
Impact Conditions
Speed .................................................................. 62.6 mph
Angle ............................................................. 24.5 degrees
Impact Location ........... 4513/16 in. upstream from joint 4-5
Exit Conditions
Speed .................................................................. 51.3 mph
Angle ............................................................... 9.9 degrees
Vehicle Stability ............................................. Satisfactory
Test Article Damage ........................................ Moderate
Vehicle Damage .............................................. Moderate
Maximum Test Article Deflections
Permanent Set ....................................................... - ½ in.
Dynamic ............................................................... 4.9 in.
Occupant Risk Values
Occupant Risk Value MASH
Limit
OIV
(ft/s)
Longitudinal -16.66 ± 40
Lateral 24.06 ± 40
ORA
(g’s)
Longitudinal -10.05 ± 20.49
Lateral 9.99 ± 20.49
Maximum
Angular
Displacement
(degrees)
Roll 20.7 ± 75
Pitch -12.0 ± 75
Figure 20. Results Summary of full-scale crash test – NJPCB-2

32
5.2.1 Test Description and Vehicle Behavior
A 4,992-lb pickup truck impacted the system at a speed of 62.6 mph and at an angle
of 24.5 degrees, resulting in an impact severity of 112.6 kip-ft. Vehicle experienced roll of
20.7 degrees and pitch of -12.0 degrees. Longitudinal and Lateral Occupant Ridedown
Acceleration (ORA) were -10.05 g’s and 9.99 g’s respectively, and Longitudinal and
Lateral Occupant Impact Velocity (OIV) were -16.66 ft/s and 24.06 ft/s respectively. Upon
investigation of the results, all occupant risk values were found to be within limits, and the
occupant compartment deformations were also deemed acceptable as per MASH
recommended values. Sequential views of the vehicle kinematics during the test from a
downstream perspective are shown in Figure 21.
t = 0 msec t = 52 msec t = 734 msec t = 1468 msec
Figure 21. Sequential View of Vehicle Behavior – NJPCB-2
5.2.2 Barrier Deflections
The barrier system experienced a maximum lateral dynamic deflection of 5 in. and
a permanent set deflection of -½ in., as shown in Figure 22.
Figure 22. Barrier Deflection (Impact location, during impact, and Post Impact)

33
5.2.3 Barrier Damage
Scuff marks, cracks, and spalling near the barrier toe occurred on barriers 3, 4, 5
and 6. Barriers 3 and 6 had minor cracks and spalling, which would make them reusable
with minor repairs. Severe damage occurred to barriers 4 and 5 rendering them as non-
reusable (see Figure 23). Barriers 4 and 5 experienced fracture extending through their
entire height and toward joint connection between them, which exposed steel
reinforcement near the top on both barriers.
Figure 23. Barrier Damage – Barrier 4 (Top) and Barrier 5 (Bottom)
5.2.4 Vehicle Damage
Majority of the vehicle damage was concentrated on the impact left-front corner
and left side. Denting, scraping, and gouging were observed on the entire left side of the
vehicle. The windshield had cracks. The occupant compartment experienced minor
deformations, all within MASH allowable limits.
Fracture
Fracture

34
5.3 Test No. NJPCB-3
NJPCB-3 was conducted with Barriers 1 and 10 pin anchored to concrete tarmac, a
class A joint. Summary of the results are provided in Figure 24, details of NJPCB-3 are in
test report [22]. NJPCB-3 was determined to be successful according to MASH
requirements.
Vehicle Kinematics
t = 0 msec t = 62 msec t = 232 msec t = 796 msec
Schematic View
Impact Conditions and Results
Test Number ..................................................... NJPCB-3
Test Article ............................................New Jersey PCB
Total Length ........................................................... 200 ft
Key Component – Anchor Pins
Pin Size ............................. 1-in. diameter unthreaded rod
Pin Length .............................................................. 15 in.
Embedment Depth .................................................... 5 in.
Pinned Barriers ................................................... 1 and 10
Vehicle Model ........ 2010 Dodge Ram 1500 pickup truck
Test Inertial......................................................... 4,999 lb
Impact Conditions
Speed ................................................................ 62.3 mph
Angle ........................................................... 25.8 degrees
Impact Location ........... 463/16 in. upstream from joint 4-5
Exit Conditions
Speed ................................................................ 51.7 mph
Angle ........................................................... 11.9 degrees
Vehicle Stability ........................................... Satisfactory
Test Article Damage ......................................... Moderate
Vehicle Damage ................................................ Moderate
Maximum Test Article Deflections
Permanent Set ...................................................... 36⅝ in.
Dynamic ............................................................... 38.1 in.
Occupant Risk Values
Occupant Risk Value MASH
Limit
OIV
(ft/s)
Longitudinal -13.52 ± 40
Lateral 18.01 ± 40
ORA
(g’s)
Longitudinal -5.23 ± 20.49
Lateral 9.61 ± 20.49
Maximum
Angular
Displacement
(degrees)
Roll -17.2 ± 75
Pitch -9.0 ± 75
Figure 24. Results Summary of full-scale crash test – NJPCB-3

35
5.3.1 Test Description and Vehicle Behavior
A 4,999-lb pickup truck impacted the system at a speed of 62.3 mph and at an angle
of 25.8 degrees, resulting in an impact severity of 121.9 kip-ft. Vehicle experienced roll of
-17.2 degrees and pitch of -9.0 degrees. Longitudinal and Lateral Occupant Ridedown
Acceleration (ORA) were -5.23 g’s and 9.61 g’s respectively, and Longitudinal and Lateral
Occupant Impact Velocity (OIV) were -13.52 ft/s and 18.01 ft/s respectively. Upon
investigation of the results, all occupant risk values were found to be within limits, and the
occupant compartment deformations were also deemed acceptable as per MASH
recommended values. Sequential views of the vehicle kinematics during the test from a
downstream perspective are shown in Figure 25.
t = 0 msec t = 122 msec t = 602 msec t = 1232 msec
Figure 25. Sequential View of Vehicle Behavior – NJPCB-3
5.3.2 Barrier Deflections
The barrier system experienced a maximum lateral dynamic deflection of 38.1 in.
and a permanent set deflection of 36⅝ in., as shown in Figure 26.
Figure 26. Barrier Deflection (Impact location, during impact, and Post Impact)

36
5.3.3 Barrier Damage
Scuff marks, cracks, and spalling near the barrier toe occurred on barriers 3, 4, 5,
6, 7 and 8. Barriers 3, 7, and 8 had minor cracks and spalling, which would make them
reusable with minor repairs. Severe damage occurred to barriers 4 and 5 rendering them as
non-reusable (see Figure 27). Barriers 4 and 5 experienced vertical cracks that extended on
front, top and back faces, major spalling near pin and bolt anchor recesses and below
connection key, which makes them ineffective to reuse. Barrier 6 experienced vertical
cracking and spalling near the connection key, which meant the steel reinforcement was no
longer intact, and the barrier was deemed non-reusable.
Figure 27. Barrier Damage – Barrier no. 4 (Top) and Barrier no. 5 (Bottom)
5.3.4 Vehicle Damage
The majority of the damage was concentrated on the left-front corner and left side
of the vehicle where the impact occurred. Denting, scraping, and gouging were observed
on the entire left side of the vehicle. The windshield had cracks. Occupant compartment
experienced minor deformations, all within MASH allowable limits.
Spalling
Vertical Cracks

37
5.4 Test No. NJPCB-4
NJPCB-4 was conducted with Barriers 1 and 10 pin anchored to concrete tarmac,
and with non-shrink grout wedges, a class B joint. Summary of the results are provided in
Figure 28, details of NJPCB-4 are in test report [23]. NJPCB-4 was determined to be
successful according to MASH requirements.
Vehicle Kinematics
t = 0 msec t = 40 msec t = 226 msec t = 634 msec
Schematic View
Impact Conditions and Results
Test Number ..................................................... NJPCB-4
Test Article ............................................New Jersey PCB
Total Length ........................................................... 200 ft
Key Component – Anchor Pins
Pin Size ............................. 1-in. diameter unthreaded rod
Pin Length .............................................................. 15 in.
Embedment Depth .................................................... 5 in.
Pinned Barriers ................................................... 1 and 10
Vehicle Model ........ 2011 Dodge Ram 1500 pickup truck
Test Inertial......................................................... 5,000 lb
Impact Conditions
Speed ................................................................ 62.8 mph
Angle ........................................................... 24.5 degrees
Impact Location ............. 45½ in. upstream from joint 4-5
Exit Conditions
Speed ................................................................ 54.2 mph
Angle ............................................................. 8.4 degrees
Vehicle Stability ........................................... Satisfactory
Test Article Damage ......................................... Moderate
Vehicle Damage ................................................ Moderate
Maximum Test Article Deflections
Permanent Set ......................................................... 38 in.
Dynamic ............................................................... 40.7 in.
Occupant Risk Values
Occupant Risk Value MASH
Limit
OIV
(ft/s)
Longitudinal -12.1 ± 40
Lateral 18.7 ± 40
ORA
(g’s)
Longitudinal -4.0 ± 20.49
Lateral 12.1 ± 20.49
Maximum
Angular
Displacement
(degrees)
Roll -16.2 ± 75
Pitch -14.2 ± 75
Figure 28. Results Summary of full-scale crash test – NJPCB-4

38
5.4.1 Test Description and Vehicle Behavior
A 5,000-lb pickup truck impacted the system at a speed of 62.8 mph and at an angle
of 24.5 degrees, resulting in an impact severity of 114.1 kip-ft. Vehicle experienced roll of
-16.2 degrees and pitch of -14.2 degrees. Longitudinal and Lateral Occupant Ridedown
Acceleration (ORA) were -4.0 g’s and 12.1 g’s respectively, and Longitudinal and Lateral
Occupant Impact Velocity (OIV) were -12.1 ft/s and 18.7 ft/s respectively. Upon
investigation of the results, all occupant risk values were found to be within limits, and the
occupant compartment deformations were also deemed acceptable as per MASH
recommended values. Sequential views of the vehicle kinematics during the test from a
downstream perspective are shown in Figure 29.
t = 0 msec t = 84 msec t = 648 msec t = 2636 msec
Figure 29. Sequential View of Vehicle Behavior – NJPCB-4
5.4.2 Barrier Deflections
The barrier system experienced a maximum lateral dynamic deflection of 40.7 in.
and a permanent set deflection of 38 in., as shown in Figure 30.
Figure 30. Barrier Deflection (Impact location, during impact, and Post Impact)

39
5.4.3 Barrier Damage
Cracks, and spalling occurred on barriers 2, 3, 4, 5, 6, 7 and 8. Barriers 2, 3, 7, and
8 had minor cracks and spalling, which would make them reusable with minor repairs.
Severe damage occurred to barriers 4 and 5 rendering them as non-reusable (see Figure
31). Barriers 4 and 5 experienced vertical cracks that extended on front, top and back faces,
major spalling near pin and bolt anchor recesses and below connection key, which makes
them ineffective to reuse. Barrier 6 had vertical cracks and spalling near connection key,
which meant the steel reinforcement was no longer intact, and the barrier was deemed non-
reusable.
Figure 31. Barrier Damage – Barrier no. 4 (Top) and Barrier no. 5 (Bottom)
5.4.4 Vehicle Damage
The majority of the damage was concentrated on the left-front corner and left side
of the vehicle where the impact occurred. Denting, scraping, and gouging were observed
on the entire left side of the vehicle. The windshield had cracks. Occupant compartment
experienced minor deformations, all within MASH allowable limits.
Spalling
Vertical Cracks

40
5.5 Test No. NJPCB-5
NJPCB-5 was conducted with Barriers 1 and 10 pin anchored to concrete tarmac,
and box beam rails mounted on back side of barriers at each joint, a class B joint (modified
Joint Class B). Summary of the results are provided in Figure 32, details of NJPCB-5 are
in test report [24]. NJPCB-5 was determined to be successful according to MASH
requirements.
Vehicle Kinematics
t = 0 msec t = 56 msec t = 218 msec t = 642 msec
Schematic View
Impact Conditions and Results
Test Number ........................................................ NJPCB-5
Test Article .............................................. New Jersey PCB
Total Length .............................................................. 200 ft
Key Component – Anchor Pins and Box Beam Rails
Pin Size ................................ 1-in. diameter unthreaded rod
Pin Length ................................................................. 15 in.
Embedment Depth ....................................................... 5 in.
Pinned Barriers ..................................................... 1 and 10
Box Beam Rail Size ............................6 in. × 6 in. × 3/16 in.
Box Beam Rail Length ................................................ 12 ft
Vehicle Model .......... 2009 Dodge Ram 1500 pickup truck
Test Inertial............................................................ 5,001 lb
Impact Conditions
Speed ................................................................... 62.7 mph
Angle .............................................................. 24.9 degrees
Impact Location ................49⅜ in. upstream from joint 4-5
Exit Conditions
Speed ................................................................... 47.7 mph
Angle ................................................................ 4.9 degrees
Vehicle Stability .............................................. Satisfactory
Test Article Damage ...........................................Moderate
Vehicle Damage ..................................................Moderate
Maximum Test Article Deflections
Permanent Set ........................................................ 32½ in.
Dynamic ................................................................. 33.0 in.
Occupant Risk Values
Occupant Risk Value MASH
Limit
OIV
(ft/s)
Longitudinal -13.6 ± 40
Lateral 21.6 ± 40
ORA
(g’s)
Longitudinal -7.65 ± 20.49
Lateral 9.62 ± 20.49
Maximum
Angular
Displacement
(degrees)
Roll -7.9 ± 75
Pitch -12.5 ± 75
Figure 32. Results Summary of full-scale crash test – NJPCB-5

41
5.5.1 Test Description and Vehicle Behavior
A 5,001-lb pickup truck impacted the system at a speed of 62.7 mph and at an angle
of 24.9 degrees, resulting in an impact severity of 116.3 kip-ft. Vehicle experienced roll of
-7.9 degrees and pitch of -12.5 degrees. Longitudinal and Lateral Occupant Ridedown
Acceleration (ORA) were -7.65 g’s and 9.62 g’s respectively, and Longitudinal and Lateral
Occupant Impact Velocity (OIV) were -13.6 ft/s and 21.6 ft/s respectively. Upon
investigation of the results, all occupant risk values were found to be within limits, and the
occupant compartment deformations were also deemed acceptable as per MASH
recommended values. Sequential views of the vehicle kinematics during the test from a
downstream perspective are shown in Figure 33.
t = 0 msec t = 238 msec t = 642 msec t = 1518 msec
Figure 33. Sequential View of Vehicle Behavior – NJPCB-5
5.5.2 Barrier Deflections
The barrier system experienced a maximum lateral dynamic deflection of 33.0 in.
and a permanent set deflection of 32½ in., as shown in Figure 34.
Figure 34. Barrier Deflection (Impact location, during impact, and Post Impact)

42
5.5.3 Barrier Damage
Scuff marks, cracks, and spalling near the barrier toe occurred on barriers 2, 3, 4,
5, 6, 7 and 8. Barriers 2, 3, 7, and 8 had minor cracks and spalling, which would make them
reusable with minor repairs. Severe damage occurred to barriers 4 and 5 rendering them as
non-reusable (see Figure 35). Barriers 4 and 5 experienced vertical cracks that extended on
front, top and back faces, major spalling near pin and bolt anchor recesses and below
connection key. Barrier 6 had vertical cracks and spalling near connection key, which
meant the steel reinforcement was no longer intact, and the barrier was deemed non-
reusable.
Figure 35. Barrier Damage – Barrier 4 (Top) and Barrier 5 (Bottom)
5.5.4 Vehicle Damage
The majority of the damage was concentrated on the left-front corner and left side
of the vehicle where the impact occurred. Denting, scraping, and gouging were observed
on the entire left side of the vehicle. The windshield had cracks. Occupant compartment
experienced minor deformations, all within MASH allowable limits.
Spalling

43
5.6 Test No. NJPCB-6
NJPCB-6 was conducted with barriers 1 and 10 pinned on traffic side and back
side, and barrier 2 through 9 pinned on back side to concrete tarmac with non-shrink grout
wedges, a class C joint (modified Joint Class C). Summary of the Results are provided in
Figure 36, details of NJPCB-6 are in test report [25]. NJPCB-6 was determined to be
successful according to MASH requirements.
Vehicle Kinematics
t = 0 msec t = 160 msec t = 398 msec t = 752 msec
Schematic View
Impact Conditions and Results
Test Number ..................................................... NJPCB-6
Test Article ............................................New Jersey PCB
Total Length ........................................................... 200 ft
Key Component – Anchor Pins
Pin Size ............................. 1-in. diameter unthreaded rod
Pin Length .............................................................. 15 in.
Embedment Depth .................................................... 5 in.
Pinned Barriers – Traffic and Back Side ............ 1 and 10
Pinned Barriers – Back Side .................................... 2 – 9
Vehicle Model ........ 2009 Dodge Ram 1500 pickup truck
Test Inertial......................................................... 5,000 lb
Impact Conditions
Speed ................................................................ 62.9 mph
Angle ........................................................... 25.1 degrees
Impact Location .......... 4511/16 in. upstream from joint 4-5
Exit Conditions
Speed ................................................................ 52.5 mph
Angle ............................................................. 8.0 degrees
Vehicle Stability ........................................... Satisfactory
Test Article Damage ......................................... Moderate
Vehicle Damage ................................................ Moderate
Maximum Test Article Deflections
Permanent Set ........................................................ 3¾ in.
Dynamic ............................................................... 15.2 in.
Occupant Risk Values
Occupant Risk Value MASH
Limit
OIV
(ft/s)
Longitudinal -17.30 ± 40
Lateral 20.67 ± 40
ORA
(g’s)
Longitudinal -9.73 ± 20.49
Lateral 8.43 ± 20.49
Maximum
Angular
Displacement
(degrees)
Roll 28.9 ± 75
Pitch -12.2 ± 75
Figure 36. Results Summary of full-scale crash test – NJPCB-6

44
5.6.1 Test Description and Vehicle Behavior
A 5,000-lb pickup truck impacted the system at a speed of 62.9 mph and at an angle
of 25.1 degrees, resulting in an impact severity of 119.2 kip-ft. Vehicle experienced roll of
-28.9 degrees and pitch of -12.2 degrees. Longitudinal and Lateral Occupant Ridedown
Acceleration (ORA) were -9.73 g’s and 8.43 g’s respectively, and Longitudinal and Lateral
Occupant Impact Velocity (OIV) were -17.30 ft/s and 20.67 ft/s respectively. Upon
investigation of the results, all occupant risk values were found to be within limits, and the
occupant compartment deformations were also deemed acceptable as per MASH
recommended values. Sequential views of the vehicle kinematics during the test from a
downstream perspective are shown in Figure 37.
t = 0 msec t = 194 msec t = 398 msec t = 720 msec
Figure 37. Sequential View of Vehicle Behavior – NJPCB-6
5.6.2 Barrier Deflections
The barrier system experienced a maximum lateral dynamic deflection of 15.2 in.
and a permanent set deflection of 3¾ in., as shown in Figure 38.
Figure 38. Barrier Deflection (Impact location, during impact, and Post Impact)
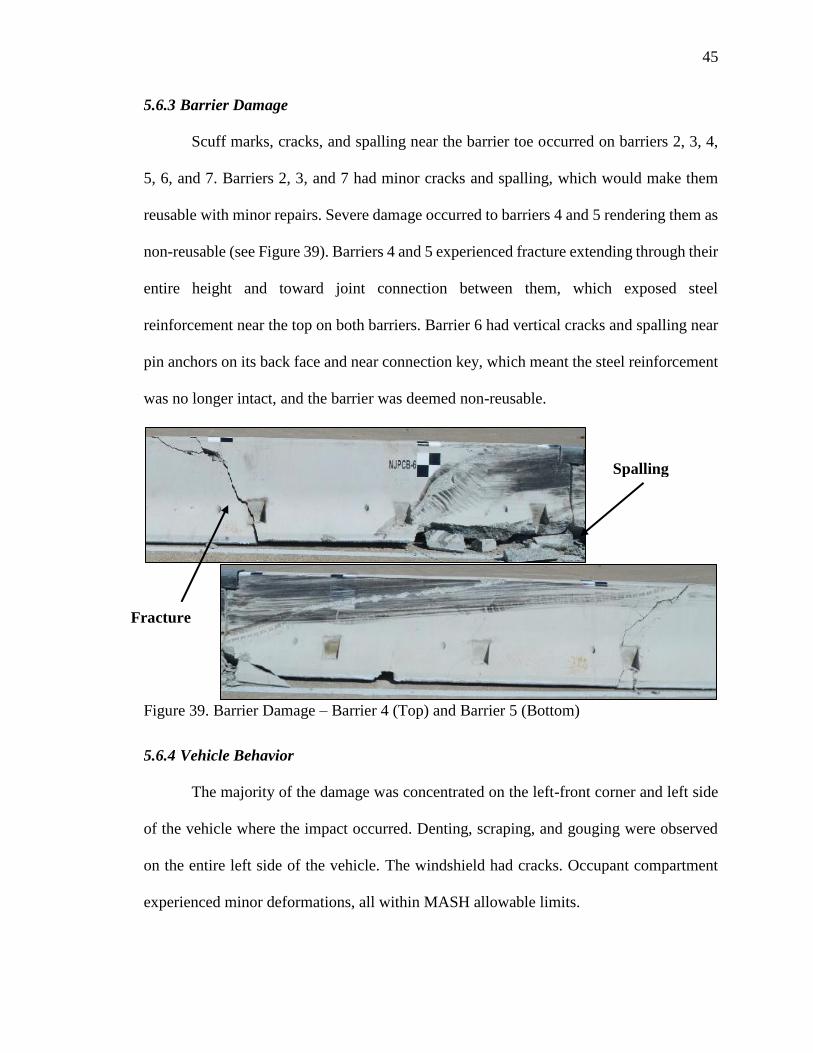
45
5.6.3 Barrier Damage
Scuff marks, cracks, and spalling near the barrier toe occurred on barriers 2, 3, 4,
5, 6, and 7. Barriers 2, 3, and 7 had minor cracks and spalling, which would make them
reusable with minor repairs. Severe damage occurred to barriers 4 and 5 rendering them as
non-reusable (see Figure 39). Barriers 4 and 5 experienced fracture extending through their
entire height and toward joint connection between them, which exposed steel
reinforcement near the top on both barriers. Barrier 6 had vertical cracks and spalling near
pin anchors on its back face and near connection key, which meant the steel reinforcement
was no longer intact, and the barrier was deemed non-reusable.
Figure 39. Barrier Damage – Barrier 4 (Top) and Barrier 5 (Bottom)
5.6.4 Vehicle Behavior
The majority of the damage was concentrated on the left-front corner and left side
of the vehicle where the impact occurred. Denting, scraping, and gouging were observed
on the entire left side of the vehicle. The windshield had cracks. Occupant compartment
experienced minor deformations, all within MASH allowable limits.
Fracture
Spalling

46
5.7 Test No. NJPCB-7
NJPCB-7 was conducted with barriers 1 and 10 pinned on traffic side and back
side, and barrier 2 through 9 pinned on traffic side to concrete tarmac with non-shrink grout
wedges, a class C joint (modified Joint Class C). Summary of the Results are provided in
Figure 40, details of NJPCB-7 are in test report [26]. NJPCB-7 was determined to be
successful according to MASH requirements.
Vehicle Kinematics
t = 0 msec t = 144 msec t = 290 msec t = 722 msec
Schematic View
Impact Conditions and Results
Test Number ..................................................... NJPCB-7
Test Article ............................................New Jersey PCB
Total Length ........................................................... 200 ft
Key Component – Anchor Pins
Pin Size ............................. 1-in. diameter unthreaded rod
Pin Length .............................................................. 15 in.
Embedment Depth .................................................... 5 in.
Pinned Barriers – Traffic and Back Side ............ 1 and 10
Pinned Barriers – Traffic Side ................................. 2 – 9
Vehicle Model ........ 2010 Dodge Ram 1500 pickup truck
Test Inertial......................................................... 5,000 lb
Impact Conditions
Speed ................................................................ 62.8 mph
Angle ........................................................... 25.2 degrees
Impact Location ........... 465/16 in. upstream from joint 4-5
Exit Conditions
Speed ................................................................ 54.8 mph
Angle ............................................................. 7.1 degrees
Vehicle Stability ........................................... Satisfactory
Test Article Damage ......................................... Moderate
Vehicle Damage ................................................ Moderate
Maximum Test Article Deflections
Permanent Set ........................................................ 6¼ in.
Dynamic ............................................................... 11.4 in.
Occupant Risk Values
Occupant Risk Value MASH
Limit
OIV
(ft/s)
Longitudinal -14.09 ± 40
Lateral 21.56 ± 40
ORA
(g’s)
Longitudinal -3.65 ±
20.49
Lateral 7.98 ±
20.49
Maximum
Angular
Displacement
(degrees)
Roll -29.2 ± 75
Pitch -18.6 ± 75
Figure 40. Results Summary of full-scale crash test – NJPCB-7

47
5.7.1 Test Description and Vehicle Behavior
A 5,000-lb pickup truck impacted the system at a speed of 62.8 mph and at an angle
of 25.2 degrees, resulting in an impact severity of 119.1 kip-ft. Vehicle experienced roll of
-29.19 degrees and pitch of -18.62 degrees. Longitudinal and Lateral Occupant Ridedown
Acceleration (ORA) were -3.65 g’s and 7.98 g’s respectively, and Longitudinal and Lateral
Occupant Impact Velocity (OIV) were -14.09 ft/s and 21.56 ft/s respectively. Upon
investigation of the results, all occupant risk values were found to be within limits, and the
occupant compartment deformations were also deemed acceptable as per MASH
recommended values. Sequential views of the vehicle kinematics during the test from a
downstream perspective are shown in Figure 41.
t = 0 msec t = 140 msec t = 290 msec t = 658 msec
Figure 41. Sequential View of Vehicle Behavior – NJPCB-7
5.7.2 Barrier Deflections
The barrier system experienced a maximum lateral dynamic deflection of 11.4 in.
and a permanent set deflection of 6¼ in., as shown in Figure 42.
Figure 42. Barrier Deflection (Impact location, during impact, and Post Impact)

48
5.7.3 Barrier Damage
Scuff marks, cracks, and spalling near the barrier toe occurred on barriers 3, 4, 5,
and 6. Barrier 3 had minor cracks and spalling, which would make them reusable with
minor repairs. Severe damage occurred to barriers 4 and 5 rendering them as non-reusable
(see Figure 43). Barriers 4 and 5 experienced fracture extending through their entire height
and toward joint connection between them, which exposed steel reinforcement near the top
on both barriers. Barrier 6 had vertical cracks and spalling near pin anchors on its back face
and near connection key, which meant the steel reinforcement was no longer intact, and
the barrier was deemed non-reusable.
Figure 43. Barrier Damage – Barrier 4 (Top) and Barrier 5 (Bottom)
5.7.4 Vehicle Behavior
The majority of the damage was concentrated on the left-front corner and left side
of the vehicle where the impact occurred. Denting, scraping, and gouging were observed
on the entire left side of the vehicle. The windshield had cracks. Occupant compartment
experienced minor deformations, all within MASH allowable limits.
Spalling
Fracture
Fracture

49
CHAPTER 6. DISCUSSION AND ANALYSIS
Anchoring and stiffening techniques for NJDOT PCBs were evaluated for reducing
barrier deflections. Seven full-scale crash test techniques consisted of one joint class A,
two joint class B, three joint class C and one joint class D configurations. In addition, all
safety performance evaluations were performed using the criteria found in MASH. The
systems were constructed with ten 20-ft long, PCB segments utilizing a connection key
between the barrier sections with the first and last sections anchored to the tarmac and
subjected to full-scale crash testing.
NYTCB-2, a free-standing PCB system was considered as a baseline test to
compare results of NJPCB systems. NYTCB-2 utilized New Jersey shaped NYSDOT
PCBs, which are nearly identical to NJPCBs except for additional bolt anchor pockets on
NJPCBs. NYTCB-2 consisted of the same system configuration as of NJPCB-3, except
slack was removed from all joints in NJPCB systems.
Seven full-scale crash tests were performed with approximately the same impact
severity (I.S.), ranging from 112.6 to 121.9 kip-ft considering the combined effect of the
vehicle mass, impact speed, and impact angle. A summary of test results is listed in Tables
6 and 7. Table 6 includes the number of anchor pins or bolts used in a system, dynamic
deflection, permanent set, and impact severity. Table 7 includes maximum vehicle roll and
pitch, maximum longitudinal and lateral OIVs, and maximum longitudinal and lateral
ORAs.
The tested embodiments discussed are separated into three primary groups for
comparison: 1) free-standing barriers without anchorage (NJPCB-3, NJPCB-4 and NJPCB-
5), 2) barriers using pin anchorage (NJPCB-1, NJPCB-6 and NJPCB-7), and 3) barriers
using bolted anchorage (NJPCB-2).

50
Table 6. Full-Scale Crash Tests Results – Barrier Deflections and Impact Severities
Test No. Joint
Class
Anchored
Barriers
No. of
Anchor
Pins/Bolts
Dynamic
Deflection
(in.)
Permanent
Set (in.)
Impact
Severity
(kip-ft)
Baseline
NYTCB-2 A 1 and 10 18 40.3 39½ 119.2
Free-Standing Systems
NJPCB-3 A 1 and 10 18 38.1 36⅝ 121.9
NJPCB-4 B 1 and 10 18 40.7 38 114.1
NJPCB-5 B 1 and 10 18 33.0 32½ 116.3
Pin Anchorage Systems
NJPCB-1 C 1, 3, 5, 7, 9 and 10 54 13.5 6¼ 114.9
NJPCB-6 C 1 and 10 (Both)
50 15.2 3¾ 119.2 2-9 (Back)
NJPCB-7 C 1 and 10 (Both)
58 11.4 6¼ 119.1 2-9 (Front)
Bolt Anchorage System
NJPCB-2 D 1-10 100 4.9 -½
(Forward) 112.6
Table 7. Full-Scale Crash Tests Results – Vehicle Behavior
Test No. Roll
(deg.)
Pitch
(deg.)
OIV (ft/s) ORA (g’s)
Longitudinal Lateral Longitudinal Lateral
Baseline
NYTCB-2 -12.4 -10.6 -15.88 20.74 -5.44 8.09
Free-Standing Systems
NJPCB-3 -17.2 -9.0 -13.52 18.01 -5.23 9.61
NJPCB-4 -16.2 -14.2 -12.1 18.7 -4.0 12.1
NJPCB-5 -7.9 -12.5 -13.6 21.6 -7.65 9.62
Pin Anchorage Systems
NJPCB-1 -39.9 -12.8 -14.27 19.33 -9.97 7.17
NJPCB-6 28.9 -12.2 -17.30 20.67 -9.73 8.43
NJPCB-7 -29.2 -18.6 -14.09 21.56 -3.65 7.98
Bolt Anchorage System
NJPCB-2 20.7 -12.0 -16.66 24.06 -10.05 9.99
51
The PCB system contained and redirected the impact vehicle for all seven tests. In
terms of impacting angle, contact with system, and redirection, general vehicle behavior
was similarly experienced for all seven systems, but occupant risk values and vehicle Euler
Angular movements varied.
6.1 Free-standing Systems
NJPCB-3 and NJPCB-4 had very similar overall results, both of which are similar
to the baseline, NYTCB-2. Although NJPCB-4 had grout between the barriers and its I.S.
was 6.4% less than NJPCB-3, it still had slightly larger deflection than NJPCB-3.
The box beam stiffening for NJPCB-5 significantly reduced barrier deflections
relative to NJPCB-3, NJPCB-4 and the baseline (approximately 17%). The box-beam
stiffeners also stabilized the truck in terms of roll, with approximately a 50% reduction,
and this is without notably affecting the OIVs and ORAs.
6.2 Pin Anchorage Systems
Pin anchoring of barriers in NJPCB-1, NJCPB-6 and NJPCB-7 significantly
reduced the barrier deflections relative to free-standing systems and the baseline, but
vehicle instability was higher. Alternate pin anchoring for NJPCB-1 experienced four times
higher vehicle instability in terms of roll, while pitch, ORAs and OIVs did not differ much.
NJPCB-6 and NJPCB-7 had similar vehicle stability and I.S., but traffic side pin
anchoring in NJPCB-7 experienced lower barrier deflections compared to back side pin
anchoring, approximately 15% reduction. Relatively high vehicle roll was observed in
NJPCB-1 compared to NJPCB-6 and NJPCB-7, which may be due to the majority of
vehicle contact being with barrier 5, which was pin anchored on both sides.

52
6.3 Bolt Anchorage System
The bolt anchoring system in NJPCB-2 deflected the least among all seven tests.
Upon examination of I.S. values and barrier deflections, it was evident that the bolt
anchored system was effective in reducing barrier deflections. Dynamic barrier deflection
for NJPCB-2 was 4.9 in., which included tipping of the barrier along the top surface, as
shown in Figure 44.
Figure 44. Dynamic Deflection and Permanent Set Deflection – NJPCB-2
Bolt anchored system also stabilized the truck in terms of roll, with approximately
a 40% reduction when compared to pin anchorage systems. Pitch, ORAs and OIVs were
comparable to other tests, even though NJPCB-2 had all barriers anchored. This may be
because there were no steel reinforcements for bolt anchor pockets, while pin anchor
recesses have steel reinforcements.

53
CHAPTER 7. CONCLUSION AND FUTURE WORK
Anchoring and stiffening techniques for PCBs were evaluated according to MASH
using full-scale crash tests. Anchoring techniques included use of pins and bolts, and
stiffening techniques included use of box beam rails and non-shrink grout wedges placed
at toes between barriers. These techniques were intended to limit barrier deflections, and
to implement and update NJDOT’s PCB installation guidance.
Seven full-scale crash tests were conducted with 2270P vehicle, and were
determined to be successful per criteria set forth in MASH. These seven full-scale crash
tests were grouped in three categories:
(a) Joint classes A and B consisted of a similar type of anchoring technique, but
featured different stiffening techniques. Among tests with joint classes A and
B, NJPCB-5 used grout and box beam stiffeners, which resulted in the lowest
barrier deflections and low occupant risk values.
(b) Joint class C consisted of alternate barrier anchorage, barrier anchorage on the
back side and barrier anchorage on the traffic side. These anchorages made the
PCB system stiffer when compared to joint classes A and B. The comparison
of dynamic deflections, barrier damages and occupant risk values indicated that
the traffic side pin anchored system was stiffer and resulted in the lowest
dynamic deflection among joint class C.
(c) Joint class D consisted of bolt anchors epoxied to concrete tarmac, with the least
system deflection observed among all joint classes, and occupant risk values
considerably lower when compared to pin anchorage systems. Vehicle stability
was satisfactory, and system damage was limited to barriers 4 and 5.

54
Table 8 contains usage limits according to dynamic deflections observed during the
tests, and the changes are based on allowable movements. It is not specified in the
NJDOT’s Roadway Design Manual whether the data listed in Table 1 were considered as
dynamic deflection or permanent set deflection. Hence, both deflection limits are listed.
Limits used in Table 8 include data from tests mentioned in the literature review.
Table 8. PCB guidance – Change in Allowable Movements
Joint
Class
Allowable Movement
Joint Treatment Dynamic
Deflection
Permanent Set
Deflection
A Up to 41 in. Up to 40 in. Connection Key
B Up to 41 in. Up to 41 in. Connection Key and grout in every joint
C Up to 16 in. Up to 7 in.
Connection Key and grout in every joint.
Alternate anchored units, all units anchored
on traffic side, or all units anchored on back
side
D Up to 5 in. No allowable
movement
Connection Key and grout in every joint
and bolt every anchor pocket hole in every
unit.
Instead of changing allowable movements in PCB usage guidance, changes can be
made in specification of Joint Classes. Joint Treatments are organized into the classes based
on the dynamic deflections found during testing. Types of Joint Treatments that fall under
different Joint Classes are listed in Table 9. The updated PCB guidance is based on seven
full-scale crash tests on NJDOT New Jersey shape PCBs. All tested systems had ten 20-ft
long PCBs and used connection keys, and all systems successfully passed MASH Safety
Evaluation Criteria. All four joint classes use connection keys for barrier to barrier
connections, and end barriers anchored to road surface on both sides. Joint classes B and
C include grouted toes. As yet, no joint treatment was able to prevent dynamic deflection
and thus none should be listed under Joint Class D.

55
Table 9. PCB guidance – Change in Joint Treatments with dynamic deflections
Joint
Class Use Test No. Joint Treatment
A
Allowable
movement over 16
to 42 inches
NJPCB-3 Free-standing system with barriers 1 and 10 pin
anchored to concrete tarmac
NJPCB-4 Free-standing system with barriers 1 and 10 pin
anchored to concrete tarmac
NJPCB-5
Box-Beam Stiffened to all nine joints between barrier
segments, and barriers 1 and 10 pin anchored to
concrete tarmac
B
Allowable
movement over 11
to 16 inches
NJPCB-1 Barriers 1, 3, 5, 7, 9, and 10 pin anchored to concrete
tarmac
NJPCB-6 Barriers 1 and 10 pinned on both sides, and barriers 2
through 9 pin anchored on back side to concrete tarmac
NJPCB-7 Barriers 1 and 10 pinned on both sides, and barriers 2
through 9 pin anchored on traffic side to concrete tarmac
C
Maximum allowable
movement of 11
inches
NJPCB-2 All ten barrier segments bolt anchored to concrete
tarmac
D No allowable
movement N/A No test met this criteria
Joint Treatments are organized into the classes based on the permanent set
deflections found during testing. Types of Joint Treatments that fall under different Joint
Classes are listed in Table 10. No observed test were found to have permanent set
deflections within the range from 11 to 16 in., hence no test fall in to Joint Class B. Tests
with pin anchorage techniques had permanent set deflections ranged within 11 in., so pin
anchorage tests are in Joint Class C. Permanent set deflection observed in NJPCB-2 was
considered negligible as the barrier deflected ½ in. forward.

56
Table 10. PCB guidance – Change in Joint Treatments with Permanent set deflections
Joint
Class Use Test No. Joint Treatment
A
Allowable
movement over 16
to 42 inches
NJPCB-3 Free-standing system with barriers 1 and 10 pin
anchored to concrete tarmac
NJPCB-4 Free-standing system with barriers 1 and 10 pin
anchored to concrete tarmac
NJPCB-5
Box-Beam Stiffened to all nine joints between barrier
segments, and barriers 1 and 10 pin anchored to
concrete tarmac
B
Allowable
movement over 11
to 16 inches
N/A No test met this criteria
C
Maximum allowable
movement of 11
inches
NJPCB-1 Barriers 1, 3, 5, 7, 9, and 10 pin anchored to concrete
tarmac
NJPCB-6 Barriers 1 and 10 pinned on both sides, and barriers 2
through 9 pin anchored on back side to concrete tarmac
NJPCB-7 Barriers 1 and 10 pinned on both sides, and barriers 2
through 9 pin anchored on traffic side to concrete tarmac
D No allowable
movement NJPCB-2
All ten barrier segments bolt anchored to concrete
tarmac
Future Work
Further work could improve on the vehicle instabilities caused by the barrier
impacts and evaluate anchorage techniques with other anchor embodiments, surfaces, and
system lengths. A non-exhaustive list of suggestions for future research is included below:
(a) Conduct additional crash tests on hot mix asphalt (HMA) surfaces to evaluate
whether the prior anchorage tests are still acceptable, and characterize the
system behavior on HMA
(b) Conduct crash testing using shorter overall system lengths to evaluate the
minimum effective length of the system with different anchorage and stiffening
techniques
(c) Utilize steel reinforcement in the barrier toe to provide additional fracture
resistance to Class D joint barriers with bolt anchorage

57
(d) Increase barrier strength via including more rebar and higher compressive
strength concrete mix
(e) Conduct a crash test with all barriers pinned for vehicle and system behavior
comparison against bolted barriers

58
CHAPTER 8. REFERENCES
1. New Jersey Department of Transportation (NJDOT), Roadway Design Manual, 2015.
2. Manual for Assessing Safety Hardware, Second Edition, American Association of State
Highway and Transportation Officials (AASHTO), Washington, D.C., 2016.
3. Mak, K.K., Bligh, R.P., Menges, W.L., Schoeneman, S.K., NCHRP Report 350 Test 3-11 of
the New York DOT Portable Concrete Barrier with I-Beam Connection, Research Report
No. 473220-7, Texas Transportation Institute, The Texas A&M University System, College
Station, TX, February 1999.
4. Bligh, R.P., Menges, W.L., Sanders, S.K., NCHRP Report 350 Test 3-11 of the New York
DOT Portable Concrete Barrier with I-Beam Connection (Retest), Research Report No.
473220-14, Texas Transportation Institute, The Texas A&M University System, College
Station, TX, July 2001.
5. Stolle, C.J., Polivka, K.A., Faller, R.K., Sicking, D.L., Bielenberg, R.W., Reid, J.D., Rohde,
J.R., Allison, E.M., and Terpsma, R.J., Evaluation of Box Beam Stiffening of Unanchored
Temporary Concrete Barriers, Transportation Research Report No. TRP-03-202-08,
Midwest Roadside Safety Facility, University of Nebraska-Lincoln, March 14, 2008.
6. Howard, C.N., Stolle, C.J., Lechtenberg, K.A., Faller, R.K., Reid, J.D., and Sicking, D.L.,
Dynamic Evaluation of a Pinned Anchoring System for New York State’s Temporary
Concrete Barriers, Research Report No. TRP-03-216-09, Midwest Roadside Safety Facility,
University of Nebraska-Lincoln, Lincoln, Nebraska, September 8, 2009.
7. Lechtenberg, K.A., Faller, R.K., Reid, J.D., Sicking, D.L., Dynamic Evaluation of a Pinned
Anchoring System for New York State’s Temporary Concrete Barriers – Phase II,
Transportation Research Report No. TRP-03-224-10, Midwest Roadside Safety Facility,
University of Nebraska-Lincoln, January 27, 2010.
8. Ross, H.E., Sicking, D.L., Zimmer, R.A., and Michie, J.D., Recommended Procedures for
the Safety Performance Evaluation of Highway Features, National Cooperative Highway
Research Program (NCHRP) Report 350, Transportation Research Board, Washington,
D.C., 1993.
9. Faller, R.K., Rohde, J.R., Rosson, B.T., Smith, R.P., and Addink, K.H., Development of a
TL-3 F-Shape Temporary Concrete Median Barrier, MwRSF Report No. TRP-03-64-96,
Midwest Roadside Safety Facility, University of Nebraska-Lincoln, December 1996.
10. Eugene Buth. C., Menges, W.L., Schoeneman S.K., NCHRP Report 350 Test 3-11 of the
Modified Virginia DOT Portable Concrete Barrier, Research Report No. 402041-1, Texas
Transportation Institute, The Texas A&M University System, College Station, TX, January
1999.
11. Polivka, K.A., Faller, R.K., Sicking, D.L., Rohde, J.R., Bielenberg, B.W., Reid, J.D., and
Coon, B.A., Performance Evaluation of the Free-Standing Temporary Barrier – Update to

59
NCHRP 350 Test No. 3-11 with 28” C.G. Height (2214TB-2), MwRSF Report No. TRP-03-
174-06, Midwest Roadside Safety Facility, University of Nebraska-Lincoln, October 2006.
12. Bielenberg, B.W., Faller, R.K., Reid, J.D., Holloway, J.C., Rohde, J.R., and Sicking, D.L.,
Development of a Tie-Down System for Temporary Concrete Barriers, MwRSF Report No.
TRP-03-115-02, Midwest Roadside Safety Facility, University of Nebraska-Lincoln, August
2002.
13. Polivka, K.A., Faller, R.K., Rohde, J.R., Holloway, J.C., Bielenberg, B.W., and Sicking,
D.L., Development and Evaluation of a Tie-Down System for the Redesigned F-Shape
Concrete Temporary Barrier, MwRSF Report No. TRP-03-134-03, Midwest Roadside
Safety Facility, University of Nebraska-Lincoln, August 2003.
14. Bielenberg, B.W., Faller, R.K., Rohde, J.R., Reid, J.D., Sicking, D.L., and Holloway, J.C.,
Development of Tie-Down and Transition Systems for Temporary Concrete Barrier on
Asphalt Road Surfaces, MwRSF Report No. TRP-03-180-06, Midwest Roadside Safety
Facility, University of Nebraska-Lincoln, February 2007.
15. Addink, K.H., Pfeifer, B.G., and Rohde, J.R., Development of a Temporary Barrier System
for Off-Road Applications, MwRSF Report No. TRP-03-66-98, Midwest Roadside Safety
Facility, University of Nebraska-Lincoln, March 1998.
16. Bronstad, M.E., Calcote, L.R., and Kimball, C.E., Jr., Concrete Median Barrier
ResearchVol.2 Research Report, Report No. FHWA-RD-77-4, Submitted to the Office of
Research and Development, Federal Highway Administration, Performed by Southwest
Research Institute, San Antonio, TX, March 1976.
17. Buth, C.E., Campise, W.L., Griffin III, L.I., Love, M.L., and Sicking, D.L., Performance
Limits of Longitudinal Barrier Systems-Volume I: Summary Report, FHWA/RD-86/153,
Final Report to the Federal Highway Administration, Office of Safety and Traffic Operations
R&D, Performed by Texas Transportation Institute, Texas A&M University, College
Station, TX, May 1986.
18. Polivka, K.A., Faller, R.K., Sicking, D.L., Rohde, J.R., Bielenberg, B.W., Reid, J.D., and
Coon, B.A. Performance Evaluation of the Permanent New Jersey Safety Shape Barrier –
Update to NCHRP 350 Test No. 3-10 (2214NJ-1), Final Report to the Transportation
Research Board, National Research Council, National Cooperative Highway Research
Program (NCHRP), NCHRP Project No. 22-14(2), Transportation Research Report No.
TRP- 03-177-06, Midwest Roadside Safety Facility, University of Nebraska-Lincoln,
October 13, 2006.
19. Fortuniewicz, J.S., Bryden, J.E., and Phillips, R.G., Crash Tests of Portable Concrete Median
Barrier for Maintenance Zones, Report No. FHWA/NY/RR-82/102, Final Report to the
Office of Research, Development, and Technology, Federal Highway Administration,
Performed by the Engineering Research and Development Bureau, New York State
Department of Transportation, December 1982.

60
20. Bhakta, S.K., Lechtenberg, K.A., Faller, R.K., Reid, J.D., and Bielenberg, R.W.,
Performance Evaluation of New Jersey’s Portable Concrete Barrier in a Pinned
Configuration – Test No. NJPCB-1, Report No. TRP-03-338-17, Midwest Roadside Safety
Facility, University of Nebraska-Lincoln, 2017.
21. Bhakta, S.K., Lechtenberg, K.A., Faller, R.K., Reid, J.D., and Bielenberg, R.W.,
Performance Evaluation of New Jersey’s Portable Concrete Barrier in a Bolted
Configuration – Test No. NJPCB-2, Report No. TRP-03-340-17, Midwest Roadside Safety
Facility, University of Nebraska-Lincoln, 2017.
22. Bhakta, S.K., Lechtenberg, K.A., Faller, R.K., Reid, J.D., and Bielenberg, R.W.,
Performance Evaluation of New Jersey’s Portable Concrete Barrier in a Free-Standing
Configuration – Test No. NJPCB-3, Report No. TRP-03-355-17, Midwest Roadside Safety
Facility, University of Nebraska-Lincoln, 2017.
23. Bhakta, S.K., Lechtenberg, K.A., Faller, R.K., Reid, J.D., and Bielenberg, R.W.,
Performance Evaluation of New Jersey’s Portable Concrete Barrier in a Free-Standing
Configuration with Grout – Test No. NJPCB-4, Report No. TRP-03-371-17, Midwest
Roadside Safety Facility, University of Nebraska-Lincoln, 2017.
24. Bhakta, S.K., Lechtenberg, K.A., Faller, R.K., Reid, J.D., and Bielenberg, R.W.,
Performance Evaluation of New Jersey’s Portable Concrete Barrier in a Box Beam Stiffened
Configuration– Test No. NJPCB-5, Report No. TRP-03-372-17, Midwest Roadside Safety
Facility, University of Nebraska-Lincoln, 2017.
25. Bhakta, S.K., Lechtenberg, K.A., Faller, R.K., Reid, J.D., and Bielenberg, R.W.,
Performance Evaluation of New Jersey’s Portable Concrete Barrier in a Back Side Pinned
Configuration – Test No. NJPCB-6, Report No. TRP-03-373-17, Midwest Roadside Safety
Facility, University of Nebraska-Lincoln, 2017.
26. Bhakta, S.K., Lechtenberg, K.A., Faller, R.K., Reid, J.D., and Bielenberg, R.W.,
Performance Evaluation of New Jersey’s Portable Concrete Barrier in a Traffic Side Pinned
Configuration – Test No. NJPCB-7, Report No. TRP-03-374-17, Midwest Roadside Safety
Facility, University of Nebraska-Lincoln, 2017.