Embed Size (px)
Citation preview

California Public Employees’ Retirement System
2016–17 Approved Annual Budgetand 2017-18 Projection

Contents
A Message from the Chief Financial Officer 1
GFOA Distinguished Award FY 2015-16 2
Introduction & Overview 3
CalPERS Organization 3
Strategic Goals and Strategies 5
Short-Term Organization Factors 8
Budget Overview 10
Financial Structure, Policy and Process 12
CalPERS Organizational Chart 12
Expanded Organizational Chart 13
Fund Description and Structure 14
Department/Fund Relationship 15
Basis of Budgeting and Accounting 17
Financial Policies 18
CalPERS Budget Process 20
Financial Summaries 22
FY 2016-17 Annual Financial Plan 22
Consolidated Financial Schedule 37
Three-Year Consolidated & Fund Financial Schedules 38
Trust Fund Balance 39
Revenues 42
Debt 45
Long-Term Financial Plans 45
Capital Expenditures and Enterprise Projects . . 47
Capital Expenditures 47
Impact of Capital Expenditures in Enterprise Projects Budget 47
. . . . . . . . .
. . . . . . . . . . . . . . .
. .
. . . . . . . . .
. . . .
. . . . . . . . . . .
Department Information 54
Position Summary 54
Performance Measures 60
Department Descriptions, Unit Goals and Objectives 72
Statistical/Supplemental 84
Glossary 86

A Message from the Chief Financial Officer
The Total Budget for the California Public Employees’ Retirement System (CalPERS) for Fiscal Year (FY) 2016-17 represents continued process improvements and reductions in cost With continued fiscal prudence, this is the third budget process to deliver budget requirements lower than the previous year
The CalPERS Total Budget is designed to provide significant information about planning processes, annual performance, forecasting, and financial planning It represents the financial resources needed to help us achieve our strategic priorities and initiatives for the organization and to those who serve California The budget also demonstrates our commitment to reduce and control costs in a collaborative effort that also aligns with our long-term strategies
The FY 2016-17 CalPERS Total Budget is estimated to be $1,788 5 million, a decrease of $19 1 million or 1 1 percent from the FY 2015-16 Approved Budget of $1,807 6 million
The following are the budget highlights:
• Continued optimization of the mylCalPERS system to realize increased operational efficiencies ($23 5 million)
• Redesign of the Actuarial Valuation System (AVS) to provide information that meets actuarial practices and supports new Governmental Accounting Standards Board (GASB) reporting requirements ($4 8 million)
• Continued building of a sound Risk and Compliance Program for CalPERS to enhance internal controls ($1 2 million)
• Ongoing Security Roadmap efforts to protect and secure CalPERS member and employer data ($5 2 million)
• Increased workload in the Customer Services and Support area specific to increased death benefits processing, GASB reporting, and audit responses ($1 5 million)
• Implementation of an in-house Opportunistic Investment Program ($1 3 million)
The focus of the FY 2016-17 CalPERS Total Budget continues to demonstrate the mission of CalPERS, priorities of the enterprise, and priorities of our stakeholders in a transparent manner, while delivering a value-based, managed-risk perspective
Cheryl Eason, MBA, CPA CGA, RPA, DMCChief Financial Officer
1

GFOA Distinguished Award FY 2015-16
The Government Finance Officers Association of the United States and Canada (GFOA) presented a Distinguished Budget Presentation Award to CalPERS for its annual budget for the fiscal year beginning July 1, 2015 To receive this award, a governmental unit must publish a budget document that meets program criteria as a policy document, as an operations guide, as a financial plan, and as a communications device This award is valid for a period of one year
2

Introduction & Overview
CalPERS OrganizationCalPERS is the largest defined benefit fund in the United States and is dedicated to providing world-class retirement and health benefit services to more than 1 8 million retirement system members, 1 4 million health plan members, and 3,007 public school, local agency and state employers
Headquartered in Sacramento, CalPERS also operates eight Regional Offices located in Fresno, Glendale, Orange, Sacramento, San Diego, San Bernardino, San Jose, and Walnut Creek
Led by a 13-member Board of Administration (Board) consisting of member-elected, appointed, and ex officio members, CalPERS membership (as of June 2015) consists of 1,204,621 active and inactive members and 611,078 retirees, beneficiaries, and survivors from state, school, and public agencies
Established by legislation in 1931, the CalPERS System (System) became operational in 1932 for the purpose of providing a secure retirement to state employees In 1939, new legislation allowed public agency and classified school employees to join the System for retirement benefits CalPERS began administering health benefits for state employees in 1962, and five years later, public agencies joined the Health Program on a contract basis The following page depicts the historical CalPERS milestones
As a defined benefit retirement plan, CalPERS provides benefits based on a member’s years of service, age, and highest compensation In addition, benefits are provided for disability and death Today CalPERS offers additional programs, including long-term care insurance, a deferred compensation retirement savings plan, and member education services
Serving those who serve California At CalPERS, we are part of the fabric of California For more than eight decades, we’ve built retirement and health security for people who invest their lifework in the state Their contributions help move all of us forward through services such as education, transportation, safety, and the environment As stewards of the System, we ensure that their benefits and earned retirements are as enduring as the state they maintain
To support our employers, members, and their beneficiaries, we also invest in the health and infrastructure of California building portfolios that bolster local business and funding enterprises that directly influence and stimulate our state economy With an unwavering commitment to retirement security and wellness, we help create equity in the future for generations to come
We are proud to serve those who serve California
CalPERS Investments As the nation’s largest public pension fund with assets totaling approximately $299 4 billion (as of July 2016), CalPERS investments span domestic and international markets
The CalPERS Board has investment authority and sole fiduciary responsibility for the management of CalPERS assets With the Board’s guidance, the CalPERS Investment Committee and Investment Office carry out the daily activities of the investment program
CalPERS has generated sustainable long-term returns by effectively managing investments to achieve the highest possible return at an acceptable level of risk The CalPERS portfolio is diversified into several asset classes, so any weakness in one area is offset by gains in another The Board follows a strategic asset allocation policy that targets the percentage of funds invested in each asset class
3

CalPERS Historical Milestones
1921State government employees discuss
possibility of establishing retirement provisions for State employees 1932
State Employees’ Retirement System (SERS) begins operation on January 1, 19321933
The first service retirements begin on January 1, 1933 1939
Legislation is passed to allow public agencies to participate in SERS
1955SERS takes over administration of
the federal Social Security program for California public employees 1962
SERS offers health insurance to state employees
• 1967
The name of SERS is changed to the Public Employees’ Retirement System (CalPERS)
• CalPERS offers health insurance to public agency employees
198•
7CalPERS implements Electronic Fund Transfer-early direct deposit service
• CalPERS develops automated PC-based programs for employer payroll reporting
1989CalPERS launches self-funded
health plans introducing fee-for-service 1992
California voters approve Proposition 162 and establish the CalPERS Board absolute and exclusive (plenary) authority over the adminis-tration of investment of retirement funds
1996CalPERS investment portfolio reaches the $100 Billion mark 2006
CalPERS crosses several significant milestones: 1) Surpasses $200 Billion mark, 2) Surpasses 1 5 million members, and 3) Surpasses 2,600 contracting public employers
2011CalPERS launches
my|CalPERS System 2013CalPERS implements the Public Employees’ Pension Reform Act (PEPRA)
2014CalPERS investment portfolio reaches
the $300 Billion mark 2015CalPERS adopts a Funding Risk Mitigation Policy that lowers the discount rate incrementally in years with good investment returns to provide better predictability and less volatility in employer contribution rates
4

Strategic Goals and StrategiesCalPERS’ strategic plan contains the strategic goals and strategies of the organization over a five-year period and is used to align the enterprise budget structure with the organization’s priorities, mission, and objectives This is done in an effort to provide responsible and efficient stewardship of the System to deliver promised retirement and health benefits, while promoting wellness and retirement security for members and beneficiaries
Strategic Planning In 2012, the CalPERS Board adopted the CalPERS 2012-17 Strategic Plan that guides the development of our business plan This comprehensive Business Plan supports and helps CalPERS accomplish our strategic goals, which are:
• Improve long-term pension and health benefit sustainability
• Cultivate a high-performing, risk-intelligent, and innovative organization
• Engage in state and national policy development to enhance the long-term sustainability and effectiveness of our programs
Business Planning The business plan initiatives are shaped with the strategic goals as a guide and are intended to sharpen organizational focus and help sustain the pension and health programs, enhance customer service, strengthen our internal organization, and advance policy development It is a systematic method to anticipate and adapt to expected changes
The CalPERS Business Plan sets the operational direction and focus on aligning the organization’s work with the Strategic Plan over a two-year period
Strategic planning is the key to assuring that our organization is prepared for the challenges of tomorrow and an essential first step in the development of a results-based planning process With a focus on the long-term, the strategic goals and objectives set out in the strategic plan provide a sense of direction and continuity with an opportunity to influence the future
The business plan development process is an organizational wide approach to establishing enterprise priorities and initiatives to focus the organization’s efforts The two-year business plan is reviewed and updated annually as part of a “rolling” two-year planning cycle including assessment of various performance measures for success in meeting established goals
The CalPERS 2015-17 Business Plan builds on the progress made over the past three years, since adopt-ing the CalPERS strategic plan in 2012 CalPERS is continuing the two-year planning cycle, which includes an annual refresh process This will align the business planning with the budget process to ensure that the long-term strategic goals of the organization are met
CalPERS core values of Quality, Respect, Accountability, Integrity, Openness, and Balance continue to guide our work Executive leadership has identified specific, achievable objectives that play a fundamental role in accomplishing our goals The comprehensive Business Plan supports and helps us accomplish our strategic goals The following chart details the CalPERS strategic goals, objectives, and initiatives
5

Aligning Strategic, Business and Budget Planning
Strategic Planning» Long-term, 5-year plan (2012–17)
» Foundation for business plan
Business Planning» 2-year plans
» Formulation of initiatives
» Approved by Board
Forecasting/Mid-Year Requests» Monthly management and status reporting
» Quarterly forecasting
» Budget transfers
Budget Planning» Identification of resourcing needs
» Formulation of formal budget requests
6

Strategic Goals and Objectives
Strategic Goal Objectives Initiatives
Goal A: Improve long-term pension and health benefit sustainability
Fund the System through an integrated view of pension assets and liabilities
Actively manage and assess funding risk through an asset liability management framework to guide investment strategy and actuarial policy
Educate employers and other stakeholders to make informed decisions about retirement security and health care
Provide employers and other stakeholders with thorough, risk-based information about the expected course and variability of future pension contribution requirements
Expand member and employer access to information regarding the cost and quality of health care and ways to impact those trends
Provide existing and prospective Long-Term Care Program policy holders with premium and other information to improve decision making
Deliver target risk-adjusted investment returns
Implement programs and initiatives that improve investment performance and ensure effective systems, operations, and controls are in place
Ensure high-quality, accessible, and affordable health benefits
Implement new approaches and expand efforts already proven to reduce health care costs and improve health outcomes, including changing how we contract with health plans
Create a lifestyle of wellness among members and employers
Establish partnerships that focus on increasing public and private sector focus on wellness
Develop and administer an independent wellness platform that ensures the active engagement of employees and employers
Goal B: Cultivate a high-performing, risk-intelligent, and innovative organization
Use a focused approach to generate, test, refine, and implement new ideas
Adopt methodologies that empower staff to quickly test, vet, and refine ideas that improve internal and external performance and services
Deliver superior end-to-end customer service that is adaptive to customer needs
Promote the use of business intelligence throughout the organization to optimize customer service and delivery
Enhance business processes to achieve high-quality, timely, effective, and efficient customer service delivery to our members and employers
Recruit, retain, develop, and empower a broad range of talents against organizational priorities
Develop and implement a comprehensive talent management strategy that includes recruitment, knowledge transfer, succession planning, and a methodology to regularly gauge employee satisfaction
Actively manage business risks with an enterprise-wide view
Develop a robust risk-intelligent culture through enhanced governance, risk assessment and mitigation, and collaboration with stakeholders
Goal C: Engage in state and national policy development to enhance the long-term sustainability and effectiveness of our programs
Clarify and communicate CalPERS perspective on pension, health, and financial markets
Establish principles and beliefs to guide public policy engagement by the System
Provide education and engagement opportunities to shape policy agenda and expand impact
Develop new strategic partnerships with academic institutions, governmental organizations, non-profits, the financial sector, and the California business community
Develop a series of thought leadership initiatives that promote CalPERS priorities and policies
Elevate the profile of CalPERS Board of Administration and Executive Leadership through strategic involvement at industry and stakeholder events
7

Short-Term Organization FactorsThe objective of the budget process is to address the immediate needs of the organization, such as preserving the current level of service to our members while making progress towards the implementation of CalPERS long-term goals
Incorporated into the FY 2016-17 CalPERS Total Budget are the following assumptions and factors that guided the development of the budget to meet the immediate needs of the organization:
• Resources to support proposed FY 2016-17 business plan initiatives are included
• Reductions in temporary staffing requirements are anticipated to reduce costs by $1 5 million
• Targeted vacancy factor of 5 0 percent• Reduction in State of California central administrative
services (pro-rata) costs due to a reduced allocation assessed to the CalPERS organization ($0 4 million)
• The FY 2016-17 approved budget excludes potential increases for State employee salary and benefit adjustments Bargaining unit agreements expire on June 30, 2016, and it is unknown what, if any, salary and benefit adjustments will be forthcoming at this time
Enterprise Priorities and RisksThe FY 2016-17 Total Budget is focused on core business needs critical to CalPERS long-term strategy and furthering our mission of building retirement and health security for those who serve California The initiatives comprised in the budget will be implemented to achieve efficiencies, identify and implement cost-saving measures, manage risks, and deliver quality customer service and strong affordable health care programs to effectively deliver retirement and health security for California public workers
The approved budget provides the annual financial plan for FY 2016-17 and supports Goal B of the CalPERS 2012-17 Strategic Plan, which is to cultivate a high-performing, risk-intelligent, and innovative organization Through the annual budget process, CalPERS staff address efforts to mitigate certain risks throughout the enterprise The end result allows for the enhancement of business processes, ultimately
heightening the quality and efficiency of service to our members, employers, and stakeholders
This document compiles the financial data needed to support CalPERS goals, is aligned with the initiatives outlined in the proposed CalPERS 2016-17 Business Plan, and is based on the departmental review of operations In alignment with the CalPERS strategic goals and business planning, five key areas of focus were identified for the FY 2016-17 budget:
• Innovative approaches to improve benefit services and continued customer focus
• Effective information technology solutions• Cost efficiencies and workload capacity• Effective risk management and compliance• Sound management practices and leadership
development
Budget HighlightsThese five key areas of focus were used to identify the budgetary need for the fiscal year Some of the major highlights of the FY 2016-17 Total Budget include:
• Continued optimization of the mylCalPERS system to realize increased operational efficiencies ($23 5 million)
• Redesign of the Actuarial Valuation System (AVS) to provide information that meets actuarial practices and supports new Governmental Accounting Standards Board (GASB) reporting requirements ($4 8 million)
• Continued building of a sound Risk and Compliance Program to enhance internal controls ($1 2 million)
• Ongoing Security Roadmap efforts to protect and secure CalPERS member and employer data ($5 2 million)
• Increased workload in the Customer Services and Support area specific to increased death benefits processing, GASB reporting, and audit responses ($1 5 million)
• Implementation of an in-house Opportunistic Investment Program ($1 3 million)
8

In the previous FY 2015-16 Budget, key priorities of the organization that were met include:
• my|CalPERS optimization improvements, including simplification measures, workflow redesigns, and comprehensive reconciliations
• Completion of the Medicare-Only Health Contracting Alternatives
• Adoption of an Asset Liability Management - Risk Mitigation Policy
• Adoption of the New Treasury Management Program and approved policy
• Support the growth in the California Employers’ Retiree Benefit Trust Fund (CERBT) and improved service to our employers
• Continued enhancement of the Investment Office business effectiveness, resource allocation, and efficiency including the reduction of Investment External Management Fees
9

Budget OverviewThe CalPERS Total Budget focuses on the organization’s three strategic goals:
• Improve long-term pension and health benefit sustainability
• Cultivate a high-performing, risk-intelligent, and innovative organization
• Engage in state and national policy development to enhance the effectiveness of our programs
Total Budget SummaryThe proposed FY 2016-17 CalPERS Total Budget is $1,788 5 million, which represents an overall decrease of $19 1 million (1 1 percent) from the FY 2015-16 approved budget of $1,807 6 million Specifically, this is an increase of $18 7 million (3 5 percent) in administra-tive and investment operating costs; a decrease of $34 0 million (3 7 percent) in investment external management fees; an increase of $3 9 million (10 3 percent) in enterprise project costs; an increase of $0 9 million (3 1 percent) in headquarters building costs; and a decrease of $8 6 million (3 0 percent) in third-party administrator fees
FY 2016-17 CalPERS Total Budget (in millions)
FY 2015-16 Approved
Budget1FY 2015-16
Forecast
FY 2016-17 Approved
BudgetFY 2017–18 Projection
Budget to Budget
$ Change % Change increase/ increase/
(decrease) (decrease)
Administrative Operating Costs $444.7 $431.1 $455.8 $465.3 $11.1 2.5%
Investment Operating Costs2 83.0 83.0 90.5 90.5 7.6 9.1%
SUBTOTAL 527.7 514.1 546.3 555.8 18.7 3.6%
Investment External Management Fees 930.7 930.7 896.7 896.7 (34.1) (3.7%)
SUBTOTAL: OPERATING COSTS $1,458.4 $1,444.8 $1,443.0 $1,452.5 ($15.4 ) (1.1%)
Enterprise Projects Costs $37.5 $35.6 $41.4 $17.6 $3.9 10.3%
Headquarters Building Costs 30.3 28.4 31.3 31.3 .9 3.1%
Third-Party Administrator Fees 281.4 278.4 272.8 272.9 (8.6) (3.0%)
CalPERS TOTAL BUDGET $1,807.6 $1,787.2 $1,788.5 $1,774.3 ($19.1) (1.1%)
TOTAL POSITIONS 2,765.0 2,872.0 107.0 3.9%
1 FY 2015-16 Mid-Year Budget approved by CalPERS Board of Administration on December 15, 2015 2 Investment operating expenses are not part of CalPERS Administrative Operating Costs and therefore
should not be included in CalPERS pro-rata assessment
10

Key changes in the FY 2016-17 CalPERS Total Budget include an overall net decrease of $19 1 million (decrease of $42 6 million offset by an increase of $23 5 million) from the FY 2015-16 Approved Budget
Cost decreases of $42 6 million are associated with:
Cost decreases (in millions)
Investment external management fees ($34)
Third-party administrator fees (8 6)
Total decreases ($42 .6)
These cost decreases were offset by increases of $23 5 million primarily associated with:
Cost increases (in millions)
Administrative operating costs $11 1
Investment operating costs 7 6
Enterprise project costs 3 9
Headquarters building costs 0 9
Total increases $23 .5
Each budget area will be covered separately and detailed to provide analysis of the historical trending and current proposal of the costs
11

Financial Structure, Policy, and Process
CalPERS Organizational Chart
Benefit General Communications Customer Investment Actuarial Financial Operations & Programs Counsel & Stakeholder Services & Office Office Office Technology Policy & Office Relations Support Planning
INVESTMENTS, FUNDING & FINANCIAL
BENEFITS
Board of Administration
Executive Office
ENTERPRISE SUPPORT
12

Expanded Organizational Chart
Investment Office
— Investment Compliance & Operational Risk
— Investment Servicing Division
— Investment Portfolio Analytics
— Investment Core Services
— Asset Allocation & Risk Management
— Global Equity
— Global Fixed Income
— Global Governance
— Private Equity
— Real Assets
— Manager Evaluation and Engagement
Actuarial Office
— Actuarial Office
Financial Office
— Enterprise Compliance Division
— Enterprise Risk Management Division
— Financial Reporting & Accounting Services Division
— Treasury Management
— Financial Planning, Policy & Budgeting Division
— Strategic Planning and Communications Unit
Operations & Technology
Information Technology Services Branch
— Technology Business Management Division
— Enterprise Solutions Development Division
— Technology Infrastructure Services Division
— Information Security Office Division
— CalPERS Diversity Outreach Program
— Enterprise Strategy & Performance Division
— Human Resources Division
— Operations Support Services Division
INVESTMENTS, FUNDING & FINANCIAL
ENTERPRISE SUPPORT
General Counsel Office
— Investigations Unit
— Legal Office
— Office of Audit Services
Communications & Stakeholder Relations
— Office of Public Affairs
— Stakeholder Relations
Customer Services & Support
— Benefit Services Division
— Customer Service &Outreach Division
— Employer Account Management Division
— Member Account Management Division
— Special Programs & Marketing Division
— Branch Administrative Services Section
Benefit Programs Policy & Planning
— Center for Innovation
— Health Plan Administration Division
— Health Policy Research Division
— Benefit and Policy Administration Support
— Retirement Research & Planning Division
— Legislative Affairs Division
ENTERPRISE SUPPORT BENEFITS
13

Fund Description and StructureCalPERS has five budgetary funds which are approved by the CalPERS Board and funded at the beginning of each new fiscal year
The CalPERS fiscal year is a 12-month period beginning every July 1 and ending June 30 The Board approves fund balances for purposes specific to that fund Any appropriated funds that are not used over the course of the 12-month fiscal year are no longer accessible after fiscal year end The five budgetary funds are independ-ent of each other and appropriations cannot be commingled or transferred among the various budget-ary funds Authority for these budgetary funds are based on internal CalPERS policies or statutorily appropriated by the State of California Government Code
CalPERS Budgetary Funds1 Total Operating Costs Fund - The Total Operating
Costs Fund is statutorily authorized per Article XVI, Section 17 of the California Constitution It allows for the budget to fund all functional cost centers within the CalPERS enterprise
2 Enterprise Projects Fund - The Enterprise Projects Fund is statutorily authorized per Article XVI, Section 17 of the California Constitution It allows for the budget to fund special projects that are temporary in nature
3 Headquarters Building Costs Fund - The CalPERS Headquarters Building Costs Fund is statutorily appropriated in California State law per Government Code §20199 It provides for the purchase and maintenance of facilities that CalPERS owns and manages
4 Investment External Management Fees Fund - The CalPERS Investment External Management Fees Fund is statutorily appropriated in California State law per Government Code §20172, 20208, and 20210 The Investment External Management Fees Fund provides for expenditures related to external investment advisors and other investment related expenses
5 Third-Party Administrator Fees Fund - The Third-Party Administrator Fees Fund is statutorily authorized per Article XVI, Section 17 of the California Constitution This budget tracks expenses for programs that provide benefits to members of CalPERS including: CalPERS Self-Funded Health Program, Long-Term Care Program, and Supplemental Income Plan
14

Department/Fund Relationship
Budget Fund StructureThe diagram below provides a breakdown of CalPERS departments within each of the budget fund structures
CalPERS Budgetary Funds
Total Operating Costs Fund
— Actuarial Office
— Benefit Programs Policy & Planning
— Communications and Stakeholder Relations
— Customer Services & Support
— Executive Office
— Financial Office
— General Councel Office
— Investment Office
— Operations & Technology
Enterprise Projects Fund
— Information Technology System Development
— Infrastructure
— Process Improvements
Headquarters Building Costs Fund
— Facilities Support Budget
— Lincoln Plaza Building Account
— 1800 3rd Street
— 1800 7th Street
Investment External Management Fees Fund
— External Management Base Fees
— External Management Performance Fees
Third-Party Administrator Fees Fund
— Self/Flex-Funded Health Program
» Anthem Blue Cross
» Blue Shield
» Health Net
» Sharp Health Plan
» United Health Care
— Pharmacy Benefit Manager
» CVS Caremark
— Long-Term Care Program
» Long Term CareGroup, Inc.
— Supplemental Income Plan
» Voya
15

Total Operating Costs FundThe Total Operating Costs Fund is the primary operating fund for departments within the enterprise and is used to account for financial transactions and resources of the organization Costs are covered by revenues derived from the trust funds per Board approval of the annual budget The operations and expense centers included in the Total Operating Costs Fund include:
• Actuarial Office • Benefit Programs, Policy and Planning • Communications & Stakeholder Relations• Customer Services & Support • Executive Office • Financial Office • General Counsel Office • Investment Office • Operations & Technology
Expense types for these areas include:
• Personnel services, which is broken out into base salaries and wages, benefits, temporary help, overtime, and incentive compensation
• Operating expenses include office supplies, subscrip-tions, software, printing, postage, travel, training, consulting and professional services, audit services, communications, data processing, equipment, and other general operating expenses
• Investment operating costs primarily include technology expenses for data, analytics, trading or portfolio management systems, and business operations tools; investment consultant and system consulting fees; portfolio management services and subscriptions; and legal, appraisal, and tax advisory services
Enterprise Projects Fund The Enterprise Projects Fund accounts for special projects (predominately technology related) and one time operations deemed temporary in nature The projects may be completed in one budget cycle, or may need to be funded over multiple budget cycles Expenses are primarily related to temporary staff, training, consulting and professional services, hardware, and software Costs are covered by revenues derived from the trust funds per Board approval of the annual budget At the conclusion of a special project, the ongoing maintenance and operational costs, if any, are transitioned over to the Total Operating Costs Fund
Headquarters Building Costs Fund The Headquarters Building Costs Fund provides for the purchase and maintenance of facilities that CalPERS owns and manages, and accounts for costs relating to maintaining CalPERS main campus, an emergency operations center, and two outlying properties at 1800 3rd Street and 1800 7th Street, Sacramento, California
Costs consist of operating expenses related to:
• Building support for expenditures on items such as insurance, maintenance, and improvements
• The Lincoln Plaza Building costs maintain the buildings that house CalPERS staff and provide support services such as utilities, security, landscaping, janitorial, maintenance, and engineering
• The 1800 3rd Street costs maintain the properties and parking garage, which are available for tenant occupancy
• The 1800 7th Street costs maintain the properties which are available for tenant occupancy
Headquarters building costs are partially funded by outside rental income, and the remaining costs are covered by revenues derived from the trust funds per Board approval of the annual budget
16

Investment External Management Fees Fund The Investment External Management Fees Fund accounts for costs related to external management of CalPERS investment portfolios including base fees and performance fees Costs are covered by revenues derived from the trust fund appropriations set by the Board in the formal budget process
Third-Party Administrator Fees Fund The Third-Party Administrator Fees Fund accounts for fees paid to third-party administrators that manage programs that provide health care and benefits to the members of CalPERS including the self-funded health care programs, pharmacy benefit management, the Long-Term Care Program, and supplemental income plans for three defined contribution programs By contracting with health maintenance organizations to manage health benefits, the program allows CalPERS members ease of use, and inherent cost savings for these benefits Recent increases in the number of health providers allows for more choice and thus, additional member participation in the program
Costs are covered by revenues derived from the Trust Fund appropriations set by the Board in the formal budget process
Basis of Accounting and BudgetingThe term “basis of accounting” is used to describe the timing of recognition, that is, when the effects of transactions or events should be recognized The basis of accounting used for purposes of financial reporting in accordance with Generally Accepted Accounting Principles (GAAP) is not necessarily the same basis used in preparing the budget document Explaining the major differences between the basis of accounting used in the budget document and the basis of accounting used in the GAAP financial statements helps stakehold-ers better understand and interpret the numbers presented in both documents
The Governmental Accounting Standards Board (GASB) establishes GAAP used in the United States GASB has jurisdiction over accounting and financial reporting by governmental entities and seeks to ensure that govern-ment organizations provide accurate and reliable information to end users who are typically tax-paying citizens who want information about financial transac-tions made by the government
AccountingThe CalPERS accounting and financial reports are managed and prepared in accordance with the guide-lines of GASB In government, the basic objective is service to the public and not the realization of net profit However, under the GASB’s authoritative guidance, governmental financial statements are to be presented using the full accrual method to help users assess the finances of government, including the year’s operating results, in a manner similar to private sector (for profit) company reports
The full accrual method allows the performance of an organization to be measured by recognizing revenues when the activity that generates them occurs, not necessarily when actual payments are received Expenses are also recognized at the time they are incurred, not necessarily after actual payments are made This generates financial statements that more accurately describe the current financial situation of the organization
BudgetingAt CalPERS, the basis of budgeting differs from the basis of accounting because the basis of accounting is the full accrual method and the basis of budgeting is the modified accrual method
The modified accrual method reflects revenues when payments are actually received, unlike the full accrual method Expenses, however, are recorded using the full accrual method and are recognized at the time they are incurred, not necessarily when actual payments are made
17

Financial PoliciesThe following policies reflect the overall framework that CalPERS uses These policies are reviewed annually and updated as required, and are adopted by the Board or approved by senior executives
Governance Policies• The Global Governance Policy—Provides CalPERS
with a system of policies and structure by which the long-term goals and strategic plans are guided The global governance structure specifies the distribution of authority and accountability among different levels of the organization It details best practices and guiding principles for making decisions throughout the organization and provides a mechanism for accountability Good governance ensures that CalPERS funds are used for the sole benefit of our members to produce the long-term, risk-adjusted returns that pay pensions
• The Regulations Analysis Policy—Allows CalPERS to advocate for its members and stakeholders by providing information and in-depth policy analyses to state and federal governmental entities; educatingCalPERS about relevant changes in state and federal laws; and works with members and stakeholders to ensure the integrity of the CalPERS trust funds
General Policies• Authorized Position Policy—Defines CalPERS internal
controls and staff roles and responsibilities when establishing, tracking, and approving new authorized positions for the organization All proposals are presented to the CalPERS Board, whose authority it is to review and approve the proposals to begin the process of establishing new positions Position control resides with the Financial Office
• Bill Analysis Policy—Provides analysis of legislative bills or the effects of proposed measures or amend-ments and the fiscal impact affecting the organization The purpose of bill analysis is to provide the organiza-tion with information concerning the probable programmatic and fiscal effects of pending legislation CalPERS puts forth a position when the organization supports or rejects proposed legislation that creates an impact to CalPERS
• Contract and Amendments Policy—Provides transpar-ency and ensures there is awareness of significant contracts; gives the executive team the opportunity to participate in significant contract decisions before being finalized; assists in monitoring responsibilities regarding contract decisions Certain contracts and purchases that exceed a threshold of $1 million or more will be reported on a prospective basis to the Board
• Pro Rata Policy—Defines CalPERS established guide-lines determined by the California Department of Finance to identify statewide central administrative service costs paid from the General Fund that are chargeable to, and can be recovered from, special funds CalPERS has control processes in place to ensure the pro rata assessment charges are allowable and reasonable
Fiscal Control and Operating Budget Policies• Accounting Policy—Requires CalPERS to establish
and maintain its accounting systems according to Generally Accepted Accounting Principles (GAAP) and standards promulgated by the GFOA, GASB, and the Financial Accounting Standards Board (FASB)
• Administrative Budget Policy—Allows CalPERS to develop the administrative budget plan for the upcom-ing fiscal year and submit the plan to the Department of Finance for inclusion in the Governor’s Budget The primary purpose is to develop a plan to operate within authorized budgeted levels and to comply with any restrictions or limitations enacted by the Legislature
• Annual and Mid-Year Budget Development Policy— Defines how the annual and mid-year operating plans and budgets are developed within timeframes for review by the Board In conducting these formal budgeting processes, CalPERS ensures the timely distribution of the annual budget for the operation of the organization and provides a means for modification in the mid-year when projections reflect potential pressures or new opportunities
18

• Budget Policy—Ensures CalPERS budgeting practices are in accordance with responsible fiscal management for the allocation and utilization of resources to meet the organization’s mission, vision, and values The policy sets out the budgeting principles for the preparation of the budget, the process for the budget formulation, and the responsibilities in the preparation, approval, and implementation of a total balanced budget
• Budget Change Proposal Policy—Budget change proposals are traditional decision documents which propose a change to the existing budget level and are submitted to the California Department of Finance for review and analysis This policy ensures consistency, provides guidelines when proposing a change to the level of service or funding sources for activities authorized by the California State Legislature to establish a new program that is not currently author-ized, or to delete an existing program
• Budget Check Error Policy—Specifies a control in place to verify funding and appropriation availability in the accounting system when expenditures are posted against funding sources or an established encumbrance Daily checks implement the control and notification of funds and encumbrances availability in a timely manner to both the accounting and budget staff This policy assures a balanced budget within the authorized budget funds
• Budget to Actual Reconciliation Policy—The budget reconciliation process serves as a control to confirm transactions were authorized, accurate, and complete The authorization and approval processes for transactions serve as initial components of the budget reconciliation
• Budget Transfer Policy—Establishes roles, responsi-bilities, and guidelines to request and approve budget transfers between a division’s budget line items, from one division’s budget to another, to and from the Unallocated Reserve Account and to cover unanticipated business needs
• Cost Allocation Policy—Identifies allowable direct and indirect organizational costs and communicates the methodology used to participants and stakeholders
• Legislative Budget Hearings Policy—Defines roles and responsibilities in attending the California State Legislature’s policy and fiscal committee The majority of measures of proposed programmatic or public policy changes are sent to the policy committee for review Measures that could have a fiscal impact on the state are also sent to a fiscal committee to measure financial implications
• Quarterly Projections Policy—Explains the compari-son of quarterly expenditure projections using actuals against budget, identifies the methodology used and the total amount of anticipated expenditures The remaining months of the fiscal year are used to identify divisions’ spending if they fall under, over or on budget, and to identify specific budget item concerns
• Quarterly Reporting Policy—Details requirements so data is captured quarterly to develop reports displaying projected and actual expenditure activity and investment information to present to the Board
• Revenue and Expenditure Analysis Policy— Compares revenue and expenditure projections against actuals to identify fiscal year surpluses and/or deficits within the organization Ensures divisional funding is adequate and funding sources do not exceed the appropriation levels
• Transferring Investment Expenses Policy—Maintains consistent reporting of investment costs to the Joint Legislative Budget Committee and the Legislative Analyst’s Office Identifies investment–related expenses in the Total Operating Costs Budget that should be more appropriately charged to the Investment External Management Fees Budget
• Treasury Management Policy—Defines CalPERS responsibilities, structure, and approach for the Treasury Management Program The policy ensures the payment of member benefits and organizational obligations without interruption, provides an inte-grated oversight structure, maintains the appropriatecoverage and reserve levels for programs and the enterprise, and manages enterprise liquidity risk
• Treasury Management Reserve Policy—The Treasury Management (TM) Program will establish and manage TM reserves to ensure the payment of Member Benefits and other obligations without interruption while optimizing the use of fund assets
19

CalPERS Budget Process The CalPERS budget is a financial plan for the spending and allocation of resources needed to meet the organi-zation’s mission, vision, and values necessary to build and maintain retirement and health security for members that serve the State of California; in accord-ance with the California Constitution, Article XVI, Section 17 The budget reflects CalPERS values and priorities and is the basis in determining how resources will be used and the estimated expenditures for the approved period
Prior to building the budget, enterprise priorities are determined through a business planning process The five-year strategic plan and the two-year business plan are approved by the Board The strategic goals of the enterprise, the mission of CalPERS, and the priorities of our stakeholders are incorporated into the budget process
CalPERS has two budget processes during the fiscal year-the annual and mid-year budget processes
CalPERS Budget Process
Annual Budget» One-year funding source
» Board approval in April of each year
» Budget approval effective July 1 – June 30
Mid-Year Budget» 6-month funding source for Board-directed,
unanticipated, and emergency needs only
» Board approval in December of each year
» Budget approval effective January 1 – June 30 of each year, if needed
20

Annual Budget ProcessThe annual budget process is for review of the organiza-tion’s existing resources and requests for new resources required to meet CalPERS mission, strategic plan, and business plan priorities The process begins in October of each year with submission of the Financial Office’s annual budget memo to enterprise management The memo provides a universal message detailing instruc-tions, budget policy direction, communication of expectations, and objectives for the budget process
In the annual budget process, divisions’ operational budgets are reviewed to determine core operational budget needs to maintain current service levels Additionally, divisions requiring additional resources for new services, initiatives, and projects submit detailed formal budget request documents for review and prioritization during the budget process Executive management and the Financial Office work collaboratively with divisions through this process and in the recommended allocation of funding based on enterprise priorities
The proposed budget is reviewed by the Board in an open public forum in March and April, with a first and second reading The Board approves and adopts the annual budget in April with an annual budget effective date of July 1 of the new fiscal year
Mid-Year Budget Process The purpose of the mid-year budget process is to amend the approved annual budget with up to six months of funding for Board-directed, critical, emergency, or unforeseen circumstances that arise after the start of the new fiscal year needing to be addressed and funded in the current year The process begins in late August and the proposed mid-year budget is reviewed by the Board in an open public forum in November and December, as first and second readings, respectively The Board approves and adopts the mid-year budget in December with an annual budget effective date of January 1 in the current fiscal year
Annual Budget Process Key Milestones
OctoberAnnual budget process memo to the enterprise
OctoberFunctional areas develop Formal Budget Requests (FBRs)
November Division Chiefs discuss FBRs, enterprise priorities,area needs, and projects for upcoming year
December FBRs due to the Financial Office
December Financial Office analysis, prioritization, and recommendations of FBRs to executive management
JanuaryDivision Chiefs present their FBRs to executive management panel
FebruaryExecutive management finalize recommendations on FBRs to go forward to Board for review and approval
MarchFirst reading of the annual budget to the Board
AprilSecond reading of the annual budget to the Board for final approval
JulyAuthorized budget takes effect on July 1st
21

Financial Summaries
FY 2016-17 Annual Financial Plan The following budget provides the annual financial plan for FY 2016-17 CalPERS is committed to maintaining efficient and effective administration that is accountable and transparent to its stakeholders This document compiles the financial data needed to support CalPERS goals which is aligned with the initiatives outlined in the CalPERS 2015-17 Business Plan, and is based on the departmental review of operations
The $1,788 5 million budget for CalPERS consists of five budgetary funds: Total Operating Costs Fund, Enterprise Projects Budget Fund, Headquarters Building Costs Fund, Investment External Management Fees Fund, and Third-Party Administrator Fees Fund
FY 2016-17 Annual CalPERS Total Budget (in millions)
Budget to Budget
FY 2015–16 Approved
Budget1FY 2015–16
Forecast
FY 2016–17 Approved
BudgetFY 2017–18 Projection
$ Change increase/
(decrease)
% Change increase/
(decrease)
Administrative Operating Costs $444.7 $431.1 $455.8 $465.3 $11.1 2.5%
Investment Operating Costs2 83.0 83.0 90.5 90.5 7.6 9.1%
SUBTOTAL $527.7 $514.1 $546.3 $555.8 $18.7 3.6%
Investment External Management Fees 930.7 930.7 896.7 896.7 (34.1) (3.7%)
SUBTOTAL: OPERATING COSTS $1,458.4 $1,444.8 $1,443.0 $1,452.5 ($15.4) (1.1%)
Enterprise Projects Costs $37.5 $35.6 $41.4 $17.6 $3.9 10.3%
Headquarters Building Costs 30.3 28.4 31.3 31.3 .9 3.1%
Third-Party Administrator Fees 281.4 278.4 272.8 272.9 (8.6) (3.0%)
CalPERS TOTAL BUDGET $1,807.6 $1,787.2 $1,788.5 $1,774.3 ($19.1) (1.1%)
TOTAL POSITIONS 2,765.0 2,872.0 107.0 3.9%
1 FY 2015-16 Mid-Year Budget approved by CalPERS Board of Administration on December 15, 2015 2 Investment operating expenses are not part of CalPERS Administrative Operating Costs and therefore
should not be included in CalPERS pro-rata assessment
22

CalPERS FY 2016–17 Budget by Branch (in thousands)
FY 2015–16 Approved
Budget
FY 2016–17 Approved
Budget
Budget to Budget
$ Change increase/
(decrease)
% Change increase/
(decrease)
ADMINISTRATIVE & INVESTMENT OPERATING COSTS
Actuarial Office $8,036 $9,301 $1,265 15.7%
Benefit Programs Policy and Planning 30,088 28,762 (1,326) (4.4%)
Communications & Stakeholder Relations 10,215 10,560 345 3.4%
Customer Services & Support 103,971 109,434 5,463 5.3%
Executive Office 6,581 6,603 22 0.3%
Financial Office 29,777 29,978 201 0.7%
General Counsel 27,515 26,210 (1,305) (4.7%)
Investment Office 151,621 161,796 10,176 6.7%
Operations & Technology 138,038 142,015 3,977 2.9%
Pro-Rata Assessment 21,814 21,651 (163) (0.7%)
SUBTOTAL $527,656 $546,310 $18,655 3 .5%
Investment External Management Fees 930,726 896,705 (34,021) (3.7%)
Enterprise Projects Budget 37,508 41,382 3,874 10.3%
Headquarters Building Costs 30,350 31,295 946 3.1%
Third-Party Administrator Fees1 281,360 272,809 (8,551) (3.0%)
CalPERS TOTAL BUDGET $ 1,807,600 $ 1,788,500
1 Includes Health Program Fees, Long-Term Care Fees, and Supplemental Income Management and Custodial Fees
($19,100) (1.1%)
Total Administrative & Investment Operating Costs Budget Fund The proposed FY 2016-17 CalPERS Total Budget is $1,788 5 million, which represents an overall decrease of approximately $19 1 million (1 1 percent) from the FY 2015-16 Approved Budget of $1,807 6 million Specifically, this is an increase of $18 7 million (3 5 percent) in administrative and investment operating costs; a decrease of $34 0 million (3 7 percent) in investment external management fees; an increase of $3 9 million (10 3 percent) in enterprise project costs; an increase of $0 9 million (3 1 percent) in headquarters building costs; and a decrease of $8 6 million (3 0 percent) in third-party administrator fees
$0
$100
$200
$300
$400
$500
$600
FY2017-18
Projection
FY2016-17
ApprovedBudget
FY2015-16Forecast
FY2015-16
ApprovedBudget
FY2014-15Actual
FY2013-14Actual
$485.4$527.7 $555.8
$479.1$546.3
$514.1
$700
$800
Total Administrative & Investment Operating Costs Trend (in millions)
23

The Total Administrative and Investment Operating Costs for the FY 2016-17 Approved Budget are $546 3 million compared to $527 7 million in the FY 2015-16 Approved Budget, an increase of $18 6 million (3 5 percent), as detailed below:
$ Change (in millions) % Change
FY 2015-16 Administrative & Investment Operating Costs $527 .7
Cost Increases:
Trading and Portfolio Management Systems 8.8 1.7%
Data Processing 7.4 1.4%
Personnel Services 5.5 1.0%
Appraisal Fees/Tax Advisory Services 3.2 0.6%
Master Custodial/Investment Expenses 2.1 0.4%
Other 2.5 0.5%
TOTAL 29 .5 5 .6%
Cost Decreases:
External Counsel Fees (3.2) (0.6%)
Data Analytics (2.7) (0.5%)
Consultant and Professional Services (2.0) (0.4%)
Equipment (1.7) (0.3%)
Other (1.3) (0.2%)
TOTAL (10 .9) (2 .1%)
Net Increase 18.6 3.5%
FY 2016-17 ADMINISTRATIVE & INVESTMENT OPERATING COSTS $546.3
24

Line Items of Expense (Financial Schedule)The following pages highlight each notable change for the expense items within the Administrative and Investment Operating Costs
Line Item Expense (in thousands)
FY 2014–15 Actual
FY 2015–16 Approved
Budget
FY 2016–17 Approved
Budget
Budget to Budget
$ Change increase/
(decrease)
% Change increase/
(decrease)
Administrative & Investment Operating Costs[1] PERSONNEL SERVICES
Salaries & Wages $194,733 $222,110 $230,026 $7,915 3.6%Temporary Help 14,335 14,424 10,619 (3,805) (26.4%)Overtime 2,208 2,660 2,395 (265) (10.0%)Benefits 88,739 113,271 114,963 1,692 1.5%
TOTAL PERSONNEL SERVICES $300,014 $352,465 $358,002 $5,537 1 .6%Vacancy Savings (17,144) (17,226) (81)
REVISED TOTAL PERSONNEL SERVICES $300,014 $335,321 $340,776 $5,455 1 .6%
[2] OPERATING EXPENSES & EQUIPMENTGeneral Expense $7,362 $9,826 $9,849 $22 0.2%Fund Administrative Services/Subscriptions [2.1] 5,700 4,156 3,630 (526) (12.7%)Software [2.2] 2,662 2,051 2,724 673 32.8%Printing [2.3] 1,252 1,393 1,724 331 23.8%Postage [2.4] 1,240 1,305 1,433 128 9.8%Communications 1,830 2,260 2,328 68 3.0%Data Processing Services [2.5] 13,375 9,728 17,094 7,366 75.7%Travel [2.6] 2,511 2,981 3,134 153 5.1%Training [2.7] 1,417 1,394 1,746 352 25.3%Medical Exam/Disability Travel [2.8] 1,795 1,150 1,703 553 48.0%Facilities Operations 4,217 5,428 5,481 53 1.0%Central Administrative Services 22,263 25,155 24,710 (445) (1.8%)External Legal Counsel [2.9] 12,507 18,739 15,489 (3,250) (17.3%)Professional Services 8,056 7,096 6,896 (200) (2.8%)Consultants 38,362 42,984 41,159 (1,825) (4.2%)Audit Services [2.10] 1,330 2,073 1,799 (273) (13.2%)Master Custodian Fees [2.11] 6,757 5,970 6,800 830 13.9%Appraisal Fees/Tax Advisory Services [2.12] 6,285 6,275 9,453 3,178 50.6%Federal Legislative Rep [2.13] 659 800 900 100 12.5%Administrative Hearings [2.14] 754 500 760 260 52.0%Other Administrative & Operating Expenses [2.15] 1,546 722 1,546 824 114.1%Consolidated Data Centers 81 90 90 0.0%Trading & Portfolio Mgmt Systems [2.16] 15,056 13,315 22,101 8,786 66.0%Data/Analytics [2.17] 14,979 19,140 16,477 (2,663) (13.9%)Business Operations Tool/Other Technology [2.18] 1,041 650 1,060 410 63.1%Equipment (Includes EDP) [2.19] 6,038 7,154 5,447 (1,708) (23.9%)
TOTAL OPERATING EXPENSES & EQUIPMENT $ 179,075 $192,335 $ 205,533 $13,198 6 .9%TOTAL COSTS $479,089 $527,656 $546,309 $18,653 3.5%
25

[1] Personnel Services Information provided in the Position Summary Schedule page 54
[2] Operating Expenses & EquipmentOperating Expenses and Equipment costs of $205 5 million represent an increase of $13 2 million (6 9 percent) from the FY 2015-16 Budget of $192 3 million
Operating Expenses and Equipment Costs Trend (in millions)
$0
$50
$100
$150
$200
$250
FY2017-18
Projection
FY2016-17
ApprovedBudget
FY2015-16Forecast
FY2015-16
ApprovedBudget
FY2014-15Actual
FY2013-14Actual
$206.5$192.3
$209.3
$179.1$205.5$195.8
$300
$350
[2 .1] Fund Admin Services/SubscriptionsThe fund administration services/subscriptions costs are estimated to decrease by $526,000 primarily due to the wind down of the Absolute Return Strategy (ARS) portfolio and the transition to PEARS in Private Equity
[2 .2] SoftwareSoftware costs are estimated to increase by $673,000 primarily due to the one-time purchase of eDiscovery Software for the Legal Office ($400,000) and ongoing costs for security software in ITSB
[2 .3] PrintingPrinting costs are estimated to increase by $331,000 The PERSpective mailing costs are increasing due to a
larger volume being distributed and increased costs by the Office of State Printing
[2 .4] PostagePostage costs are estimated to increase by $128,000 due to Board election postage costs
[2 .5] Data Processing ServicesData Processing Services costs reflect an increase of $7 4 million However, the current year budget has not been updated to reflect anticipated costs that are more in line with FY 2016-17 costs
[2 .6] TravelTravel costs are estimated to increase by $153,000 primarily due to the increased costs associated with the CalPERS Benefit Education Events and due to more in-house investment staff traveling
[2 .7] TrainingTraining costs are estimated to increase by $352,000 primarily in the investment and information technology areas This is due to having in-house staff perform functions previously done by outside consultants Also, the fast-paced technological environment and high demands for system changes require the continuous learning and enhancement of the skills and knowledge of state staff
[2 .8] Medical Exams/Disability TravelMedical exams/disability travel costs are estimated to increase by $553,000 compared to the FY 2015-16 Budget However, the proposed costs are lower than the FY 2014-15 actual expenses due to in-house medical staff who can assist with disability eligibility determinations
[2 .9] External Legal CounselExternal legal counsel costs are estimated to decrease by $3 3 million due to a reduction in bankruptcy and investment-related legal costs
[2 .10] Audit Services Audit services costs are estimated to decrease by $273,000 primarily due to the trend over the past three years related to costs for auditing external managers
26
[2 .11] Master Custodian Fees Master Custodian Fees are estimated to increase by $830,000 to align with prior year actual expenses and to reflect added services in the Investment Office for the Emerging Manager portfolio
[2 .12] Appraisal Fees/Tax Advisory Services Appraisal Fees and Tax Advisory Services are estimated to increase by $3 2 million due to the increased frequency of real estate appraisals to normalize the schedule of asset valuations
[2 .13] Federal Legislative RepresentativeA recent change from one federal representative for all health, pension, and investment related issues to three individual representatives for each area of focus has increased federal legislative costs by an estimated $100,000 due to moving from one to three firms
[2 .14] Administrative HearingsAdministrative Hearings costs are estimated to increase by $260,000 due to additional member appeal cases that go to the Department of General Services - Office of Administrative Hearings This is consistent with the FY 2014-15 expenditure level
[2 .15] Other Administrative & Operating Expenses Other Administrative and Operating Expenses are estimated to increase by $824,000 primarily due to the continued efforts toward the internalization of core, high value functions related to investing that were previously outsourced and the addition of the Emerging Manager portfolio
[2 .16] Trading & Portfolio Management SystemsTrading & Portfolio Management Systems costs are estimated to increase by $8 8 million primarily due to the implementation of the ARTEMIS II and PEARS systems in the Investment Office In addition, our subscriptions with Blackrock, Charles River, and Capital Analytics are expected to increase as we continue to insource our investment management
[2 .17] Data/AnalyticsData analytics costs are estimated to decrease compared to the FY 2015-16 projection by $2 6 million based on continued INVO cost effectiveness efforts to assess tools needed for internal investment staff This is a direct result of the Investment Office’s continued effort to build infrastructure necessary to support the internal management of assets
[2 .18] Business Operations Tool/Other TechnologyBusiness operations tool/other investment technology costs are estimated to increase by $410,000 to align with prior year actual expenses and to reflect the increase in our trading activity as we more actively manage our cash holdings
[2 .19] Equipment (includes EDP)Equipment costs are estimated to decrease by $1 7 million primarily due to a reduction in the Hardware Refresh amount in FY 2016-17 (from $5 8 million in FY 2015-16 to $4 2 million in FY 2016-17)
27

Investment External Management Fees Fund The FY 2016-17 Approved Budget of $896 7 million is made up of $677 5 million for External Management Base Fees and $219 2 million for External Management Performance Fees which is an overall decrease of $34 0 million or 3 7 percent from the FY 2015-16 Approved Budget Total External Management Base Fees are decreasing by $70 6 million or 9 4 percent and total External Management Performance Fees are increasing by $36 6 million or 20 1 percent from the FY 2015-16 Approved Budget
Investment External Management Fees Fund (in thousands)
FY 2014–15 Actual
FY 2015–16 Approved
Budget
FY 2016–17 Approved
Budget
Budget to Budget
$ Change increase/
(decrease)
% Change increase/
(decrease)
Global Equity [3.0] $50,457 $51,265 $92,750 $41,485 80.9%
Fixed Income 9,354 7,915 8,797 882 11.1%
Real Assets [3.1] 199,279 206,296 165,378 (40,918) (19.8%)
Absolute Return Strategy [3.2] 40,260 2,641 4,000 1,359 51.5%
Private Equity 414,137 440,582 391,000 (49,582) (11.3%)
Activist Funds [3.3] 28,464 31,772 6,185 (25,587) (80.5%)
Multi Asset Class1 [3.4] 7,650 9,358 1,708 22.3%
EXTERNAL MGMT, BASE FEES $741,950 $748,121 $677,468 ($70,653) (9.4%)
Global Equity [3.0] $69,715 $32,096 $72,258 $40,162 125.1%
Fixed Income 2,446 4,199 4,114 (85) (2.0%)
Real Assets2 [3.1] 472,688 89,672 142,865 53,193 59.3%
Absolute Return Strategy [3.2] 46,250 2,938 (2,938) (100.0%)
Activist Funds [3.3] 93 44,945 (44,945) (100.0%)
Multi Asset Class1,3 [3.4] 8,755 (8,755) (100.0%)
EXTERNAL MGMT, PERFORMANCE FEES 4 $591,192 $182,605 $219,237 $36,632 20.1%
TOTAL EXTERNAL MANAGEMENT FEES $1,333,142 $930,726 $896,705 ($34,021) (3.7%)
1 For FY 2014-15, Multi Asset Class base and performance fees were unavailable
2 For budget reporting purposes, in FY 2015-16 and FY 2016-17, performance fees for Real Assets do not include accrued profit-shar-ing fees All real asset profit-sharing fees (including accruals) continue to be reported as Management & Performance Fees on the Statement of Changes in Fiduciary Net Position – Fiduciary Funds along with the Other Supplementary Information section of the CAFR
3 In FY 2015-16, performance fees for Multi Asset Class include profit-sharing accrual estimates Beginning in FY 2016-17, for budget reporting purposes, profit-sharing accruals are not included The profit-sharing accruals continue to be reported as Net Appreciation (Depreciation) in Fair Value of Investments on the Statement of Changes in Fiduciary Net Position – Fiduciary Funds
4 Profit-sharing for Private Equity is deducted from the net returns earned in that asset class
28

The following are the main variances from the previous year:
[3 .0] Global Equity base fees are projected to increase by $41 5 million as deployment of additional capital for three new Emerging Managers strategies took place in FY 2015-16 Performance fees are anticipated to increase by $40 2 million based on a projection of a slight positive market return and represents a minimal increase of 4 0 percent compared to prior year actuals
[3 .1] Real Assets base fees are projected to decrease by $40 9 million based on INVO’s cost effectiveness focus of renegotiating current contracts and external manager feedback based on average net asset value (NAV) and market analysis Projected paid profit sharing fees show an increase compared to FY 2015-16 projections of $53 2 million based on market analysis and feedback from external managers on asset valuations FY 2015-16 projections were based on historical paid incentive fees
[3 .2] Absolute Return Strategy (ARS) base fees are projected to increase by $1 4 million based on a blended rate being applied to expected remaining average balances at the end of FY 2015-16 INVO expects any remaining ARS assets will be sold by the end of FY 2016-17 Performance fees are projected to be zero due to the wind down of this portfolio
[3 .3] Activist Funds (previously Corporate Governance) base fees are projected to decrease by $25 6 million and performance fees are projected to be $0 as INVO discontinues these relationships and the assets under management (AUM) move to traditional GE managers on a lower base of fees
[3 .4] Multi Asset Class base fees are projected to increase by $1 7 million based on NAV and contracted basis points, and performance fees are projected to decrease by $8 8 million No performance fees are anticipated to be paid out in FY 2015-16 and FY 2016-17
The following table shows the net decrease in invest-ment costs, comparing the decrease in external management fees offset by the increase in investment administrative and operating costs
Net Decrease in Investment Costs (in millions)
FY 2015–16 Budget
FY 2016–17 Approved
Budget
Budget to Budget
$ Change increase/
(decrease)
% Change increase/
(decrease)
INVESTMENT COSTS
Administrative $68.7 $71.3 $2.6 3.8%
Investment Operating Costs 83.0 90.5 7.6 9.1%
External Management Fees 930.7 896.7 (34.0) (3.7%)
TOTAL $1,082.3 $1,058.5 ($23.8) (2.2%)
29

Basis Points TrendThe expense ratio reflects investment expenses in relation to the value of the portfolio The above chart shows the comparison, or ratios, of the External Management Fees and the Investment Administrative and Operating Costs to the net asset value (NAV) of the assets under manage-ment by fiscal year In summary, there is a positive downward trend for External Management Fees relative to the NAV
The increase in basis points in FY 2014-15 Actual External Management Fees from FY 2013-14 is due to higher increases in the performance fee expenses in comparison to increases in the NAV
The expense ratio of the FY 2016-17 Proposed Budget total investment expenses is anticipated to be 29 45 basis points This assumes a downward trend in the ratio as staff continue to negotiate more favorable portfolio management terms and bring outside external manage-ment fees in-house to state staff
CalPERS Investment Expenses/Net Asset Value (in basis points)
50
40
30
20
10
0
40.7843.01
27.8824.95 23.17
45.13
4.34 4.46 4.54 4.50 4.18
47.46
32.4329.45
27.35
FY 2013-14Actual
FY 2015-16Approved
Budget
FY 2014-15Actual
FY 2016-17Approved
Budget
FY 2017-18Projection
Total Investment Expenses External Mgmt Fees Investment Admin and Operating Costs
Note: FY 2015-16, FY 2016-17 and FY 2017-18 forcasted NAV is based on the average annual percentage increase in net assets from FY 2010-11 to FY 2014-2015
30

Enterprise Projects Fund
The FY 2016-17 Enterprise Project Costs of $41 4 million represent an increase of $3 9 million or 10 3 percent from the FY 2015-16 Approved Budget of $37 5 million driven by increases in system security costs, AVS redesign, system infrastructure moderniza-tion, and tobacco divestment study (totaling $8 2 million) offset by the disaster recovery one-time cost decrease of $4 0 million Compared to the FY 2015-16 Forecast of $35 6 million, the FY 2016-17 Proposed Budget represents an increase of $5 8 million or 16 2 percent
The Enterprise Projects are detailed further in the Capital Expenditures Section on page 47
Enterprise Projects (in thousands)
Budget to BudgetFY 2015–16
Approved Budget
FY 2016–17 Approved
Budget
FY 2017–18 Projection
$ Change increase/
(decrease)
% Change increase/
(decrease)
CURRENT PROJECTS
[1] my|CalPERS Business Optimization $23,000 $23,470 $10,000 $470 2.0%
[2] Security Roadmap 4,000 5,179 1,340 1,179 29.5%
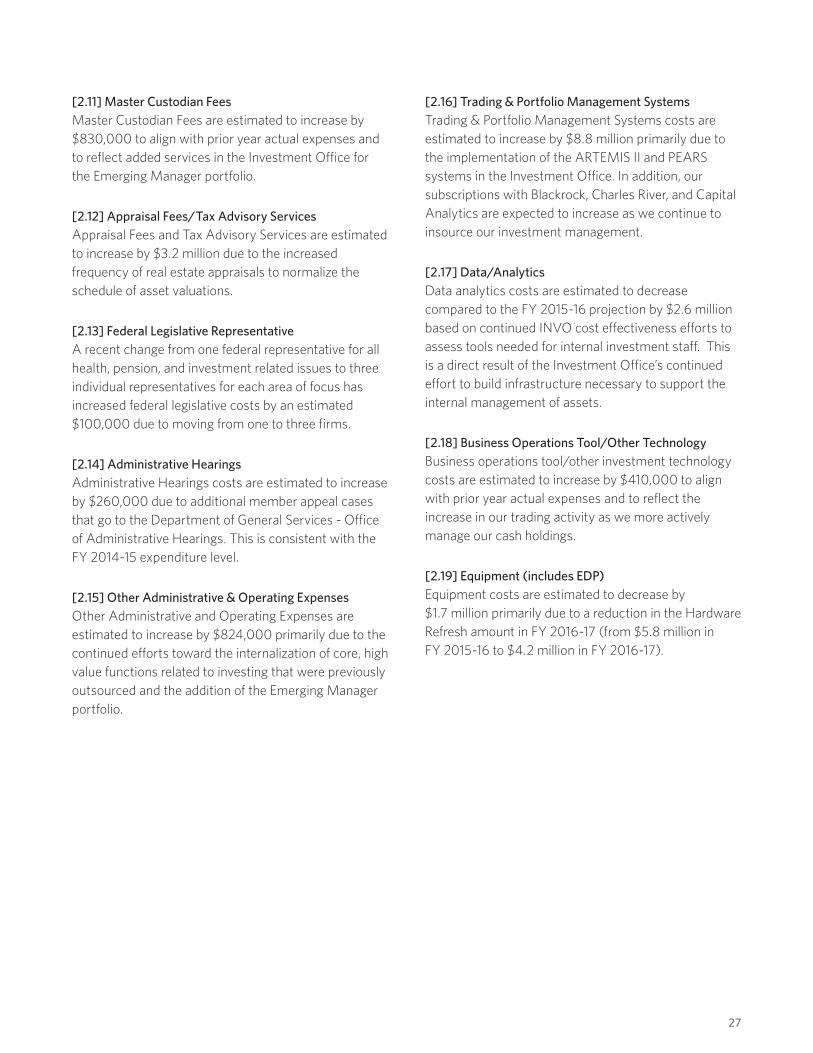
[3] Actuarial Valuation System Redesign 2,500 4,797 5,000 2,297 91.9%
[4] Infrastructure Modernization - 4,200 - 4,200 -
[5] Business Intelligence 1,000 1,000 - - 0.0%
[6] Compliance Program Infrastructure, Framework, & eGRC 500 550 500 50 10.0%
[7] Treasury Management 500 400 - (100) (20.0%)
[8] Tobacco Divestment Study and Outreach - 500 - 500 -
[9] Miscellaneous Projects1 200 1,285 763 1,085 542.5%
PRIOR YEAR PROJECTS
IT Backup/Restoration/Archiving/Disaster Recovery 4,000 - - (4,000) (100.0%)
Data Governance 600 - - (600) (100.0%)
Budget Analytics Software 500 - - (500) (100.0%)
Enterprise Content Management Website Accessibility 225 - - (225) (100.0%)
Miscellaneous Projects2 483 - - (483) (100.0%)
TOTAL OF ENTERPRISE PROJECTS $37,508 $41,382 $17,603 $3,874 10.3%
1 Includes PeopleSoft HCM 9 2 Upgrade, Windows 10 Planning, Succession Planning, and Executive Compensation Project
2 Includes Information Security Risk Metrics, CalPERS Education Center Replacement, and Talent Management-Learning Management System Upgrade
31

Headquarters Building Costs FundThe FY 2016-17 Headquarters Building Costs are $34 4 million, reduced by $3 1 million in rent revenues, creating a net cost of $31 3 million Costs include operating expenses of $18 9 million (utilities, engineer-ing services, janitorial, security, etc ) and non-operating expenses of $15 5 million (structural improvements, staff moves, insurance, etc )
Operating expenses in the FY 2016-17 Approved Budget of $18 9 million is a $0 3 million increase from the FY 2015-16 Approved Budget of $18 6 million Non-Operating expenses in the FY 2016-17 Approved Budget of $15 4 million have increased by $0 5 million from the FY 2015-16 Approved Budget of $14 9 million
$20
$25
$30
$35
$40
FY2017-18
Projection
FY2016-17
ApprovedBudget
FY2015-16Forecast
FY2015-16
ApprovedBudget
FY2014-15Actual
FY2013-14Actual
$25.9$28.3
$31.3
$28.1
$31.3$30.3
Headquarters Building Costs Trend (in millions) The increase of $0 .8 million is broken down as follows: (in millions)
Utilities—(2 5% SMUD increase) and Stairwell Maintenance
$0 4
Security—Increased salaries due to Government Code compliance
0 2
EOC (Sun Center)—Removal of 10-year uninterrupted power system battery replacement and cold aisle containment project from previous year
(0 5)
Owner Improvements—Decrease in tenant improvements project expenses
(0 2)
Building Improvements—Garage door conversion, dimming system replacement, emergency services replacements, drought tolerant supplies, concrete repairs, lighting upgrades
1 1
Building Insurance—Decrease based on current market and decrease in trending premiums
(0 4)
Miscellaneous—Net effect of all other changes
0 2
Total Change in Cost $0 .8
Rent Revenue Offset 0 2
Budget Increase from FY 2015-16 to FY 2016-17
$1 .0
32

Headquarters Building Costs by Category (in thousands)
FY 2014–15 Actual
Expenses
FY 2015–16 Approved
Budget
FY 2016–17 Approved
Budget
Budget to Budget
$ Change % Change increase/ increase/
(decrease) (decrease)
OPERATING:
Utilities $2,456 $2,258 $2,455 $198 8.8%
Engineering Services 2,572 3,004 3,085 81 2.7%
Janitorial 2,465 3,189 3,202 13 0.4%
Landscaping 753 822 840 18 2.2%
General Maintenance 1,826 2,043 2,218 175 8.6%
Security 2,164 2,231 2,454 223 10.0%
Property Mgmt & Administrative Fees 1,124 1,254 1,227 (27) (2.1%)
Café Plaza 402 375 376 1 0.3%
Front St. Parking/Warehouse 473 644 660 16 2.5%
EOC (Sun Center)1 508 931 414 (517) (55.5%)
Operating Other2 1,795 1,873 1,979 106 5.6%
TOTAL OPERATING COSTS $16,537 $18,623 $18,911 $288 1.5%
NON-OPERATING:3Owner Improvements $5,748 $7,395 $7,158 ($237) (3.2%)
Building Improvements 4 3,689 4,113 5,170 1,057 25.7%
Furniture & Fixtures 2,880 2,451 2,511 60 2.5%
Building Insurance 475 976 610 (366) (37.5%)
TOTAL NON-OPERATING COSTS $12,793 $14,934 $15,449 $515 3.4%
TOTAL COSTS $29,330 $33,558 $34,360 $803 2.4%
Rent Revenue Offset 5 (3,385) (3,208) (3,065) 143 (4.5%)
TOTAL HEADQUARTERS BUILDING COSTS $25,944 $30,350 $31,295 $946 3.1%
1 Emergency Operations Center (EOC) includes utilities, janitorial, security, landscaping, generator maintenance
2 Includes ongoing expense categories that individually equal less than $300K annually, such as electrical, HVAC, plumbing, general maintenance, waste removal, property taxes, child care center, and parking garage
3 Non-Operating Owner Improvements include CalPERS operational enhancements and support for the movement of divisions, units, and/or staff within CalPERS
4 Non-Operating Building Improvements are improvements made to the building structure or common areas
5 The Headquarters Building Account receives rent revenue that is used to offset the annual expenses of the Headquarters Building Account
33

Financial Summaries
FY 2016-17 Annual Financial Plan The following budget provides the annual financial plan for FY 2016-17 CalPERS is committed to maintaining efficient and effective administration that is accountable and transparent to its stakeholders This document compiles the financial data needed to support CalPERS goals which is aligned with the initiatives outlined in the CalPERS 2015-17 Business Plan, and is based on the departmental review of operations
The $1,788 5 million budget for CalPERS consists of five budgetary funds: Total Operating Costs Fund, Enterprise Projects Budget Fund, Headquarters Building Costs Fund, Investment External Management Fees Fund, and Third-Party Administrator Fees Fund
FY 2016-17 Annual CalPERS Total Budget (in millions)
FY 2015–16 Approved
Budget1FY 2015–16
Forecast
FY 2016–17 Approved
BudgetFY 2017–18 Projection
Budget to Budget
$ Change increase/
(decrease)
% Change increase/
(decrease)
Administrative Operating Costs $444.7 $431.1 $455.8 $465.3 $11.1 2.5%
Investment Operating Costs2 83.0 83.0 90.5 90.5 7.6 9.1%
SUBTOTAL $527.7 $514.1 $546.3 $555.8 $18.7 3.6%
Investment External Management Fees 930.7 930.7 896.7 896.7 (34.1) (3.7%)
SUBTOTAL: OPERATING COSTS $1,458.4 $1,444.8 $1,443.0 $1,452.5 ($15.4) (1.1%)
Enterprise Projects Costs $37.5 $35.6 $41.4 $17.6 $3.9 10.3%
Headquarters Building Costs 30.3 28.4 31.3 31.3 .9 3.1%
Third-Party Administrator Fees 281.4 278.4 272.8 272.9 (8.6) (3.0%)
CalPERS TOTAL BUDGET $1,807.6 $1,787.2 $1,788.5 $1,774.3 ($19.1) (1.1%)
TOTAL POSITIONS 2,765.0 2,872.0 107.0 3.9%
1 FY 2015-16 Mid-Year Budget approved by CalPERS Board of Administration on December 15, 2015 2 Investment operating expenses are not part of CalPERS Administrative Operating Costs and therefore
should not be included in CalPERS pro-rata assessment
22

Health Program
Health Program Fees Trend (in millions)
$0
$100
$200
$300
FY2017-18
Projection
FY2016-17
ApprovedBudget
FY2015-16Forecast
FY2015-16
ApprovedBudget
FY2014-15Actual
FY2013-14Actual
$172.9*
$254.6 $247.3
$263.8 $247.3$255.3
*Excludes Blue Shield administrative fees which were not available separately.
$400
The Health Program provides health coverage to more than 1 4 million members and their families enrolled in CalPERS health plans which include all active and retired California State employees, as well as active and retired employees of local agencies, and school districts in California Effective January 1, 2014, health coverage providers were expanded to include Anthem Blue Cross, Blue Shield, Health Net, Sharp Health Plan, and United Healthcare
The FY 2016-17 Approved Budget of $247 3 million represents a net decrease of $7 3 million or 2 9 percent from the FY 2015-16 Approved Budget mainly driven by changes in health plan enrollment of the Blue Shield health plan The FY 2015-16 Forecast shows a slight increase in costs of $0 7 million in comparison to the FY 2015-16 Budget due to movement in membership amongst the various health plans The FY 2017-18 Projection is estimated to be the same as the FY 2016-17 Approved Budget due to continued efficiencies identified in the health program although membership continues to increase
Long-Term Care Program
Long-Term Care Program Fees Trend (in millions)
$0
$5
$10
$15
$20
$25
$30
FY2017-18
Projection
FY2016-17
ApprovedBudget
FY2015-16Forecast
FY2015-16
ApprovedBudget
FY2014-15Actual
FY2013-14Actual
$19.1
$22.8 $21.6
$20.2 $21.6$19.2
$35
$40
The Long Term Care Program, as administered by Long Term Care Group, Inc , provides comprehensive, personal, non-medical assistance, including care at home, adult care centers, assisted living facilities, and nursing homes to its members Administrator fees include underwriting costs, billing/banking, care advisory services, claims administration, reports, and customer service
The FY 2016-17 Approved Budget of $21 6 million represents a decrease of $1 2 million or 5 5 percent from the FY 2015-16 Approved Budget This decrease is attributed to a reduction in projected enrollment and the associated savings in related administrative costs The FY 2015-16 Forecast shows a decrease in costs of $3 6 million in comparison to the FY 2015-16 Budget due to a decrease in enrollment The FY 2017-18 Projection is estimated to be the same as the FY 2016-17 Approved Budget
35

Supplemental Income Plan
Supplemental Income Plan Fees Trend (in millions)
$0
$1
$2
$3
$4
$5
FY2017-18
Projection
FY2016-17
ApprovedBudget
FY2015-16Forecast
FY2015-16
ApprovedBudget
FY2014-15Actual
FY2013-14Actual
$4.0 $3.9 $3.9
$3.9 $3.9$3.9
$6
$7
The Supplemental Income Plans (SIP) program provides deferred compensation and defined contribution plans for employees of participating public agencies, schools, and the State of California The Voya Group is the third- party administrator responsible for providing record-keeping and administrative services for the SIP Program
The FY 2016-17 Approved Budget of $3 9 million is relatively the same as the FY 2015-16 Approved Budget For the FY 2015-16 Forecast, the program estimates spending the entire budget The FY 2017-18 Projection is also estimated to be the same as the FY 2016-17 Approved Budget
36

Consolidated Financial ScheduleFY 2016–17 Consolidated Financial Schedule (in thousands)
Total Operating
Costs Fund
Enterprise Projects
Fund
HQ Building
Costs Fund
Investment External
Mgmt Fees Fund
Third-Party Administrator
Fees FundTotal for
FY 2016-17
REVENUES 1 $546,309 $41,382 $31,295 $896,705 $272,809 $ 1,788,500
EXPENDITURESPersonnel $327,762 $ - $ - $ - $ - $ 327,762
Temporary Help & Overtime 13,014 - - - - 13,014
General Expense 9,849 - - - - 9,849
Communications 2,328 - - - - 2,328
Data Processing Services 17,094 - - - - 17,094Facilities Operations 5,481 - - - - 5,481Travel & Training 4,879 - - - - 4,879Central Administrative Services 24,710 - - - - 24,710Professional Services 6,896 - - - - 6,896Consultants 41,159 - - - - 41,159External Legal Counsel & Audit Services 17,288 - - - - 17,288Trading & Portfolio Mgmt Systems 22,101 - - - - 22,101Data/Analytics 16,477 - - - - 16,477Other Investment Operating Costs 22,489 - - - - 22,489Other Administrative Costs 9,334 - - - - 9,334Equipment 5,447 - - - - 5,447my|CalPERS Business Optimization - 23,470 - - - 23,470Security Roadmap - 5,179 - - - 5,179Actuarial Valuation System - 4,797 - - - 4,797Infrastructure Modernization - 4,200 - - - 4,200Business Intelligence - 1,000 - - - 1,000Compliance Infrastructure & Framework - 550 - - - 550
Tobacco Divestment Study Outreach - 500 - - - 500Treasury Management - 400 - - - 400Miscellaneous Projects2 - 1,285 - - - 1,285Headquarters Building Costs - - 31,295 - - 31,295
External Management - Base Fees - - - 677,468 - 677,468
External Management - Performance Fees - - - 219,237 - 219,237Health Program Administrative Fees - - - - 235,181 235,181Pharmacy Services - CVS Caremark - - - - 12,158 12,158
Long-Term Care Program - LTC Group, Inc. - - - - 21,572 21,572
Supplemental Income Plan - Voya - - - - 3,899 3,899
TOTAL EXPENDITURES $546,309 $41,382 $31,295 $896,705 $272,809 $ 1,788,500
1 The CalPERS program receives revenue for expenditures through allocation from the trust funds
2 Includes Human Capital Management System 9 2 Upgrade, Windows 10 Planning, Succession Planning, and the Executive Compensation Project
37

38
Three-Year Consolidated & Fund Financial Schedules
Three-Year Consolidated Financial Sources & Uses (in thousands)
FY 2014-15 Actual Expenses
FY 2015-16 Approved Budget
FY 2016-17 Approved Budget
REVENUESTotal Operating Costs Fund $479,089 $527,656 $546,309Enterprise Projects Fund 22,921 37,508 41,382Headquarters Building Costs Fund 25,944 30,350 31,295Investment External Management Fees Fund 1,333,142 930,726 896,705Third-Party Administrator Fees Fund 287,849 281,360 272,809
TOTAL REVENUES $ 2,148,945 $ 1,807,600 $ 1,788,500
EXPENDITURESPersonnel $ 300,014 $ 335,321 $ 340,776Data Processing Services 13,375 9,728 17,094Central Administrative Services 22,263 25,155 24,710Consultant & Professional Services 46,418 50,080 48,055External Legal Counsel 12,507 18,739 15,489Equipment 6,038 7,154 5,447Other Administrative Operating Costs 26,556 30,279 32,904Investment Operating Costs 51,918 51,199 61,834my|CalPERS System 17,400 23,000 23,470Security Roadmap 2,019 4,000 5,179Actuarial Valuation System 132 2,500 4,797Infrastructure Modernization - - 4,200Business Intelligence 1,240 1,000 1,000Compliance Program Infrastructure & Framework - 500 550Human Capital Management System 1,000 - 525Tobacco Divestment Study and Outreach - - 500Treasury Management - 500 400Windows 10 Planning - - 300Succession Planning - - 260Executive Compensation Project 140 200 200IT Backup/Restoration/Archiving/Disaster Recovery - 4,000 - Data Governance - 600 - Budget Analytics Software - 500 - PeopleSoft Financials eProcurement Module 496 - - Enterprise Content Management Website Accessibility 494 225 - Information Security Risk Metrics - 200 - CalPERS Education Center Replacement - 173 - Talent Management - Learning Mgmt System Upgrade - 110 - Headquarters Building Costs 25,944 30,350 31,295External Management - Base Fees 741,950 748,121 677,468External Management - Performance Fees 591,192 182,605 219,237Health Program 251,560 242,477 235,181CVS Caremark Pharmacy 12,274 12,158 12,158Long Term Care Program - Long Term Care Group, Inc. 20,162 22,822 21,572Supplemental Income Plan - Voya 3,853 3,903 3,899TOTAL EXPENDITURES $ 2,148,945 $ 1,807,600 $ 1,788,500

Trust Fund BalanceIn accordance with the California Constitution, Article XVI, Section 17 “The assets of a public pension or retirement system are trust funds and shall be held for the exclusive purposes of providing benefits to partici-pants in the pension or retirement system and their beneficiaries and defraying reasonable expenses of administering the System ”
Fund condition statements for the CalPERS trust funds are presented below and include beginning balances, revenues, expenditures and ending balances for three years Changes from year to year are described in the footnotes for each fund and are primarily based on membership/enrollment forecasts and investment return estimates The Administrative Expenses identi-fied in each fund displayed as follows are comprised of administrative and investment operating costs, invest-ment external management fees, enterprise project costs, headquarters building costs, and third-party administrator fees, as applicable
Annuitants’ Health Care Coverage Fund (AHCCF) (in Thousands)
Actual 2014-15
Estimate 2015-16
Estimate 2016-17
Beginning Balance $3,889,264 $4,470,554 $5,359,220
REVENUESInvestment Income* (7,453) 327,990 385,648Contributions** 632,844 608,946 614,576
TOTAL REVENUES $625,391 $936,936 $1,000,224
EXPENDITURES
Employer Health Reimbursement Expenses for Retirees 39,766 43,742 48,116
Administrative Expenses 4,335 4,528 5,833
TOTAL EXPENDITURES $41,101 $48,270 $53,949
ENDING BALANCE $4,470,554 $5,359,220 $6,305,495
* 2015-16 and 2016-17 estimates are based on projected return rate
** 2015-16 and 2016-17 estimates are based on percentage of salaries
Public Employees’ Contingency Reserve Fund (CRF) (in Thousands)
Actual 2014-15
Estimate 2015-16
Estimate 2016-17
Beginning Balance $7,933 $8,280 $7,848
REVENUESInvestment Income* 803 838 775Contributions** 26,712 26,656 27,717Retiree Drug Subsidy*** 6,000 4,600 4,600
TOTAL REVENUES $33,515 $32,094 $33,092
EXPENDITURES
Retiree Drug Subsidy Payments 6,000 4,600 4,600
Administrative Expenses 27,168 27,926 28,004
TOTAL EXPENDITURES $33,168 $32,526 $32,604
ENDING BALANCE $8,280 $7,848 $8,336
* 2015-16 and 2016-17 estimates are based on prior year return percentage
** 2015-16 and 2016-17 estimates are based on annual health premiums multiplied by the administrative rate
*** Pass-through subsidy from Centers for Medicare and Medicaid Services; based on eligible enrollees
39

Public Employees’ Health Care Fund (HCF) (in Thousands)
Actual 2014-15
Estimate 2015-16
Estimate 2016-17
Beginning Balance $454,325 $344,443 $361,345
REVENUESInvestment Income* 20,631 21,663 22,748Contributions** 3,919,334 3,790,162 4,091,121
TOTAL REVENUES $3,939,965 $3,811,825 $4,113,869
EXPENDITURES
Benefit Payments** 3,762,938 3,506,311 3,639,852
Administrative Expenses 286,909 288,612 287,945
TOTAL EXPENDITURES $4,049,847 $3,794,923 $3,927,797
ENDING BALANCE $344,443 $361,345 $547,417
* 2015-16 and 2016-17 estimates are based on a 5 percent increase over prior year
** 2015-16 and 2016-17 estimates are based on projected enrollment counts
Judges’ Retirement Fund (JRF) (in Thousands)
Actual 2014-15
Estimate 2015-16
Estimate 2016-17
Beginning Balance $57,705 $41,788 $35,004
REVENUESInvestment Income 90 65 55 Contributions* 186,986 197,675 208,611 Contribution Refunds* (134) (48) (48)
TOTAL REVENUES $186,942 $197,692 $208,618
EXPENDITURES
Pension Benefit Payments** 201,734 203,139 208,162
Administrative Expenses 1,125 1,337 1,767
TOTAL EXPENDITURES $202,859 $204,476 $209,929
ENDING BALANCE $41,788 $35,004 $33,693
* 2015-16 and 2016-17 estimates are based on a rolling three year average
** 2015-16 and 2016-17 estimates are based on projected annual pension benefit payouts
Judges’ Retirement Fund II (JRF II) (in Thousands)
Actual 2014-15
Estimate 2015-16
Estimate 2016-17
Beginning Balance $1,014,295 $1,084,302 $1,237,593
REVENUESInvestment Income (2,410) 75,913 86,662 Contributions* 87,871 88,939 91,621 Contribution Refunds (16) (53) (53)
TOTAL REVENUES $85,445 $164,799 $178,230
EXPENDITURES
Pension Benefit Payments** 14,024 9,877 11,927
Administrative Expenses 1,414 1,631 2,189
TOTAL EXPENDITURES $15,438 $11,508 $14,116
ENDING BALANCE $1,084,302 $1,237,593 $1,401,707
* 2015-16 and 2016-17 estimates are based on a rolling three year average
** 2015-16 and 2016-17 estimates are based on projected annual pension benefit payouts
Public Employees’ Retirement Fund (PERF) (in Thousands)
Actual 2014-15
Estimate 2015-16
Estimate 2016-17
Beginning Balance $300,326,385 $302,892,380 $317,954,209
REVENUESInvestment Income*Contributions**
9,716,616 22,720,025 23,854,32413,563,154 14,097,582 14,631,866
TOTAL REVENUES $23,279,770 $36,817,607 $38,486,190
EXPENDITURES
Pension Benefit Payments 18,922,292 20,310,543 21,800,644
Administrative Expenses 1,791,483 1,445,235 1,424,181
TOTAL EXPENDITURES $20,713,775 $21,755,778 $23,224,825
ENDING BALANCE $302,892,380 $317,954,209 $333,215,574
* 2015-16 and 2016-17 estimates are based on the projected fund balance and actuarial rates
** 2015-16 and 2016-17 estimates are based on the historical trend of annual percentage increases
40

Legislators’ Retirement Fund (LRF) (in Thousands)
Actual 2014-15
Estimate 2015-16
Estimate 2016-17
Beginning Balance $130,495 $121,658 $120,362
REVENUESInvestment Income* (30) 6,996 6,925 Contributions** 695 307 371 Contribution Refunds (1,693) (564) (752)
TOTAL REVENUES ($1,028) $6,739 $6,544
EXPENDITURES
Pension Benefit Payments 7,393 7,506 7,925
Administrative Expenses 416 529 622
TOTAL EXPENDITURES $7,809 $8,035 $8,547
ENDING BALANCE $121,658 $120,362 $118,359
* 2015-16 and 2016-17 estimates assume a 5 75 percent rate of return
** 2015-16 and 2016-17 estimates are based on a rolling three year average
Long-Term Care Fund (LTCF) (in Thousands)
Actual 2014-15
Estimate 2015-16
Estimate 2016-17
Beginning Balance $4,118,576 $4,077,741 $4,283,508
REVENUESInvestment Income* (36,550) 224,920 94,185 Contributions* 272,361 282,426 277,394
TOTAL REVENUES $235,811 $507,346 $371,579
EXPENDITURES
Benefit Payments* 248,550 271,742 260,146
Administrative Expenses 28,096 29,837 30,035
TOTAL EXPENDITURES $276,646 $301,579 $290,181
ENDING BALANCE $4,077,741 $4,283,508 $4,364,906
* 2015-16 estimates are based on preliminary trial balance reports, and 2016-17 estimates are based on prior year averages
Deferred Compensation Fund (DCF) (Includes Public Agency Deferred Compensation Plan (IRC 457) and Supplemental Contribution Plan) (in Thousands)
Actual 2014-15
Estimate 2015-16
Estimate 2016-17
Beginning Balance $1,311,888 $1,474,727 $1,410,575
REVENUESInvestment Income* 40,876 13,980 27,428 Contributions* 131,239 27,832 79,536
TOTAL REVENUES $172,115 $41,812 $106,964
EXPENDITURES
Benefit Payments* 2,888 99,507 49,350
Administrative Expenses 6,388 6,457 6,459
TOTAL EXPENDITURES $9,276 $105,964 $55,809
ENDING BALANCE $1,474,727 $1,410,575 $1,461,730
* 2015-16 estimates are based on preliminary trial balance reports, and 2016-17 estimates are based on prior year averages
Replacement Benefit Custodial Fund (RBF) (in Thousands)
Actual 2014-15
Estimate 2015-16
Estimate 2016-17
Beginning Balance $- $- $-
REVENUESInvestment Income* 299 293 296 Contributions* 10,524 10,148 10,336
TOTAL REVENUES $10,823 $10,441 $10,632
EXPENDITURES
Benefit Payments* 10,816 10,434 10,618
Administrative Expenses 7 7 14
TOTAL EXPENDITURES $10,823 $10,441 $10,632
ENDING BALANCE $- $- $-
* 2015-16 estimates are based on preliminary trial balance reports, and 2016-17 estimates are based on prior year averages
41

Revenues CalPERS has eleven trust funds that provide 100 percent funding of the budget needs for the enterprise and does not incur debt to fund the costs of the system The Board has authority under the California Constitution, Article XVI, Section 17, which states, “the retirement board of a public pension or retirement system shall have plenary authority and fiduciary responsibility for investment of moneys and administration of the System…”
Consolidated Financial Schedule (in thousands)
FY 2014–15 Actual
Expenses
FY 2015–16 Approved
Budget
FY 2016–17 Approved
Budget
Budget to Budget
$ Change increase/
(decrease)
% Change increase/
(decrease)
ADMINISTRATIVE BUDGET BY FUND
Public Employees' Retirement Fund (PERF)
Public Employees' Contingency Reserve Fund (CRF)
Public Employees' Health Care Fund (HCF)
Long-Term Care Fund (LTCF)
Annuitants' Health Care Coverage Fund (AHCCF)
Deferred Compensation Fund (DCF)
Judges' Retirement Fund (JRF)
Judges' Retirement Fund II (JRF II)
Legislators' Retirement Fund (LRF)
Replacement Benefit Custodial Fund (RBF)
$1,791,483
27,168
286,909
28,096
4,335
6,388
1,125
1,414
416
7
$1,445,235
27,926
288,612
29,837
4,528
6,457
1,337
1,631
529
7
$1,424,181
28,004
287,945
30,035
5,833
6,459
1,767
2,189
622
14
($21,054)
78
(666)
197
1,305
2
429
558
93
7
(1.5%)
0.3%
(0.2%)
0.7%
28.8%
0.0%
32.1%
34.2%
17.6%
100.0%
SUBTOTAL
Reimbursements1
$2,147,341
1,604
$1,806,100
1,500
$1,787,050
1,450
($19,050)
(50)
(1.1%)
(3.3%)
CalPERS TOTAL $2,148,945 $1,807,600 $1,788,500 ($19,100) (1.1%)
1 Amounts received by CalPERS for services rendered These reimbursements are actuarial valuations prepared for public agencies that qualify for reimbursement, cost of photocopies/postage related to the Public Records Act requests, annual employer conferences, and administrative assessments for employers’ delinquent payroll
42

CalPERS Revenue Sources and Allocation by Fund
PERF Public Employees’ Retirement Fund
79 7%
HCF Health Care Fund 16 1%CRF Contingency Reserve Fund 1 6%LTCF Long-Term Care Fund 1 7%AHCCF Annuitants’ Health Care
Coverage Fund0 3%
DCF Deferred Compensation Fund (2 Funds)
0 4%
JRF Judges’ Retirement Fund 0 1%JRF II Judges’ Retirement Fund II 0 1%LRF Legislators’ Retirement Fund 0 0%RBF Replacement Benefit
Custodial Fund0 0%
100 0%
The Contingency Reserve Fund is an exception to the above-described authority The mechanism to secure funding for administration of a portion of the health benefit program is through the annual California state budget bill and May budget revision process with the State of California
The eleven trust funds that provide revenue sources for the CalPERS Budget are described as follows:
• Public Employees’ Retirement Fund (PERF) is the main trust fund from which nearly all CalPERS retirement benefits are paid to State of California and other California public agency employees The PERF benefits are funded by member contributions, employer contributions, and investment income
• Public Employees’ Health Care Fund (HCF) accounts for the activities of the CalPERS self-insured health care programs Health premiums are collected from employers and members, and funding is used to directly pay for medical services and pharmaceutical usage The HCF is funded by premium revenues In addition, HCF receives Employer Group Waiver Plan (EGWP) subsidies Under the EGWP, CalPERS contracts with federal prescription drug programs through the Pharmacy Benefit Manager (PBM) as the EGWP administrator, and the PBM manages all federal interaction Investments of the HCF are a non-opera-tional use of reserves until needed for claims
• Public Employees’ Contingency Reserve Fund (CRF) was established to fund administrative costs related to the CalPERS health care programs and to provide a contingency reserve for potential increases in future health care premium rates or health care benefit costs The CRF is funded by administrative fees The administrative fees that are collected are a composite of three items; enrollment, premium rates, and public agency health payments and remittances to contracted health care providers Investments of the CRF include only liquid, short-term securities, as investment balances are used to fund operating cash flows
• Public Employees’ Long-Term Care Fund (LTCF) provides long-term care insurance to participating members and is funded through premium revenues and investment income
• Annuitants Health Care Coverage Fund (AHCCF) is referred to as the California Employers’ Retiree Benefit Trust Fund (CERBTF) It is an Other Post-Employment Benefit (OPEB) fund for the pre-funding by employers of health, dental, and other non-pension benefits promised to employees when they retire Funding to the CERBTF includes employer contributions and investment income
• Deferred Compensation Fund provides CalPERS members with two defined contribution plans to help save for retirement:» The Board is the trustee for public agency partici-
pant assets in the Public Agency Deferred Compensation Plan (Internal Revenue Code [IRC] 457) Funding to the IRC 457 Plan consists of member contributions and investment income The CalPERS Supplemental Income 457 Plan (457 Deferred Compensation Plan) is available to employees of public agencies and school districts within the State of California Plan participation is voluntary to employees of contracting public agencies and school districts Members may contribute up to IRC limits
» The Supplemental Contributions Plan was established effective January 1, 2000 to provide supplemental retirement benefits to State of California employees who are members of CalPERS Program participation is voluntary and consists of member contributions and invest ment income In March 2015, as directed by statute, the State Peace
43

44
Officers’ & Firefighters’ Supplemental Plan (SCP-POFF), an employer-provided benefit for state peace officers and firefighters in certain bargaining units, was terminated Funds remaining in the plan after termination were rolled over into the Supplemental Contributions Plan as pretax SCP-POFF rollover accounts
• Judges’ Retirement Fund (JRF) provides retirement benefits to California Supreme and Appellate Court Justices and Superior Court Judges appointed or elected before November 9, 1994 Funding to the JRF includes employer contributions, member contribu-tions, investment income, and State of California “balancing contributions” pursuant to state statute
• Judges’ Retirement Fund II (JRF II) provides retire-ment benefits to California Supreme and Appellate Court Justices and Superior Court Judges first appointed or elected on or after November 9, 1994 Funding to the JRF II includes employer contributions, member contributions, and investment income
• Legislators’ Retirement Fund (LRF) provides retire-ment benefits to California Legislators elected to officebefore November 7, 1990, and to constitutional,
legislative, and statutory officers elected or appointed prior to January 1, 2013 The Public Employees’ Pension Reform Act of 2013 (PEPRA) closed enroll-ment for new participants to the Legislators’ Retirement Fund The number of LRF members has been declining in the last decade as eligible incumbent Legislators leave office and are replaced by those ineligible to participate in the LRF Actuarially deter-mined contributions will continue to be made by the State of California to supplement the existing assets until all benefit obligations have been fulfilled
• Replacement Benefit Fund (RBF) provides benefits to members of the PERF, LRF, JRF and JRF II whose retirement allowances exceed the Internal Revenue Code Section 415(b) limits IRC Section 415(b) imposes a dollar limit on the annual retirement benefits an individual may receive from a qualified defined benefit pension plan The RBF is funded on a “pay-as-you-go” basis That is, the employer is invoiced for amounts payable to its former employees in the calendar year, and upon receipt of payment by the employers, CalPERS remits the replacement benefit to the retirees
65¢ Investment Earnings
22¢ CalPERS Employers
13¢ CalPERS Members
Source: CalPERS, Income over the last 20 years as of June 2015. Figures are updated following the close of each fiscal year.
Every dollar paid to CalPERS retirees comes from three sources:
CalPERS Pension BuckThe CalPERS Pension Buck illustrates the sources of income that fund public employee pensions Pension fund income over the last 20 years (as of June 2015) shows that investment earnings account for 65 cents of each dollar paid in pensions, 22 cents from employers and 13 cents from employees
Pensions are jointly funded by employer and employee contributions, which are invested so that pension fund
dollars grow over time Workers contribute up to 15 25 percent of their paycheck to help fund their own pensions
CalPERS pension payments generate more than $30 billion of economic activity per year in California, supporting more than 113,000 jobs and generating nearly $800 million in sales and property tax revenue every year

Debt CalPERS has eleven trust funds that provide 100 percent recovery of the costs for the enterprise and does not incur debt to fund the budget There is no borrowed principal and/or related interest payments for any budget year, as the expenditures are initially paid from the Public Employees’ Retirement Fund from the remaining ten funds (as described on pages 43 and 44) that are appropriated by the Board, therefore there are no formally established debt limits The debt limits can be interpreted as being directly correlated with the revenues provided by a cost recovery/cost allocation process, which is performed on a monthly basis, whereby the amounts necessary to appropriately fund the five main budgeting funds are submitted to the Board for approval during the annual and mid-year budget processes
Long Term Financial Plans CalPERS will be embarking on the development of the new five-year Strategic Plan for 2017-22 which will drive budget proposals in future years Due to the anticipated large number of baby-boomer retirees over the next few years, not only will the retirement processing workload increase for the organization, but continued focus on the funded status of the system will be a high priority For the health care program, efforts to identify cost saving programs and measures will continue to be a high priority In the area of information security, the constant and more sophisticated threats to data require continued investment of cyber-security solutions
To offset cost increases described above, the organiza-tion continues to identify cost savings and efficiencies The success of the mylCalPERS Optimization efforts assists in this effort by improving the technological infrastructure and workload processing times Further, as we continue to build a robust in-house investment management group, expensive external manager fees will continue to decrease Process improvement efforts and monitoring of expenses will ensure further opportu-nities for ongoing cost savings
FY 2017-18 Budget ProjectionThe FY 2017-18 Budget Projection will represent the first year of the new five-year 2017-22 Strategic Plan and the 2017-19 Business Plan
The FY 2017-18 Projection estimates a decrease of $14 2 million or 0 8 percent from the FY 2016-17 Approved Budget The estimated administrative operating cost increase of $9 0 million or 2 0 percent represents estimated merit salary increases in personnel services for CalPERS staff and an inflation adjustment of 2 6 percent for operat-ing expenses (based on the estimated U S state and local government implicit deflator provided by the Department of Finance in their 2016-17 Price Letter)
No additional positions are included in the FY 2017-18 Projection The organization is committed to continuing to manage vacancies and redirect positions when appropriate Further, this will give the organization time to review program areas and study their staffing requirements based on a long term view of program area functions
Projections for the Investment External Management Fees are unchanged from the FY 2016-17 Approved Budget as are the Investment Operating Costs These are likely to change, but projections are unavailable Costs of $17 6 million for the multi-year projects reflect those initiatives currently undertaken by the organization There are no anticipated changes to the Headquarters Building Costs and the Third Party Administrator fees
45

FY 2018-19 Budget ProjectionThe FY 2018-19 Projection represents the second year of the new five-year Strategic Plan and assumes CalPERS overall strategic direction will remain the same The FY 2018-19 Projection estimates an increase of $7 9 million or 0 5 percent from the FY 2017-18 Projection, and includes the following:
• Increase of $11 8 million or 3 4 percent for salary and benefit adjustments for existing staff
• Increase of $3 1 million or 2 6 percent in administrative operating costs based on the current CPI figure, and adjustment of ongoing project costs moved to the operating budget
• Decrease of $7 8 million or 44 percent in multi-year project costs
• Increase of $0 8 million or 2 6 percent in Headquarters Building Costs due to inflation as reflected in the cost of goods purchased and annual salary increases for engineers
• No changes to the FY 2018-19 Projection for Third-Party Administrator Fees; while it is likely to change, projections are unavailable
• No changes to the FY 2018-19 Projection for the Investment External Management Fees and the Investment Operating Costs; while both are likely to change, projections are unavailable
Total Budget Forecast/Projection (in millions)
$2,005.1
$1600
$1700
$1800
$1900
$2000
FY 2018-19Projection
FY 2017-18Projection
FY 2016-17Approved
Budget
FY 2015-16Forecast
FY 2015-16Approved
Budget
FY 2014-15Actual*
FY 2013-14Actual*
$1,787.2 $1,774.3$2,152.3
$1,807.6 $1,788.5 $1,782.2
*In FY 2013-14 and FY 2014-15, the actual Investment External Management fees exceeded the budget due to higher than anticipated investment performance.
$2100
$2200
$2300
46

Capital Expenditures and Enterprise Projects
Capital Expenditures Capital expenditures are incurred when capital assets purchased exceed an initial individual cost of $5,000 or more, or $1 million or more for intangible assets, and have an estimated useful life in excess of one year
Enterprise Projects Capital expenditures are budgeted and captured in the Enterprise Projects Fund The FY 2016-17 Enterprise Project Costs of $41 4 million represent an increase of $3 9 million or 10 3 percent from the FY 2015-16 Approved Budget of $37 5 million driven by increases in system security costs, AVS redesign, system infrastruc-ture modernization, and tobacco divestment study (totaling $8 2 million) offset by the disaster recovery one-time cost decrease of $4 0 million Compared to the FY 2015-16 Forecast of $35 6 million, the FY 2016-17 Approved Budget represents an increase of $5 8 million or 16 2 percent
The concentration of projects for FY 2016-17 are centered around the my|CalPERS business optimization component, reengineering of the Actuarial Valuation System, continued reinforcement efforts toward the Security Roadmap Project, Business Intelligence, and Enterprise Compliance initiatives
$0
$10
$20
$30
$40
$50
$60
$70
$80
$90
$100
FY2015-16
FY2014-15
FY2013-14
FY2012-13
$32.7
$33.3
$22.9
$24.9
$35.6
$37.5
$83.6
$84.6
Budgeted Amount
Actual Expenditures
Enterprise Project Budget and Expenditure Trend (in millions)
Impact of Capital Expenditures in Enterprise Projects Budget on Administrative Operating BudgetThe one-time and ongoing costs associated with capital expenditures in the Enterprise Projects Fund are analyzed for their return on investment (ROI), savings to the organization, improved business processes leveraged through technology, and cost-benefit analysis to determine if the project is a prudent investment of fund resources
Anticipated operating costs associated with significant non-recurring capital investments are addressed during the operational budget planning phase as part of the process to build the annual budget Forecasting helps determine the expected operational needs to migrate costs from the Enterprise Projects Fund to the Total Operating Costs Fund
Potential ongoing operational needs are assessed when a Formal Budget Request proposes a new project and reassessed annually when a new Formal Budget Request is submitted
Projects previously budgeted through the Enterprise Projects Fund are re-evaluated annually for readjustments of anticipated maintenance or staffing costs related to move in scope from a project cost to an ongoing operational cost
The ongoing costs to maintain these projects are identified in life cycle costs
47

Enterprise Projects (in thousands)
FY 2015–16 Approved
Budget
FY 2016–17 Approved
Budget
FY 2017–18 Projection
Budget to Budget$ Change increase/
(decrease)
% Change increase/
(decrease)
CURRENT PROJECTS
[1] my|CalPERS Business Optimization $23,000 $23,470 $10,000 $470 2.0%
[2] Security Roadmap 4,000 5,179 1,340 1,179 29.5%
[3] Actuarial Valuation System Redesign 2,500 4,797 5,000 2,297 91.9%
[4] Infrastructure Modernization - 4,200 - 4,200 -
[5] Business Intelligence 1,000 1,000 - - 0.0%
[6] Compliance Program Infrastructure, Framework, & eGRC 500 550 500 50 10.0%
[7] Treasury Management 500 400 - (100) (20.0%)
[8] Tobacco Divestment Study and Outreach - 500 - 500 -
[9] Miscellaneous Projects1 200 1,285 763 1,085 542.5%
PRIOR YEAR PROJECTS
IT Backup/Restoration/Archiving/Disaster Recovery 4,000 - - (4,000) (100.0%)
Data Governance 600 - - (600) (100.0%)
Budget Analytics Software 500 - - (500) (100.0%)
Enterprise Content Management Website Accessibility 225 - - (225) (100.0%)
Miscellaneous Projects2 483 - - (483) (100.0%)
TOTAL OF ENTERPRISE PROJECTS $37,508 $41,382 $17,603 $3,874 10.3%
1 Includes PeopleSoft HCM 9 2 Upgrade, Windows 10 Planning, Succession Planning, and Executive Compensation Project
2 Includes Information Security Risk Metrics, CalPERS Education Center Replacement, and Talent Management-Learning Management System Upgrade
Capital Expenditure Projects
[1] my|CalPERS Business OptimizationIn January 2015, an effort was jointly launched by both theprogram areas and the Information Technology ServicesBranch to leverage the my|CalPERS system to realize increasedoperational efficiencies across the CalPERS organization Theeffort outlined initiatives to increase performance and function-ality in four major areas: improved customer service, reducedfinancial and business risk, increased operational performance,and streamlined business processes In its inaugural year of athree-year program, twenty-one optimization initiatives wereimplemented Among the most significant were the
simplification of Medicare Service Payers, Disability Retirement Package automation, and comprehensive reconciliation of system, financial, and actuarial activity Additionally, internal staff workflows were redesigned and streamlined to better serve our members and partners Funding for the next fiscal year will support further optimiza-tions for maturing retirement services, such as: expanded final compensation automation, simplification of PEPRA program support, process improvements in the service credit purchase program, enhanced State enrollments, interest payment functionality, as well as nearly fifteen additional optimization initiatives The Optimization project is scheduled to be completed by June of 2018
Project Life Cycle Costs – my|CalPERS Business Optimization
Project Budget
Operational Budget Total
FY 2014-15 Actuals $17,368,588 - $17,368,588
FY 2015-16 Forecast 23,000,000 - 23,000,000
FY 2016-17 Approved Budget 23,470,000 - 23,470,000
FY 2017-18 Projection 10,000,000 - 10,000,000
TOTAL $73,838,588 $- $73,838,588
48

[2] Security RoadmapThe Security Roadmap Project (SRP) is a multi-year effort that will ensure CalPERS technology and member data will remain secure against constantly changing threats in the environment For FY 2016-17, efforts will be directed towards the Enhanced Enterprise Identity System (EIS), Security Information and Event Management (SIEM), Database Encryption, and Two-Factor Authentication
• EIS will focus on user password management, tighter controls around sensitive administrative accounts, and enhancing the end-user experience by consolidating usernames and passwords needed for cloud services
• SIEM will proactively alert CalPERS of possible security breaches and fraudulent activity
• Database Encryption will assess and implement multiple methods of personal identification and health-related information data encryption to reduce the risk of data loss
• Two-Factor Authentication is a type of technology architecture that reduces possible security breaches Currently, CalPERS utilizes Two-Factor Authentication for remote access This effort will deploy the technology to additional critical systems
Three of the initiatives will be completed in FY 2016-17 The EIS project will continue in FY 2017-18
Project Life Cycle Costs – Security Roadmap
Project Budget
Operational Budget Total
FY 2013-14 Actuals $4,995,614 - $4,995,614
FY 2014-15 Actuals 2,237,195 - 2,237,195
FY 2015-16 Forecast 3,999,320 - 3,999,320
FY 2016-17 Approved Budget 5,179,410 420,000 5,599,410
FY 2017-18 Projection 1,340,000 420,000 1,760,000
TOTAL $17,751,539 $840,000 $18,591,539
49
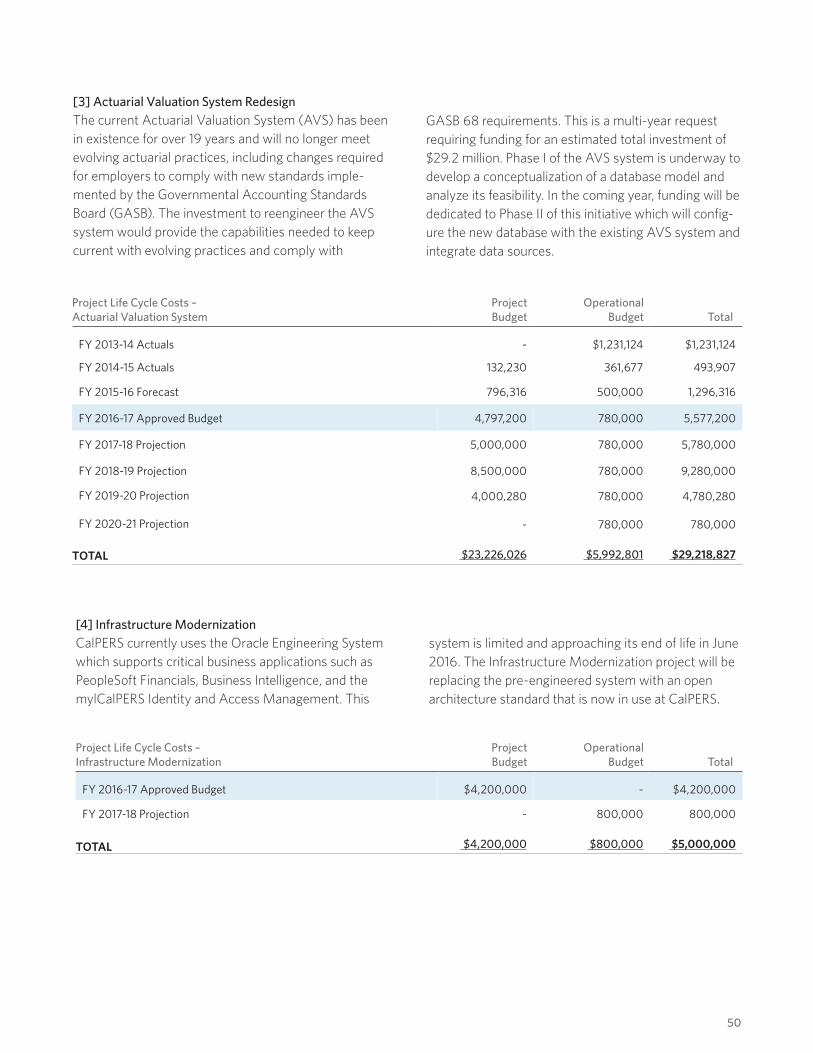
[3] Actuarial Valuation System RedesignThe current Actuarial Valuation System (AVS) has been in existence for over 19 years and will no longer meet evolving actuarial practices, including changes required for employers to comply with new standards imple-mented by the Governmental Accounting Standards Board (GASB) The investment to reengineer the AVS system would provide the capabilities needed to keep current with evolving practices and comply with
GASB 68 requirements This is a multi-year request requiring funding for an estimated total investment of $29 2 million Phase I of the AVS system is underway to develop a conceptualization of a database model and analyze its feasibility In the coming year, funding will be dedicated to Phase II of this initiative which will config-ure the new database with the existing AVS system and integrate data sources
Project Life Cycle Costs – Actuarial Valuation System
Project Budget
Operational Budget Total
FY 2013-14 Actuals - $1,231,124 $1,231,124
FY 2014-15 Actuals 132,230 361,677 493,907
FY 2015-16 Forecast 796,316 500,000 1,296,316
FY 2016-17 Approved Budget 4,797,200 780,000 5,577,200
FY 2017-18 Projection 5,000,000 780,000 5,780,000
FY 2018-19 Projection 8,500,000 780,000 9,280,000
FY 2019-20 Projection 4,000,280 780,000 4,780,280
FY 2020-21 Projection - 780,000 780,000
TOTAL $23,226,026 $5,992,801 $29,218,827
[4] Infrastructure ModernizationCalPERS currently uses the Oracle Engineering System which supports critical business applications such as PeopleSoft Financials, Business Intelligence, and the mylCalPERS Identity and Access Management This
system is limited and approaching its end of life in June 2016 The Infrastructure Modernization project will be replacing the pre-engineered system with an open architecture standard that is now in use at CalPERS
Project Life Cycle Costs – Infrastructure Modernization
Project Budget
Operational Budget Total
FY 2016-17 Approved Budget $4,200,000 - $4,200,000
FY 2017-18 Projection - 800,000 800,000
TOTAL $4,200,000 $800,000 $5,000,000
50

[5] Business IntelligenceThe Business Intelligence (BI) project is an ongoing multi-year effort that ensures CalPERS technology and information supports an environment where the business can make fact-based decisions using accurate and timely data and information To date, communica-tion and project management action plans have been developed, deliverables for Human Resources, the Financial Office, Audit Services, and Public Affairs have been completed, and the “CalPERS 2014 Retirement Trend Report” and “CalPERS Economic Impacts in California” report created using business intelligence have been presented to the Board
The activities planned for FY 2016-17 include creation of a BI product depository and development of a request for information (RFI) to understand retirement data warehouse and analytics market environment, as well as more self-service BI and reporting capabilities When the project is complete, the business benefits will be:
• Availability of timely and relevant data • Accurate data to support informed decisions • Ability of the business to access data directly
Project Life Cycle Costs – Business Intelligence
Project Budget
Operational Budget Total
FY 2013-14 Actuals $2,454,291 - $2,454,291
FY 2014-15 Actuals 1,240,223 - 1,240,223
FY 2015-16 Forecast 889,662 - 889,662
FY 2016-17 Approved Budget 1,000,000 - 1,000,000
FY 2017-18 Projection - 1,000,000 1,000,000
TOTAL $5,584,177 $1,000,000 $6,584,177
[6] Compliance Program Infrastructure, Framework, and eGRCThis is the second year of a five-year plan to mature compliance capabilities within CalPERS The project roles and responsibilities were defined and socialized with management, controls for investment trading were identified, and compliance protocols and educational programs are in development In the coming year, protocols and processes for operational control, policy management, and reporting standards will continue to be developed in conjunction with compliance
principles and culture Technology consulting services are also planned in order to assist with development of compliance components in the CalPERS electronic Governance, Risk, Compliance (eGRC) system The end goal for the five-year plan will be to roll out the protocols and processes to all program areas through-out the enterprise and develop a process for ongoing refinement as the project transitions into maintenance and operations
Project Life Cycle Costs - Compliance Program Infrastructure, Framework, and eGRC
Project Budget
Operational Budget Total
FY 2015-16 Forecast $500,000 - $500,000
FY 2016-17 Approved Budget 550,000 - 550,000
FY 2017-18 Projection 500,000 - 500,000
FY 2018-19 Projection 500,000 - 500,000
FY 2019-20 Projection 500,000 - 500,000
TOTAL $2,550,000 - $2,550,000
51

[7] Treasury Management Funding is proposed for consultants and software to implement the Treasury Management System that aggregates and centralizes treasury and cash management functions performed by the Financial Office and the Investment Office This software is essential to ensure integrity of the cash forecasting, streamline cash management functions, and allow for robust reporting
This new system would eliminate the use of over 2,000 spreadsheets annually allowing for increased focus on cash management analysis and tax workload
Project Life Cycle Costs - Treasury Management
Project Budget
Operational Budget Total
FY 2015-16 Forecast $500,000 - $500,000
FY 2016-17 Approved Budget 400,000 - 400,000
TOTAL $900,000 - $900,000
Project Life Cycle Costs - Tobacco Divestment Study and Outreach
Project Budget
Operational Budget Total
FY 2016-17 Approved Budget $500,000 - $500,000
TOTAL $500,000 - $500,000
[8] Tobacco Divestment Study and OutreachFunding to perform further study and outreach on the divestment of tobacco
52

Miscellaneous Projects
PeopleSoft HCM 9 .2 UpgradeThe Human Resources Division in coordination with Information Technology is requesting funding to upgrade the current PeopleSoft Human Capital Management (HCM) system from version 9 1 to 9 2 The upgraded version of HCM supports automation strategies to recruit, develop, and empower the CalPERSworkforce Upgrading to version 9 2 will provide several benefits including Oracle’s Premier Support services, increased functionality, a reduction in system customi-zations, and access to a new Product Update Manager that will assist with system patches The need for the upgrade is urgent as Oracle Extended Support for the current HCM system version ends January 2018 Extended Support includes system troubleshooting, bug fixes, and system patching
Windows 10 PlanningFunds are required to plan for the migration to the Windows 10 Operating System and to upgrade to Office ProPlus for the CalPERS enterprise Windows 10 offers a more secured desktop while allowing for collaboration and mobile computing
Succession PlanningThe Human Resources Division is requesting funding to create and maintain the necessary structure for a Succession Planning Program in line with the CalPERS strategic and business plans Due to the large segment of the CalPERS workforce nearing retirement age, it is recommended that CalPERS have a succession plan in place Approval of this request will better position CalPERS to establish an internal talent pipeline from which qualified candidates can be sourced to fill key organizational positions as they become vacant
Executive Compensation ProjectThe Human Resources Division requests funding to continue a comprehensive review of the Executive Compensation Program’s components and propose modifications to simplify the program, increase transparency, and ensure alignment with CalPERS goals and strategies In earlier stages of the project, an external vendor was engaged to administer a biennial salary survey In the coming year, external consultants will advise on improvements to the existing compensation program structure and design, schedules and benchmarks for investment executives’ annual performance awards, and the compensation for delegated executive staff
Project Life Cycle Costs - Miscellaneous Projects
Project Budget
Operational Budget Total
2014-15 Actuals $139,580 – $139,580
2015-16 Forecast 133,000 – 133,000
2016-17 Approved Budget 1,285,000 – 1,285,000
2017-18 Projection 763,000 – 763,000
TOTAL $2,320,580 – $2,320,580
53

Department Information
Position Summary FY 2016–17 Positions by Branch
FY 2015–16 Authorized
Positions (as of 1/31/16)
FY 2016–17 Approved Positions
Change in Positions % Change
Division Vacant
Positions
Branch Vacant
Positions
ACTUARIAL OFFICE 58.0 59.0 1.0 1.7% 5.0
ACTO 5.0
Long-Term Care Actuary Support 1.0
BENEFIT PROGRAM POLICY & PLANNING 158.0 159.0 1.0 0.6% 13.0
HHPB 1.0
Clinical Pharmacy Oversight Support 1.0
COMMUNICATIONS & STAKEHOLDER RELATIONS 59.0 61.0 2.0 3.4% 4.0
PAOF 4.0
Increased Electronic Communication Workload 2.0
CUSTOMER SERVICES & SUPPORT 905.5 992.5 87.0 9.6% 34.0
BNSD 14.0
Increased Death Benefit Processing Workload 7.0
BASS 1.0
Improve Compliance and Reduce Operational Risk 2.0
EAMD 4.0
Public Agency Audit Review Workload 2.0
Address SCO Review on Active Member Accounts 5.0
Increased GASB 68 Workload 3.0
CSOD 6.0
Call Center Staffing - Convert Temporary Staff to Authorized Positions
68.0
EXECUTIVE OFFICE 18.0 18.0 0.0 0.0% 1.0
FINANCIAL OFFICE 217.0 219.0 2.0 0.9% 19.0
ECOM 4.0
Increased Enterprise Compliance Workload 2.0
Table continues next page »
54

FY 2016–17 Positions by Branch continued
FY 2015–16 Authorized
Positions (as of 1/31/16)
FY 2016–17 Approved Positions
Change in Positions % Change
Division Vacant
Positions
Branch Vacant
Positions
GENERAL COUNSEL 137.0 137.0 0.0 0.0% 14.0
INVESTMENT OFFICE 335.0 346.0 11.0 3.3% 32.0
INVO 32.0
New Associate Investment Manager Positions 9.0
Opportunistic Investment Program 2.0
OPERATIONS & TECHNOLOGY 877.5 880.5 3.0 0.3% 62.0
OSSD 3.0
Improve Compliance and Reduce Operational Risk 2.0
HRSD 7.0
Increased Succession Planning & Executive Development
1.0
TOTAL 2,765.0 2,872.0 107.0 3.9% 81.0 184.0
Vacancy % to Total Authorized Positions 2.9% 6.7%
55

Salaries & Wages The $340 8 milllion represents a $5 5 million net increase (1 6 percent) over the FY 2015-16 Approved Budget of $335 3 million, as follows:
• Increase of $5 9 million for 39 0 new positions • Increase of $2 4 million for anticipated merit salary
adjustments• Decrease of $1 8 million for temporary staffing
and overtime reductions• Decrease of $1 0 million for the delayed hiring
of health-funded positions
To recognize the impact of vacancies on the cost of personnel services, an overall vacancy savings target of 5 0 percent has been applied, thus reducing costs by $17 2 million, from $358 0 million to a revised net cost of $340 8 million The current year-to-date vacancy rate is 6 7 percent It is anticipated that the vacancy rate will decline, as each division continues to manage their existing vacancies and redirects or fills positions as part of their workforce planning
The conversion of 68 0 temporary limited-term positions to permanent authorized positions in the Customer Contact Center is cost neutral and is reflected as a shift of $2 3 million from the Temporary Help to Salaries and Wages line items in the budget This conversion is a workforce planning strategy to retain these critical front-line representatives that service our customers directly
The request for 107 0 new authorized positions (including the cost neutral conversion of 68 0 temporary limited-term appointments to permanent positions) at a total cost of $5 9 million (salaries $4 2 million and benefits $1 7 million), resulted from an in-depth look at each business area’s needs The vacancy rate for divisions requesting positions is 5 9 percent Staffing requests address new workload functionality and several key factors to further advance the strategic objectives of the organization The 107 0 new author-ized positions are summarized below and details by organizational unit are then provided
Personnel Services Cost Trend (in millions)
$0
$100
$200
$300
$400
FY2017-18
Projection
FY2016-17
ApprovedBudget
FY2015-16Forecast
FY2015-16
ApprovedBudget
FY2014-15Actual
FY2013-14Actual
$278.9
$335.3 $346.4
$300.0$340.8
$318.3
$500
FY 2016-17 New Positions
New Workload Positions (in millions)
Enterprise Compliance 6.0 $0.6
Opportunistic Investment Program 2.0 1.3
Succession Planning 1.0 0.2
9 .0 $2 .1
Increased Workload
Associate Investment Managers 9.0 $1.9
Audit Resolution 7.0 0.7
Death Benefit Processing 7.0 0.5
GASB 68 3.0 0.3
Communication and Outreach 2.0 0.2
Pharmacy Operations 1.0 0.1
Long-Term Care Actuarial Assistant 1.0 0.1
30 .0 $3 .8
Temporary Limited-Term to Permanent Positions Conversion (cost neutral)
Customer Contact Center 68.0 $0
TOTAL NEW POSITIONS 107.0 $5.9
56

Actuarial Office [$104,000 – 1 PY]Due to the insourcing and enhancement of the actuarial work on the Long-Term Care Program, a new position is proposed to assist with verifying accuracy of premiums in the system, creating the assumptions for the new Principles Based Valuation model, and performing product pricing rate verifications and analysis
Benefit Program Policy & Planning [$119,000 – 1 PY]Due to the increase in the number of members whose pharmacy benefits are managed by CalPERS (from 358,000 to 462,000), this new position will handle day-to-day clinical operations support, member issues, and appeals This additional position will support the continued effort to reduce pharmacy benefit costs with a particular focus on high-cost specialty drugs and new expensive pipeline brand drugs
Communications and Stakeholder Relations [$205,000 – 2 PYs]These positions are proposed to address increases in core workload relating to (a) electronic communications strategies, (b) sales and outreach strategies, and (c) expanded communication support for new CalPERS Business Plan initiatives These new positions will work to maintain service levels while providing support to the enterprise to address Strategic and Business Plan objectives
Customer Service and Support [$1,679,000 – 87 PYs]To address the additional workload due to (a) the increase in the number of member death cases, (b) audit findings generated by increased Public Agency Audit Reviews (PAAR), and the State Controller’s Office (SCO) Report on active member compensation, (c) new workload created by GASB 68, (d) the implementation of a compliance team in the Customer Services and Support branch, and (e) the conversion of temporary limited-term staff to permanent staff in the Customer Contact Center (CCC), 87 0 positions are proposed
• Benefits Services Division [7 .0]—To address the additional workload due to an increase in the number of member death cases in the CalPERS pension
system If this workload is not addressed in a timely manner, interest must be paid to the beneficiaries of these accounts Approval of these resources will result in a reduction in interest paid on delayed death benefit payments and reduce the need for overtime
• PAAR & SCO [7 .0]—To address increased retire-ment benefit audit findings requiring resolution and to comply with the Board’s request that audit findings be resolved within twelve months, an additional 7 0 positions are needed in these areas CSS had previously received 7 0 positions in the pre-retirement area toward the PAAR effort since FY 2011-12, but 2 0 additional positions are needed as the number of audits have increased and become more complex to resolve An additional 5 0 posi-tions are needed to address the findings from an SCO audit of CalPERS processes related to compen-sation review, retirement analysis, and the continued avoidance of pension spiking
• GASB 68 workload [3 .0]—To dedicate resources to GASB 68 workload which includes addressing inquiries from employers regarding the valuations provided in GASB 68 statements
• CSS Compliance Team [2 .0]—To support and strengthen the Board-adopted CalPERS 2015-17 Enterprise Compliance Program, these resources will be embedded in the CSS branch of the organization to expand on protocols and processes for operational control, policy management, and reporting standards It is anticipated that this embedded compliance effort will be continued in future years for the remaining organizational units
• Customer Service and Outreach Division (CSOD) [68 .0]—To convert 68 0 temporary limited-term positions to permanent authorized positions to support ongoing core workload This will enable the CCC to meet the CalPERS-established service levels for call wait times and electronic inquiry responses In 2011, additional temporary positions were provided to the CCC to meet increased call volumes associated with the launch of mylCalPERS In early 2013, the Contact Center Operational Efficiencies effort was initiated to ensure resources, processes, and technolo-gies were aligned to produce optimum performance, and a staffing analysis was performed to determine the level of phone agents needed to meet service level
57

targets Operational improvements were identified and a 15-month Action Plan was developed It was also determined that the CCC historically had not been staffed according to industry standards to meet the service level targets The temporary staff and operational efficiencies gained from the completion of the Action Plan allowed the CCC to transform and meet service levels Cost Effectiveness Measurement ratings, as they pertain to customer service levels, are now above the median of our peer group Of the original temporary positions, nearly half have been eliminated and 70 0 remain Based on the staffing analysis mentioned above, it has been deter-mined that 68 0 of those should be converted to perma-nent status to meet the current service level targets As additional operational efficiencies are rolled out, we are confident the remaining 2 0 temporary positions will be eliminated Converting to permanent positions will eliminate the significant challenges related to hiring limited-term employees such as attracting and retaining qualified candidates Costs for recruiting and training are higher due to the turnover The increased turnover results in less experienced staff on the phones, which in turn causes an increase in overall call handle times and call wait times
Financial Office [$243,000 – 2 PYs] To continue to build and mature the compliance oversight function, these positions will continue to mitigate signifi-cant and potential risks to CalPERS This will be accom-plished through implementation of a risk-based compliance program and protocols across program areas The posi-tions will continue to enhance the compliance culture in CalPERS by providing awareness through education and expanding reporting and disclosure processes
Investment Office [$3,230,000 – 11 PYs]To address the challenges in recruiting and retaining staff with the full complement of skills and functions necessary to effectively manage a highly complex investment portfolio, in April 2015, CalPERS was successful in obtain-ing approval for a new Associate Investment Manager (AIM) classification The Investment Office (INVO) is requesting 9 0 new AIM positions in addition to upgrading 9 0 existing Investment Officer III positions to AIMs These positions will be allocated across all asset classes and business groups and will (a) provide key investment
management and technical expertise necessary to meet investment performance and financial management objectives, (b) effectively manage operational and investment risk, and (c) provide opportunities for staff development and improved retention
To continue INVO’s 2020 Vision around reducing costs and testing new business models within the private asset classes, 2 0 positions are proposed to leverage the existing Opportunistic Investment program The program enables INVO staff to undertake investment strategies that do not cleanly fit into one of the existing four asset classes Currently, CalPERS undertakes these investments primarily through external managers in the private equity program It is expected that this Opportunistic Investment program would help begin reducing dependence on external private equity managers, reducing management fees while taking advantage of CalPERS long term time horizon and investment capacity
Operations [$325,000 – 3 PYs]To address new workload to operationalize a compli-ance team within the Operations & Technology Branch, expand the Succession Planning and Executive Development Program for the enterprise, and begin development of an Emerging Leader Program, 3 0 positions are proposed
• OPT Compliance Team [2 .0]—To support and strengthen the Board-adopted CalPERS 2015-17 Enterprise Compliance Program, these resources will be embedded in the Operations Support Services Division to expand on protocols and processes for operational control, policy management, and reporting standards It is anticipated that this embedded compliance effort will be pushed out to additional organizational units
• Succession Planning and Executive Development [1 .0]—To develop and retain executive and senior leadership, this position will (a) manage and adminis-ter the expansion of the Succession Planning Program designed to more systematically onboard new executives and senior leaders, and (b) continue to deliver a Board Education Program
58

Position History GrowthOver the three-year period through FY 2016-17, authorized positions have grown from 2,696 at the end of FY 2013-14 to 2,872; an increase of 176 positions, or 6 5 percent
2200
2400
2600
2800
FY 2016-17FY 2015-16FY 2014-15
+3.9%
+1.4%+1.2%2,872
2,7652,727
2900
3000
Position History Growth
Three-Year History of Position Growth
Position Increase Per Fiscal Year – by Branch
Annual Position Changes Three-Year% Increase to
FY 2016–17 Position Total
FY 2016–17 Total
PositionsThree-Year
TotalFY 2014–15 FY 2015–16 FY 2016–17
Actuarial Office 0.0 2.0 1.0 3 .0 59 .0 5 .4%Benefit Programs Policy and Planning 2.0 3.0 1.0 6 .0 158 .0 3 .9%Communications &
Stakeholder Relations 3.0 0.0 2.0 5 .0 61 .0 8 .9%
Customer Services & Support 5.0 15.0 87.0 107 .0 994 .5 12 .1%Executive Office 0.0 0.0 0.0 0 .0 18 .0 0 .0%Financial Office 7.0 12.0 2.0 21 .0 219 .0 10 .6%General Counsel 3.0 5.0 0.0 8 .0 137 .0 6 .2%Investment Office 7.0 0.0 11.0 18 .0 346 .0 5 .5%Operations &Technology 4.0 1.0 3.0 8 .0 879 .5 0 .9%
CalPERS TOTAL POSITION GROWTH 31.0 38.0 107.0 176.0 2,872.0 6.5%
59

Performance Measures Strategic performance measures build a framework that enables CalPERS to evaluate the organization’s progress in meeting the goals of our Strategic Plan, and provide the linkage from business strategy to execution
The CalPERS Board of Administration approved the CalPERS 2012-17 Strategic Plan in August 2012 To assist the Board in evaluating the success of the Plan, an initial set of Strategic Measures was developed and presented as part of a larger effort to support the use of enterprise-wide measurements to guide the organization The Strategic Measures Project continues to use an iterative approach to develop the measures
To ensure the strategic value of this long-term effort, the following steps are underway across the enterprise to build out the suite of strategic measures:
• Analyze and validate available data to ensure the integrity of the information being captured
• Standardize the level and frequency in which information is reported from each program area to correctly align the interdependencies of the measures and minimize redundancies
• Ensure the effectiveness of the technological tools being used for the capture and display of each measure
The organization has continued to develop and evaluate the corporate performance measures listed on the following page Over the past year, measure-ments have begun to be captured and analyzed Some are still in process so data is not yet available However, data for seven performance measures that was not available at this time last year have been updated in the following pages
• Annualized excess investment returns relative to Actuarial Rate of Return Assumptions
• Annualized excess investment returns relative to Policy Benchmark
• Net value added relative to an appropriate peer universe median return adjusted for composition of asset allocation and after expenses
• Affordability of health benefits as measured by the percentage of total average costs for covered benefits that a health plan will cover
• Percentage of benefit payments issued to our custom-ers within established service levels
• Percentage of legislative bills enacted or defeated consistent with positions taken by the Board (not including neutral positions)
• CalPERS perception in the media • CalPERS perception among stakeholders
60

Corporate Performance Measures for each Strategic Goal
Goal A: Improve long-term pension and health benefit sustainability
PENSION:
A1 Annualized excess investment returns relative to Actuarial Rate of Return AssumptionsA2 Annualized excess investment returns relative to Policy BenchmarkA3 Net value added relative to an appropriate peer universe median return adjusted for composition of asset
allocation and after expensesA4 Funded status
HEALTH:
A5 Quality of health care provided as measured by observed ratio of all-cause readmissions compared to what would be expected
A6 Access to health care as measured by the percent of CalPERS health beneficiaries reporting receipt of routine health care when needed, relative to benchmark data
A7 Affordability of health benefits as measured by the percentage of total average costs for covered benefits that a health plan will cover
A8 Wellness of our membership as measured by the percentage of members who smoke, have diabetes, or are obese, compared to state and national data
Goal B: Cultivate a high-performing, risk-intelligent, and innovative organization
EXTERNAL:
B1 Percentage of benefit payments issued to our customers within established service levels B2 Customer satisfaction with CalPERS services as measured by surveys and other feedback methods
INTERNAL:
B3 Employee turnover B4 Employee assessment of CalPERS Organizational Health
Goal C: Engage in state and national policy development to enhance the long-term sustainability and effectiveness of our programs
C1 Percentage of legislative bills enacted or defeated consistent with positions taken by the Board (not including neutral positions)
C2 CalPERS perception in the mediaC3 CalPERS perception among stakeholders
61
The following are examples of some of our key performance measures:
A1) Measure: Annualized excess investment returns relative to Actuarial Rate of Return Assumptions.
This measure provides a method to evaluate the ability to achieve superior investment performance relative to relevant targets Over the longer term, this measure specifically targets the organization’s ability to achieve the actuarial rate of return assumption over a full business cycle, thus capturing long-term capital market assumptions This measure is the most important in terms of overall organizational health and has a direct impact on employer contribution rates and the ability to sustain beneficiary payments
Analysis: The annualized 10-year return underper-formed by 237 basis points (bps) relative to the actuarial rate of return due primarily to the poor FY 2008-09 market environment and resulting returns and current year underperformance Current challenges lay in the actual market opportunity set and CalPERS’ ability to meet or exceed the actuarial rate of return Extraordinarily low-interest rates, which are designed to help the global economic activity recover from the 2009 market crash have resulted in reduced expected returns for Global Fixed Income assets, in particular This is now impacting longer-term returns, including the 10-Year horizon
Annualized Excess Return vs . Actuarial Rate of Return
Type of ReturnReturn Period 2006 2007 2008 2009 2010 2011 2012 2013 2014
2015 June
2015 Dec .
Excess Return (above/ below 7.5%)
1 year 4.2% 11.1% -10.6% -31.3% 3.4% 13.0% -6.7% 5.0% 10.9% -5.1% -7.6%
3 year 5.8% 6.5% 1.2% -11.8% -14.0% -6.9% 2.9% 3.6% 2.9% 3.4% -0.2%
5 year -0.4% 4.8% 3.3% -5.7% -5.9% -4.3% -7.6% -4.4% 5.0% 3.2% -0.3%
10 year 1.3% 1.1% -1.1% -5.1% -5.1% -2.4% -1.6% -0.5% -0.3% -1.3% -2.4%
June Dec
-40.0%
10.0%
20.0%
0.0%
-10.0%
-20.0%
-30.0%
2006 2007 2008 2009 2010 2011
Year Ending
2012 2013 2014 2015 2015
1YR 3YR 5YR 10YR Target
62

A2) Measure: Annualized excess investment returns relative to Policy Benchmark.
This measure provides a method to evaluate the ability to achieve superior investment performance relative to relevant targets, and targets the effectiveness in meeting the objective of achieving superior investment returns when compared against the policy benchmark
Analysis: The 1-year return for the total fund is over-performing by 54 bps relative to the policy benchmark, and the 5-Year return outperformed by 15 bps relative to the policy benchmark The 10-Year return underper-formed by 106 bps relative to the policy benchmark This is primarily due to the underperformance of the real estate portfolio during the financial crisis from 2008-2010
Annualized Excess Return vs . Policy Benchmark
Type of ReturnReturn Period 2006 2007 2008 2009 2010 2011 2012 2013 2014
2015 June
2015 Dec .
Excess Return (above/below the benchmark)
1 year 0.9% 1.2% -0.9% -6.5% -4.0% 0.6% -0.6% 1.5% 0.4% -0.1% 0.5%
3 year 1.0% 1.0% 0.3% -2.6% -4.1% -3.9% -1.4% 0.5% 0.4% 0.6% 0.5%
5 year 0.6% 0.8% 0.6% -1.3% -2.2% -2.3% -2.6% -2.2% -0.4% 0.3% 0.2%
10 year 0.7% 0.7% 0.5% -0.3% -0.8% -0.9% -1.0% -0.8% -0.9% -1.0% -1.0%
June Dec
-8.0%
2.0%
0.0%
-2.0%
-4.0%
-6.0%
2006 2007 2008 2009 2010 2011 2012 2013 2014 2015 2015
1YR 3YR 5YR 10YR Target
Year Ending
63

A3) Measure: Net value added relative to an appropri-ate peer universe median return adjusted for composi-tion of asset allocation and after expenses.
This measure reflects net value added relative to an appropriate peer universe median return adjusted for composition of asset allocation and after expenses The desired outcome is to appear in the upper left quadrant, indicating we are low cost and high value-add relative to our peer universe
Analysis: While we are in the slight negative 5-Year net value add, we have improved versus the 2013 report year results of -1 9 percent The desired outcome is to be low-cost and high value-add relative to our peer universe Actions we are taking to improve our standing among peers include restructuring portfolios to improve returns, re-negotiation of existing terms with current managers, and investing in risk management and control capabilities
Excess CostCalPERS
Net
Val
ue A
dded
-15bp -10bp -5bp 0bp 5bp 10bp 15bp 20bp-0.6%
-0.4%
-0.2%
0.2%
0.4%
0.6%
-0.0%
0.8%
1.0%
1.4%
1.2%
Peers
5-year Net Value Added Versus Excess Cost
Excess CostCalPERS
Net
Val
ue A
dded
-15bp -10bp -5bp 0bp 5bp 10bp 15bp 20bp 25bp 30bp-2.0%
-1.5%
-1.0%
-0.5%
-0.0%
0.5%
1.0%
1.5%
Peers
3-year Net Value Added Versus Excess Cost
Excess CostCalPERS
Net
Val
ue A
dded
-10bp -5bp 0bp 5bp 10bp 15bp 20bp 25bp
3.0%
2.5%
2.0%
1.0%
1.5%
-1.0%
0.5%
-0.5%
0.0%
Peers
2014 Net Value Added Versus Excess Cost
64

A4) Measure: Funded status.
CalPERS Funded Status
80%
$0
$50
$100
$150
$200
$250
$300
$350
$400
0%
30%
60%
90%
120%
150%
2014 2015*201320122011201020092008200720062005200420032002200120001999199819971996199519941993
138%
100%
61% 70%
101%
Actuarial liabilities ($B)
Assets market value ($B)
Funded ratio (%)
76% 73%*
* Estimated funding levels as of June 30, 2015.
A key aspect of sustainability is the funded status of the pension fund — therefore the ratio of our assets to our accrued liabilities is an important measure to monitor The funded status is impacted by the change in the fair market value of the fund’s assets The estimated decrease in the funded status from 76 percent to 73 percent reflects the latest annual investment return of 2 4 percent as of June 30, 2015
A5) Measure: Quality of health care provided as measured by observed ratio of all-cause readmissions, compared to what would be expected.
Analysis: CalPERS’ score is a relative 5 percent better than the National Commercial Average Readmission percentages higher than expected may be due to poor quality health care, such as poor chronic disease management, improper discharge instructions, or missed opportunities to coordinate care better By using this nationally standardized measure for health care quality, we can compare the quality of care of CalPERS members to national populations Updated readmission data beyond 2012 is underway
Health Quality: Plan All-Cause Readmission, 2012
YEAR CalPERS National Commercial Average
2012 0.79 0.83
Table footnote: A lower score is better for this measure
$0
$50
$100
$150
$200
$250
$300
$350
$400
2014201320122011201020092008200720062005200420032002200120001999199819971996199519941993
65

A6) Measure: Access to health care as measured by the percent of CalPERS health beneficiaries reporting receipt of routine health care when needed, relative to benchmark data.
Analysis: The score represents the percentage of CalPERS members who received routine health care as soon as needed in the last 12 months as measured by the CalPERS Health Plan Member Survey utilizing questions consistent with the Consumer Assessment of Healthcare Providers and Systems survey Measurement year 2015 marks the establishment of our baseline of 83 1 percent, our 3-year average This baseline is in keeping with the national commercial 3-year average of 83 9 percent Future CalPERS scores will be compared to national benchmarks in the context of this baseline, which will inform the need for interven-tions to improve the score
Access to Routine Health Care, 2013-2015
YEAR CalPERS National Commercial Average
2013-15 83.1 83.9
Table footnote: A higher score is better for this survey-question measure
A7) Measure: Affordability of health benefits as measured by the percentage of total average costs for covered benefits that a health plan will cover.
Actuarial Value of Health Benefits, 2008-2013
Plan 2008 2009 2010 2011 2012 2013
Health Maintenance Organization (HMO) 93-97% 94-97% 94-97% 94-97% 95-97% 96-97%
Overall CalPERS Basic 90% 91% 91% 92% 92% 92%
Preferred Provider Organization 81-85% 77-85% 78-86% 78-87% 78-87% 81-87%
Table footnote: A higher score is better for this survey-question measure
Analysis: Affordability of health benefits, in addition to other strategic measure results, provide context to aid CalPERS decision-making, health plan contract negotia-tions, and determining optimal strategies to achieving long-term health benefit sustainability Health insurance plans in the marketplace are categorized into metal tiers – Bronze (60 percent), Silver (70 percent), Gold (80 percent), and Platinum (90 percent) CalPERS health plans have consistently ranked as Silver or higher If the actuarial value is too high, benefits may be too rich for the employers to continue to pay long-term If the actuarial value is too low, members will carry a greater burden of their health care costs
66

A8) Measure: Wellness of our membership as meas-ured by the percentage of members who practice preventative health measures, compared to state and national data. The preventative measurements are related to smoking, obesity, and daily monitoring of blood glucose levels by individuals with diabetes.
Analysis: Starting with measurement year 2013, changes were incorporated on the CalPERS Health Plan Member Survey to gather data related to the wellness of CalPERS membership The information collected is designed to be comparable with state and national data The annual survey results will contribute to these measurements providing essential baseline risk factor data
Smoking Prevalence5 3 percent of members compared to 12 9 percent of California adults are current smokers, with the national median at 18%
0
5
10
15
20
CaliforniaNationalCalPERS
12.5 12.9
19.0 18.1
5.3 5.3
2013 2014
25
Prevalence of Current Smokers, 2013-2014
Obesity Prevalence27 3 percent of members compared to 24 1 percent of California adults have a Body Mass Index (BMI) of ≥ 30 0 with the national median at 29 6 percent BMI is a screening tool and commonly used for population assessment of overweight and obesity It can be used to compare one’s weight status against that of the general population
0
5
10
15
20
25
30
CaliforniaNationalCalPERS
24.124.7
29.4 29.628.4 27.3
2013 2014
35
40
Percentage of Adults with Body Mass Index (BMI) ≥ 30 .0, 2013-2014
Diabetes Prevalence59 3 percent of members with diabetes perform daily self-monitoring of blood glucose levels compared to 63 5 percent of the national median For individuals with diabetes, daily self-monitoring of blood glucose levels is amongst multiple important preventative care practices that help reduce diabetes related complications
45
50
55
60
NationalCalPERS
59.363.5
2013 2014
65
Percentage of Adults Performing Daily Self-Monitoring of Blood Glucose, 2014
67

B1) Measure: Percentage of benefit payments issued to our customers within established service levels.
This measure captures the timeliness of four essential customer benefit payment streams: service retirement, refunds, disability retirement, and survivor benefits Timely payments are essential to a positive customer experience We focus heavily on benefit payments in our performance management to ensure customers always receive timely payments
Analysis: In FY 2014-15 our overall score was 95 percent We exceeded our exception reporting threshold in each benefit payment measured This result reflects the high efficiency of our operations as well as the importance we place on immediately addressing issues that may affect timeliness of payments
Overall Benefit Payment Results
100%
95%
90%
85%
80%
75%
70%
65%
60%FY 2013-2014 FY 2014-2015
94% 95%
B2) Measure: Customer satisfaction with CalPERS services as measured by surveys and other feedback methods.
CalPERS administers an extensive range of surveys online, by mail, in person, and through email to measure satisfaction with our processes and services Collecting satisfaction data through surveys allows us to identify our customers’ preferences and increases our flexibility and responsiveness to their needs
Analysis: In FY 2014-15 our overall score is 91 percent in the three categories for which we administered surveys We met or exceeded our exception reporting threshold, indicating our customers’ overall high satisfaction with the services we provide
68

B3) Measure: Employee Turnover.
This measure identifies two employee turnover rates: (a) External Movement rate which reflects employees who separate and retire from CalPERS, and (b) Internal Movement rate which reflects transfers and promotions within CalPERS
Analysis: In FY 2014-15, the external movement rate was 8 7 percent (240 separations/retirements) which is approximately half of the Bureau of Labor Statistics rate and one percent higher than the previous fiscal year We expect to see this trend continue as more Baby Boomers exit the workforce In FY 2014-15, the internal movement rate was 14 2 percent (390 promotions/transfers), a drop of four percentage points from the previous fiscal year Internal movement is positive and reflects workforce health, increased tenure, and employee retention In addition, it builds our bench strength and supports knowledge transfer and succes-sion planning Business plan initiatives underway that align with our Strategic Goal B (cultivate a high perform-ing, risk intelligent, and innovative organization)include: (a) training and knowledge transfer opportunities for staff, (b) reduced reliance on consultants, (c) recruit-ment outreach and marketing, (d) supervisory skills enhancements, and (e) comprehensive compensation program review We consider our overall turnover rate to be healthy and are continuing to monitor; if we notice a change of 5 percent or more we will evaluate and determine if any adjustments are needed
B4) Measure: Employee assessment of CalPERS Organizational Health.
Every three years, CalPERS conducts an employee survey which provides an Organizational Health Index (OHI) used to measure organizational health from the employees’ point of view Based on the 2013 survey results, the executive team selected the Innovation and Learning category as a focus area This specific measurement determines if the Innovation and Learning OHI score increased by 5 percent or more since the 2013 survey
Analysis: In 2016, the score for Innovation and Learning was 5 percent higher (65 percent) than in 2013 (60 percent) Improvement can be attributed to an increase in bottom-up innovation initiatives, such as implementation of the “Idea Factory,” an employee-driven internal innovation program Based on the 2016 OHI survey, new areas of focus are being identified which will influence the 2017-22 CalPERS Strategic Plan process
69

C1) Measure: Percentage of legislative bills enacted or defeated.
This measure reflects the percentage of California state legislation enacted or defeated consistent with positions taken by the Board of Administration
Analysis: This is a biennial measure because the California Legislature operates on a 2-year cycle Generally speaking, we always strive for 100%, espe-cially on bills that are deemed to be harmful to our members, programs, and stakeholders CalPERS continues to maintain a presence at the capitol and a voice in policymaking
Legislative Board Position Success Rate
20%
10%
30%
40%
50%
60%
70%
80%
90%
100%
2005-06 2007-08 2009-10 2011-12 2013-14
51% 50%
91%
79% 81%
C2) Measure: CalPERS perception in the media.
This measure identifies key topics for CalPERS and how they are being framed in the media related to CalPERS strategic messages, policies, programs and beliefs, and ranks the favorability of CalPERS media coverage
Analysis: This measure tracks the number of positive, negative, and neutral CalPERS media mentions in the first three quarters of FY 2015-16 Overall the media sentiment tone across all three categories was neutral However there were increases of positive media coverage due to favorable outcomes from CalPERS legal cases, health care procedure cost savings, and CalPERS credit rating settlement
CalPERS Perception in the Media (Dated by Quarter: FY 2015-16, Qtr . 1-3)
0
200
400
600
800
1,000
1,200
1,400
1,600
Qtr. 2 (10/1/2015 - 12/31/2015)Qtr. 1 (7/1/2015 - 9/30/2015) Qtr. 3 (1/1/2016 - 3/31/2016)
Nuetral Negative Positive
1,120
27 84
1,380
94 115
1,018
43 95
Session Year
70

C3) Measure: CalPERS perception among stakeholders.
This measure gauges stakeholder perception in relation to effectiveness in communicating and engaging with stakeholders, and effectiveness as a policy advocate
Analysis: Overall the perception of CalPERS engagement and advocacy work has remained steadily positive
Historical Stakeholder Feedback from Online Survey (2011-2014) Question: On a scale of one-to-ten (one is lowest, ten is highest), how would you rate CalPERS on being effective in engaging and communicating with stakeholders?
0
1
2
3
4
5
6
7
8
Employers EmployeesMembers
6.5 6.77.3
Historical Stakeholder Feedback From Online Survey Question: On a scale of one-to-ten (one is lowest, ten is highest),how would you rate CalPERS as an effective policy advocate?
8
7
6
5
4
3
2
1
0Members Employers Employees
7.27.6 7.37.0 7.2
7.57.26.9
8.07.4 7.5
2011 2013, Phase 2 2014, Phase 1 2014, Phase 2 7 = Above Average
71

Department Descriptions, Unit Goals, and Objectives
The following charts are enterprise-wide measures that include the percentage of budget expenditures and vacancies This section also expands on each program area’s purpose and individual objectives that have been achieved for past years and anticipated for 2016-17
72

Measure: Percentage of Budget Expended.
Target: 100 percent
Budget Funds (in millions)
FY 2012–13 FY 2013–14 FY 2014–15 FY 2015–16
TOTAL OPERATING COSTSApproved Budget
Expenditures
Percentage Expended
$464.2
$435.9
93 .8%
$509.6
$485.4
95 .3%
$498.9
$479.1
96 .0%
$527.7
$514.1
97 .4%
ENTERPRISE PROJECTSApproved Budget
Expenditures
Percentage Expended
$84.6
$83.6
98 .8%
$33.3
$32.7
98 .4%
$24.9
$22.9
92 .0%
$37.5
$35.6
94 .9%
HEADQUARTERS BUILDING COSTSApproved BudgetExpendituresPercentage Expended
$41.8$31.7
75 .9%
$40.7$32.0
78 .8%
$32.6$29.3
89 .9%
$30.3$28.3
93 .4%
INVESTMENT EXTERNAL MANAGEMENT FEESApproved BudgetExpendituresPercentage Expended
$1,093.0$1,216.2
111 .3%
$1,030.0$1,258.8
122 .2%
$1,016.5$1,333.1131 .2%
$930.7$930.7
100 .0%
THIRD-PARTY ADMINISTRATOR FEESApproved BudgetExpendituresPercentage Expended
$103.0$105.4
102 .3%
$274.5$196.071 .4%
$285.3$287.8
100 .9%
$281.4$278.499 .0%
TOTAL BUDGETApproved BudgetExpendituresPercentage Expended
$1,786.7$1,872.8104 .8%
$1,888.1$2,005.1106 .2%
$1,858.2$2,152.3
115 .8%
$1,807.6$1,787.2
98 .9%
Analysis: The percentage of budget expended in FY 2015-16 is 98 9 percent and represents an estimate since year-end is not finalized This is just below the benchmark of 100 percent In FY 2014-15, the 115 8 percent expended exceeds the benchmark of 100 percent This is primarily due to additional external management fees based on higher than expected investment returns Improved forecasting and budget processes, as well as tighter spending controls, ensure that budgets are a more accurate reflection of the actual expenditures The goal for spending the budget is 100 percent or less
$1000
$1500
$2000
$2500
FY 2015-16FY 2014-15FY 2013-14FY 2012-13
Approved Budget Actual Expenditures
$1,78
7.2
$1,80
7.6
$2,15
2.3
$1,85
8.2
$2,00
5.1
$1,88
8.1
$1,87
2.5
$1,78
6.7
98.9%104.8%
106.2%115.8%
73

Measure: Vacancies as a percent of total Personnel Years (PY).Target: 5 percent
CalPERSPerformance Tracking & Reporting Benchmark 2013-14 2014-15 2015-16 Average
Authorized Positions – Enterprise-wide - 2,696.0 2,727.0 2,765.0 2,746.0
% of Position Vacancy 5% 7.8% 5.8% 5.8% 5.9%
Analysis: The CalPERS vacancy rate decreased from 7 8 percent in 2013-14 to 5 8 percent in 2015-16 The number of specialized positions within the financial, legal, actuarial, and investment offices contributes to the vacancy rate as there may be difficulties recruiting qualified candidates to fill positions There will always be a certain number of vacancies in an organization this large, with diverse business lines
Vacancy Rate by Year
2
4
6
8
10
FY 2015-16FY 2014-15FY 2013-14
5.8% 5.8%
7.8%
74

Recent Accomplishments:• Redesigned GASB 68 Cost Sharing Multiple Employer
Valuations into two reports, one for miscellaneous workers and one for safety workers, allowing comple-tion of GASB 68 valuations in-house without the use of consultant actuaries
• Improved the actuarial data extract process from the mylCalPERS system, allowing a more accurate and efficient valuation process with less need for manual intervention
• In collaboration with FINO and CSR, participated in numerous stakeholder conferences and outreach events to continue to educate and inform stakehold-ers of the Asset Liability Management policy and its purpose and intent
MeasureStrategic
Goal2016-17
Target 2015-16 2014-15 2013-14
Authorized Positions (2015-16 as of May 31, 2016) – 59.0 58.0 54.0 55.0
Vacant Positions (2015-16 as of May 31, 2016) – 3.0 3.0 2.0 4.0
Percentage of Position Vacancy – 5% 5.2% 3.7% 7.3%
Approved Budget (in thousands) B $9,301 $8,248 $7,684 $8,070
Expenditures (in thousands) B $9,301 $7,991 $7,647 $7,953
Percentage of Budget Expended – 100% 96.9% 99.5% 98.6%
Employer Contribution Rate Valuation Reports Received A – 3,642 3,163 2,573
Employer Contribution Rate Valuation Reports Completed A – 3,642 3,163 2,573
Percentage of Reports Completed A 100% 100.0% 100.0% 100.0%
Goal A: Improve long-term pension and health benefit sustainability
Goal B: Cultivate a high-performing, risk-intelligent, and innovative organization
Actuarial Office (ACTO)CalPERS actuaries prepare actuarial valuations for the State of California, school employers, and contracting public agencies (cities, counties, municipalities, etc ) The valuations are based on the benefits adopted, actuarial methods and assumptions set by the Board, and the membership and financial data for each plan The contribution rates employers pay to fund their employees’ retirements are based on these actuarial valuations
75
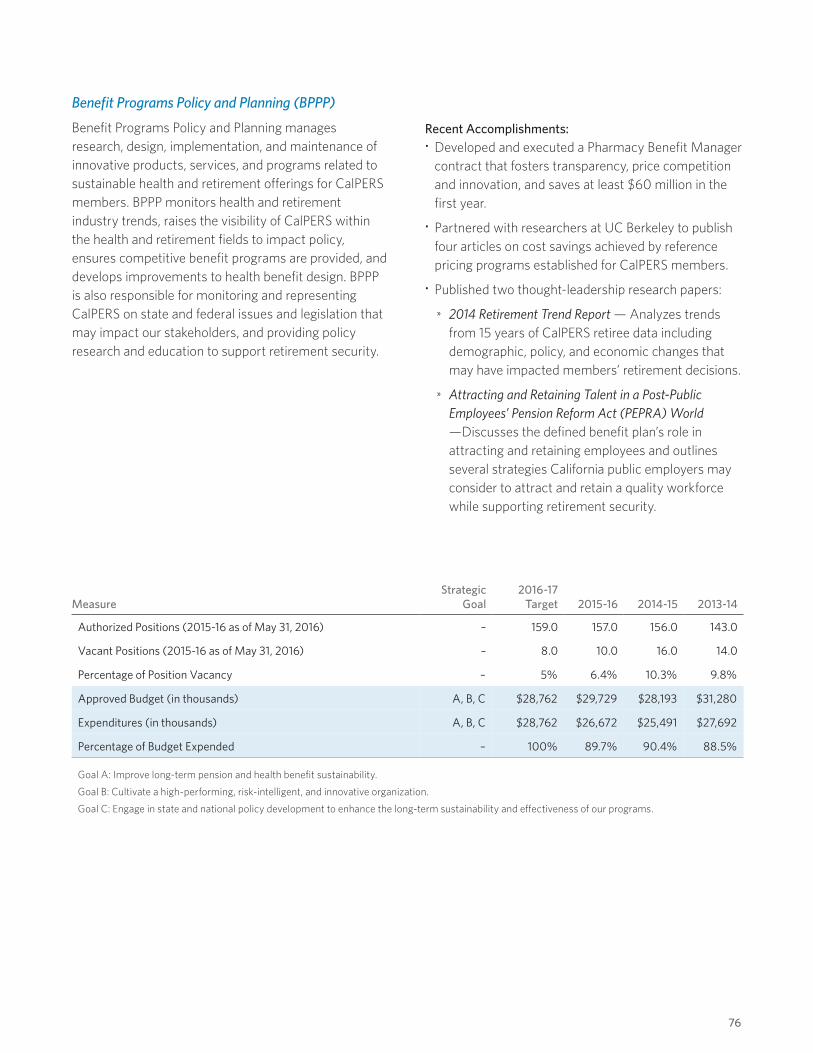
Benefit Programs Policy and Planning (BPPP)Benefit Programs Policy and Planning manages research, design, implementation, and maintenance of innovative products, services, and programs related to sustainable health and retirement offerings for CalPERS members BPPP monitors health and retire ment industry trends, raises the visibility of CalPERS within the health and retirement fields to impact policy, ensures competitive benefit programs are provided, and develops improvements to health benefit design BPPP is also responsible for monitoring and representing CalPERS on state and federal issues and legislation that may impact our stakeholders, and providing policy research and education to support retirement security
Recent Accomplishments:• Developed and executed a Pharmacy Benefit Manager
contract that fosters transparency, price competition and innovation, and saves at least $60 million in the first year
• Partnered with researchers at UC Berkeley to publish four articles on cost savings achieved by reference pricing programs established for CalPERS members
• Published two thought-leadership research papers:» 2014 Retirement Trend Report — Analyzes trends
from 15 years of CalPERS retiree data including demographic, policy, and economic changes that may have impacted members’ retirement decisions
» Attracting and Retaining Talent in a Post-Public Employees’ Pension Reform Act (PEPRA) World —Discusses the defined benefit plan’s role in attracting and retaining employees and outlines several strategies California public employers may consider to attract and retain a quality workforce while supporting retirement security
MeasureStrategic
Goal2016-17
Target 2015-16 2014-15 2013-14
Authorized Positions (2015-16 as of May 31, 2016) – 159.0 157.0 156.0 143.0
Vacant Positions (2015-16 as of May 31, 2016) – 8.0 10.0 16.0 14.0
Percentage of Position Vacancy – 5% 6.4% 10.3% 9.8%
Approved Budget (in thousands) A, B, C $28,762 $29,729 $28,193 $31,280
Expenditures (in thousands) A, B, C $28,762 $26,672 $25,491 $27,692
Percentage of Budget Expended – 100% 89.7% 90.4% 88.5%
Goal A: Improve long-term pension and health benefit sustainability
Goal B: Cultivate a high-performing, risk-intelligent, and innovative organization
Goal C: Engage in state and national policy development to enhance the long-term sustainability and effectiveness of our programs
76

Communications & Stakeholder Relations (CSR)Communications & Stakeholder Relations is responsible for monitoring and communicating CalPERS’ position on issues that may impact our stakeholders CSR directs and supports internal and external communications, including the overall communications strategy for the www .calpers .ca .gov and my calpers ca gov websites
Recent Accomplishments:• Created a new digital communication strategic plan
and developed a social media toolkit for employees • Developed comprehensive communication plans for
the Operational Health Index employee survey, and an employee-driven internal innovation program called the Idea Factory
• Issued 80 news releases and produced 29 webinars/webcasts
MeasureStrategic
Goal2016-17
Target 2015-16 2014-15 2013-14
Authorized Positions (2015-16 as of May 31, 2016) – 61.0 60.0 59.0 63.0
Vacant Positions (2015-16 as of May 31, 2016) – 3.0 5.0 4.0 1.0
Percentage of Position Vacancy – 5% 8.3% 6.8% 1.6%
Approved Budget (in thousands) B $10,560 $10,356 $10,571 $12,106
Expenditures (in thousands) B $10,560 $10,172 $9,573 $11,901
Percentage of Budget Expended – 100% 98.2% 90.6% 98.3%
Total CalPERS Facebook Followers B, C 10,000 12,606 10,719 10,224
Increase in Social Media Followers B, C – 30,232 29,798 19,359
Goal B: Cultivate a high-performing, risk-intelligent, and innovative organization
Goal C: Engage in state and national policy development to enhance the long-term sustainability and effectiveness of our programs
77

Customer Services & Support (CSS)Customer Services & Support provides the first point of contact for CalPERS employers and members at eight Regional Offices throughout the State of California and the main Customer Contact Center CSS handles health and retirement account management for employers and members, calculates and manages benefit payments to members, retirees, and beneficiaries, as well as provides employer and member education
Recent Accomplishments:• Improved the timeliness of Disability Retirement
Determinations by over 50%, resolving most cases in less than 4 months
• Contracted with 22 new employers due to successful marketing, resulting in the addition of 11,000 total covered lives to the CalPERS Health Program
• Closed 576 cases submitted by Employers, with 80% of those resolved within 1-3 days, gaining a Customer satisfaction survey score of 95%
• Achieved an overall customer satisfaction rating of 90% or higher on business process surveys
MeasureStrategic
Goal2016-2017
Target 2015-16 2014-15 2013-14
Authorized Positions (2015-16 as of May 31, 2016) – 992.5 907.5 892.5 885.5
Vacant Positions (2015-16 as of May 31, 2016) – 50.0 48.5 25.5 35.5
Percentage of Position Vacancy – 5% 5.3% 2.9% 4.0%
Approved Budget (in thousands) B $109.434 $102,949 $98,151 $97,901
Expenditures (in thousands) B $109.434 $101,104 $96,827 $95,354
Percentage of Budget Expended – 100% 98.2% 98.7% 97.4%
Members added to Service Retirement Roll B – – 33,832 30,993
Service Retirements paid within 45 days of retirement date or application receipt B 95% – 90.0% 90.0%
Members added to Disability Retirement Roll B – – 1,602 1,533
Disability Retirements paid within 45 days of retirement or disability approval date B 90% – 90.0% 90.0%
Death Benefit cases completed B – – 16,675 15,238
Death Benefit cases paid within 45 days of documentation receipt B 100% – 87.6% 89.6%
Call Wait Time (in minutes) – Target B – 1 or less 1 or less 6
Call Wait Time (in minutes) – Actual B – 1.5 2.0 3.0
Goal B: Cultivate a high-performing, risk-intelligent, and innovative organization
78
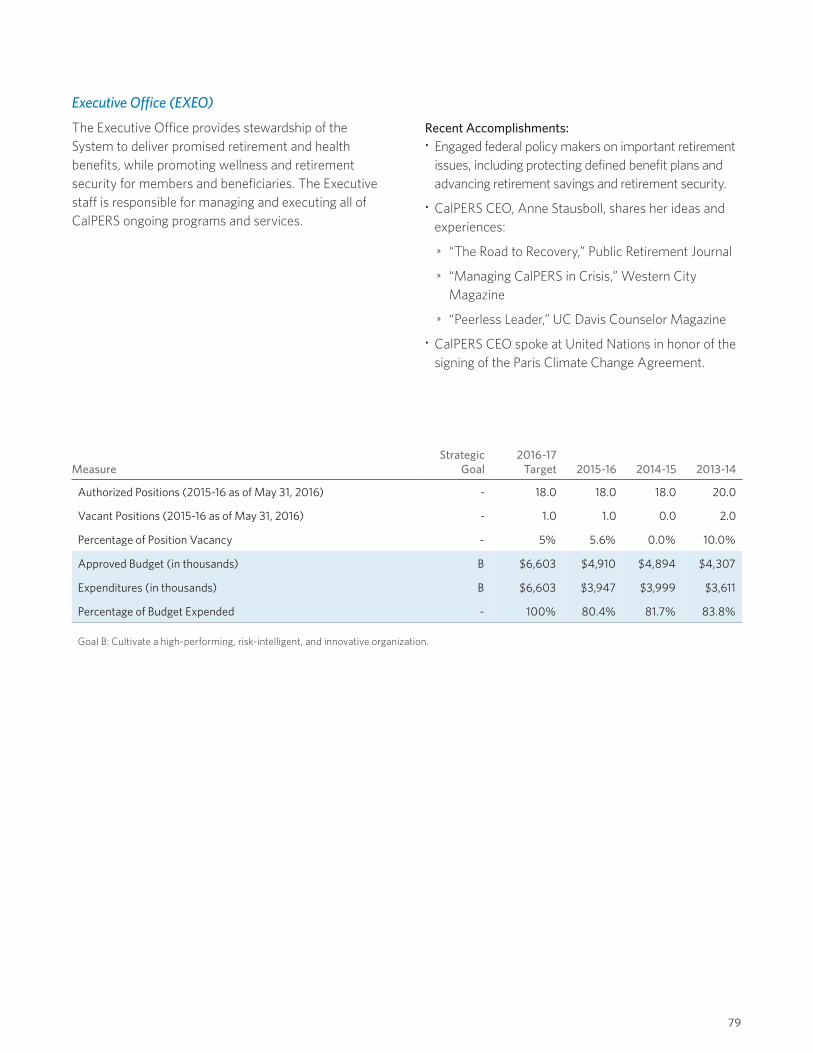
Executive Office (EXEO)The Executive Office provides stewardship of the System to deliver promised retirement and health benefits, while promoting wellness and retirement security for members and beneficiaries The Executive staff is responsible for managing and executing all of CalPERS ongoing programs and services
Recent Accomplishments:• Engaged federal policy makers on important retirement
issues, including protecting defined benefit plans and advancing retirement savings and retirement security
• CalPERS CEO, Anne Stausboll, shares her ideas and experiences: » “The Road to Recovery,” Public Retirement Journal» “Managing CalPERS in Crisis,” Western City
Magazine» “Peerless Leader,” UC Davis Counselor Magazine
• CalPERS CEO spoke at United Nations in honor of the signing of the Paris Climate Change Agreement
MeasureStrategic
Goal2016-17
Target 2015-16 2014-15 2013-14
Authorized Positions (2015-16 as of May 31, 2016) - 18.0 18.0 18.0 20.0
Vacant Positions (2015-16 as of May 31, 2016) - 1.0 1.0 0.0 2.0
Percentage of Position Vacancy - 5% 5.6% 0.0% 10.0%
Approved Budget (in thousands) B $6,603 $4,910 $4,894 $4,307
Expenditures (in thousands) B $6,603 $3,947 $3,999 $3,611
Percentage of Budget Expended - 100% 80.4% 81.7% 83.8%
Goal B: Cultivate a high-performing, risk-intelligent, and innovative organization
79

Financial Office (FINO)The Financial Office is responsible for CalPERS financial management through coordination and centralization of all CalPERS finance activity This includes managing and directing all accounting and budgeting activities for all funds and programs administered by CalPERS Risk management and enterprise compliance activities also fall under the Chief Financial Officer’s responsibility within the Financial Office
Recent Accomplishments:• Developed CalPERS’ first Risk Mitigation Policy
ensuring long-term sustainability of the pension system by reducing funding risk and volatility over time
• Successfully implemented a Treasury Management Program including semi-annual Treasury Management Section analysis and liquidity reporting to the CalPERS Board, a Treasury Management Reserve Policy, and 12 month rolling cash flow fore-casts for all CalPERS funds
• Completed FY 2014-15 Comprehensive Annual Financial Report in compliance with Governmental Accounting Standards Board Pronouncement 68, which required the creation of GASB 68 reports, Statement of Net Position, and audit coordination
• Developed CalPERS Budget Policy to ensure CalPERS maintains a fiscally sustainable balanced budget that recognizes the fiduciary duty owed to our members
MeasureStrategic
Goal2016-17
Target 2015-16 2014-15 2013-14
Authorized Positions (2015-16 as of May 31, 2016) – 219.0 216.0 206.0 209.0
Vacant Positions (2015-16 as of May 31, 2016) – 11.0 14.0 18.0 38.0
Percentage of Position Vacancy – 5% 6.5% 8.7% 18.2%
Approved Budget (in thousands) B $29,978 $24,277 $42,361 $40,339
Expenditures (in thousands) B $29,978 $21,570 $41,751 $39,857
Percentage of Budget Expended – 100% 88.8% 98.6% 98.8%
Achieve CAFR Certification of Excellence in Financial Reporting A Receive GFOA Award Yes Yes Yes
Achieve Government Finance Officers Association (GFOA) Excellence in Budgeting Award B Receive
GFOA Award Yes Yes N/A
Receive Unqualified or Unmodified (clean) Audit Opinion on the CAFR A Receive Clean
Audit Opinion Yes Yes Yes
Goal A: Improve long-term pension and health benefit sustainability
Goal B: Cultivate a high-performing, risk-intelligent, and innovative organization
80

General Counsel Office (GCO)The General Counsel Office provides legal advice to the Board, Executive Office, staff, coordinates the use of external legal counsel, and analyzes and drafts legisla-tion They represent CalPERS at hearings, appeal boards, court cases, and other legal actions GCO also manages internal auditing of CalPERS operations and programs in concert with an external auditor engaged by the Board
Recent Accomplishments:• Reached a settlement in CalPERS’ case against
Moody’s credit rating agency, which resulted in a $130 million recovery of investment losses by CalPERS from Moody’s
• Won a case in the Second District Court of Appeal (Department of Justice v CalPERS, Resendez) that held employers have a mandatory duty to reinstate a member from disability retirement after CalPERS concludes the member is no longer incapacitated and all appeals have been exhausted
• Implemented a new outside counsel electronic billing system that eliminates manual tracking of expenses
MeasureStrategic
Goal2016-17
Target 2015-16 2014-15 2013-14
Authorized Positions (2015-16 as of May 31, 2016) – 137.0 137.0 131.0 128.0
Vacant Positions (2015-16 as of May 31, 2016) – 7.0 9.0 14.0 16.0
Percentage of Position Vacancy – 5% 6.6% 10.7% 12.5%
Approved Budget (in thousands) B $26,210 $29,058 $24,326 $25,469
Expenditures (in thousands) B $26,210 $24,873 $23,707 $25,176
Percentage of Budget Expended – 100% 85.6% 97.5% 98.8%
Public Agency Audit Reviews Planned A 240 126 90 93
Public Agency Audit Reviews Completed A – 125 105 99
Percentage of Public Agency Completed Audits A 100% 99.2% 116.7% 106.5%
Internal Audits Planned B 36 35 53 56
Internal Audits Completed* B – 32 58 58
Percentage of Internal Audits Completed B 100% 91.4% 109.4% 103.6%
Goal A: Improve long-term pension and health benefit sustainability
Goal B: Cultivate a high-performing, risk-intelligent, and innovative organization
*Estimates were received since year-end data is not available
81

Investment Office (INVO)Under the general direction of the CalPERS Board, Investment Committee, and Executive Office, the Investment Office is responsible for the successful investment of the CalPERS funds Individual investment decisions are made by an internal advisory staff as well as external equity managers on behalf of the Board Trading decisions are governed by policies established by the Investment Committee in accordance with applicable law and are reported to the Investment Committee on a monthly basis
Recent Accomplishments:• Active funds in private equity program have added
$24 2 billion in realized net gains to the fund from 1990 During that same time period, CalPERS’ external investment partners have realized $3 4 billion from profit sharing agreements with CalPERS
• CalPERS annual ongoing costs for its investment operations declined by approximately $134 million for the 5-fiscal-year period from 2010-15
• Received an A+ from the Principles for Responsible Investment (PRI) Assessment Report, and received an A+ in Listed Equity Active Ownership Fewer than eight assets owners of the 245 surveyed globally received such a score
MeasureStrategic
Goal2016-17
Target 2015-16 2014-15 2013-14
Authorized Positions (2015-16 as of May 31, 2016) - 346.0 335.0 334.0 341.0
Vacant Positions (2015-16 as of May 31, 2016) - 17.0 33.0 27.0 36.0
Percentage of Position Vacancy - 5% 9.9% 8.1% 10.6%
Approved Budget (in thousands) B $161,796 $67,301 $63,272 $57,859
Expenditures (in thousands) B $161,796 $63,987 $61,760 $57,548
Percentage of Budget Expended - 100% 95.1% 97.6% 99.5%
Net Investment Return as of June 30 A 7.5% TBD 2.4% 18.4%
Goal A: Improve long-term pension and health benefit sustainability
Goal B: Cultivate a high-performing, risk-intelligent, and innovative organization
82

Operations & Technology (OPT)The Operations & Technology staff perform system analysis, design, programming, testing, implementation, and maintain CalPERS computer systems and data-bases OPT also provides technical support and training for personal computers, local area networks, and office automation facilities In support of innovation, OPT conducts research, evaluation, and development of new information technology services that support the CalPERS mission In addition OPT has jurisdiction over Human Resources, building maintenance contracts, procurement, strategic planning, diversity inclusion, and equal employment opportunity
Recent Accomplishments:• Diverted 18 49 tons of food waste from landfills to
produce alternative fuel for the City of Sacramento’s vehicle fleet in 2015
• Reduced water consumption in 2015 by 44 percent (14 34 million gallons) over the 2013 baseline, exceeding the target reduction due to the California drought by almost 20 percent
• Received CAPIO Gold Award for my|CalPERS website redesign
• Built an internal professional networking/mentoring site called Illuminet, which provides staff increased opportunities for career development
Operations:
MeasureStrategic
Goal2016-17
Target 2015-16 2014-15 2013-14
Authorized Positions (2015-16 as of May 31, 2016) - 279.5 277.5 276.5 258.5
Vacant Positions (2015-16 as of May 31, 2016) - 14.0 18.0 5.0 23.5
Percentage of Position Vacancy - 5% 6.5% 1.8% 9.1%
Approved Budget (in thousands) B $39,176 $38,075 $36,937 $36,395
Expenditures (in thousands) B $39,176 $37,470 $35,938 $34,798
Percentage of Budget Expended - 100% 98.4% 97.3% 95.6%
Workflow documents processed within 24 hours B 100% 98.0% 98.0% -
Goal B: Cultivate a high-performing, risk-intelligent, and innovative organization
Technology:
MeasureStrategic
Goal2016-17
Target 2015-16 2014-15 2013-14
Authorized Positions (2015-16 as of May 31, 2016) - 601.0 599.0 600.0 593.0
Vacant Positions (2015-16 as of May 31, 2016) - 30.0 29.0 48.0 40.0
Percentage of Position Vacancy - 5% 4.8% 8.0% 6.7%
Approved Budget (in thousands) B $102,839 $105,192 $98,287 $107,904
Expenditures (in thousands) B $102,839 $102,255 $97,063 $107,745
Percentage of Budget Expended - 100% 97.2% 98.8% 99.9%
Service Availability Uptime for mylCalPERS Application B 100% 99.9% 99.9% -
Goal B: Cultivate a high-performing, risk-intelligent, and innovative organization
83

Statistical/Supplemental
CalPERS at a Glance June 2016
Our Mission: Provide responsible and efficient stewardship of the System to deliver promised retirement and health benefits, while promoting wellness and retirement security for members and beneficiaries.
The information presented in this document provides a statistical outline of our retirement and health programs and a breakdown of our investment profile and Fund performance.
Pension Program Figures as of June 30, 2015 unless otherwise noted.
Members 1.8 million memberstotal retirement plan membership
868,713 / 48%active members
556,640 / 31% state members
611,078/ 34%retirees & beneficiaries
687,117 / 38% school members
335,908 / 18%inactive members1
571,942/ 31% public agency members
Employers 3,007 employers total employers in retirement program
1State of California
$2,825average monthly service retirement2
1,423School Districts
$1,438average monthly service retirement2
1,583Public Agencies
$2,826average monthly service retirement2
Economic Impact 3
$17.9 billionin benefits paid
$31 billion economic activity created by CalPERS benefit payments
$716 million generated in sales and property taxes
$26 billioninvested in California
Shared Responsibility4
Every dollar paid to CalPERS retirees comes from three sources:
We serve those who serve California.
65¢ Investment earnings
22¢ CalPERS employers
13¢ CalPERS members
84
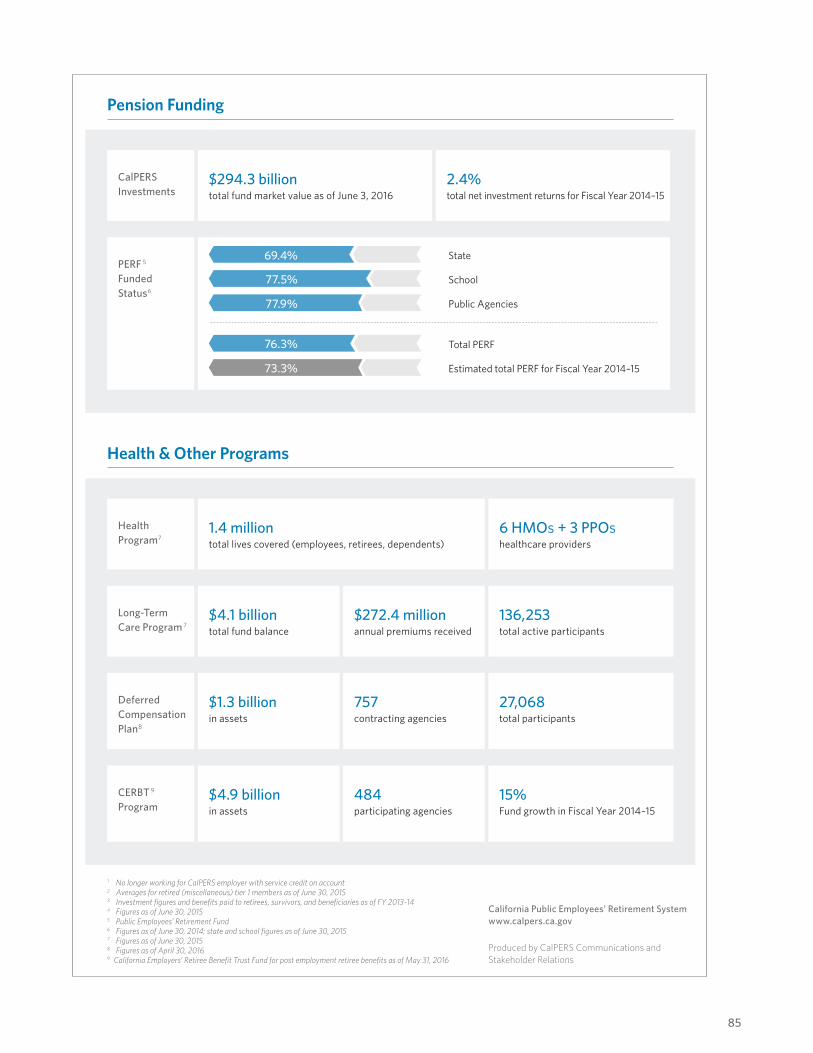
Pension Funding
CalPERS Investments
$294.3 billiontotal fund market value as of June 3, 2016
2.4% total net investment returns for Fiscal Year 2014–15
PERF 5 Funded Status6
694+306 775+225 733+267
698+302 733+267
69.4% State
77.5% School
77.9% Public Agencies
76.3% Total PERF
73.3% Estimated total PERF for Fiscal Year 2014–15
Health & Other Programs
Health Program7
1.4 milliontotal lives covered (employees, retirees, dependents)
6 HMOs + 3 PPOs healthcare providers
Long-Term Care Program 7
$4.1 billiontotal fund balance
$272.4 millionannual premiums received
136,253total active participants
Deferred Compensation Plan8
$1.3 billionin assets
757contracting agencies
27,068total participants
CERBT 9 Program
$4.9 billionin assets
484participating agencies
15% Fund growth in Fiscal Year 2014–15
1 No longer working for CalPERS employer with service credit on account2 Averages for retired (miscellaneous) tier 1 members as of June 30, 20153 Investment figures and benefits paid to retirees, survivors, and beneficiaries as of FY 2013-144 Figures as of June 30, 20155 Public Employees’ Retirement Fund6 Figures as of June 30, 2014; state and school figures as of June 30, 20157 Figures as of June 30, 20158 Figures as of April 30, 20169 California Employers’ Retiree Benefit Trust Fund for post employment retiree benefits as of May 31, 2016
California Public Employees’ Retirement Systemwww.calpers.ca.gov
Produced by CalPERS Communications and Stakeholder Relations
85

86
Glossary
Allotment The approved portion of an amount (usually of an appropriation) to be expended for a particular purpose during a specified time period
Appropriation Authorization to make expenditures or incur liabilities from a specific fund for a specific purpose It is usually limited in amount and has a specific period of time during which the expenditure is to be incurred For example, appropriations made by the Budget Act are available for encumbrance for one year, unless otherwise specified
Augmentation An authorized increase to a previously authorized appropriation or allotment
Baseline Adjustment A change from the currently authorized budget necessary to maintain the current level of service or activities in the current year or in a future year
Baseline Budget The anticipated costs of carrying out the current level of service or activities as authorized by the Legislature (or CalPERS Board)
Board CalPERS Board of Administration
Budget A plan of operation expressed in terms of financial or other resource requirements for a specific period of time
Budget Change ProposalA proposal to change the level of service or funding sources for activities authorized by the California Legislature, to propose new program activities not currently authorized, or to delete existing programs
Budget To Actual ReportsA series of reports including a Budget to Actual report (includes the annual budget, month and year-to-date expenses, and encumbrance balance), encumbrance query, voucher expenditures query, and the on-line expense query
CalPERS California Public Employees’ Retirement System
California Legislative Analyst’s OfficeThe California Legislative Analyst’s Office (LAO) is a nonpartisan government agency that has provided fiscal and policy advice to the California Legislature since 1941 It is known for its fiscal and programmatic expertise and nonpartisan analysis of the state budgetThe office serves as the “eyes and ears” for the Legislature to ensure that the executive branch is implementing legislative policy in a cost-efficient and effective manner
Continuous Appropriation Permanent constitutional or statutory expenditure authorization that is automatically renewed each year without further legislative (or CalPERS Board) action
Encumbrance The commitment of part or all of an appropriation by a governmental unit for goods and services not yet received These commitments are expressed by such documents as purchase orders, contracts, and future salaries, and cease to be encumbrances when they are paid or otherwise canceled
Emergency Operations Center (EOC)CalPERS off-site center that houses backup information technology data
Financial Accounting Standards Board (FASB)The Financial Accounting Standards Board (FASB) is a private, non-profit organization market regulator whose primary purpose is to establish and improve generally accepted accounting principles (GAAP) within the United States in the public’s interest The Securities and Exchange Commission (SEC) designated the FASB as the organization responsible for setting accounting standards for public companies in the U S
Fiscal Year (FY)The period beginning July 1 and continuing through the following June 30
Formal Budget Request (FBR) A CalPERS proposal to change the level of service or funding sources for activities authorized by the CalPERS Board, to propose new program activities not currently authorized, or to delete existing programs
Fund A legal entity that segregates monies or other resources for obligations in accordance with specific restrictions or limitations
Generally Accepted Accounting Principles (GAAP)GAAP refers to the standard framework of guidelines for financial accounting They are the common set of accounting principles, standards, and procedures that companies use to compile their financial statements and are the commonly accepted ways of recording and reporting accounting information
Governmental Accounting Standards Board (GASB) GASB is the source of GAAP used by state and local governments in the United States
Governor’s Budget The recommendations and estimates for the state’s financial operations for the ensuing fiscal year that the Governor presents to the Legislature by January 10 of each year This document also displays the actual revenues and expenditures of the state for the immediate past year, updates estimates for the current year revenues and expenditures, and projects for the upcoming budget year revenues and expenditures
-
Health Maintenance Organization (HMO) An organization that provides or arranges managed care for health insurance, self-funded health care benefit plans, individuals, and other entities in the United States and acts as a liaison with health care providers (hospitals, doctors, etc ) on a prepaid basis The Health Maintenance Organization Act of 1973 required employers with 25 or more employees to offer federally certified HMO options if the employer offers traditional health care options Unlike traditionally indemnity insurance, an HMO covers care rendered by those doctors and other professionals who have agreed by contract to treat patients in accordance with the HMO’s guidelines and restrictions in exchange for a steady stream of customers HMOs cover emergency care regardless of the health care provider’s contracted status
Indirect Costs (cost allocation) Costs which cannot be readily associated with a specific organization unit or program, such as general administrative expenses Indirect costs are prorated to the organizational unit(s) or program(s) which are affected
Merit Salary Adjustment (MSA) A cost factor resulting from the periodic increase in salaries paid to personnel occupying authorized positions
Object of Expenditure (Line Item) A classification of expenditures based on the type of goods or services received For example, the budget category of personnel services includes the objects of salaries and wages, and staff benefits
87

One-Time Cost A proposed or actual expenditure that is non-recurring (usually only in one annual budget) and not permanently included in baseline expenditures
Operating Expenses and Equipment (OE&E) A category of a support appropriation which includes general expenses, printing, communication, travel, data processing, equipment, and accessories for the equipment
Other Postemployment Benefits (OPEB)Other Postemployment Benefits ( OPEB) is an account-ing concept created by the Governmental Accounting Standards Board (GASB) by pronouncements designed to address expenses that entities may or may not be legally bound to pay, but pay as a moral obligation GASB pronouncements apply to governmental entities, public benefit entities, public employee retirement systems, and public utilities, hospitals and other healthcare providers, and colleges and universities
Preferred Provider Organization (PPO)In health insurance in the United States, a Preferred Provider Organization is a managed care organization of medical doctors, hospitals, and other health care providers who have agreed with an insurer or a third-party administrator to provide health care at reduced rates to the insurer’s or administrator’s clients
Pro Rata Represents General Fund recoveries of statewide general administrative costs (i e , indirect costs incurred by central service agencies) from special funds (California Government Code [GC] sections 11010, and 11270 through 11277) The pro rata process apportions the costs of providing central administrative services to all state departments that benefit from the services This apportioned amount is further allocated to each state department’s funding sources based on the percentage of total expenditures in each fund
Personnel Services A category of expenditure which includes payment of salaries and wages, the state’s contribution to the Public Employees’ Retirement Fund, insurance premiums for workers’ compensation, the state’s share of employees’ health insurance, and the state’s share of Social Security
Personnel Year (PY) The actual or estimated portion of a position expended for the performance of work For example, a full-time position that was filled by an employee for half of a year would result in an expenditure of 0 5 Personnel Year This may also be referred to as a PY equivalent A PY is currently calculated using 1,776 working hours Non-working hours related to vacation, sick leave, and holidays have been factored into this number
Proposition 162 An initiative approved by the voters in 1992 It gives the CalPERS Board absolute and exclusive authority over the administration and investment of pension funds
Public Agency Audit Reviews (PAAR)Audits of public agencies that participate in CalPERS
Public Records Act (PRA) The California Public Records Act (Statutes of 1968, Chapter 1473; currently codified as California Government Code §6250 through 6276 48) was a law passed by the California State Legislature and signed by the Governor in 1968 requiring inspection and/or disclosure of governmental records to the public upon request, unless exempted by law
Public Employees’ Pension Reform Act (PEPRA)Effective January 2013, the California Public Employees’ Pension Reform Act (PEPRA) changes the way CalPERS retirement and health benefits are applied, and places compensation limits on members The greatest impact is felt by new CalPERS members All members that don’t fall into the definition of new members are considered classic members, who will retain the existing benefit levels for future service with the same employer
CalPERS FY 2016–17 Annual Budget 88

An amount received as a payment for the cost of services performed, or of other expenditures made for, or on behalf of, another entity (reimbursements represent the recovery of an expenditure)
Return on Investment (ROI) A performance measure used to evaluate the efficiency of an investment or to compare the efficiency of a number of different investments
Revolving Fund An agency or office revolving fund (ORF) is not a fund but an advance from an appropriation Agenciesmay use the cash advance to disburse ORF checks The cash account is subsequently replenished by a State Controller’s Office warrant which records the expenditure and reduces the balance of the appropriation
Service Employees International Union (SEIU) Local 1000 A labor union representing 95,000 California state employees with nine different bargaining units Local 1000 deals with issues such as salaries, benefits, working conditions, and contract negotiations
Staff Benefits An object of expenditure representing the state costs of contributions for employees’ retirement, state disability insurance, health and welfare benefits, and non-industrial disability leave benefits
CalPERS FY 2016–17 Annual Budget 89

Produced by CalPERS Financial Office, Financial Planning, Policy and Budgeting Division
For media inquiries, please contact (916) 795-3991 or [email protected].
California Public Employees’ Retirement System400 Q StreetP.O. Box 942701Sacramento, CA 94229-2701www.calpers.ca.gov
July 2016 | 2016.7.1