Embed Size (px)
Citation preview

CONTENTS
Important Notes
Company Information
Financial Highlights
Changes in Share Capital and Shareholdings of Substantial Shareholders
Directors, Supervisors, Senior Management and Employees
Corporate Governance
Shareholders’General Meeting
Risk Management
Report of the Board of Directors
Report of the Board of Supervisors
Significant Events
References
Organizational Charts
Independent Auditor’s Report
Financial Statements
Notes to Financial Statements
List of Branches

Important Notice
1 The Board of Directors of Ningbo Commercial Bank Co.,Ltd. warrants that there are no fraudulent
disclosures, misguiding statements or significant material omissions in this report and the Board is
responsible for the authenticity, accuracy and integrity of the report.
2 The financial statements for 2006 has been audited by Shu Lun Pan Certified Public Accountants Co.,
Ltd. in accordance with the independent auditing standards for the Chinese certified public accountants.
The company has formed the unqualified auditor’s opinion.
3 Mr. Luhuayu, Chairman of the directors, Ms. Yufengying, President of the Bank and Mr. Luoweikai,
CFO of the Bank undertake that the financial statements in this annual report are true and integrity.
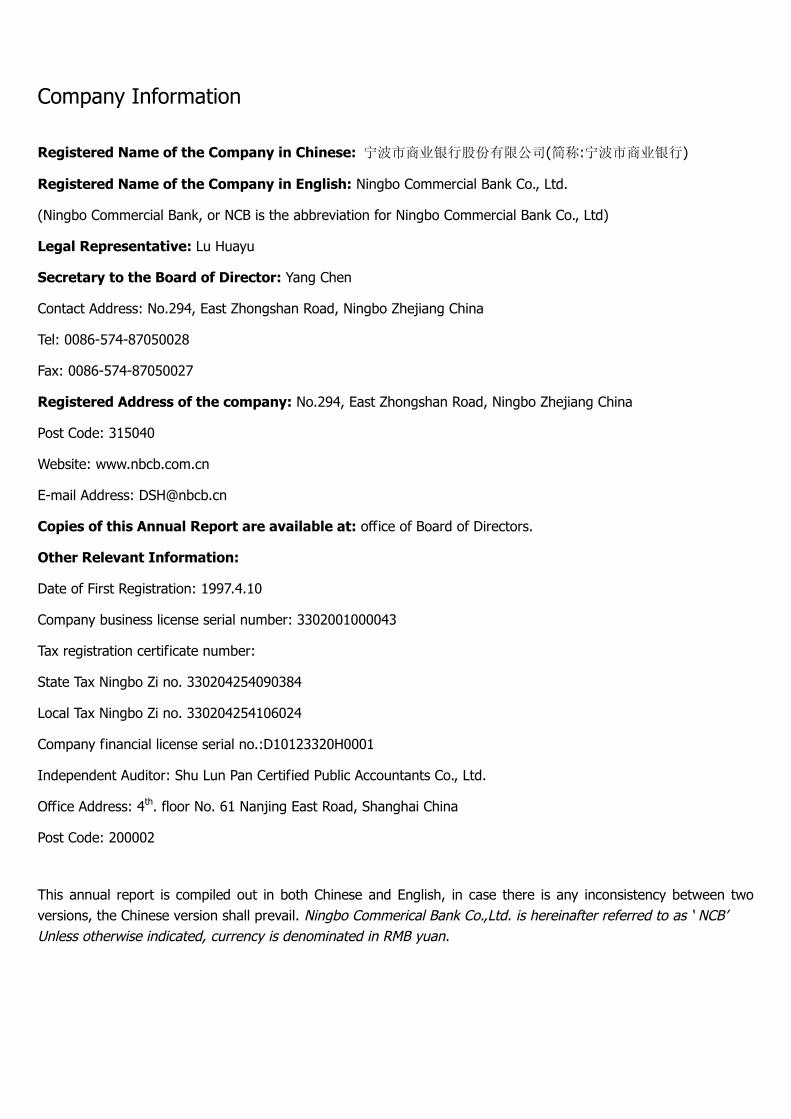
Company Information
Registered Name of the Company in Chinese: 宁波市商业银行股份有限公司(简称:宁波市商业银行)
Registered Name of the Company in English: Ningbo Commercial Bank Co., Ltd.
(Ningbo Commercial Bank, or NCB is the abbreviation for Ningbo Commercial Bank Co., Ltd)
Legal Representative: Lu Huayu
Secretary to the Board of Director: Yang Chen
Contact Address: No.294, East Zhongshan Road, Ningbo Zhejiang China
Tel: 0086-574-87050028
Fax: 0086-574-87050027
Registered Address of the company: No.294, East Zhongshan Road, Ningbo Zhejiang China
Post Code: 315040
Website: www.nbcb.com.cn
E-mail Address: [email protected]
Copies of this Annual Report are available at: office of Board of Directors.
Other Relevant Information:
Date of First Registration: 1997.4.10
Company business license serial number: 3302001000043
Tax registration certificate number:
State Tax Ningbo Zi no. 330204254090384
Local Tax Ningbo Zi no. 330204254106024
Company financial license serial no.:D10123320H0001
Independent Auditor: Shu Lun Pan Certified Public Accountants Co., Ltd.
Office Address: 4th. floor No. 61 Nanjing East Road, Shanghai China
Post Code: 200002
This annual report is compiled out in both Chinese and English, in case there is any inconsistency between two
versions, the Chinese version shall prevail. Ningbo Commerical Bank Co.,Ltd. is hereinafter referred to as ‘NCB’
Unless otherwise indicated, currency is denominated in RMB yuan.

Financial Highlights
Key profits figures in reporting period (unit: in RMB thousand)
Profit before tax 814,196
Net profit 632,085
Operating profit 838,696
Investment income 8093
Net non-operating income -24500
Net cash flow from operating activities 141,410
Net increase in cash and cash equivalents -143,218
Three-year summary of selected financial figures (unit: in RMB thousand)
2006 2005 2004
Operating income 1,600,804 1.230,574 1,039,215
Net profit 632,085 471,951 438,024
Total assets 56,546,233 42,429,348 34,238,004
Equity 3,196,184 2,187,172 1,743,629
Diluted earnings per share (yuan) 0.33 0.26 1.04
Average earnings per share (yuan) 0.33 0.26 1.04
Net assets per share (yuan) 1.56 1.22 0.97
Net cash flow per share from operating activities 0.07 2.55 0.59
Diluted return on equity (%) 19.78 21.58 25.12
Average return on equity(%) 23.79 24.08 301.01
Adjusted net assets per share(yuan) 1.54 1.19 0.94
Three year supplemental financial data (unit: in RMB thousand)
2006 2005 2004
Total liabilities 53,350,049 40,242,176 32,494,375
Total deposit 46,191,396 37,521,242 29,755,055
Long-term deposit 3,702,605 2,469,591 2,472, 997
Placements from banks and
Other financial institutions _ 36,773 _
Total loans 28,134,899 19,609,133 17,295,444
Notes:
Total deposit comprises short-term deposit, short-term savings deposit, fiscal deposit, remittance payable, margin
deposit, outward remittance, short-term guaranteed deposit, long-term deposit, long-term savings deposit and
long-term security deposit;
Long-term deposit includes long-term deposit, long-term savings deposit and long-term security deposit;
Total loans include short-term loans, bill purchasing, refinancing, discounting, medium and long-term loans, overdue
loans and advances, less rediscounting and inter-bank discounting.
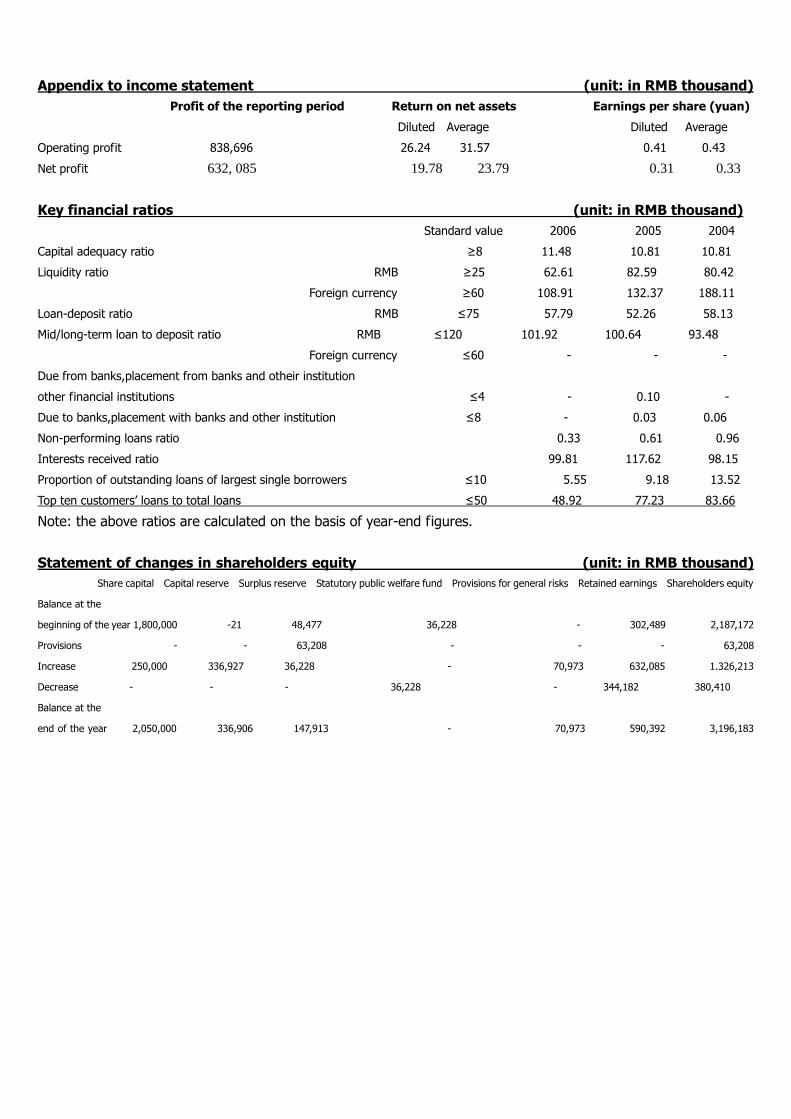
Appendix to income statement (unit: in RMB thousand)
Profit of the reporting period Return on net assets Earnings per share (yuan)
Diluted Average Diluted Average
Operating profit 838,696 26.24 31.57 0.41 0.43
Net profit 632, 085 19.78 23.79 0.31 0.33
Key financial ratios (unit: in RMB thousand)
Standard value 2006 2005 2004
Capital adequacy ratio ≥ 8 11.48 10.81 10.81
Liquidity ratio RMB ≥ 25 62.61 82.59 80.42
Foreign currency ≥ 60 108.91 132.37 188.11
Loan-deposit ratio RMB ≤ 75 57.79 52.26 58.13
Mid/long-term loan to deposit ratio RMB ≤ 120 101.92 100.64 93.48
Foreign currency ≤ 60 - - -
Due from banks,placement from banks and otheir institution
other financial institutions ≤ 4 - 0.10 -
Due to banks,placement with banks and other institution ≤ 8 - 0.03 0.06
Non-performing loans ratio 0.33 0.61 0.96
Interests received ratio 99.81 117.62 98.15
Proportion of outstanding loans of largest single borrowers ≤ 10 5.55 9.18 13.52
Top ten customers’loans to total loans ≤ 50 48.92 77.23 83.66
Note: the above ratios are calculated on the basis of year-end figures.
Statement of changes in shareholders equity (unit: in RMB thousand)
Share capital Capital reserve Surplus reserve Statutory public welfare fund Provisions for general risks Retained earnings Shareholders equity
Balance at the
beginning of the year 1,800,000 -21 48,477 36,228 - 302,489 2,187,172
Provisions - - 63,208 - - - 63,208
Increase 250,000 336,927 36,228 - 70,973 632,085 1.326,213
Decrease - - - 36,228 - 344,182 380,410
Balance at the
end of the year 2,050,000 336,906 147,913 - 70,973 590,392 3,196,183

Financial Highlight
Deposit (unit: in RMB thousand)
0
5000000
10000000
15000000
20000000
25000000
30000000
35000000
40000000
45000000
50000000
2001 2002 2003 2004 2005 2006
Deposit
9798762
Loan (unit: in RMB thousand)
0
5000000
10000000
15000000
20000000
25000000
30000000
2001 2002 2003 2004 2005 2006
Loan
6185380

Changes in Share Capital and Shareholdings of Substantial Shareholders
A. Changes of shareholders (unit: in thousands of shares)
Types Share capital Decrease during the year Iecrease during the year Share capital
(2005/12/31) (2006) (2006) (2006/12/31)
State-owned shares 270.000 _ _ 270,000
(Ningbo Financial Bureau)
Shares held by legal persons 1,156,593 37,777 _ 1,118,816
Shares held by natural persons 373,407 _ 37,777 411,184
Shares held by foreign investors _ _ 250,000 250,000
Total 1,800,000 37,777 287,777 2,050,000
B. Shareholders’information
As of 31 December 2006, the Bank has 3161 shareholders, of which 3 are state-owned shareholders, 116 are legal persons’shares, 1 is
foreign investor, 3040 are natural persons investors.
Top 10 Shareholders as at 31 December 2006 (unit: in thousands of shares)
No. Name End of the year Beginning of the year Increase/Decrease Proportion(%)
1 Ningbo Financial Bureau 27,000 27,000 _ 13.17
2 OCBC Group Singapore 25,000 0 25,000 12.20
3 Fubang (Holdings) Group Co Ltd. 17,900 17,900 _ 8.73
4 Ningbo Huamao Investment & Holding Co., Ltd 17,900 17,900 _ 8.73
5 Ningbo Shanshan Co., Ltd 17,900 17,900 _ 8.73
6 Ningbo Power Development Company 17,900 17,900 _ 8.73
7 Ningbo Youngor (Group) Co., Ltd 17,900 17,900 _ 8.73
8 Ningbo Yunsheng (Group) Co., Ltd 6084 6084 _ 2.97
9 Zhejiang Cuori Electical Appliances (Group)Co., Ltd 5400 5400 _ 2.63
10 Ningbo ETDZ Holdings Co., Ltd. 2,201 2,201 _ - 1.07
Total 155,185 130,185 25,000 75.70
Note: These shares are all ordinary shares.

C. Related party disclosures
1. Loans and credit facilities granted by the Bank to natural person in the Bank and their relatives
(unit: in RMB thousand)
Type of guarantee Approved Line of credit Remaining of approved Line of credit Balance of related loans
(I.E. VIP, Daiyitong, Bailingtong) (Including businesses under Line of
credit)
Secured by collaterals - - 24259
Secured by guarantee - - 3695
Total 3534 543.62 27854
Note: Natural person in the Bank comprises senior management, credit approval staffs, members of credit approval committee and their
closed relatives.
2. Loans and credit facilities granted by the Bank to the related parties of shareholders
who hold more than 5 percent shares
i. Ningbo Shanshan Co., Ltd and its related parties (G001) as at 2006/12/31 (unit: in RMB 10 thousand)
No. Name Line of credit balance Balance deducting guaranteed deposits
Remarks
1. Shanshan (Group) Co., Ltd 8,000 Loans 7,000 7,000
2. Ningbo Shanshan Technology Venturing Investment Co., Ltd - - -
3. Ningbo Shanshan Neo-Material Technology Co., Ltd 4580 Acceptances 1378.241 758.03255
500 Letter of credits 201.135 110.6005
4.Ningbo Shanshan Eco-protection Development Co., Ltd - - -
5.Ningbo Bellsen Maternity Articles Co.,Ltd - Loans 100 100
6. Ningbo Shanshan Garments Co., Ltd 7000 Loans1500 1500
7.China Ningbo International Corporation Co., Ltd - Letter of credits 54.951672 54.951672
8.Zhejiang Technology Imp.&Exp.(Ningbo) Co., Ltd - Loans 500 500
9.Ningbo Qineng Commercial Co., Ltd 500 - -
10..Ningbo Arts and Crafts I/E Co., Ltd USD300 - -
11.Ningbo ETDZ Huixing Trade Co., Ltd 1833.6 Loans 500 500
Acceptances 980 784
Bill purchasing 432.723906 432.723906
12.Ningbo Shanshan Ulica Solar Energy Science & Technology Co., Ltd - -
Total 12646.65 11740.308628
ii.Ningbo Youngor Group Co., Ltd and its relative parties (G002) (unit: in RMB 10 thousand)
No. Name Line of credit Balance Balance deducting guaranteed deposits
Remarks
1. Ningbo Youngor Group Co., Ltd - - -
2. China-base Ningbo Foreign Trade Co., Ltd 25000 Letter of credits 14002.047505 14002.047505
Discounts 1185.256925 1185.256925
3.Ningbo China-base I/E Co., Ltd - Letter of credits 1412.41448 1412.41448
4.Ningbo Free Trade Xinyue International Trade Co., Ltd - - -
5. Ningbo Youngor International Trade and
Transportation Co., Ltd. USD300 Discounts 342.56 342.56
6.Ningbo Qianyi I/E Co., Ltd - Letter of credits 26.59275 22.159774
Total - 16967 16964.438684
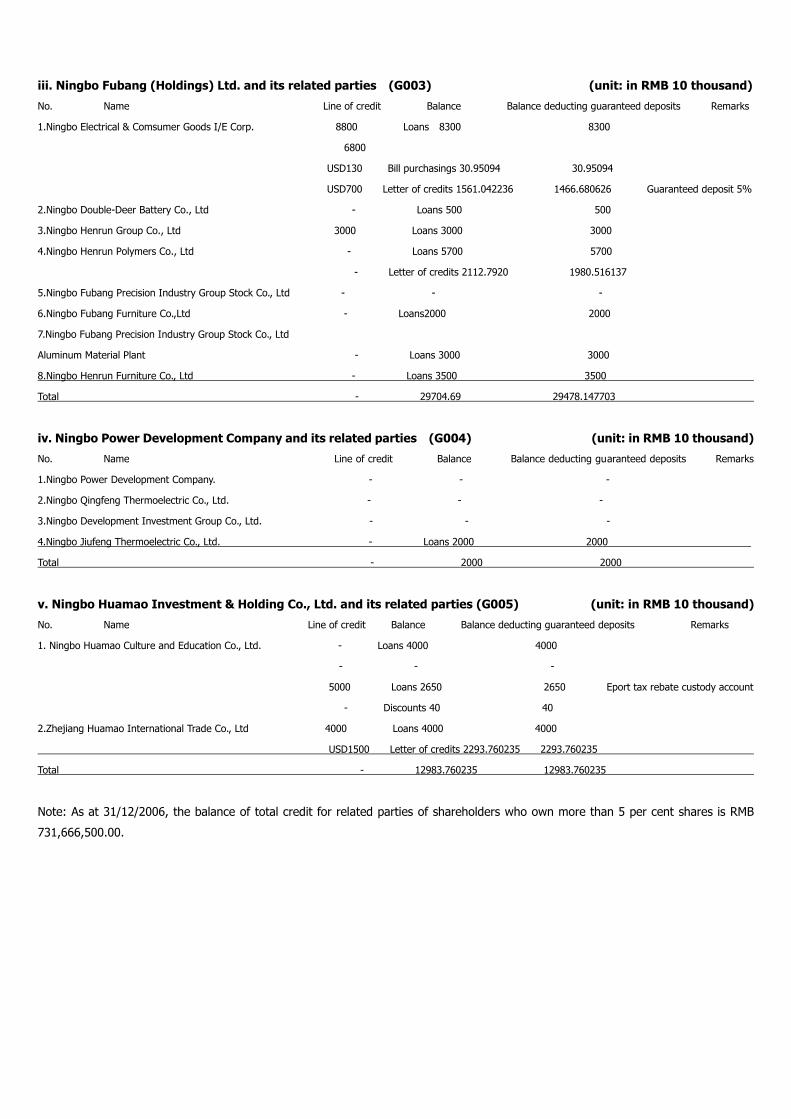
iii. Ningbo Fubang (Holdings) Ltd. and its related parties (G003) (unit: in RMB 10 thousand)
No. Name Line of credit Balance Balance deducting guaranteed deposits Remarks
1.Ningbo Electrical & Comsumer Goods I/E Corp. 8800 Loans 8300 8300
6800
USD130 Bill purchasings 30.95094 30.95094
USD700 Letter of credits 1561.042236 1466.680626 Guaranteed deposit 5%
2.Ningbo Double-Deer Battery Co., Ltd - Loans 500 500
3.Ningbo Henrun Group Co., Ltd 3000 Loans 3000 3000
4.Ningbo Henrun Polymers Co., Ltd - Loans 5700 5700
- Letter of credits 2112.7920 1980.516137
5.Ningbo Fubang Precision Industry Group Stock Co., Ltd - - -
6.Ningbo Fubang Furniture Co.,Ltd - Loans2000 2000
7.Ningbo Fubang Precision Industry Group Stock Co., Ltd
Aluminum Material Plant - Loans 3000 3000
8.Ningbo Henrun Furniture Co., Ltd - Loans 3500 3500
Total - 29704.69 29478.147703
iv. Ningbo Power Development Company and its related parties (G004) (unit: in RMB 10 thousand)
No. Name Line of credit Balance Balance deducting guaranteed deposits Remarks
1.Ningbo Power Development Company. - - -
2.Ningbo Qingfeng Thermoelectric Co., Ltd. - - -
3.Ningbo Development Investment Group Co., Ltd. - - -
4.Ningbo Jiufeng Thermoelectric Co., Ltd. - Loans 2000 2000
Total - 2000 2000
v. Ningbo Huamao Investment & Holding Co., Ltd. and its related parties (G005) (unit: in RMB 10 thousand)
No. Name Line of credit Balance Balance deducting guaranteed deposits Remarks
1. Ningbo Huamao Culture and Education Co., Ltd. - Loans 4000 4000
- - -
5000 Loans 2650 2650 Eport tax rebate custody account
- Discounts 40 40
2.Zhejiang Huamao International Trade Co., Ltd 4000 Loans 4000 4000
USD1500 Letter of credits 2293.760235 2293.760235
Total - 12983.760235 12983.760235
Note: As at 31/12/2006, the balance of total credit for related parties of shareholders who own more than 5 per cent shares is RMB
731,666,500.00.
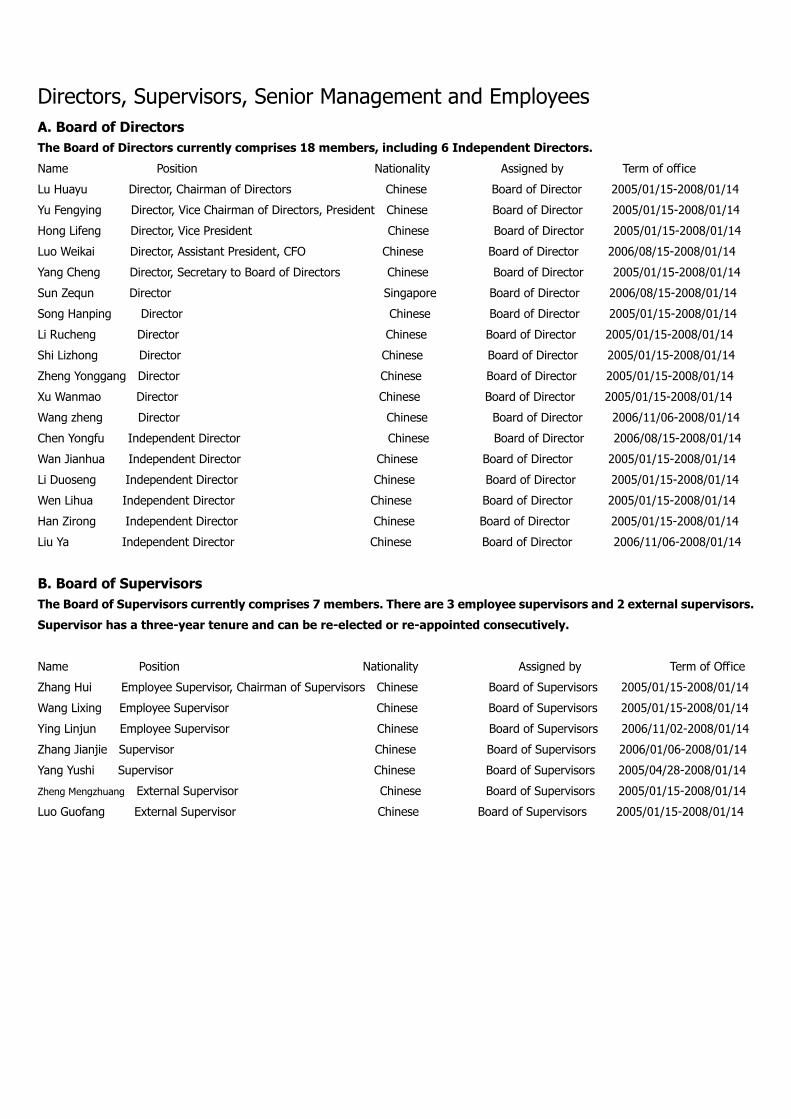
Directors, Supervisors, Senior Management and Employees
A. Board of Directors
The Board of Directors currently comprises 18 members, including 6 Independent Directors.
Name Position Nationality Assigned by Term of office
Lu Huayu Director, Chairman of Directors Chinese Board of Director 2005/01/15-2008/01/14
Yu Fengying Director, Vice Chairman of Directors, President Chinese Board of Director 2005/01/15-2008/01/14
Hong Lifeng Director, Vice President Chinese Board of Director 2005/01/15-2008/01/14
Luo Weikai Director, Assistant President, CFO Chinese Board of Director 2006/08/15-2008/01/14
Yang Cheng Director, Secretary to Board of Directors Chinese Board of Director 2005/01/15-2008/01/14
Sun Zequn Director Singapore Board of Director 2006/08/15-2008/01/14
Song Hanping Director Chinese Board of Director 2005/01/15-2008/01/14
Li Rucheng Director Chinese Board of Director 2005/01/15-2008/01/14
Shi Lizhong Director Chinese Board of Director 2005/01/15-2008/01/14
Zheng Yonggang Director Chinese Board of Director 2005/01/15-2008/01/14
Xu Wanmao Director Chinese Board of Director 2005/01/15-2008/01/14
Wang zheng Director Chinese Board of Director 2006/11/06-2008/01/14
Chen Yongfu Independent Director Chinese Board of Director 2006/08/15-2008/01/14
Wan Jianhua Independent Director Chinese Board of Director 2005/01/15-2008/01/14
Li Duoseng Independent Director Chinese Board of Director 2005/01/15-2008/01/14
Wen Lihua Independent Director Chinese Board of Director 2005/01/15-2008/01/14
Han Zirong Independent Director Chinese Board of Director 2005/01/15-2008/01/14
Liu Ya Independent Director Chinese Board of Director 2006/11/06-2008/01/14
B. Board of Supervisors
The Board of Supervisors currently comprises 7 members. There are 3 employee supervisors and 2 external supervisors.
Supervisor has a three-year tenure and can be re-elected or re-appointed consecutively.
Name Position Nationality Assigned by Term of Office
Zhang Hui Employee Supervisor, Chairman of Supervisors Chinese Board of Supervisors 2005/01/15-2008/01/14
Wang Lixing Employee Supervisor Chinese Board of Supervisors 2005/01/15-2008/01/14
Ying Linjun Employee Supervisor Chinese Board of Supervisors 2006/11/02-2008/01/14
Zhang Jianjie Supervisor Chinese Board of Supervisors 2006/01/06-2008/01/14
Yang Yushi Supervisor Chinese Board of Supervisors 2005/04/28-2008/01/14
Zheng Mengzhuang External Supervisor Chinese Board of Supervisors 2005/01/15-2008/01/14
Luo Guofang External Supervisor Chinese Board of Supervisors 2005/01/15-2008/01/14
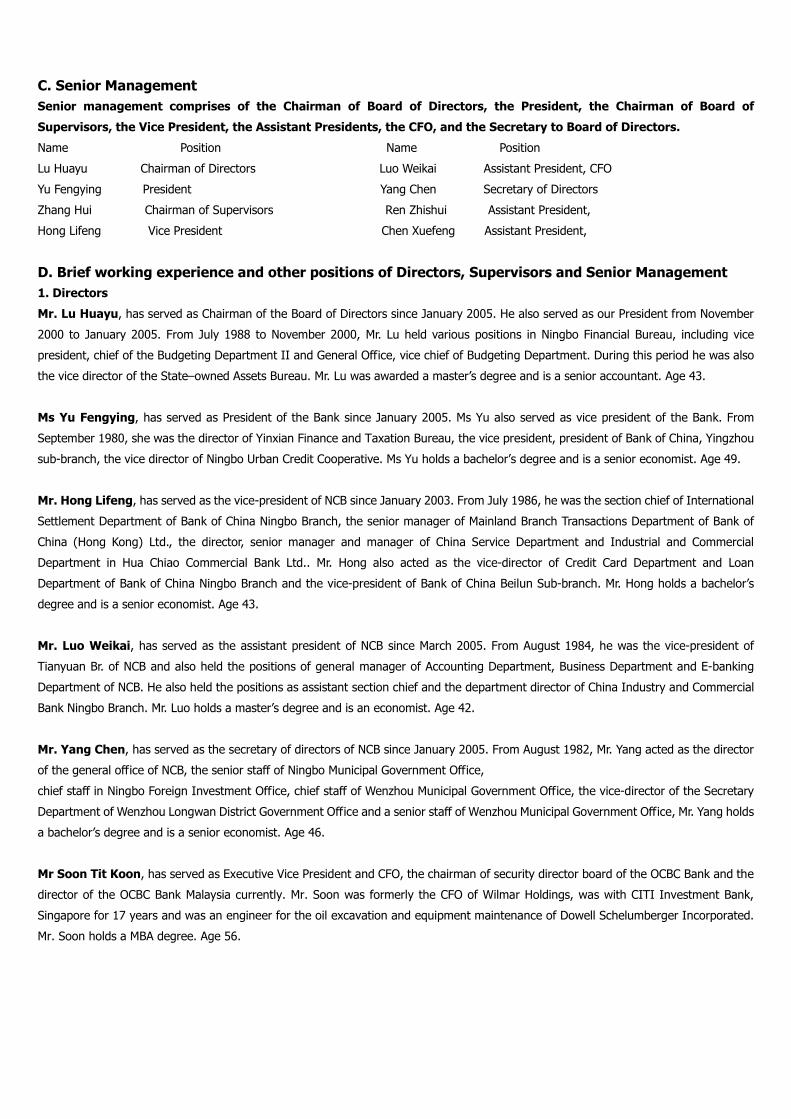
C. Senior Management
Senior management comprises of the Chairman of Board of Directors, the President, the Chairman of Board of
Supervisors, the Vice President, the Assistant Presidents, the CFO, and the Secretary to Board of Directors.
Name Position Name Position
Lu Huayu Chairman of Directors Luo Weikai Assistant President, CFO
Yu Fengying President Yang Chen Secretary of Directors
Zhang Hui Chairman of Supervisors Ren Zhishui Assistant President,
Hong Lifeng Vice President Chen Xuefeng Assistant President,
D. Brief working experience and other positions of Directors, Supervisors and Senior Management
1. Directors
Mr. Lu Huayu, has served as Chairman of the Board of Directors since January 2005. He also served as our President from November
2000 to January 2005. From July 1988 to November 2000, Mr. Lu held various positions in Ningbo Financial Bureau, including vice
president, chief of the Budgeting Department II and General Office, vice chief of Budgeting Department. During this period he was also
the vice director of the State–owned Assets Bureau. Mr. Lu was awarded a master’s degree and is a senior accountant. Age 43.
Ms Yu Fengying, has served as President of the Bank since January 2005. Ms Yu also served as vice president of the Bank. From
September 1980, she was the director of Yinxian Finance and Taxation Bureau, the vice president, president of Bank of China, Yingzhou
sub-branch, the vice director of Ningbo Urban Credit Cooperative. Ms Yu holds a bachelor’s degree and is a senior economist. Age 49.
Mr. Hong Lifeng, has served as the vice-president of NCB since January 2003. From July 1986, he was the section chief of International
Settlement Department of Bank of China Ningbo Branch, the senior manager of Mainland Branch Transactions Department of Bank of
China (Hong Kong) Ltd., the director, senior manager and manager of China Service Department and Industrial and Commercial
Department in Hua Chiao Commercial Bank Ltd.. Mr. Hong also acted as the vice-director of Credit Card Department and Loan
Department of Bank of China Ningbo Branch and the vice-president of Bank of China Beilun Sub-branch. Mr. Hong holds a bachelor’s
degree and is a senior economist. Age 43.
Mr. Luo Weikai, has served as the assistant president of NCB since March 2005. From August 1984, he was the vice-president of
Tianyuan Br. of NCB and also held the positions of general manager of Accounting Department, Business Department and E-banking
Department of NCB. He also held the positions as assistant section chief and the department director of China Industry and Commercial
Bank Ningbo Branch. Mr. Luo holds a master’s degree and is an economist. Age 42.
Mr. Yang Chen, has served as the secretary of directors of NCB since January 2005. From August 1982, Mr. Yang acted as the director
of the general office of NCB, the senior staff of Ningbo Municipal Government Office,
chief staff in Ningbo Foreign Investment Office, chief staff of Wenzhou Municipal Government Office, the vice-director of the Secretary
Department of Wenzhou Longwan District Government Office and a senior staff of Wenzhou Municipal Government Office, Mr. Yang holds
a bachelor’s degree and is a senior economist. Age 46.
Mr Soon Tit Koon, has served as Executive Vice President and CFO, the chairman of security director board of the OCBC Bank and the
director of the OCBC Bank Malaysia currently. Mr. Soon was formerly the CFO of Wilmar Holdings, was with CITI Investment Bank,
Singapore for 17 years and was an engineer for the oil excavation and equipment maintenance of Dowell Schelumberger Incorporated.
Mr. Soon holds a MBA degree. Age 56.
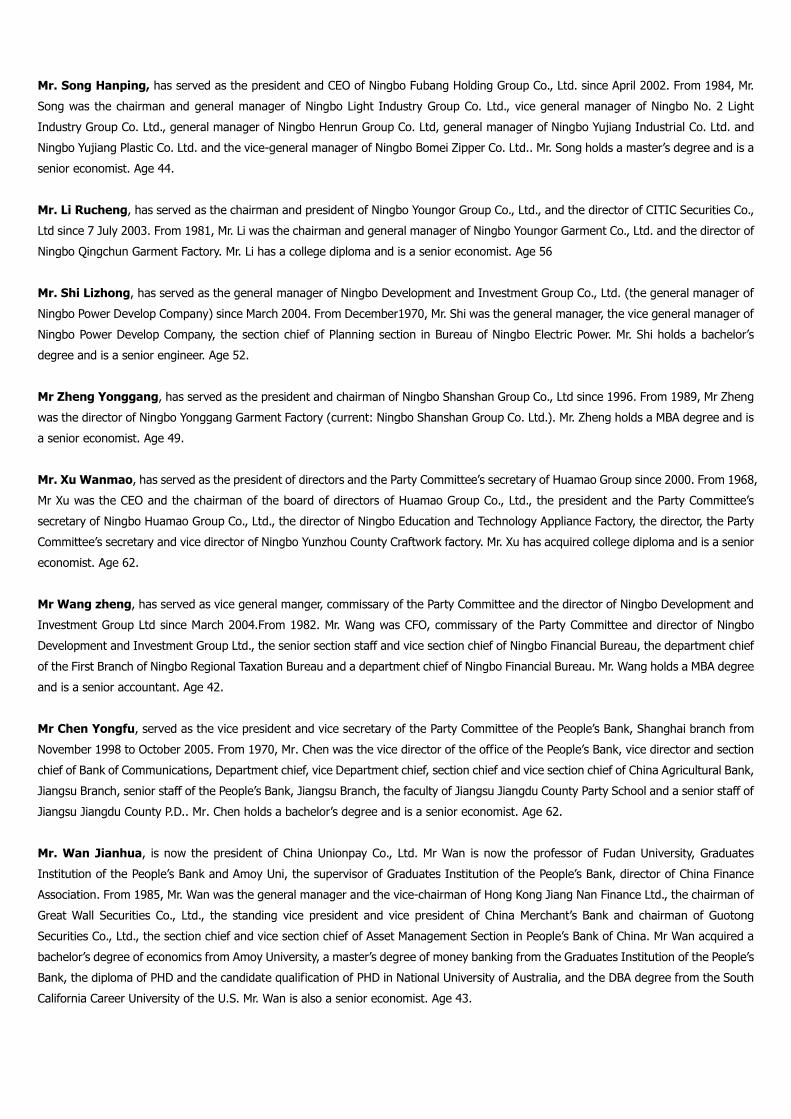
Mr. Song Hanping, has served as the president and CEO of Ningbo Fubang Holding Group Co., Ltd. since April 2002. From 1984, Mr.
Song was the chairman and general manager of Ningbo Light Industry Group Co. Ltd., vice general manager of Ningbo No. 2 Light
Industry Group Co. Ltd., general manager of Ningbo Henrun Group Co. Ltd, general manager of Ningbo Yujiang Industrial Co. Ltd. and
Ningbo Yujiang Plastic Co. Ltd. and the vice-general manager of Ningbo Bomei Zipper Co. Ltd.. Mr. Song holds a master’s degree and is a
senior economist. Age 44.
Mr. Li Rucheng, has served as the chairman and president of Ningbo Youngor Group Co., Ltd., and the director of CITIC Securities Co.,
Ltd since 7 July 2003. From 1981, Mr. Li was the chairman and general manager of Ningbo Youngor Garment Co., Ltd. and the director of
Ningbo Qingchun Garment Factory. Mr. Li has a college diploma and is a senior economist. Age 56
Mr. Shi Lizhong, has served as the general manager of Ningbo Development and Investment Group Co., Ltd. (the general manager of
Ningbo Power Develop Company) since March 2004. From December1970, Mr. Shi was the general manager, the vice general manager of
Ningbo Power Develop Company, the section chief of Planning section in Bureau of Ningbo Electric Power. Mr. Shi holds a bachelor’s
degree and is a senior engineer. Age 52.
Mr Zheng Yonggang, has served as the president and chairman of Ningbo Shanshan Group Co., Ltd since 1996. From 1989, Mr Zheng
was the director of Ningbo Yonggang Garment Factory (current: Ningbo Shanshan Group Co. Ltd.). Mr. Zheng holds a MBA degree and is
a senior economist. Age 49.
Mr. Xu Wanmao, has served as the president of directors and the Party Committee’s secretary of Huamao Group since 2000. From 1968,
Mr Xu was the CEO and the chairman of the board of directors of Huamao Group Co., Ltd., the president and the Party Committee’s
secretary of Ningbo Huamao Group Co., Ltd., the director of Ningbo Education and Technology Appliance Factory, the director, the Party
Committee’s secretary and vice director of Ningbo Yunzhou County Craftwork factory. Mr. Xu has acquired college diploma and is a senior
economist. Age 62.
Mr Wang zheng, has served as vice general manger, commissary of the Party Committee and the director of Ningbo Development and
Investment Group Ltd since March 2004.From 1982. Mr. Wang was CFO, commissary of the Party Committee and director of Ningbo
Development and Investment Group Ltd., the senior section staff and vice section chief of Ningbo Financial Bureau, the department chief
of the First Branch of Ningbo Regional Taxation Bureau and a department chief of Ningbo Financial Bureau. Mr. Wang holds a MBA degree
and is a senior accountant. Age 42.
Mr Chen Yongfu, served as the vice president and vice secretary of the Party Committee of the People’s Bank, Shanghai branch from
November 1998 to October 2005. From 1970, Mr. Chen was the vice director of the office of the People’s Bank, vice director and section
chief of Bank of Communications, Department chief, vice Department chief, section chief and vice section chief of China Agricultural Bank,
Jiangsu Branch, senior staff of the People’s Bank, Jiangsu Branch, the faculty of Jiangsu Jiangdu County Party School and a senior staff of
Jiangsu Jiangdu County P.D.. Mr. Chen holds a bachelor’s degree and is a senior economist. Age 62.
Mr. Wan Jianhua, is now the president of China Unionpay Co., Ltd. Mr Wan is now the professor of Fudan University, Graduates
Institution of the People’s Bank and Amoy Uni, the supervisor of Graduates Institution of the People’s Bank, director of China Finance
Association. From 1985, Mr. Wan was the general manager and the vice-chairman of Hong Kong Jiang Nan Finance Ltd., the chairman of
Great Wall Securities Co., Ltd., the standing vice president and vice president of China Merchant’s Bank and chairman of Guotong
Securities Co., Ltd., the section chief and vice section chief of Asset Management Section in People’s Bank of China. Mr Wan acquired a
bachelor’s degree of economics from Amoy University, a master’s degree of money banking from the Graduates Institution of the People’s
Bank, the diploma of PHD and the candidate qualification of PHD in National University of Australia, and the DBA degree from the South
California Career University of the U.S. Mr. Wan is also a senior economist. Age 43.

Mr. Li Duosen, is now a member of Hong Kong Securities Institute, the independent non-executive director of United Metals holdings
Limited(Listed Company) and the director of Hua Chiao Commercial Bank, Hongkong. Mr. Li was retired on 1 December 2001. He took
various positions in Hua Chiao Commercial Bank from 1963: the director and the deputy general manager, chief of Loan Lending Centre,
Credit Loan Department, Research Department, Management Department of Branch, Banking Department and Business Develop
Department. Meanwhile, from 1985, Mr Li also holds positions as the director of Hong Kong Caizhi Development Co., Ltd., the chairman
and the director of Hong Kong Anlian Trading Co., Ltd., the chairman and the director of Hong Kong Kiu Sheung (Agent) Co., Ltd., the
chairman and the director of Hong Kong Chiao Yue Finance Co., Ltd., the standing director and director of Beijing Yanshan Hotel. Mr. Li
holds a bachelor’s degree. Age 67.
Mr. Wen Lihua, has served as the vice-director of Economy Construction Qualification Committee, the vice-chief of Preparation Office of
China Museum Construction, Ministry of Finance, the director of Culture and History Research Center in Zhejiang University. Mr Wen is
also a professor of Zhejiang University and a part-time professor of Zhejiang University of Finance and Economics, Zhejiang University of
Science and Technology and Zhejiang Province Party Committee School. From September 1967, he was the director of Zhejiang
State-owned Assets Office, director of Zhejiang Local Taxation Bureau and director Zhejiang Financial Bureau, the vice general secretary
of Zhejiang Province Government, the vice director of General Office of Zhejiang Province , the Head of Fenghua County and Yinxian
County. Mr. Wen holds a bachelor’s degree. Age 43.
Mr. Han Zirong, has served as the chief partner of Shenzhen Rongxin Chartered Public Accountant Office. Mr. Han was engaged in
national audit and social audit for years. He was also in charge of overall loan management in ICBC Changchun. Mr. Han has worked in
Loan Management Department of China Industrial and Commercial Bank Changchun Branch for seven years. Mr Han holds a bachelor’s
degree and a CPA certificate. Age 44.
Mr Liu Ya, has served as the vice principal of University of International Business and Economy. Mr Liu is now also the director of the
China Financial Association, the expert getting special allowance from the government, the president of Beijing Jinghua Zhiye Education
and Technology Co.,Ltd. Since December 1984, Mr. Liu was the vice principal and the Party committee member of University of
International Business and Economy, professor and vice principal of China Financial Institution, vice director of Department Of
International Finance, assistant director of International Economics, director of International Finance Research Center, supervisor of
masters in International Finance and the vice professor of international finance in the Economic Department Of University of Liaoning. Mr
Liu holds a PHD degree specialized in International finance and is a professor of finance, supervisor of PHD. Age 48.
2. Supervisors
Mr. Zhang Hui, has served as the chairman of supervisors of NCB since January 2005. He also served as Vice-president of NCB from
December 2000 to January 2005. From April 1978, He held positions as: President of Beilun Branch of NCB, General Manager of Ningbo
Yongxin City Credit Union, secretary of Ningbo Economic Study Centre and Economic Researching Office of Ningbo Government, senior
staff of Ningbo Economic Researching Office. Mr. Zhang holds a bachelor’s degree and is a senior economist. Age 43.
Mr. Wang Lixing, has served as the position as general manager of Settlement Administration Department in NCB since November 2004.
Mr. Wang held various positions in his banking career from November1979: president of NCB’s Yinzhou Br. and Mingzhou Br., director of
Xinye business office of Ningbo City Credit Union, manager of international settlement Department, director of audit section, accounting
section as well as credit section of branch, director of business office of Yinzhou branch of Agricultural Bank of China. Mr. Wang holds a
bachelor’s degree and is a senior economist. Age 48.
Mr. Ying Linjun, has served as the chief of the auditing department of NCB since July 2002. From July 1994, He was vice manager of
business department, chief of accounting department and the vice manager of the operating department of Zhedong Branch, NCB, the
accountant of the financial department of Ningbo Shuangyuan Group Co., Ltd. Mr Ying holds a bachelor’s degree and is an economist. Age
34.
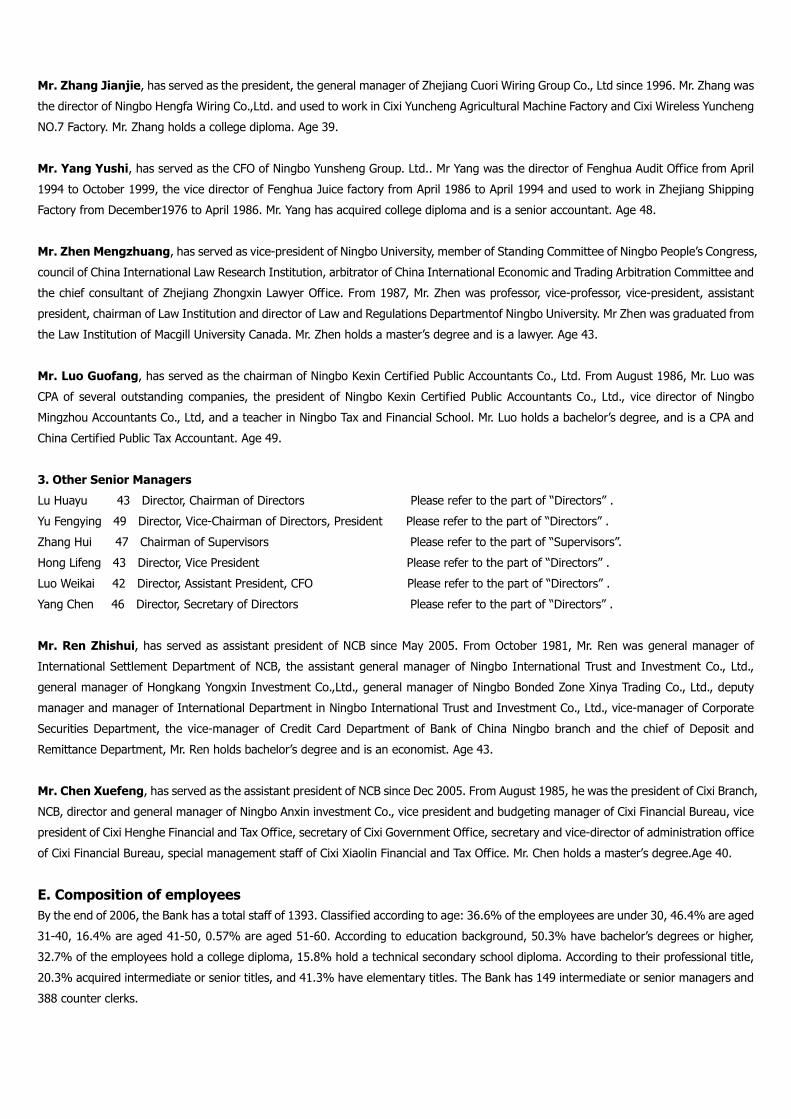
Mr. Zhang Jianjie, has served as the president, the general manager of Zhejiang Cuori Wiring Group Co., Ltd since 1996. Mr. Zhang was
the director of Ningbo Hengfa Wiring Co.,Ltd. and used to work in Cixi Yuncheng Agricultural Machine Factory and Cixi Wireless Yuncheng
NO.7 Factory. Mr. Zhang holds a college diploma. Age 39.
Mr. Yang Yushi, has served as the CFO of Ningbo Yunsheng Group. Ltd.. Mr Yang was the director of Fenghua Audit Office from April
1994 to October 1999, the vice director of Fenghua Juice factory from April 1986 to April 1994 and used to work in Zhejiang Shipping
Factory from December1976 to April 1986. Mr. Yang has acquired college diploma and is a senior accountant. Age 48.
Mr. Zhen Mengzhuang, has served as vice-president of Ningbo University, member of Standing Committee of Ningbo People’s Congress,
council of China International Law Research Institution, arbitrator of China International Economic and Trading Arbitration Committee and
the chief consultant of Zhejiang Zhongxin Lawyer Office. From 1987, Mr. Zhen was professor, vice-professor, vice-president, assistant
president, chairman of Law Institution and director of Law and Regulations Departmentof Ningbo University. Mr Zhen was graduated from
the Law Institution of Macgill University Canada. Mr. Zhen holds a master’s degree and is a lawyer. Age 43.
Mr. Luo Guofang, has served as the chairman of Ningbo Kexin Certified Public Accountants Co., Ltd. From August 1986, Mr. Luo was
CPA of several outstanding companies, the president of Ningbo Kexin Certified Public Accountants Co., Ltd., vice director of Ningbo
Mingzhou Accountants Co., Ltd, and a teacher in Ningbo Tax and Financial School. Mr. Luo holds a bachelor’s degree, and is a CPA and
China Certified Public Tax Accountant. Age 49.
3. Other Senior Managers
Lu Huayu 43 Director, Chairman of Directors Please refer to the part of “Directors” .
Yu Fengying 49 Director, Vice-Chairman of Directors, President Please refer to the part of “Directors” .
Zhang Hui 47 Chairman of Supervisors Please refer to the part of “Supervisors”.
Hong Lifeng 43 Director, Vice President Please refer to the part of “Directors” .
Luo Weikai 42 Director, Assistant President, CFO Please refer to the part of “Directors” .
Yang Chen 46 Director, Secretary of Directors Please refer to the part of “Directors” .
Mr. Ren Zhishui, has served as assistant president of NCB since May 2005. From October 1981, Mr. Ren was general manager of
International Settlement Department of NCB, the assistant general manager of Ningbo International Trust and Investment Co., Ltd.,
general manager of Hongkang Yongxin Investment Co.,Ltd., general manager of Ningbo Bonded Zone Xinya Trading Co., Ltd., deputy
manager and manager of International Department in Ningbo International Trust and Investment Co., Ltd., vice-manager of Corporate
Securities Department, the vice-manager of Credit Card Department of Bank of China Ningbo branch and the chief of Deposit and
Remittance Department, Mr. Ren holds bachelor’s degree and is an economist. Age 43.
Mr. Chen Xuefeng, has served as the assistant president of NCB since Dec 2005. From August 1985, he was the president of Cixi Branch,
NCB, director and general manager of Ningbo Anxin investment Co., vice president and budgeting manager of Cixi Financial Bureau, vice
president of Cixi Henghe Financial and Tax Office, secretary of Cixi Government Office, secretary and vice-director of administration office
of Cixi Financial Bureau, special management staff of Cixi Xiaolin Financial and Tax Office. Mr. Chen holds a master’s degree.Age 40.
E. Composition of employees
By the end of 2006, the Bank has a total staff of 1393. Classified according to age: 36.6% of the employees are under 30, 46.4% are aged
31-40, 16.4% are aged 41-50, 0.57% are aged 51-60. According to education background, 50.3% have bachelor’s degrees or higher,
32.7% of the employees hold a college diploma, 15.8% hold a technical secondary school diploma. According to their professional title,
20.3% acquired intermediate or senior titles, and 41.3% have elementary titles. The Bank has 149 intermediate or senior managers and
388 counter clerks.
Corporate Governance
In 2006, the Bank continued its efforts to improve its corporate governance framework as a joint-stock company, which is in compliance
with the PRC Company Law, the Guidelines for PRC Joint-stock Commercial Banking Corporate Governance and the relevant regulations
promulgated by regulatory authorities. The Bank further revised NCB Articles of Association, Rules for NCB Group Customer and its
Related Parties Credit Risk Management, Rules for Related Parties of Shareholders Credit Risk Management and other relevant rules and
regulations, which enhance and specialize NCB’s management system through the set of processes, policies and institutions.
Shareholders and shareholder’s meeting
The Bank established rules of procedure for Shareholder’s Meeting, and held Shareholder’s Meeting to ensure that all shareholders
especially minority shareholders are recognized and treated equally, can exercise their rights in the Bank. The Bank has set up an
effective channel to communicate with shareholders, reviewe shareholders’opinions and suggestions, which ensure all shareholders are
properly informed and are able to participate in and exercise their voting rights on major issues of the Bank.
Shareholders and the company
Shareholdings of the Bank are decentralized, which means none of the shareholders has genuine control rights over the Bank. The top
five shareholders in the Bank do not have the rights to override the Shareholder’s Meeting intervening the Bank’s business activities and
decision-making directly or indirectly. In respect of employees, assets, financing, institutions, and businesses, the top five shareholders
are independent to the Bank. The Board of Directors, the Board of Supervisors, and internal organizations are able to operate
independently.
Directors and the Board of Directors
According to the Directors’electing procedure to the Articles of Association of the Bank, in 2006, the Board of Directors consists of 18
directors, includes 6 independent directors who bring broad vision and experiences and provide a reasonable specialist structure to the
Board of Directors. The personnel composition is fully in compliance with the laws and relevant regulations with which can not only
effectively represent different parts of investor entities and maintain the benefits for the Bank and Shareholders, but also ensure the
quality and standard of strategies that Board of Directors make as well as the core functions that the Board of Directors have within the
corporate governance. In compliance with relative regulations promulgated, the Board of Directors has set up the Strategic Development
Committee, Audit Committee, Related Party Transaction Control Committee, Risk Management Committee, Nominating Committee and
Remuneration Committee. Other than Strategic Development Committee and Remuneration Committee, the Chairmanship of the other
four committees is assumed by independent directors.
The attendance of the board meetings of the Independent Directors: In 2006, the Board of Directors held 10 meetings, 3 independent
directors attended 10 out of a total of 10 meetings, Mr. Wan Jianhua appointed authorized person attending 2 out of 10 meetings, Mr.
Weng Lihua and Mr. Chen Yongfu entrusted authorized person to attend 1 out of 10 meetings on his behalf.
The attendance of the board meetings of other Directors: In reporting period, Mr. Xu Wanmao and Mr. Zheng Yonggang appointed
authorized person attending 1 out of 10 meetings respectively, other Directors attended all the meetings.
Supervisors and the Board of Supervisors
In 2006, the Board of Supervisors is comprised of 7 supervisors, including 3 employee supervisors and 2 external supervisors, the
personnel structure is in compliance with laws and relative regulation promulgated. The Board of Supervisors has set up the Auditing
Committee and Nomination Committee. Supervisors are able to perform their responsibilities conscientiously for the shareholders. The
Board of Supervisors is responsible for overseeing the Bank’s financial activities and the legality and compliance of the Board of Directors
and Senior Management in performing their roles.

The attendance of the supervisors’meetings of the External Supervisors: in 2006, the Board of supervisors held four meetings, Mr.
Luoguofang attended 4 out of a total 4 meetings, Mr. Zheng Mengzhuang entrusted authorized person to attend 1 out of a total 4
meetings.
The attendance of the supervisors’meetings of other supervisors: in 2006, all other supervisors attended the meetings.
The decision-making system
The Shareholders’ Meeting is the highest authority within the Bank, implementing decision-making, management and supervision
through the Board of Directors and the Board of Supervisors. The president is appointed by the Board of Directors and responsible for the
Bank’s day-to-day business. The Bank implement first tier legal person management system, all branches and subsidiaries do not have
legal personalities. The branches operate their businesses with the authorization of the head office; the head office is responsible for the
civil liabilities.
Information disclosure and transparency
The Bank formulated the information disclosure policy and appointed the secretary of the Board of Directors disclosing information,
reception of visits and giving consultation. The Bank discloses information in compliance with laws, regulations, the Article of Association
and the Bank’s information disclosure policy. Information disclosure is truthful, accurate, complete, and timely which ensure that all
investors are able to receive information fairly.
Shareholder’s Meeting
In January 6, 2006, the Bank held extraordinary Shareholder’s Meeting for the first time, approved introducing strategic foreign investor
into the Bank, amendments to the Article of Association and the changing of directors and supervisors. There are 10 shareholders and the
representative of shareholders who hold 1,639,840,000 shares of the Bank attended the meeting, their shares consist 91.1% of the total
share capitals to the Bank.
The Bank held 2005 Annual Shareholder’s Meeting in April 22, 2006. The meeting approved Report of Board of Director, Report of Board
of Supervisors, 2005 annual financial report, annual budgets, profit distribution plan for the year 2005, strategic development plans for
2006-2008, appointment of external auditors. There are 12 shareholders and representative of shareholders who hold 1,651,662,700
shares attended the meeting. Their shares constitute 91.76% of a total share capital to the Bank.
Amendment of the Articles of Association and the appointment of Mr. Sun Zequn, Mr. Lou Weikai as directors, Mr. Chen Yongfu as
independent director of the Bank were approved at the extraordinary meeting held on August 15, 2006. There are 12 shareholders and
representative of shareholders who hold 1,830,828,416 shares attended the meeting, their shares constitute 89.31% of a total share
capital to the Bank.
In November 6, 2006, the Bank held extraordinary meeting for the third time. The meeting approved the Initial Public Offering and Listing
of A shares scheme, revision of the Articles of Association, rules of procedures for Board of Directors of the Bank, rules of procedures for
Board of Supervisors of the Bank and connected transaction management, all of which are adopted disclosed ballot method. The meeting
approved the resignation of Mr. Zhou Haiming as director of shareholders, appointed Mr. Wang Zeng as director and Mr. Liu Ya as
independent director of the Bank. There are 14 shareholders and representative of shareholders who hold 1,890,246,000 shares attended
the meeting, their shares constitute 92.37% of a total share capital to the Bank.
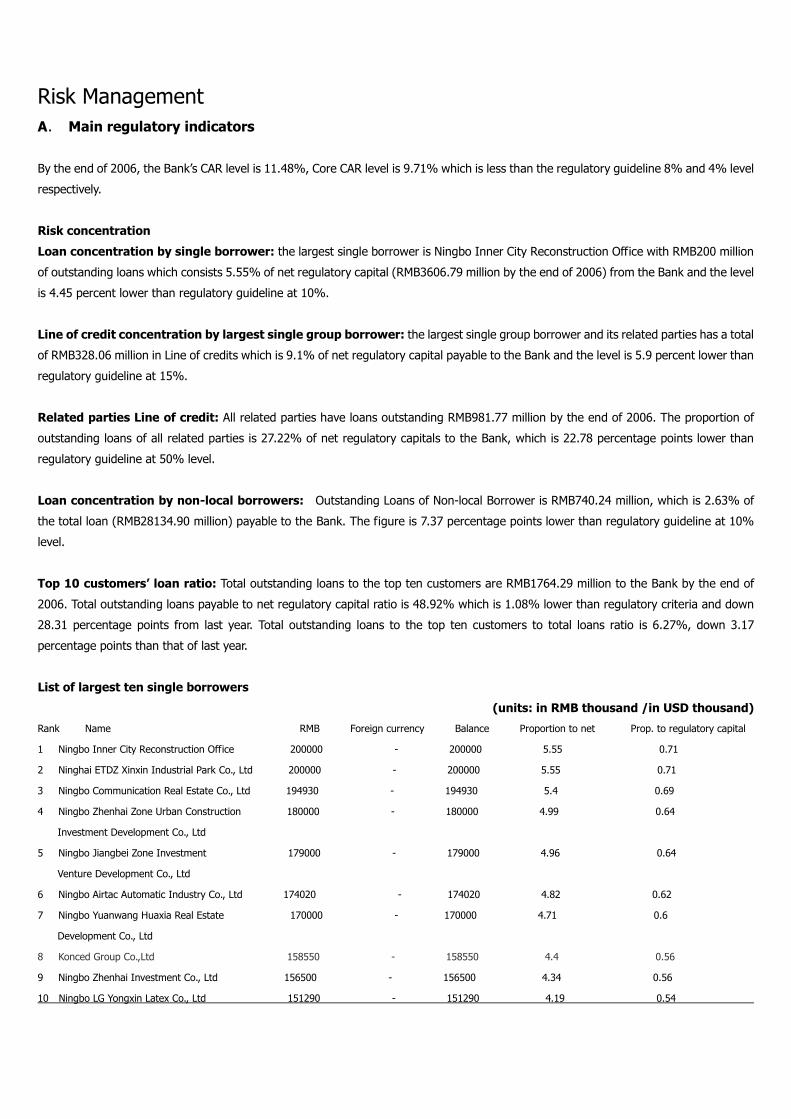
Risk Management
A. Main regulatory indicators
By the end of 2006, the Bank’s CAR level is 11.48%, Core CAR level is 9.71% which is less than the regulatory guideline 8% and 4% level
respectively.
Risk concentration
Loan concentration by single borrower: the largest single borrower is Ningbo Inner City Reconstruction Office with RMB200 million
of outstanding loans which consists 5.55% of net regulatory capital (RMB3606.79 million by the end of 2006) from the Bank and the level
is 4.45 percent lower than regulatory guideline at 10%.
Line of credit concentration by largest single group borrower: the largest single group borrower and its related parties has a total
of RMB328.06 million in Line of credits which is 9.1% of net regulatory capital payable to the Bank and the level is 5.9 percent lower than
regulatory guideline at 15%.
Related parties Line of credit: All related parties have loans outstanding RMB981.77 million by the end of 2006. The proportion of
outstanding loans of all related parties is 27.22% of net regulatory capitals to the Bank, which is 22.78 percentage points lower than
regulatory guideline at 50% level.
Loan concentration by non-local borrowers: Outstanding Loans of Non-local Borrower is RMB740.24 million, which is 2.63% of
the total loan (RMB28134.90 million) payable to the Bank. The figure is 7.37 percentage points lower than regulatory guideline at 10%
level.
Top 10 customers’ loan ratio: Total outstanding loans to the top ten customers are RMB1764.29 million to the Bank by the end of
2006. Total outstanding loans payable to net regulatory capital ratio is 48.92% which is 1.08% lower than regulatory criteria and down
28.31 percentage points from last year. Total outstanding loans to the top ten customers to total loans ratio is 6.27%, down 3.17
percentage points than that of last year.
List of largest ten single borrowers
(units: in RMB thousand /in USD thousand)
Rank Name RMB Foreign currency Balance Proportion to net Prop. to regulatory capital
1 Ningbo Inner City Reconstruction Office 200000 - 200000 5.55 0.71
2 Ninghai ETDZ Xinxin Industrial Park Co., Ltd 200000 - 200000 5.55 0.71
3 Ningbo Communication Real Estate Co., Ltd 194930 - 194930 5.4 0.69
4 Ningbo Zhenhai Zone Urban Construction 180000 - 180000 4.99 0.64
Investment Development Co., Ltd
5 Ningbo Jiangbei Zone Investment 179000 - 179000 4.96 0.64
Venture Development Co., Ltd
6 Ningbo Airtac Automatic Industry Co., Ltd 174020 - 174020 4.82 0.62
7 Ningbo Yuanwang Huaxia Real Estate 170000 - 170000 4.71 0.6
Development Co., Ltd
8 Konced Group Co.,Ltd 158550 - 158550 4.4 0.56
9 Ningbo Zhenhai Investment Co., Ltd 156500 - 156500 4.34 0.56
10 Ningbo LG Yongxin Latex Co., Ltd 151290 - 151290 4.19 0.54

Total 1764290 - 1764290 48.92 6.27
Liquidity ratio: Liquidity ratio is 63.46%, decreased 19.79 percent points than that of last year and 38.46 percentage points over
regulatory standards, which is 25% level.
Mid-long term loan ratio: Mid-long term loan to mid-long term deposit ratio is 101.78%, which is 18.22 percentage points lower than
regulatory standards at 120%.
B. Loan concentration by top five industries (units: in RMB thousand )
Rank Industry Balance Proportion
1 Manufacturing 11220287 39.88
2 Individual person 8128356 28.89
3 Wholesale and retail 3333513 11.85
4 Real estate 1789396 6.36
5 Irrigation works, environmental and public facilities management 839750 2.98
Total 25311302 89.96
C. Loan classification
The Bank started to apply a Ten-category Loan Classification Principle to measure and manage the quality of credit assets from December
2005, which is based on the Five-category Loan Classification Principle. The method further decomposes ‘pass’loan into three categories,
which are pass +, pass and pass-, subdivided ‘special-mention’loan and into special-mention +, special-mention, special-mention – three
categories, classified two levels in ‘substandard’loan, substandard + and substandard.
By the end of 2006, loan outstanding of substandard loan is RMB21.25 million with 8 basis points to the total loan that is 9 basis points
lower than that of at the beginning of the year. Loan outstanding of doubtful loan is RMB9.8 million, representing a decrease of 1 basis
point to 0.03% from that at the beginning of the year. Loss loan dropped 18 basis points to 0.22% with RMB60.81 million loan
outstanding. Total non-performing loans outstanding amount is RMB91.86, which improved 28 basis points to 0.33%.
D. Changes of special provision for loan losses (units: in RMB thousand)
Items 2006 2005 2004
Balance at the beginning of the year 324,226 334,376 540,235
Provision for the year 66,524 35,144 -
Withdraw for the year 40 500 -
Draw back of appreciation of assets value - - 7,542
Write-off 18,399 45,735 198,264
Transfer out - - -
Converting differences -98 -60 -53
Balance as at the end of year 372,294 324,226 334,376
E. Repossessed assets
Repossessed assets are accounted as ‘Assets held for sale’ and reported in ‘Other assets’. As of 31 December 2006, the Bank has
repossessed assets of RMB108.41 million, including RMB104.55 real estate, which consists 96.43% of the total, repossessed assets, and
the remaining is other repossessed assets with RMB3.86 million.
F. Investment in equity and self-owned enterprises
By the end of 2006, the Bank has RMB8.25 million other Long-term Investments, including the investment of China Unionpay Co. Ltd.,
with RMB8 million and RMB250 thousand in City Commercial Bank Clearing House. The Bank has no self-owned enterprises.
G. Non-performing assets management
At the end of 31 December 2006, the Bank’s total assets stood at RMB56487.16, non-performing assets were RMB202.64, with the
non-performing assets ratio of 0.36%.
Strategies:
1. The Bank carried out differentiated and efficient credit policies based on comprehensive market research.
2. The Bank improved and strengthened credit authorization management. The Bank built authorization control systems for the credit
businesses, which ensure the power of credit application approvers at each level can be identified within information technology system.
This system unified credit approval standards for the whole bank, which can guarantee all high risk/ large-scale activities are approved by
the head office through various control and approval procedures.
3. The Bank established rules for the guarantee value estimation. Related to those guaranteed by real estate, the independent appraisal
agents are appointed by the head office who then perform the valuations of pledged real estate, other lower value pledged real estate
appraisal is determined by the branches.
4. The Bank enhanced the NPL monitoring and management system. The Bank improved the NPL monitoring process through real-time
checking of the statements reporting system for newly created NPL. As to those overdue loans recognized as NPLs, these should be
reported to the head office and be disposed by the Special Assets Management Department.
5. The Bank standardized the responsibility of risk assets recognition and investigation. On losses arising, the related person will be
accountable according to the relevant rules and regulations of the Bank.
6. The Bank has a qualified credit application approval team.
7. The Bank has reasonable Provision and Write-off policies for credit losses and bad debts.

H. Main off-balance items and risk management statement
Off-balance sheet (unit: in thousands of RMB)

Items
Balance as at the end
of the year Bails
Assessment
value of
collaterals Unsecured loans
Increase during
the year
Revalua
tion
Advances at
the end of
year
Advances
increase during
the year
RMB 9178823.92 5101434.40 2189349.84 1888039.67 21366299.06 - 904.00 1845820.78
Foreign
currency
1316241.61
224360.95 86620.66 1005260.00 8910976.03 - - 966.44
1.Guarantee
Total 10495065.53 5325795.35 2275970.51 2893299.67 30277275.09 - 904.00 1846787.21
RMB 8856094.46 4938199.33 2174338.20 1743556.93 21103635 - 904.00 1845820.78
Foreign
currency - - - - - - - -
2.Bank acceptances
Total 8856094.46 4938199.33 2174338.20 1743556.93 21103635.35 - 904.00 1845820.78
RMB - - - - - - - -
Foreign
currency 1274724.74 193118.45 86620.66 994985.63 8847049.25 - - 966.44
3.L/C issuing
Total 1274724.74 193118.45 86620.66 994985.63 8847049.25 - - 966.44
RMB 322729.46 163235.07 15011.64 144482.75 262663.71 - - -
Foreign
currency 41517 31242.50 - 10274.37 63926.78 - - -
4.Letter of guarantee
Total 364246.33 194477.57 15011.64 154757.11 326590.49 - - -
RMB - - - - - - - -
Foreign
currency - - - - - - - -5.Guarantee for bond
issuance
Total - - - - - - - -
RMB - - - - - - - -
foreign
currency - - - - - - - -6.Guarantee for convertible
bond Total - - - - - - - -
RMB - - - - - - - -
Foreign
currency - - - - - - - -7.Other guaranty businesses
Total - - - - - - - -
RMB - - - - 111850.00 - - -
Foreign
currency - - - - - - - -8.Commitment
Total - - - - 111850.00 - - -
RMB - - - - 118500.00 - - -
Foreign
currency - - - - - - - -
9.Loan commitment
Total - - - - 11850.00 - - -
RMB - - - - - - - -
Foreign
currency
- - - - - - - -
10.Revolving Line of credit
Total - - - - - - - -
RMB - - - - - - - -
Foreign
currency
- - - - - - - -
11.Other commitment
Total - - - - - - - -
RMB - - - - - - - -12.Financial derivatives
Foreign
currency
- - - - - - - -
13.Options Foreign
currency
- - - - - - - -
14.Swaps Foreign
currency
- - - - - - - -
RMB - - - - - - - -15.Forward for foreign
exchange Foreign
currency
- - - - - - - -

I. Main risks and strategies
As a special financial institution, there are many risks affecting the Bank to certain degrees, such as credit risk, market risk, operational
risk, liquidity risk, reputation/brand risk and other miscellaneous risks which are risks beyond management’s ability to control, regulate
(through policies or legally), and so on.
With sufficient reference to the successful practices of international leading banks, the Bank implemented steady progress in its risk
management system, further improved its risk management ability with a view to promoting complete, centralization, professionalism,
matrix reporting in its risk management reform. Meanwhile, the Bank established rigorous risk monitoring system through combining
internal control and external auditing mechanism. The Bank appointed Ernst and Young, Shu Lun Pan Certified Public Accountants Co.,
Ltd. as independent auditors, was inspected and audited by external regulatory authorities, such as Auditing Bureau, CBRC and PBC
Ningbo.
Credit risk management
1. The Bank further improved and revised policies and guidelines, meanwhile, actively adjusted the credit structure.
In 2006, the Bank enhanced market analysis and prediction, researching changes of different industries of its credit business, realizing
pre-warning controls for credit risk. According to the risk management scheme for the year 2006, which was carried out at the general
meeting of Board of Directors at the beginning of the year, the Bank established ‘the Lending Guidelines of NBCB 2006’, which set up
differentiated guidelines for corporate customers and retail customers.
2. The Bank implemented the internal credit rating of customers, established the credit of entry and exit mechanisms.
The Bank set up an overall customer internal credit rating system through quantitative analysis combined with qualitative analysis, static
and dynamic analysis. Through implementing internal credit rating, the Bank set up its credit entry and exit mechanisms, which is
complied within our risk control requirements, further improved the mix of our loan portfolio with the reduction of NPL arising.
3. The Bank improved its authorization management.The Bank adjusted authorization letters on a timely basis according to the change of
personnel or the previous authorization letters are invalid, meanwhile, we rigorously standardized our re-authorization, temporary
authorization, and specialized authorization management processes. All intercity credit businesses should be authorized by the head
office and operated at tier one branches, other than Bank Acceptance Discount, Commercial Acceptance Bill Discount which is approved
by the head office, Acceptance of 100% security deposits for the Bank Acceptance. Bank Acceptances are operated in tier one branches
and are prohibited to be performed by tier two branches.
4. The Bank strengthened and standardizedits post-credit analysis and inspection control.
5. The Bank implemented a personal lending quantitative credit rating system, which further improved and specialized its credit risk
management.
6. The Bank employed ten-category classification for its credit business, further broke down five-category classification into ten
categories, which are Pass+, Pass, Pass-, Special-mention+, Special-mention, Special –mention-, substandard+, substandard-, doubtful
and loss. We disclosed changes of our asset quality by auditing loan classifications and analyzing asset quality on a seasonal basis; based
on associated data, the Bank implemented five-category classification for the total loan portfolio.
7. The value evaluation management for collaterals and pledged goods was improved and standardized which reduced credit risk for the
Bank. The confirmation of estimated real estate value over equivalent to RMB 2 million should be performed internally by the Risk
Management Department in the head office or by other assets appraisal companies who are appointed by the Risk Management
Department.
Market risk management
1. A series of market risk management policies and rules were set up by the Bank, which ensure market risk management can be
pursuant with the proper documentary rules.
2. The Bank set trading limitation and controls for each trader and created an authorization systemin line with the treasury business. The
Bank manages market risk through setting up investing, trading and stop-loss limits for securities; daily, overnight exposure position limits
and stop-loss limits for foreign exchange. Pursuant to tiered authorization requirements, the Bank implemented tiered authorization
management from the Board of Directors, president, general manager of Treasury Operating Department to the traders.
3. The Bank implemented middle office risk management monitoring to the treasury business.
4. A product innovation committee was set up, which is responsible for the bank’s new products development and management.
Liquidity risk management
1. The Bank set up a series of rules and policies for liquidity risk management, which ensured liquidity risk management, is in accordance
with the correct documentary rules.
2. The Bank set up Asset and Liability Management Committee, which is responsible for the establishment of targets and policies for asset
and liability management, asset and liability operation monitoring and decision-making for significant events concerned with asset and
liability management for the whole bank.
3. The Bank control and monitor regulatory indicators through managing risk level indicators, risk migration indicators and risk offset
indicators.
Operational risk management
1. The Bank established guidance on banking crime resolution 2006, and carried out specific measures and approaches for the Bank to
enhance its competence in fighting banking irregularities. The Bank conducted self-inspection and on-the-spot specific inspection through
a vertical management model, in the corporate line, retail customer line and operational line within the whole bank, which ensured no
material criminal cases occurred in the year 2006.
2. The Bank tried to prevent commercial bribes to enhance curbing rule-breaking irregularities on commercial bribe. The Bank inspected
case by case and put forward specific measures on different divisions to fight against banking violations, such as capital construction,
material purchasing, credit business, special assets management, IT department and sales staffs in branch level.
3. The Bank efficiently and effectively prevented operational risk on account distribution through centralizing account distribution to the
head office in bank acceptance, trade finance in international banking, credit business in personal banking and all other credit business
except discount.
4. The Bank improved operational risk on bank acceptance by setting up rules of operational flow for the Bank acceptance transactions,
which clearly formulated provisions of sales, acceptance and transfer for bank acceptance.
5. Security management for personal E-Banking was improved. The Bank applied dynamic password instead of formerly transaction
password for the personal E-Banking business, which ensured the E-Banking transactions were executed with increased safety .
6. A fingerprint verification system substituted previous operational card in the Bank’s core accounting system AS400 to prevent potential
operational risk in checking and authorization.
7. After June 2006, the head office inspected and audited the branches in respect of corporate banking, personal banking and
administration and carried out internal control assessments for internal monitoring and control of each branches.
8.In order to reduce the information updating risk in IT system, the Bank use Concurrent Version System and two-people updating
principle to control the risk. In respect to mitigating the incomplete test risk, the Bank formulated a program for updating and restoring,
which can return to the correct program version prior to a failure in testing of newly compiled software in time.
Legal and compliance risk management
1. The Bank conducted legal examinations on standard form contract amendments, non-standard form contracts, other non-standard
form contracts that over RMB1 million, business agreements and new products’legal risk prevention, providing assurance to the legality,
compliance and validity of the credit business.
2. The Bank further mitigated legal risks through examining different standard form contracts, formulating specific contract for the new
products.
3. The Bank revised and amended the Article of Association cooperated with an external legal agent, reelected directors and supervisors
of the Board of Directors and the Board of Supervisions which provide effective corporate governance in the Bank.
4. Legal and Compliance risk management provide compliance support to product innovation and process reengineering.
J. Strategies to improve internal control
1. An Internal control system was comprehensively integrated and improved. Pursuant to ‘Commercial Bank Internal Control Guidance’
and ‘Commercial Bank Internal Control Assessment (for trial implementation)’ issued by CBRC, the Bank further formed, revised and
improved infrastructure of the internal control system. By further playing the roll of early risk warning, improving and building an internal
reporting system, the Bank provides assurance as to standardize operations from systems building, preventing initiating of risk. In 2006,
the Bank formulated and revised 192 different material rules and policies.
2. The Operational risk management structure was improved; the rebuilt operational risk prevention processes were implemented and
self-analysis, assessment mechanism of the operational risk was improved which accompanied with the introduction of separating and
controlling front, middle and back offices.
3. The Bank implemented an internal control assessment system within different levels of the branches. An Audit department regularly
assessed internal controls of corporate banking, personal banking and administration management in the different branches. According to
the results of the assessment ratings, the internal control of assessed branches, The results would influence the synthesis business
administration assessment for the branches and is one of the qualification requirements for director and vice director of branches.
4. The Bank adopted vertical inspection for specific governance of internal control in four lines, which are personal banking, corporate
banking, clearing and IT. Audit department in the head office regularly evaluate the result of inspection in respect of branches and
different departments.
Report of the Board of Directors
A. Management discussion and analysis
1. Scope of principal activities and operating conditions
The scope of our principal operating business are various banking businesses approved by the China Banking Regulatory Commission
(CBRC), including: absorption of deposits; release of short-term, medium–term and long-term loans; domestic settlements; discounting;
issuance of financial bonds; issuance, payment, subscription of government bonds on behalf of the state; trade of government bonds;
inter-bank lending/borrowing; bank guarantee; payment/collection agent and insurance agent; safe deposit box; consignment loan of
local fiscal revolving fund; foreign currency deposits, loans, and remittance; international settlement; purchase and sale of foreign
currency; inter-bank foreign currency lending/borrowing; acceptance and discount of foreign-currency paper; foreign currency guarantee;
and all other business under the approval of CBRC.
During the reporting period, the Bank has completed all tasks of the current year by introducing an overseas strategic investor, optimizing
operations and management workflows, actively promoting product services and derivatives, changing the operational concept and
marketing patterns. By the end of the reporting period, the total assets of the Bank reached RMB56.546 billion with a 33.27% increase
from the year-beginning base; deposit amounts increased by 23.10% to RMB46.191 billion; loan amount totaled RMB28.135 billion, with
a increment of 43.48%; net profit reached RMB632 million; ROE reached 23.79%; ROA approached 1.3%; CAR is 11.48%; the core
capital adequacy ratio reached 9.71%; NPL ratio dropped by 0.28% to 0.33% from the beginning of the year; the provision ration soared
to 405.28% with a 145.26% improvement.
During the reporting period, the Bank endeavored to adjust the capital and customer structure. Meanwhile, the personal banking business
was also greatly enhanced. These efforts promoted the business development and improvements reliably and rapidly.
During the reporting period, corporate deposits increased by RMB6.248 billion to RMB36.933 billion; corporate loans amounted
RMB20.007 billion with a growth of RMB4.306 billion; the new effective clients totaled 486 in the whole year.
Saving deposits increased by 35.43% to RMB9.258 billion; saving deposits recorded 20.04% of the total deposit amount, raised by 1.82%;
personal loan balance increased by 107.93% to RMB8.128 billion; personal loan represents 28.89% of the total loan amount, a growth of
8.96%.
Newly issued HuiTong deposit cards reached 531.5 thousand and outstanding card amount totaled 928.8 thousand. Our credit card
increased by 75 thousand and its total issuance is 102.5 thousand.
We realized USD4.73 billion in International Banking, recording a growth of 39%. E-banking volume accumulated RMB78.971 billion, or
RMB6.581 billion on a monthly average.
At the same time, the Bank actively developed its treasury business. In Oct. 2006, we were approved to operate financial derivatives,
becoming the forth city commercial bank actively participating in this business area. Our first HuiTong RMB/foreign currency (FC) product
has been launched. In 2006, we issued certificate T-bonds with an amount of RMB780 million, which constitutes one-thirds of the total
amount of certificate T-bonds issued in Ningbo. We realized earnings of RMB409 million in dealing T-bills. By steadily developing the
trading business, which earned RMB25.28 million.

i. Increment of major operating income, operating profit, net profit, cash equivalents during the reporting period.
(unit: in RMB thousand)
Items Closing balance Balance of the prior year Increase/Decrease%
Operating income 1,600,803.72 1,230,573.95 30.09
Operating profit 838,695.90 653,380.64 28.36
Net profit 632,084.51 471,950.69 33.93
Balance of cash and cash equivalent 5,249,506.15 5,392,724.11 -2.66
ii. Comparisons of the total assets and equity between the starting balance and closing balance.
(unit: in RMB thousand)
Items Closing balance Starting balance Increase/Decrease %
Total assets 56,546,232.89 42,429,347.76 33.27
Equity 3,196,183.70 2,187,172.07 46.13
iii. Our organizations
The Bank has 68 branches and outlets and 38 remote-ATMs at present.
iv. Principal products and market share
At the end of the reporting period, the total deposits are RMB46.191 billion, constituting 9.81% of the market. The total loan recorded
RMB28.135 billion, occupying 7.21% of the market. The accumulated credit card issuance is 102.5 thousand, ranking it number 1
amongst other lenders in Ningbo city.
2. Major holding companies
(unit: in RMB thousand)
Name Investment tenor Proportions of total shares(%) Shares at the end of the year
China UnionPay Co., Ltd. 0.48 8,000.00
City Commercial Bank Fund Clearing House 0.83 250.00
3. Major clients
During the reporting period, the Bank’s top-10 borrowers are as following:
(unit: in RMB thousand)
Name of clients Industry Loan balance Ratio
Ningbo Inner City Reconstruction Office Irrigational, environmental
and public facilities management 200,000.00 0.71
Ninghai ETDZ Xinxin Industrial Park Co., Ltd Public management and social
organization 200,000.00 0.71
Ningbo Communication Real Estate Co., Ltd. Real estates 194,930.00 0.69
Ningbo Zhenhai Zone Urban Construction
Investment Development Co., Ltd. Real estates 180,000.00 0.64
Ningbo Jiangbei investment
Venture Development Co., Ltd. Public management and social
organization 179,000.00 0.64
Ningbo Airtac Automation Industry Co., Ltd. Manufacturing 174,022.70 0.62
Ningbo Yuanwang Huaxia Real estate Co., Ltd Real estate 170,000.00 0.60
.
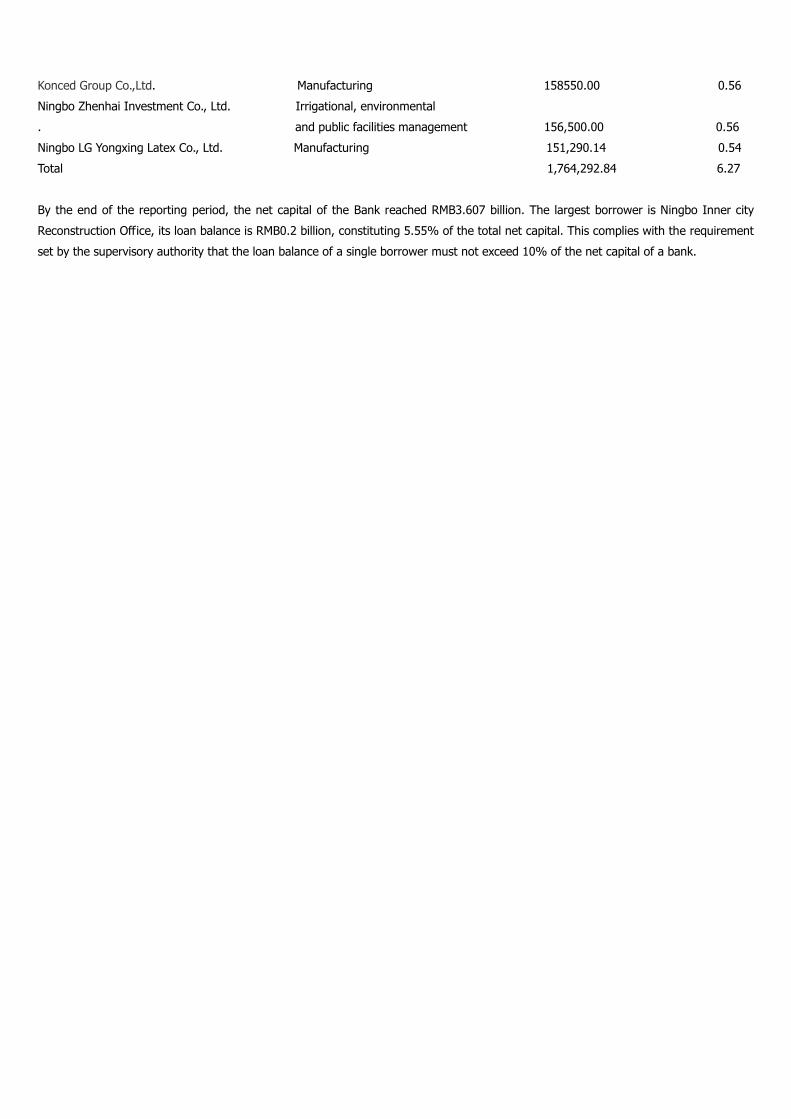
Konced Group Co.,Ltd. Manufacturing 158550.00 0.56
Ningbo Zhenhai Investment Co., Ltd. Irrigational, environmental
. and public facilities management 156,500.00 0.56
Ningbo LG Yongxing Latex Co., Ltd. Manufacturing 151,290.14 0.54
Total 1,764,292.84 6.27
By the end of the reporting period, the net capital of the Bank reached RMB3.607 billion. The largest borrower is Ningbo Inner city
Reconstruction Office, its loan balance is RMB0.2 billion, constituting 5.55% of the total net capital. This complies with the requirement
set by the supervisory authority that the loan balance of a single borrower must not exceed 10% of the net capital of a bank.
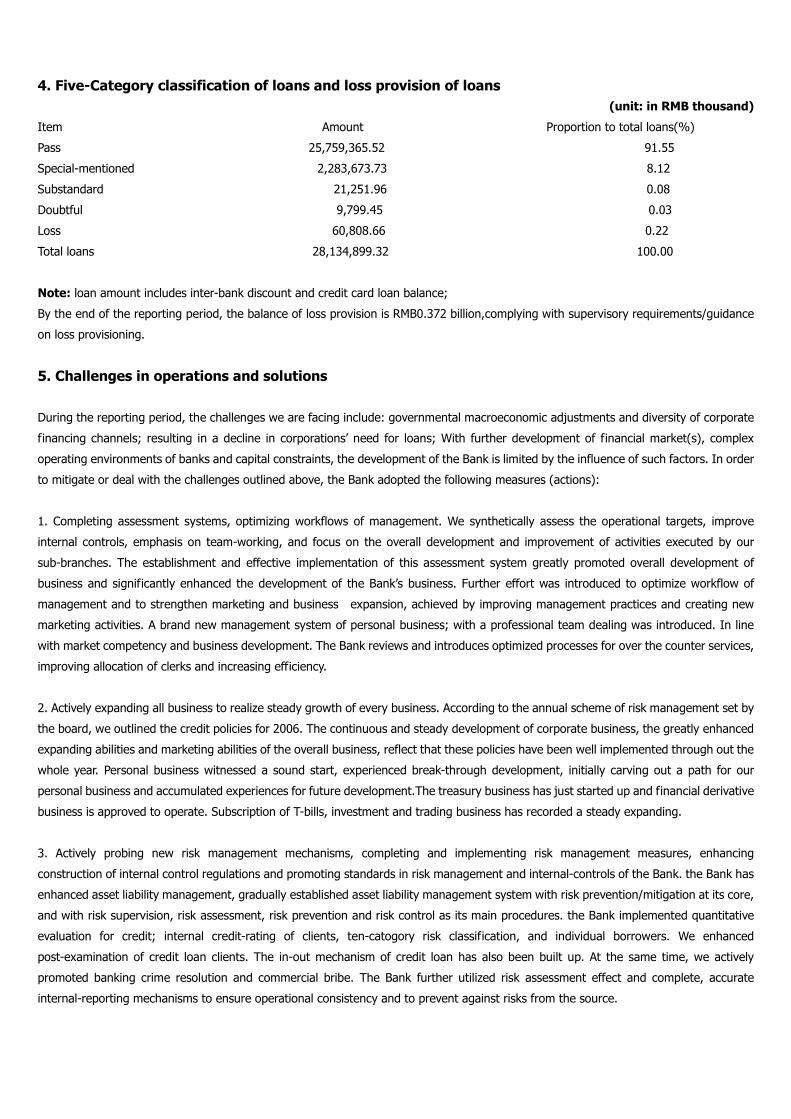
4. Five-Category classification of loans and loss provision of loans
(unit: in RMB thousand)
Item Amount Proportion to total loans(%)
Pass 25,759,365.52 91.55
Special-mentioned 2,283,673.73 8.12
Substandard 21,251.96 0.08
Doubtful 9,799.45 0.03
Loss 60,808.66 0.22
Total loans 28,134,899.32 100.00
Note: loan amount includes inter-bank discount and credit card loan balance;
By the end of the reporting period, the balance of loss provision is RMB0.372 billion,complying with supervisory requirements/guidance
on loss provisioning.
5. Challenges in operations and solutions
During the reporting period, the challenges we are facing include: governmental macroeconomic adjustments and diversity of corporate
financing channels; resulting in a decline in corporations’need for loans; With further development of financial market(s), complex
operating environments of banks and capital constraints, the development of the Bank is limited by the influence of such factors. In order
to mitigate or deal with the challenges outlined above, the Bank adopted the following measures (actions):
1. Completing assessment systems, optimizing workflows of management. We synthetically assess the operational targets, improve
internal controls, emphasis on team-working, and focus on the overall development and improvement of activities executed by our
sub-branches. The establishment and effective implementation of this assessment system greatly promoted overall development of
business and significantly enhanced the development of the Bank’s business. Further effort was introduced to optimize workflow of
management and to strengthen marketing and business expansion, achieved by improving management practices and creating new
marketing activities. A brand new management system of personal business; with a professional team dealing was introduced. In line
with market competency and business development. The Bank reviews and introduces optimized processes for over the counter services,
improving allocation of clerks and increasing efficiency.
2. Actively expanding all business to realize steady growth of every business. According to the annual scheme of risk management set by
the board, we outlined the credit policies for 2006. The continuous and steady development of corporate business, the greatly enhanced
expanding abilities and marketing abilities of the overall business, reflect that these policies have been well implemented through out the
whole year. Personal business witnessed a sound start, experienced break-through development, initially carving out a path for our
personal business and accumulated experiences for future development.The treasury business has just started up and financial derivative
business is approved to operate. Subscription of T-bills, investment and trading business has recorded a steady expanding.
3. Actively probing new risk management mechanisms, completing and implementing risk management measures, enhancing
construction of internal control regulations and promoting standards in risk management and internal-controls of the Bank. the Bank has
enhanced asset liability management, gradually established asset liability management system with risk prevention/mitigation at its core,
and with risk supervision, risk assessment, risk prevention and risk control as its main procedures. the Bank implemented quantitative
evaluation for credit; internal credit-rating of clients, ten-catogory risk classification, and individual borrowers. We enhanced
post-examination of credit loan clients. The in-out mechanism of credit loan has also been built up. At the same time, we actively
promoted banking crime resolution and commercial bribe. The Bank further utilized risk assessment effect and complete, accurate
internal-reporting mechanisms to ensure operational consistency and to prevent against risks from the source.

4. Promoting strategic co-operation with OCBC Singapore. We constructed ‘Five-year A Hundred Persons Fostering Plan’and Technology
Assistance Commission with OCBC. The plan now is entering into the implementing phase. Four groups of our personnel will be sent to
OCBC to learn about and investigate the retail business, treasury business, financial business, corporate banking business and risk
management. OCBC will also dispatch staff to assist the preparation, application and product development of our financial derivative
business.
5. Improving exchange of employees and strengthening man-power reservation. In line with human-resource demand of our business
development, we actively improved human-resource planning, allocation and hiring. In order to resolve personnel gaps in sub-branches,
we have accepted 224 college graduates in 2006. the Bank expanded the channel of personnel introducing and enrolled senior talents
specialized in wealth management, cash management, trasury management products from overseas. We have also run all kinds of
specific fundamental training to promote the quality of our employees.
6. Promoting development of technology system to support the business development and risk management. Based on perfecting the
AS/400 core system, we actively developed other business systems, including completion of 1104 statements supervisory system,
utilization of small-amount-payment system, completion of the first phase of Customer Service Center, initiation of data-base construction,
basic completion of audit sheets system, implementation of corporate-class CIF(customer information foundation) system construction,
preliminary construction of CIF system and introducing and development of money management system. The completion and
construction of these systems provided business development and risk management ability with powerful technical assurance.
7. Praperation an IPO program and implementing tran-regional operations. In order to speed up our business development, raise
operation/management standards and core competency, and to build up capital-supplementary mechanism, the Bank launched an IPO
application program in Aug. 2006. Under our efforts, IPO application materials were officially accepted by CSRC (China Security
Regulatory Commission) IN Nov. 2006. Meanwhile, in order to promote comprehensive competency and expand business development
scope, the Bank applied to set up a Shanghai Branch, and the supervisory authority approved our application in Jan. 2007.
8. Further strengthening the construction of the Board of Directors, promoting operating efficiency and decision-making ability, perfecting
corporate governance mechanism and standardizing corporate governance activities. Based on the completion of special commissions of
the Board, these commissions better performed their effects, the Board of Directors continuously promoted its operating quality and
efficiency to ensure all businesses run healthily. We formulated and implemented the Bank’s ‘Three-year Development Plan’, constructed
IPO scheme according to requirements imposed on IPO program, we further enhanced the construction of corporate governance
mechanism, modified the Bank’s article of association and the discussion rules of the Board of Shareholders and the Board of Directors.
We formulated methods of introducing independent directors to the board the implementation method of the trading rules of related
parties, the method of investor relationship management, the method of information release management, the detailed working rules of
the board secretaries, and the detailed working rules of the presidents. According to the requirements placed on corporate governance,
the Bank adjusted and supplemented members in the Board of Directors and the Special Commissions, and optimized the structure of
corporate governance. The assessment mechanism for directors and mutual-assessment mechanism for independent directors, the
appraisal mechanism for senior management and senior managers have been established. We also further perfected and implemented
communication-feedback mechanism, implemented reporting mechanism of highlighted affairs among directors, so that the directors’
right of being informed is ensured.
B. Statement of capital raising
Under its replied document (Yinjianfu[2006]No.115), CBRC has approved OCBC to make investment to the Bank in a manner of increasing
capital and expanding shares outstanding. OCBC purchased 250 million shares of our stock for RMB570 million at RMB2.28 per share. The
fund was received on 9th Jun 2006, which was also examined by Kexin Certified Public Accountants (Kexin yanbao zi[2006]No.082) and a
capital vertification report was issued. After that, the registered capital of the Bank has increased from RMB1.8 billion to RMB2.05 billion,
12.2% of which are shares of OCBC.
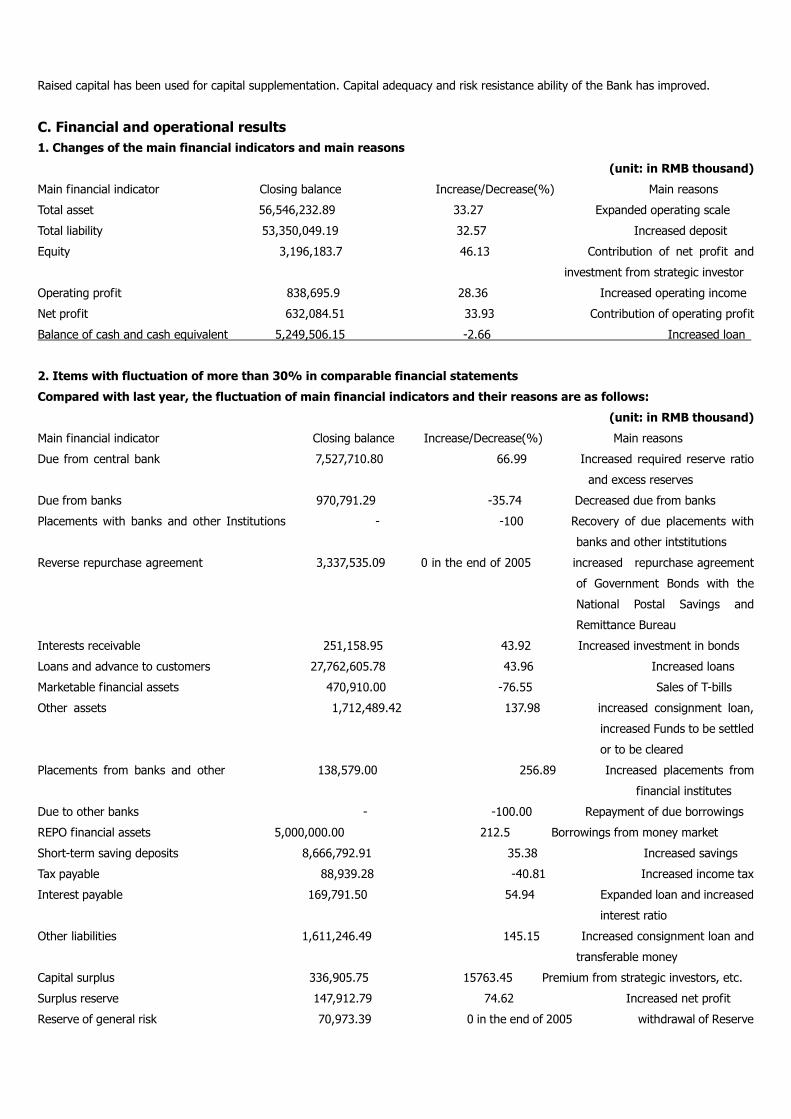
Raised capital has been used for capital supplementation. Capital adequacy and risk resistance ability of the Bank has improved.
C. Financial and operational results
1. Changes of the main financial indicators and main reasons
(unit: in RMB thousand)
Main financial indicator Closing balance Increase/Decrease(%) Main reasons
Total asset 56,546,232.89 33.27 Expanded operating scale
Total liability 53,350,049.19 32.57 Increased deposit
Equity 3,196,183.7 46.13 Contribution of net profit and
investment from strategic investor
Operating profit 838,695.9 28.36 Increased operating income
Net profit 632,084.51 33.93 Contribution of operating profit
Balance of cash and cash equivalent 5,249,506.15 -2.66 Increased loan
2. Items with fluctuation of more than 30% in comparable financial statements
Compared with last year, the fluctuation of main financial indicators and their reasons are as follows:
(unit: in RMB thousand)
Main financial indicator Closing balance Increase/Decrease(%) Main reasons
Due from central bank 7,527,710.80 66.99 Increased required reserve ratio
and excess reserves
Due from banks 970,791.29 -35.74 Decreased due from banks
Placements with banks and other Institutions - -100 Recovery of due placements with
banks and other intstitutions
Reverse repurchase agreement 3,337,535.09 0 in the end of 2005 increased repurchase agreement
of Government Bonds with the
National Postal Savings and
Remittance Bureau
Interests receivable 251,158.95 43.92 Increased investment in bonds
Loans and advance to customers 27,762,605.78 43.96 Increased loans
Marketable financial assets 470,910.00 -76.55 Sales of T-bills
Other assets 1,712,489.42 137.98 increased consignment loan,
increased Funds to be settled
or to be cleared
Placements from banks and other 138,579.00 256.89 Increased placements from
financial institutes
Due to other banks - -100.00 Repayment of due borrowings
REPO financial assets 5,000,000.00 212.5 Borrowings from money market
Short-term saving deposits 8,666,792.91 35.38 Increased savings
Tax payable 88,939.28 -40.81 Increased income tax
Interest payable 169,791.50 54.94 Expanded loan and increased
interest ratio
Other liabilities 1,611,246.49 145.15 Increased consignment loan and
transferable money
Capital surplus 336,905.75 15763.45 Premium from strategic investors, etc.
Surplus reserve 147,912.79 74.62 Increased net profit
Reserve of general risk 70,973.39 0 in the end of 2005 withdrawal of Reserve

of ordinary-risk
Operating income 1,600,803.72 30.08 Expanded operating scale
Interest income 2,218,734.53 34.00 Increased loan
Interests expense 735,601.54 49.92 Increased liabilities
Fees and commissions income 128,457.88 62.12 Increased income from
inter-business
Investment gains 8,093.13 732.50 Increased investment
in government bonds
Other operating income 2,791.63 66.02 Increased income
from leasing
Operating expense 762,107.83 32.03 Expanded operating scale
Operating tax and additions 100,006.39 38.26 ncreased taxable operating
income in year 2006
Administration expense 601,779.02 29.12 Increased provision of loan-loss
Impairment losses 59,655.77 66.33 Net income from sales
of fixed assets
Non-operating income 11,067.28 39.16
Non-operating expense 35,567.24 430.35 Withdrawal of reserve
of general risk
D. Strategies for the new year
Guidance of development in the new year. In 2007, under the leadership of the Board of Directors and based on the concept of
maximizing shareholders’returns, the Bank will grasp the opportunities of the successful IPO and tran-regional operation, aim at increase
the ratio of economic capital return, follow the path of business structure adjustment, utilise technology as an enabler, deepen reform of
business and management workflows, perfect risk management skills, enhance construction of internal-controls, optimize personnel
quality, continuously promote the transformation of operating and managing patterns, further raise comprehensive competency, speed up
development of overall business.
Operational plans for the new year
To realize profit before provision RMB1 billion and net profit RMB 0.72 billion
To achieve RONA 20% and ROE 35%
To ensure CAR above 9%
To confine NPL ratio within 1%
Main measures
1. Steadily promoting IPO program and the construction of Shanghai Branch. Actively prepare for IPO. At the same time, the Bank shall
pay close attention to presentation and staff enrollment of Shanghai Branch, promote programming and research of market and
advertising, we strive to open our Shanghai Branch by the end of June 2007. We shall further adjust and lay out our networks in Ningbo
city, enhance deployment of networks in key rural areas to develop financial services in countryside.
2. Further perfecting assessment mechanism and structure of organization. We shall implement economic capital management, construct
effective and scientific assessment/incentive mechanism, promote harmonious development of overall business and management ability.
Based on the management structure implemented last year, we shall adjust the structure of business management organization, enhance
the management of business-line, and improve efficacy of management and efficiency of services.
3. Continuously and greatly promoting steady development of overall business. We shall deepen and promote large/medium scaled
corporate business to ensure sound profit for the Bank, utilize new marketing methods and management patterns to put great efforts to
develop small scaled corporate business and to promote it not only to gain remarkable breakthrough quantitatively but also improve the
contribution rate from small scaled corporations. We shall maintain the development trend of 2006, continuously create and grasp market
opportunities, endeavor to achieve rapid and sound development of personal business, and actively and steadily improve treasury
business based on derivative products.
4. Improve overall risk management
i. Credit-risk management. We shall enhance the management of highest comprehensive credit-line granting upon individual and group
related party clients, set up corresponding regulations and uniform credit-line granting standards, set up inter-bank credit-line granting
regulations, manage inter-bank fund transaction collectively within the context of inter-bank credit-line granting management,
continuously enhance the construction of models on client rating and risk classification improve the accuracy of client credit rating and
risk classification, enhance the portfolio risk management on credit assets, make analysis in a regular manner upon the variation of credit
assets with different products, different tenor, different credit grades, different guarantees, in different industry and different regions to
accumulate experience in portfolio risk management on credit assets. We shall implement quality assessment on research before granting
loans and examination reports after granting loans, and incorporate this into ranking management of sub-branches.
ii. Liquidity-risk control management. We shall gradually employ quantitative methods to supervise and control liquidity-risk. It is assumed
to complete asset/liability management system so as to provide asset/liability management and liquidity-risk management with
systematic tools. By introducing advanced asset/liability management system, we are able to build up more scientific indicators and
models of liquidity-risk management, and to continuously improve liquidity-risk management ability.
iii. Mark-risk control management. According to needs of treasury business, we regularly adjust trade volume limits, stop-loss limits and
risk limits so as to further optimize the market-risk limits of the Bank. We shall implement revaluation of daily trade position, regularly
assess market-risk, and implement effective risk limits management. Further more, we shall improve market-risk supervisory indicators,
perfect market-risk management mechanism, and optimize the workflows of market-risk management.
iv. Operational-risk management. We shall continuously complete internal-control system and perfect internal-control mechanism and
operational-risk management. Specific personnel in charge of operational-risk in Risk Management Department and personnel in charge
of risk management in any other departments will be appointed to be responsible for management and report the operational-risk and
other risks in their business line or within their own departments. We shall build up a report mechanism and open specific report channels
to encourage employees to report against any violations in operational activities, enhance personnel management and pay attention to
moral risks of employees, hold emergency maneuvers against deviation, improve the crisis handling capacity and continuous operating
capacity of the IT system.
5. Speeding up IT construction and training of personnel to provide business development with powerful technology and human-resource
support. We shall enhance informational construction based on service channels, workflows and operational aspects, product system and
infrastructures. At the same time, training of staffs and professionals are to have special attention.
6. Further improving corporate governance. Firstly, we shall define the rights, obligations, and relationships of
‘Three-Boards-and-One-Management’that complies with the requirements imposed to listed companies based on completing mechanism
and law issued like ‘Corporate Law’, ‘Commercial Bank Law’, and ‘Guidance of articles of association for Listed Companies’. This will enable
the Board of Directors to completely act as a pivotal role in corporate governance. We shall continuously perfect the evaluation
mechanism and assessment system for directors, supervisors and senior management. Secondly, we shall conscientiously take
responsibilities and improve decision-making ability. The special committees should fully act as core parts to discuss thoroughly over
issues like development strategic of the Bank, significant operational decisions, risk management, relatived party transactions and
management of asset-liability ratio. Finally, work on Information release should be focused on. According to requirements upon listed
companies, we shall further improve the quality of information released and enhance its transparency, formulate and implement effective
information report and feedback mechanism, increase and improve channels of information reporting, defend the rights and interests of
shareholders, construct sound inter-action between the Bank and the investors.
E. Statements on routine works of the Board of Directors.
Board of Director meetings and resolutions during the reporting period
The sixth meeting of the second Board of Directors was held on 18th, March. 2006. The meeting discussed and passed 14 motions,
including ‘2005 Summary of Works of the Management and the Board of Directors and 2006 Work assignment’, ‘2005 Financial Report and
Report of 2006 Financial Budget’, ‘Proposals of 2005 Profit assignment’, ‘2005 Risk-management Report and Proposals on 2006
Risk-management’, ‘Reports on Relatived Party Transactions of insiders and Shareholders’, ‘Strategic Development Plans for 2006-2008’
and ‘Modification of Bank’s Article of Association’, and so on.
On 10th, April 2006, the extraordinary meeting of the second Board of Directors was called in communication mode and passed ‘2005
Annual Report’and ‘2006 Budget Plans of Economic Capital of the Bank’and ‘Motivation on initiation of Financial Derivative Business’.
On 14th July 2006, the seventh meeting of the second Board of Directors was held. During the meeting, the following 19 motivations were
passed: ‘Reports on Work Summary of the 1st-half Year and Work Assignment of the 2nd –half Year’, ‘Financial Report of the1st-half of 2006’,
‘Motivation on IPO Program’, ‘Motivation on Construction of NBCB, Shanghai Branch’, ‘Motivation on Modification of Bank’s Article of
Association’, ‘Motivation on Transfer of Stocks’, ‘Motivation on Nominating Mr. Shi Ruixiang as the General Manager of Audit Department of
NBCB’, ‘Motivation on Employees’Supplementary Pension Insurance’, ‘Report on Relative Transactions of Insiders and Shareholders in the
1st half of 2006’, ‘Reports on Risk-management Implementations and Risk Control Indicators in the 1st Half of 2006’, ‘Methods of
Market-risk Management’, ‘Limitations of Market-risk management in 2006’, ‘Methods of Liquidation Management’, ‘Evaluation Report on
Capital Adequacy Ratio in the 1st half of 2006’, ‘Report on Internal Audit in the 1st half of 2006’, ‘Report of Corporate Governance’and
‘Report of Employee Stock Pledge’.
The 8th meeting of the second Board of Directors was held on 4th Sept 2006. The meeting discussed and passed the following 12 motions:
‘Stock Issuance and IPO Plan’, ‘Distribution of Accumulated Profits Before IPO’, ‘Motivation on modification of Bank’s Article of Association‘,
‘Motivation on Discussion Rules of the Board of Directors’, ‘Construction Methods of Independent Directors Mechanism’, ‘Implementation
Methods of Related Party Transaction Management’, ‘Methods of Related Party Transaction Management ’, ‘Methods of Investor
Relationship Management’, ‘Methods of Information Releasing Management’, ‘Detailed Working Rules of Secretary to the Board of
Directors’, and ‘Detailed Working Rules of the Presidents’.
The Extraordinary meeting of the second Board of Directors was held on 4th Sept, 2006. The meeting discussed and passed the following
5 motivations: ‘Report on Ms Yu Fengying’s Concurrent Position as the Vice-chairman of the Board of Directors’, ‘Motivation on Adding
Independent Directors and Members of Special Committees’, ‘Motivation on Mr. Luo Weikai’s Concurrent position as the Financial head of
the Bank’, ‘Motivation on Cancellation of The resolution passed in the Shareholders’Meeting held on 31st May 2004’.
On 25th, Sept 2006, the Extraordinary meeting of the second Board of Directors was called in communication mode and passed the
following 4 motivations: ‘Motivation on Modification of Stock Issuance and IPO Plan’, ‘Motivation on Auditor’s Report of 2003, 2004, 2005
and 2006 Interim issued by Shu Lun Pan Certified public Accountants Co., Ltd.’, ‘Modification of Accounting Policy of NBCB’, and
‘Modification of Detailed Rules of Presidents’Works’.
On 23rd Oct. 2006, the meeting of the second Board of Directors was called in communication mode and passed the following 6

motivations: ‘Motivation on Re-modification of Stock Issuance and IPO Plan’, ‘Motivation on Modification of Methods of Related Party
Transaction Management and Confirmation of Significant and Extraordinarily Significant Related Party Transaction, and Confirmation of
Control of Related Party Credit-granting Plan, Based on the Modified Methods, ‘Motivation on Modification of Detailed Work Rules of Audit
Committee, the Methods of Internal Audit Management’, ‘Motivation on Adjustment of Directors and Cancellation of the Resolution Passed
in the Eighteenth Meeting of the First Board of Directors’.
On 4th Nov. 2006, the Extraordinary meeting of the second Board of Directors was called in communication mode and passed ‘Motivation
on Report on Audit of the Third Quarter 2006 of NBCB Issued by Shu Lun Pan Certified Public Accounts Co., LTD’.
On 29th Nov. 2006, the Extraordinary meeting of the second Board of Directors was called in communication mode and passed
‘Motivation on Construction of Xiaolin Sub-Branch, NBCB’.
On 15th Dec. 2006, the ninth meeting of the second Board of Directors was held and passed the following 3 motions: ‘Motivation on
Changes in Accounting Policies of NBCB’, ‘Writing-off of Assets in 2006’and ‘Changes of Departments’Names in Head Quarter’.
Board of Directors’Implementation of resolutions passed in shareholders’meeting during the reporting period.
According to ‘Motivation on Introducing Foreign Strategic Investors, Increasing Capital and Expanding Stocks Outstanding’passed in the
First Extraordinary Shareholders’Meeting in 2006, Oversea-Chinese Banking Corporation (OCBC) Singapore purchased 0.25 billion shares
of NBCB and became our foreign strategic investor. After increasing our capital, NBCB’s equity has now improved from RMB1.8 billion to
RMB2.05 billion, and OCBC takes up 12.2% of this amount.
Based on ‘Motivation on Modification of Bank’s Article of Association’passed in the First Extraordinary Shareholders’Meeting in 2006 and
‘Yinjianfu[2006] No.104 Reply’issued by CBRC Ningbo, NBCB has amended its article of association accordingly.
Based on ‘Motivation on Adjustment of Directors and Supervisors’passed in the First Extraordinary Shareholders’Meeting in 2006, Mr.
Zhengjianjiang has resigned from his position as a director in the Board.
Based on ‘Proposal on 2005 Profit Distribution of NBCB’passed in 2005 Shareholders’Meeting, the dividend pay-out ratio of 2005 profit
was 12%, or RMB222,000,000. The remaining RMB70,973,394.62 undistributed dividends has been p transferred as ordinary provision.
Based on ‘Motivation on Modification of Bank’s Article of Association’passed in the Second Extraordinary Shareholders’Meeting in 2006,
and ‘Yinjianfu[2006] No.183 Reply’issued by CBRC Ningbo, NBCB has made modifications accordingly.
Based on ‘Motivation on Adding Directors’passed in the Second Extraordinary Shareholders’Meeting, new directors have been appointed.
Based on ‘Motivation on Stock Issuance and IPO Plan’passed in the Third Extraordinary Shareholders’Meeting, NBCB has engaged with
subscribers and lawyer offices to develop IPO program, and all application materials and documents regarding IPO have been handed in
to China Securities Regulatory Commission(CSRC). The IPO price and the category of our stocks: common shares issued in domestic
market (A Share) are 1 Yuan per share and the total amount will not go beyond RMB0.45 billion. Detailed volume of issuance will be
decided by the agreement between NBCB and subscribers according to market situations. The target customers will be the natural
persons, corporations and other institutions that open account in Shanghai Stock Exchange (excluding the ones prohibited by the PRC
laws, regulations and other supervisory requirements that the issuer must abide by). The interval and of the offering price and the pricing
methods will be in accordance with market rules, the China’s market condition at the time of offering, the market supervisory regulations
and the concrete situations of NBCB. The use of the capital collected: The revenues/funds collected in this new offering after deduction of
fees and charges of issuance will be used to reinforce the capital of the Bank. The place of offering: After this issuance, Shanghai Stock
Exchange will be the place for our public offering. The Plan of allocating the accumulated profit before offering: according to the
calculation of the Bank’s shares before this public offering, the 35% of the accumulated profits before this offering (until the end of the
year prior to offering, or the ‘base day’) will be shared by the old shareholders and the rest of the profits will go to old and new
shareholders, and all of the accumulated profits after the ‘base day’will be entirely received by shareholders either old or new. At the
same time, the Board of Directors will launch their works based on what the resolutions and reauthorization have confined.
Based on ‘Motivation on Modification of ‘Article of Association of NBCB’’passed in the third Extraordinary Shareholders’Meeting in 2006,
and ‘Notification on issuance of ‘Guidance for the Article of Association of Listed Companies<Modified version 2006>’’issued by the CSRC,
and ‘‘Yinjianfu[2006] No.208 Reply’’issued by CBRC Ningbo, the Bank has modified its article of association accordingly. The amended
article of association of the Bank will be effective from the day when the fund collected in this public offering is in place and the Bank’s
registry with the Industry and Commerce Administrative Bureau.
Based on ‘Formulation of Related Party Transaction Management Methods of NBCB’’ and ‘Motivation on Modification of Methods of
Related Party Transaction Management and Confirmation of Current Significant and Extraordinarily Significant Related Party Transaction,
and Confirmation of Control of Related Party Credit-granting Plan’passed in the third Extraordinary Shareholders’Meeting, the Bank has
confirmed the significant and extraordinarily significant Related Party transaction happened during 23rd Oct. 2006 to 1st Jan.
2006(including currently all significant Related Party transactions that are not fulfilled). Meanwhile, based on ‘Implementation Methods of
Related Party Transaction Management of NBCB’, the Bank has adjusted the current plan of Related Party transaction control. It is
regulated that the highest Line of credit for a single Related Party must not exceed RMB0.25 billion, the ceiling of the Line of credit
granted to a single Related Party who is also a shareholder must not exceed 0.375 billion, the maximum accumulated credit amount to a
single Related Party in consecutive 12 months must not exceed RMB2.0 billion, the exposed balance of a Related Party who possesses
more than 5% of our capital must not exceed RMB1.25 billion. All significant Related Party transaction must be approved by Credit
Authorization Management Department who obtain the authorization of the Board of Directors, abiding by internal procedure of
examination. Based on internal procedure of examination, Credit Authorization Management Department are authorized by the Board of
Directors to examine all following extraordinarily significant Related Party transactions: a single transaction not exceeding RMB0.25 billion,
a single account transaction not exceeding RMB0.25 billion, accumulated transaction volume within 12 consecutive months not exceeding
RMB2.0 billion.
Based on ‘Motivation on Adjustment of Directors’passed in the Third Extraordinary Shareholders’Meeting in 2006, new directors are
adjusted and added to the board according to laws and article of association.
F. Distribution of profits
Based on ‘Motivation on Issuance of A Share and IPO Plan’passed in the Third Extraordinary Shareholders’Meeting in 2006, the Chairman
and the President are authorized to be in charge of all detailed affairs on this issuance and IPO scheme. The profit distribution plan in
2006 is as following:
1. According to Auditor’s Report (2007) No.20346 issued by Shu Lun Pan Certified public Accountants Co., Ltd., net profit in 2006 is
RMB632,084,511.38.
2. According to ‘Corporate Law’, surplus reserve drawn as 10% of net profit is RMB63,208,451.14
3. In year 2005, undistributed profit is RMB302,489,102.21
4. According to resolutions passed in Shareholders’ Meeting on 22nd April 2006, ordinary provision drawn is RMB70,973,394.62.
Shareholders’dividend ratio is 12% or RMB210,000,000.00.
5. Accumulated undistributed profit in this year is RMB590,391,767.83.
Based on the Third Extraordinary Shareholders’ Meeting held in 2006, old shareholders gains 35% or RMB206, 637,118.74 of
accumulated undistributed profit before public offering. According to the 1st item in the second clause of the agreements signed by NBCB
and OCBC, OCBC will receive dividends of 2006 accounting year on the day their invested fund is in place. There are 1,941,095,870

weighted shares. Dividend per share in 2006 is RMB0.106. All undistributed profit for RMB880954.36 is to be shared among old and new
shareholders.

Report of the Board of Supervisors
Year 2006 is the second year of the reelected Board of Supervisors. According to the supervisory regulations of CBRC
and requirements imposed on listed companies and functions granted by the NBCB’s Article of Associations, Board of
Supervisors continuously completed supervisory procedure and accentuates examination and supervision on the Bank’s
key links in operation and management.
A. Routine work of Board of Supervisors
1. Completing Framework of organization and ensuring effective supervision.
First, the Board optimized the structure of its members. According to ‘Guidance on Corporate Governance of Commercial Bank Limited’
and NBCB’s Article of associations, the current Board of Supervisors consists of seven members. There is one full time chairman of the
Board, three employee representatives (including the chairman of the Board), two shareholder supervisors, two external supervisors.
external supervisors engaged are of rich experience in economics and financial management, which enhance objectivity and balance of
the board. Second, Audit Committee and Nomination Committee are set up and fulfill their roles. Third, a ‘Supervisors’ Office’ is
established to be responsible for routine work of the Board, coordinating examination and supervision on organization, maintaining
communication between the Board of Directors and senior management and ensuring the smooth running of the Board of Supervisors.
2. Constituting work mechanism and formulating procedure of operation. Based on the original work mechanism, the need of public
offering and the requirements imposed on listed companies, ‘Discussion Rules of the Board of Supervisors of NBCB’has been modified
and passed accordingly.
3. Enhancing study of regulations to be familiar with function ability of the Board. First, members of the Board are to be organized to put
effort on study of all supervisory regulations. Second, supervisors are sent out to learn and investigate. Third, the Board communicate
with the Bank Regulatory Bureau of Ningbo in a regular manner to understand recent requirements and policies imposed on commercial
banks, feedback how the Board of Supervisors of NBCB is operating, and acquire the Bureau’s opinions on the Bank’s supervisory work.
Rotating the personnel in time to ensure the function of Board of Supervisors.
4. According to the requirement imposed by CBRC, NBCB’s Article of Associations and Discussion Rules of the Board of Supervisors, the
Nominations Committee has held meetings announcing changes of position of two of the employee supervisors, due to the fact that a
senior manager is not suitable to play a role as an employee supervisor. Personnel adjustment has been made accordingly.
B. Statement of function of the board and opinions on supervision
1.The Board of Supervisors has confirmed ‘Shareholders’Dividend Distribution Plan’and ‘Auditor’s Report’issued by Shu Lun Pan Certified
public Accountants Co., Ltd. And handed them to the Board of Directors.
2.The Board of Supervisors has handed ‘Motivation on Engagement of External Auditors’to Shareholders’Meeting. Shu Lun Pan Certified
public Accountants Co., Ltd. has been engaged as our exterior auditor.
3.The Board of Supervisors has inspected and examined financial statements of the 1st half of year 2006. A relative examination report
and a report regarding opinions on problems found in inspection have been issued.
4.The Board of Supervisors has inspected and examined conditions of risk management and risk control. An examination report and a
report regarding opinions on challenges found in inspection have been issued.

5.The Board of Supervisors has inspected and examined implementation of internal management. An examination report and a report
regarding opinions on challenges found in inspection have been issued.
6.The Board of Supervisors has inspected and examined implementation of operational decisions made by the Board of Directors and
senior management. An examination report and a report regarding opinions on challenges found in inspection have been issued.
7.The Board of Supervisors organized and presided over external auditors’audit with the absence of internal audit head. An auditor’s
report was issued.
8.Evaluation of due diligence of Board of Directors and senior management and Mutual assessment of members of Board of Supervisors
has been launched. The Board of Supervisors believe that, during the reporting period, the operation of the Bank is in compliance with
‘Corporate Law’, ‘Commercial Bank Law’ and ‘NBCB’s Article of Associations’. Procedures of decision-making are legal and effective.
Risk-management and internal-control mechanism are further improved. Illegal or improper manner or actions that go against the
interests of the Bank and shareholders, were not detected with the members of the Board of Directors and senior management
performing their roles.. related party transactions are fair and in compliance with regulations.
C. Meetings held by Board of Supervisors during the reporting period
The sixth meeting of the second Board of Supervisors was held on 16th Mar. 2006.
The meeting discussed and approved ‘2005 Auditor’s Report issued by Shu Lun Pan Certified public Accountants Co., Ltd.’, ‘Opinions on
Appointment of External Auditors’, ‘Due Diligent Rules of Appointment of External Auditors’’‘Opinions on Audit Committee’s Work Plan of
2006’, and ‘Motivation on Work Summary of 2005 and Work Plan of 2006’.
The seventh meeting of the second Board of Supervisors was held on 26th Mar. 2006. The meeting examined and approved ‘Motivation on
Proposal of 2005 Profit Distribution’, and ‘Motivation on Evolution Report of Board of Supervisors and its Function’.
The eighth meeting of the second Board of Supervisors was held on 28th Aug. 2006. The meeting passed the following motivations:
‘Motivation on Modification of Discussion Rules of Board of Supervisors of NBCB’, ‘Motivation on Report of 2006 1st Half Year Financial
Statement and Issuance of Report of Inspection Opinions’, ‘Motivation on Mr. Chen Xuefeng’s Resignation from Employee Supervisor and
Nominating Mr. Shi Ruixiang as Employee Supervisor’.
The ninth meeting of the second Board of Supervisors was held on 3rd Nov. 2006. The meeting passed the following motivations:
‘Motivation on Evaluation Report of 2006 Internal-control and Issuance of Report of Inspection Opinions’, and ‘Motivation on Mr. Shi
Ruixiang’s Resignation from Employee Supervisor and Nominating Mr. Ying Linjun as Employee Supervisor’.
D. Work plan of year 2007
Based on protecting shareholders, depositors and our bank’s benefits, preventing risks, the key point of Year 2007’s work is to enhance
supervision and inspection, ensure our operation and management are in compliance with laws and regulations, keep healthy
development of all our business.
To confirm and supervise ‘2006 Dividend Distribution Plan’and Auditor’s Report.
To engage external Auditors.
To supervise financial activities.
To evaluate risk-management and internal-control
To evaluate and supervise regular reports prepared by the Board of Directors, and their implementing of decision making.
To motivate the director of supervisors for further business education and their performance evaluation.

Significant Events
Material litigations, arbitrations and legal cases within the reporting period
During the reporting period, the Bank investigated and dealt with 91 cases of offences relating to breaches of laws and regulations. These
cases involved an amount of RMB52,712,800, among which 34 were judged involving RMB17,240,000.
Acquisition and Disposal of assets
In the reporting period, increment in fixed assets amounted to RMB89.87 million, mainly used in setting up business offices; sale of fixed
assets RMB50.78 million, loss in fixed assets RMB127800. There’s no consolidation in the reporting period.
Significant contract and performance thereof
1.No significant custody, acceptance and leasing items in the reporting period.
2.No significant guarantee information to be disclosed in the reporting period, except for guarantee businesses approved by People’s
Bank of China and regulatory authorities.
3.No wealth management agreement in the reporting period.
4.Contracts Performed normally in the reporting period.
Appointment of Public Accountants Company Limited
Shu Lun Pan Certified Public Accountants Co., Ltd. was appointed to audit the financial statements and other financial matters of NBCB of
2006 in the reporting period.
Fees and charges paid to Shu Lun Pan Certified Public Accountants Co., Ltd. was 500,000
No directors, supervisors and management directors were sentenced by supervisory authorities in the reporting period.

References
Original annual report signed by Chairman of Board of Directors
Financial Statements stamped and signed by legal representative, CEO and CFO.
Original Auditor’s Report stamped by the accountants company and signed by its certified public
accountants.
NBCB’s Article of Association.
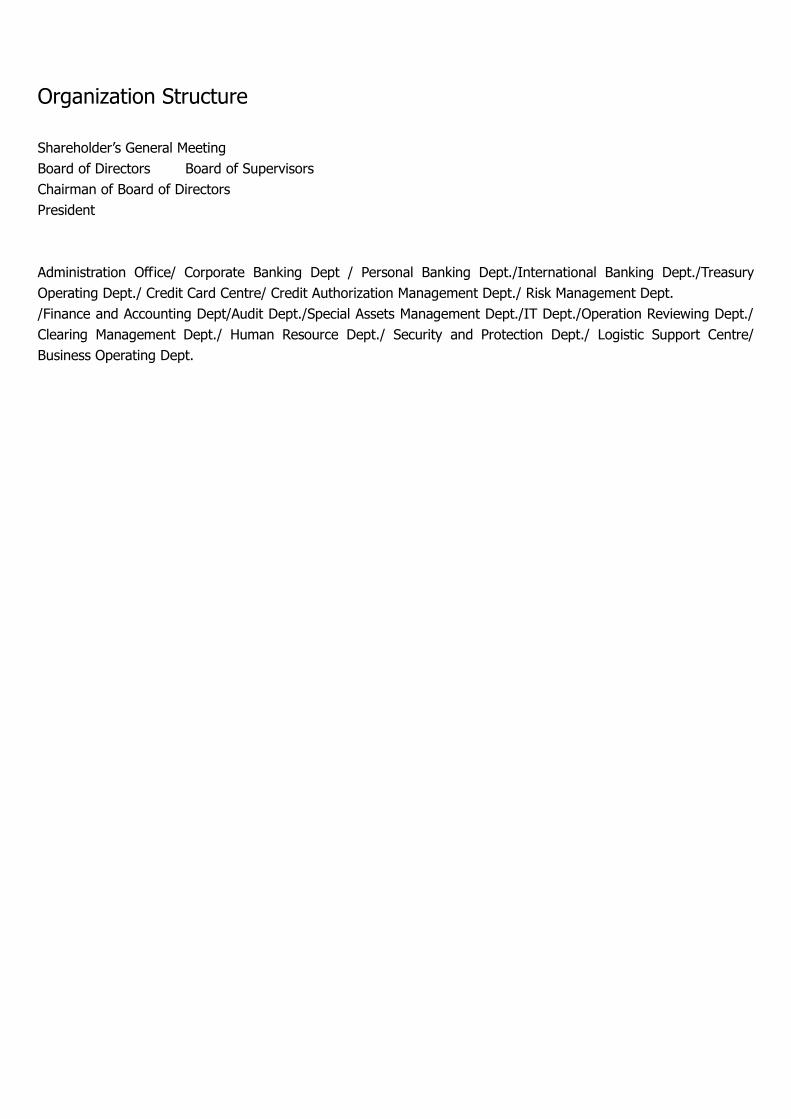
Organization Structure
Shareholder’s General Meeting
Board of Directors Board of Supervisors
Chairman of Board of Directors
President
Administration Office/ Corporate Banking Dept / Personal Banking Dept./International Banking Dept./Treasury
Operating Dept./ Credit Card Centre/ Credit Authorization Management Dept./ Risk Management Dept.
/Finance and Accounting Dept/Audit Dept./Special Assets Management Dept./IT Dept./Operation Reviewing Dept./
Clearing Management Dept./ Human Resource Dept./ Security and Protection Dept./ Logistic Support Centre/
Business Operating Dept.
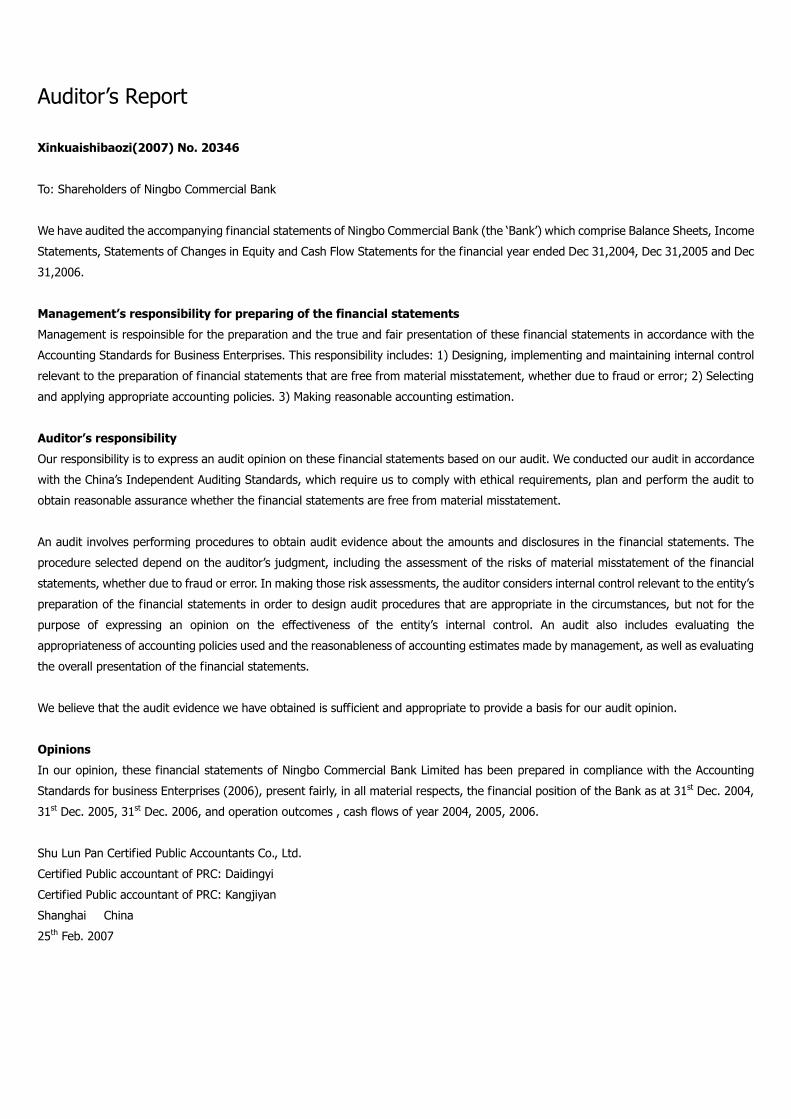
Auditor’s Report
Xinkuaishibaozi(2007) No. 20346
To: Shareholders of Ningbo Commercial Bank
We have audited the accompanying financial statements of Ningbo Commercial Bank (the ‘Bank’) which comprise Balance Sheets, Income
Statements, Statements of Changes in Equity and Cash Flow Statements for the financial year ended Dec 31,2004, Dec 31,2005 and Dec
31,2006.
Management’s responsibility for preparing of the financial statements
Management is respoinsible for the preparation and the true and fair presentation of these financial statements in accordance with the
Accounting Standards for Business Enterprises. This responsibility includes: 1) Designing, implementing and maintaining internal control
relevant to the preparation of financial statements that are free from material misstatement, whether due to fraud or error; 2) Selecting
and applying appropriate accounting policies. 3) Making reasonable accounting estimation.
Auditor’s responsibility
Our responsibility is to express an audit opinion on these financial statements based on our audit. We conducted our audit in accordance
with the China’s Independent Auditing Standards, which require us to comply with ethical requirements, plan and perform the audit to
obtain reasonable assurance whether the financial statements are free from material misstatement.
An audit involves performing procedures to obtain audit evidence about the amounts and disclosures in the financial statements. The
procedure selected depend on the auditor’s judgment, including the assessment of the risks of material misstatement of the financial
statements, whether due to fraud or error. In making those risk assessments, the auditor considers internal control relevant to the entity’s
preparation of the financial statements in order to design audit procedures that are appropriate in the circumstances, but not for the
purpose of expressing an opinion on the effectiveness of the entity’s internal control. An audit also includes evaluating the
appropriateness of accounting policies used and the reasonableness of accounting estimates made by management, as well as evaluating
the overall presentation of the financial statements.
We believe that the audit evidence we have obtained is sufficient and appropriate to provide a basis for our audit opinion.
Opinions
In our opinion, these financial statements of Ningbo Commercial Bank Limited has been prepared in compliance with the Accounting
Standards for business Enterprises (2006), present fairly, in all material respects, the financial position of the Bank as at 31st Dec. 2004,
31st Dec. 2005, 31st Dec. 2006, and operation outcomes , cash flows of year 2004, 2005, 2006.
Shu Lun Pan Certified Public Accountants Co., Ltd.
Certified Public accountant of PRC: Daidingyi
Certified Public accountant of PRC: Kangjiyan
Shanghai China
25th Feb. 2007

Financial Statement
Balance Sheet (unit: in RMB yuan)
Note 31/12/2006 31/12/2005 31/12/2004
Assets
Deposits and Due from in central bank 1 7,527,710,802.25 4,507,746,433.35 4,115,264,989.03
Due from banks 2 970,791,294.98 1,510,640,247.33 902,881,961.38
Placements with banks and other institutions 3 - 7,000,000.00 14,000,000.00
Reverse repurchase agreement 4 3,337,535,092.90 - -
Interest receivable 5 251,158,952.51 174,508,989.14 155,088,205.76
Loans and advance payments 6 27,762,605,778.96 19,284,906,991.09 16,961,068,080.13
Financial assets available-for-sale 7 470,910,000.00 2,008,152,000.00 1,360,148,000.00
Investment hold till maturity 8 13,715,866,626.75 13,447,626,884.91 9,275,332,990.02
Long-term equity investment 9 8,250,000.00 8,250,000.00 8,250,000.00
Real estate 10 163,738,463.00 159,480,571.00 190,604,056.00
Fixed assets 11 572,838,897.32 529,483,432.48 502,727,271.08
Intangible assets 12 10,981,401.72 14,666,190.41 14,875,796.71
Deferred income tax assets 13 41,356,159.46 57,277,841.56 104,212,611.68
Other assets 14 1,712,489,420.87 719,608,182.16 633,549,592.58
Total assets 56,546,232,890.72 42,429,347,763.43 34,238,003,554.37
Liabilities and shareholders’equity
Due to other banks 15 138,579,995.68 38,829,472.65 50,286,318.71
Placements from banks and other institutions 16 - 36,772,584.55 -
Repurchase agreements 17 5,000,000,000.00 1,600,000,000.00 2,028,500,000.00
Deposits 18 46,191,396,397.45 37,521,241,963.12 29,755,055,415.08
Salaries and welfare payable 19 129,088,648.17 111,172,104.78 35,113,889.56
Taxes payable 20 88,939,280.09 150,249,079.02 17,244,039.36
Interests payable 21 169,791,502.85 109,585,309.18 63,301,202.38
Deferred income tax liabilities 22 21,006,875.67 17,073,346.99 17,899,439.84
Other liabilities 23 1,611,246,493.01 657,251,836.29 526,974,640.67
Total liabilities 53,350,049,192.92 40,242,175,696.58 32,494,374,945.60
Shareholders’equity
Equity 24 2,050,000,000.00 1,800,000,000.00 1,800,000,000.00
Capital surplus 25 336,905,745.62 (21,373.95) (2,784,999.94)
Surplus reserve 26 147,912,789.73 84,704,338.59 25,823,169.14
General reserve 27 70,973,394.62 - -
Retained profits 28 590,391,767.83 302,489,102.21 (79,409,560.43)
Including proposed dividend 206,637,118.74 - -
Total shareholders’equity 3,196,183,697.80 2,187,172,066.85 1,743,628,608.77
Total liabilities and shareholders’equity 56,546,232,890.72 42,429,347,763.43 34,238,003 554.37

Income Statement (unit: In RMB yuan)
Note 2006 2005 2004
Operating Income 29 1,600,803,720.58 1,230,573,949.80 1,039,215,101.03
Net interest income 1,483,132,995.57 1,165,141,404.34 947,410,544.15
Interest income 2,218,734,534.81 1,655,794,016.37 1,334,971,441.88
Interest expense 735,601,539.24 490,652,612.03 387,560,897.73
Fees and commissions net income 112,115,966.75 69,156,633.59 56,514,371.50
Fees and commissions income 128,457,875.48 89,761,233.09 67,905,357.92
Fees and commissions expense 16,341,908.73 20,604,599.50 11,390,986.42
Investment gains 8,093,128,.69 (1,279,539.90) (2,576,879.90)
Fair value adjusted gains - - 28,877,271.38
Exchange gains/losses (5,330,000.07) (4,126,000.08) (3,999.94)
Other operation Income 2,791,629.64 1,681,451.85 8,993,793.84
Operating expense 30 762,107,823.84 577,193,314.20 458,824,251.55
Business tax and surcharges 100,006,392.99 72,330,776.00 58,407,837.87
Operating and administrative expenses 601,779,025.30 466,057,234.62 399,138,522.97
Impairment losses 59,655,765.47 35,864,899.08 298,487.71
Other operating expense 666,640.08 2,940,404.50 979,403.00
Operating profits 838,695,896.74 653,380,635.60 580,390,849.48
Add: non-operating income 31 11,067,276.07 7,953,176.33 6,853,925.71
Less: non-operating expense 32 35,567,241.65 6,706,404.05 1,895,985.63
Total profits 814,195,931.16 654,627,407.88 585,348,789.56
Less income tax 33 182,111,419.78 182,676,717.79 147,324,725.60
Net profit 632,084,511.38 471,950,690.09 438,024,063.96
Earnings per share:
Basic earnings per share 0.33 0.26 1.04
Diluted earnings per share 0.33 0.26 1.04
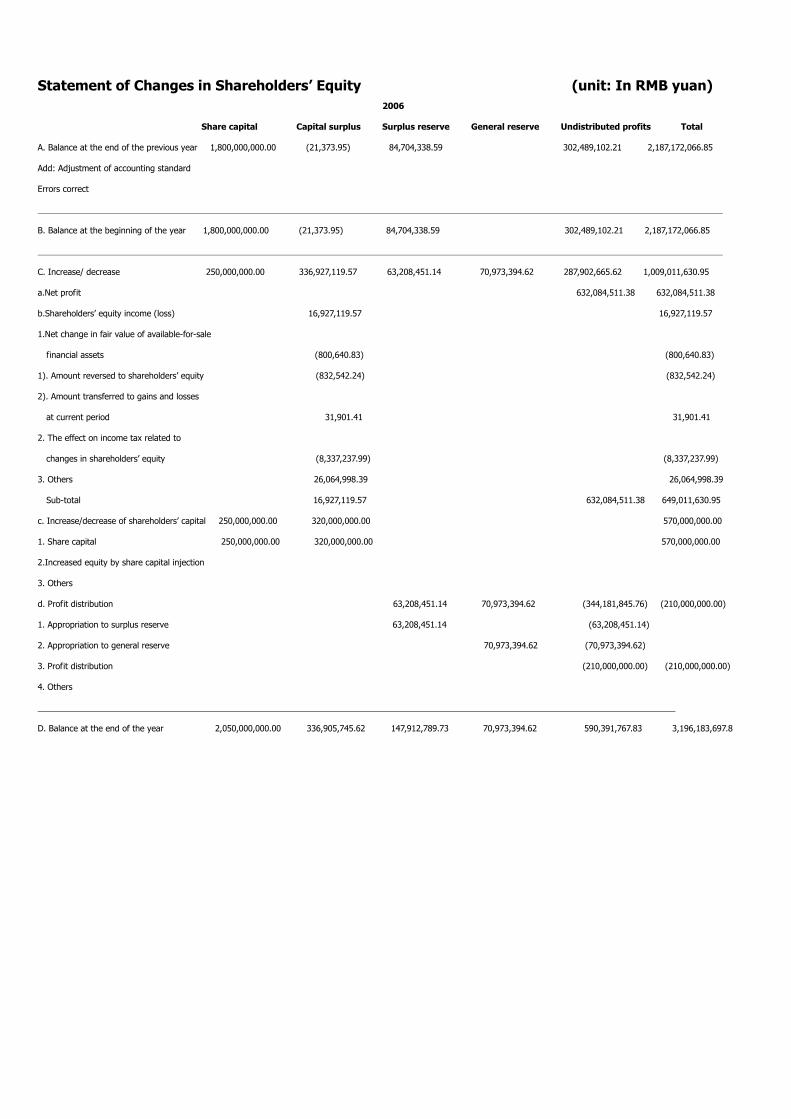
Statement of Changes in Shareholders’Equity (unit: In RMB yuan)
2006
Share capital Capital surplus Surplus reserve General reserve Undistributed profits Total
A. Balance at the end of the previous year 1,800,000,000.00 (21,373.95) 84,704,338.59 302,489,102.21 2,187,172,066.85
Add: Adjustment of accounting standard
Errors correct
B. Balance at the beginning of the year 1,800,000,000.00 (21,373.95) 84,704,338.59 302,489,102.21 2,187,172,066.85
C. Increase/ decrease 250,000,000.00 336,927,119.57 63,208,451.14 70,973,394.62 287,902,665.62 1,009,011,630.95
a.Net profit 632,084,511.38 632,084,511.38
b.Shareholders’equity income (loss) 16,927,119.57 16,927,119.57
1.Net change in fair value of available-for-sale
financial assets (800,640.83) (800,640.83)
1). Amount reversed to shareholders’equity (832,542.24) (832,542.24)
2). Amount transferred to gains and losses
at current period 31,901.41 31,901.41
2. The effect on income tax related to
changes in shareholders’equity (8,337,237.99) (8,337,237.99)
3. Others 26,064,998.39 26,064,998.39
Sub-total 16,927,119.57 632,084,511.38 649,011,630.95
c. Increase/decrease of shareholders’capital 250,000,000.00 320,000,000.00 570,000,000.00
1. Share capital 250,000,000.00 320,000,000.00 570,000,000.00
2.Increased equity by share capital injection
3. Others
d. Profit distribution 63,208,451.14 70,973,394.62 (344,181,845.76) (210,000,000.00)
1. Appropriation to surplus reserve 63,208,451.14 (63,208,451.14)
2. Appropriation to general reserve 70,973,394.62 (70,973,394.62)
3. Profit distribution (210,000,000.00) (210,000,000.00)
4. Others
D. Balance at the end of the year 2,050,000,000.00 336,905,745.62 147,912,789.73 70,973,394.62 590,391,767.83 3,196,183,697.8

Statement of Changes in Shareholders’Equity (unit: In RMB yuan)
2005
Share capital Capital surplus Surplus reserve General reserve Undistributed profits Total
A. Balance at the end of the previous year 1,800,000,000.00 (2,784,999.94) 25,823,169.14 (79,409,560.43) 1,743,628,608.77
Add: Adjustment of accounting standard
Errors correct
B. Balance at the beginning of the year 1,800,000,000.00 (2,784,999.94) 25,823,169.14 (79,409,560.43) 1,743,628,608.77
C. Increase/ decrease 2,763,625.99 58,881,169.45 381,898,662.64 443,543,458.08
a.Net profit 471,950,690.09 471,950,690.09
b.Shareholders’equity income (loss) 2,763,625.99 2,763.625.99
1. Net change in fair value of available-for-sale
financial assets 4,124,814.91 4,124,814.91
1). Amount reversed to shareholders’equity (31,901.41) (31,901.41)
2). Amount transferred to gains and losses
at current period 4,156,716.32 4,156,716.32
2. The effect on income tax related to
changes in shareholders’equity (1,361,188.92) (1,361,188.92)
3. Others
Sub-total 2,763,625.99 471,950,690.09 474,714,316.08
c. Increase/decrease of shareholders’capital
1. Share capital
2.Increased equity by share capital injection
3.Others
d. Profit distribution 58,881,169.45 (90,052,027.45) (31,170,858.00)
1. Appropriation to surplus reserve 58,881,169.45 (58,881,169.45)
2. Appropriation to general reserve
3. Profit distribution (31,170,858.00) (31,170,858.00)
4. Others
D. Balance at the end of the year 1,800,000,000.00 (21,373.95) 84,704,338.59 302,489,102.21 2,187,172,066.85

Statement of Changes in Shareholders’Equity (unit: In RMB yuan)
2004
Share capital Capital surplus Surplus reserve General reserve Undistributed profits Total
A. Balance at the end of the previous year 419,514,300.00 (3,854,237.03) 25,823.169.14 (494,360,337.89) (52,877,105.78)
Add: Adjustment of accounting standard
Errors correct
B. Balance at the beginning of the year 419,514,300.00 (3,854,237.03) 25,823.169.14 (494,360,337.89) (52,877,105.78)
C. Increase/ decrease 1,380,485,700.00 1,069,237.09 414,950,777.46 1,796,505,714.55
a.Net profit 438,024,063.96 438,024,063.96
b.Shareholders’equity income (loss) 1,069,237.09 1,069,237.09
1. Net change in fair value of available-for-sale
financial assets 1.,595,876.26 1.,595,876.26
1) Amount reversed to shareholders’equity (3,814,123.74) (3,814,123.74)
2) Amount transferred to gains and losses
at current period 5,410,000.00 5,410,000.00
2. The effect on income tax related to
changes in shareholders’equity (526,639.17) (526,639.17)
3. Others
Sub-total 1,069,237.09 438,024,063.96 439,093,301.05
c. Increase/decrease of shareholders’capital 1,380,485,700.00 1,380,485,700.00
1. Share capital 1,380,485,700.00 1,380,485,700.00
2.Increased equity by share capital injection
3.Others
d. Profit distribution (23,073,286.50) (23,073,286.50)
1. Appropriation to surplus reserve
2. Appropriation to general reserve
3. Profit distribution (23,073,286.50) (23,073,286.50)
4. Others
D. Balance at the end of the year 1,800,000,000.00 (2,784,999.94) 25,823,169.14 (79,409,560.43) 1,743,628,608.77
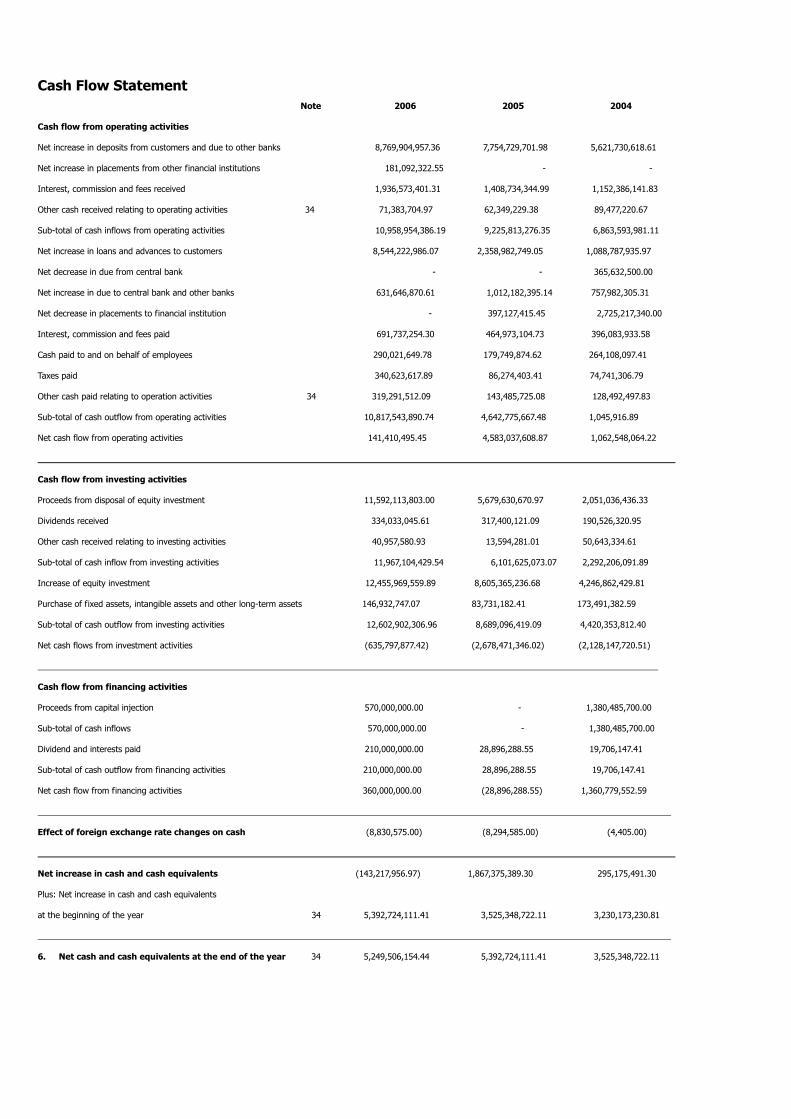
Cash Flow Statement
Note 2006 2005 2004
Cash flow from operating activities
Net increase in deposits from customers and due to other banks 8,769,904,957.36 7,754,729,701.98 5,621,730,618.61
Net increase in placements from other financial institutions 181,092,322.55 - -
Interest, commission and fees received 1,936,573,401.31 1,408,734,344.99 1,152,386,141.83
Other cash received relating to operating activities 34 71,383,704.97 62,349,229.38 89,477,220.67
Sub-total of cash inflows from operating activities 10,958,954,386.19 9,225,813,276.35 6,863,593,981.11
Net increase in loans and advances to customers 8,544,222,986.07 2,358,982,749.05 1,088,787,935.97
Net decrease in due from central bank - - 365,632,500.00
Net increase in due to central bank and other banks 631,646,870.61 1,012,182,395.14 757,982,305.31
Net decrease in placements to financial institution - 397,127,415.45 2,725,217,340.00
Interest, commission and fees paid 691,737,254.30 464,973,104.73 396,083,933.58
Cash paid to and on behalf of employees 290,021,649.78 179,749,874.62 264,108,097.41
Taxes paid 340,623,617.89 86,274,403.41 74,741,306.79
Other cash paid relating to operation activities 34 319,291,512.09 143,485,725.08 128,492,497.83
Sub-total of cash outflow from operating activities 10,817,543,890.74 4,642,775,667.48 1,045,916.89
Net cash flow from operating activities 141,410,495.45 4,583,037,608.87 1,062,548,064.22
Cash flow from investing activities
Proceeds from disposal of equity investment 11,592,113,803.00 5,679,630,670.97 2,051,036,436.33
Dividends received 334,033,045.61 317,400,121.09 190,526,320.95
Other cash received relating to investing activities 40,957,580.93 13,594,281.01 50,643,334.61
Sub-total of cash inflow from investing activities 11,967,104,429.54 6,101,625,073.07 2,292,206,091.89
Increase of equity investment 12,455,969,559.89 8,605,365,236.68 4,246,862,429.81
Purchase of fixed assets, intangible assets and other long-term assets 146,932,747.07 83,731,182.41 173,491,382.59
Sub-total of cash outflow from investing activities 12,602,902,306.96 8,689,096,419.09 4,420,353,812.40
Net cash flows from investment activities (635,797,877.42) (2,678,471,346.02) (2,128,147,720.51)
Cash flow from financing activities
Proceeds from capital injection 570,000,000.00 - 1,380,485,700.00
Sub-total of cash inflows 570,000,000.00 - 1,380,485,700.00
Dividend and interests paid 210,000,000.00 28,896,288.55 19,706,147.41
Sub-total of cash outflow from financing activities 210,000,000.00 28,896,288.55 19,706,147.41
Net cash flow from financing activities 360,000,000.00 (28,896,288.55) 1,360,779,552.59
Effect of foreign exchange rate changes on cash (8,830,575.00) (8,294,585.00) (4,405.00)
Net increase in cash and cash equivalents (143,217,956.97) 1,867,375,389.30 295,175,491.30
Plus: Net increase in cash and cash equivalents
at the beginning of the year 34 5,392,724,111.41 3,525,348,722.11 3,230,173,230.81
6. Net cash and cash equivalents at the end of the year 34 5,249,506,154.44 5,392,724,111.41 3,525,348,722.11
Notes to the Financial Statements
A. Declaration
The financial statements are approved by the board of directors in Ningbo Commercial Bank (hereinafter called ‘the Bank’or ‘NCB’) on
15th February 2007.
The financial statements and notes have been prepared based on the Accounting Standard for Business Enterprises, reflecting true,
complete and fair value of our bank’s financial status, operation and cash flow.
B. General information
1.History
Ningbo Commerical Bank was established with the approval of State Council Guideline on ‘”Notice to Establish City Cooperative Banks”
(Guofa(1995)No. 25) and People’s Bank of China Guideline on “Response to Develop City Cooperative Banks in Ningbo”
(Yinfa(1996)No.167). The Bank’s business license registered number is 25410602-4, which acquired on 10th, April 1997 from Ningbo
Chamber Administration Bureau. The original name of the Bank is Ningbo City Cooperative Bank, approved by People’s bank of China
Zhengjiang Branch and People’s bank of China Nignbo Branch Guideline on ‘”Approval of Ningbo City Cooperative Bank Changing its Name
to Ningbo Commerical Bank” (Yongyin(1998) No. 99). Thus, the Bank acquired its new corporate business license on 5th June 1998 from
Ningbo Chamber Administration Bureau.
Its business license number is No. 010253 (Corporation, Ningbo, Zhejiang). Its financial license No. is D10123320H0001. The legal
representative of company is Lu, Huayu and registered address is No. 294, East Zhonghshan Road, Ningbo Zhengjiang Province China.
The Bank registered capital was RMB 238.24 million in 1997, increased 181.27 million to RMB 419.51 million in Aug 8,2001. The
registered capital incremented to 1.80 billion due to the increase of RMB 1,380,485.70 thousand in December 2004. OCBC invested
250,000,000 common stocks with unit price RMB 2.28 in June 2006. Thus, the registered capital was 2.05 billion. The largest shareholder
is Ningbo Financial Bureau with 13.17 per cent of total share capitals.
2.Branches
The Bank established 22 tier one branches including: Haishu Branch.,Jiangdong Branch, Jiangbei Branch, Hudong Branch, Ximen Branch
Dongmen Branch, Tianyuan Branch, Lingqiao Branch, Science Zone Branch, Siming Branch, Mingzhou Branch, Yinzhou Branch, Zhenhai
Branch, Beilun Branch, Daxie Branch, Cixi Branch, Yuyao Branch, Ninghai Branch, Fenghua Branch, Xiangshan Branch, Chengdong Branch,
and Xinjian Branch.
3.Operating activities and services
The scope of our principal operating business are various banking businesses approved by the China Banking Regulatory Commission
(CBRC), including: absorption of deposits; release of short-term, medium–term and long-term loans; domestic settlements; discounting;
issuance of financial bonds; issuance, payment, subscription of government bonds on behalf of the state; trade of government bonds;
inter-bank lending/borrowing; bank guarantee; payment/collection agent and insurance agent; safe deposit box; consignment loan of
local fiscal revolving fund; foreign currency deposits, loans, and remittance; international settlement; purchase and sale of foreign
currency; inter-bank foreign currency lending/borrowing; acceptance and discount of foreign-currency paper; foreign currency guarantee;
and all other business under the approval of CBRC. The Bank was approved to operate Financial Derivatives and Swaps by CBRC
(Yinjianfu(2006) No. 324) in 12th October 2006.
C. Basis of preparation and consolidation
1. Consolidation of financial statement
The financial statements have been prepared on the basis of the collection of the segment financial statements of branch, clearing
centre, international banking, credit card center and other information. All significant intercompany account and transactions have been
eliminated.
2. Basis of preparation
The financial statements have been prepared on the basis of the Accounting Standard for Business Enterprises- Basic Standard, which
promulgated by Ministry of Finance People’s Republic of China in February 2006 and other relative regulatory policies instead of “City
Corporative Bank Accounting Policy”. Therefore, the financial statements were prepared and assumed 1st January 2004 as the first
executive day and related financial statements of 2004, 2005 were reorganized under new accounting rules. The principal accounting
policies and accounting estimates of reorganized financial statements refer to “ 4. Principal Accounting Policies and Accounting Estimate”.
D. Principal accounting policies and accounting estimate
1.Accounting standard
The financial statements have been prepared on the basis of the Accounting Standard for Business Enterprises- Basic Standard and
related regulatory policies.
2.Accounting year
The accounting year of the Bank is from 1st January to 31st December. The accounting year of the financial statements in this annual
report is from 1st January 2004 to 31st December 2006.
3.Reporting currency
The functional currency in the financial statements is RMB.
4.Reporting principle
The financial statements have been prepared on a accrual basis and under historical cost conversion, other than available-for-sail
financial assets and real estate for investment are at fair value.
5.Cash and cash equivalents
Cash comprises cash on hand and deposits available for withdraw, which including cash in hand, non-restricted balances with central
banks, due form banks, placements with banks and other financial institutions with an original maturity of less than three months. Cash
equivalents comprise short-term, liquidity preference, low-risk and easy convertible investment, including bond investment due within
three months and repurchasing agreement.
6.Foreign currency transactions
Foreign currency transactions are recorded in multi-currency ledgers, then translate into RMB at the end of the accounting year. All
foreign currency items are translated into USD at first and then translated into RMB at the respective exchange rates ruling at the end of
the accounting year.
Assets and Liabilities accounts denominated in foreign currencies are translated into RMB at the respective exchange rates ruling at the
end of the accounting year. Equity items, other than undistributed profits, are translated into RMB at the historical rate. The rate is based
on the benchmark rates published by the People’s Republic of China and the methods of calculating exchange rates are recognized by
central bank. Exchange differences are recognized in the income statement..
7.Financial assets and financial liabilities
1)Classification of financial assets
According to the intention of acquired financial assets, the financial assets are classified into four categories: financial assets at fair value
through profit or loss, including trading and other financial assets at fair value through profit and loss; hold-to-maturity investment; loans
and receivables, available-for-sale financial assets. All financial assets are initially measured and recognized at cost. Other financial assets
measured not at fair value and its adjustment also reversed to gains and losses should add relative transaction fees.
i. Trading and other financial assets at fair value through profit or loss
Trading and other financial assets at fair value through profit or loss include trade financial assets or initially recognized as trading and
other financial assets at fair value through profit or loss by senior management. The trading financial assets include buying of short-term
selling out financial assets. These short-term financial assets are all measured at fair value and its realized and unrealized gains and
losses are recognized in the income statement.
ii. Hold-to-maturity investments
Hold-to-maturity investments refer to the investment with fixed or determinable payments and fixed maturity date and with respect to
which the Bank has both the positive intention and the ability to hold to maturity non-financial derivative assets. Hold-to-maturity
investments are carried at amortized cost using the effective interest method, less allowances for impairment losses. If hold-to-maturity
investments are terminated, impaired, gains or losses due to amortization, those are recognized in income statement.
If the Bank sold hold-to-maturity investments before maturity or re-categorized hold to maturity investments which contain big proportion
of total hold to maturity investments in the accounting year or before last two accounting years, the Bank can not categorized any
financial assets as hold-to-maturity investments, other than:
The date of selling or re-categorizing of hold-to-maturity investments is near maturity date (within three months); thus, the market rate
would not effect the fair value of the investment.
The principal of investment has mainly drawn back according to the agreed reimbursement or pay back in advance, as well as those force
Majeures.
iii. Loans and receivables
Non-financial assets with fixed maturities and fixed or determinable payments, which are not quoted in an active market or the Bank is
not intent to sell these assets in short-term are loans and receivables. Loans and receivables are carried at amortized cost using the
effective interest method, less allowance for impairment losses. If loans and receivables are terminated, impaired, gains or losses due to
amortization, those are recognized in income statement.
iv. Available-for-sell financial assets
Available-for-sale financial assets are those non-financial derivative assets either designated as such or are not classified in any of the
other categories. These assets are measured at fair value at the balance sheet date. The unrealized gains and losses arising from changes
in the fair value are recognized as capital surplus before termination or impairment. If these financial assets are disposed of or impaired,
the related accumulated fair value adjustments are transferred to the income statement. .
The fair value of available-for-sell financial assets is measured according to price of interbank security market.
2) Loans
i. Loan classfication
Short-term, Mid-long term loans: Loans originated by the Bank are classified by terms. Loans less than one year (including) are classified
as short term loan. Loans over one year but less than 5 years (including) are classified as mid-term loans. Loans over 5 years is
recognized as long-term loan.
Discount: refers to funds used to discount the unexpired commercial acceptance bills held by customers or financial institutions.
Bill purchase for Import/Export Business: refer to loan facilities granted to importers/exporters including package loan, export L/C bill
purchase, export collection bill purchase, export T/T finance against commercial invoice and forfeiting.
Overdue loans: Overdue loans refer to loans that borrowers fail to repay on due date(including the extended period), discounted bills
were dishonored while the applicant’s deposit account was insufficient to repay the amount, bills accepted by the Bank came due while
the applicant’s deposit is insufficient to pay the accepted amount, advances arise from overdue bill purchase under Imp/Exp L/C,
guarantee or other off-balance sheet items, all advances are recognized as overdue loans.
ii. Accrued and non-accrued loans
Loans originated by the Bank are classified as either accrued loans or non-accrued loans. When either the principal or the interest
receivable to loans becomes overdue for more than 90 days, such loans are classified as non-accrued loans. When the Bank ceases to
accrue interest on a loan, the outstanding amount of accrued interest receivable in respect of the loan is then recorded in off-balance
sheet memorandum accounts. Any cash receipts from the borrower are first used to reduce the principal balance and interest income is
only recognized when the all past due principal amount is fully repaid. Non-accrual loans may be reinstated to accrual status when all past
due principal and interest have been brought current.
iii. The amount of loan is based on the actual amount. Bills discount is based on the book value. Discount interest income is calculated at
practical rate and periods, which reversed to relative periods gains and loss. At balance sheet date, bills discount, as per book value and
unrealized interest income, are reversed to loan and deferred income items of balance sheet.
iv. Loans are classified into pass, special mention, substandard, doubtful and loss five categories according to ‘Guidelines for Loan Risk
Classification’issued by People’s Bank of China (Yinfa(2001)No.416). Pass loan means that borrowers are capable of fulfilling the contract
and pay back on time. Special mention means that borrowers are capable of fulfilling the contract; however, the disadvantage may exist.
Substandard loan means that borrowers are incapable of paying the money back wholly, even if guaranteed, some loss may occur.
Doubtful loan means that borrowers are incapable of paying the money back wholly, even if guaranteed, a large amount of loss will occur.
Loss loan means principle and interest will not cover all necessary measures and legal procedure.
3) Financial liabilities
According to the intention, financial liabilities are divided into financial liabilities at fair value through gains or losses, deposit, accounts
payable, bond payable and other financial liabilities.
Financial liabilities at fair value through gains and losses include trade and other financial liabilities at fair value through profit and loss
and financial liabilities at fair value through gains and losses which are initially recognized by senior management. All the adjustment of
fair value is recognized in income statement.
Deposit, bond payable and other financial liabilities
Deposit, accounts payable, bond payable and other financial liabilities are carried out at amortized cost, other than those are classified as
tradable securities and financial liabilities at fair value through gains or losses.
4) Financial assets and financial liabilities cancellation and validation
i. Financial assets
When the contract of gaining financial assets future cash flow terminated, the financial assets are cancelled.
ii. Financial liabilities
When the contract of financial liabilities terminated partly or wholly, the financial liabilities are cancelled partly or wholly.
8. Measurement of real estate for investment
Real estate for investment mean that the real estate could gains rent, or the value of real estate will increase.
The Bank acquires market price and information of similar real estate easily because our real estate was located in the flourish trading
market.
Thus, the fair value of real estate for investment could be revalued. We measure real estate for investment at fair value basis.

As for the real estate outsourcing or self-built, the initial amount is measured on historical cost basis. When fixed assets conversed to real
estate, the initial amount is measured on fair value basis at the conversing date. If the fair value of real estate is bigger than the book
value, the difference is reversed to capital surplus (other capital surplus). If the fair value of real estate is smaller than the book value, the
difference is reversed to gains and losses account.
Real estate for investment measures on fair value basis every day of balance sheet. The increase or decrease of fair value is reversed to
gains and losses account.
9. The valuation of fixed assets
Fixed assets refer to buildings for working, renting or operation, which have useful life of more than one year.
The acquiring of fixed assets was stated at historical cost. The cost of fixed assets includes any direct or indirect cost before the use of
fixed assets. The fitment fee of capitalized fixed assets is depreciated on average period basis. The depreciation of fixed assets is
measured on the straight-line method to write down the cost of such assets to their estimated residual values over their estimated useful
lives as follows:
Type Estimated useful lives (years) Residual ratio (%) Depreciation ratio (%)
Buildings 20 3 4.85
Motor vehicles 5 3 19.40
Electronic equipment 5 3 19.40
Machinery equipment 5-10 3 19.4-9.7
Fitment of fixed assets 5 0 20.00
Improvements of leasing fixed assets leasing term 0 --
10. Construction in progress
Construction in progress is stated at real cost which incurred in the construction and classified for measurements. Items classified as
construction in progress are transferred to fixed assets when such assets are ready for their intended use, non-ready for intended use
construction in progress are stated as estimated value.
11.Financing expenses
Financing expenses occurred in financing capital for operating activities are stated at profit and loss in the accounting period. Financing
expenses for buying or building fixed assets are transferred into buying and building cost before the fixed assets put into use. After fixed
assets put into use, the expenses are stated at profit and loss in the accounting period.
12. Intangible assets
Intangible assets are stated at cost. They are amortized on a straight-line basis from the month of acquisition over estimated useful
period. Computer software is amortized averagely from the month of acquisition over five years.
13. Long-term prepaid expenses
Long-term prepaid expenses represent expenses already incurred but will be amortized over a period of more than one year (excluding
those of one year). They are recorded at the amount of incurred and amortized as follows:
Prepaid operating lease rental is amortized on straight-line basis over the terms of the respective leases.
Operating lease charges are amortized on a straight-line basis over the shorter between the residual leasing period and estimated useful
period.
14. Foreclosed assets
Acquisition of the assets: the stated value of assets is the amount of outstanding principal to be offset plus recognized interest and taxes
incur related to the acquisition.

Disposal of assets: if the disposal income is higher than book value of the assets, difference is credited to non-operating incomes and if
disposal income is less than book value of assets, difference is charged to non-operating expenditures. Custodian fee incurred directly
charged to non-operating expenditures and disposal expenditures is decreased from the disposal income.
15. Entrusted business
The Bank undertakes entrusted business refers to entrusted loans. Entrusted loans are funded by entrusted deposits and are granted to
designated borrowers for specific purposes at terms specified by entrustors. The Bank is responsible for managing entrusted loans. The
risks, gains or losses and responsibilities of all entrusted business are borne by entrustors and the Bank only charges handling fees.
16. Repurchase agreements, agreements to re-sell
Agreements to re-sell refer to debt securities, bills purchased from a counter-party with a related obligation to re-sell to the counter-party
at a pre-determined price on a specified future date under a resale agreement. They are initially recorded in the balance sheet under “The
assets sold under the repurchase agreements” at the actual amount paid to counterparties. Repurchase agreements refer to debt
securities and bills sold to a counter-party with a related obligation to repurchase them at a pre-determined price on a specified future
date under a repurchase agreement. They are initially recorded in the balance sheet under “The assets purchased under the resale
agreements” at the actual amounts received from the counter-parties. The assets sold subject to repurchase agreements are not
derecognized and are recorded on the balance sheet.
The differences in prices for purchases and sales are recognized as interest income or expense in the income statement using the
effective interest method.
17. Impairment of assets
1) Financial asset
The Bank assesses at each balance sheet date whether there is objective evidence that a financial asset is impaired. Impairments are
recognized as one or more events that occurred after the initial recognition of the asset and that the loss event has an impact on the
estimated future cash flows that can be reliably estimated.
i. Financial assets measured as amortized cost
If there is objective evidence that an impairment loss has been incurred on financial assets (including loans, receivables and
hold-to-mature investment) which are measured as amortized cost, the book value of the financial assets should be devalued as retract
value. The devalued amount is recognized as loss of asset impairment and put into loss at the period. The retract amount is recognized
though estimating future cash flows discounted at the loan’s original contractual effective interest rate, together with the consideration of
the value of guarantee items(less estimated disposal expense). The original contractual effective interest rate is the effective interest rate
at the initial recognition of the financial assets. Loans, receivables and hold-to-mature investment with variable interest rate could take
original contractual effective interest rate as the discount rate.
The Bank assesses impairment individually on financial assets that are individually significant, and individually or collectively on those
assets that are not individually significant. If the Bank determines that no objective evidence of impairment exists for an individually
assessed financial asset, whether significant or not, it includes the asset in a portfolio of assets with similar credit risk characteristics and
collectively assesses them for impairment. Financial assets which have been impaired and impairment losses are incurred if there is
objective evidence of impairment as a result of one or more events that occurred after the initial recognition of the assets and that event
has an adverse impact on the estimated future cash flows of the assets that can be reliably estimated.
The impairment of loans in financial assets which are measured as amortized cost is measured by offset method. The provision for loan
loss covers all the loans which are taken commitment and risk by the Bank.
The impairment of loans includes impairment for different types and special impairment. The former one refers to the impairment
according to the risk level and the probability for retraction while the latter one refers to the impairment specially prepared for the certain
loan to certain country.
The Bank assesses whether there is objective evidence that loans are impaired at each balance sheet date individually or collectively. If
the Bank determines that no objective evidence of impairment exists for an individually assessed loan, whether significant or not, it
includes the loan in a portfolio of loans with similar credit risk characteristics and collectively assesses them for impairment. Loans which
have been impaired and impairment losses are incurred if there is objective evidence of impairment as a result of one or more events that
occurred after the initial recognition of the loans and that event has an adverse impact on the estimated future cash flows of the loans
that can be reliably estimated. Objective evidence includes but not restricts to the overdue payment of interest and the principal, or meets
fatal financial difficulties
If there is objective evidence that an impairment loss has been incurred, the amount of the loss is measured as the difference between
the loan’s carrying amount and the present value of estimated future cash flows (excluding future credit losses that have not been
incurred) discounted at the loan’s original contractual effective interest rate. The amount of the loss is recognized in the income
statement. If a loan has a variable interest rate, the discount rate for measuring loan impairment loss is the current effective interest rate
determined under the contract.
If, in a subsequent period, the amount of impairment loss decreased and the decrease can be objectively related to an event (including
improvement in debtor’s credit rating) occurring after the impairment loss was recognized, the impairment loss is reversed through the
income statement. The occurred loss offsets the impairment.
ii. Available – for-sale financial assets
If the fair value of available –for-sale financial assets decreased sharply, and the Bank could estimate that the trend is not temporary after
comprehensive consideration incorporated by several related factors, the impairment is recognized. The accumulative loss (used to stated
in capital reserves) from devaluation of the fair value, should reversed into income statement. The reversed accumulative loss is the
difference between the original cost and the fair value less the impairment loss which has already been there.
The equity tool investment loss and the liability tool loss which belong to available –for-sale financial assets cannot be reversed if they are
recognized.
iii. Financial assets measured by cost
If there is evidence that the equity financial instruments without market value which are not measured by fair value are impaired, the
amount of the loss is measured as the difference between the assets’carrying amount and the present value of estimated future cash
flows.
2) Fixed assets, construction in progress intangible assets and other long-term non-financial assets
Refer to fixed assets, construction in progress intangible assets and other long-term non-financial assets, the Bank judges whether it is
possible for them to impair. Intangible assets without certain using period, should be tested no matter it is impaired or not.
The Bank estimated the retract value of the assets which has the possibility to impair. The retract value is recognized as the fair value of
the assets less disposal expense with the comparison of the higher between fair value and the present value of estimated future cash
flows.
If the retract value is lower than the book value, the latter one should be state d with the same amount of the former. The money

decreased is recognized as the impairment loss and stated in the income statement.
After the recognition the impairment loss, the expense in assets depreciation and amortization should be adjusted to fit the asset’s value
in the rest of its using life.
The recognized assets impairment could not be reversed in the subsequent period.
If an assets is likely to devaluate, the estimated retract value should be based on individual asset, otherwise, based on collective asset.
The recognition of collective assets is based on whether the cash flow of it is independent from other assets. Meanwhile, take the Bank’s
management and operational activity as well as the decision about the way on continuously use or dispose on assets into consideration.
The asset portfolio should keep consistency during the accounting year as soon as it is recognized.
3)Forclosed financial assets
Financial assets and liabilities are offset and the net amount reported in the balance sheet when there is a legally enforceable right to set
off the recognized amounts and there is an intention to settle on a net basis, or realize the asset and settle the liability simultaneously.
18. Interest income and interest expense
Interest income and interest expense are recognized in the income statement using the effective interest method except in the case of
non-accrual loans, where interest is credited to off-balance sheet memorandum account. The effective interest method is a method of
calculating the amortized cost of a financial asset or a financial liability and of allocating the interest income or interest expense over the
relevant period. The effective interest rate is the rate that exactly discounts estimated future cash payments or receipts through the
expected life of the financial instrument or, when appropriate, a shorter period to the net carrying amount of the financial asset or
financial liability. The Bank estimates cash flows considering all contractual terms of the financial instrument but does not consider future
credit losses. The calculation includes all amounts paid or received by the Bank that are an integral part of the effective interest rate,
including transaction costs and all other premiums or discounts.
19. Fee and commission income
Fees and commissions are recognized on an accrual basis when the related service has been provided. Loan commitment fees for loan
that are likely to be drawn down are deferred (together with related direct costs) and recognized as an adjustment to the effective
interest rate on the loan.
20. Income tax
The Bank accounts for its income tax using the deferred tax method. Deferred income tax is provided in full, using the liability method, on
timing differences. Timing differences are differences between the Group’s taxable profits and its results as stated in the financial
statements that arise from the inclusion of gains and losses in tax assessments in periods different from those in which they are
recognized in the financial statements. The principal timing differences arise from loan loss provisions, impairment allowance for other
assets, fair value change of trading securities and derivative financial instruments and fixed asset depreciation. The tax impact of the
timing differences are accounted for using the tax rate currently applicable to the Group. Deferred tax assets are recognized to the extent
that it is probable that future taxable profit will be available against which the timing differences can be utilized. Deferred income tax is
provided on timing differences arising from investments in subsidiaries and associates, except where the timing of the reversal of the
timing differences can be controlled and it is probable that the difference will not reverse in the foreseeable future.
21. Cash dividends
Cash dividends are from undistributed profit on the approval of the shareholders meeting.
22. Adjustment of main accounting policy and estimation during reporting period

According to the regulation from CSRC, company posted its capital-raising letter for its IPO planning, the Bank should prepare its financial
report under the new accounting rules after 1 January 2007. As a result, this financial report has been assumed 1 January 2004 as the
first executive day under new accounting rules and being prepared based on the influence of rule 5 to rule 19 in <Accounting Standards
for Business Enterprises No.38 for the first time execution>.
The influences are as follows:
Item Difference under multi-currency ledgers Estates for investment at fair value adjustment of income tax Total
Influence on the retained gains in 2004 (2000.02) 45,025,034.90 (14857601.51) 30,165,433.37
Including: Influence on the undistributed profits as (2,000.02) 45,025,034.90 (14857601.51) 30,165,433.37
at the end of the year 2004
Influence on Net profit in the year 2004 (3,999.94) 30,412,101.33 (10,034,673.47) 20,373,427.92
Influence on Net profit in the year 2005 (4,126,000.08) (14,913,858.13) 6,283,153.21 (12,756,705.00)
Influence on Net profit in the year 2006 (5,330,000.07) (37,799,743.97) (550,241.77) (43,679,985.81)
E. Taxation
Major taxation policies adopted:
Business tax: at 5% of operating income and paid by branches locally.
City maintenance and construction tax: at 5-7% of the business tax accrued and paid by branches locally.
Education surcharge: at 4% of the business tax accrued and paid by branches locally.
Income tax: applying 33% tax rate and paid by head office on an aggregate basis.
F. Notes to the financial statements
1. Deposits and required reserve in central bank
Item 2006/12/31 2005/12/31 2004/12/31
Cash on hand 207,126,425.58 118,899,851.01 125,360,127.76
Statutory deposit reserve in central bank 3,596,022,913.24 2,308,219,129.88 2,146,724,000.00
Other reserve in central bank 3,672,712,463.43 2,038,653,452.46 1,788,604,861.27
Fiscal deposit due to central bank 51,849,000.00 41,974,000.00 54,576,000.00
Total 7,527,710,802.25 4,507,746,433.35 4,115,264,989.03
1) As at 31 December 2006, The amount due from central banks included in “Cash and Cash equivalents” refers to Note F/34/1).
2) The bank is required to place an RMB statutory deposit reserve, a foreign currency statutory deposit reserve and a fiscal deposit with
the PBOC. The mandatory reserve funds are not available for use in the Group's day to day operations.
At 31 December 2006, the required reserve ratio for customer deposits denominated in RMB is 9% (2005: 7.5%;2004:7.5%); the
required reserve ratio for customer deposits denominated in foreign currencies is 4% (2005: 3%). The fiscal deposit of Domestic
Operations comprises funds from government agencies, non-fiscal deposits, individual deposits, corporate deposits and the balance
under entrusted business.
3) Cash and deposits due from the central bank increased RMB3019964368.90 with a percentage of 66.99% from 2005 to 2006. The
reasons are as follows.
i. According to the PBOC, the required reserve ratio for customer deposits denominated in RMB increased from 7.5% to 9.5%, the
statutory deposit reserve increased RMB 128703783.36 by 55.79%.
ii. The bank increased settlement account balance with the PBOC of RMB 1634059010.97(80.15%) for normal settlements in accordance
with the needs for the developing debt businesses.
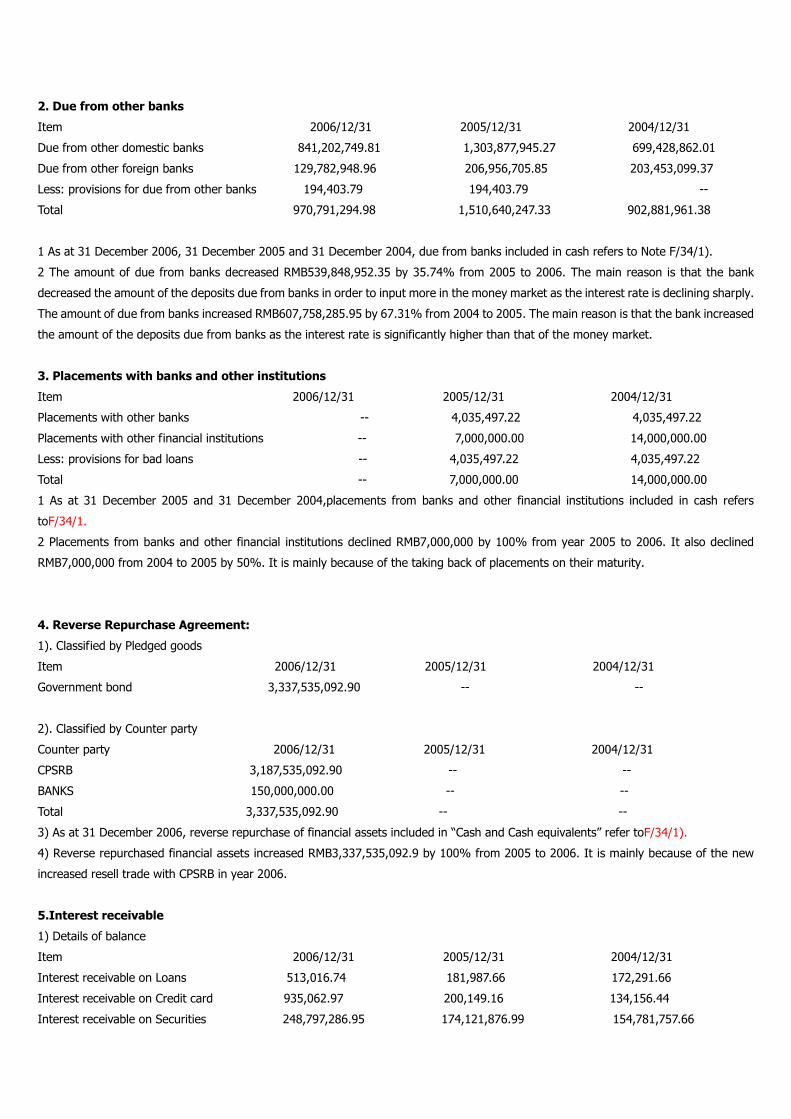
2. Due from other banks
Item 2006/12/31 2005/12/31 2004/12/31
Due from other domestic banks 841,202,749.81 1,303,877,945.27 699,428,862.01
Due from other foreign banks 129,782,948.96 206,956,705.85 203,453,099.37
Less: provisions for due from other banks 194,403.79 194,403.79 --
Total 970,791,294.98 1,510,640,247.33 902,881,961.38
1 As at 31 December 2006, 31 December 2005 and 31 December 2004, due from banks included in cash refers to Note F/34/1).
2 The amount of due from banks decreased RMB539,848,952.35 by 35.74% from 2005 to 2006. The main reason is that the bank
decreased the amount of the deposits due from banks in order to input more in the money market as the interest rate is declining sharply.
The amount of due from banks increased RMB607,758,285.95 by 67.31% from 2004 to 2005. The main reason is that the bank increased
the amount of the deposits due from banks as the interest rate is significantly higher than that of the money market.
3. Placements with banks and other institutions
Item 2006/12/31 2005/12/31 2004/12/31
Placements with other banks -- 4,035,497.22 4,035,497.22
Placements with other financial institutions -- 7,000,000.00 14,000,000.00
Less: provisions for bad loans -- 4,035,497.22 4,035,497.22
Total -- 7,000,000.00 14,000,000.00
1 As at 31 December 2005 and 31 December 2004,placements from banks and other financial institutions included in cash refers
toF/34/1.
2 Placements from banks and other financial institutions declined RMB7,000,000 by 100% from year 2005 to 2006. It also declined
RMB7,000,000 from 2004 to 2005 by 50%. It is mainly because of the taking back of placements on their maturity.
4. Reverse Repurchase Agreement:
1). Classified by Pledged goods
Item 2006/12/31 2005/12/31 2004/12/31
Government bond 3,337,535,092.90 -- --
2). Classified by Counter party
Counter party 2006/12/31 2005/12/31 2004/12/31
CPSRB 3,187,535,092.90 -- --
BANKS 150,000,000.00 -- --
Total 3,337,535,092.90 -- --
3) As at 31 December 2006, reverse repurchase of financial assets included in “Cash and Cash equivalents” refer toF/34/1).
4) Reverse repurchased financial assets increased RMB3,337,535,092.9 by 100% from 2005 to 2006. It is mainly because of the new
increased resell trade with CPSRB in year 2006.
5.Interest receivable
1) Details of balance
Item 2006/12/31 2005/12/31 2004/12/31
Interest receivable on Loans 513,016.74 181,987.66 172,291.66
Interest receivable on Credit card 935,062.97 200,149.16 134,156.44
Interest receivable on Securities 248,797,286.95 174,121,876.99 154,781,757.66

Other interest receivable 913,585.85 4,975.33 --
Total 251,158,952.51 174,508,989.14 155,088,205.76
2) Aging analysis
Age 2006/12/31 2005/12/31 2004/12/31
Amount proportion(%) Amount proportion(%) Amount proportion(%)
Within 1 year 199,907,116.03 79.59 147,194,858.04 84.34 136,968,801.11 88.31
One to two years 22,095,216.05 8.80 18,480,610.16 10.59 11,719,982.63 7.56
2-3 years 17,565,998.48 7.00 7,549,085.84 4.33 3,886,605.89 2.51
Above three years 11,590,621.95 4.61 1,284,435.10 0.74 2,512,816.13 1.62
Total 251,158,952.51 100.00 174,508,989.14 100.00 155,088,205.76 100.00
3) As at 31 December 2006, there is no interest receivable from shareholders who own no less than 5% shares of the bank.
4) Interest receivable increased RMB76,649,963.37 by 43.92%. The reasons are:
i. Because both the new increased resell financial assets and hold-to-mature investments are bonds which pay interest annually, interest
receivable Within 1 year increased RMB52,712,257.99 from 2005 to 2006..
ii. Previously bought bond added to bond interest receivable to RMB23,937,705.38
6. Loans and advance payments
1) Composition of Loans
Type 2006/12/31 2005/12/31 2004/12/31
Amount proportion(%) Amount proportion(%) Amount proportion(%)
Corporation Loans 20,006,542,923.26 71.11 15,700,565,995.03 80.07 13,945,420,412.09 80.63
Personal Loans 8,128,356,393.62 28.89 3,908,566,862.04 19.93 3,350,023,943.50 19.37
Total 28,134,899,316.88 100.00 19,609,132,857.07 100.00 17,295,444,355.59 100.00
Allowance for impairment loss 372,293,537.92 324,225,865.98 334,376,275.46
Balance 27,762,605,778.96 19,284,906,991.09 16,961,068,080.13
i. Analyzed by Industry
Industry 2006/12/31 2005/12/31 2004/12/31
Amount proportion(%) Amount proportion(%) Amount proportion(%)
Agriculture/Forestry/Animal/Fishing 27,120,000.00 0.14 25,803,853.95 0.18 71,310,000.00 0.50
Mining 19,000,000.00 0.09 2,990,000.00 0.02 -- -
Manufacturing 11,218,774,399.51 56.07 7,732,504,470.29 49.25 5,862,685,441.02 42.04
Energy/Gas/Utility 109,235,010.20 0.55 168,600,000.00 1.07 182,750,000.00 1.31
Construction 594,219,035.51 2.97 603,190,636.30 3.84 607,618,490.00 4.36
Transportation/Storage/Mailing 575,219,035.51 2.87 482,576,501.20 3.07 461,728,976.00 3.31
Information transfer/computer
services and Software 201,790,000.00 1.01 210,500,000.00 1.34 93,667,180.00 0.67
Commerce 3,332,467,670.70 16.66 2,480,737,188.89 15.80 1,876,971,555.67 13.46
Hospitalities/Restaurant 64,170,00.00 0.32 237,530,000.00 1.51 124,630,000.00 0.89
Finance 2,640,000.00 0.01 14,167,000.00 0.09 20,330,000.00 0.15
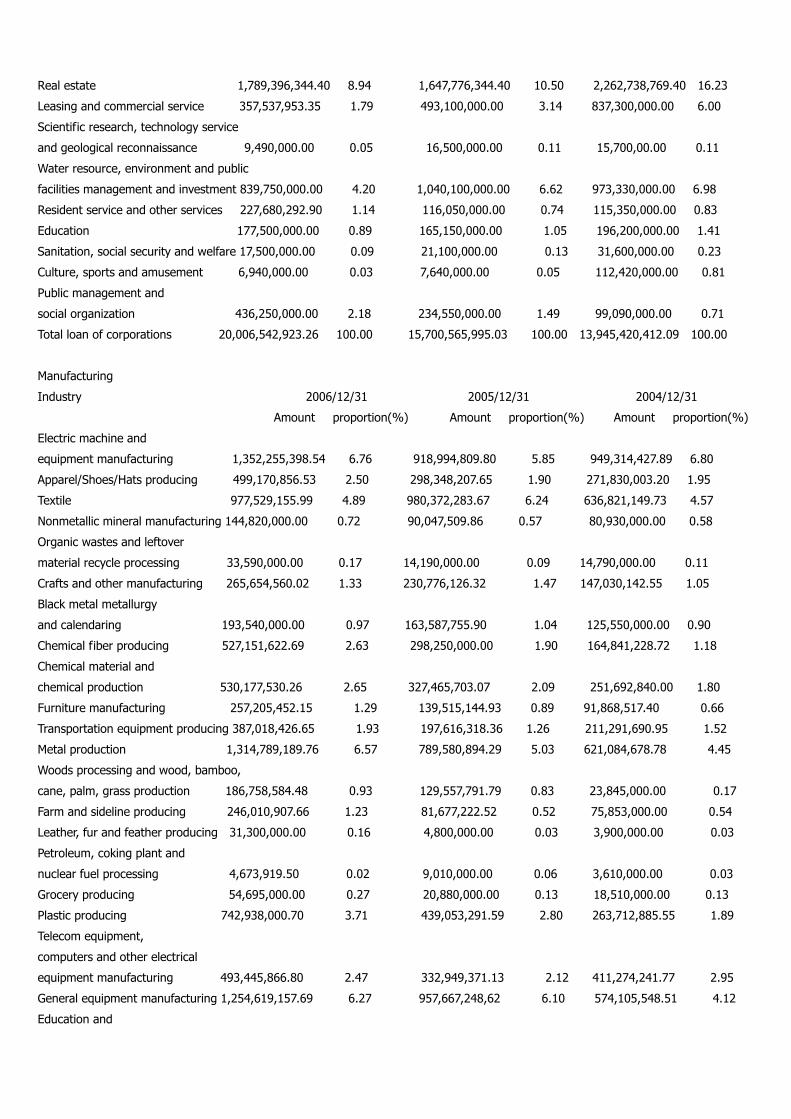
Real estate 1,789,396,344.40 8.94 1,647,776,344.40 10.50 2,262,738,769.40 16.23
Leasing and commercial service 357,537,953.35 1.79 493,100,000.00 3.14 837,300,000.00 6.00
Scientific research, technology service
and geological reconnaissance 9,490,000.00 0.05 16,500,000.00 0.11 15,700,00.00 0.11
Water resource, environment and public
facilities management and investment 839,750,000.00 4.20 1,040,100,000.00 6.62 973,330,000.00 6.98
Resident service and other services 227,680,292.90 1.14 116,050,000.00 0.74 115,350,000.00 0.83
Education 177,500,000.00 0.89 165,150,000.00 1.05 196,200,000.00 1.41
Sanitation, social security and welfare 17,500,000.00 0.09 21,100,000.00 0.13 31,600,000.00 0.23
Culture, sports and amusement 6,940,000.00 0.03 7,640,000.00 0.05 112,420,000.00 0.81
Public management and
social organization 436,250,000.00 2.18 234,550,000.00 1.49 99,090,000.00 0.71
Total loan of corporations 20,006,542,923.26 100.00 15,700,565,995.03 100.00 13,945,420,412.09 100.00
Manufacturing
Industry 2006/12/31 2005/12/31 2004/12/31
Amount proportion(%) Amount proportion(%) Amount proportion(%)
Electric machine and
equipment manufacturing 1,352,255,398.54 6.76 918,994,809.80 5.85 949,314,427.89 6.80
Apparel/Shoes/Hats producing 499,170,856.53 2.50 298,348,207.65 1.90 271,830,003.20 1.95
Textile 977,529,155.99 4.89 980,372,283.67 6.24 636,821,149.73 4.57
Nonmetallic mineral manufacturing 144,820,000.00 0.72 90,047,509.86 0.57 80,930,000.00 0.58
Organic wastes and leftover
material recycle processing 33,590,000.00 0.17 14,190,000.00 0.09 14,790,000.00 0.11
Crafts and other manufacturing 265,654,560.02 1.33 230,776,126.32 1.47 147,030,142.55 1.05
Black metal metallurgy
and calendaring 193,540,000.00 0.97 163,587,755.90 1.04 125,550,000.00 0.90
Chemical fiber producing 527,151,622.69 2.63 298,250,000.00 1.90 164,841,228.72 1.18
Chemical material and
chemical production 530,177,530.26 2.65 327,465,703.07 2.09 251,692,840.00 1.80
Furniture manufacturing 257,205,452.15 1.29 139,515,144.93 0.89 91,868,517.40 0.66
Transportation equipment producing 387,018,426.65 1.93 197,616,318.36 1.26 211,291,690.95 1.52
Metal production 1,314,789,189.76 6.57 789,580,894.29 5.03 621,084,678.78 4.45
Woods processing and wood, bamboo,
cane, palm, grass production 186,758,584.48 0.93 129,557,791.79 0.83 23,845,000.00 0.17
Farm and sideline producing 246,010,907.66 1.23 81,677,222.52 0.52 75,853,000.00 0.54
Leather, fur and feather producing 31,300,000.00 0.16 4,800,000.00 0.03 3,900,000.00 0.03
Petroleum, coking plant and
nuclear fuel processing 4,673,919.50 0.02 9,010,000.00 0.06 3,610,000.00 0.03
Grocery producing 54,695,000.00 0.27 20,880,000.00 0.13 18,510,000.00 0.13
Plastic producing 742,938,000.70 3.71 439,053,291.59 2.80 263,712,885.55 1.89
Telecom equipment,
computers and other electrical
equipment manufacturing 493,445,866.80 2.47 332,949,371.13 2.12 411,274,241.77 2.95
General equipment manufacturing 1,254,619,157.69 6.27 957,667,248,62 6.10 574,105,548.51 4.12
Education and
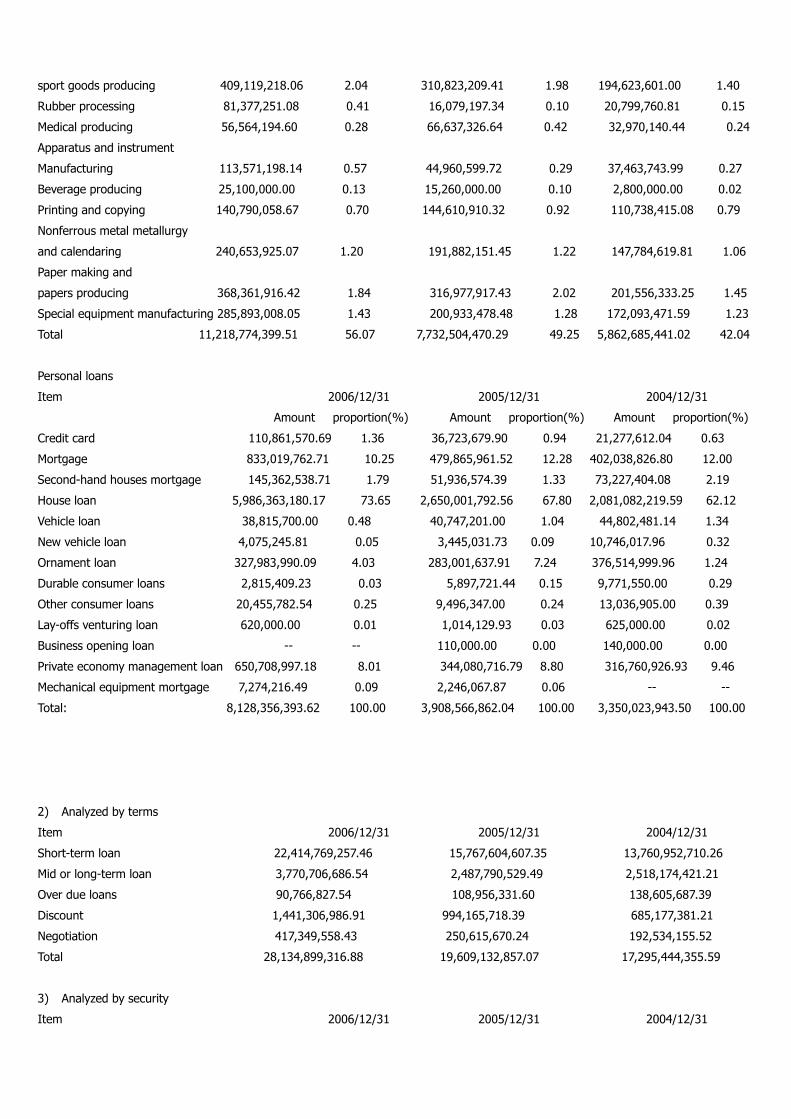
sport goods producing 409,119,218.06 2.04 310,823,209.41 1.98 194,623,601.00 1.40
Rubber processing 81,377,251.08 0.41 16,079,197.34 0.10 20,799,760.81 0.15
Medical producing 56,564,194.60 0.28 66,637,326.64 0.42 32,970,140.44 0.24
Apparatus and instrument
Manufacturing 113,571,198.14 0.57 44,960,599.72 0.29 37,463,743.99 0.27
Beverage producing 25,100,000.00 0.13 15,260,000.00 0.10 2,800,000.00 0.02
Printing and copying 140,790,058.67 0.70 144,610,910.32 0.92 110,738,415.08 0.79
Nonferrous metal metallurgy
and calendaring 240,653,925.07 1.20 191,882,151.45 1.22 147,784,619.81 1.06
Paper making and
papers producing 368,361,916.42 1.84 316,977,917.43 2.02 201,556,333.25 1.45
Special equipment manufacturing 285,893,008.05 1.43 200,933,478.48 1.28 172,093,471.59 1.23
Total 11,218,774,399.51 56.07 7,732,504,470.29 49.25 5,862,685,441.02 42.04
Personal loans
Item 2006/12/31 2005/12/31 2004/12/31
Amount proportion(%) Amount proportion(%) Amount proportion(%)
Credit card 110,861,570.69 1.36 36,723,679.90 0.94 21,277,612.04 0.63
Mortgage 833,019,762.71 10.25 479,865,961.52 12.28 402,038,826.80 12.00
Second-hand houses mortgage 145,362,538.71 1.79 51,936,574.39 1.33 73,227,404.08 2.19
House loan 5,986,363,180.17 73.65 2,650,001,792.56 67.80 2,081,082,219.59 62.12
Vehicle loan 38,815,700.00 0.48 40,747,201.00 1.04 44,802,481.14 1.34
New vehicle loan 4,075,245.81 0.05 3,445,031.73 0.09 10,746,017.96 0.32
Ornament loan 327,983,990.09 4.03 283,001,637.91 7.24 376,514,999.96 1.24
Durable consumer loans 2,815,409.23 0.03 5,897,721.44 0.15 9,771,550.00 0.29
Other consumer loans 20,455,782.54 0.25 9,496,347.00 0.24 13,036,905.00 0.39
Lay-offs venturing loan 620,000.00 0.01 1,014,129.93 0.03 625,000.00 0.02
Business opening loan -- -- 110,000.00 0.00 140,000.00 0.00
Private economy management loan 650,708,997.18 8.01 344,080,716.79 8.80 316,760,926.93 9.46
Mechanical equipment mortgage 7,274,216.49 0.09 2,246,067.87 0.06 -- --
Total: 8,128,356,393.62 100.00 3,908,566,862.04 100.00 3,350,023,943.50 100.00
2) Analyzed by terms
Item 2006/12/31 2005/12/31 2004/12/31
Short-term loan 22,414,769,257.46 15,767,604,607.35 13,760,952,710.26
Mid or long-term loan 3,770,706,686.54 2,487,790,529.49 2,518,174,421.21
Over due loans 90,766,827.54 108,956,331.60 138,605,687.39
Discount 1,441,306,986.91 994,165,718.39 685,177,381.21
Negotiation 417,349,558.43 250,615,670.24 192,534,155.52
Total 28,134,899,316.88 19,609,132,857.07 17,295,444,355.59
3) Analyzed by security
Item 2006/12/31 2005/12/31 2004/12/31
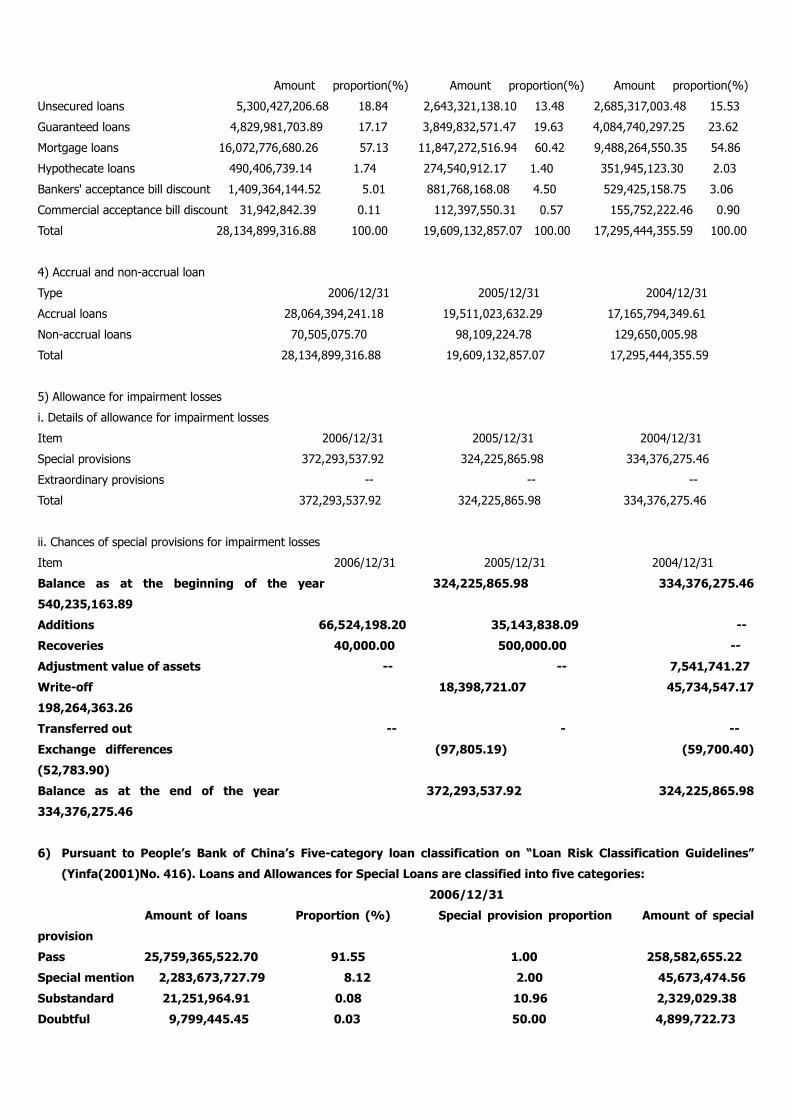
Amount proportion(%) Amount proportion(%) Amount proportion(%)
Unsecured loans 5,300,427,206.68 18.84 2,643,321,138.10 13.48 2,685,317,003.48 15.53
Guaranteed loans 4,829,981,703.89 17.17 3,849,832,571.47 19.63 4,084,740,297.25 23.62
Mortgage loans 16,072,776,680.26 57.13 11,847,272,516.94 60.42 9,488,264,550.35 54.86
Hypothecate loans 490,406,739.14 1.74 274,540,912.17 1.40 351,945,123.30 2.03
Bankers' acceptance bill discount 1,409,364,144.52 5.01 881,768,168.08 4.50 529,425,158.75 3.06
Commercial acceptance bill discount 31,942,842.39 0.11 112,397,550.31 0.57 155,752,222.46 0.90
Total 28,134,899,316.88 100.00 19,609,132,857.07 100.00 17,295,444,355.59 100.00
4) Accrual and non-accrual loan
Type 2006/12/31 2005/12/31 2004/12/31
Accrual loans 28,064,394,241.18 19,511,023,632.29 17,165,794,349.61
Non-accrual loans 70,505,075.70 98,109,224.78 129,650,005.98
Total 28,134,899,316.88 19,609,132,857.07 17,295,444,355.59
5) Allowance for impairment losses
i. Details of allowance for impairment losses
Item 2006/12/31 2005/12/31 2004/12/31
Special provisions 372,293,537.92 324,225,865.98 334,376,275.46
Extraordinary provisions -- -- --
Total 372,293,537.92 324,225,865.98 334,376,275.46
ii. Chances of special provisions for impairment losses
Item 2006/12/31 2005/12/31 2004/12/31
Balance as at the beginning of the year 324,225,865.98 334,376,275.46
540,235,163.89
Additions 66,524,198.20 35,143,838.09 --
Recoveries 40,000.00 500,000.00 --
Adjustment value of assets -- -- 7,541,741.27
Write-off 18,398,721.07 45,734,547.17
198,264,363.26
Transferred out -- - --
Exchange differences (97,805.19) (59,700.40)
(52,783.90)
Balance as at the end of the year 372,293,537.92 324,225,865.98
334,376,275.46
6) Pursuant to People’s Bank of China’s Five-category loan classification on “Loan Risk Classification Guidelines”
(Yinfa(2001)No. 416). Loans and Allowances for Special Loans are classified into five categories:
2006/12/31
Amount of loans Proportion (%) Special provision proportion Amount of special
provision
Pass 25,759,365,522.70 91.55 1.00 258,582,655.22
Special mention 2,283,673,727.79 8.12 2.00 45,673,474.56
Substandard 21,251,964.91 0.08 10.96 2,329,029.38
Doubtful 9,799,445.45 0.03 50.00 4,899,722.73

Loss 60,808,656.03 0.22 100.00 60,808,656.03
Total 28,134,899,316.88 100.00 1.32 372,293,537.92
2005/12/31
Amount of loans Proportion (%) Special provision proportion Amount of special
provision
Pass 16,399,980,337.84 83.63 1.07 175,965,293.52
Special mention 3,089,726,285.58 15.76 2.00 61,794,525.72
Substandard 34,068,044.15 0.17 15.94 5,429,940.70
Doubtful 8,334,568.49 0.04 48.14 4,012,485.04
Loss 77,023,621.01 0.40 100.00 77,023,621.01
Total 19,609,132,857.07 100.00 1.65 324,225,865.98
2004/12/31
Amount of loans Proportion (%) Special provision proportion Amount of special
provision
Pass 13,355,687,341.11 77.22 1.00 133,556,873.42
Special mention 3,773,142,374.86 21.82 2.09 78,840,615.07
Substandard 44,352,013.16 0.26 11.20 4,965,363.73
Doubtful 3,116,599.27 0.02 39.95 1,245,163.64
Loss 119,146,027.19 0.68 100.00 115,768,259.60
Total 17,295,444,355.59 100.00 1.93 334,376,275.46
7) Top 10 single largest borrowers
i. As at the end of 2006
Industry Balance of loan Proportion
(%)
Client 1 Water resource, environment and public facilities management 200,000,000.00
0.71
Client 2 Real estate 200,000,000.00 0.71
Client 3 Public management and social organization 194,930,000.00
0.69
Client 4 Real estate 180,000,000.00 0.64
Client 5 Public management and social organization 179,000,000.00
0.64
Client 6 Manufacturing 174,022,703.95
0.62
Client 7 Real estate 170,000,000.00 0.60
Client 8 Manufacturing 158,550,000.00 0.56
Client 9 Manufacturing 156,500,000.00 0.56

Client 10 Water resource, environment and public facilities management 151,290,138.83
0.54
Total 1,764,292,842.78 6.27
ii. As at the end of 2005
Industry Balance of loan Proportion
(%)
Client 1 Water resource, environment and public facilities management 220,000,000.00
1.12
Client 2 Public management and social organization 200,000,000.00 1.02
Client 3 Real estate 200,000,000.00 1.02
Client 4 Information transfer/computer services and Software 195,000,000.00 0.99
Client 5 Real estate 192,600,000.00 0.98
Client 6 Manufacturing 186,805,000.00 0.95
Client 7 Water resource, environment and public facilities management 179,000,000.00
0.91
Client 8 Manufacturing 172,060,000.00 0.88
Client 9 Water resource, environment and public facilities management 156,500,000.00
0.80
Client 10 Water resource, environment and public facilities management 150,000,000.00
0.76
Total 1,851,965,000.00 9.43
iii. As at the end of 2004
Industry Balance of Loan Proportion
(%)
Client 1 Water resource, environment and public facilities management 290,000,000.00
1.68
Client 2 Real estate 220,000,000.00 1.27
Client 3 Real estate 220,000,000.00 1.27
Client 4 Real estate 180,000,000.00 1.04
Client 5 Water resource, environment and public facilities management 170,000,000.00
0.98
Client 6 Manufacturing 166,950,000.00 0.97
Client 7 Manufacturing 163,120,000.00 0.94
Client 8 Water resource, environment and public facilities management 156,500,000.00
0.90
Client 9 Real estate 150,000,000.00 0.87
Client 10 Real estate 120,000,000.00 0.69
Total 1,836,570,000.00 10.61
8) As at 31 December 2006, 31 December 2005 and 31 December 2004,the loans of shareholders who own not less than 5% shares of
the bank refer to F/2/2)/iii
9) Loans and advances to customers increased RMB8,477,698,787.87 by 43.96% from 2004 to 2005. Reasons are as follows:
i. The bank emphasis on the development of personal banking business in 2006 in order to enlarge the proportion of personal loan
business in total loan business
ii. The rapid increase of the amount of the loans partly benefit from the high economy development of Ningbo.
iii. In 2006, the bank boosted the enthusiasm of sales staff according to the improvement of the performance assessment system which
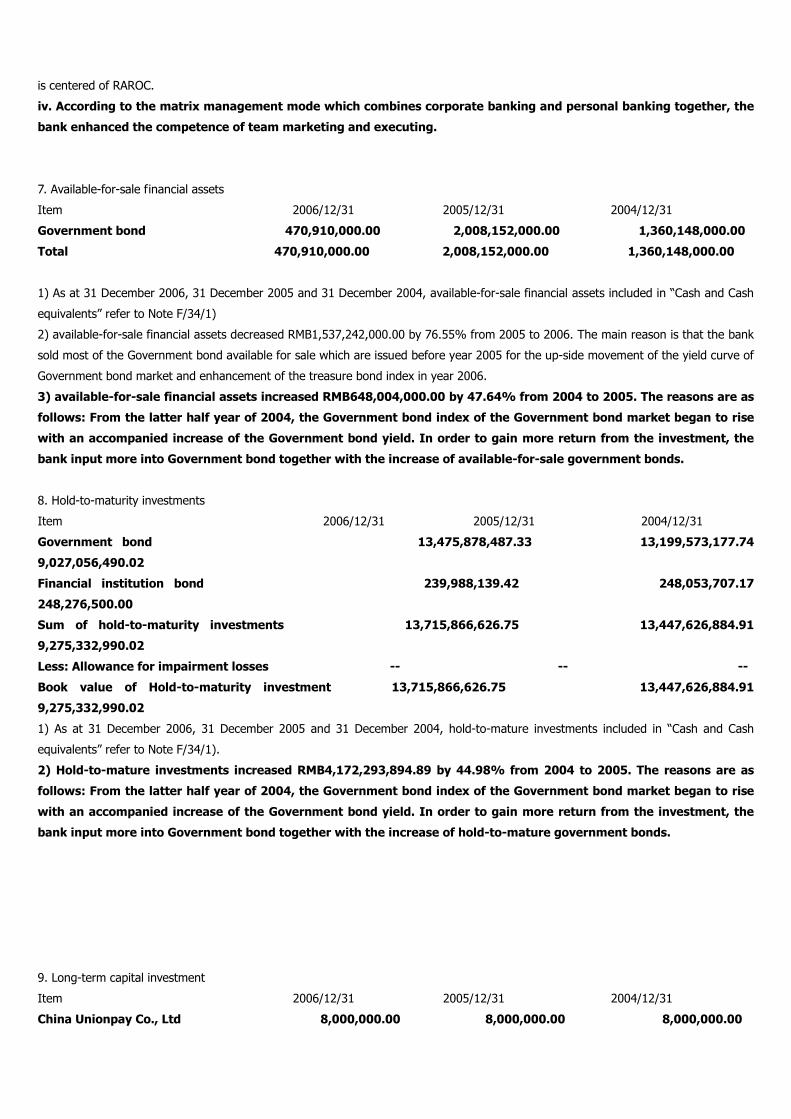
is centered of RAROC.
iv. According to the matrix management mode which combines corporate banking and personal banking together, the
bank enhanced the competence of team marketing and executing.
7. Available-for-sale financial assets
Item 2006/12/31 2005/12/31 2004/12/31
Government bond 470,910,000.00 2,008,152,000.00 1,360,148,000.00
Total 470,910,000.00 2,008,152,000.00 1,360,148,000.00
1) As at 31 December 2006, 31 December 2005 and 31 December 2004, available-for-sale financial assets included in “Cash and Cash
equivalents” refer to Note F/34/1)
2) available-for-sale financial assets decreased RMB1,537,242,000.00 by 76.55% from 2005 to 2006. The main reason is that the bank
sold most of the Government bond available for sale which are issued before year 2005 for the up-side movement of the yield curve of
Government bond market and enhancement of the treasure bond index in year 2006.
3) available-for-sale financial assets increased RMB648,004,000.00 by 47.64% from 2004 to 2005. The reasons are as
follows: From the latter half year of 2004, the Government bond index of the Government bond market began to rise
with an accompanied increase of the Government bond yield. In order to gain more return from the investment, the
bank input more into Government bond together with the increase of available-for-sale government bonds.
8. Hold-to-maturity investments
Item 2006/12/31 2005/12/31 2004/12/31
Government bond 13,475,878,487.33 13,199,573,177.74
9,027,056,490.02
Financial institution bond 239,988,139.42 248,053,707.17
248,276,500.00
Sum of hold-to-maturity investments 13,715,866,626.75 13,447,626,884.91
9,275,332,990.02
Less: Allowance for impairment losses -- -- --
Book value of Hold-to-maturity investment 13,715,866,626.75 13,447,626,884.91
9,275,332,990.02
1) As at 31 December 2006, 31 December 2005 and 31 December 2004, hold-to-mature investments included in “Cash and Cash
equivalents” refer to Note F/34/1).
2) Hold-to-mature investments increased RMB4,172,293,894.89 by 44.98% from 2004 to 2005. The reasons are as
follows: From the latter half year of 2004, the Government bond index of the Government bond market began to rise
with an accompanied increase of the Government bond yield. In order to gain more return from the investment, the
bank input more into Government bond together with the increase of hold-to-mature government bonds.
9. Long-term capital investment
Item 2006/12/31 2005/12/31 2004/12/31
China Unionpay Co., Ltd 8,000,000.00 8,000,000.00 8,000,000.00

City commercial bank clearing centre 250,000.00 250,000.00 250,000.00
Total 8,250,000.00 8,250,000.00 8,250,000.00
Equity investments in other corporations are all less than 5% in their total investments. Because it is unable to state the
fair value of the equity investment, the impairment of the cost method is applied here for the balance of it.
10. Real estate
fair value of real estate
2004/01/01 161,934,784.61
Increase 28,669,271.39
Decrease --
2004/12/31 190,604,056.00
Increase --
Decrease 31,123,485.00
2005/12/31 159,480,571.00
Increase 38,635,130.00
Decrease 34,377,238.00
2006/12/31 163,738,463.00
According to the xinchangpinzizi<2004> No.002 report, the management made the estimate of the fair value of
investment estate based on the assessment for the buildings up to 30 June, 2004, combined with the market
information in Ningbo during corresponding period.
11. Fixed assets
1) Details of balance
Item 2006/12/31 2005/12/31 2004/12/31
Cost 804,011,794.13 705,164,303.13 634,427,802.49
Accumulated depreciation 226,307,924.15 170,406,134.38 129,535,295.83
Impairment allowances 4,864,972.66 5,274,736.27 2,165,235.58
Net value of fixed assets 572,838,897.32 529,483,432.48 502,727,271.08
Fixed assets disposal -- -- --
Fixed assets 572,838,897.32 529,483,432.48 502,727,271.08
2) Adjustment of cost of fixed assets
House & Conveyance Electric Mechanical Improvement of Ornament
Total
Building equipment equipment rented fixed assets fees
2004/01/01 65,090,681.15 58,628,000.10 69,018,970.71 17,036,416,27 16,334,627.90 --
526,108,696.13
Purchase and other increase 102,193,837.56 10,154,548.00 5,244,835.26 975,922.40 4,482,390.56 --
123,051,533.78
Transfer from construction in progress 75,735,081.25 -- -- -- -- --
75,735,081.25
Sell/disposal 61,049,660.92 4,573,925.00 24,328,484.75 515,438.00 -- --
90,467,508.67
2004/12/31 481,969,939.04 64,208,623.10 49,935,321.22 17,496,900.67 20,817,018.46 --
634,427,802.49
Purchase and other increase 11,069,453.27 8,212,391.00 11,817,699.52 1,590,197.60 7,671,111.25 --
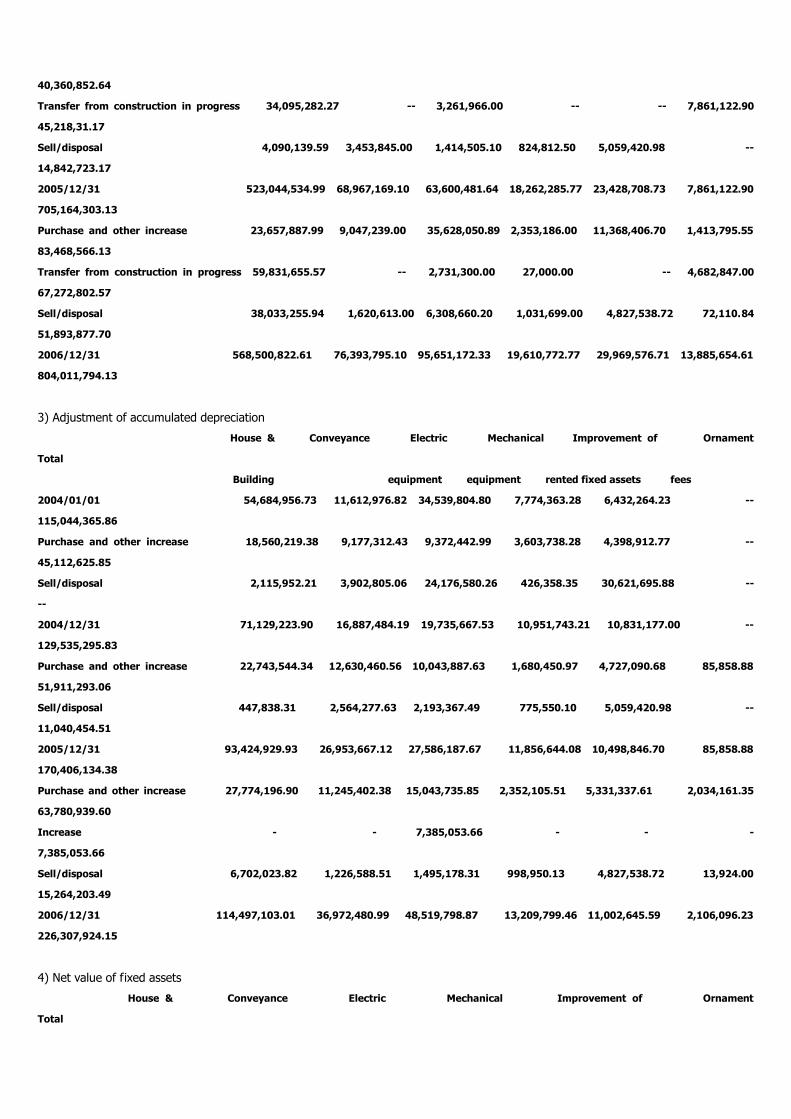
40,360,852.64
Transfer from construction in progress 34,095,282.27 -- 3,261,966.00 -- -- 7,861,122.90
45,218,31.17
Sell/disposal 4,090,139.59 3,453,845.00 1,414,505.10 824,812.50 5,059,420.98 --
14,842,723.17
2005/12/31 523,044,534.99 68,967,169.10 63,600,481.64 18,262,285.77 23,428,708.73 7,861,122.90
705,164,303.13
Purchase and other increase 23,657,887.99 9,047,239.00 35,628,050.89 2,353,186.00 11,368,406.70 1,413,795.55
83,468,566.13
Transfer from construction in progress 59,831,655.57 -- 2,731,300.00 27,000.00 -- 4,682,847.00
67,272,802.57
Sell/disposal 38,033,255.94 1,620,613.00 6,308,660.20 1,031,699.00 4,827,538.72 72,110.84
51,893,877.70
2006/12/31 568,500,822.61 76,393,795.10 95,651,172.33 19,610,772.77 29,969,576.71 13,885,654.61
804,011,794.13
3) Adjustment of accumulated depreciation
House & Conveyance Electric Mechanical Improvement of Ornament
Total
Building equipment equipment rented fixed assets fees
2004/01/01 54,684,956.73 11,612,976.82 34,539,804.80 7,774,363.28 6,432,264.23 --
115,044,365.86
Purchase and other increase 18,560,219.38 9,177,312.43 9,372,442.99 3,603,738.28 4,398,912.77 --
45,112,625.85
Sell/disposal 2,115,952.21 3,902,805.06 24,176,580.26 426,358.35 30,621,695.88 --
--
2004/12/31 71,129,223.90 16,887,484.19 19,735,667.53 10,951,743.21 10,831,177.00 --
129,535,295.83
Purchase and other increase 22,743,544.34 12,630,460.56 10,043,887.63 1,680,450.97 4,727,090.68 85,858.88
51,911,293.06
Sell/disposal 447,838.31 2,564,277.63 2,193,367.49 775,550.10 5,059,420.98 --
11,040,454.51
2005/12/31 93,424,929.93 26,953,667.12 27,586,187.67 11,856,644.08 10,498,846.70 85,858.88
170,406,134.38
Purchase and other increase 27,774,196.90 11,245,402.38 15,043,735.85 2,352,105.51 5,331,337.61 2,034,161.35
63,780,939.60
Increase - - 7,385,053.66 - - -
7,385,053.66
Sell/disposal 6,702,023.82 1,226,588.51 1,495,178.31 998,950.13 4,827,538.72 13,924.00
15,264,203.49
2006/12/31 114,497,103.01 36,972,480.99 48,519,798.87 13,209,799.46 11,002,645.59 2,106,096.23
226,307,924.15
4) Net value of fixed assets
House & Conveyance Electric Mechanical Improvement of Ornament
Total

Building equipment equipment rented fixed assets fees
2006/12/31 454,003,719.60 39,421,314.11 47,131,373.46 6,400,973.31 18,966,931.12 11,779,558.38
577,703,869.98
2005/12/31 429,619,605.06 42,013,501.98 36,014,293.97 6,405,641.69 12,929,862.03 7,775,264.02
534,758,168.75
2004/12/31 410,840,715.14 47,321,138.91 30,199,653.69 6,545,157.46 9,985,841.46 --
504,892,506.66
5) Changes of Impairment allowances
House & Conveyance Electric Mechanical Improvement of Ornament
Total
Building equipment equipment rented fixed assets fees
2004/01/01 - - - - - - -
Purchase and other increase 2,165,235.58
2,165,235.58
Sell/disposal - - - - - - -
2004/12/31 2,165,235.58 - - - - -
2,165,235.58
Purchase and other increase - 724,255.98 1,709,419.18 724,834.53 - -
3,158,509.69
Sell/disposal 49,009.00 - - - - -
49,009.00
2005/12/31 2,116,226.58 724,255.98 1,709,419.18 724,834.53 - -
5,274,736.27
Purchase and other increase - - - - - -
-
Sell/disposal 394,695.84 15,067.77 - - - -
409,763.61
2006/12/31 1,721,530.74 709,188.21 1,709,419.18 724,834.53 - -
4,864,972.66
6) Net book value of fixed assets
House & Conveyance Electric Mechanical Improvement of Ornament
Total
building equipment equipment rented fixed assets fees
2006/12/31 452,282,188.86 38,712,125.90 45,421,954.28 5,676,138.78 18,966,931.12 11,779,558.38
572,838,897.32
2005/12/31 427,503,378.48 41,289,246.00 34,304,874.79 5,680,807.16 12,929,862.03 7,775,264.02
529,483,432.48
2004/12/31 408,675,479.56 47,321,138.91 30,199,653.69 6,545,157.46 9,985,841.46 -
502,727,271.08
7) As at 31 December 2006, the Cost of buildings and constructions without House Property ownership certificate or Certificate for the use
of state-owned land was RMB32,280,580.83yuan and the accumulated depreciation was RMB410,588.40yuan. The Cost of buildings and
constructions which have not registered under the name of Ningbo Commercial bank was RMB36,121,667.34yuan and the accumulated
depreciation was RMB9,192,681.24yuan.
8) the Cost of unused fixed assets was RMB25,136,099.34yuan and the accumulated depreciation was RMB7,542,625.18yuan.
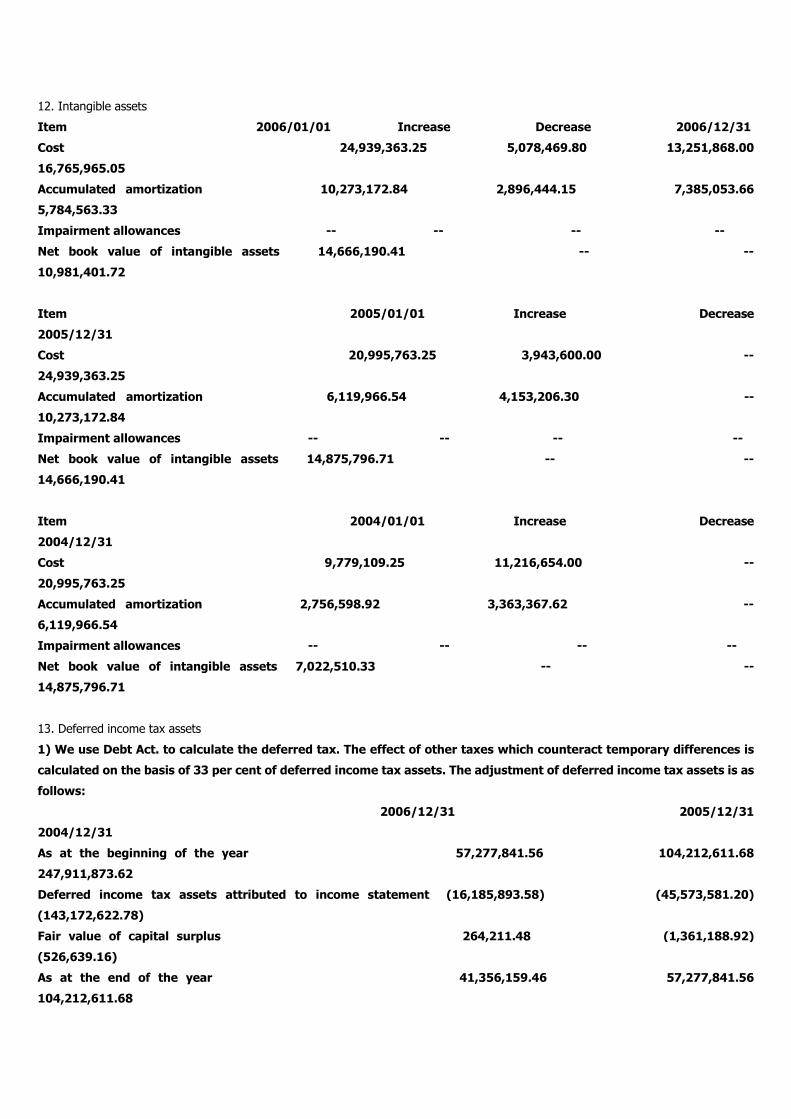
12. Intangible assets
Item 2006/01/01 Increase Decrease 2006/12/31
Cost 24,939,363.25 5,078,469.80 13,251,868.00
16,765,965.05
Accumulated amortization 10,273,172.84 2,896,444.15 7,385,053.66
5,784,563.33
Impairment allowances -- -- -- --
Net book value of intangible assets 14,666,190.41 -- --
10,981,401.72
Item 2005/01/01 Increase Decrease
2005/12/31
Cost 20,995,763.25 3,943,600.00 --
24,939,363.25
Accumulated amortization 6,119,966.54 4,153,206.30 --
10,273,172.84
Impairment allowances -- -- -- --
Net book value of intangible assets 14,875,796.71 -- --
14,666,190.41
Item 2004/01/01 Increase Decrease
2004/12/31
Cost 9,779,109.25 11,216,654.00 --
20,995,763.25
Accumulated amortization 2,756,598.92 3,363,367.62 --
6,119,966.54
Impairment allowances -- -- -- --
Net book value of intangible assets 7,022,510.33 -- --
14,875,796.71
13. Deferred income tax assets
1) We use Debt Act. to calculate the deferred tax. The effect of other taxes which counteract temporary differences is
calculated on the basis of 33 per cent of deferred income tax assets. The adjustment of deferred income tax assets is as
follows:
2006/12/31 2005/12/31
2004/12/31
As at the beginning of the year 57,277,841.56 104,212,611.68
247,911,873.62
Deferred income tax assets attributed to income statement (16,185,893.58) (45,573,581.20)
(143,172,622.78)
Fair value of capital surplus 264,211.48 (1,361,188.92)
(526,639.16)
As at the end of the year 41,356,159.46 57,277,841.56
104,212,611.68

2) Composition of deferred income tax assets
Item 2006/12/31 2005/12/31 2004/12/31
Temporary Deferred income Temporary Deferred income Temporary
deferred income
differences tax assets differences tax assets differences tax
assets
Impairment Allowances 100,255,341.64 33,084,262.74 156,384,247.30 51,606,801.61 295,433,639.97
97,493,101.19
Unrealized loss and gains of investment 832,542.24 274,738.94 31,901.39 10,527.46 4,156,716.30
1,371,716.38
Other temporary differences 24,233,811.45 7,997,157.78 17,153,068,15 5,660,512.49 16,205,436.70
5,347,794.11
Total 125,321,695.33 41,356,159.46 173,569,216.84 57,277,841.56 315,795,792.97
104,212,611.68
3) Composition of deferred income tax assets attributed to income statement
2006/12/31 2005/12/31 2004/12/31
Impairment allowances (18,522,538.87) (45,886,299.58)
(133,841,896.53)
Other temporary differences 2,336,645.29 312,718.38
(9,330,726.25)
Total (16,185,893.58) (45,573,581.20)
(143,172,622.78)
14. 0ther assets
1) Details of balance
Item 2006/12/31 2005/12/31 2004/12/31
Prepaid expenses 4,809,410.25 2,475,508.09 514,526.20
Other receivables 262,796,999.39 17,114,646.96
15,833,634.67
Foreclosed assets 8,415,138.06 49,949,965.26
75,865,756.06
Long-term deferred and prepaid expenses 39,473,970.56 35,714,346.17
37,670,468.69
Construction in progress 95,770,571.20 63,659,160.20
71,397,566.00
Consignment loan 1,301,223,331.41 550,694,555.48
432,267,640.96
Total 1,712,489,420.87 719,608,182.16
633,549,592.58
2) Deferred and prepaid expenses
Item 2006/01/01 Occurrence Amortization
2006/12/31

Renting 1,639,966.76 4,349,892.68 3,286,125.93
2,703,733.51
Papers and journals 628,117.00 814,474.72 674,061.57
768,530.15
Transportation fees 196,500.00 34,800.00 186,900.00 44,400.00
Public security service fees 8,724.33 172,100.00 118,674.33
62,150.00
The access tax of cars and ships 1,200.00 1,300.00 1,200.00 1,300.00
Software service fees 1,000.00 3,000.00 2,750.00 1,250.00
Pension -- 70,271.00 36,361.00 33,920.00
Properties management fees -- 9,423.54 7,852.95 1,570.59
Advertising -- 165,000.00 56,250.00 108,750.00
Uniform -- 1,083,806.00 -- 1,083,806.00
Total 2,475,508.09 6,704,067.94 4,370,165.78
4,809,410.25
Item 2005/01/01 Occurrence Amortization
2006/12/31
Renting 93,725.00 1,639,966.76 93,725.00
1,639,966.76
Papers and journals 334,401.20 628,117.00 334,401.20
628,117.00
Transportation fees 86,400.00 196,500.00 86,400.00
196,500.00
Public security service fees -- 8,724.33 -- 8,724.33
The access tax of cars and ships -- 1,200.00 -- 1,200.00
Software service fees -- 1,000.00 -- 1,000.00
Total 514,526.20 2,475,508.09 514,526.20
2,475,508.09
Item 2004/01/01 Occurrence Amortization
2006/12/31
Renting 291,058.00 576,600.00 773,933.00
93,725.00
Papers and journals 5,760.00 334,401.20 5,760.00
334,401.20
Transportation fees -- 86,400.00 -- 86,400.00
Total 296,818.00 997,401.20 779,693.00
514,526.20
3) Other account receivable
i. Details of balance
Item 2006/12/31 2005/12/31
2004/12/31
Revolving fund -- 200,000.00 1,175,530.00
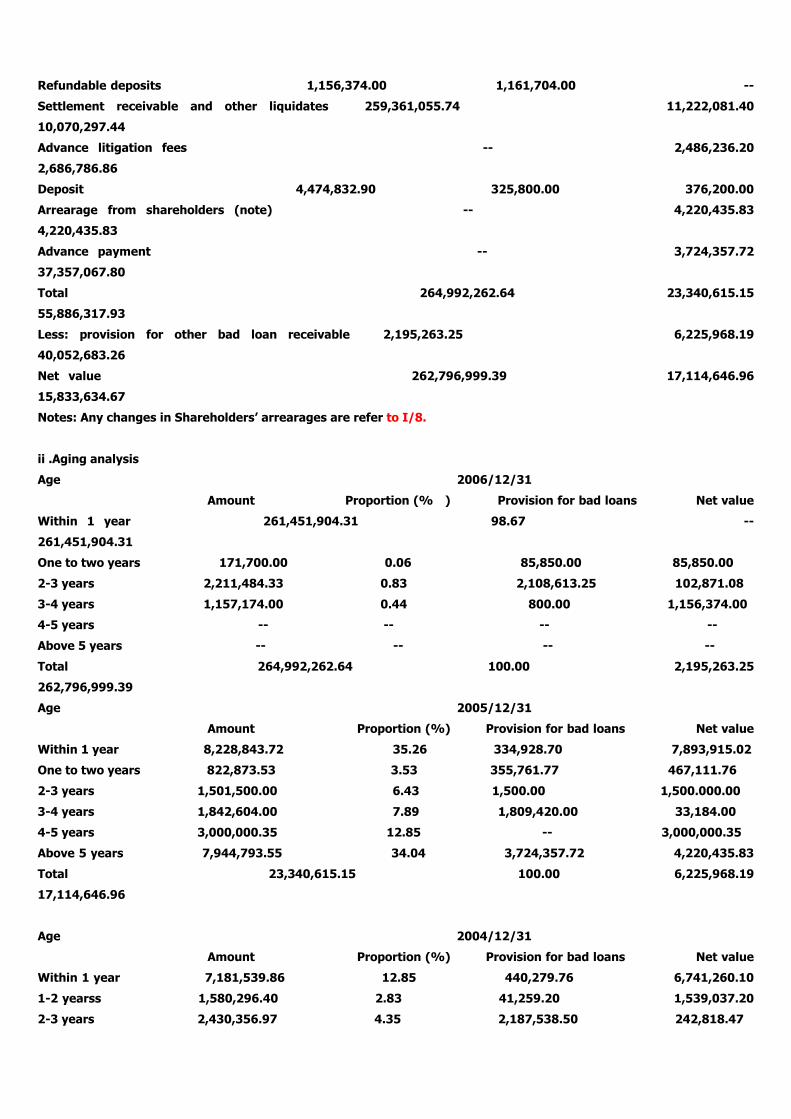
Refundable deposits 1,156,374.00 1,161,704.00 --
Settlement receivable and other liquidates 259,361,055.74 11,222,081.40
10,070,297.44
Advance litigation fees -- 2,486,236.20
2,686,786.86
Deposit 4,474,832.90 325,800.00 376,200.00
Arrearage from shareholders (note) -- 4,220,435.83
4,220,435.83
Advance payment -- 3,724,357.72
37,357,067.80
Total 264,992,262.64 23,340,615.15
55,886,317.93
Less: provision for other bad loan receivable 2,195,263.25 6,225,968.19
40,052,683.26
Net value 262,796,999.39 17,114,646.96
15,833,634.67
Notes: Any changes in Shareholders’arrearages are refer to I/8.
ii .Aging analysis
Age 2006/12/31
Amount Proportion (% ) Provision for bad loans Net value
Within 1 year 261,451,904.31 98.67 --
261,451,904.31
One to two years 171,700.00 0.06 85,850.00 85,850.00
2-3 years 2,211,484.33 0.83 2,108,613.25 102,871.08
3-4 years 1,157,174.00 0.44 800.00 1,156,374.00
4-5 years -- -- -- --
Above 5 years -- -- -- --
Total 264,992,262.64 100.00 2,195,263.25
262,796,999.39
Age 2005/12/31
Amount Proportion (%) Provision for bad loans Net value
Within 1 year 8,228,843.72 35.26 334,928.70 7,893,915.02
One to two years 822,873.53 3.53 355,761.77 467,111.76
2-3 years 1,501,500.00 6.43 1,500.00 1,500.000.00
3-4 years 1,842,604.00 7.89 1,809,420.00 33,184.00
4-5 years 3,000,000.35 12.85 -- 3,000,000.35
Above 5 years 7,944,793.55 34.04 3,724,357.72 4,220,435.83
Total 23,340,615.15 100.00 6,225,968.19
17,114,646.96
Age 2004/12/31
Amount Proportion (%) Provision for bad loans Net value
Within 1 year 7,181,539.86 12.85 440,279.76 6,741,260.10
1-2 yearss 1,580,296.40 2.83 41,259.20 1,539,037.20
2-3 years 2,430,356.97 4.35 2,187,538.50 242,818.47

3-4 years 3,067,638.35 5.49 11,238.00 3,056,400.35
4-5 years 4,235,735.83 7.58 15,300.00 4,220,435.83
Above 5 years 37,390,750.52 66.90 34,357,067.80 33,682.72
Total 5,886,317.93 100.00 40,052,683.26
15,833,634.67
As at the end of 31 December 2006, no receivable items of Shareholders who hold 5% or more than 5% shares of the
Bank.
4) Foreclosed assets
Item 2006/12/31 2005/12/31
2004/12/31
House and building 6,794,544.39 60,303,030.92
138,448,854.18
Equipment -- -- 1,862,430.00
Capital stock 3,865,854.85 4,054,854.85 4,054,854.85
Total of Assets for solvency 10,660,399.24 64,357,885.77
144,366,139.03
Less: Allowance for impairment losses 2,245,261.18 14,407,920.51
68,500,382.97
Book value of foreclosed assets 8,415,138.06 49,949,965.26
75,865,756.06
As at 31 December 2006, the value of foreclosed assets without House Property ownership certificate or Certificate for the use of
state-owned land is RMB4,323,554.51yuan and the impairment is RMB2,575,720.03yuan. The value of foreclosed assets with House
Property ownership certificate or Certificate for the use of state-owned land which have not registered yet is RMB1,263,164.46yuan and
the impairment was RMB787,898.68yuan. The sales of these foreclosed assets refer to Note J/1.
5) Long-term deferred and prepaid expenses
Item 2006/01/01 Occurrence Amortization
2006/12/31
Supplementary to pension 12,330,916.49 12,392,217.28 5,480,407.33
19,242,726.44
Renting 23,381,809.68 2,583,479.20 5,785,304.76
20,179,984.12
Information service fees 1,620.00 -- 360.00 1,260.00
Advertising -- 60,000.00 10,000.00
50,000.00
Total 35,714,346.17 15,035,696.48 11,276,072.09
39,473,970.56
Item 2005/01/01 Occurrence Amortization
2005/12/31
Supplementary to pension 12,895,076.07 -- 564,159.58
12,330,916.49
Renting 24,756,492.62 3,650,083.33 5,024,766.27
23,381,809.68

Information service fees -- 1,620.00 --
1,620.00
Public security service fees 18,900.00 -- 18,900.00 --
Total 37,670,468.69 3,651,703.33 5,607,825.85
35,714,346.17
Item 2004/01/01 Occurrence Amortization
2004/12/31
Supplementary to pension 14,506,960.58 -- 1,611,884.51
12,895,076.07
Renting 24,023,015.29 5,092,486.00 4,359,008.67
24,756,492.62
Information service fees 4,800.00 -- 4,800.00 --
Public security service fees -- 75,600.00 56,700.00
18,900.00
Total 38,534,775.87 5,168,086.00 6,032,393.18
37,670,468.69
6) Construction in progress
As As at the beginning of the year Occurrence As at the end of
the year
Increase Fixed assets Decrease
2006 63,659,160.20 99,887,698.77 67,272,802.57 503,485.20
95,770,571.20
2005 71,397,566.00 43,048,248.67 45,218,371.17 5,568,283.30
63,659,160.20
2004 96,195,578.44 50,937,068.81 75,735,081.25 --
71,397,566.00
7) Other assets increased RMB992,881,238.71 from 2005 to 2006 by 137.98%, the main reasons are as follows:
i. Entrusted loans for which the bank doesn’t undertake risks increased RMB750,528,775.93.
ii. Items in the process of clearance and settlement increased RMB248,138,974.34which mainly comes from the timing
between trade and settlement in foreign currency trade.
15. Due to banks and other institutions
Item 2006/12/31 2005/12/31 2004/12/31
Due to banks 90,093,231.61 15,995,590.48 1,314,457.89
Due to other financial institutions 48,486,764.07 22,833,882.17
48,971,860.82
Total 138,579,995.68 38,829,472.65 50,286,318.71
Due to banks and other financial institutions increased RMB99,750,523.03 by 256.89% from 2005 to 2006. The main reasons are as
follows:
1) According to the matrix management mode which combines corporate banking and personal banking together, the bank enhanced the

competence of team marketing and executing.
2) The bank emphasis on marketing on stock companies and commercial banks, the amount increased
RMB25,652,881.9 and RMB74,097,641.13 respectively.
16. Placements to other institutions
2006/12/31 2005/12/31
2004/12/31
Placements from other non-financial institutions -- 36,772,584.55
--
Placement from banks and other financial institutions decreased RMB36,772,584.55yuan by 100% for the reason that
placement of foreign currency shortage in 2005 has returned in 2006 after its maturity.
17. Repurchase agreement
1) Repurchase of Pledged goods
Item 2006/12/31 2005/12/31
2004/12/31
Bond 5,000,000,000.00 1,600,000,000.00
1,933,500,000.00
Bills -- -- 95,000,000.00
Total 5,000,000,000.00 1,600,000,000.00
2,028,500,000.00
2) Counter party
Counter party 2006/12/31 2005/12/31
2004/12/31
National postal saving bureau 3,000,000,000.00 --
--
Bank 2,000,000,000.00 1,600,000,000.00
2,028,500,000.00
Total 5,000,000,000.00 1,600,000,000.00
2,028,500,000.00
3) Repurchased financial assets increased RMB3,400,000,000.00 by 212.5% which are borrowed from money market
for the new resell government bond.
18. Deposits
1) Details of balance
Item 2006/12/31 2005/12/31
2004/12/31
Short-term deposit 28,416,382,576.57 23,667,490,835.68
19,516,823,677.71
Short-term savings 8,666,792,905.13 6,401,612,732.62
4,512,641,426.87
Long-term deposit 3,111,365,000.00 2,035,000,000.00
2,074,368,685.00
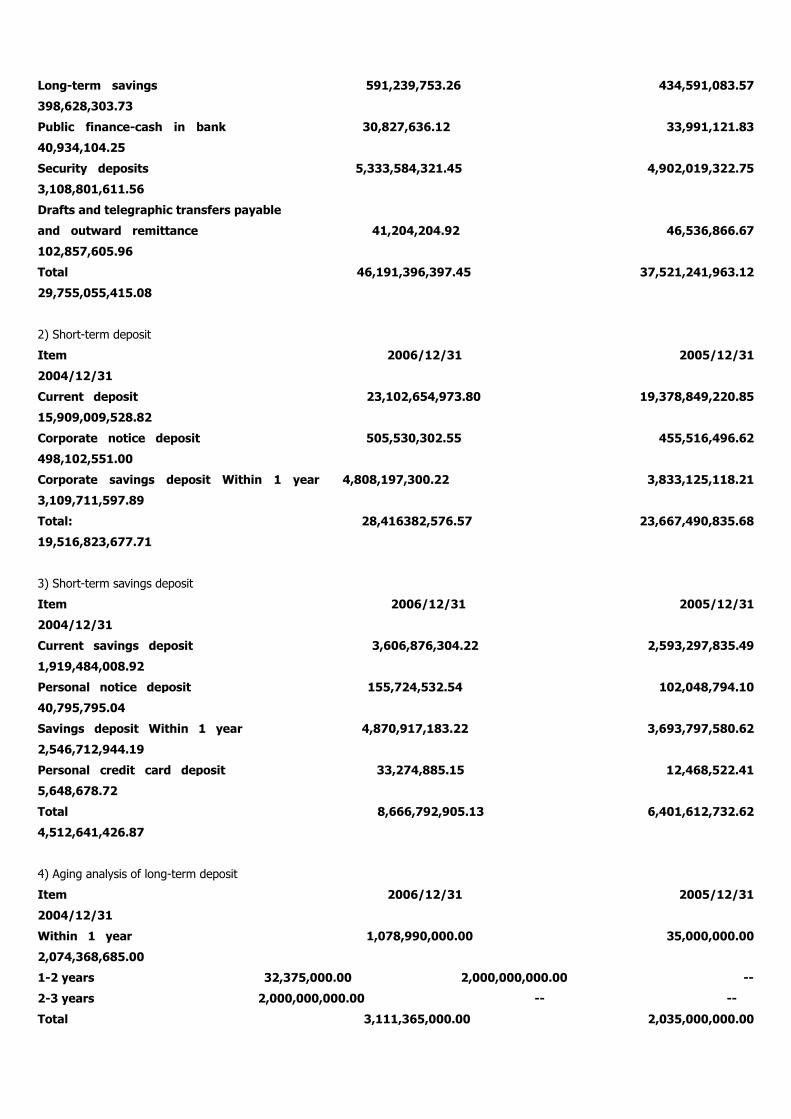
Long-term savings 591,239,753.26 434,591,083.57
398,628,303.73
Public finance-cash in bank 30,827,636.12 33,991,121.83
40,934,104.25
Security deposits 5,333,584,321.45 4,902,019,322.75
3,108,801,611.56
Drafts and telegraphic transfers payable
and outward remittance 41,204,204.92 46,536,866.67
102,857,605.96
Total 46,191,396,397.45 37,521,241,963.12
29,755,055,415.08
2) Short-term deposit
Item 2006/12/31 2005/12/31
2004/12/31
Current deposit 23,102,654,973.80 19,378,849,220.85
15,909,009,528.82
Corporate notice deposit 505,530,302.55 455,516,496.62
498,102,551.00
Corporate savings deposit Within 1 year 4,808,197,300.22 3,833,125,118.21
3,109,711,597.89
Total: 28,416382,576.57 23,667,490,835.68
19,516,823,677.71
3) Short-term savings deposit
Item 2006/12/31 2005/12/31
2004/12/31
Current savings deposit 3,606,876,304.22 2,593,297,835.49
1,919,484,008.92
Personal notice deposit 155,724,532.54 102,048,794.10
40,795,795.04
Savings deposit Within 1 year 4,870,917,183.22 3,693,797,580.62
2,546,712,944.19
Personal credit card deposit 33,274,885.15 12,468,522.41
5,648,678.72
Total 8,666,792,905.13 6,401,612,732.62
4,512,641,426.87
4) Aging analysis of long-term deposit
Item 2006/12/31 2005/12/31
2004/12/31
Within 1 year 1,078,990,000.00 35,000,000.00
2,074,368,685.00
1-2 years 32,375,000.00 2,000,000,000.00 --
2-3 years 2,000,000,000.00 -- --
Total 3,111,365,000.00 2,035,000,000.00
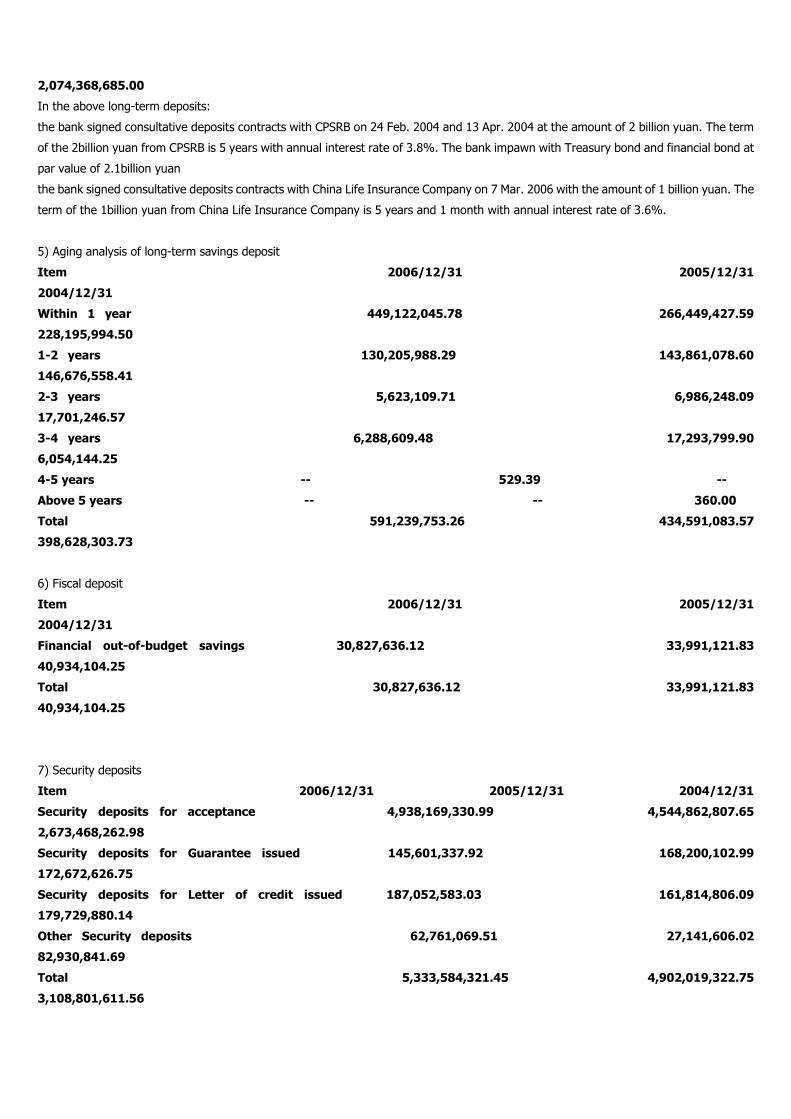
2,074,368,685.00
In the above long-term deposits:
the bank signed consultative deposits contracts with CPSRB on 24 Feb. 2004 and 13 Apr. 2004 at the amount of 2 billion yuan. The term
of the 2billion yuan from CPSRB is 5 years with annual interest rate of 3.8%. The bank impawn with Treasury bond and financial bond at
par value of 2.1billion yuan
the bank signed consultative deposits contracts with China Life Insurance Company on 7 Mar. 2006 with the amount of 1 billion yuan. The
term of the 1billion yuan from China Life Insurance Company is 5 years and 1 month with annual interest rate of 3.6%.
5) Aging analysis of long-term savings deposit
Item 2006/12/31 2005/12/31
2004/12/31
Within 1 year 449,122,045.78 266,449,427.59
228,195,994.50
1-2 years 130,205,988.29 143,861,078.60
146,676,558.41
2-3 years 5,623,109.71 6,986,248.09
17,701,246.57
3-4 years 6,288,609.48 17,293,799.90
6,054,144.25
4-5 years -- 529.39 --
Above 5 years -- -- 360.00
Total 591,239,753.26 434,591,083.57
398,628,303.73
6) Fiscal deposit
Item 2006/12/31 2005/12/31
2004/12/31
Financial out-of-budget savings 30,827,636.12 33,991,121.83
40,934,104.25
Total 30,827,636.12 33,991,121.83
40,934,104.25
7) Security deposits
Item 2006/12/31 2005/12/31 2004/12/31
Security deposits for acceptance 4,938,169,330.99 4,544,862,807.65
2,673,468,262.98
Security deposits for Guarantee issued 145,601,337.92 168,200,102.99
172,672,626.75
Security deposits for Letter of credit issued 187,052,583.03 161,814,806.09
179,729,880.14
Other Security deposits 62,761,069.51 27,141,606.02
82,930,841.69
Total 5,333,584,321.45 4,902,019,322.75
3,108,801,611.56

8) Remittance payable and outward remittance
Item 2006/12/31 2005/12/31 2004/12/31
Remittance payable 34,536,903.18 35,101,634.39
60,728,679.46
Temporary deposit 2,044,305.18 2,037,574.32
39,649,984.07
Outward remittance 4,012,721.07 9,229,144.26 2,448,451.89
Inward remittance 610,275.49 168,513.70 30,490.54
Total 41,204,204.92 46,536,866.67
102,857,605.96
As at 31 December 2006, 31 December 2005 and 31 December 2004, payable to shareholders who own no less than 5%
shares of the bank refers to Note G/2/2)/iii.
19 Accrued payroll
Item 2006/12/31 2005/12/31 2004/12/31
Salary, bonus and allowance 124,666,574.40 104,850,168.55
27,528,123.71
Welfare 1,864,057.53 1,954,024.35
1,628,870.39
Labor union’s funds and employee education funds -- --
216.00
Economic Compensation for terminating labor relations (Note) 2,558,016.24 4,367,911.88
5,956,679.46
Total 129,088,648.17 111,172,104.78
35,113,889.56
The bank makes commitment to employees who retire before the legal retirement age that they can get monthly compensates from their
retirement until their legal retirement age. The bank estimated the future compensate and discounted it as liability at present using the
interest rate of treasury bond at the corresponding period.
The balance of salary payable is mainly accumulated by annual salary reserves drawn in line with the performance and management
assessing regulations. The bank has made adjustment to the tax payable in consideration of these reserves when calculating income tax.
The retract of the RMB60.30million on balance of salary payable from 2004 to 2005 which is related to the change of the share capital
refers to I/8.
Salary payable increased RMB76,058,215.22 by 216.6% from 2004 to 2005. As when the registered capital and share capital both
increase, the bank purchased shares hold by 12employees using the RMB60.30million on balance of salary payable, and totally endorsed
to employees in 2005 with the RMB60.30million switch back on salary payable.
20. Taxes payable
Item 2006/12/31 2005/12/31 2004/12/31
Enterprise Income Tax 44,616,713.49 117,955,592.51 --
Business Tax 38,699,405.18 19,071,243.47 14,205,503.55
City Maintenance And Construction Tax 2,016,006.66 1,262,261.10
960,053.70
Educational surcharges 1,397,116.64 772,972.17
554,417.30
Real estate tax -- 289,909.68 --
Individual Income Tax 397,377.89 9,904,203.89

1,077,134.81
Stamp duty -- -- 86,449.11
Other 1,812,660.23 992,896.20 360,480.89
Total 88,939,280.09 150,249,079.02
17,244,039.36
Tax payable declined RMB 61,309,798.93 by 40.81%. The main reasons are as follows:
1)In 2005, the bank estimated the income tax payable for the whole accounting year in accordance with the regulations from Ningbo
National Taxation Bureau brought the amount of income tax payable for the whole accounting year into that of the fourth quarter, and
increased the income tax payable in year end.
2)Business tax increased RMB19,628,161.71 from 2005 to 2006 because of the increase of the business income in the fourth quarter of
2006.
Tax payable increased RMB133,005,039.66 by 771.31%. The main reasons are as follows:
1)In 2005, the bank estimated the income tax payable for the whole accounting year in accordance with the regulations from National
Taxation Bureau, brought the amount of income tax payable for the whole accounting year into that of the fourth quarter, and increased
the income tax payable in year end.Income tax payable increased RMB117,955,592.51 from 2004 to 2005 and no income tax payable is
stated at the year end of 2004.
2)Personal income tax payable increased RMB8,827,069.08 from 2004 to 2005 for that the bank gave out bonus of 2005 in advance.
21. Interest payable
1) Details of balance
Item 2006/12/31 2005/12/31
2004/12/31
Interest on fixed deposit 68,608,774.86 30,856,004.33
32,963,569.32
Interest on fixed savings deposit 73,876,096.21 59,389,354.98
30,281,337.01
Interest on Security deposits 21,377,506.66 15,898,186.77
--
Interest on notice deposit 3,789,530.44 3,385,467.05
--
Interest on selling repurchase national debt 2,083,298.63 --
--
Other interest payable 56,296.05 56,296.05
56,296.05
Total 169,791,502.85 109,585,309.18
63,301,202.38
2) Aging analysis
Age 2006/12/31 2005/12/31
2004/12/31
Amount Proportion (%) Amount Proportion (%) Amount
Proportion (%)
Within 1 year 43,944,384.52 25.89 80,461,692.54 73.43 61,368,704.93
96.94
1-2 years 6,692,241.19 3.94 28,672,368.51 26.16 1,663,135.80
2.63
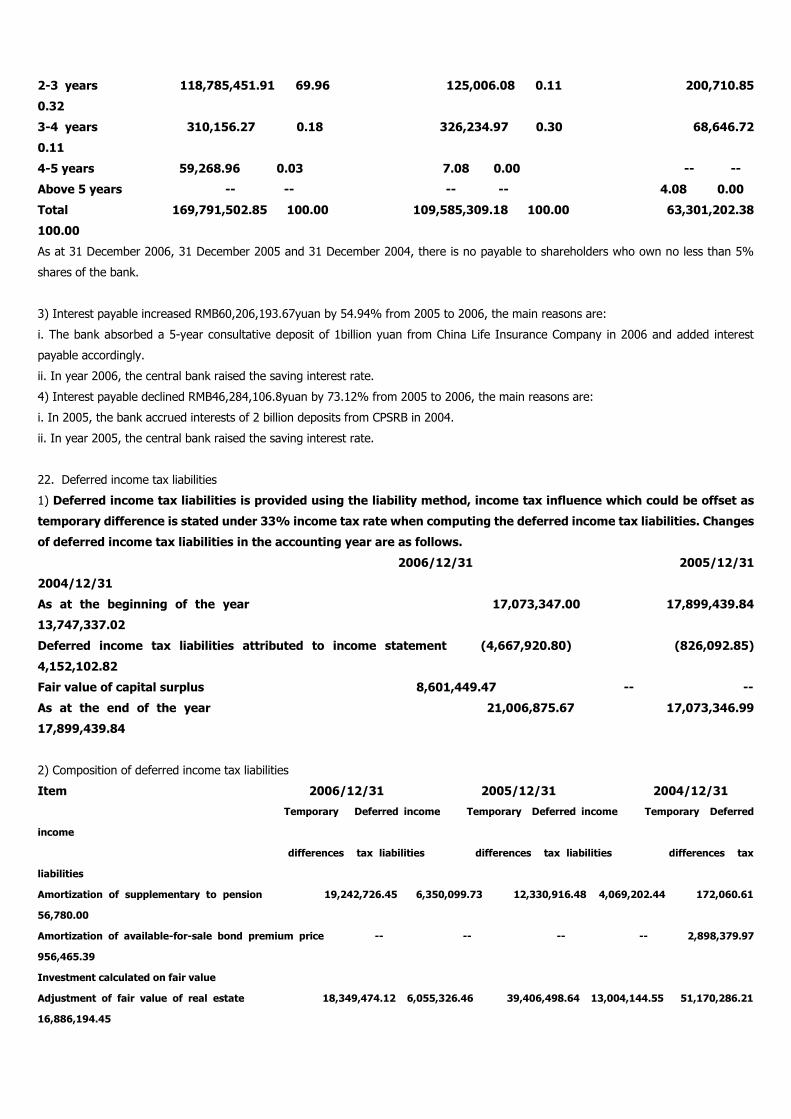
2-3 years 118,785,451.91 69.96 125,006.08 0.11 200,710.85
0.32
3-4 years 310,156.27 0.18 326,234.97 0.30 68,646.72
0.11
4-5 years 59,268.96 0.03 7.08 0.00 -- --
Above 5 years -- -- -- -- 4.08 0.00
Total 169,791,502.85 100.00 109,585,309.18 100.00 63,301,202.38
100.00
As at 31 December 2006, 31 December 2005 and 31 December 2004, there is no payable to shareholders who own no less than 5%
shares of the bank.
3) Interest payable increased RMB60,206,193.67yuan by 54.94% from 2005 to 2006, the main reasons are:
i. The bank absorbed a 5-year consultative deposit of 1billion yuan from China Life Insurance Company in 2006 and added interest
payable accordingly.
ii. In year 2006, the central bank raised the saving interest rate.
4) Interest payable declined RMB46,284,106.8yuan by 73.12% from 2005 to 2006, the main reasons are:
i. In 2005, the bank accrued interests of 2 billion deposits from CPSRB in 2004.
ii. In year 2005, the central bank raised the saving interest rate.
22. Deferred income tax liabilities
1) Deferred income tax liabilities is provided using the liability method, income tax influence which could be offset as
temporary difference is stated under 33% income tax rate when computing the deferred income tax liabilities. Changes
of deferred income tax liabilities in the accounting year are as follows.
2006/12/31 2005/12/31
2004/12/31
As at the beginning of the year 17,073,347.00 17,899,439.84
13,747,337.02
Deferred income tax liabilities attributed to income statement (4,667,920.80) (826,092.85)
4,152,102.82
Fair value of capital surplus 8,601,449.47 -- --
As at the end of the year 21,006,875.67 17,073,346.99
17,899,439.84
2) Composition of deferred income tax liabilities
Item 2006/12/31 2005/12/31 2004/12/31
Temporary Deferred income Temporary Deferred income Temporary Deferred
income
differences tax liabilities differences tax liabilities differences tax
liabilities
Amortization of supplementary to pension 19,242,726.45 6,350,099.73 12,330,916.48 4,069,202.44 172,060.61
56,780.00
Amortization of available-for-sale bond premium price -- -- -- -- 2,898,379.97
956,465.39
Investment calculated on fair value
Adjustment of fair value of real estate 18,349,474.12 6,055,326.46 39,406,498.64 13,004,144.55 51,170,286.21
16,886,194.45
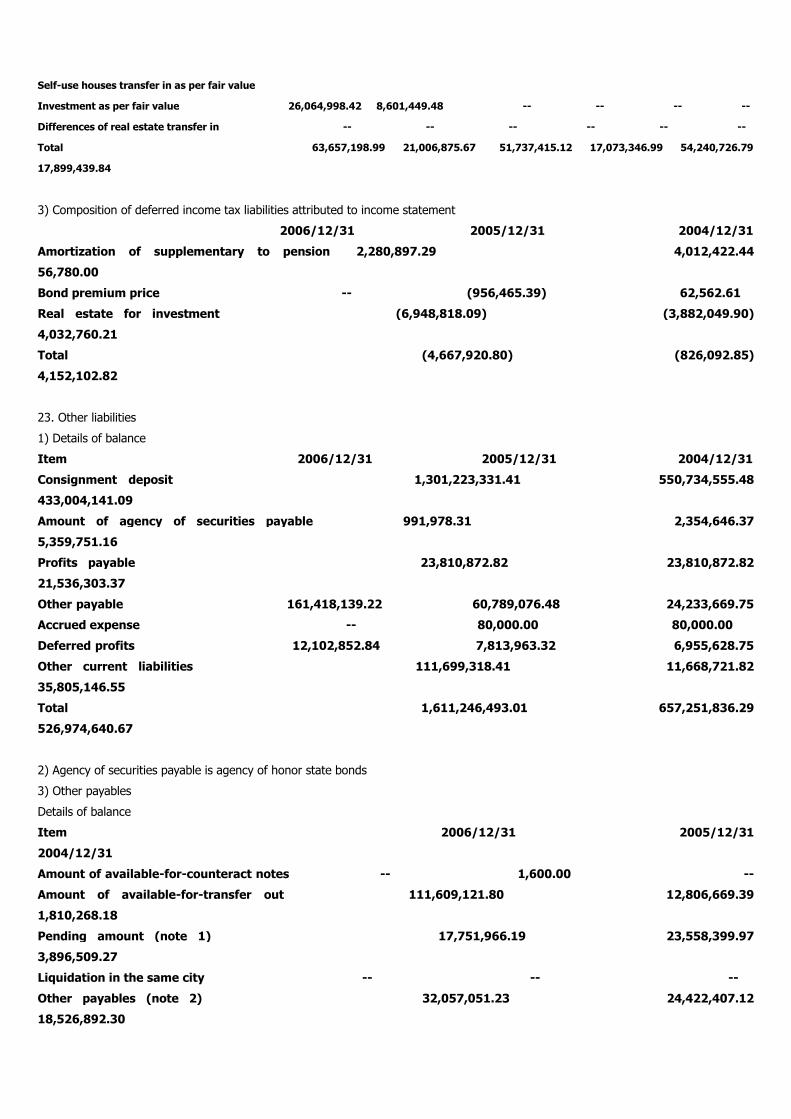
Self-use houses transfer in as per fair value
Investment as per fair value 26,064,998.42 8,601,449.48 -- -- -- --
Differences of real estate transfer in -- -- -- -- -- --
Total 63,657,198.99 21,006,875.67 51,737,415.12 17,073,346.99 54,240,726.79
17,899,439.84
3) Composition of deferred income tax liabilities attributed to income statement
2006/12/31 2005/12/31 2004/12/31
Amortization of supplementary to pension 2,280,897.29 4,012,422.44
56,780.00
Bond premium price -- (956,465.39) 62,562.61
Real estate for investment (6,948,818.09) (3,882,049.90)
4,032,760.21
Total (4,667,920.80) (826,092.85)
4,152,102.82
23. Other liabilities
1) Details of balance
Item 2006/12/31 2005/12/31 2004/12/31
Consignment deposit 1,301,223,331.41 550,734,555.48
433,004,141.09
Amount of agency of securities payable 991,978.31 2,354,646.37
5,359,751.16
Profits payable 23,810,872.82 23,810,872.82
21,536,303.37
Other payable 161,418,139.22 60,789,076.48 24,233,669.75
Accrued expense -- 80,000.00 80,000.00
Deferred profits 12,102,852.84 7,813,963.32 6,955,628.75
Other current liabilities 111,699,318.41 11,668,721.82
35,805,146.55
Total 1,611,246,493.01 657,251,836.29
526,974,640.67
2) Agency of securities payable is agency of honor state bonds
3) Other payables
Details of balance
Item 2006/12/31 2005/12/31
2004/12/31
Amount of available-for-counteract notes -- 1,600.00 --
Amount of available-for-transfer out 111,609,121.80 12,806,669.39
1,810,268.18
Pending amount (note 1) 17,751,966.19 23,558,399.97
3,896,509.27
Liquidation in the same city -- -- --
Other payables (note 2) 32,057,051.23 24,422,407.12
18,526,892.30

Total 161,418,139.22 60,789,076.48
24,233,669.75
note1:Unclaimed deposit accounts come from balance of two accounts
i. Corporate accounts without any transaction in more than one year and without any accounts closing action after 30 days notice from
the bank are transferred into unclaimed deposit accounts.
ii. Personal accounts without any transaction in more than five years and with the balance less than RMB10 are transferred into unclaimed
deposit accounts. So are the expired joint cards.
Note2: In March,2005,the bank started to make clearance of the legal person shareholders who have been written off by Industrial And
Commercial Bureau. As at 31 December 2006, the amount of payable to these shareholders within the balance of other payables is
RMB242,474.08.
4) Unrealized interest income of deferred bill discount
5) Other liabilities
Item 2006/12/31 2005/12/31 2004/12/31
Issuance of promissory notes 87,252,686.00 31,309,322.60
5,295,706.85
Interest payable tax 2,960,393.50 1,946,511.20 1,921,417.09
Other agency of business 10,712,252.25 -- 4,451,256.76
Public finance funds settlement 10,763,677.89 989,791.36 --
Other 10,308.77 1,559,521.39 341.12
Total 111,699,318.41 35,805,146.55 11,668,721.82
6) Other liabilities increased RMB953,994,656.72 from 2005 to 2006 by 145.15%, the main reasons are:
i. Entrusted loans for which the bank doesn’t undertake risks increased and entrusted deposits increased RMB750,488,775.93
accordingly.
ii. Pending for settlement increased RMB98,802,452.41 because of the timing difference in clearance.
24. Share Capital
Type 2006/12/31 2005/12/31
2004/12/31
National shares 270,000,000.00 270,000,000.00
270,000,000.00
State-owned corporate shares 201,009,200.00 201,009,200.00
184,009,200.00
Foreign invested shares 250,000,000.00 -- --
Domestic legal person shares 917,806,153.00 955,583,500.00
971,120,400.00
Natural personal shares 411,184,647.00 373,407,300.00
374,870,400.00
Total 2,050,000,000.00 1,800,000,000.00
1,800,000,000.00
The bank’s capital was verified for four times:
In Mar.1997, Ningbo Yongjiang Certified Public Accountants Co., Ltd confirmed that the bank’s registered capital was
238,244,300.00yuan and issued the capital verification report (Yongkuaizi〈1997〉No.51017.)

In Aug.2001, its capital was increased by 181,270,000.00yuan to 419,514,000.00yuan, which was verified by Ningbo Dewei Certified
Public Accountants Co., Ltd and the number of the verification report is Deweiyanzi <2001> No.277.
In Dec.2004, the registered capital increased by 1,380,486,000.00yuan to 1,800,000,000.00yuan. Ningbo Kexin Certified Public
Accountants Co., Ltd verified the capital and reported the result by Kexinyanbaozi<2004> No.152.
In Jun.2006, the registered capital increased by 250,000,000.00yuan to 2,050,000,000.00yuan. Ningbo Kexin Certified Public
Accountants Co., Ltd verified the capital and reported the result By Kexinyanbaozi<2006> No.082.
As at 30.Sep. 2006, the capital changes was checked by Shanhai Changjiang Certified Public Accountants Co., Ltd and reported the result
by Xinchangkuaishibaozi<2006>No.23019. See referenceI/8.
In accordance with Yongguozichan<2006>No.63”Approval on the issue about management of state-owned assets of Ningbo Commercial
Bank”, the structure of the shares is: Ningbo Financial Bureau holds 270 million state-owned shares; Ningbo Power Development
Company and Ningbo ETDZ shareholding Co, Ltd hold 201million state-owned shares in total; The OCBC Bank holds 250 million foreign
shares; 116 domestic legal person shareholders hold 918 million public shares and 3040 natural person shareholders hold 411 million
personal shares.
25. Capital surplus
Other capital surplus
Item Premium Reserves for fair value changes Difference and fair value of
Total
Of available-for-sale investment self-use houses transferred to
real estate for investment
2004/01/01 -- (3,854,237.03) --
(3,854,237.03)
Increase/decrease -- 1,069,237.09 --
1,069,237.09
2004/12/31 -- (2,784,999.94) --
(2,784,999.94)
Increase/decrease -- 2,763,625.99 --
2,763,625.99
2005/12/31 -- (21,373.95) --
(21,373.95)
Increase/decrease 320,000,000.00 (536,429.35) 17,463,548.92
336,927,119.57
2006/12/31 320,000,000.00 (557,803.30) 17,463,548.92
336,905,745.62
Capital reserve increased RMB336,927,119.57 by 15,763.45% from 2005 to 2006. Main reasons are:
i. In Jun. 2006, OCBC Bank purchased RMB250 million ordinary shares at the price of 2.28yuan per share, the premium of shares is
RMB320 million
ii. When estates turned from self-use to investment, the difference between fair value and book value on transfer day is stated in other
capital reserve with RMB17,463,548.92.
Capital reserve increased RMB2,763,625.99 by 99.23% from 2004 to 2005. The main reason is that reserve for fair value changes of
available-for-sale securities increased.
26. Surplus reserve
Item Surplus reserve Public welfare fund Total
2004/01/01 9,222,566.92 16,600,602.22 25,823,169.14
2004/12/31 9,222,566.92 16,600,602.22 25,823,169.14
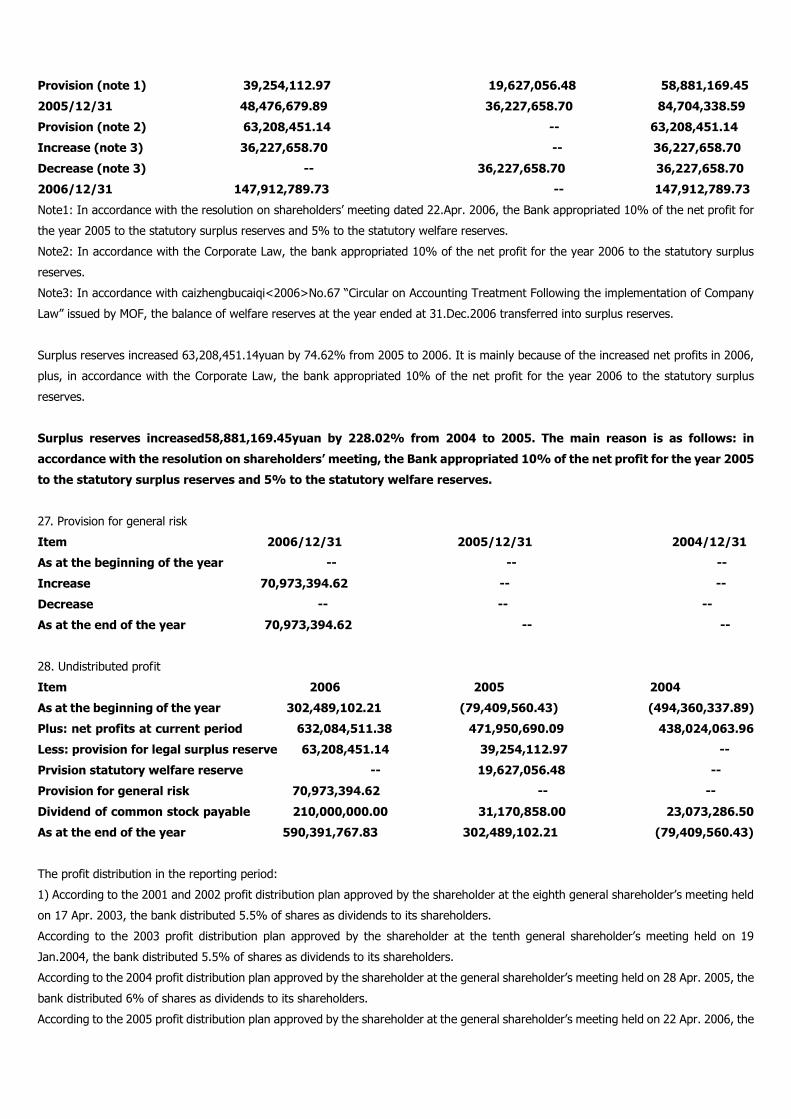
Provision (note 1) 39,254,112.97 19,627,056.48 58,881,169.45
2005/12/31 48,476,679.89 36,227,658.70 84,704,338.59
Provision (note 2) 63,208,451.14 -- 63,208,451.14
Increase (note 3) 36,227,658.70 -- 36,227,658.70
Decrease (note 3) -- 36,227,658.70 36,227,658.70
2006/12/31 147,912,789.73 -- 147,912,789.73
Note1: In accordance with the resolution on shareholders’meeting dated 22.Apr. 2006, the Bank appropriated 10% of the net profit for
the year 2005 to the statutory surplus reserves and 5% to the statutory welfare reserves.
Note2: In accordance with the Corporate Law, the bank appropriated 10% of the net profit for the year 2006 to the statutory surplus
reserves.
Note3: In accordance with caizhengbucaiqi<2006>No.67 “Circular on Accounting Treatment Following the implementation of Company
Law” issued by MOF, the balance of welfare reserves at the year ended at 31.Dec.2006 transferred into surplus reserves.
Surplus reserves increased 63,208,451.14yuan by 74.62% from 2005 to 2006. It is mainly because of the increased net profits in 2006,
plus, in accordance with the Corporate Law, the bank appropriated 10% of the net profit for the year 2006 to the statutory surplus
reserves.
Surplus reserves increased58,881,169.45yuan by 228.02% from 2004 to 2005. The main reason is as follows: in
accordance with the resolution on shareholders’meeting, the Bank appropriated 10% of the net profit for the year 2005
to the statutory surplus reserves and 5% to the statutory welfare reserves.
27. Provision for general risk
Item 2006/12/31 2005/12/31 2004/12/31
As at the beginning of the year -- -- --
Increase 70,973,394.62 -- --
Decrease -- -- --
As at the end of the year 70,973,394.62 -- --
28. Undistributed profit
Item 2006 2005 2004
As at the beginning of the year 302,489,102.21 (79,409,560.43) (494,360,337.89)
Plus: net profits at current period 632,084,511.38 471,950,690.09 438,024,063.96
Less: provision for legal surplus reserve 63,208,451.14 39,254,112.97 --
Prvision statutory welfare reserve -- 19,627,056.48 --
Provision for general risk 70,973,394.62 -- --
Dividend of common stock payable 210,000,000.00 31,170,858.00 23,073,286.50
As at the end of the year 590,391,767.83 302,489,102.21 (79,409,560.43)
The profit distribution in the reporting period:
1) According to the 2001 and 2002 profit distribution plan approved by the shareholder at the eighth general shareholder’s meeting held
on 17 Apr. 2003, the bank distributed 5.5% of shares as dividends to its shareholders.
According to the 2003 profit distribution plan approved by the shareholder at the tenth general shareholder’s meeting held on 19
Jan.2004, the bank distributed 5.5% of shares as dividends to its shareholders.
According to the 2004 profit distribution plan approved by the shareholder at the general shareholder’s meeting held on 28 Apr. 2005, the
bank distributed 6% of shares as dividends to its shareholders.
According to the 2005 profit distribution plan approved by the shareholder at the general shareholder’s meeting held on 22 Apr. 2006, the
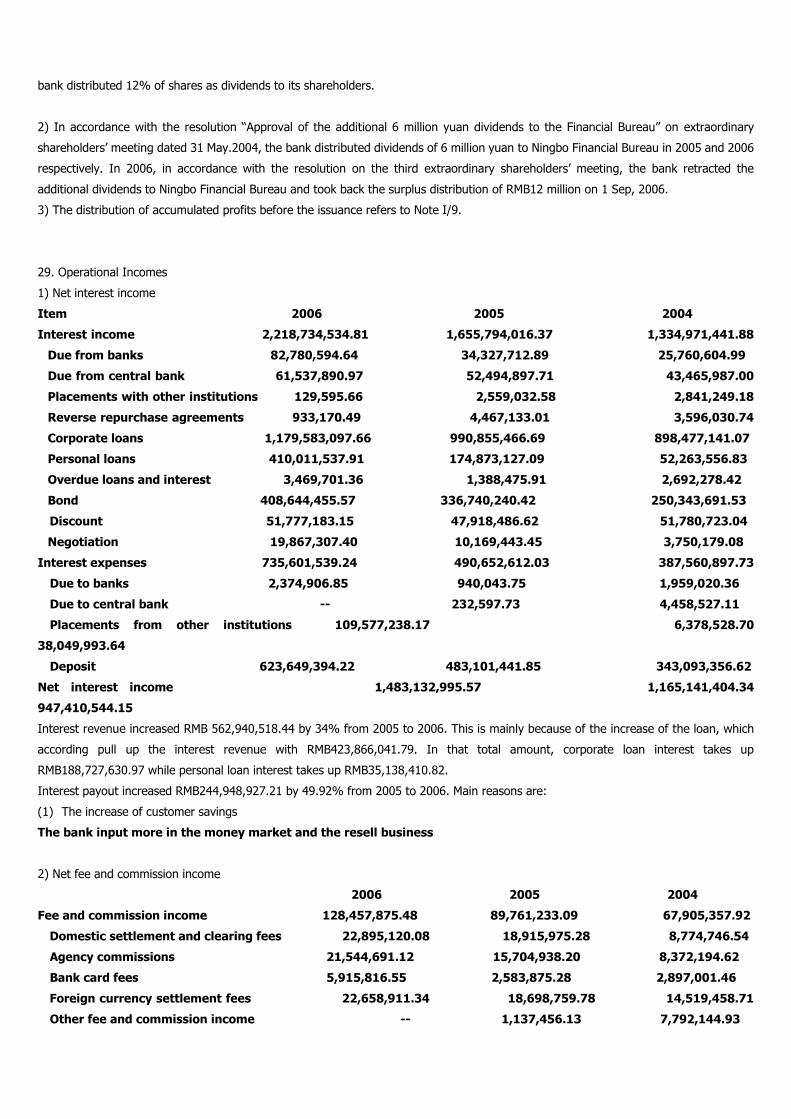
bank distributed 12% of shares as dividends to its shareholders.
2) In accordance with the resolution “Approval of the additional 6 million yuan dividends to the Financial Bureau” on extraordinary
shareholders’meeting dated 31 May.2004, the bank distributed dividends of 6 million yuan to Ningbo Financial Bureau in 2005 and 2006
respectively. In 2006, in accordance with the resolution on the third extraordinary shareholders’ meeting, the bank retracted the
additional dividends to Ningbo Financial Bureau and took back the surplus distribution of RMB12 million on 1 Sep, 2006.
3) The distribution of accumulated profits before the issuance refers to Note I/9.
29. Operational Incomes
1) Net interest income
Item 2006 2005 2004
Interest income 2,218,734,534.81 1,655,794,016.37 1,334,971,441.88
Due from banks 82,780,594.64 34,327,712.89 25,760,604.99
Due from central bank 61,537,890.97 52,494,897.71 43,465,987.00
Placements with other institutions 129,595.66 2,559,032.58 2,841,249.18
Reverse repurchase agreements 933,170.49 4,467,133.01 3,596,030.74
Corporate loans 1,179,583,097.66 990,855,466.69 898,477,141.07
Personal loans 410,011,537.91 174,873,127.09 52,263,556.83
Overdue loans and interest 3,469,701.36 1,388,475.91 2,692,278.42
Bond 408,644,455.57 336,740,240.42 250,343,691.53
Discount 51,777,183.15 47,918,486.62 51,780,723.04
Negotiation 19,867,307.40 10,169,443.45 3,750,179.08
Interest expenses 735,601,539.24 490,652,612.03 387,560,897.73
Due to banks 2,374,906.85 940,043.75 1,959,020.36
Due to central bank -- 232,597.73 4,458,527.11
Placements from other institutions 109,577,238.17 6,378,528.70
38,049,993.64
Deposit 623,649,394.22 483,101,441.85 343,093,356.62
Net interest income 1,483,132,995.57 1,165,141,404.34
947,410,544.15
Interest revenue increased RMB 562,940,518.44 by 34% from 2005 to 2006. This is mainly because of the increase of the loan, which
according pull up the interest revenue with RMB423,866,041.79. In that total amount, corporate loan interest takes up
RMB188,727,630.97 while personal loan interest takes up RMB35,138,410.82.
Interest payout increased RMB244,948,927.21 by 49.92% from 2005 to 2006. Main reasons are:
(1) The increase of customer savings
The bank input more in the money market and the resell business
2) Net fee and commission income
2006 2005 2004
Fee and commission income 128,457,875.48 89,761,233.09 67,905,357.92
Domestic settlement and clearing fees 22,895,120.08 18,915,975.28 8,774,746.54
Agency commissions 21,544,691.12 15,704,938.20 8,372,194.62
Bank card fees 5,915,816.55 2,583,875.28 2,897,001.46
Foreign currency settlement fees 22,658,911.34 18,698,759.78 14,519,458.71
Other fee and commission income -- 1,137,456.13 7,792,144.93

Gains from foreign exchange 1,088,984.50 590,275.36 748,419.00
Gains from arbitrage 448,501.60 186,094.05 2,957,589.82
Gains from RMB FX 53,978,379.23 31,706,834.66 21,837,170.55
Gains from purchase and
sell foreign currency on behalf of clients 11,852,.65 220,620.30 --
Other gains from foreign exchange product (84,381.59) 16,404.05 6,632.29
Fee and commission expense 16,341,908.73 20,604,599.50
11,390,986.42
Domestic settlement and clearing fees 4,875,317.28 4,035,160.50
3,262,566.99
Agency commissions 651.33 1,500.00 277.610.95
Bank card fees 5,777,005.01 2,731,159.28 1,342,065.67
Foreign currency settlement fees 2,081,082.52 5,230,282.67
5,747,193.42
Losses from foreign exchange 2,581,460.78 3,366,661.49 262,399.09
Losses from arbitrage 914,482.31 983,216.55 493,696.30
Losses from RMB FX -- 16,823.43 8.40
Other losses from foreign exchange product 111,909.50 4,239,795.58 5,445.60
Net fee and commission income 112,115,966.75 69,156,633.59
56,514,371.50
Fees and commission income increased RMB42,959,333.16 by 62.12% from 2005 to 2006. Main reasons are as follows:
i. The bank carried out a matrix management mode which combines corporate banking and personal banking together from 2006 and put
emphasis on marketing. Moreover, net income of domestic settlement fees and agency fees increased RMB8,979,589.61.
ii. Bank card fees income increased RMB3,331,941.27 for the development of the credit card business.
iii. The bank developed international settlement business further more with the net income of foreign currency settlement fees increase
RMB7,109,351.71 and the income of buying and selling of foreign exchange increased RMB22,271,544.57.
3). Investment gains
Item 2006 2005 2004
Gains from equity investment 64,000.00 -- --
Difference of trading
Available-for-sell securities 8,029,128.69 (1,279,539.90) (2,576,879.90)
Total 8,093,128.69 (1,279,539.90) (2,576,879.90)
Investment gains increased RMB9,372,668.59 by 732.5%from 2005 to 2006. The main reason is that the bank sold most of the treasury
bonds available for sale for the enhancement of the treasure bond index in year 2006.
Investment gains increased RMB1,297,340 by 50.35%from 2004 to 2005. It is mainly because of the ascending trend of
the yield of government bonds market with the increase of price difference of bonds available for sale.
4). Gains from fair value changes
Item 2006 2005 2004
Fair value changes on real estate for investment -- --
28,877,271.38
Total -- -- 28,877,271.38
5). Other operating income

Item 2006 2005 2004
Rent income 2,626,333.67 1,681,451.85 8,993,793.84
Other income 165,295.97
Other operating income increased RMB1,110,177.79 by 66.02% from 2005 to 2006. It is mainly because that the better leasehold market
brought increasing rent income.
Other operating income declined RMB7,312,341.99 by 50.35% from 2004 to 2005. It is mainly because that the bank
disposed large amount of foreclosed assets in order to decrease the capital in assets with low interest yields including
estate transferred from foreclosed assets to investment assets.
30. Operating expenses
1) Business tax and surcharges
Item 2006 2005 2004
Business tax 89,744,921.43 65,267,403.76 52,716,746.74
City maintenance and construction tax 6,307,242.88 4,400,659.74
3,606,043.34
Educational surcharges 3,954,228.68 2,662,712.50 2,085,047.79
Total 100,006,392.99 72,330,776.00 58,407,837.87
Business tax and surcharges increased RMB27,675,616.99 by 38.26% from 2005 to 2006 mainly because of the increased operating
income in 2006.
2) General and administrative expenses
Item 2006 2005 2004
Staff costs 307,938,193.97 264,063,202.41
219,491,830.20
Business expenses 215,887,375.49 140,321,707.00
125,138,306.12
Depreciation of fixed assets 63,780,939.60 51,911,293.06
45,112,625.85
Amortization of long-term prepaid expenses 11,276,072.09 5,607,825.85
6,032,393.18
Amortization of intangible assets 2,896,444.15 4,153,206.30
3,363,367.62
Total 601,779,025.30 466,057,234.62
399,138,522.97
3) Allowance for impairment losses
Item 2006 2005 2004
Provision for other receivable (306,347.21) (194,004.99)
256,106.56
Provision for Due from banks -- 194,403.79 --
Allowance for loan impairment 66,524,198.20 35,143,838.09
(7,541,741.27)
Provision for devalue of fixed assets -- 3,158,509.69
2,165,235.58
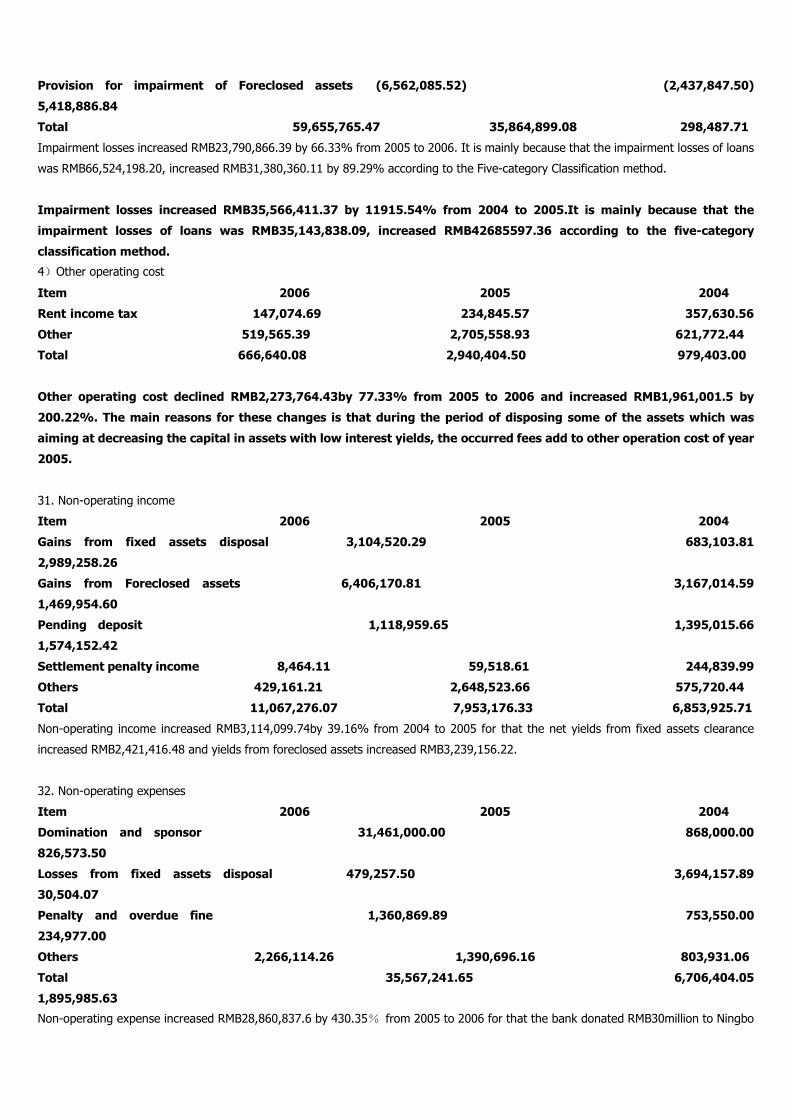
Provision for impairment of Foreclosed assets (6,562,085.52) (2,437,847.50)
5,418,886.84
Total 59,655,765.47 35,864,899.08 298,487.71
Impairment losses increased RMB23,790,866.39 by 66.33% from 2005 to 2006. It is mainly because that the impairment losses of loans
was RMB66,524,198.20, increased RMB31,380,360.11 by 89.29% according to the Five-category Classification method.
Impairment losses increased RMB35,566,411.37 by 11915.54% from 2004 to 2005.It is mainly because that the
impairment losses of loans was RMB35,143,838.09, increased RMB42685597.36 according to the five-category
classification method.
4)Other operating cost
Item 2006 2005 2004
Rent income tax 147,074.69 234,845.57 357,630.56
Other 519,565.39 2,705,558.93 621,772.44
Total 666,640.08 2,940,404.50 979,403.00
Other operating cost declined RMB2,273,764.43by 77.33% from 2005 to 2006 and increased RMB1,961,001.5 by
200.22%. The main reasons for these changes is that during the period of disposing some of the assets which was
aiming at decreasing the capital in assets with low interest yields, the occurred fees add to other operation cost of year
2005.
31. Non-operating income
Item 2006 2005 2004
Gains from fixed assets disposal 3,104,520.29 683,103.81
2,989,258.26
Gains from Foreclosed assets 6,406,170.81 3,167,014.59
1,469,954.60
Pending deposit 1,118,959.65 1,395,015.66
1,574,152.42
Settlement penalty income 8,464.11 59,518.61 244,839.99
Others 429,161.21 2,648,523.66 575,720.44
Total 11,067,276.07 7,953,176.33 6,853,925.71
Non-operating income increased RMB3,114,099.74by 39.16% from 2004 to 2005 for that the net yields from fixed assets clearance
increased RMB2,421,416.48 and yields from foreclosed assets increased RMB3,239,156.22.
32. Non-operating expenses
Item 2006 2005 2004
Domination and sponsor 31,461,000.00 868,000.00
826,573.50
Losses from fixed assets disposal 479,257.50 3,694,157.89
30,504.07
Penalty and overdue fine 1,360,869.89 753,550.00
234,977.00
Others 2,266,114.26 1,390,696.16 803,931.06
Total 35,567,241.65 6,706,404.05
1,895,985.63
Non-operating expense increased RMB28,860,837.6 by 430.35% from 2005 to 2006 for that the bank donated RMB30million to Ningbo

Charity Federation and Ningbo Reemployment Office.
Non-operating expense increased RMB4,810,418.42 by 254.72% from 2004 to 2005 for that the net loss of fixed assets clearance
increased RMB3,663,653.82.
33. Income tax
Item 2006 2005 2004
Income tax 170,593,446.99 137,929,229.44 --
Deferred income tax 11,517,972.79 44,747,488.35
147,324,725.60
Total 182,111,419.78 182,676,717.79
147,324,725.60
Income tax in financial report is differ from that from total profit multiply the legal interest rate. The main adjustments are as follows.
2006 2005 2004
Total profits 814,195,931.16 654,627,407.88
585,348,789.56
Income tax (33% of total profits) 268,684,657.28 216,027,044.60
193,165,100.55
Plus: the effect of not deducted fees before income tax (note 1) 72,250,029.22 75,558,978.74
33,590,717.99
Plus: the effect of duty free commodities (note 2) (158,823,266.72) (108,909,305.55)
(79,431,092.94)
Income tax 182,111,419.78 182,676,717.79
147,324,725.60
Note1: Expenses which are not allowed to be offset before tax mainly refer to wages and other cost and expenses which are out of the
range of the Tax Law.
Note2: Tax-free incomes refer to the government bond interest.
34 Notes to Cash flow statement
1) Cash and cash equivalents
Item 2006/12/31 2005/12/31
2004/12/31
Cash 4,454,725,003.18 2,607,856,457.24
2,632,199,122.11
Cash on hand 207,126,425.58 118,899,851.01
125,360,127.76
Balance with central bank 3,672,712,463.43 2,038,653,452.46
1,788,604,861.27
Due from banks due within three months 574,886,114.17 448,703,153.77
704,234,133.08
Placements with other institutions due within three months -- 1,600,000.00
14,000,000.00
Cash equivalents 794,781,151.26 2,784,867,654.17
893,149,600.00
Buying repurchase securities due within three months 150,000,000.00 --
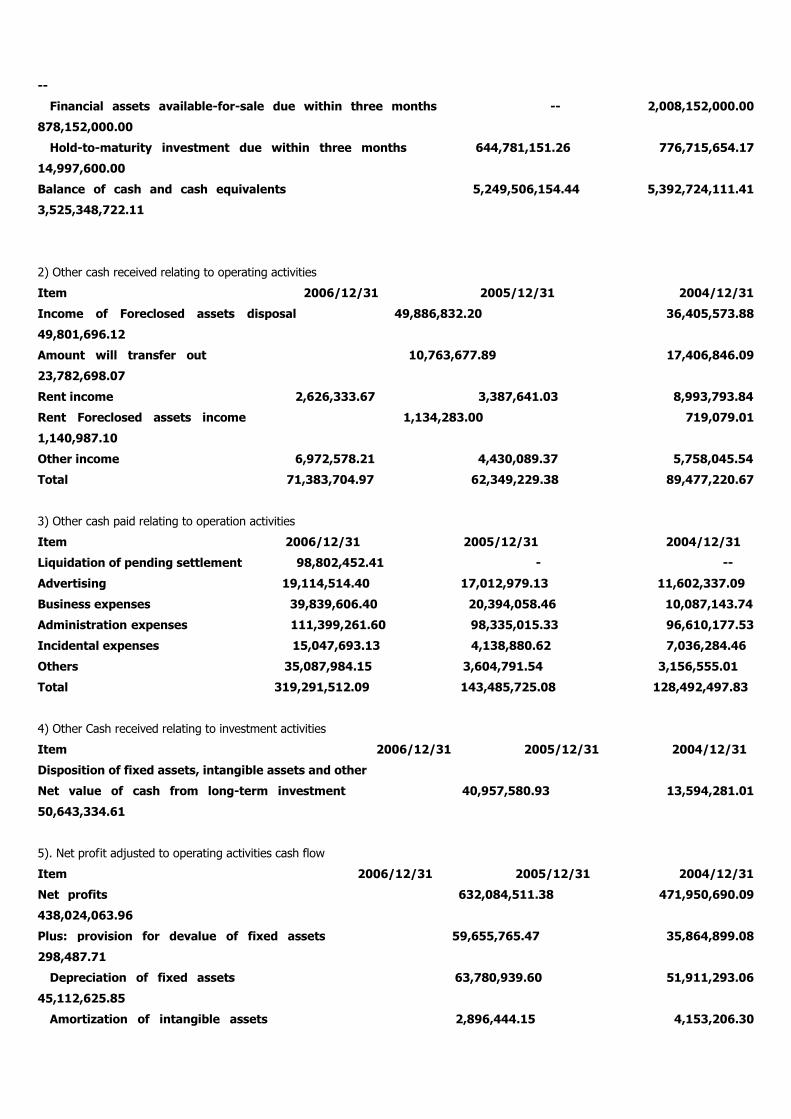
--
Financial assets available-for-sale due within three months -- 2,008,152,000.00
878,152,000.00
Hold-to-maturity investment due within three months 644,781,151.26 776,715,654.17
14,997,600.00
Balance of cash and cash equivalents 5,249,506,154.44 5,392,724,111.41
3,525,348,722.11
2) Other cash received relating to operating activities
Item 2006/12/31 2005/12/31 2004/12/31
Income of Foreclosed assets disposal 49,886,832.20 36,405,573.88
49,801,696.12
Amount will transfer out 10,763,677.89 17,406,846.09
23,782,698.07
Rent income 2,626,333.67 3,387,641.03 8,993,793.84
Rent Foreclosed assets income 1,134,283.00 719,079.01
1,140,987.10
Other income 6,972,578.21 4,430,089.37 5,758,045.54
Total 71,383,704.97 62,349,229.38 89,477,220.67
3) Other cash paid relating to operation activities
Item 2006/12/31 2005/12/31 2004/12/31
Liquidation of pending settlement 98,802,452.41 - --
Advertising 19,114,514.40 17,012,979.13 11,602,337.09
Business expenses 39,839,606.40 20,394,058.46 10,087,143.74
Administration expenses 111,399,261.60 98,335,015.33 96,610,177.53
Incidental expenses 15,047,693.13 4,138,880.62 7,036,284.46
Others 35,087,984.15 3,604,791.54 3,156,555.01
Total 319,291,512.09 143,485,725.08 128,492,497.83
4) Other Cash received relating to investment activities
Item 2006/12/31 2005/12/31 2004/12/31
Disposition of fixed assets, intangible assets and other
Net value of cash from long-term investment 40,957,580.93 13,594,281.01
50,643,334.61
5). Net profit adjusted to operating activities cash flow
Item 2006/12/31 2005/12/31 2004/12/31
Net profits 632,084,511.38 471,950,690.09
438,024,063.96
Plus: provision for devalue of fixed assets 59,655,765.47 35,864,899.08
298,487.71
Depreciation of fixed assets 63,780,939.60 51,911,293.06
45,112,625.85
Amortization of intangible assets 2,896,444.15 4,153,206.30

3,363,367.62
Decrease of long-term prepaid expenses (3,759,624.39) 1,956,122.52 864,307.18
Disposition of fixed asset, intangible assets (2,625,262.79) 3,011,054.08
(2,461,534.19)
and loss of other long-term assets
Loss of fixed assets condemnation -- -- (497,220.00)
Loss of fair value adjustment -- -- (28,877,271.39)
Investment loss (416,737,584.26) (335,460,700.52)
(247,766,811.63)
Decrease of deferred income tax assets 15,921,682.10 46,934,770.12
143,699,261.94
Increase of deferred income tax liabilities 3,933,528.68 (826,092.85)
4,152,102.83
Decrease of loans (8,544,222,9786.07) (2,358,982,749.05)
(1,054,787,935.97)
Increase of deposit 8,670,154,434,.33 7,766,186,548.04
5,693,299,008.20
Net value of deposit and loans 181,092,322.55 (397,127,415,45)
(2,725,217,340.00)
Decrease of operating receivable (878,997,429.24) (1,013,544,470.28)
(728,764,654.40)
Increase of operating payable 217,192,523.90 280,445,922.35
(507,193,034.78)
Decrease of other operating assets (712,817,700.95) (72,138,165.24)
(217,950,142.84)
Increase of other operating liabilities 853,858,930.99 98,702,696.62
247,250,784.13
Other -- -- --
Net value of cash flows from operating activities 141,410,495.45 4,583,037,608.87
1,062,548.064.22
6) Net increase of cash and cash equivalents
Item 2006/12/31 2005/12/31
2004/12/31
Balance of cash as at the end of the year 4,454,725,003.18 2,607,856,457.24
2,632,199,122.11
Less: balance of cash equivalents as at the beginning of the year 2,607,856,457.24 2,632,199.122.11
2,634,026,430.81
Plus: balance of cash equivalents as at the end of the year 794,781,151.26 2,784,867,654.17
893,149,600.00
Less: balance of cash equivalents as at the beginning of the year 2,784,867,654.17 893,149,600.00
596,146,800.00
Net value of cash and cash equivalents (143,217,956.97) 1,867,375,389.30
295,175,491.30
G. Related parties and transaction
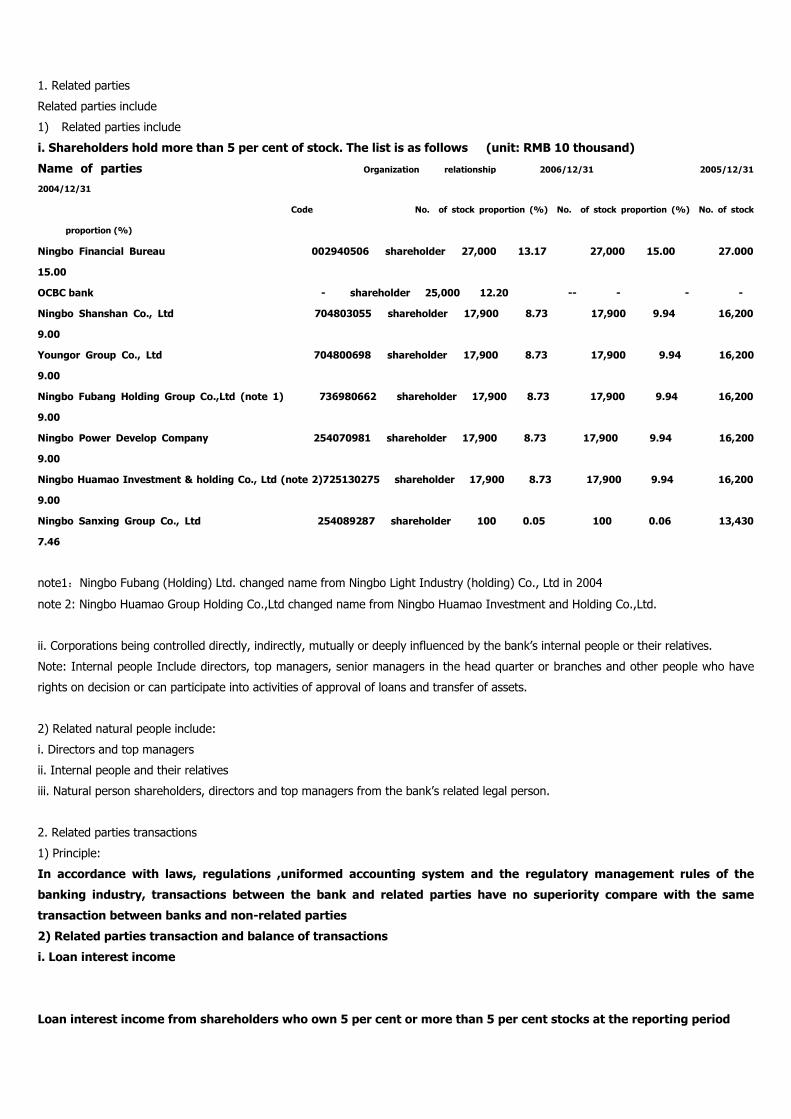
1. Related parties
Related parties include
1) Related parties include
i. Shareholders hold more than 5 per cent of stock. The list is as follows (unit: RMB 10 thousand)
Name of parties Organization relationship 2006/12/31 2005/12/31
2004/12/31
Code No. of stock proportion (%) No. of stock proportion (%) No. of stock
proportion (%)
Ningbo Financial Bureau 002940506 shareholder 27,000 13.17 27,000 15.00 27.000
15.00
OCBC bank - shareholder 25,000 12.20 -- - - -
Ningbo Shanshan Co., Ltd 704803055 shareholder 17,900 8.73 17,900 9.94 16,200
9.00
Youngor Group Co., Ltd 704800698 shareholder 17,900 8.73 17,900 9.94 16,200
9.00
Ningbo Fubang Holding Group Co.,Ltd (note 1) 736980662 shareholder 17,900 8.73 17,900 9.94 16,200
9.00
Ningbo Power Develop Company 254070981 shareholder 17,900 8.73 17,900 9.94 16,200
9.00
Ningbo Huamao Investment & holding Co., Ltd (note 2)725130275 shareholder 17,900 8.73 17,900 9.94 16,200
9.00
Ningbo Sanxing Group Co., Ltd 254089287 shareholder 100 0.05 100 0.06 13,430
7.46
note1:Ningbo Fubang (Holding) Ltd. changed name from Ningbo Light Industry (holding) Co., Ltd in 2004
note 2: Ningbo Huamao Group Holding Co.,Ltd changed name from Ningbo Huamao Investment and Holding Co.,Ltd.
ii. Corporations being controlled directly, indirectly, mutually or deeply influenced by the bank’s internal people or their relatives.
Note: Internal people Include directors, top managers, senior managers in the head quarter or branches and other people who have
rights on decision or can participate into activities of approval of loans and transfer of assets.
2) Related natural people include:
i. Directors and top managers
ii. Internal people and their relatives
iii. Natural person shareholders, directors and top managers from the bank’s related legal person.
2. Related parties transactions
1) Principle:
In accordance with laws, regulations ,uniformed accounting system and the regulatory management rules of the
banking industry, transactions between the bank and related parties have no superiority compare with the same
transaction between banks and non-related parties
2) Related parties transaction and balance of transactions
i. Loan interest income
Loan interest income from shareholders who own 5 per cent or more than 5 per cent stocks at the reporting period

Name of parties 2006 2005 2004
Ningbo Power Develop Company -- 1,104,480.00 1,907,835.00
Loan interest income from insiders and their relatives and corporations which they have power to control directly or
indirectly at the reporting period.
2006 2005 2004
31,326,743.66 30,119,173.26 27,935,719.10
ii. Deposit interest expenses
Deposit interest expenses from shareholders who own 5 per cent or more than 5 per cent stocks at the reporting period
Name of parties 2006 2005 2004
Ningbo Financial Bureau 11,966,868.92 7,556,421.36 4,786,489.96
Ningbo Shanshan Co., Ltd 40,301.60 25,540.70 89,041.91
Youngor Group Co., Ltd 21,977.22 2,325.48 1,432.50
Ningbo Fubang (Holdings) Group Co., Ltd 38,678.00 41,738.06 49,385.66
Ningbo Power Develop Company 41,842.92 63,681.64 69,809.80
Ningbo Sanxing Group Co., Ltd -- -- 9,710.87
Deposit interest expenses from insiders and their relatives and corporations which they have power to control directly
or indirectly at the reporting period
2006 2005 2004
1,310,998.82 1,262,329.11 1,165,947.58
iii. Balance of related parties transaction
Loans to chairmen and senior managers at the reporting period
2006/12/31 2005/12/31 2004/12/31
12,503,000.00 11,993,000.00 11,570,000.00
Loans to insiders and their relatives expect chairmen and senior managers at the reporting period
2006/12/31 2005/12/31 2004/12/31
266,039,469.38 220,284,223.81 281,916,071.64
Loans to related major natural person shareholders, chairmen and main managers at the reporting period.
2006/12/31 2005/12/31 2004/12/31
690,000.00 670,000.00 1,430,000.00
Balance of related parties transactions from shareholders who own 5 per cent or more than 5 per cent stocks at the
reporting period
2006/12/31
Name of parties Balance of loans Balance of deposit L/C issuance Bank acceptance bill Issuance of guarantee
Security deposits
Ningbo Financial Bureau - 766,295,871.62 - - -
-
Ningbo Shanshan Co., Ltd - 3,633,398.40 - - -
-
Ningbo Fubang Holding Group Co.,Ltd - 4,371,614.48 - - -
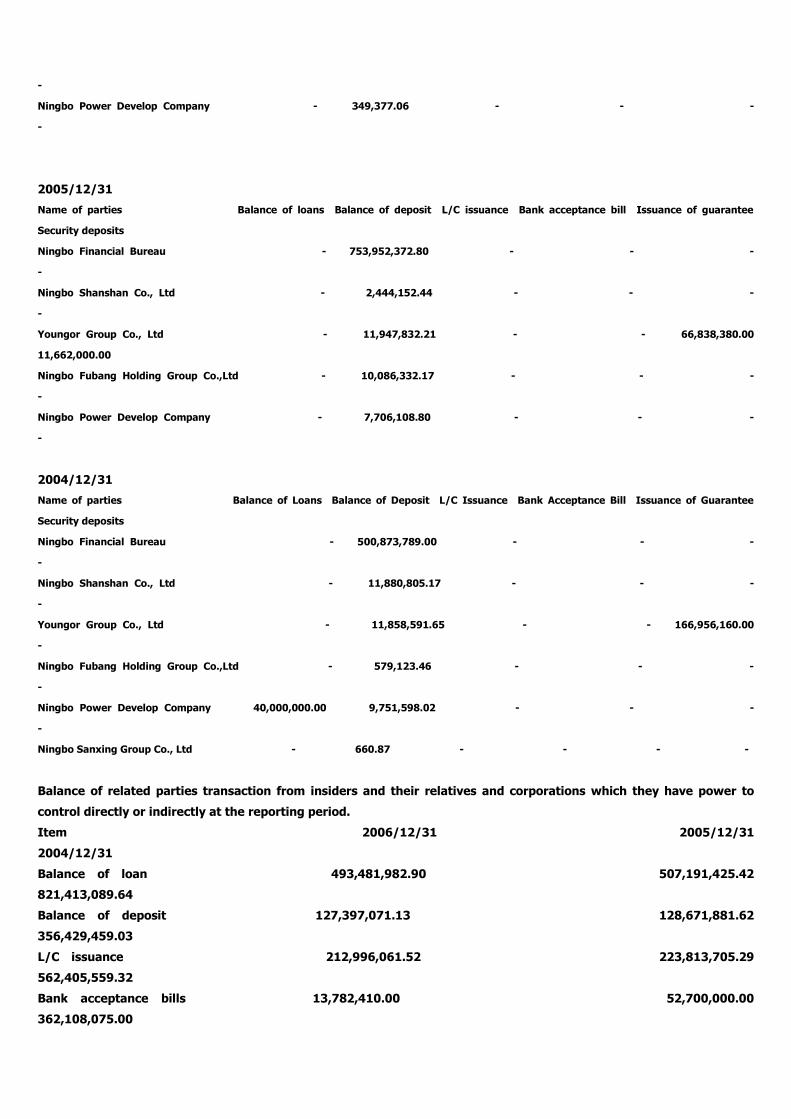
-
Ningbo Power Develop Company - 349,377.06 - - -
-
2005/12/31
Name of parties Balance of loans Balance of deposit L/C issuance Bank acceptance bill Issuance of guarantee
Security deposits
Ningbo Financial Bureau - 753,952,372.80 - - -
-
Ningbo Shanshan Co., Ltd - 2,444,152.44 - - -
-
Youngor Group Co., Ltd - 11,947,832.21 - - 66,838,380.00
11,662,000.00
Ningbo Fubang Holding Group Co.,Ltd - 10,086,332.17 - - -
-
Ningbo Power Develop Company - 7,706,108.80 - - -
-
2004/12/31
Name of parties Balance of Loans Balance of Deposit L/C Issuance Bank Acceptance Bill Issuance of Guarantee
Security deposits
Ningbo Financial Bureau - 500,873,789.00 - - -
-
Ningbo Shanshan Co., Ltd - 11,880,805.17 - - -
-
Youngor Group Co., Ltd - 11,858,591.65 - - 166,956,160.00
-
Ningbo Fubang Holding Group Co.,Ltd - 579,123.46 - - -
-
Ningbo Power Develop Company 40,000,000.00 9,751,598.02 - - -
-
Ningbo Sanxing Group Co., Ltd - 660.87 - - - -
Balance of related parties transaction from insiders and their relatives and corporations which they have power to
control directly or indirectly at the reporting period.
Item 2006/12/31 2005/12/31
2004/12/31
Balance of loan 493,481,982.90 507,191,425.42
821,413,089.64
Balance of deposit 127,397,071.13 128,671,881.62
356,429,459.03
L/C issuance 212,996,061.52 223,813,705.29
562,405,559.32
Bank acceptance bills 13,782,410.00 52,700,000.00
362,108,075.00

Issuance of guarantee - 50,000,000.00
50,000,000.00
Security deposits 17,726,674.31 31,405,716.25
161,916,070.74
H. Contingent items, commitment items and main off balance sheet items
1. litigation items come to contingent items
The amount of lawsuits is RMB 22,564,000.00 as a plaintiff and the amount of lawsuit is RMB 515,000.00 as a defendant
at the end of 2006.
2. Commitment items
1) Capitalized commitment
2006/12/31 2005/12/31 2004/12/31
Signed but not provision 29,496,095.08 6,245,087.80 53,239,922.71
Approval but not Signed 2,034,500.00 -- --
Total 31,530,595.08 6,245,087.80 53,239,922.71
2) Lease out commitment
The least rent of irrevocable operating sites and buildings in the future
2006/12/31 2005/12/31 2004/12/31
Within 1 year 24,868,302.55 8,392,928.62 7,355,860.41
1-2 years 26,286,555.13 7,496,673.00 4,637,609.36
2-3 years 24,926,576.23 8,326,346.52 3,617,576.16
3-4 years 22,263,333.22 5,822,178.89 2,747,150.84
4-5 years 20,924,706.94 4,554,166.23 2,062,373.86
Above 5 years 88,743,841.11 20,033,626.47 10,507,085.88
Total 208,013,315.18 54,625,919.73 30,927,656.51
3) Commitment to external assets pledge
Part of national debt are used for pledging deposit of personal financial products, post savings deposit and selling
repurchase guaranty in other banks
The balance and maturity date of pledge are as follows:
2006/12/31 Maturity Date
Personal financial products 17,400,000.00 2007/12/25
Post savings deposit 2,100,000,000.00 2009/4/21-2009/05/10
Selling repurchase securities agreement 5,000,000,000.00 2007/01/04-2007/12/28
2005/12/31 Maturity Date
Personal financial products 235,110,000.00 2006/02/28-2007/12/25
Post savings deposit 2,100,000,000.00 2009/4/21-2009/05/10
Selling repurchase securities agreement 1,600,000,000.00 2006/01/09-2006/01/11
2004/12/31 Maturity Date
Personal financial products 35,110,000.00 2005/05/31-2007/12/25
Post savings deposit 2,100,000,000.00 2009/4/21-2009/05/10
Selling repurchase securities agreement 2,060,000,000.00
2005/01/04-2005/01/07

Selling repurchase bills 95,000,000.00 2005/02/04-2005/03/10
3. Main off balance sheet contingent risks
2006/12/31
Item Amount Amount of Security deposits Proportion of Total Security
deposits (%)
L/C issuance 1,274,724,742.21 187,052,583.03 14.67
Bank acceptance bill 8,856,094,461.98 4,938,169,330.99 55.76
Issuance of guarantee 319,071,658.04 145,601,337.92 45.63
Loan commitment and others 6,019,375,266.41 - -
Treasury acceptance commitment 2,256,181,100.00 - -
Consignment - - -
2005/12/31
Item Amount Amount of Security deposits Proportion of Total Security
deposits (%)
L/C issuance 1,091,787,182.84 161,814,806.09 14.82
Bank acceptance bill 7,781,695,337.55 4,544,862,807.65 58.40
Issuance of guarantee 488,208,650.04 168,200,102.99 34.45
Loan commitment and others 980,080,931.10 - -
Treasury acceptance commitment 2,081,259,500.00 - -
Consignment 400,000,000.00 - -
2004/12/31
Item Amount Amount of Security deposits Proportion of Total Security
deposits (%)
L/C issuance 1,029,170,940.50 179,729,880.14 17.46
Bank acceptance bill 5,349,763,640.12 2,673,468,262.98 49.97
Issuance of guarantee 524,574,330.13 172,672,626.75 32.92
Loan commitment and others 609,029,211.96 - -
Treasury acceptance commitment 1,796,619,800.00 - -
Consignment 800,000,000.00
Letters of Credits issued refers to the bank acting at the request and on the instruction of a customer, to make a payment to the
beneficiary and pay bills of exchange drawn by the beneficiary during a certain period provided the required documents are submitted
and the terms of the credit are complied with.
Banker Acceptance refers to a draft or bill of exchange drawn upon a payee or a drawee(applicant) and accepted by a bank.
Letter of Guarantee is a written undertaking made by the bank at the request of the applicant to the beneficiary, guaranteeing that the
applicant will perform obligations under the contract signed between the applicant and the beneficiary, or the bank will take the
responsibility.
Loan Guarantee is a commitment made by the bank guarantees to the customer to offer certain amount loan in a certain period.
Certificate treasury bonds redemption commitments refer to that The Bank is entrusted by the MOF to issue certain Certificate Treasury
Bonds. The investors of Certificate Treasury Bonds have a right to redeem the bonds at par any time prior to maturity and the Bank is
committed to redeem those bonds. The redemption price is the principal value of the Certificate Treasury Bonds plus unpaid interest in

accordance with the early redemption arrangement.
The issuing responsibility refers the responsibility the bank takes on in issuing Certificate treasury bonds under the pan from the MOF.
I. Other importation items
1. Analysis of operating
1) Detailed analysis of operating in 2006
Item Corporate banking Personal banking Capital banking Other Total
Net interest income 964,829,743.03 320,151,122.45 198,152,130.09 -
1,483,132,995.57
Net fee and commission income 39,329,792.56 17,027,477.77 3,923,212.62 -
60,280,482.95
Net transaction revenues/expenses 51,835,483.80 -- - -
51,835,483.80
Net securities investment income 64,000.00 - 8,029,128.69 -
8,093,128.69
Other operating revenues/expenses - - - 2,124,989.56
2,124,989.56
Fair value adjustment gains - - - - -
Remittance gains (5,330,000.07) - - -
(5,330,000.07)
Sales tax and surcharges 75,204,765.01 23,984,305.76 662,570.09 154,752.13
100,006,392.99
Management fees 346,214,737.13 110,414,813.49 144,437,053.48 712,421.20
601,779,025.30
Loan loss/ return 19,615,303.02 46,908,895.18 - -
66,524,198.20
Other assets loss/ return (6,562,085.52) - - (306,347.21)
(6,868,432.73)
Operating profits 616,256,299.68 155,870,585.79 65,004,847.83 1,564,163.44
838,695,896.74
Net value of non-operating profits - - - (24,499,965.58)
(24,499,965.58)
Profits before tax 616,256,299.68 155,870,585.79 65,004,847.83 (22,935,802.14)
814,195,931.16
Amount of assets 21,547,399,964.27 8,293,347,458.82 26,441,847,969.42 263,637,498.21
56,546,232,890.72
Amount of liabilities 38,430,773,813.48 9,456,844,226.16 5,171,673,660.85 290,757,492.43
53,350,049,192.92
Supplementary information
1. Depreciation and amortization 44,848,082.22 14,302,951.64 18,710,136.12 92,285.86
77,953,455.84
2. Capitalized expense 84,533,159.58 26,959,317.61 35,266,322.30 173,947.58
146,932,747.07

2) Detailed analysis of operating in 2005
Item Corporate banking Personal banking Capital banking Other Total
Net interest income 816,873,801.76 135,953,995.05 212,613,607.53 --
1,165,141,404.34
Net fee and commission income 29,485,248.02 7,862,647.00 7,695,007.20 --
45,042,902.22
Net transaction revenues/expenses 24,113,731.37 -- -- --
24,113,731.37
Net securities investment income -- -- (1,279,539.90) --
(1,279,539.90)
Other operating revenues/expenses -- -- -- (1,258,952.65)
(1,258,952.65)
Fair value adjustment gains -- -- -- -- --
Remittance gains (4,126,000.08)
(4,126,000.08)
Sales tax and surcharges 61,512,580.09 10,169,821.66 421,945.03 226,429.22
72,330,776.00
Management fees 299,029,674.09 49,438,317.36 116,488,508.05 1,100,735.12
466,057,234.62
Loan loss/ return 24,064,727.00 11,079,111.09 -- --
35,143,838.09
Other assets loss/ return (735,286.24) 668,408.85 787,938.38 --
721,060.99
Operating profits 482,175,086.13 72,460,983.09 101,330,683.37 (2,586,116.99)
653,380,635.60
Net value of non-operating profits -- -- -- 1,246,772.28
1,246,772.28
Profits before tax 482,175,086.13 72,460,983.09 101,330,683.37 (1,339,344.71)
654,627,407.88
Amount of assets 16,618,897,149.72 4,011,020,881.43 21,781,324,593.00 18,105,139.28
42,429,347,763.43
Amount of liabilities 31,397,176,334.48 6,947,918,093.54 1,725,720,914.95 171,360,353.61
40,242,175,696.58
Supplementary information
1. Depreciation and amortization 39,569,936.77 6,542,063.42 15,414,667.17 145,657.85
61,672,325.21
2. Capitalized expense 53,723,247.54 8,882,018.05 20,928,160.31 197,756.51
83,731,182.41
3) Detailed analysis of operating in 2004
Item Corporate banking Personal banking Capital banking Other Total
Net interest income 754,857,886.69 41,237,111.74 151,315,545.72 --
947,410,544.15
Net fee and commission income 21,798,978.82 4,177,130.41 5,750,000.00 --
31,726,109.23
Net transaction revenues/expenses 24,788,262.27 -- -- --
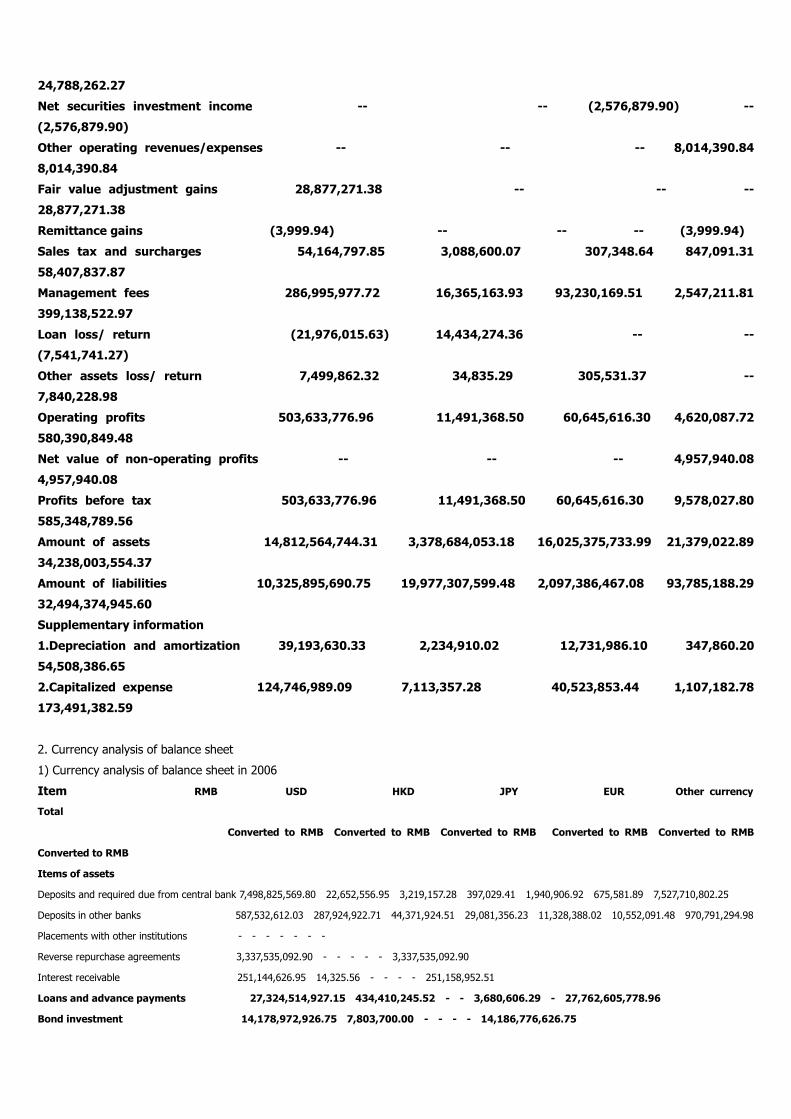
24,788,262.27
Net securities investment income -- -- (2,576,879.90) --
(2,576,879.90)
Other operating revenues/expenses -- -- -- 8,014,390.84
8,014,390.84
Fair value adjustment gains 28,877,271.38 -- -- --
28,877,271.38
Remittance gains (3,999.94) -- -- -- (3,999.94)
Sales tax and surcharges 54,164,797.85 3,088,600.07 307,348.64 847,091.31
58,407,837.87
Management fees 286,995,977.72 16,365,163.93 93,230,169.51 2,547,211.81
399,138,522.97
Loan loss/ return (21,976,015.63) 14,434,274.36 -- --
(7,541,741.27)
Other assets loss/ return 7,499,862.32 34,835.29 305,531.37 --
7,840,228.98
Operating profits 503,633,776.96 11,491,368.50 60,645,616.30 4,620,087.72
580,390,849.48
Net value of non-operating profits -- -- -- 4,957,940.08
4,957,940.08
Profits before tax 503,633,776.96 11,491,368.50 60,645,616.30 9,578,027.80
585,348,789.56
Amount of assets 14,812,564,744.31 3,378,684,053.18 16,025,375,733.99 21,379,022.89
34,238,003,554.37
Amount of liabilities 10,325,895,690.75 19,977,307,599.48 2,097,386,467.08 93,785,188.29
32,494,374,945.60
Supplementary information
1.Depreciation and amortization 39,193,630.33 2,234,910.02 12,731,986.10 347,860.20
54,508,386.65
2.Capitalized expense 124,746,989.09 7,113,357.28 40,523,853.44 1,107,182.78
173,491,382.59
2. Currency analysis of balance sheet
1) Currency analysis of balance sheet in 2006
Item RMB USD HKD JPY EUR Other currency
Total
Converted to RMB Converted to RMB Converted to RMB Converted to RMB Converted to RMB
Converted to RMB
Items of assets
Deposits and required due from central bank 7,498,825,569.80 22,652,556.95 3,219,157.28 397,029.41 1,940,906.92 675,581.89 7,527,710,802.25
Deposits in other banks 587,532,612.03 287,924,922.71 44,371,924.51 29,081,356.23 11,328,388.02 10,552,091.48 970,791,294.98
Placements with other institutions - - - - - - -
Reverse repurchase agreements 3,337,535,092.90 - - - - - 3,337,535,092.90
Interest receivable 251,144,626.95 14,325.56 - - - - 251,158,952.51
Loans and advance payments 27,324,514,927.15 434,410,245.52 - - 3,680,606.29 - 27,762,605,778.96
Bond investment 14,178,972,926.75 7,803,700.00 - - - - 14,186,776,626.75

Long-term capital investment 8,250,000.00 - - - - - 8,250,000.00
Real estate 163,738,463.00 - - - - - 163,738,463.00
Fixed assets 572,838,897.32 - - - - - 572,838,897.32
Intangible assets 10,981,401.72 - - - - - 10,981,401.72
Deferred income tax assets 41,356,159.46 - - - - - 10,981,401.72
Other assets 1,712,316,002.99 173,417.88 - - - - 1,712,489,420.87
Total assets 55,688,006,680.07 752,979,168.62 47,591,081.79 29,478,385.64 16,949,901.23 11,227,673.37
56,546,232,890.72
Items of liabilities
Due to central bank - - - - - - -
Due to banks 64,106,812.81 50,724,050.00 23,749,132.87 - - - 138,579,995.68
Placements from other institutions - - - - - - -
Selling repurchase financial assets 5,000,000,000.00 - - - - - 5,000,000,000.00
Deposits 45,726,073,576.04 416,429,376.72 12,319,761.45 25,488,268.73 9,415,925.77 1,669,488.74 46,191,396,397.45
Accrued payroll 129,088,648.17 - - - - - 129,088,648.17
Taxes payable 88,939,280.09 - - - - - 88,939,280.09
Interest payable 169,410,240.99 292,691.82 64,406.28 226.60 8,849.31 15,087.85 169,791,502.85
Deferred income tax liabilities 21,006,875.67 - - - - - 21,006,875.67
Other liabilities 1,494,759,794.31 84,715,473.76 11,546,670.15 3,959,897.90 7,155,211.42 9,109,445.47 1,611,246,493.01
Total liabilities 52,693,385,228.08 552,161,592.30 47,679,970.75 29,448,393.23 16,579,986.50 10,794,022.06
53,350,049,192.92
Position of assets and liabilities 2,994,621,451.99 200,817,576.32 (88,888.96) 29,992.41 369,914.73 433,651.31
3,196,183,697.80
2) Currency analysis of balance sheet in 2005
Item RMB USD HKD JPY EUR Other currency
Total
Converted to RMB Converted to RMB Converted to RMB Converted to RMB Converted to RMB
Converted to RMB
Items of assets
Deposits and required Due from central bank 4,489,419,380.17 14,111,326.32 2,403,267.34 214,614.22 1,192,567.96 405,277.34 4,507,746,433.35
Deposits in other banks 1,121,072,035.25 281,856,830.60 53,205,432.63 12,869,112.12 16,042,275.91 25,594,560.82 1,510,640,247.33
Placements with other institutions 7,000,000.00 - - - - - 7,000,000.00
Reverse repurchase agreements - - - - - - -
Interest receivable 174,430,651.86 78,337.28 - - - - 174,508,989.14
Loans and advance payments 19,013,772,926.02 269,689,395.22 175,099.94 - 1,269,569.91 - 19,284,906,991.09
Bond investment 15,447,708,684.91 8,070,200.00 - - - - 15,455,778,884.91
Long-term capital investment 8,250,000.00 - - - - - 8,250,000.00
Real estate 159,480,571.00 - - - - - 159,480,571.00
Fixed assets 529,483,432.48 - - - - - 529,483,432.48
Intangible assets 14,666,190.41 - - - - - 14,666,190.41
Deferred income tax assets 57,277,841.56 - - - - - 57,277,841.56
Other assets 719,446,478.16 161,704.00 - - - - 719,608,182.16
Total assets 41,742,008,191.82 573,967,793.42 55,783,799.91 13,083,726.34 18,504,413.78 25,999,838.16
42,429,347,763.43
Items of liabilities

Due to central bank - - - - - - -
Due to banks 38,829,472.65 - - - - - 38,829,472.65
Placements from other institutions - 12,105,300.00 24,667,284.55 - - - 36,772,584.55
Selling repurchase financial assets 1,600,000,000.00 - - - - - 1,600,000,000.00
Deposits 37,159,030,745.69 307,313,010.94 19,083,585.90 8,555,597.10 8,626,118.14 18,632,905.35 37,521,241,963.12
Accrued payroll 111,172,104.78 - - - - - 111,172,104.78
Taxes payable 150,249,079.02 - - - - - 150,249,079.02
Interest payable 109,370,846.80 169,200.30 34,453.64 65.73 4,329.12 6,413.59 109,585,309.18
Deferred income tax liabilities 17,073,346.99 - - - - - 17,073,346.99
Other liabilities 657,234,042.62 14,946.09 2,533.53 1.36 84.88 227.81 657,251,836.29
Total liabilities 39,842,959,638.55 319,602,457.33 43,787,857.62 8,555,664.19 8,630,532.14 18,639,546.75
40,242,175,696.58
Position of assets and liabilities 1,899,048,553.27 254,365,336.09 11,995,942.29 4,528,062.15 9,873,881.64 7,360,291.41
2,187,172,066.85
3) Currency analysis of balance sheet in 2004
Item RMB USD HKD JPY EUR Other currency
Total
Converted to RMB Converted to RMB Converted to RMB Converted to RMB Converted to RMB
Converted to RMB
Items of assets
Deposits and required Due from central bank 4,106,292,954.13 3,881,273.54 2,245,526.44 1,064,167.75 1,435,994.26 345,072.92 4,115,264,989.03
Deposits in other banks 401,207,044.07 434,336,859.51 29,064,759.27 8,099,590.45 18,981,123.03 11,192,585.05 902,881,961.38
Placements with other institutions 14,000,000.00 - - - - - 14,000,000.00
Reverse repurchase agreements - - - - - - -
Interest receivable 154,997,585.38 90,620.38 - - - - 155,088,205.76
Loans and advance payments 16,664,765,672.96 293,161,847.93 - - 3,140,559.24 - 16,961,068,080.31
Bond investment 10,627,204,490.02 8,276,500.00 - - - - 10,635,480,990.02
Long-term capital investment 8,250,000.00 - - - - - 8,250,000.00
Real estate 190,604,056.00 - - - - - 190,604,056.00
Fixed assets 502,727,271.08 - - - - - 502,727,271.08
Intangible assets 14,875,796.71 - - - - - 14,875,796.71
Deferred income tax assets 104,212,611.68 - - - - - 104,212,611.68
Other assets 633,384,060.58 165,532.00 - - - - 633,549,592.58
Total assets 33,422,521,542.61 739,912,633.36 31,310,285.71 9,163,758.20 23,557,676.53 11,537,657.96
34,238,003,554.37
Items of liabilities
Due to central bank - - - - - - -
Due to banks 50,286,318.71 - - - - - 50,286,318.71
Placements from other institutions - - - - - - -
Selling repurchase financial assets 2,028,500,000.00 - - - - - 2,028,500,000.00
Deposits 29,271,302,386.08 462,847,235.14 15,556,720.01,,949,442.11 3,893,563.61 506,068.13 29,755,055,415.08
Accrued payroll 35,113,889.56 - - - - - 35,113,889.56
Taxes payable 17,244,039.36 - - - - - 17,244,039.36
Interest payable 63,165,549.72 118,474.46 7,550.78 26.26 4,081.26 5,519.90 63,301,202.38
Deferred income tax liabilities 17,899,439.84 - - - - - 17,899,439.84

Other liabilities 526,969,874.23 3,368.54 1,287.14 1.69 48.43 60.64 526,974,640.67
Total liabilities 32,010,481,497.50 462,969,078.14 15,565,557.93 949,470.06 3,897,693.30 511,648.67
32,494,374,945.60
Position of assets and liabilities 1,412,040,045.11 276,943,555.22 15,744,727.78 8,214,288.14 19,659,983.23 11,026,009.29
1,743,628,608.77
3. Maturity analysis of balance sheet
1) Maturity analysis of balance sheet at the end of 2006.
Item Overdue On demand Up to 3 months 3 months to 1 year 1-5 years Above 5 years Total
Items of assets
Deposits and required
Due from central bank - 3,879,838,889.01 - - - 3,647,871,913.24 7,527,710,802.25
Deposits in other banks - 254,338,084.12 320,548,030.05 352,984,830.81 3,901,850.00 39,018,500.00 970,791,294.98
Placements with other institutions - - - - - - -
Reverse repurchase agreements - - 150,000,000.00 3,187,535,092.90 - - 3,337,535,092.90
Interest receivable - 11,657,820.27 4,804,439.45 58,166,539.96 149,078,821.32 27,451,331.51 251,158,952.51
Loans and advance payments 23,548,188.48 6,820,818.11 6,353,849,770.91 17,649,464,708.17 2,494,948,857.42 1,233,973,435.87
27,762,605,778.96
Bond investment - 470,910,000.00 644,781,151.26 3,201,374,101.95 7,769,834,239.44 2,099,877,134.10
14,186,776,626.75
Long-term capital investment - - - - - 8,250,000.00 8,250,000.00
Real estate - - - - - 163,738,463.00 163,738,463.00
Fixed assets - - - - - 572,838,897.32 572,838,897.32
Intangible assets - - - - - 10,981,401.72 10,981,401.72
Deferred income tax assets - - - - 41,356,159.46 - 41,356,159.46
Other assets 104,337,758.03 262,796,999.39 55,947,200.14 310,617,656.59 838,735,854.71 140,053,952.01 1,712,489,420.87
Total assets 127,885,946.51 4,886,362,610.90 7,529,930,591.81 24,760,142,930.38 11,297,855,782.35 7,944,055,028.77
56,546,232,890.72
Items of liabilities
Due to central bank - - - - - - -
Due to banks - 64,106,812.81 74,473,182.87 - - - 138,579,995.68
Placements from other institutions - - - - - - -
Selling repurchase financial assets - - 2,000,000,000.00 3,000,000,000.00 - - 5,000,000,000.00
Deposits - 27,540,281,934.55 5,672,821,608.24 9,179,206,169.10 3,757,010,502.80 42,076,182.76 46,191,396,397.45
Accrued payroll - 129,088,648.17 - - - - 129,088,648.17
Taxes payable - 88,939,280.09 - - - - 88,939,280.09
Interest payable - 100,120,352.67 23,455,695.55 32,983,018.13 13,142,881.14 89,555.36 169,791,502.85
Deferred income tax liabilities - - - - 21,006,875.67 - 21,006,875.67
Other liabilities 104,337,758.03 285,496,342.13 56,463,620.15 334,350,772.85 830,597,999.85 - 1,611,246,493.01
Total liabilities 104,337,758.03 28,208,033,370.42 7,827,214,106.81 12,546,539,960.08 4,621,758,259.46 42,165,738.12
53,350,049,192.92
Net value of liquidation 23,548,188.48 (23,321,670,759.52) (297,283,515.00) 12,213,602,970.30 6,676,097,522.89 7,901,889,290.65
3,196,183,697.80
2) Maturity analysis of balance sheet at the end of 2005.
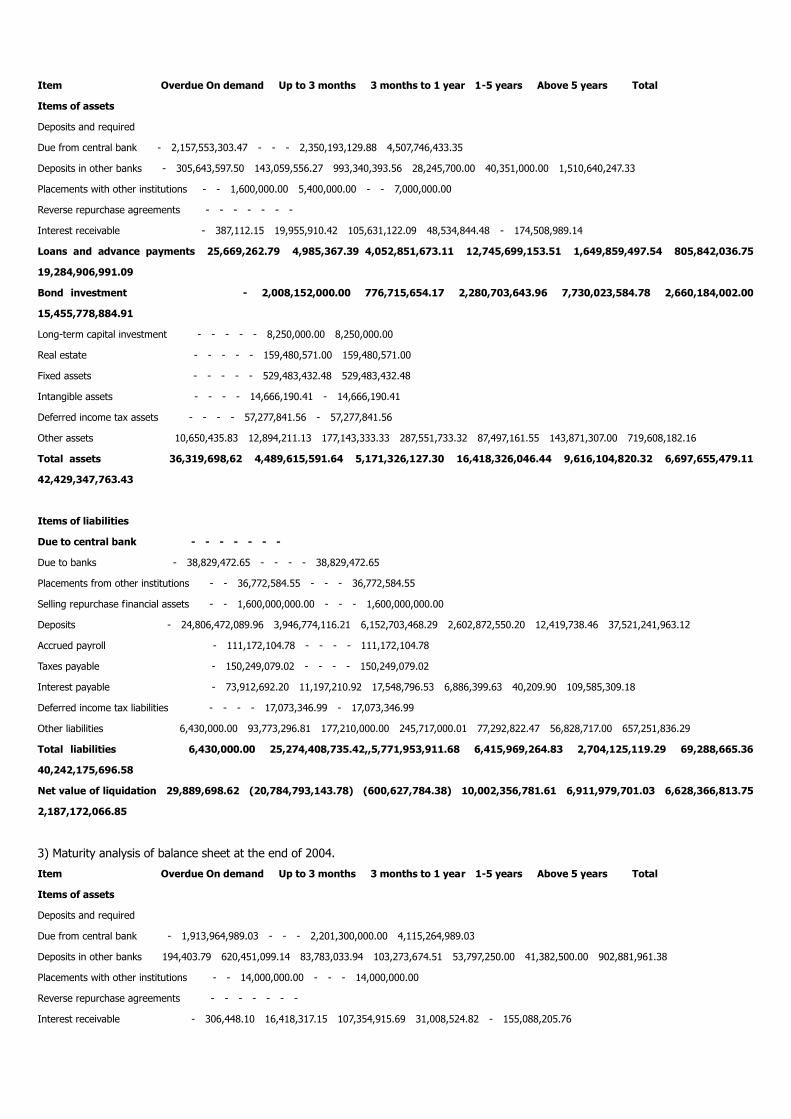
Item Overdue On demand Up to 3 months 3 months to 1 year 1-5 years Above 5 years Total
Items of assets
Deposits and required
Due from central bank - 2,157,553,303.47 - - - 2,350,193,129.88 4,507,746,433.35
Deposits in other banks - 305,643,597.50 143,059,556.27 993,340,393.56 28,245,700.00 40,351,000.00 1,510,640,247.33
Placements with other institutions - - 1,600,000.00 5,400,000.00 - - 7,000,000.00
Reverse repurchase agreements - - - - - - -
Interest receivable - 387,112.15 19,955,910.42 105,631,122.09 48,534,844.48 - 174,508,989.14
Loans and advance payments 25,669,262.79 4,985,367.39 4,052,851,673.11 12,745,699,153.51 1,649,859,497.54 805,842,036.75
19,284,906,991.09
Bond investment - 2,008,152,000.00 776,715,654.17 2,280,703,643.96 7,730,023,584.78 2,660,184,002.00
15,455,778,884.91
Long-term capital investment - - - - - 8,250,000.00 8,250,000.00
Real estate - - - - - 159,480,571.00 159,480,571.00
Fixed assets - - - - - 529,483,432.48 529,483,432.48
Intangible assets - - - - 14,666,190.41 - 14,666,190.41
Deferred income tax assets - - - - 57,277,841.56 - 57,277,841.56
Other assets 10,650,435.83 12,894,211.13 177,143,333.33 287,551,733.32 87,497,161.55 143,871,307.00 719,608,182.16
Total assets 36,319,698,62 4,489,615,591.64 5,171,326,127.30 16,418,326,046.44 9,616,104,820.32 6,697,655,479.11
42,429,347,763.43
Items of liabilities
Due to central bank - - - - - - -
Due to banks - 38,829,472.65 - - - - 38,829,472.65
Placements from other institutions - - 36,772,584.55 - - - 36,772,584.55
Selling repurchase financial assets - - 1,600,000,000.00 - - - 1,600,000,000.00
Deposits - 24,806,472,089.96 3,946,774,116.21 6,152,703,468.29 2,602,872,550.20 12,419,738.46 37,521,241,963.12
Accrued payroll - 111,172,104.78 - - - - 111,172,104.78
Taxes payable - 150,249,079.02 - - - - 150,249,079.02
Interest payable - 73,912,692.20 11,197,210.92 17,548,796.53 6,886,399.63 40,209.90 109,585,309.18
Deferred income tax liabilities - - - - 17,073,346.99 - 17,073,346.99
Other liabilities 6,430,000.00 93,773,296.81 177,210,000.00 245,717,000.01 77,292,822.47 56,828,717.00 657,251,836.29
Total liabilities 6,430,000.00 25,274,408,735.42,,5,771,953,911.68 6,415,969,264.83 2,704,125,119.29 69,288,665.36
40,242,175,696.58
Net value of liquidation 29,889,698.62 (20,784,793,143.78) (600,627,784.38) 10,002,356,781.61 6,911,979,701.03 6,628,366,813.75
2,187,172,066.85
3) Maturity analysis of balance sheet at the end of 2004.
Item Overdue On demand Up to 3 months 3 months to 1 year 1-5 years Above 5 years Total
Items of assets
Deposits and required
Due from central bank - 1,913,964,989.03 - - - 2,201,300,000.00 4,115,264,989.03
Deposits in other banks 194,403.79 620,451,099.14 83,783,033.94 103,273,674.51 53,797,250.00 41,382,500.00 902,881,961.38
Placements with other institutions - - 14,000,000.00 - - - 14,000,000.00
Reverse repurchase agreements - - - - - - -
Interest receivable - 306,448.10 16,418,317.15 107,354,915.69 31,008,524.82 - 155,088,205.76

Loans and advance payments 16,953,582.47 3,674,119.11 3,949,188,639.71 10,501,770,670.40 1,678,907,584.48 810,573,483.96
16,961,068,080.13
Bond investment - 1,360,148,000.00 14,997,600.00 339,479,998.62 5,595,113,700.12 3,325,741,691.28
10,635,480,990.02
Long-term capital investment - - - - - 8,250,000.00 8,250,000.00
Real estate - - - - - 190,604,056.00 190,604,056.00
Fixed assets - - - - - 502,727,271.08 502,727,271.08
Intangible assets - - - - 14,875,796.71 - 14,875,796.71
Deferred income tax assets - - - - 104,212,611.68 - 104,212,611.68
Other assets 24,650,000.00 15,833,634.37 30,440,000.00 371,124,526.20 59,929,249.30 131,572,182.41 633,549,592.58
Total assets 41,797,986.26 3,914,378,290.05 4,108,827,590.80 11,423,003,785.42 7,537,844,717.11 7,212,151,184.73
34,238,003,554.37
Items of liabilities
Due to central bank - - - - - - -
Due to banks - 50,286,318.71 - - - - 50,286,318.71
Placements from other institutions - - - - - - -
Selling repurchase financial assets - - 2,028,500,000.00 - - - 2,028,500,000.00
Deposits - 18,694,332,901.47 3,622,650,159.70 4,846,911,811.88 2,591,060,542.03 100,000.00 29,755,055,415.08
Accrued payroll - 35,113,889.56 - - - - 35,113,889.56
Taxes payable - 17,244,039.36 - - - - 17,244,039.36
Interest payable - 44,301,257.71 4,808,540.02 8,450 844.90 5,740,559.75 - 63,301,202.38
Deferred income tax liabilities - - - - 17,899,439.84 - 17,899,439.84
Other liabilities 24,650,000.00 83,769,669.71 30,440,000.00 334,560,000.00,,18,155,747.17 35,399,223.79 526,974,640.67
Total liabilities 24,650,000.00 18,925,048,076.52 5,686,398,699.72 5,189,922,656.78 2,632,856,288.79 35,499,223.79
32,494,374,945.60
Net value of liquidation 17,147,986.26 (15,010,669,786.47) (1,577,571,108.92) 6,233,081,128.64 4,904,988,428.32 7,176,651,960.94
1,743,628,608.77
4. Interest rate risk
1) Interest rate sensitivity analysis in 2006
Item Up to 1 month 1-3 months 3 months to 1 year 1-5 years Above 5 years overdue(no interest)
Total
Items of assets
Deposits and required
Due from central bank 7,456,114,889.01 - - - - 71,595,913.24 7,527,710,802.25
Deposits in other banks 327,261,758.20 247,624,355.97 352,984,830.81 3,901,850.00 39,018,500.00 - 970,791,294.98
Placements with other institutions -
Reverse repurchase agreements 150,000,000.00 - 3,187,535,092.90 - - - 3,337,535,092.90
Interest receivable - - - - - 251,158,952.51 251,158,952.51
Loans and advance payments 1,650,145,531.50 4,710,525,057.52 21,378,387,001.46 - - 23,548,188.48
27,762,605,778.96
Bond investment 670,636,317.93 445,054,833.33 3,201,374,101.95 7,769,834,239.44 2,099,877,134.10 -
14,186,776,626.75
Long-term capital investment - - - - - 8,250,000.00 8,250,000.00
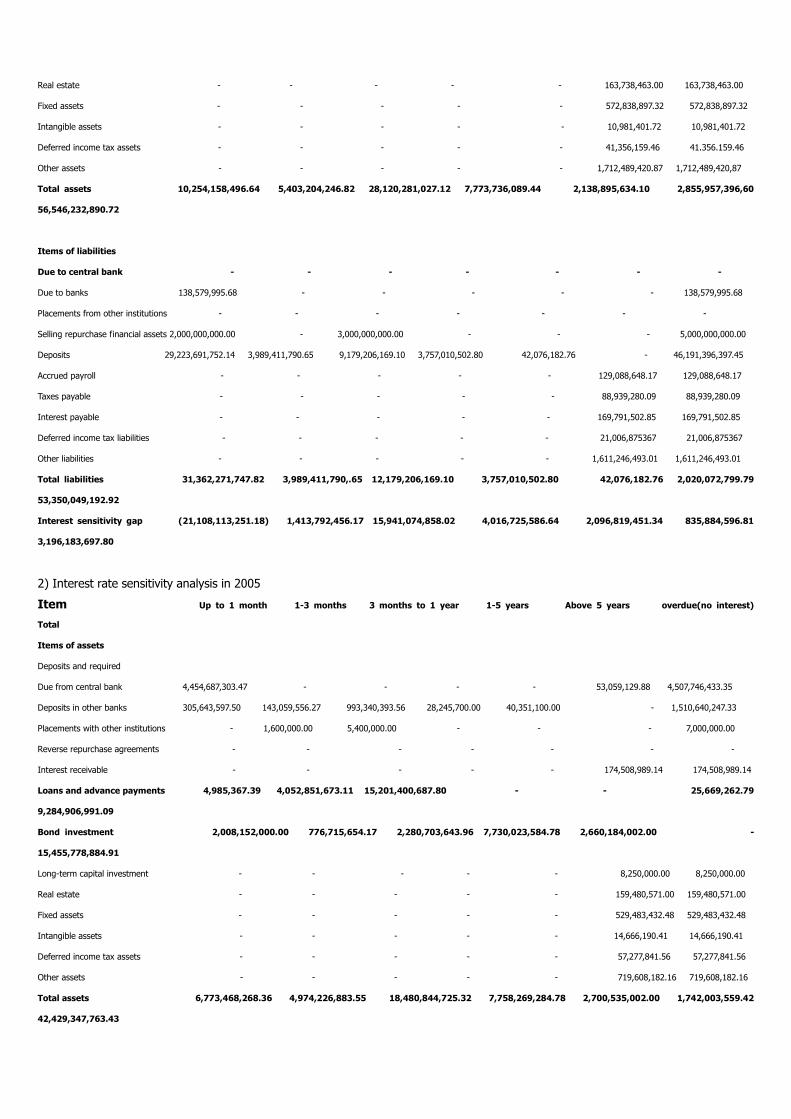
Real estate - - - - - 163,738,463.00 163,738,463.00
Fixed assets - - - - - 572,838,897.32 572,838,897.32
Intangible assets - - - - - 10,981,401.72 10,981,401.72
Deferred income tax assets - - - - - 41,356,159.46 41.356.159.46
Other assets - - - - - 1,712,489,420.87 1,712,489,420,87
Total assets 10,254,158,496.64 5,403,204,246.82 28,120,281,027.12 7,773,736,089.44 2,138,895,634.10 2,855,957,396,60
56,546,232,890.72
Items of liabilities
Due to central bank - - - - - - -
Due to banks 138,579,995.68 - - - - - 138,579,995.68
Placements from other institutions - - - - - - -
Selling repurchase financial assets 2,000,000,000.00 - 3,000,000,000.00 - - - 5,000,000,000.00
Deposits 29,223,691,752.14 3,989,411,790.65 9,179,206,169.10 3,757,010,502.80 42,076,182.76 - 46,191,396,397.45
Accrued payroll - - - - - 129,088,648.17 129,088,648.17
Taxes payable - - - - - 88,939,280.09 88,939,280.09
Interest payable - - - - - 169,791,502.85 169,791,502.85
Deferred income tax liabilities - - - - - 21,006,875367 21,006,875367
Other liabilities - - - - - 1,611,246,493.01 1,611,246,493.01
Total liabilities 31,362,271,747.82 3,989,411,790,.65 12,179,206,169.10 3,757,010,502.80 42,076,182.76 2,020,072,799.79
53,350,049,192.92
Interest sensitivity gap (21,108,113,251.18) 1,413,792,456.17 15,941,074,858.02 4,016,725,586.64 2,096,819,451.34 835,884,596.81
3,196,183,697.80
2) Interest rate sensitivity analysis in 2005
Item Up to 1 month 1-3 months 3 months to 1 year 1-5 years Above 5 years overdue(no interest)
Total
Items of assets
Deposits and required
Due from central bank 4,454,687,303.47 - - - - 53,059,129.88 4,507,746,433.35
Deposits in other banks 305,643,597.50 143,059,556.27 993,340,393.56 28,245,700.00 40,351,100.00 - 1,510,640,247.33
Placements with other institutions - 1,600,000.00 5,400,000.00 - - - 7,000,000.00
Reverse repurchase agreements - - - - - - -
Interest receivable - - - - - 174,508,989.14 174,508,989.14
Loans and advance payments 4,985,367.39 4,052,851,673.11 15,201,400,687.80 - - 25,669,262.79
9,284,906,991.09
Bond investment 2,008,152,000.00 776,715,654.17 2,280,703,643.96 7,730,023,584.78 2,660,184,002.00 -
15,455,778,884.91
Long-term capital investment - - - - - 8,250,000.00 8,250,000.00
Real estate - - - - - 159,480,571.00 159,480,571.00
Fixed assets - - - - - 529,483,432.48 529,483,432.48
Intangible assets - - - - - 14,666,190.41 14,666,190.41
Deferred income tax assets - - - - - 57,277,841.56 57,277,841.56
Other assets - - - - - 719,608,182.16 719,608,182.16
Total assets 6,773,468,268.36 4,974,226,883.55 18,480,844,725.32 7,758,269,284.78 2,700,535,002.00 1,742,003,559.42
42,429,347,763.43

Items of liabilities
Due to central bank - - - - - - _
Due to banks 38,829,472.65 - - - - - 38,829,472.65
Placements from other institutions 36,772,584.55 - - - - - 36,772,584.55
Selling repurchase financial assets - 1,600,000,000.00 - - - - 1,600,000,000.00
Deposits 24,806,472,089.96 3,946,774,116.21 6,152,703,468.29 2,602,872,550.20 12,419,738.46 - 37,521,241,963.12
Accrued payroll - - - - - 111,172,104.78 111,172,104.78
Taxes payable - - - - - 150,249,079.02 150,249,079.02
Interest payable - - - - - 109,585,309.18 109,585,309.18
Deferred income tax liabilities - - - - - 1 7,073,346.99 17,073,346.99
Other liabilities - - - - - 657,251,836.29 657,251,836.39
Total liabilities 24,882,074,147.16 5,546,774,116.21 6,152,703,468.29 2,602,872,550.20 12,419,738.46 1,045,331,676.26
40,242,175,696.58
Interest sensitivity gap (18,108,605,878.80) (572,547,232,.66) 12,328,141,257.03 5,155,396,734.58 2,688,115,263.54 696,671,923.16
2,187,172,066.85
3) Interest rate sensitivity analysis in 2004
Item Up to 1 month 1-3 months 3 months to 1 year 1-5 years Above 5 years overdue(no interest)
Total
Items of assets
Deposits and required
Due from central bank 4,060,688,989.03 - - - - 54,576,000.00 4,115,264,989.03
Deposits in other banks 620,451,099.14 83,783,033.94 103,273,674.51 53,797,250.00 41,382,500.00 194,403.79 902,881,96138
Placements with other institutions - 14,000,000.00 - - - - 14,000,000.00
Reverse repurchase agreements - - - - - - -
Interest receivable - - - - - 155,088,205.76 155,088,205.76
Loans and advance payments 3,674,119.11 3,949,188,639.71 12,991,251,738.84 - - 16,953,582.47 16,961,068,080.13
Bond investment 1,360,148,000.00 14,997,600.00 339,479,998.62 5,595,113,700.12 3,325,741,691.28 - 10,635,480,990.02
Long-term capital investment - - - - - 8,250,00.00 8,250,000.00
Real estate - - - - - 190,604,056.00 190,604,056.00
Fixed assets - - - - - 502,727,271.08 502,727,271.08
Intangible assets - - - - - 14,875,796.71 14,875,796.71
Deferred income tax assets - - - - - 104,212,611,68 104,212,611.68
Other assets - - - - - 633,549,592.58 633,549,592.58
Total assets 6,044,962,207.28 4,061,969,273.65 13,434,005,411.97 5,648,910,950.12 3,367,124,191.28 1,681,031,520.07
34,238,003,554.37
Items of liabilities
Due to central bank - - - - - - _
Due to banks 50,286,318.71 - - - - - 50,286,318.71
Placements from other institutions - - - - - - _
Selling repurchase financial assets - 2,028,500,000.00 - - - - 2,028,500,000.00
Deposits 18,694,33,901.47 3,622,650,159.70 4,846,911,811.88 2,591,060,542.03 100,000.00 - 29,755,055,415.08
Accrued payroll - - - - - 35,113,889.56 35,113,889.56
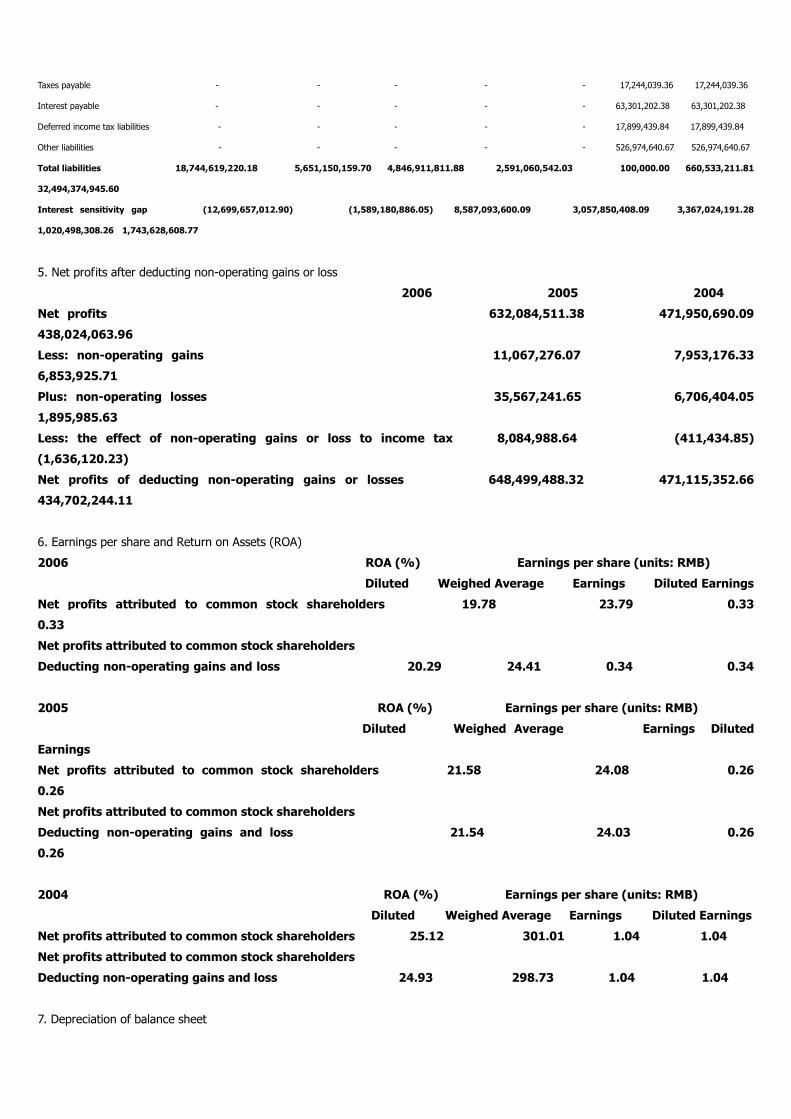
Taxes payable - - - - - 17,244,039.36 17,244,039.36
Interest payable - - - - - 63,301,202.38 63,301,202.38
Deferred income tax liabilities - - - - - 17,899,439.84 17,899,439.84
Other liabilities - - - - - 526,974,640.67 526,974,640.67
Total liabilities 18,744,619,220.18 5,651,150,159.70 4,846,911,811.88 2,591,060,542.03 100,000.00 660,533,211.81
32,494,374,945.60
Interest sensitivity gap (12,699,657,012.90) (1,589,180,886.05) 8,587,093,600.09 3,057,850,408.09 3,367,024,191.28
1,020,498,308.26 1,743,628,608.77
5. Net profits after deducting non-operating gains or loss
2006 2005 2004
Net profits 632,084,511.38 471,950,690.09
438,024,063.96
Less: non-operating gains 11,067,276.07 7,953,176.33
6,853,925.71
Plus: non-operating losses 35,567,241.65 6,706,404.05
1,895,985.63
Less: the effect of non-operating gains or loss to income tax 8,084,988.64 (411,434.85)
(1,636,120.23)
Net profits of deducting non-operating gains or losses 648,499,488.32 471,115,352.66
434,702,244.11
6. Earnings per share and Return on Assets (ROA)
2006 ROA (%) Earnings per share (units: RMB)
Diluted Weighed Average Earnings Diluted Earnings
Net profits attributed to common stock shareholders 19.78 23.79 0.33
0.33
Net profits attributed to common stock shareholders
Deducting non-operating gains and loss 20.29 24.41 0.34 0.34
2005 ROA (%) Earnings per share (units: RMB)
Diluted Weighed Average Earnings Diluted
Earnings
Net profits attributed to common stock shareholders 21.58 24.08 0.26
0.26
Net profits attributed to common stock shareholders
Deducting non-operating gains and loss 21.54 24.03 0.26
0.26
2004 ROA (%) Earnings per share (units: RMB)
Diluted Weighed Average Earnings Diluted Earnings
Net profits attributed to common stock shareholders 25.12 301.01 1.04 1.04
Net profits attributed to common stock shareholders
Deducting non-operating gains and loss 24.93 298.73 1.04 1.04
7. Depreciation of balance sheet
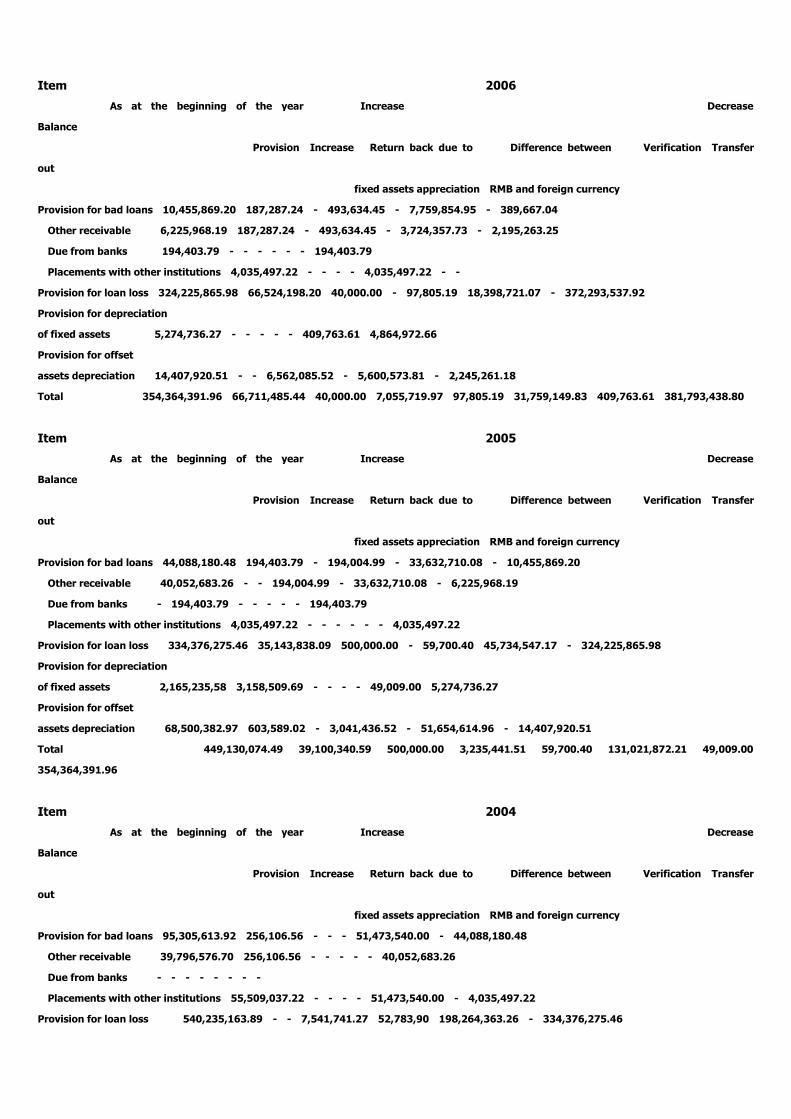
Item 2006
As at the beginning of the year Increase Decrease
Balance
Provision Increase Return back due to Difference between Verification Transfer
out
fixed assets appreciation RMB and foreign currency
Provision for bad loans 10,455,869.20 187,287.24 - 493,634.45 - 7,759,854.95 - 389,667.04
Other receivable 6,225,968.19 187,287.24 - 493,634.45 - 3,724,357.73 - 2,195,263.25
Due from banks 194,403.79 - - - - - - 194,403.79
Placements with other institutions 4,035,497.22 - - - - 4,035,497.22 - -
Provision for loan loss 324,225,865.98 66,524,198.20 40,000.00 - 97,805.19 18,398,721.07 - 372,293,537.92
Provision for depreciation
of fixed assets 5,274,736.27 - - - - - 409,763.61 4,864,972.66
Provision for offset
assets depreciation 14,407,920.51 - - 6,562,085.52 - 5,600,573.81 - 2,245,261.18
Total 354,364,391.96 66,711,485.44 40,000.00 7,055,719.97 97,805.19 31,759,149.83 409,763.61 381,793,438.80
Item 2005
As at the beginning of the year Increase Decrease
Balance
Provision Increase Return back due to Difference between Verification Transfer
out
fixed assets appreciation RMB and foreign currency
Provision for bad loans 44,088,180.48 194,403.79 - 194,004.99 - 33,632,710.08 - 10,455,869.20
Other receivable 40,052,683.26 - - 194,004.99 - 33,632,710.08 - 6,225,968.19
Due from banks - 194,403.79 - - - - - 194,403.79
Placements with other institutions 4,035,497.22 - - - - - - 4,035,497.22
Provision for loan loss 334,376,275.46 35,143,838.09 500,000.00 - 59,700.40 45,734,547.17 - 324,225,865.98
Provision for depreciation
of fixed assets 2,165,235,58 3,158,509.69 - - - - 49,009.00 5,274,736.27
Provision for offset
assets depreciation 68,500,382.97 603,589.02 - 3,041,436.52 - 51,654,614.96 - 14,407,920.51
Total 449,130,074.49 39,100,340.59 500,000.00 3,235,441.51 59,700.40 131,021,872.21 49,009.00
354,364,391.96
Item 2004
As at the beginning of the year Increase Decrease
Balance
Provision Increase Return back due to Difference between Verification Transfer
out
fixed assets appreciation RMB and foreign currency
Provision for bad loans 95,305,613.92 256,106.56 - - - 51,473,540.00 - 44,088,180.48
Other receivable 39,796,576.70 256,106.56 - - - - - 40,052,683.26
Due from banks - - - - - - - -
Placements with other institutions 55,509,037.22 - - - - 51,473,540.00 - 4,035,497.22
Provision for loan loss 540,235,163.89 - - 7,541,741.27 52,783,90 198,264,363.26 - 334,376,275.46
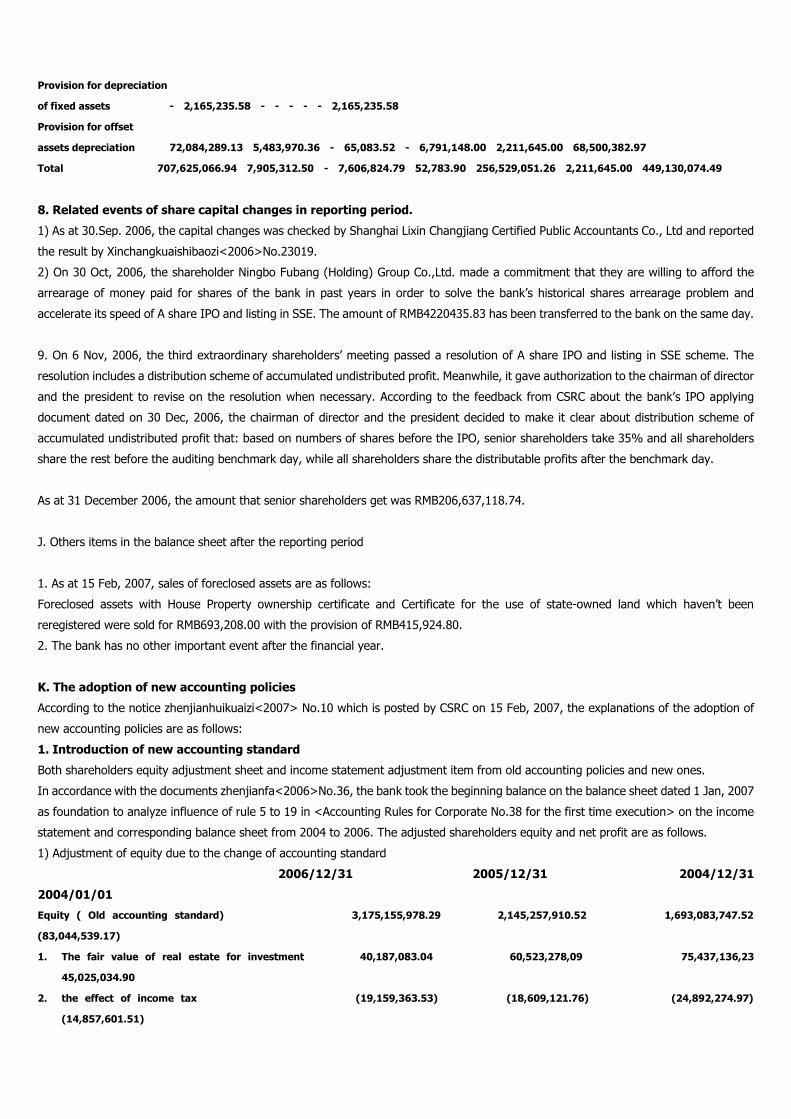
Provision for depreciation
of fixed assets - 2,165,235.58 - - - - - 2,165,235.58
Provision for offset
assets depreciation 72,084,289.13 5,483,970.36 - 65,083.52 - 6,791,148.00 2,211,645.00 68,500,382.97
Total 707,625,066.94 7,905,312.50 - 7,606,824.79 52,783.90 256,529,051.26 2,211,645.00 449,130,074.49
8. Related events of share capital changes in reporting period.
1) As at 30.Sep. 2006, the capital changes was checked by Shanghai Lixin Changjiang Certified Public Accountants Co., Ltd and reported
the result by Xinchangkuaishibaozi<2006>No.23019.
2) On 30 Oct, 2006, the shareholder Ningbo Fubang (Holding) Group Co.,Ltd. made a commitment that they are willing to afford the
arrearage of money paid for shares of the bank in past years in order to solve the bank’s historical shares arrearage problem and
accelerate its speed of A share IPO and listing in SSE. The amount of RMB4220435.83 has been transferred to the bank on the same day.
9. On 6 Nov, 2006, the third extraordinary shareholders’meeting passed a resolution of A share IPO and listing in SSE scheme. The
resolution includes a distribution scheme of accumulated undistributed profit. Meanwhile, it gave authorization to the chairman of director
and the president to revise on the resolution when necessary. According to the feedback from CSRC about the bank’s IPO applying
document dated on 30 Dec, 2006, the chairman of director and the president decided to make it clear about distribution scheme of
accumulated undistributed profit that: based on numbers of shares before the IPO, senior shareholders take 35% and all shareholders
share the rest before the auditing benchmark day, while all shareholders share the distributable profits after the benchmark day.
As at 31 December 2006, the amount that senior shareholders get was RMB206,637,118.74.
J. Others items in the balance sheet after the reporting period
1. As at 15 Feb, 2007, sales of foreclosed assets are as follows:
Foreclosed assets with House Property ownership certificate and Certificate for the use of state-owned land which haven’t been
reregistered were sold for RMB693,208.00 with the provision of RMB415,924.80.
2. The bank has no other important event after the financial year.
K. The adoption of new accounting policies
According to the notice zhenjianhuikuaizi<2007> No.10 which is posted by CSRC on 15 Feb, 2007, the explanations of the adoption of
new accounting policies are as follows:
1. Introduction of new accounting standard
Both shareholders equity adjustment sheet and income statement adjustment item from old accounting policies and new ones.
In accordance with the documents zhenjianfa<2006>No.36, the bank took the beginning balance on the balance sheet dated 1 Jan, 2007
as foundation to analyze influence of rule 5 to 19 in <Accounting Rules for Corporate No.38 for the first time execution> on the income
statement and corresponding balance sheet from 2004 to 2006. The adjusted shareholders equity and net profit are as follows.
1) Adjustment of equity due to the change of accounting standard
2006/12/31 2005/12/31 2004/12/31
2004/01/01
Equity ( Old accounting standard) 3,175,155,978.29 2,145,257,910.52 1,693,083,747.52
(83,044,539.17)
1. The fair value of real estate for investment 40,187,083.04 60,523,278,09 75,437,136,23
45,025,034.90
2. the effect of income tax (19,159,363.53) (18,609,121.76) (24,892,274.97)
(14,857,601.51)

Equity ( New accounting standard) 3,196,183,697.80 2,187,172,066.85 1,743,628,608.77
52,877,105.78
2) Adjustment of income statement due to the change of accounting standard
Item 2006 2005 2004
Before adjustment After adjustment Before adjustment After adjustment Before adjustment After
adjustment
Exchange gains or loss - (5,330,0007.07) - (4,126,000.08) -
(3,999.94)
Fair value adjustment gains (*) - - - - -
28,877,271.38
Operating expense (*) 603,376,935.33 601,779,025.30 467,457,135.93 466,057,234.62 400,673,352.91
399,138,522..97
Loss of assets depreciation (*) 42,614,117.96 59,655,765.47 30,266,892.93 35,864,899.08 298,487.71
298,487.71
Income of non-operating activities (*) 33,423,282.56 11,067,276.07 15,115,437.65 7,953,176.33 6,853,925.71
6,853,925.71
Expenses of non-operating activities (*) 35,567,241.65 35,567,241.65 3,152,912.08 6,706,404.05 1,895,985.63
1,895,985.63
Income tax 181,561,178.01 182,111,419.78 188,959,871.00 182,676,717.79 137,290,052.14
147,324,725.60
Net profits 675,764,497.19 632,084,511.38 484,707,395.09 471,950,690.09 417,650,636.04
438,024,063.96
* The adjusted items are corresponded to real estate for investment based on the fair value.
2. Adjustment of net profits statement in new accounting standard
The bank is supposed to execute the new accounting policies from 1 Jan, 2004 and take the balance sheet on this day as
the starting point to prepare the experimental income statement from 2004 to 2006. Data on the experimental income
statement is the same as that on real income statement. The comprehensive simulation of three years income difference
adjustment is as follows.
2006 2005 2004
Net profits (old accounting standard0 675,764,497.19 484,707,395.09
417,650,636.04
The effect of adjustment -43,679,985.81 -12,756,705.00
20,373,427.92
Exchange gains and loss (5,330,000.07) (4,126,000,.08)
(3,999.94)
Fair value adjustment gains (*) - -
28,877,271.38
Operating expense (*) 1,597,910.03 1,399,901.31
1,534,829.94
Loss of assets depreciation (*) (17,041,647.51) (5,598,006.15)
-
Income of non-operating activities (*) (22,356,006.49) (7,162,261.32)
-

Expenses of non-operating activities (*) - (3,553,491.97)
-
Income tax (550,241.77) 6,283,153.21
(10,034,673.46)
Net profits 632,084,511.38 471,950,690.09
438,024,063.96
Supplementary information suppose new accounting standard execution
Other effects - - -
Mock profits 632,084,511.38 471,950,690.09
438,024,063.96
* The adjusted items are correspond to real estate for investment based on the fair value.
L. Supplementary information
Explanation of adjustment statement of net profits and net assets according to Chinese Accounting Standard and
International Financial Reporting Standard
1. Adjustment statement of net profits (units: In RMB thousand
yuan)
2006 2005 2004
Chinese accounting standard 632,825 471,951
438,024
Revalue of houses and building (6,843) (84)
_
Provision for houses and
building depreciation (10,306) (11,575)
(10,035)
Adjustment of deferred income tax 4,948 3,665
1,774
Other 780 (145) 2,555
International Financial Reporting Standard 620,664 463,812
432,318
2. Adjustment of net assets
2006/12/31 2005/12/31 2004/12/31
Chinese accounting standard 3,196,184 2,187,173
1,743,629
Revalue of houses and building 194,418 218,724
218,808
Provision for houses and
Building depreciation (31,916) (21,610)
(10,035)
Adjustment of deferred income tax 10,671 5,723
2,058
Other 635 (145) __

International Financial Reporting Standard 3,369,992 2,389,865
1,954,460
Note: When preparing reports under the International Financial Report Rules, buildings and investment assets are assessed under
revaluation method and fair value method. These could influence the net assets and the profits together with the difference of
depreciation and deferred tax.
The above “The adjustments sheet of net profit after tax and net assets in the year end are under the International Financial report rules
and Chinese accounting rules” is referred from the auditing report of Ernst and Young.
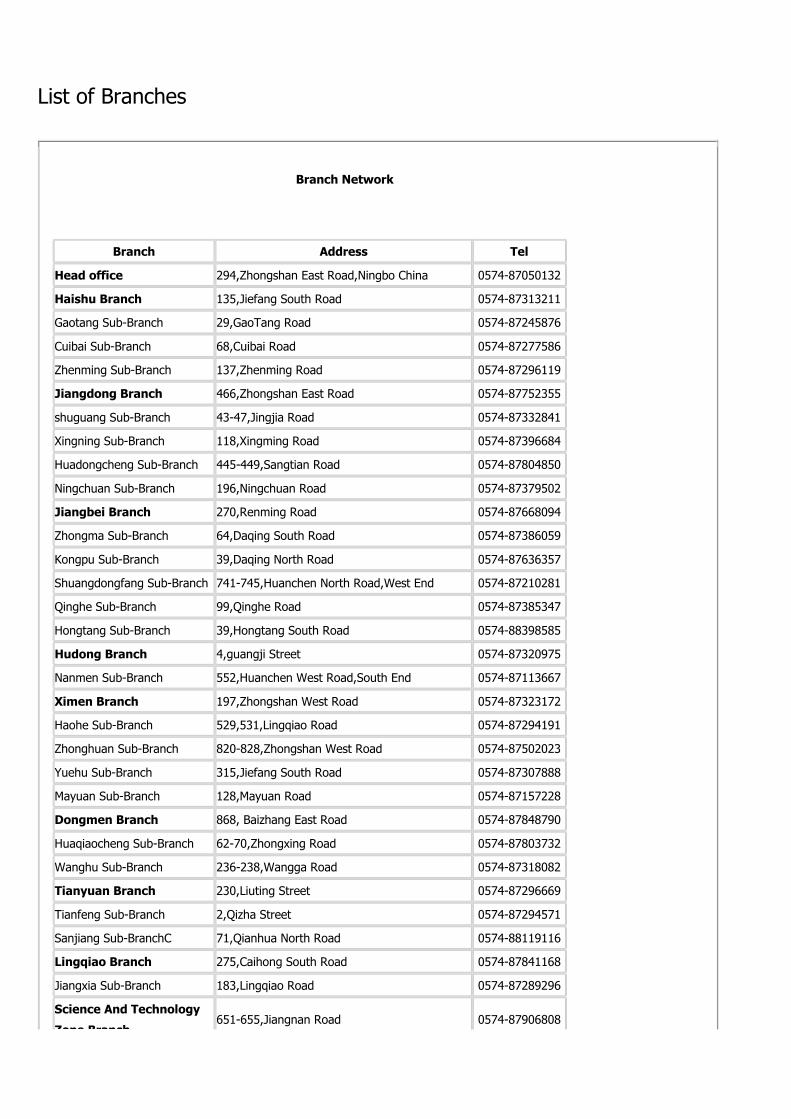
List of Branches
Branch Network
Branch Address Tel
Head office 294,Zhongshan East Road,Ningbo China 0574-87050132
Haishu Branch 135,Jiefang South Road 0574-87313211
Gaotang Sub-Branch 29,GaoTang Road 0574-87245876
Cuibai Sub-Branch 68,Cuibai Road 0574-87277586
Zhenming Sub-Branch 137,Zhenming Road 0574-87296119
Jiangdong Branch 466,Zhongshan East Road 0574-87752355
shuguang Sub-Branch 43-47,Jingjia Road 0574-87332841
Xingning Sub-Branch 118,Xingming Road 0574-87396684
Huadongcheng Sub-Branch 445-449,Sangtian Road 0574-87804850
Ningchuan Sub-Branch 196,Ningchuan Road 0574-87379502
Jiangbei Branch 270,Renming Road 0574-87668094
Zhongma Sub-Branch 64,Daqing South Road 0574-87386059
Kongpu Sub-Branch 39,Daqing North Road 0574-87636357
Shuangdongfang Sub-Branch 741-745,Huanchen North Road,West End 0574-87210281
Qinghe Sub-Branch 99,Qinghe Road 0574-87385347
Hongtang Sub-Branch 39,Hongtang South Road 0574-88398585
Hudong Branch 4,guangji Street 0574-87320975
Nanmen Sub-Branch 552,Huanchen West Road,South End 0574-87113667
Ximen Branch 197,Zhongshan West Road 0574-87323172
Haohe Sub-Branch 529,531,Lingqiao Road 0574-87294191
Zhonghuan Sub-Branch 820-828,Zhongshan West Road 0574-87502023
Yuehu Sub-Branch 315,Jiefang South Road 0574-87307888
Mayuan Sub-Branch 128,Mayuan Road 0574-87157228
Dongmen Branch 868, Baizhang East Road 0574-87848790
Huaqiaocheng Sub-Branch 62-70,Zhongxing Road 0574-87803732
Wanghu Sub-Branch 236-238,Wangga Road 0574-87318082
Tianyuan Branch 230,Liuting Street 0574-87296669
Tianfeng Sub-Branch 2,Qizha Street 0574-87294571
Sanjiang Sub-BranchC 71,Qianhua North Road 0574-88119116
Lingqiao Branch 275,Caihong South Road 0574-87841168
Jiangxia Sub-Branch 183,Lingqiao Road 0574-87289296
Science And Technology
Zone Branch651-655,Jiangnan Road 0574-87906808
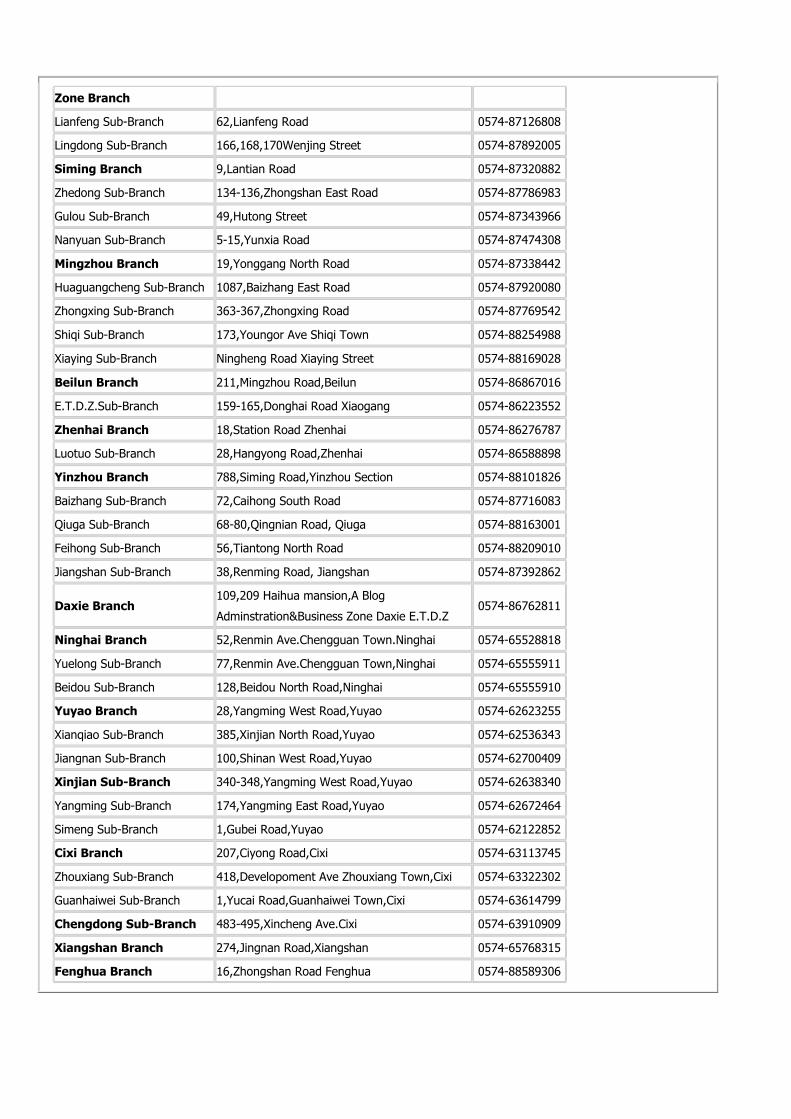
Zone Branch
Lianfeng Sub-Branch 62,Lianfeng Road 0574-87126808
Lingdong Sub-Branch 166,168,170Wenjing Street 0574-87892005
Siming Branch 9,Lantian Road 0574-87320882
Zhedong Sub-Branch 134-136,Zhongshan East Road 0574-87786983
Gulou Sub-Branch 49,Hutong Street 0574-87343966
Nanyuan Sub-Branch 5-15,Yunxia Road 0574-87474308
Mingzhou Branch 19,Yonggang North Road 0574-87338442
Huaguangcheng Sub-Branch 1087,Baizhang East Road 0574-87920080
Zhongxing Sub-Branch 363-367,Zhongxing Road 0574-87769542
Shiqi Sub-Branch 173,Youngor Ave Shiqi Town 0574-88254988
Xiaying Sub-Branch Ningheng Road Xiaying Street 0574-88169028
Beilun Branch 211,Mingzhou Road,Beilun 0574-86867016
E.T.D.Z.Sub-Branch 159-165,Donghai Road Xiaogang 0574-86223552
Zhenhai Branch 18,Station Road Zhenhai 0574-86276787
Luotuo Sub-Branch 28,Hangyong Road,Zhenhai 0574-86588898
Yinzhou Branch 788,Siming Road,Yinzhou Section 0574-88101826
Baizhang Sub-Branch 72,Caihong South Road 0574-87716083
Qiuga Sub-Branch 68-80,Qingnian Road, Qiuga 0574-88163001
Feihong Sub-Branch 56,Tiantong North Road 0574-88209010
Jiangshan Sub-Branch 38,Renming Road, Jiangshan 0574-87392862
Daxie Branch109,209 Haihua mansion,A Blog
Adminstration&Business Zone Daxie E.T.D.Z0574-86762811
Ninghai Branch 52,Renmin Ave.Chengguan Town.Ninghai 0574-65528818
Yuelong Sub-Branch 77,Renmin Ave.Chengguan Town,Ninghai 0574-65555911
Beidou Sub-Branch 128,Beidou North Road,Ninghai 0574-65555910
Yuyao Branch 28,Yangming West Road,Yuyao 0574-62623255
Xianqiao Sub-Branch 385,Xinjian North Road,Yuyao 0574-62536343
Jiangnan Sub-Branch 100,Shinan West Road,Yuyao 0574-62700409
Xinjian Sub-Branch 340-348,Yangming West Road,Yuyao 0574-62638340
Yangming Sub-Branch 174,Yangming East Road,Yuyao 0574-62672464
Simeng Sub-Branch 1,Gubei Road,Yuyao 0574-62122852
Cixi Branch 207,Ciyong Road,Cixi 0574-63113745
Zhouxiang Sub-Branch 418,Developoment Ave Zhouxiang Town,Cixi 0574-63322302
Guanhaiwei Sub-Branch 1,Yucai Road,Guanhaiwei Town,Cixi 0574-63614799
Chengdong Sub-Branch 483-495,Xincheng Ave.Cixi 0574-63910909
Xiangshan Branch 274,Jingnan Road,Xiangshan 0574-65768315
Fenghua Branch 16,Zhongshan Road Fenghua 0574-88589306