Embed Size (px)
Citation preview

\,.' !| i r: l\.rr:.i r :'l l' .
,'t ìl i r. ¡ :.
2 q. 1.9l.riiì( ",iiY
AGROBACTERII.JM: PLASMIDS AND BIOVARS
Kathleen Margaret Ophel
B.Sc.(Ag¡.) Univ. of British Columbia
Departnent of Plant PathologY
Waite Agricultural Research Institute
University of Adelaide
South Australia
Thesis submitted to The University of Adelaide
in fulfrlment of the requirements for the
degree of Doctor of Philosophy.
December 1987
by
u)N *. o, ðoA \\\ ¡n'
"_¿1c1'?-¡?, '
dedicated to my father,Ivan OPhel

TABLE OF CONTENTS
SI.]MMARY
STATEMENT
ACKNOWLEDGEMENTS
ABBREVIATIONS
LIST OF TABLES
LIST OF FIGURES
GENERAL INTRODUCTION
PART A: ECOLOGY OF AGROBACTERIUM BIOVARS 2
AND 3 ON STONEFRUIT AND GRAPEVINE
IntroductionMaterials andMethodsResults:
A. I Sampling techniques
4.2 Colonization of almonds and vines by
biovars 2 and3,A..3 Construction of transconjugant strains
4.4 Colonization of almonds and vines by
constructed strains
,A'.5 Colonization of nopaline galls
Discussion
PART B: TAXONOMY OF AGROBACTERIUM ISOLATES
FROM RUBUS AND GRAPEVINE
IntroductionMaterials and Methods
PAGE
t315
29
34
36
1
111
iv
V
vii
ix
1
22
23
26
48
50

Resuls:8.1 Characteristics of isolates from Rubus
and grapevine
B.2 Relatedness among Agrobacterium strains
Discussion
63
68
7l
PART C: OTÉIER OPINE-UTILIZING BACTERTA
IntroductionPseudomonas
Materials and Methods
Results:
L. Occurrence and abundance
2. Opine utilization
3. Biochemical tests
4.Inhibitory activityDiscussion
Fermentative isolates
Materials and Methods
Results
1. Biochemical characteristics
2. Growth rates
3. Pathogenicity
4. Microscopy5. DNA melting points
6. Plasmids
Discussion
GENERAL DISCUSSION
APPENDICES:A. CULTURE MEDIAB. BUFFERS AND SOLUTIONS
C. DATA PRESENTED IN PART A
77
18
82
82
83
83
86
88
90
90
90
9l9l9T
93
95
103
110
tt2
BIBLIOGRAPHY 113

I
AGROBACTERIUM: PLASMIDS AND BIOVARS
Two chromosomal forms of Agrobacterium, biova¡s 2 and 3, are found in
association with specific host plants. Biovar 2 is found in nature associated with
crown gall disease on almonds and biovar 3 is found almost exclusively with the
disease on grapevine. The nature of these associations was examined. Root
colonization studies performed over a l2-month period showed a specific rhizosphere
effect between biovar 2 and.almonds. Biovar 2 colonizeÀalmonds at levels of 106 to
lO7 cfutcr& root, significantly higher than biovar 3 on almonds and than biovar 2 on
vines. Biovar 3 survived poorly in the rhizosphere of both almonds and grapevine,
dropping to levels of 104 cfulcm2 root in the first few months. However, biovar 3
but not biovar 2 was isolated from the vascular system of grapevine.
Other workers have shown in vitro that the tumour-inducing (Ii)-plasmids of
Agrobacterium carry genes coding for host specificity (Loper & Kado, 1979;
Thomasho'w eta!., 1980; Knauf et al., 1982). To test the effect of Ti-plasmid makeup
on host plant colonization, reciprocal plasmid transfers were made between biovars 2
and 3. A Ti-plasmidless strain of biovar 3 was obtained by elimination of its resident
plasmid using a cloned fragment of the Agrobacterium plasmid incompatibility region.
Ti-plasmid transfer was achieved by mobilization with the wide host range plasmid
RP4. The transconjugants were then compared with wild-type strains in terms of their
ability to colonize almonds and grapevine. In all cases, the level of colonization
achieved was determined by the chromosomal background. However, specificity was
also observed between Ti-plasmids and biovars in vivo. The biovar 3 Ti-plasmid was
highly unstable in the biovar 2 background and some plasmid loss was observed in
biovar 3 strains carrying a biovar 2 Ti-plasmid. This instability was not observed in
vitro.

ll
The 'opine concept' proposes that the ability of the Ti-plasmid to catabolize
the gall-specifrc opines creates a selective advantage for Ti-plasmid carrying bacteria
(Petit et al., 1978a; Tempé eta!., 1979; Guyon g1ggl,, 1980). In vivo gall colonization
was studied using octopine and nopaline strains of biovar 3. The nopaline strain
achieved signifrcantly higher populations than did the octopine strain on nopaline
galls. This provides preliminary evidence in support of the opine concept.
Confusion exists over the taxonomic position of Agrobacterium strains from
Rubus and grapevine. Recent isolates of both groups were compared with existing A.
rubi type strains and isolates of the well-characterized biova¡s I andZ. Comparisons
were made primarily by single-tinkage cluster analysis of data obtained from standard
bacteriological tests and by DNA reassociation studies. Both approaches showed that
the Rubus strains all belong to the existing species, ¡\.ruþi, and that the grapevine
strains form a separate and new species. Changes to the nomenclatu¡e are proposed.
Two genera of Gram-negative bacteria capable of catabolizing opines were
studied. One group contained fermentative isolates found in Rubus galls. The second
group consisted of fluorescent Pseudomonas spp. which were isolated from
grapevine. The latter isolates are able to colonize the vascula¡ system of grapevine and
they produce a diffusible, non-siderophore molecule inhibitory to Aerobacterium
biovar 3 in vitro. These characteristics give the Pseudomonas isolates potential as
biological control agents for crown gall on grapevine.

iii
STATEMENT
This thesis contains no material which has been accepted
for the awa¡d of any other degree or diploma in any
university and to the best of my knowledge contains no
material previously published or written by another person,
except where due reference is made in the text. The author
consents to the thesis being made available for photocopying
and loan if applicable if accepted for the award of the degree.
Kathy Ophel

1V
ACKNOWLEDGEMENTS
I would like to thank my supervisor, Allen Kerr, for his guidance and
encogragement throughout this work. I would also like to acknowledge David Jones,
Maarten Ryder, Tom Burr and J.S. Shim for helpful discussions and suggestions on
various aspects of this study and Steve Farrand for generously allowing me to work
in his lab in Chicago and for his invaluable suggestions on the plasmid transfers.
Thanks are also due to a number of people for advice on specific procedures:
Max Tate and his lab for help with high-voltage paper electrophoresis and for
suppyling me with opines, John Randles and Nigel Scott for advice on the DNA
reassociation studies, Stuart Mclure for scanning electron microscopy, Trevor Cock
and Richard Miles for transmission elecüon microscopy, Margie Monis for statistical
advice and Brian Palk for assistance with photogaphy.
I would also like to thank my friends, in particular Tracey \Moodhead, David
Dall and Karen Gibb for moral support, and Mike Keller for advice, enthusiasm and
friendship. Finally,I wish to thank my family, especially my mother, for unfailing
encouragement right from the start

V
ABBREVIATIONS
ANOVA
AS
ATCC
bp
cfu
cv
df
dMGlu
DNA
F
GC
kb
M
MS
IvIW
LambdaHind Itr
HVPE
analysis of variance
acetosyringone
American Type Culture Collection
base pairs
colony forming units
cultivar
degrees of freedom
deoxymannityl glutamato
deoxyribonucleic acid
statistical test of equality of variance
guanine plus cytosine
lambdaDNA cut with therestriction enzyme from Haemophilusinfluenzae Rd
high voltage paper electrophoresis
region of A grobacterium Ti-plasmidcoding for plasmid incompatibility
kilobase
molar
mean square
molecular weight
National Collection of PlantPathogenic Bacteria
optical density
probability
pounds per square inch
Inc
NCPPB
OD
P
ps1
Ri-plasmid
RNA
RNase
SDS
SDV/
SEM
SS
SSC
sym
T-DNA
TE
TEM
Ti-plasmid
vt
root-inducing plasmid
ribonucleic acid
ribonuclease
sodium dodecyl sulphate
sterile distilled water
scanning electron microscoPe
sum of squares
saline sodium citrate
symbiotic
transferred-DNA
Tris-EDTA buffer
transmission electron microscoPe
tumour-inducin g plasmid
Tm
UV
vir
midpoint of the thermaldenaturation profile
ultraviolet
virulence

LIST OF TABLES
PART A
1A Strains and their origin2A Antibiotic concentrations in media
3A Pot experiments described in this study
4A Comparison of root surface area and root weight
5A Gall weights: Almond Ex. L
6A Virulence of biovar 2 strains carrying biovar 3 Ti-plasmidson tomato
7A Pathogenicity of biovar 2/blovar 3 transconjugants ongrapevine and almond
Tarrate utilization of biovar 3 strains
Root populations: Almond Ex. 4
Stem and Lateral root populations: Almond Ex. 4
Root populations: Vine Ex. 2
Gall weights: Almond Ex. 3
8A9A104114t2A
vll
Following page:
15
t6t723
24
28
28
29
30
32
32
35
50
51
60
PART B
61
63
63
64
65
65
65
66
69
69
1B
2B3B4B
5B
6B
7B
8B
9B10B
118LzB138
Strains used and their originCommon opines and their detection
Cuvette differences in DNA reassociation studies
Comparison of original and recalculated DNA degreesof bindingPathogenicity and host range of grapevine andRubus isolates
Opine catabolism and synthesis by grapevineand Rubus isolates
Biochemical cha¡acteristics of A grobacterium strainsused in this study
Growth characteristics of Agrobacterium strains innutrient brothEffect of growth factor addition on Agrobacterium gowthDNA melting points of selected Aelrobacterium strains
Motility of Agrobacterium strains
S ummary : Differentiation of A erobacterium species
Serological relationships between Rubus andgrapevine isolates
vtlt
148 Degree of DNA binding: Grapevine strains andother agrobacteria
158 Degree of DNA binding: Rubus isolates a¡rdother agrobacteria
PART C
4C5C6C
APPENDTX C
AC-l Root Populations: Almond Ex. 1
AC-2 Root Populations: Vine Ex. 1
AC-3 Root Populations: Almond Ex. 2AC-4 Gall Populations: Almond Ex.3
70
70
tt2TT2
tt2L12
1C
2C3C
Strains and their originBiochemical characteristics of Pseudomonas isolates
Specificity of in vitro activity of inhibitoryPseudomonas isolates
Effect of iron on inhibition of biovar 3 by Pseudomonas
Relative inhibitory activity of strains K84 and P-14
Biochemical characteristics of fermentative Rubu s isolates
78
83
83
84
84
90

ix
PART A
8A9A104114t2A
PART B1B
5B
6B
7B8B
9B108
4C5C6C
1A2A3A4A5A6A7A
LIST OF FIGURES
Sampling sites for root colonization studies
Colonization of almond roots by biovar 2 and 3 strains
Colonization of vine roots by biovar 2 and 3 strains
Gel: Transfer of pTiK309 into K128
Scheme for transfer of pTiK27 into K377
Gel: Transfer of pTiK2l intoK377 pTi-
Pathogenicity of Biovar 2/ Biovar 3 transconjugantson tomato
Tartrate utilization by biovar 3
Colonization of almond roots by biovars L and2Plasmid loss from transconjugant strains in Almond Ex. 4
Plasmid loss from transconjugant strains in Vine Ex. 2
C-olonization of nopaline galls by biovar 2 and 3 strains
Gel: Fragmented DNA preparations for DNAreassociation studies
Absorbance profile of DNA for reassociation studies
Sample DNA reassociation plot: Closely related strains
Sample DNA reassociation plot: DifferentAgrobacterium species
TIVPE: Opines in grapevine crown gall extract
Growth of Ti-plasmidless strains on octopine and nopaline
Gel: Plasmids of Sconish Rubus isolates
Transmission EM: Rubus and biova¡ 3 isolates
Single linkage cluster analysis (negative matches not included)
Single linkage cluster analysis (negative matches included)
Octooine utilization bv Pseudomonas isolates
Inhibition of Agrobacterium spp. by Pseudomonas
Effect of i¡on on in viffo activity of inhibitoryPseudomonas isolates
FIVPE: Opines in Rubus crown gall extract
Scanning EM of fermentative Rubus isolates
Gel: Plasmids of fermentaúve Rubus isolates
Following page:
19
23
25
26
n27
28
29
29
31
33
34
2B
3B
4B
58
58
61
61
63
64
64
66
68
68
82
83
84
88
9T
91

1
INTRODUCTION/ LITERATURE REVIEV/
The plant disease crown gall is caused by soil-inhabiting bacteria belonging to
rhe genus Agrobacterium (Smith & Townsend 1907) Conn 1942. The disease is
characterized by tumorous growths on the root, crown or aerial parts of affected
plants. The host range of AÊrobacterium spp. is large but in nature confined to
dicotyledons (DeCleene & Deley, L976). Some Agrobacterium spp. cause a related
condition, known as hairy loot d"isease, fîrst described by Smith et al. (1911) and
characterized by massive root proliferation.
Aerobacterium has been well-studied, initially for its ability to cause disease
and, more recently, because of iS impact on plant genetic engineering. Its role in the
latter has been reviewed elsewhere (Depicker et a1., 1983; Caplan et al., 1983).
Crown gall disease is an economically damaging problem in many parts of the world
and in Australia is a problem on stonefruit and rose (Ken & Brisbane, 1983) and
recently on grapevine. Crown gall of grapevine has been a major problem in
European and North American vineyards for some time. Aspects of crown gall
disease and. i¡5 control have been reviewed by Schroth et al. (1971), Moore & Warren
(lg7g),Kerr (1980), Moore et al. (1980) and Kerr & Tate (1984)'
Taxonomic nomenclature
The nomenclature of Agrobacterium is somewhat confused at present, a
problem addressed in Part B of this thesis. The genus is closely related to the fast-
growing strains of Rhizobium and this relationship has been reviewed by Kersters &
Det ey (1984). At present there are four species of Aerobacterium described- A.
tumefaciens, A. radiobacter, A. rhizogenes and A. rubi (Kersters & Deley, 1984).
Confusion arises because the genes for pathogenicity in the genus are located on large
plasmids which are transferable between bacterial strains (Van Larebeke et al., 1975;
Watson et a1., 197s).These plasmids are known as Ti- (or tumour-inducing) and Ri-
(or root-inducing) and define a strain as being tumorigenic or rhizogenic respectively.
In the present classification scheme, species are defined by their pathogenicity with

')
the result that species are distinguished by a characteristic which is highly
transferable.
There are at least three chromosomal forms of Agrobacterium which can be
referred to as species (Holmes & Roberts, 1981) or biovars (Keane et al., l97O;
DeIæy et al., 1973; Kersters et al., 1973). Biovars I and2 are well-dehned and easily
separated (Keane e]!3l., 1970; Deley et 41., 1973; Kersters et al., 1973; Holmes &
Roberts, 19S1) but the taxonomic position of A. rubi and biova¡ 3 is less clear. This
is discussed extensively in Part B of this thesis. Throughout this study the biovar
nomenclature is used except when referring to isolates from Rubus cane galls, which
are refered to as'þS cane gall isolates' or as A. rubi, for isolates previously
placed in the species (Kersters & Deley, 1984).
Events in Pathogenesis
Ti-plasmids and their role in tumour formation have been the subject of
numerous reviews, including those by Nester & Kosuge (1981)' Bevan & Chilton
(L982), Zambryski er al. (1983), and Nester et al. (1984). Transfer of pathogenicity
to avirulent bacteria was fîrst shown to occur in galls (Ker, 1969). Initial
experiments demonstrating the role of the large plasmids showed that their loss by
curing ar3Tocwas correlated with loss of pathogenicity (Van Larebeke et al., 1974).
Transfer of virulence was shown to be correlated with transfer of the plasmids (Van
LarebekeS! ¡1., L975; Watson et al., L975), thus defrning them as Ti- (tumour-
inducing) plasmids. Ti-plasmids are conjugative (Kerr et al., 1977; Genetello et al.,
Lg71)and large with a molecular weight of approximatety 120 x 106 Daltons (Z'aenen
et al., 1974),corresponding to 180 to225 kb (Currier & Nester, L976).
Subsequentþ it has been demonstrated that large Ri- (root-inducing) plasmids in
some Agrobacterium strains carry the genes for hairy root formation (White & Nester,
1980).
The steps leading to tumour formation by Agrobacterium have been
intensively studied in the past 10 years and have been reviewed recentþ by
Hooykaas & Schilperoort (1986) and Stachel &Zarnbryski (1986b). Bacterial

3
anachment to the cell wall is required for virulence (Lippincott & Lippincott, 1969)
and this is encoded by two genes, chvA and chvB, which are located on the bacterial
chromosome @ouglas et al., L982; Draper et a1., 1983; Douglas et al., 1985). The
process of attachment is not clearly understood. The pectic portion of the plant cell
wall is reported to be implicated in binding (Lippincott et al., 1977).
Lipopolysaccha¡ide in the bacterial outer membrane has been suggested as the
bacterial factor involved in binding (Whatley et al., L976) but more recent evidence
suggests the involvement of a bacterial surface polypeptide (Matthyse, 1986).
However, chvB codes for the production of a ß-2-glucan (Puvanesarajah 9I-41., 1985)
and mutants which are attachment-defective do not produce ttre ß-1-2-glucan so, by
inference, chvB and the ß-l-2-glucan must be involved in attachment. Recent
evidence indicates that chvA mutants also lack the ß-l-2-glucan (J. Handelsman,
unpublished data). Bacterial motility and thus chemotaxis are also associated with the
chv loci (Bradley g!-AL, 1984) which appear to be very pleiotropic. Chemotaxis is a
response, at least ir part, to the production of exudates by the plant from the wound
site (Schroth & Ting, 1968; Shaw et al., 1986). A requirement of wounding for
Agrobacterium pathogenesis has long been realised (Riker g]!el., 1946) and recent
work has shown that the key substances are the phenolic compounds, acetosyringone
(AS) and a-hydroxy-acetosyringone (OH-AS) (Stachel et al. 1986a; 1986b). These
compounds are produced at low levels by normal plant tissue but at high levels in
wounded plant tissue (Søchel etal., 1986b).
A discrete segment of the Ti-plasmid, known as the T-DNA, is
transferred to the plant (Chilton g!, 1977;L97&\where it becomes integrated into
the plant nuclear DNA (Chilton et al., 1980; Willmitzer et al., 1980). Three T-DNA
loci essential for oncogenicity have been characterized and are involved in the
biosynthesis of plant hormones. The lpt (formerþ tmr) locus codes for an enzyme
involved in cytokinin synthesis (Akiyoshi et al., 1984; Barry et al., 1984; Buchmann
9!.-ú, 1985) and two genes, iaaM and iaaH (formerly tms-l and tms-2) (Schroder et
a1.,1984; Thomashow 9!_ú, 1984) code for enzymes involved in the conversion of
tryptophan to the auxin, indole acetic acid. The elucidation of the functions of these
4
genes explains the observation of Braun (1958) that crown gall tumours can grow in
tissue culture in the absence of phytohormones.
The incorporated r-DNA genes arso encode the synthesis of novel
compounds known as 'opines' (Bomhoff et al. , L976; Kerr & Roberts, 1976;
Montoya et al., 1977). Opines a¡e found within the plantkingdom only in plant tissue
which has been transformed by Aerobacterium. Octopine and nopaline are both
arginine derivatives and were amongst the first opines to be described @etit et al.,
1970) and a number more have since been characterized (reviewed by Tempé &Goldmann, L982). Opines can be amino acid-keto acid conjugates, such as octopine
and nopaline, or phosphorylated sugar derivatives (Eilis & Murphy, l9g1). An opine
is def,rned by its function; it is a substance whose synthesis in plants is encoded bybacterial genes and is catabolized by the inciting bacteria as a specific growth substrate
(Tempé et al., L979). Opine catabolic genes are usually located on the non-transferred
portion of the Ti-plasmid (Holsters et al., 1982) although there are strains which have
chromosomal genes for opine degradation (Montoya et al., 1978). Bacteria from other
genera, especially Pseudomonas, are also able to catabolize opines (Kohn &Beiderbeck, rgS2; Beaulieu et al., 1983; Brisbane & Kerr, 19g3; Rossignol & Dion,1985; Tremblay et al., 1987) but none of these bacteria appear to be capable ofdirecting opine synthesis.
The Ti-plasmid atso contains a region of approximately 35 kb, known as the
virulence (Vir) region. This region is required for pathogenicity but, unlike the T-DNA, is not transferred and integraæd into the plant genome (tlille et al., l9g4:Hooykaas et al., 1984). In an octopine plasmid the Vir region contains six operons
@-E, virG) (Stachel & Nester, 1986). VirA andg[¡G are expressed constitutively
but the other vir loci are expressed only in the presence of plant cells (Stachel et al.,
1986b), specifically in the presence of the phenolic inducer molecules in woundexudate. Both virA and virG are required for the induction of the other vir loci(Stachel &Z,ambryski, 1986a; Winans er al., 19g6).
The functions of virA and virG have been studied more intensively than the
other vir loci. Winans et al. (1936) showed that virG codes for a protein of 30, 000

5
daltons. The amino acid sequence of this protein is homologous to a number ofproteins which are components of two-part chemoregulatory systems in other
bacteria. Læroux et al. (1987) showed that virA encodes a92,000 dalton inner
membrane protein which has homology to receptor proteins in these other regulatory
systems. A model has been proposed where virA detects the presence of the plant
inducer molecules and transmits the signal across the cytoplasmic membrane. VirAcannot regulate the other vir loci without the presence of virG (Winans et al., 1986)
and both Leroux and Winans suggest that, by analogy with other bacterial systems,
virA probably acts to convert the virG protein, located in the cytoplasm, to an active
form, which in turn activates the remaining vir loci. The functions ofltg,C and E
have not been elucidated but the function of virD has been studied. The T-DNA is
flanked by 24 bp imperfect direct repeat sequences, known as the T-DNA bord.ers
(Yadav et al., 1982). VirD encodes an endonuclease which causes a'nicking' within
the T-DNA borders ( Yanofsky et al., 1986). This results in the generation of single-
stranded, linear molecules known as the T-strands (Stachel et al., 1986a) which are
probably transferred into the plant cell.
Comparatively little is known about T-DNA transfer and integration. Stachel
et al. (1986b) propose that the T-strand is an intermediate molecule similiar to the
linear single-stranded DNA transferred from donor to recipient during bacterial
conjugation. Recently, Buchanan-Wollaston et al. (19g7) showed functional
homology between bacterial mobilization (mqþ) genes required for plasmid transfer
and virD, as well as between origins of plasmid transfer (or[!) and the T-DNA border
repeats. Extending the comparison, the plasmid transfer (tra) genes are then
analogous to the remaining vir genes. This further strengthens a model for T-DNAtransfer which is analogous to bacterial conjugation. It remains to be understood how
the T-strand gets to the plant cell nucleus and how it then becomes integrated into the
plant genome. Stachel &z,atrbryski (1986b) suggesr rhat wounding may also
stimulate DNA replication in the plant cell and that the DNA recombination a¡rd repair
processes thus set in motion may be essential for T-DNA integration. Once integration
has occurred, T-DNA genes are transcribed and translated in the plant cells.

6
Octopine and nopaline Ti-plasmids belong to the same plasmid incompatibility
group (Hooykaas et al., 1930) and Ri-plasmids belong to a separate group
(Costantino er al., 1980). In addition Agrrobacterium isolates may contain other
compatible plasmids. There a¡e often large plasmids (Merlo & Nester, 1977;
Sheikholeslam et a1., 1979) of up to zl4Mrdin size (Casse et al., 1979) whose
functions remain cryptic. There are several well-studied smaller plasmids. One of
them resides in the economically important biological control strain, K84. It contains
a 47.7 kb conjugative plasmid, pAgK84, which encodes the production of and
immunity to the antibiotic, agocin 84 (Ellis et a1., 1979; Slota & Farand, 1982). The
use of this strain wilt be discussed later. Some biovar 1 strains isolated from
grapevine possess a Mkbplasmid, pTAR, which enables them to catabolize sodium
tartrate (Gallie etal., 1984).
The linkage of genes for opine synthesis and catabolism genes on the Ti-
plasmid and the role of the opines as a nutritional substrate for agrobacteria has led to
postulation that the opine functions are the 'raison d'etre' for the existence of the Ti-
ptasmid. This theory has been termed the'opine concept' (Petit et al., 1978a; Tempé
., L979; Guyon et al., 1980 or'genetic colonization' (Schell, L978; Schell d,lg7g).The basic tenet of the theory is that the opines create a selective advantage for
opine-catabolizing agrobacteria. The theory is strengthened by the discovery that
some opines, octopine (Petit et al., 1978b; Klapwijk et al., 1978), the agrocinopines
(Ellis et al., L982) and, more recently, cucumopine (4. Petit, pers. communication)
promote transfer of some Ti-plasmids. Thus the opines may be creating an ecological
niche for agrobacteria where the Ti-plasmids confer not only a nutritional advantage
but, in the presence of opines, promote their own propagation. There has been no
experimental proof of this theory to date. The role of the opines is further discussed in
Part A of this thesis.
A number of functions have been mapped on the non-transferred portion of
'the Ti-plasmid besides the virulence and opine catabolism genes, and functional maps
have been made of both octopine and nopaline Ti-plasmids @epickeret al., 1980;
Holsters et al., 1980; DeGreve et al., 1981; DeVos et al., 1981). Ti-plasmids contain

7
regions which code for conjugal plasmid transfer (Tra), replication (Rep) and
exclusion of the bacteriophage APl (Ape). Sensitivity to the antibiotic produced by
strain K84 is also Ti-ptasmid encoded (Engler et al., 1975) but is presont only on
some nopaline Ti-plasmids and some Ri-plasmids (Ryder, 1984). In addition, a
number of agropine strains appear to have a repressed agrocin uptake system (Ellis &
Murphy, 1981).
Host soecificitv
Not all Agrobacterium strains have the same host range (Anderson & Moore,
LgTg) and strains from grapevine in particular often have a limited hostrange (Knauf
et al., 1982). A number of studies have shown that the host range of Agrobacterium
is determined by Ti-plasmid genes (L,oper & Kado, 1979; Thomashow et al., 1980;
Knauf et al. ,1982; Unger et al., 1935). This was initially demonstrated by the
transfer of the Ti-plasmid from a more limited host lange strain into a wide host range
strain and vice versa. In both cases the host range of the donor strain was also
transferred. The host specificity of the plasmid in the new background was not the
same as the wild-type in atl cases, suggesting some modulating effect from the
bacterial chromosome or perhaps from a cryptic plasmid (fhomashow e]!31., 1980;
Knauf et a1.., 1982).
Several studies have investigated the molecular basis of host range
determination in greater detail (Yanofsþ et a1., 1985a, 1985b; Yanofsky & Nester,
1936). Wide and narow host range octopine Ti-plasmids (isolated from biovars 1
and 3 respectively) are distinct, sharing only 6 to l57o homology (Thomashow et a1.,
1930). F{owever, they are still in the same plasmid incompatibility group (Knauf &
Nester, Lg8z).Initial work with pTiAg162, a narrow host range plasmid, indicated
that the pathogenic loci were on two widely separated T-DNA regions (Knauf et al.,
1984). One region, the T¡-DNA, contains the cytokinin biosynthesis ûpt) genes and
the other, the T3-DNA, contains the auxin biosynthesis (!aa) genes (Bucholz &
Thomashow, 1984a; Yanofsky et al., 1985a). Cytokinin biosynthesis genes were
initially implicated in host range expression when it was shown that part of the T-

8
DNA from a wide host mnge strain encompassing the !E locus expanded the host
range of the limited host range strain (Knauf et al., 1983). This was confrmed when
the cytokinin biosynthesis gene alone expanded the host range (Bucholz &
Thomashow, 1984b; Hoekema er a1., 1984) although it should be noted that the wide
host range phenotype was not completely restored. Yanofsky et al. (1985b) showed
that a limited host range plasmid contained a weak or inactive !p¡ locus which further
implicated cytokinin levels as an important factor in host range determination. Other
workers (Inze et al., 1984; Klee et al., 1935) have shown that some plants require
both the introduction of the ipt ard iaa loci for gall formation and other plants require
only one. The suggestion is that endogenous plant phytohormone levels may play a
deciding role in the host specificity of the bacteria.
The evidence suggests ttrat there must be other factors involved with host
range expression. Studies by Yanofsky et al. (19S5b) show homology between the
virB, virG, virD and virE loci of wide and limited host range plasmids but no
homology between the-virA and virC loci. Introduction of virA and virC from a wide
host range plasmid restored the wide host range phenotype to a narrow host range
srrain. Mutations in the virC locus affect host range (Hille et al., 1984; Hooykaas et
al., 1984; Yanofsky et al., 1985b), so there is evidence that virC plays a role in host
range determination, possibly by controlling the number of T-DNA copies transferred
to the plant cell (Yanofsky & Nester, 1936). Other evidence implies a role for vifE
(Hirooka & Kado, 1986) and more strongly for virA (Leroux et a1.,1987; Ma et
a1.,1987). Ma et al. (1987) isolated strains from grapevine in northem China, most of
which showed little or no homology to the virA locus of a wide host range strain.
Leroux et al. (1987) showed that the virA proteins from wide- and limited- host range
strains had457o homology and that they were most divergent in the region postulated
to be a binding site for the plant inducer molecules. The virA locus from limited host
range strains did not induce the Vir region when exposed to acetosyringone, the
inducer for wide host range strains. It has been suggested that the virA gene product
from limited host range strains may recognize different plant inducer molecules
specific to grapevines ([.eroux et al., L987).
9
Crown gall of srapevine
Clown gall of grapevine has long been a serious economic problem in much
of the world, particularly Europe and North America. Until recently it was not
considered a major problem in Australia. The causal agents of the disease on vines
belong almost exclusively to the biovar 3 group (Panagopoulos & Psallidas, 1973:
Kerr & Panagopoulous, 1977; Panagopoulos g! ¿L, 1978; Bur & Hurwitz, 1981;
Bur & Katz,1983). The disease is charactenzednot only by tumours at the crown
of affected plants but often by extensive galling of aerial parts. These aerial galls may
girdle the trunk of the vine and kill the more cold-sensitive cultivars @urr, 1978).
Initial evidence that biovar 3 survives in the vascular system of grapevine
came from Iæhoczky (1963;197I). He postulated that in moist spring conditions
water flow through the xylem sweeps bacteria from the root system to aerial wounds
caused by frost injory. Other workers (Burr, 1978) have observed an association
between low-temperature injury and aerial galling.Recent shrdies conf[m the
importance of the systemic survival of biovar 3 in dissemination of the disease @urr
&Kat2,1983; Burr & Katz, L984;Tarbah & Goodman, 1986). Recently, Tarbah &
Goodman (1987) monitored the movement of antibiotic resistant mutants of biovar 3
and found that they were confined to xylem vessels. Burr et al. (1987c) detected
biovar 3 in grape shoots collected late in the growing season but not in green shoots
collected in spring and summer. This may reflect the development of secondary xylem
in the growing shoots. Early in the season the xylem of canes and new shoots are not
joined so bacteria cannot migrate to ttie growing shoots @urr et a1., 1987c).
Agrobacterium biovar 3 is found in vineyard soils (Burr &Kat2,1983), in the
grapevine rhizosphere but rarely in nonrhizosphere soils (Burr 9!-AL, 1987a). Recent
work by Burr et al. (1987b) has shown that biovar 3 is capable of forming sunken
lesions on the roots of grapevine and may be isolated with high frequency from these
lesions. This root decay is highly specifrc as it is not cauSed by other Agrobacterium
biovars and biovar 3 causes root decay only on grapevine roots, not on their shoots or
on the roots of other test plants. The root lesions can extend into the vascular system
10
and Burr et al. (1987b) suggest that this may be the mode of enury of biovar 3 into the
vascular system.
'Cane gall' on Rubus sPP.
Crown gall on Rubus spp. has been less-studied than its counterpaÍ on
gfapevine. The disease is also known as 'cane gall' because, as on grapevine, galls
are ofren formed on the aerial parts of the plant. Early work by Banfreld (1930;1935)
and pinckard (1935) showed that the causal agents of 'cane gall' and 'cro\ryn gall' on
Rubus spp. were fundamentally differenl More recent reports indicate that the crown
gall isolates usually belong to biovar 2 (Perry & Kado,1981; 1982; M. I-opez, pers'
communication). A full description of cane gall and its causal agent, A. rubi, is
provided by Hildebrand (1940). Reports of the disease come largely from North
America @anf,reld, 1935; Hildebrand, l94O McKeen, 1954) though it has been
feported elsewhere. Symptoms appeaf in the late spring and the disease is
characterized by ridges of galls which run up the side of the cane. Banfield (1930)
found, evidence for systemic infection by A. rubi and Pinckard (1935) showed that its
host range was limited to Rubus spp. although it is only weakly pathogenic on red
raspberry ß-Xlaeus). Cane gall has been reported in blackberry ßubus sp.) and
boysenberry Rubus sp. cv. 'Boysen') plantings in Canada (McKeen' 1954) and
evidence for the probable systemic nature of the pathogen was provided in that case
by the isolation of virulent A. rubi from apparently healthy floral canes.
Control of crown gall disease
Until the early 1970's, there were few effective controls for crown gall
disease. The use of antibiotics (Klemmer et al., 1955), fungicides (Helton &'Williams, 1968) and soil fumigants (Deep et al., 1968) has been attempted but these
approaches are expensive and not entirely effective. Biological control of crown gall
disease on some hcist plants has been achieved through the use of an avirulent
antibiotic-producing strain of Agrobacterium, K84 (Kerr, 1972; New &Kerr,1972;
Htay & Kerr,I974: Kerr & Htay, 1974). Strain K84 produces an antibiotic (Kerr &

11
HOy, Lg/4),now called agrocin 84 @ngler et a1., I975), whose structure was
determined by Tate et al. (1979). Agrocin 84 inhibits nopaline strains of
Agrobacterium and its production is encoded by a small plasmid, pAgK84 (Ellis et
a1.,1979; Slota & Farrand, 1982). Strain K84 has been used commercially in many
countries (Moore & Warren, 1979; Kerr, 1980). Control of crown gall of grapevine
and of Rubus spp. is not possible by strain K84 because of its specificity to strains
containing nopaline Ti-ptasmids. As a result, it has been used largely for the control
of the disease on stonefruit and rose.
problems with the biological control of crown gatl by strain K84 have been
reporred (I(err & Htay, 1974; Moore, 1978) and some pathogenic agrobacteria have
become resistant to the antibiotic (Panagopoulos et al., 1979; Ellis et al., 1979;
Cooksey & Moore, Lgïz).Recently a transfer dehcient (Trr) derivative of K84 was
shown to be an effective control agent (Shim et al., 1987) and a Tra- deletion mutant
has been engineered in this laboratory (Jones g!¿!, 1988); it is currently being tested
in vivo for its control eff,rcacy @. Jones, personal communication).
Biological control of grapevine ffown gall is not possible at present.
Inhibition of biovar 3 has been achieved in vitro by agrocin-producing Agrobacterium
strains (Webster et al., 1986; Thomson, 1986; Chen & Xiang, 1986)' but this has not
led to disease control in vivo. A more promising approach appeals to be based on the
early detection of the pathogen in planting material (Tarbah & Goodman, 1986) and
the subsequent use of Aerobacterium-free stock.
Ecolo g.v of A grobacterium
Although much is understood about the infection process by
Agrobacterium, relatively little is known about its ecology. A number of early studies
(Patel, L928; 1929; Hildebrand,l94l) report the ability of Agobacterium spp. to
survive for long periods in soil which has been confirmed by Schroth et al. (1971)
and Dickey (1961). The isolation of Agrobacterium biovars 1 and 2 from soils where
crown gall had never been observed (Bouzar & Moore, 1987) is another indication of
their ability to survive saprophytically for long periods. On the other hand, it has been

l2
reporred that A. rubi may have much less ability to survive in soil (Hildebrand,
1940). One very interesting aspect of Agrobacterium ecology is the high proportion
(as high as 100:1) of nonpathogenic to pathogenic srains found in the soil and in the
galls themselves (Kerr, 1969).
Studies have looked at the effect of pH (Siegler, 1938) and temperature
(Riker, lg26).The former study established that crown gall is more prevalent in
alkaline soils and the latter demonstrated that tumour formation is inhibited by high
temperatures. Both of these observations were confirmed by Dickey (1961). None of
these studies distinguished between biovars of Agrobacterium. Selective media for
Agrobacterium biovars have been developed by Schroth et al. (1965), New & Kerr
(Ig7l),Brisbane & Kerr (1933) and Roy & Sasser (1983). These selective media
make possible ecological studies which differentiate between Aerobacterium species
or biovars.
Scooe of this studv
This thesis is divided into tlree parts. Part A looks at aspects of the ecology of
Agrobacterium biovars 2 and3 and at the role of the opines. Although host specifrcity
is relatively well-understood at the level of the Ti-plasmid, little or no work has been
done examining the specific associations which have been observed between
chromosomal forms of agrobacteria and certain host plants. This study looks at the
association between biovar 2 and stonefruit and beween biovar 3 and grapevine. At
the onset of this study, there was little information on grapevine crown gall and
experiments concentrated on the early stages of the infection process, specifically root
colonization. Part A also examines the effect of the Ti-plasmid on this early
interaction. Much has been speculated about the ecological importance of the Ti-
plasmid but to date there has been very little in vivo data in this area. Experiments
were designed to study the contribution of the Ti-plasmid to bacterial colonization of
the plant host and to examine whether the opines provide any selective advantage to
opine-catabolizing bacteria in terrns of their colonization of the plant root surface and
of crown galls.
Part B examines ta:ronomic relationships among Agrobacterium spp. with
particular reference to the relationship berween the grapevine strains (biovar 3) and
those from Rubus spp. In the past there have been conflicting reporß conceming the
taxonomic position of isolates from these hosts so studies were performed to
determine if they were separate species. Both phenotypic and genetic methods of
comparison were used.
Part C looks at two non-Agobacterium genera of Gram-negative, soil-
inhabiting bacteria which are able to catabolize opines. Some of these a¡e fluorescent
pseudomonas spp. which are inhibitory to some Agrobacterium spp. and the possible
use of organisms such as these for control of grapevine crown gall is discussed.

13
PART A: ECOLOGY OF AGROBACTERIUM BIOVARS 2 AND 3 ONSTONEFRUIT AND GRAPEVINE
INTRODUCTION
Much work has been done to demonstrate the involvement of Ti-plasmid
encoded genes in the determination of host range of Agrobacterium species (Loper &
Kado, 1979; Thomashow g!-ù 1980; Knauf e! 3!.,1982; Unger et al., 1985). Work
on a limited host range grapevine sEain, A9162, has furttrer demonstrated that the
cytokinin biosynthetic locus on the T-DNA and two of thevirulence genes are the
regions of the Ti-plasmid involved in host specificity (Yanofsþ et a1., 1985a;
19S5b). Thus there is conclusive proof that host range is determined by the Ti-
plasmid and thar Ti-plasmids all belong to the same incompatibility group (Hooykaas
et al., 1980; Montoya et al., 1977) and, as well, that they are transferable between
strains (Van Larebeke et al., 19751, 'Watson et al., 1975). Despite this, one still
observes specific natural associations between the chromosomal forms (biovars) of
AÊrobacterium and particular plant hosts. Crown galls on stonefruit yield
predominantly biovar 2 strains (New, L972) and grapevine galls yield biovar 3 strains
(Panagopoulos & Psallidas, \973; Kerr & Panagopoulos, 1977; Panagopoulos et al.,
L978; Sule,1978; Burr & Hurwitz, 1981; Perry & Kado, 1982). It is apparent that, in
nature, there must be a more complex situation with regard to host specificity. The
primary aim of this section of the work was to experimentally determine the nature of
host specif,rc interactions between biovar 2 and stonefruit and between biovar 3 and
grapevine. Reciprocal Ti-plasmid transfers were then made between biovars 2 and3
in order to examine the effect of a strain's Ti-plasmid makeup on this early interaction
with the plant host.
The second aim of this study was to obtain ecological data to critically examine
the opine concept. The theory that opine-related functions are the'raison d'etre'for
the existence of the Ti-plasmid has been proposed (Petit et al. ,1978a; Tempe et al.,
1979; Guyon @1.., 1930) and is widely accepted. However, there has been no
ecological data to actually support the theory which proposes that the opines provide

t4
agrobacteria which are able to catabolize them with a selective advantage in the
rhizosphere. This advantage may be provided in two ways. Ti-plasmid carrying
agrobacteria can selectively catabolize the opines and thereby gain a nutritional
advantage. As well, some opines induce conjugation (Petit 9¡ 41.,1978b; Ellis et
a1.,1982), ensuring the propagation of the Ti-plasmid. This study was an attempt to
examine the nutritional role of the opines.
An understanding of the ecology of Agrrobacterium is important in developing
a strategy for strains not conEolled by present biological control organisms.
Ecological studies on Agrobacterium in general have been very limited. At the onset
of this work very little was known about the ecology of the disease on grapevine. The
work of Lehackzy (1978) indicated that Agrobacterium could be isolated from the
vascular system of grapevine. The importance of this systemic inoculum versus the
conventional model of soil inoculum was not established. An understanding of the
rhizosphere dynamics of Agrobacterium is important in the development of cultural
control strategies for grapevine crown gall and also in investigations into the use of
any biological control strains on vines. Additionally, because the molecular basis of
pathogenicity and plasmid-encoded host specifrcity have been so intensively studied
and a¡e relatively well-understood, Agrobacterium is a useful model system for the
study of the relative contributions of plasmid, chromosome and host plant in the early
stages of a pathogenic interaction.

15
PART A: MATERIALS AND METHODS
a) Bacterial strains and culture conditions
All strains used in ecological studies and their sources are listed in
Table 14. Transconjugant strains constn¡cted in this study which are not described in
Table 1A are designated by the strain number of the recipient plus the plasmid derived
from rhe donor e.g. CIRS (pTiK309). Wild-type Ti-plasmids are thus designated
pTi-X where X is the strain name of the plasmid donor, according to the system of
Scialcy et al. (1978). Bacteria were generally maintained on nutrient agar (NA) or
yeast-mannitol (YM) agar at2Soc for short-tenn storage. They were mantained as
lyophilized cultures at 4oC for long-term storage.
b) Pathogenicitv testing
For pathogenicity tests, bacteria were grown at 28oC for 48 hours on
YM slopes. A turbid suspension (about 109 ce[s/ml) of bacteria \ryas made in
buffered saline and sterile toothpicks were used to inoculate suspensions directly into
the young internodes of the plant stem. A buffered saline control was included in all
[email protected].'Early Dwarf Red'), tobacco (Niçotianegauca Graham.), grapevine (Vitis vinifera L.
cv.'Cabernet Sauvignon'), almond (PrunuS¿¡qygdalus Batsch. cv.'Chellaston').
Results were recorded after 4 weeks on tomato and tobacco and after 10 weeks on
grapevine and almond. When pathogenicity was unclear, putative galls were checked
for the presence of opines by high-voltage paper elecüophoresis (as described in
Part B).
For pathogenicity tests on carrot (Oaucus carola L.) discs, whole caûots were
washed, peeled, dipped in ethanol and flamed. Discs approximately 1 cm in thickness
\ilere cut aseptically and were placed apical side facing upwards in sterile specimen
containers containing 2Vo water agar. Bacterial suspensions were prepared as
previously described and the cambial area of ttre carot discs inoculated with 50 pl of
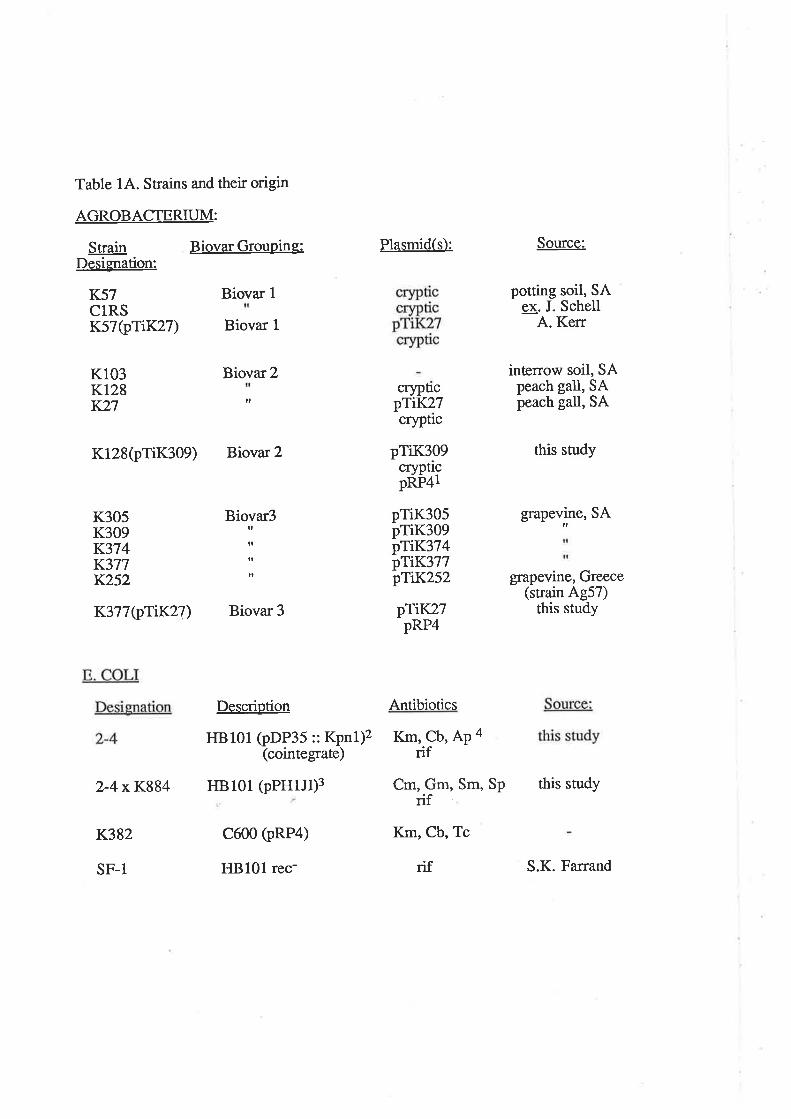
Table 14. Strains and their origin
AGROBACTERIUM:
Strain Biovar Grouping:Desisnation:
Plasmid(s):
cryptlc
pTiK309cryptigPRP4I
pTiK305pTiK309pTiK374pTiK377pTiK252
pT1K27pRP4
Antibiotics
Km, Cb, Ap 4rif
Cm, Gm, Sm, Sprif
Km, Cb, Tc
rif
K57ClRSK57(pTiK27)
2-4x K884
K382
SF-1
Biovar 1
Biovar 1
Description
IIB101 (pDP35 :: Kpnl)2(cointegrate)
H8101 (pPHlII)3
C600 (pRP4)
H8101 rec-
Source:
potting soil, SAex. J. Schell
A. Kerr
this study
grapevine, SA
interrow soil, SApeach gall, SApeach gall, SA
Kl03K128K27
Biovar 2
K128(pTiK309) Biovar 2
K305K309K374K377K252
K377@TLK27.) Biovar 3
ilcr)?trcpTlK27
Biovar3ttil
I
lt
il grapevine, Greece(strain Ag57)
this study
this study
S.K. Farrand

1- pRP4 described by Thomas (1981)
2- pDP35 described by Pischl & Farrand (1983); cointegrate formation described inPart A Results, Section 4.3.
3- pPHIJI described by Hinch & Beringer (1984)
4-By convention, two letter antibiotic codes (e.g. Km) designate plasmid-encodedantibiotic resistance and the three letter codes (e.g. riÐ represent chromosomally-encoded resista¡ce.

16
suspension. Discs were incubated at zsocunder low intensity fluorescent light (4.2
pEm-4-1¡ and results were recorded after 4 to 6 weeks.
c) Bacterial matings
For all bacterial matings, cultures were grown overnight at 25oC on a
rotary shaker and harvested by centrifugation when cells were in the mid- to late- log
phase of growth. Cultures were grown in yeast-extract (YE) broth,with antibiotics
when appropriate. Antibiotics used for Agrobacterium and E. coli and the
concentrations used in a variety of media are listed in Table 24. Before mating, all
cells were washed several times and resuspended in 2 ml YE broth. Aliquots of 1 ml
of donor and recipient bacteria were mixed, loaded into a syringe and forced onto a
0.45 pm Millipore filter. The filter was then placed on a non-selective medium- YE
agar or TY agar (see Appendix A) and incubated at 28oC for 2 days. As a control,
donor and recipient suspensions were mixed separately with 1 ml of broth and
transfered to a filter as described. After incubation, filters were suspended in 1 ml
buffered saline, diluted as desired and 200 pl of each dilution spread onto selective
media. Transconjugants usually appeared after 2 to 7 days incubation at 28oC. These
were then purified further by streaking for single colonies on selective medium.
d) Plasmid isolation and visualization by sel electrophoresis
The method used was a modification of that of Bimboim and DoIy
(1979) devised by Dr. S.K. Farrand (personal communication). The soluúons used in
this procedure are described in Appendix B. Cells were grown to late log phase at
25ocin NB or YE broth with or without antibiotics and adjusted to ttre equivalent of
1.0 ml of a suspension with an optical density (640 nm) of 0.4 and harvested by
centrifugation. Cells were resuspended in 1 ml TE buffer with 100 pl 5M NaCl and
l0 ¡tl lOVo Na Sarkosyl. After mixing and recentrifugation, the pellet was suspended
in 100 pl Solution 1 and kept on ice 5 min. Solution 2 (200 pl) was added, the tube
inverted and left to stand at room temperature for 15 minutes before the addition of 50
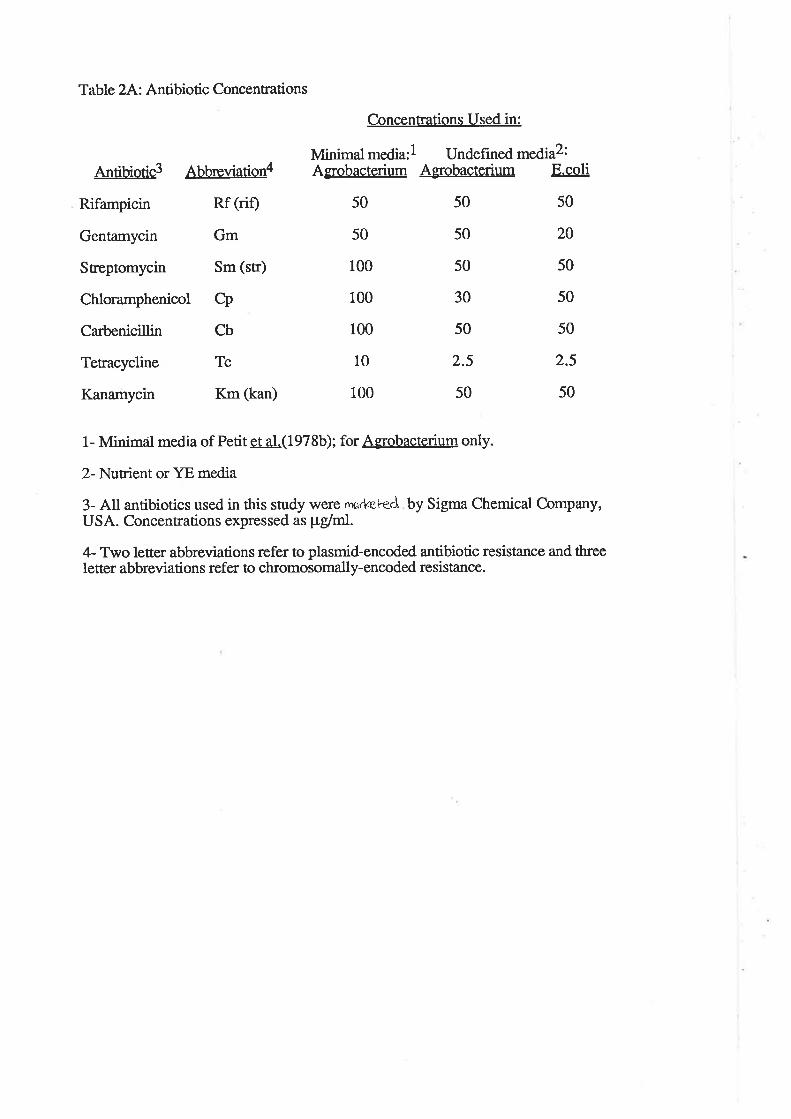
Table 2A: Antibiotic Concentrations
Antibiotic3 Abbreviation4
Rifampicin Rf (riÐ
Gentamycin Gm
Streptomycin Sm (sn)
Chloramphenicol Cp
Carbenicillin Cb
Tetracycline Tc
Kanamycin Km (kan)
Concentrations Used in:
Minimalmedia:l UndefinedmeÅiaZ:Agrobætelw Agrobacterium E.coli
50 50 50
50 50 20
100 50 50
100 30 50
100 50 50
10 2.5 2.5
100 s0 50
1- Minimal media of Petit et al.(1978b); for Agrobacterium only.
2- Nutrient or YE media
3- All antibiotics used in this study wero rtxrrkele.l by Sigma Chemical Company,USA. Concentrations expressed as pørnl.
4- Two letter abbreviations refer to plasmid-encoded antibiotic resistance and threeletter abbreviations refer to chromosomally-encoded resistance.

L7
ttl 2M Tris-HCl pH 7.0. After 30 min at room temperature, 50 ¡tl 5M NaCl was
added, gently mixed and extracted with an equal volume of phenol saturated w\¡h37o
NaCl for 5 minutes. The emulsions were then centrifuged for 10 min at 4oC and the
aqueous (upper) phase transferred to a fresh tube; 0.1 volume 3M sodium acetate and
2 volumes ice-cold absolute ethanol were added to precipitate the DNA.
The DNA was collected by centrifugation (15 min at 4oC), the pellet dried
under vacuum and redissolved in 20 pl TE8 plus 10 pl tracking dye. The samples
were loaded into 2 mm wells inaD.7%o orl%o agatose (Seakem) gel; the gel was
covered in Tris-borate buffer and electrophoresis ca:ried out at 60 mA for 4 to 6
hou¡s. Gels were stained with ethidium bromide (2 ¡tg/ml) for 15-30 minutes, then
photographed on Polaroid type 665 positive/ negative film under UV (302 nm)
illumination.
e) Plasmid tran sformation
The method of Holsters et al. (1978a) was used for plasmid
transformation of Agrobacterium. Large-scale plasmid isolations for use in the
transformation procedure were done by the method of Casse et al. (1979) and purified
in ethidium bromide-cesium chloride density gradients (Maniatis eta!, 1982).
fl Hish voltase DaDer electroohoresis
High voltage paper electrophoresis (HVPE) was used to detect opines
in gall tissue and is described in Materials and Methods, Part B, in the section, "Opine
synthesis and catabolism".
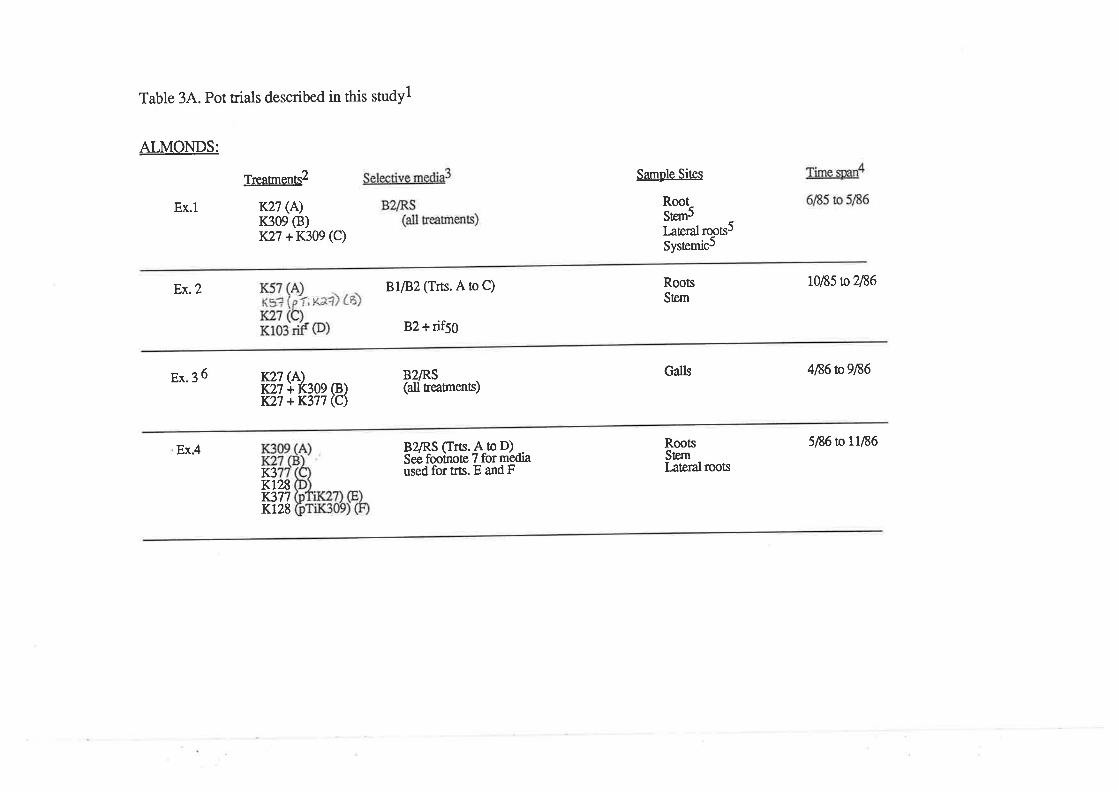
Table 3A. Pot tials described in this studyl
ALMONDS:
Treatmens2
K27()K30e (B)I07 + K309 (C)
Sample Sites
I¿teral roos5Systemics
RoosStem
Galls
RootsStemIåteral roots
Rootstem5
Ex.1
Ex.2
Ex.3 6
Ex.4
Y'n (A\ B2|RSK27 ì K309 (B) (all rearnens)r<27 +K377 (C)
BIEZ (Trts. A to C)
B2 + rif5g
B2IRS CTrts. A to D)Seä fooinoæ 7 for mifiaused for Ets. E and F
r0ß5n2ß6
4ß6tÐ9ß6
5/86 ro 11/86
K3K128K377K128

VINES:
Ex.1 K27 (A)K30e (B)K27 + K30e (C)
B2lRS(all reatmens)
Rootstern5l¿teralroos5Vascular tissueS
9Æ5 to 9Æ6
Ex.2 as AlmondEx.4 RootStemIåteral rootsVascular tissue
9ß6ta6ß7
Foohotes:
1- The general method for all pot rials is described in Part A, Materials and Methods.
2- All srains used in these studies are described in Table 1A'.
3- All media are described in AFpendix À 81 = Biovar 1 medium; B2=BiovarZmedium; RS = selective medium for biovar 3 of Roy & Sasser (1983).
4- Samples for all experiments taken at 4 week intervals.
5- Siæ was not sampled at all of the sample times.
6- Galls were formed by K27 (described in Part A, Materials and Methods).
j- 2%ropaline,2%oNaClplus cblg¡ tc16'
0.2fo ætoPne Plus cblgg tc19.

18
s) Pot Exoerimentse.-
Alt pot experiments are referred to by number and are described in
Table 34.
i) Preparation oÍ inocula
All strains used as inocula for pot experiments are described in
Table 14. Fresh cultures of each srain were inoculated on to 50 ml YM slopes and
grown a¡25oCfor 48 hours before use. Bacteria were suspended in sterile distilled
water (SDUD and diluted to a concentration of approximately 1 x 10⁸ ce[s/ml. Cell
densities were determined spectrophotometrically at 640 nm using the equation:
No. Agrobacterium cells = t 0.10 + (ODO¿O x22.93)lx 108 cells/ml (B.
Lethbridge, personal communication).
7l) Soil and growing condirtons
The soil used for all pot experiments was a 1:1 mixture (non-
sterilized) of sand and loam with no fertilizer added. A handful of bark chips was
added to each pot to improve drainage. Fertilizer (60 ammonium sulphate: 11
potassium nitrate: 9 mono-ammonium phosphate) was applied (3 g/poÐ and watered
in thoroughly every 6 to 8 weeks. All planS were grown outdoors in 8" or 10" pots
and watered regularly throughout the growing season.Initial soil levels of both biovar 2
and 3 strains were tested and found to be below 193 çfu/g soil.
ibl) Preoaration and irnctilation of planting material
Almond seeds (cv. 'Chellaston') were obtained locally. After
shelling, seeds were soaked overnight in water and placed in moistened peat at 4oC.
Captan (2gper litre) was applied weekly to inhibit fungal growth and seeds were kept
moist. After 4 weeks, seeds were transferred to 10" pots containing UC mix and
gïown under shadecloth for 3 to 4 weeks. By this time, young seedlings had emerged
and were transplanted at the initiation of each experiment.

19
For Vine Ex. 1, grapevines (cv. 'Cabernet Sauvignon'clone GV93) were
obtained from Wynn's Coonawarra estate as 1 yearrootlings and stored for a week
before use at 4oC. For Vine Ex. 2, vines (cv. 'Cabernet Sauvignon') were obtained
from Kemp's Murray Valley Nursery, Barmera as 1 year rootlings and were stored at
10oC for 10 days before use.
When inoculated, almond seedlings were dipped in the bacterial suspensions
for several minutes to a level2.5 cm above the cotyledons. Vines were dipped to 15
cm above the base of the stem and were planted to the same level. For Almond Ex. 3,
galls were induced at the time of planting by wounding the almond seedlings just
below the cotyledons with a sterile toothpick which had been dipped in a cell
suspension (109 ce[s/ml) of I(27. Seedlings 'were then inoculated with
ffeatment stains by dipping as described above'
iv) Expe rime ntal desígn
All pot experiments sha¡ed a basic randomized block design
with either 6 or 8 blocks (= replicates), each containing a complete set of treatments
and sample times. The actual treatments used and sample times for each experiment
are described in detail in Table 34.
v\ Samnlinp nrocedure
Samples were taken from all experimens at 4 week intervals.
In the experiment involving colonization of galls, the fust sample was taken 8 to 10
weeks after planting to allow time for gall formation; in all other experiments the
initial sample was taken within 2 weeks after planting.
At each sample time, plants were gently pulled from pots and roots were
shaken free of all but closely adhering soil. Sections (2.5 crn in length) were cut from
the root, stem and lateral toots as indicated in Figure 14. An effort was made to
sample from the same location on the root system each time. The diameters (top and
bottom) of each of these sections was recorded in order to estimate root surface area
and sections were suspended in l0 ml SDV/.

Figure 14. Sampling sites for root colonization studies.
1. Almond
A = 0.5 cm below soil line (stem)
B = 0.5 cm below cotyledons (roo$
C = lateral roots (no secondary ttrickening)
2. Grapevine
A = 10 cm above soil line (systemic)
B = 0.5 cm below soil line (stem)
C = on side roots 0.5 cm from stem (rooÐ
D = lateral roots (no secondary thickening)
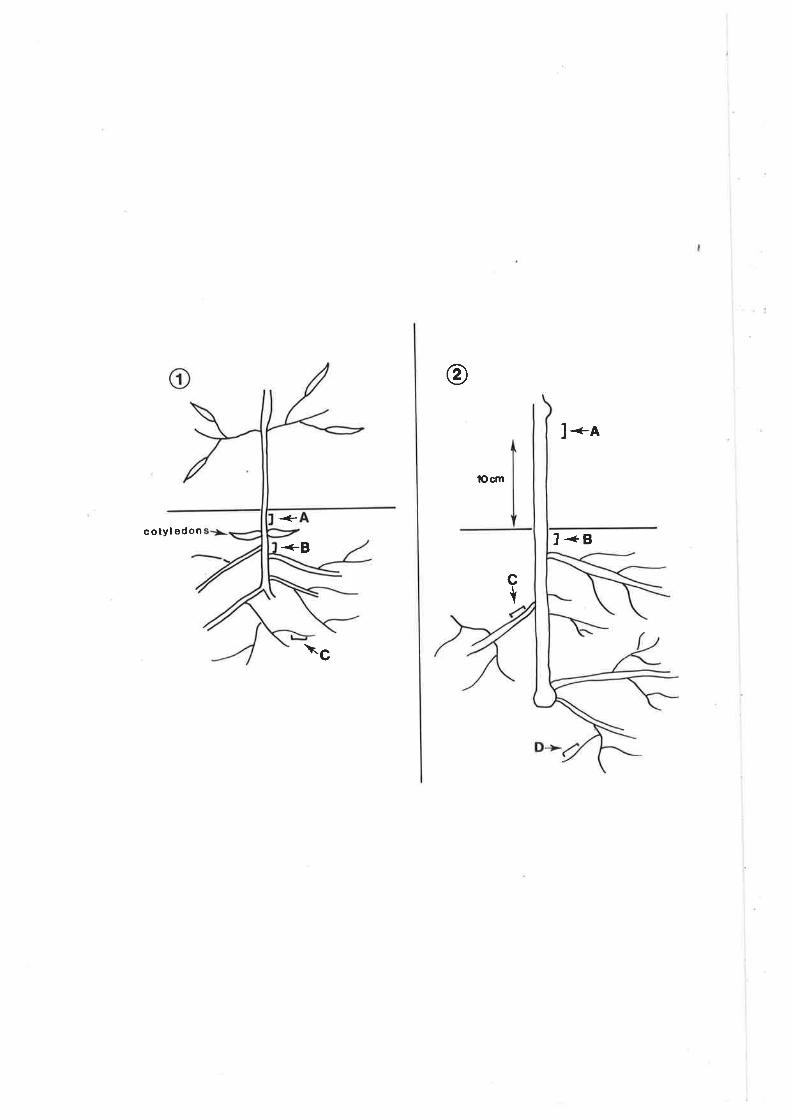
@
c oty I edon++B
þcm
J*r
l<BcI
\c

20
Initially, where systemic samples were taken, stem sections (2.5 cm in length)
were cut approximately 10 cm above the soil line, surface-sterilised in 1:10 Milton's
solution (16.51o sodium hypochlorite) followedby 90Vo ethanol, then rinsed and
macerated thoroughly in 10 ml SDV/.In Vine E,x.2, systemic samples were taken
using a modification of the method of Tarbah and Goodman (1986). A vacuum pump
(GEC Machines, UK; Type 852208) was attached to a 1 litre vacuum flask and holes
bored in rubber stoppers to allow a snug fit of the vine cutting into the stopper.
Vascular washings were collected in plastic tubes after I to 2 ml of SDV/ was sucked
through L0 cm internodal cuttings (taken 10 cm above soil level). Vascular washings
(200 pl per plate) were spread on the selecúve medium of Roy and Sasser (1983) and
colonies counted after 5 days' incubation at 28oC.In Almond Ex. 1, systemic
samples were taken from almonds at 6 sample times by maceration in SDW. Samples
were taken from stem sections 5 to 10 cm above the soil line.
For all samples, tenfold dilutions were made in SDV/ after 30 sec. votexing;
three 5 pl aliquots of each dilution were plated on selective media and incubated at
25oC (see Table 3A for details of media used in each experiment). Enumerations were
made alter2days on nutrient agar,3 days on biovar 2 medium and after 5
days'incubation on the biovar 3 medium of Roy and Sasser (1983) or on minimal
medium.In Almond Ex. ,root weights were taken for 10 root samples in addition to
root surface areas in order to correlate surface area versus wet and dry root weights.
For Almond Ex. 3, the fresh weights, number and posiúon of galls were
recorded. For an estimate of gall surface populations, whole galls were suspended in
known volumes (dependent on gall size) of SDW and agitated on a rotary shaker for
30 minutes. Ten-fold dilutions in SDV/ were made and three 5 ¡rl aliquots plated on
selective media for each dilution. Gall surface areawas measured by recording the
average diameter of each gall and surface area was calculated on the assumption that
the galls were either spherical or hemi-spherical in shape.
For internal gall populations, galls were surface-sterilised as described above
and 0.5 cm3 sections were removed aseptically from the fresh, inner portion of the

It should be noted that for each treatment, samples wore plated both on the
medium selective for the inoculated strain as well as on media selective for the strains
inoculated in other treatments. Biovar 2 populations in the soil remained below 104
cfulcrn2on both almonds and vines and biovar 3 populations were below l'03 cfu/cnr2
footonbothhosts.Contaminationbybackgroundpopulationswasnotperceivedasa
major souÍce of error'
The identity of strains reisolated from soil was checked both by their ability to
catabolizetheappropriateopinesandbytheirplasmidprofiles.Althoughthisisnota
definitive test of stain identity, it was considered suffrcient because of the low numbers
of agrobacteria present as contaminants'
2l
gall. For very small galls, the diameter was recorded and volume estimated. Sections
were ground with a mortar and pestle in 1 ml SDW and left to sit atroom temperature
30 min to allow movement of bacteria out of the gall. Dilutions and plating were
performed as above. ( tnt"n+)
vi) AnalYsis of results
Resuls of all pot experiments were analysed on GENSTAT
(Rothamsted Experimental Station, 1977) using a one-way analysis of variance. Data
were log-transformed in order to give a normal distribution of variances. Block
effects were analysed separately and found to be non-significant in all cases.
h) Comparison of selective mediaÍor biovar 3
In a preliminary experiment, 10 known strains of biovars 1 and 2 and
12 strains of biovar 3 were streaked for single colonies on the selective media for
biovar 3 of Brisbane and Kerr (1983) and of Roy and Sasser (1983); growth was
recorded after days'incubation at 28oC. In a second experiment, overnight NB
cultures of three biovar 1 and 2 and six biovar 3 strains were diluted to 500 to 1000
cells/ml in SDW. Three 100 pl aliquots for each strain were spread on the biovar 3
medium of Brisbane and Kerr (1983), the biovar 3 medium of Roy and Sasser (1983)
and nutrient agar amended with 0.17o yeast extract. Results were enumerated after 3
days'incubation at 28oC for all media and again after 5 days for the two biovar 3
media.

22
PART A: RESULTS
4.1 Sampling Techniques
i) Comparison of selective media for biovar 3
When strains of biovars 1,2 and 3 were compared after streaking on
two biovar 3 selective media, 83 (Brisbane and Kerr,1983) and RS (Roy and
Sasser,1983), all 12 biovar 3 strains grew on both media. On 83 media, 2/10 biovar
2 andS/lQ biovar 1 strains gfow, though biovar 2 strains grew very slowly and
therefore could be read.ily distinguished from biovar 3. On RS media, 10/10 biovar 1
and 0/10 biovar 2 strains grew; biovar L strains did not display the characteristic deep
red centre of the biovar 3 strains. It was observed for some of the biovar 3 strains that
the dark red coloration was often only visible where single colonies appeared and was
not evident on the heavily streaked section of the plate.
When bacteria were diluted and plated, 83 media gave lO\Vo recovery of 5/6
biovar 3 strains andTOVo fecovery of the remaining strain G<252), in comparison
with their recovery on amended nutrient agar. Recovery of biov* 2 st ins and, of 213
of the biovar 1 strains was O7o but 607o recovery of a third biovarl strain was
observed. However, colonies of the latter were smaller than biovar 3 on the same
medium. On RS medium, there was O{uorecover! of biovar 2 andl007o recovery of
all biovar 3 strains andof.2l3 biovar L strains. However, biovar 1 colonies were
small and white in comparison with the distinctive, large, red-centred biovar 3
colonies. It was noted that both of the biovar 3 media actually gave a higher recovery
than amended nutrienr agar of 416 of the biovar 3 strains. Although neither of the
media are completely selective for biovar 3, it is easier to distinguish biovar 3 from
biovar 1 colonies on the media of Roy and Sasser because of the differential
tetrazolium dye uptake and resulting pigmentation of biovar 3. Therefore RS medium
was used for selection and recovery of biovar 3 in all ecological studies.

23
ii) Correlation of root surface area and root weight
Tabte 4A shows the correlation between root surface area and root
weight. Because there is no convention about expressing colonization data and, as
many authors express bacterial populations in terms of root weight" this correlation
serves as a rough guide to compare data presented in this study with data expressed in
terms of bacterial cfry' unit weight of rool Therefore, populations per gram fresh
weight of root are approximately twice those per cm2 root and populations per gram
of dry root aIe very roughly lO-fold higher. Obviously, these correlations are
extremely crude and would serve only as a guide on a comparable host species.
4.2 Colonization of Almonds and vines b]¡ Biovars 2 and 3
The results presented in this section were obtained from Almond Ex. 1 and
Vine Ex. 1 (Iable 3A). The purpose of these experiments tw¿ts to determine ifAerobacterium strains representing biovars 2 and3 differed in their ability to colonize
their respective hosts, stonefruit and grapevine. Almond was used to represent
stonefruits in all of the pot experiments.
i) Almonds
Figure 2A shows the panern of root colonization over 12 months of
wild-type isolates K27 a¡dK309. In a separate treatment in the same experiment, a
mixed inoculation of K27 and K309 was made in order to test for competitive effects
between the two strains. No significant differences were found betrveen single and
mixed inoculations for K27. Differences for K309 between single and mixed
inoculations were observed at 3 out of the 12 sample times but followed no consistent
pattern (Appendix C, Table AC-l). There were significant differences (P< 0.05)
between root populations of K27 andK309 at all months except February for single
inoculations and, in November, December and February, for mixed inoculations.
From August to October, during the period where the first gall formation \ilas
observed" K27 maintained levels of more than 10- to 100-fold higherthan the biovar

Table 44. Comparison of Root Surface Area and RootWeightl
Surface area(cm2)
Fresh weight Ratio 2
Root Section:
1
2
3
4
5
6
7
8
2.75
2.36
3.93
3.14
r.96
2.36
L.57
3.93
(e)
.99
2.0r
2.19
t.29
.64
L.25
.60
1.98
2.78
r.t7
1.79
2.43
3.06
1.89
2.62
1.98
.2
.43
.51
.26
.1
.37
.15
.54
10.58
5.49
7.71
12.08
t2.38
6.38
10.47
7.28
Drv weishtG)
3 Ratio 4
Fresh weight/ surface area = 2.22 +/- 0.62
Dry weighl surface area = 9.05 +l- 2.65
1 - Method of root sampling is described in Part A, Materials and Methods. All rootsections were 2.5 cm in length. samples were taken at month 4 in Ahón¿ 8.. ¿.
2 - Ratio of fresh root weight to root surface area.
3 - Dry weights taken after 3 days'incubation at 90oC.
4 - Ratio of dry root weight to surface area.

Figure 2A: Colonization of almond roots by strain K27 (brovar 2)
and strain K309 (biovar 3). These data represent the
result of single inoculations of both srains and are
presented along with data from mixed inoculations
of these strains in Appendix C, Table AC-1. Plants were
inoculated in June.

ooLì¡E()
=lo0)o
I
6
4
0
2
JJASONDJFMAMmonth of samPle
Iø
K27K309

24
3 strain, K309. In the finat 3 months of the experiment,KzT numbers were again 10-
fold higher than K309. Only in December did K309 exceed K27 following single
inoculations.
The rapid decrease of K27 numbers from October to December suggested that
the pattern of root colonization may have changed, due perhaps to secondary
thickening of the main roots which occurred during that period. This decrease in
biovar 2 populations on almonds has been observed previously (Shim et al., 1987).
However, when numbers on unthickened lateral foots were measured from February
to May, they were not signifrcantly different (P< 0.05) from numbers on roots (data
not shown). This indicates that secondary thickening is not the cause of the fall in
numbers
Bacterial numbers on stetns were measured in the latter half of the experiment
and they followed the same trend as those on roots but in general were more variable
(data not shown).
Numbers of biovar 2 in galls were low (approximately 103 "¡u7"t13
gall
tissue), indicating that even the galls were not heavily colonized after 10 to 12
months. Galls were not generally decayed and appeared to be physiologically active.
All galls sampled during the experiment contained nopaline (confumed by
IIVPE) and thus wele presumably formed byK27. Gall weights increased
throughout the experiment for both of the treaunents which included K27 Clable 5A).
Several galls were formed in the K309 only treatment near the end of the experiment
but were found by TIVPE to contain nopaline. As K309 is an octopine strain, it was
assumed that the galls were fomred as a result of contamination with K27, a nopaline
strain or possibly by biovar 2 strains present as contaminants in the soil.
Systemic samples from the almonds were taken in October to January and
again in April and May; neither K27 nor K309 was found in these samples.
Colonies of both K27 andK309 were periodically picked from the
enumerating media, purihed and checked for the presence of the colrect plasmid. A

Table 54. Gall weights: Almond Ex. 1 I
Month
June
July
August
Sept.
Oct.
Nov.
Dec.
Jan.
Feb.
March
April
May
Dry weight of galls 2(g)
Treatments3:
K309 K27 K27: K309
0a 0a 0a
0a 0a 0a
0a 0.084 0a
0 a 0.t7 a 0.38 a
0 a 0.35 a 0.13 a
0 a 0:58 a 0.02 a
0a 3.58b 0.92a
0.11 a 11.31b 236a
0 a 8.39 b 5.84 b
0a 38.10b 16.52b
0 a t7.48 b 8.59 b
9.432 ll.r1 a 19.74a
1- Almond Ex. 1 described in Table 34. Procedures for sampling etc. described inPart A, Materials andMethods.
2- Values with the same letter are not significantly different. Data was analysed byone-way ANOVA andleast squares difference (P< 0.05) between means at eachmonth were deterrnined.
3- Treatments K27 and K309 were single inoculations of each strain andK27l K309was a 1:1 mixture of the two strains.

25
grcater number of contaminants were found on RS media but not at a level which
would signifrcantþ affect results.
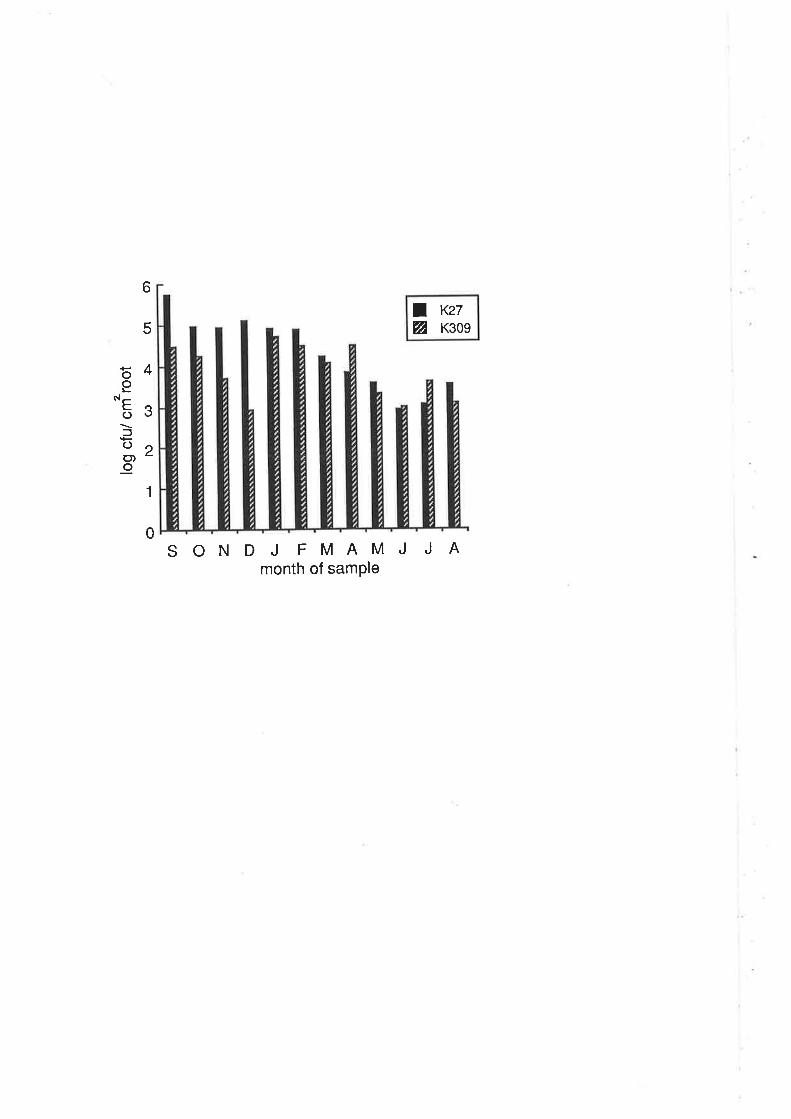
ii) Vines
Figure 3A shows the pattern of colonization over 12 months of K27
and K309 on vine roots. As with the comparable experiment on almonds, few
competitive effects were observed in the mixed versus the single inoculations (data
presented in Appendix C, Table AC-2). There were no signifrcant differences (P<
0.05) between single and mixed inoculations for K309 and for K27 dtffetences were
observed ar only 2 of the 12 sampling times. K27 maintained significantly higher (P <
0.05) numbers than.K309 during September to December in the single inoculations.
The actual levels of Í(27 were approximately l0-fold lower on vines than they were
on almonds. Levels of K309 dropped markedly in the fust 3 months to 103 cfulcrû
(the detection limit) but stabilized betrveen 103 to lú cfulcr& in the subsequent
samples. No galls were formed on any of the treatments, despite the fact that K309
was pathogenic in artif,rcial inoculations on the same cultivar of grapevine.
Numbers on stems at crown level were not signif,rcantly different from
numbers on roots and there were few significant differences benveen treatments.
Numbers on lateral roots were also low (103 cfu/cm2 root) during February to
August for all treatmenrs and became undetectable (<103¡ in June and July, as the
vines became dormant (data not shown).
Only K309 and never K27 was found in systemic samples. K309 was flrst
detected in systemic samples taken in October and was further detected at low but
consistent levels (101 to 102 cfu/cm3 stem) until March, after which time it was not
detected again until July, when the vines were fully dormant and August, at bud
burst.
Figure 34. Colonization of grapevine roots by strain K27
(biovar 2) andstrain K309 (biovar 3). These
data represent the result of single inoculations
and are presented along with data from mixed
inoculations in Appendix C, Table AC-Z. Plants were
inoculated in S eptember.
ooLnEofoO)o
6
5
4
3
2
1
0SONDJ FMAMJ JA
month of samPle
Iø
K27K309

26
4.3 Constmction of Transconjugant Strains
¿) Transfer of Biovar 3 Ti Plasmid into Biovar 1 and 2 Backgrounds
Purified plasmid DNA from K309 was transformed into an NTl
background, resulting in a biovar 1 strain that contained a biovar 3 plasmid. Initial
attempts to transform a plasmidless strain of biovar 2,K103, with pTiK309 were
unsuccessful and, because the conjugative opine for biovar 3 was unknown at this
time, the technique of RP4 mobilization was used @omhoff etal.,L976; Chilton et
a1.,1976; Van Larebeke et a1.,1977).
RP4 was introduced into K309 via mating with E.coli strain K382 (Table 1A).
Strain K309 containing RP4 was then further mated with C1RS (biovarl) or
K128chlr, a spontaneous chloramphenicol-resistant mutant of this naturally Ti-
plasmidless biovar 2 strain. Selection of transconjugants was made using the
antibiotic resistances on RP4 (Km, Cb, Tc) and on the chromosome of the recipients
ClRS (rif, str) and K128 (chl); selection for pTiK309 was made on the basis of its
ability to catablize octopine. All transfers were confirmed by gel electrophoresis and
by pathogenicity testing (see Materials and Methods). Both pTiK309 and RP4 were
transferred and maintained separately in the new background (Figure 4A). RP4 was
maintained separately and a cointegrate was not formed with pTiK309, in contrast to
the repors of others ( Holsters et a1.,1978b; Hooykaas et a1.,1980). Chilton et al.
(1976) reported stable coexistence of RP4 and a Ti-plasmid. However, although RP4
was separately maintained in the strains in this study, it was not stable in the new
background and there was evidence of some breakdown in Aerobacterium (evident in
Figure 4A,lane 1).
b) Transfer of Bior¡ar 2 Ti Plasmid to a Biovar 3 Background
Initial attempts to nansfer the biovar 2 Ti-plasmid,pTi[(Z7 , into a
wild-type biovar 3 background (containing a Ti-plasmid) by RP4 mobilization were
unsuccessful. No wild-type Ti-plasmidless strains of biovar 3 were available so

Figure 44. Agarose gel electrophoresis to confirm transfer
of pTiK309 into biovar 2 strain, K128.
Lanes:
1 to 4: K128 (pTiK309, pRPa)
5: K1286: K3097: K3098: K382 (8. coli carrying pRP4)
a: pTiK309b: cryptic plasmid of K128
c: pRP4
d: chromosomal DNA
Arrows indicate:
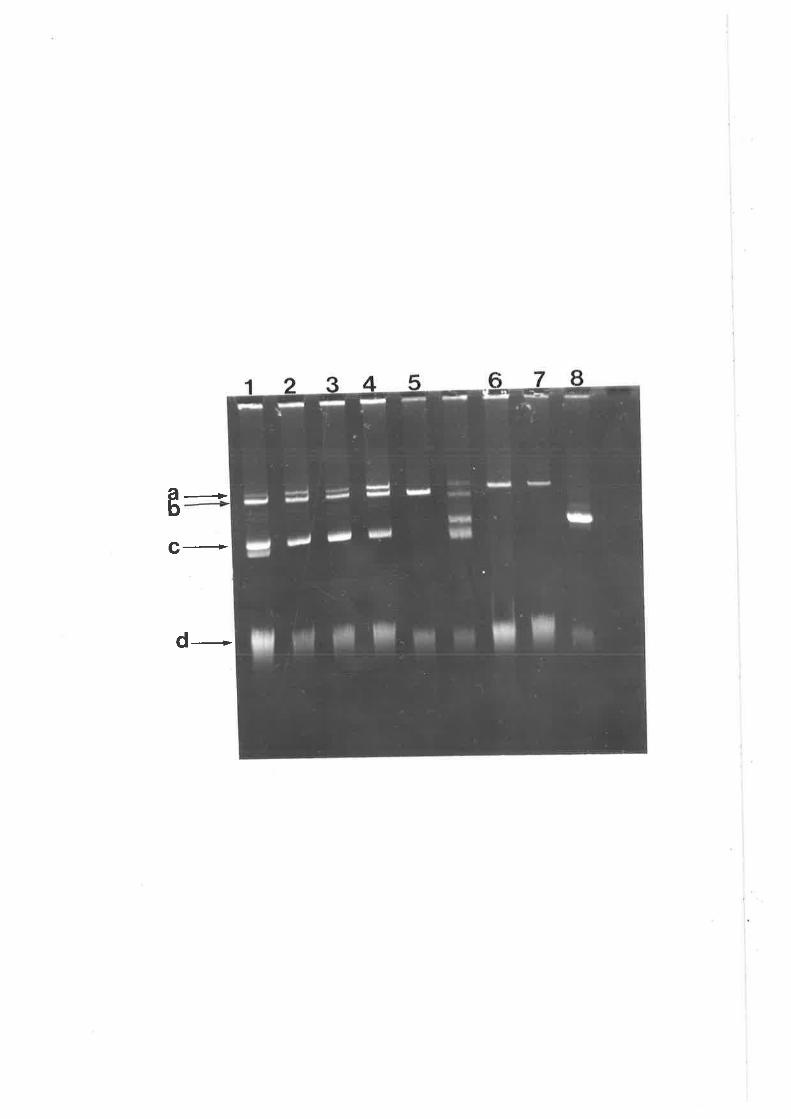
ab
+
c-+
d--._

27
attempts were made to cure a \¡/ild-type of its plasmid. Initial attempts using heat
curing (ÉIamilton,lgTl) or ethidium bromide (Lin & Kado,l977) were unsuccessful.
Only partial plasmid deletions were obtained using these methods.
A novel approach was taken,using the knowledge that the Ti-plasmids of the
biovar 1 strain, 46, and the biovar 3 isolate, A9162, are incompatible (Knauf &
Nester,1982). It was thus thought that this may be generally true for biovar 3 Ti-
plasmids. An Aerobacterium strain, NTl, containing both the RP4-derivedplasmid,
pDP35, and a plasmid, pJS400, carrying the Kpnl fragment of A6 which codes for
plasmid incompatibility (Inc) was obtained from Dr. S K. Farand. By transferring
these plasmids into a recombination def,rcient (rec-) mutant of E.coli. strain H8101
rifr, and selecting for the kanamycin resistance caried on pJS400, a cointegrate
between the two plasmids was formed which contained the wide host range capability
of pDP35 as well as the incompatibility function of 46. Cointegrate formation occuls
because pJS400 is unable to replicate in E. coli. The HB101 strain containing the
cointegrate was designated2-4 (Iable 1A) and was then used to eliminate the biovar 3
plasmid, pTiK377, from its wild-type background. In order to eliminate all
Agrobacterium incompatibility functions from the biovar 3 strain, another wide host
range plasmid pPHIJI (Hirsch & Beringer,l984), was used to eliminate the pDP35/
A6 Inc region cointegrate from K377. Both pDP35 and pPHIJI are in the same
plasmid incompatibility group (IncP).In later work,the same scheme forTi-plasmid
elimination was used to eliminate the resident Ti-plasmidof I{252.
A Ti-plasmidless strain of biovar 3 was thus available to be used as a recipient
for the transfer of the biovar 2 Ti-ptasmi d, pTiK27 . Once again, the technique of RP4
mobilization was used to transfer pTiK27 into the K377pTí- background. The ability
of biovar 3 to tolerate 27o NaCI in the growth medium was used to select for the
recipient background; plasmid selection for RP4 was made using its antibiotic
resistances and selection for pTiK27 was made on the basis of its ability to catabolize
nopaline. All transconjugantslilere screened for plasmid transfer by get
electrophoresis (Figure 6A) and for pathogenicity (discussed in the following

Figure 54. Steps involved in transfer of a biovar 2Ti-plasmid,$it<27, into biovar 3 (K377) background.
1. Elimination of pTiK377 by awide host range
plasmid, pDP35, carrying a cloned fragmentof the A grobacterium Ti-plasmid incompatibilityregion (hc A6).
2. Elimination of pDP35 with another IncP plasmid,pPHlJI, containing no Agrobacterium sequences.
3. Inttoduction of pTiK27 into K377 by RP4
mobilization.
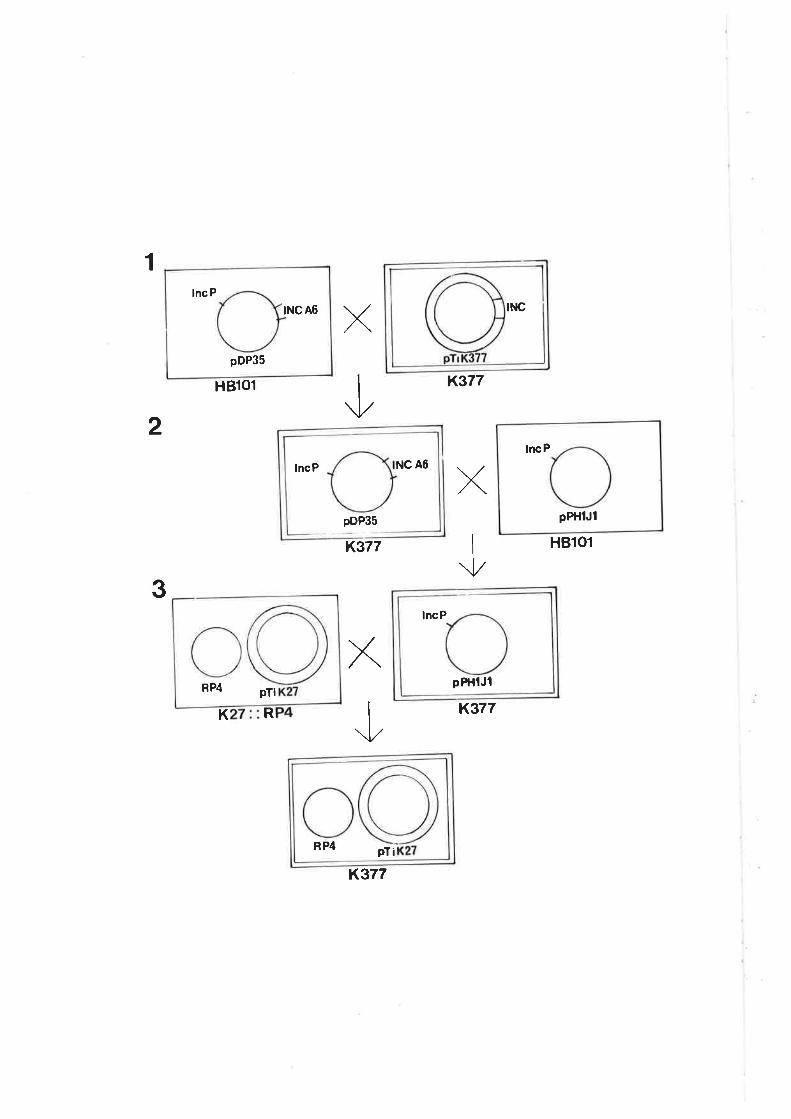
rlrc
1
H8101
K R
K377
K377
K377
K377
HBlOl
X
t.
X.1,
pTiRP4
2
X.'t
3
INCA6
pDP35
lnc P
pPtllJl
lncPlncP NC A6
pDP35
pPtllJl
lncP
RP4 pTi
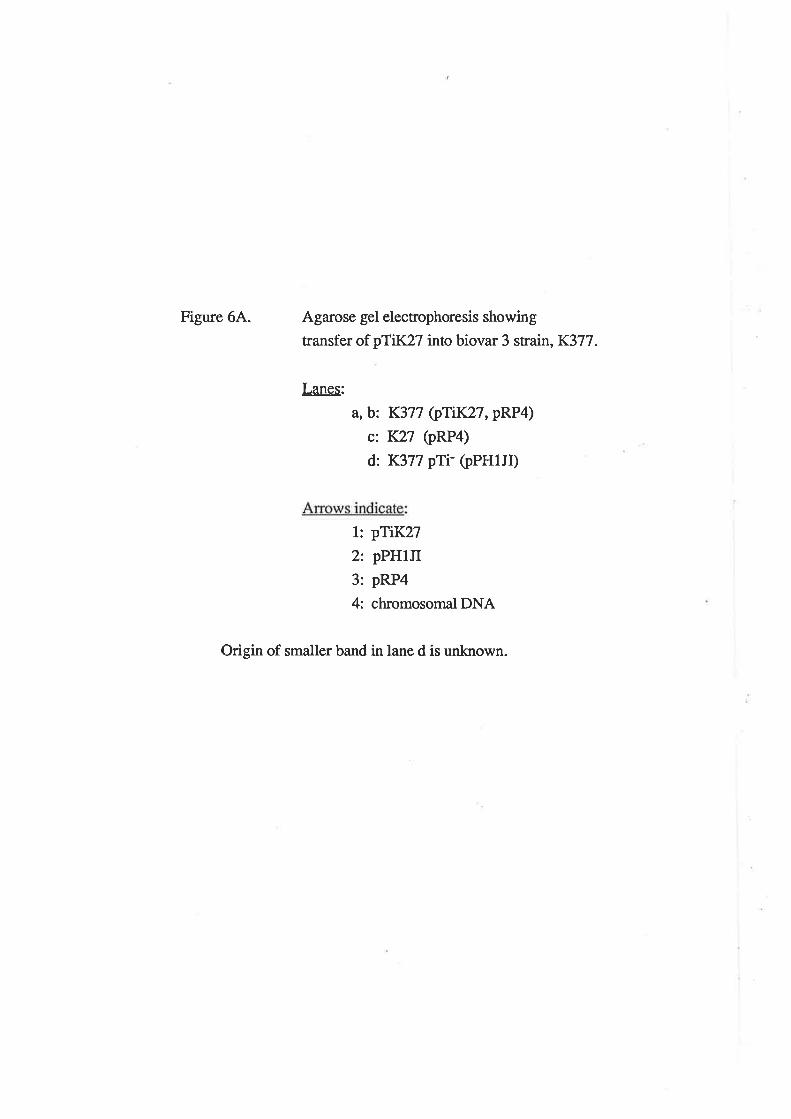
Figure 64. Agarose gel electrophoresis showing
transfer of pTiK27 into biovar 3 strain, K377.
Lanes:
a, b: Í377 (pTiK27,pRPa)c: I(27 (pRP4)
d: K377 pTi- (pPHlJr)
l: pTiK272: pPHIJI3: pRP44: chromosomal DNA
Origin of smaller band in lane d is unknown.


28
secrion). The general scheme for transfer of pTiK27 into K377 is outlined in Figure
54.
Throughout this thesis the transconjugant strains are referred to as
K377(qT1K27) and K128(pTiK309). It should be noted that pRP4 is also present in
these strains but, for simplicity, it is not indicated in the strain designation.
c) Characterization of transconiu gants
i) Patho genicity of transconju gants
when bi."uliit*'tt;,?,oiovar 3 Ti-plasmid i.e. strains+hs
designated K128 (pTiK309) were tested for pathogenicity on tomato stems, it was
observed that the transconjugants were less virulent than wild-type K309 (Figure
7A). When controlled inoculations (5 pl of a 5 x 10⁸ cells/ml bacterial suspension)
were made into tomato stenu with a sterile syringe, mean stem diameters and gall
weighs measured 4 weeks after inoculation differed significantly fum the K309.trurrncur¡tt3cl,,r-8. +l?
control (Table 6A). \Mhen biovar 3 n " õontainingnbiovar 2 Ti-plasmid i.e. strains
d.esignated K377 (pTiK27) were inoculated onto tomato stems, no loss of virulence
of the transconjugants was observed.
Table 7A summarizes the pathogenicity of parental and transconjugant strains
on almonds and grapevines. Both transconjugants had a more limited host range than
wild-type strains. Strain K128 OTiK309) was nonpathogenic on almond while K309
was weakly pathogenic in artifrcial inoculations. Similia¡ly, strain K377 (pTiK27)
retained the pathogenicity of f{27 on almond but was completely nonpathogenic on
grapevine. It was interesting to note that the biovar 2 strain, K27, was pathogenic in
artifrcial inoculations but not in natural infections on grapevine @esults, Section
4.2).

Figure 74. Pathogenicity of biovar 2lbiovar3reciprocal transconjugants on tomato stems.
Photographed 4 weeks after inoculation.
1. AtoD:K128(pTiK309)E: K309 (pRP4)
F: K309
2. A: K377 pTi-B: K377 (pTiK27)C:K27 (pRPa)

1
A
B
c
D
E
F
2
A
B
c

Table 64.
Strain
K309
K128
K128 (pTiK309) #1
K128 (pTiK309) #2
Mean stem diameter 3(mm)
8.33 a
3.67 c
6.00 b
6.83 a,b
t3r.fi a
6b
nJT b
23J7 b
1- method of testing virulence described in Part A Materials and Methods; results
iuL"n afær weeksl Values represent a mean of 6 replicates. One-way analysis ofvariance was performed.
2- plasmid transfer described in Part A Results, Section A'3'
3- values with the same letter not significantþ different
Analysis of Variance: Gall weights
sBetween strains 68.5
Residual 17.5
Totat 86
4- signifrcant at P( 0.01 ( F 5,t8 = 4.25)
df
5
18
23
MS
t3.7
2.t9
Ea
6.26**

Table 74.
Strain
K27K128K309K377
K128 (priK309)K377 (pTiK27)
++¡2
Almond(cv. 'Chellaston')
¡2¡2
+ +
+
1- Method of pathogenicity testing is described in Part A Materials and Methods.
Almonds were inoculated on the young internodes of the stem and at the crown.
Grapevines were inoculated on internodes at the tip of the new season's growth.
2- galls very small.

29
ii) Tartrate utilization by transconjugants
There has been areport in the literature of tarrate catabolic
genes in a biovar 1 strain from grapevine being located not on the chromosome but on
a separate Mkb plasmid, pTAR (Gallie g!-A1., 1984). Biova¡ 3 strains isolated from
grapevine a¡e able to catabolize tartrate (Kerr & Panagopoulos, L977) but biovar 3
isolates from chrysanthemum cannot catabolize tartrate (Bazn & Rosciglione, 1982).
These observations suggest that tartrate catabolism is not a conserved characteristic
among all biovar 3 strains and that the ability to utilize tarEate may be correlated with
colonization of grapevines. Thus, the possibility that tartrate utilization is coded for by
the Ti-plasmid in biovar 3 was investigated.
Biovar 3 strains with and without Ti-plasmids were tested (see Part B,
Materials and Methods) for their ability to catabolize Na-tartrate and results are
presented in Table 84. Typical positive and negative reactions for ta¡trate utilization in
the bromothymol blue indicator medium are depicted in Fig 8A. Results indicate that
tartrate utilization for strains K309, K377 andK252 is chromosomally encoded and
not associated with the Ti-plasmid of biovar 3 @TiK377). No plasmids in the sizet+
range of pTAR (44kb) was observed in any of thenbiovar 3 isolates used in this study.
4.4 Colonization of Almonds and Vines by Constructed Strains
The results discussed in this section were obtained from Almond E;x.2 and 4
and Vine Ex 2 respectively Clable 3A). The purpose of these experiments was to
deterrrine if the Ti-plasmid was important in plant colonization.
i) Almonds: Effect of biovar 2 Ti-plasmid on colonization b]'
biovar 1
In Almond 8x.2, biovar I and2 strains with and without a Ti-plasmid
were compared. Figure 9A shows the pattern of colonization of wild-type and

Table 84. Tarrate Utilization and Biovar 3
Strain
K309r377K252ClRS
C1RS (pTiK309)C1RS (pTi[<z7)K377 pTí-K252pTi-K377 OriK27)
Groupingl
Biovar 3
Biovar 1
Biova¡ 1
Biovar 1
Biovar 3
Biovar 3
Biova¡ 3
Tartrate catabolism
+++
+++
1- biovar grouping of chromosomal background2- construction of transconjugants is described in Part A Results, Section 4.3.

Figure 84. Indicator tubes showing that tartrate utilization
is not Ti-plasmid encoded by biovar 3 strains.
A.B, C.
D, E.
K309 (positive)
clRS #1,2C1RS (pTiK309) #1,2

l¡Jooo
K309- tZ
ClR
S
ClR
S
C1R
S P
Ti K309 2
CIR
S P
T¡K3O
9 1

Figure 94. Colonization of almondroots by srains
K27 (biovar 2), K57 (biovar 1), K57(pTiK27)
and K103 (Ti-plasmidless biovar 2). Data were
obtainedin Almond Ex. 2 and arepresentedin
Appendix C, Table AC-3. Plana were inoculatedin
October.

I
6
4
2
0
ooLô¡E(Jfcto)o
Iø@ø
K27K57K57 pTiI<21K103
Fo NDJmonth of sample

30
transconjugant biovarl and2 strains. Samples were taken over a 5-month period. In
the first 3 months, there were no significant differences betweenK2T, K57 (wild-
type biovar 1) and K57 (pTiK27). However, in January,K2T was significantly more
numerous on the roots @< 0.05) than the two strains with the biovar 1 background
and in February was more numerous than K57 (pTiK27). K57 was chosen for this
experiment because, in a previous study, Shim et al. (1987) had observed poor
colonization of almond roots by the biovar 1 strain, CIRS. The possibility existed
that, because C1RS is an antibiotic-resistant mutant of a Ti-plasmid cured biovar 1
strain ttrat it may be less'ecologically competent' than a wild-type strain. Strains in
this study which had a K57 background exhibited colonization comparable to that of
biovar 2 for much of the experiment.
K27 declined to lower numbers after month 3 (December) in this experiment
than it did in other almond experiments. The reason for this is not clear but could be
related to soil temperatues. Almond Ex. 2 commenced in October and samples for
months 4 and 5 were taken in January and February respectively, the hottest part of
the year. The Ti-plasmidless biovar 2 strain, K103, was not numerous throughout the
experiment. This probably does not reflect any real effect of the Ti-plasmid but is
rather a reflection of the origin of this strain. K103 was not isolated from stonefruit
and although it was identified as biovar 2itmay differ significantly from the biovar 2
stonefruit and rose isolates which comprise a large part of this goup. In subsequent
experiments the wild-type strain from stonefruit, K128, was used to represent Ti-
plasmidless biovar 2 strains.
ii) Almonds: Colonization by biovar 2/biovar 3 reciprocal
transconjugants
In Almond Ex. 4, biovar 2 and 3 wild-type strains were compared with strains
having the same chromosomal background but containing reciprocal Ti-plasmids.

Table 94. Root Populations: Almond Ex. 4 I
Month K27
Treatments: Q-og cfu/ cm2 root)
K309 K377 K128 K377 K128(priK27) (priK309)
4.77 b 4.92b 5.45 a,b 4.90 b 5.66 a,b
4.87 b 5.16b 5.91 a,b 4.95b 5.64a,b
437 b 4.62b 5.91 a 4.74b 5.28 a,b
3.29b 3.99b 6.18 a,b 3.63b 5.02 b
4.47 aþ 3.57 b 5.75 a 4.55 a,b 3.63 b
3.57 b 3.58 b 6.62 à 3.70 b 4.45 a,b
May
June
July
August
Sept.
Oct.
6.03 a
6.41a
5.99 a
634 a
6.17 a
6.98 a
1- Almond Ex. 4 described in Table 34. Data lepresent results of separateinoculations of each strain. Procedures for sampling are described in Part A ,Materialsand Methods.
2- Values with the same letter are not signifrcantly different. Data were analysed byone-way ANOVA and the least squares difference (P< 0.05) between means at eachmonth was determined.
The identity of strain K128 was corfirmed by gel erectrophoresis.
31
Roots: Table 9A indicates the pattern of root colonization over a 6 month period of
witd-type biovar 2 and3 isolates as well as of two transconjugant strains, a biovar 3
strain containing a biovar 2 Ti-plasmid(K377 pTiK27) and a biovar 2 strain
containing a biovar 3 Ti-plasmid (K128 pTiK309).
As in the initial experiments wittr almonds (Section 4.2), the wild-type biovar
2 isolate, K27 , muntained very high (106 cftr/cm2 root or geater) numbers over the
6 month period. Numbers of the Ti-plasmidless biovar 2 strain, K128, did not differ
significantly (P< 0.05) from those of K27 during this period, indicating the
importance of the chromosomal background in determining colonization levels. ('.,"e rt)The wild-type biovar 3 strains, K309 and K377, did not significantly differ
from each othe¡ at any sample time and showed a similia¡ decline in numbers on the
roots. After 3 months, numbers of both strains were1.04 cfulcm2 root or less.
Numbers of both wild-type biovar 3 strains differed significantly (P< 0.05) from K27
at all sample times except in September, when K309 andl(2l were not different. This
confrrms the result observed in the initial almond experiment (Section 4.2), indicating
the marked differences in colonization of almonds by biovars 2 and3.
For the first 4 months of sampling, colonization by K128 (pTiK309), the
biovar 2 strain containing a biovar 3 Ti-plasmid did not differ significantly (P< 0.05)
from strain K128, which has the same chromosomal background but lacks a Ti-
plasmid. It is important to note that in the enumeration procedure for this strain (see
Table 3A), isolation was being made on a medium that was co-selective for the Ti-
plasmid and the RP4 plasmid. In August to October, when media selective for
chromosomal background only was used for isolation of bacteria from the treatrnent
inoculated with K128 (pTiK309), results indicated that total biovar 2 numbers in that
treaünent were about lO-fold higher than populations of K128 (pTiK309) (data not
shown), suggesting that there was some loss of pTiK309 and/or RP4 from the K128
background. Plasmid isolations were made from bacteria isolated on biovar 2medta
and it was observed consistently that 50 to 807o of these isolates had lost the biovar 3
plasmid (demonstrated in Fig 104). Complete loss of the Ti-plasmid and of the RP4

Figure 104. Agarose gel electrophoresis showing plasmid
loss from transconjugant strains in Almond Ex. 4.
Isolations made in month 6 on media selective
for chromosomal background only.
1. Reisolation of K128 (pTiK309)
Lanes:a to c: Isolates recovered on 82 medium
amended with antibiotics selectivefor pRP4.
d to j: Isolates recovered on 82 media.
Loss of pTiK309 observed in lanes a to e.
Arrows indicate:
1. pTiK3092. cryptic plasmid of K1283. pRP44. chromosomal DNA
2. Reisolation of K377 (pTiK27)
Lanes:f: K377 (pTiK27)
a to e: Isolates recovered on RS media.Retention of pTiK27 visible inlanes b,c and d. Poor DNAextraction in lanes a and e.
Arrows indicate:
1. pTiK272. pPHIJI3. pRP44. chromosomal DNA

1
3><1\-2
.+4
+4
I¡¡
trJúdl

32
plasmid was observed; deletions were observed in the RP4 plasmid but there were no
apparent deletions in the Ti-plasmid, as has been reported in a similiar situation in
Rhizobium (tWang et al., 1986).
In contrast, the biovar 3 strain containing the biovar 2 Ti-plasmid, strain K377
(pTiK27),followed the same pattern of root colonization as its wild-type counte{part,
K377.The two strains did not differ signif,rcantþ rtany sample time (P< 0.05). It
should be noted that there were only few and very small galls formed even by strain
K377 OTiK27). In terms of levels of root colonization, the transconjugant strain
displayed the same pattern of colonization as its wild-type background and that there
was no effect of the Ti-plasmid on bacterial numbers on the root.
V/hen plasmid isolations were made for strain K377 (pTiK27) from selective
and non-selective media, Ti-plasmid loss was observed in less than207o of the
isolates tested (demonstrated in Fig 104), indicating ttratpTiK2T was much more
stable in vivo in its new background than was pTiK309.
Stem and lateral roots: The pattern of colonization of all isolates on the stem was
virtually identical to those on the root (Table 104, i). Once again the two wild-type
biova¡ 3 strains were signifrcantly less numerous
(P< 0.05) than K27 at all months except October. Numbers of the transconjugant
strain, K128 (pTiK309), declined in September and October on the stem as they did
on the roots. The actual levels of colonization for all isolates are very similiar to those
on the roots.
In general, levels of all isolates on the lateral roots (fable 104, ü) tended to be
lower than those on stems, although in October (month 6) a general 10-fold increase
was observed for all strains.
iii)
In Vine 8x.2, the same strains were used as in Almond Ex. 4.

Table 104. Sæm and Lateral Root Populations: Almond Ex. 4 I
i) Stem Populations Treatments: 2 (t og cfulcrû stem)
Month
May
June
July
August
Sept.
Oct.
K27 K309
3.95 b
4.47 c
3.89 c
3.55 b
4.27 b
4.t3 aþ
K317 Kl28
4.61 a,b
6.03 a
5.52 a,b
6.18 a
6.51 a
5.58 a
4.94a
5.55 a'b
6.03 a
6.22a
6.55 a
6.12a
4.04 b
4.Cl c
4.19 b,c
3.75b
3.99b
3.53 b
K377 K128(priK27) (priK30e)
4.30 a,b 4.93 a
4.'72b,c 4.68 b,c
4.04c 5.17 a,b,c
3.20b 5.33 a,b
4.50 b 3.49b
3.38 b 4.43 z,b
ii) Lateral Root PopulationsTreatments :2 g-ogcfty'cm2 root)
Month K27 K309 K377 K128 11377 K128C,TiK27) (pTiK309)
May 5.09 a 4.29a 4.66^ 4.51a 4.56a 4.84a
June 6.59 a 5.30 a'b 4.99b 5.40 4b 4.99b 5.04 a,b
July 4.82 a 3.68 a'b 3.89 b 4.49 a,b 3.27 b 3.08 a'b
August 5.07 a 3.38 b 3.42b 4.92^ 3.16 b 3.60 b
Sept. 5.44 a 3.60 b,c a.g6 t,t 5.08 a,b 3.94 a,b,c 3.2g c
oct. 6.01 a 4.68 a,b 4.53a,b 5.52 a,b 4.35 b 5.06 a,b
1- Almond Ex. 4 described in Table 34. Data representresults of separateinoculations of each strain. Procedures for sampling are described in Pa¡t A, Materialsand Methods.
2- Values with the same letter are not sþificantly different Data were analysed byone-way ANOVA and the least squares difference (P< 0.05) between means at eachmonth was determined.

Table 1.14. Root Populations: Vine Ex. 21
Month K27
Treatments: (tog cfu/cm2 root)
K309 K377 K128 K377 K128(priK27) (priK309)
4.22a 4.54a 4.66a 436a 4.56a
4.16 b,c 4.30 b 3.76b,c 4.79 ^ 3.43 c
4.24b 4.26^þ 4.16 b 5.16 a 3.O7 c
3.7ta 4.12a 3.532 3.88 a 2.91b
3.30 a,b 2.65b 3.70a 3.66a 3.06 b
3.00 a 2.92a 3.55 a 4.40a 2.85a
Sept.
Oct.
Nov.
Dec.
Jan.
Feb.
4.56a
3.97 b,c
4.59 ^,b
3.79 a
3.66 a
3.69 a
1- Vine Ex. 2 is described in Table 34. Data represent results of sparate inoculationsof each strain. Procedures fe¡ sampling are described in Part A, Materials andMethods.
2- Values wittr the same letter are not signifrcantly different. Data were analysed byone-way ANOVA and the least squares difference (P< 0.05) at each month betweenmeans was determined.

33
Roots: Table 114 shows the colonization of vine roots over 6 months by the wild-
type and transconjugant biovar 2 and3 strains. There were few signifrcant differences
between trearments. Transconjugant strain, K128 (pTiK309), was significantly (P<
0.05) lower than its wild-type background, K128, in November to January.
Transconjugant strain, K377 (pTiK27), was significantly different from its wild-type
background,K3'l7, and from K27 only in October.
As in the comparable experiment on almonds, isolations from the treatrnents
containing transconjugant strains were made on media selective for only the
chromosomal background and plasmid isolations made from bacteria growing on that
medium. All estimates of plasmid loss are based on observation of isolations made at
3 to 4 times during the sampling period. Figure 114 indicates the pattern of plasmid
loss from these strains. Strain K128 (pTiK309), which was extremely unstable on
almonds, showed a much lower rate of plasmid loss on vines (approximately 50Vo as
compared to90Vo on almonds). Plasmidretention in these strains was confirmed by
checking catabolism of octopine. Total biovar 2 counts for this treatment were not
significantly different from counts made on media which co-selected for pTiK309.
Transconjugant strain, K377 (pTlI{Z7), was more stable than K128
(pTiK309) on vines (Fig 114) as it was on almonds (Fig 104) and plasmid loss was
observed in less than 50Vo of isolates. It seems evident that, in vivo, pTiK27 is
inherently more stable in its reciprocal background than is pTiK309. However,
pTiK309 appears to be less unstable on vines than on almonds which would parallel
the findings of 'Wang et al. (1986), where they found differential plasmid stability
depending on the plant host.In the studies involved in this thesis, no plasmid
instability was observed in either strain in vitro even after multiple subcultures.
Stem and lateral roots: There were no consistent significant differences between
treaünents on either the stem or lateral roots. Numbers on the stem and lateral roots
tended to be more va¡iable but, for all treatrnents, \ilere in the range of 103 to 104
cfu/cmz root for the duration of the experiment (data not shown).

Figure 114. Agarose gel electrophoresis showing plasmid
loss from transconjugant smins in Vine 8x.2.Isolations made in month 5 on media selective
for chromosomal background only.
1. Lanes:h: K309
a to g: Isolates recovered from soilinoculated with K128 (pTiK309)Note loss of cryptic plasmid of K128in all isolates. In lanes d and e the DNAextraction was poor but pTiK309 ispresent in these isolates (visible onnegative) Origin of extra band in lane fis unknown.
Arrows indicate:
1. pTiK3092. pRP4
3. chromosomal DNA
Presence of pTiK309 was confinned by checking octopine
catabolism of isolates.
2. Lanes:
l: K377 (pTiK27)k: K128 (pTiK309)
f to j: Isolates recovered from soil inoculatedwith K377 (pTiK27). Isolatesin lanes f, h and i have lost pTiK27 andisolates in lanes f and i have lost pRP4.
a to e: Isolates recovered from soil inoculatedwith K128 (pTiK309). Isolateshave all retained pTiK309 (confirmedby checking octopine catabolism).
Arrows indicate:
1. pTiK3092. pRP4
3. chromosomal DNA4. pTíK27

<-4
Ø
1+2-3>

34
Systemic infestation: When vascular samples were taken from vines by the vacuum-
flush method (described in Part A, Materials and Methods), only biovar 3 strains
were detected at months 3 to 6, albeit at very low levels (102 cfu/10 cm intemodal
stem section). Biovar 3 suains were isolated only from treatments which had been
inoculated with K309 ,K377 andK377 (pTiK27). It is unlikely that these were
contaminants already present in the vines because they were not detected in any of the
biovar 2 treatrnents.
Bur et al. (1987b) demonstrated that biovar 3 strains can form root lesions
and this may be the first step in systemic infection. However, in this work, no root
lesions were observed in any of the treatments but this was not the primary focus of
the study. Also, no galls were formed in any of the treaünents although all isolates
except K128 are pathogenic to some extent on vines.
The conclusion to be drawn from these experiments is that the Ti-plasmid has
no influence on the colonization of either almond or grapevine by biovar 2 or biovar
3 strains. Any apparent contradictions can be explained by instability of ttre Ti-
plasmids in reciprocal transconj ugants.
4.5 Colonization of Nopaline Galls
The results presented in this section were obtained in Almond Experiment 3
(Table 3A). The purpose of the experiment was to determine if there was a
quantitative difference in the colonization of galls containing nopaline by strains of the
same chromosomal background which differ in their ability to catabolize nopaline.
Galls were formed on almond roots by the biovar 2 strain K27.T}:re colonization of
the galls by two biovar 3 strains, K309 (an octopine süain) andK377 (a nopaline
strain), was compared.
Figure 124 shows the colonization over a S-month sampling period of strains
K27,K3O9 andK377 both on and in nopaline galls induced by K27.Bactenal.
numbers inside and on the surface of the gall followed similiar patterns; levels of l(27

Figure 124. Colonization of: i) nopaline gall surfaces and
ii) inside nopaline galls on almond roots. Galls
were incited by strain K27 anddata were
obtained in Almond Ex. 3. Data are presen.ted
in Appendix C, Table AC-4. Plants were
inoculatedin February.

log
cfu/
cm
'gal
l
oÌu
ÞO
)æ
3 o f J oc-
Ø A) 3 ro õ-
c-
E¡N
Ix^
xo)
(J) r
\)o{
\¡(o
{

iÐ 8
4
2
0
6I K27ø K377El K3oe
:(õo)tE()fC)(')o
AA MJJmonth of sample
35
on the gall surface in all treatrnents remained extremely high (106 cfutcr& gall) and
inside the gall increased rapidly from April to May (up to 107 cful "t¡3 gall). It should
be noted that numbers of K27 on the gall surface were lO-fold more numerous than
those on the root surface (data not shown). Table 124 shows the increase in gall
weight during the initial months of the experiment and it is interesting to speculate on
whether the increase of K27 inside the gall may be due to an increasing amount of
nopaline in the gall environmenl
The two biovar 3 strains, K309 andK377, displayed distinctively different
patterns of colonization both on and in the galls. The nopaline-catabolizing strain,
K377, showed a large increase in May on the gall surface and in May and June inside
the gall. During this period K377 attained numbers comparable to those of K27 but
then dropped to a level comparable to that of the non-nopaline utilizing biovar 3
srrain, K309, which maintained levels of 105 cfu/cm3 gall or less inside the gall for
the entire sampling period. It is tempting to associate this difference in numbers of
biovar 3 strains (signif,rcant in May and June at P< 0.05) with the availability of
nopaline in the galls and with the ability of K377 to catabolize nopaline. This would
then provide preliminary evidence in support of the opine concept.

Table 124. Gall weights: Almond Ex. 3
Month
April
May
June
July
August
Mean fresh weight of galls (g)
Treatments:
Kn K27 + K309 K27 + K377
.04 .r2 .45
0.94 1.70 1.76
4.47 2.45 1.60
0.26 3.54 3.65
t.33 12.78 8.03
1- Almond Ex. 3 is described in Table 34. Galls were formed by inoculation withI{27 andthen plants were dipped in 1:1 suspensions of K27 and the treaûnent strains.Procedures for sampling are described in Part A, Materials and Methods.
2- No significant differences were found between means at each month when datawere analysed by one-way ANOVA.
36
PART A: DISCUSSION
1) Methods and anal]¡sis
The ability of soil-borne plant pathogenic bacteria to colonize the rhizosphere
is essential for their survival and for their ability to cause disease. Therefore it is
important when studying the pathogenic process to find ways of accurately
quantifying bacterial populations on plant root systems. There is no conventional
method for sampling bacterial populations and the approach varies widely, making it
difficult to compare the results of different studies. In some cases entire root systems
constitute the sample unit (Bushby,1981; Mendez-Castro & Alexander, 1983) and in
others the root system is suMivided into segments (Kloepper,1983; Kloepper &
Schroth 1981; Kloepper et al., 1980b; Vy'eller, 1984). In this study, "roots" were
subdivided into three categories- the crown area, the main taproot and lateral roots
without secondary thickening. This was done in order to minimize error due to the
uneven distribution of bacteria on root surfaces which has been noted in electron
microscopy studies (Newman & Bowen,1974; Rovira,1956; Rovira & Campbell,
I974). An effon was made to sample from the same relative locations each time.
Variances obtained in untransformed colonization data were uniformly high
and positively skewed. This indicated that the untransformed data did not satisfy one
of the basic assumptions underlying the analysis of va¡iance test i.e. that variances be
normally distributed. When data were log-transformed, a normal distribution of
variance was obtained. Other workers (Hirano et al., 1982) have found that
populations of epiphytes on a leaf surface were most accurately approximated by a
continuous lognormal distribution. The work of Loper et al. (1984) extended this
finding to rhizosphere bacterial populations. In the latter work, it was commented that
the reason for the appropriateness of a lognormal model was the multiplicative nature
of bacterial growth- any change in the numbers of a bacterial population is
proportional to the bacterial numbers already present. In their f,reld study of
Pseudomonas populations, l-oper et al. (1984) found very large variances and the
need for adequate replication was stressed. Variation in the work presented in this

Because of the level of replication required to carry out this type of experiment,
only a limited number of strains representative of each biovar were tested. 'fhere may be
significant differences between individual strains within a biovar and these were not
observed in this study. Throughout the discussions, conclusions are drawn about
differences between biovars but it should be stressed that these conclusions are based
on data from a limited number of strains.
:
I
i'
I

37
study \ilas not as high, probably because of the more controlled nature of pot
experiments. Generally differences of 1.0 log unit were needed in order to obtain
significant treatment differences with 95Vo confidence.
Variation of bacterial numbers on stem surfaces near the crown tended to be
higher than on the root, possibly due to moisture and temperature fluctuations in this
region. Numbers in the initial samples a¡rd in samples taken towards the end of 12
month experiments also tended to be more variable, the former probably due to
va¡iation in the amount of initial inoculum received by each toot system and the latter
possibly due to an increasing microflora and the increase in nonrandom differences
between pots with respect to temperature, shading effects, fertilizer trea¡nents etc.
accumulated over the 12 month period. The use of non-sterile soil for all experiments
may have increased variation betr¡¿een replicates but it was used in an attempt to
approximate field conditions. Because the almonds were germinated from seed, there
was a certain amount of genetic variation between almond seedlings; vines, on the
other hand, were all of a single clonal type. Differences were observed between
individual experiments in the actual numbers of bacteria achieved though relative
differences benveen treatments were consistenl The differences between separate
experiments \pere probably due to differences in soil microflora and in soil
temperatures in different years. For example, the marked decrease in biova¡ 3
populations on vines observed in months 3 and 4 in Vine Ex. 1 was not noted in Vine
Ex. 2 though populations in the latter were still low and the relative differences
between biovars 2 and 3 were consistent between experiments. The fact that
consistent signifrcant differences were observed in experiments of this type is
testimony to ttre large differences that exist between these bacterial strains in their
colonization of root rr.,.l*ìTÍ?rder to detect more subtle differences between
strains, increased replication would be required and a rigidly controlled sampling
procedure developed so that more uniform root segments were sampled. Factors such
as the number of emerging lateral roots and number of lenticels, wound sites etc. all
must have an impact on colonization levels and would have to be taken into account.

38
Many workers have expressed bacterial populations in tenns of 'cfu/ g root'.
In this study ¡oot surface area was used in preference to root weight because root
weight was felt to be inadequate when comparing different types of roots e.g. fine
lateral roots versus a taproot. Because it is the root surface and not the root as a whole
that is being colonized, estimating root surface area, although somewhat crude,
should give a more realistic assessment of bacterial numbers in the rhizosphere.
The use of selecúve media to quantify bacterial numbers in each sample was
chosen in preference to serology. Serological groups in Agrobacterium a¡e not well-
characterized and serological tests in this study indicated that the biovars are
serologically heterogenous (see Part B). The use of antibiotic resistant mutants was
also avoided due to the possibility of changes in rhizosphere competence by mutants.
This phenomenon has been noted with rifampicin-resistant mutants in Rhizobium
(Lewis eta!, 1986). The use of antibiotic resistance for the construction and recovery
of transconjugants was unavoidable and it is possible that it had some effect on their
recovery. Selective media for biovar 3 were compared and the medium of Roy and
Sasser (1983) was found to be more appropriate. Inaccuracies may arise with the use
of selective media in their relative eff,rciency of colony recovery from soil and growth
of contaminants can be a problem on some selective media. Throughout the
experiments bacteria were randomly selected, rechecked for opine catabolism,
checked on alternate selective media and for plasmid makeup to ensure that the
inoculated isolate was being enumerated.
2) Agrobacterium colonization of almonds and vines
Very little work has been done to date on the colonization of hostplana by
Agrobacterium species. Studies by Schroth et al. (1971) looked largely at disease
incidence in a nursery situation and at ratios of pathogenic and nonpathogenic isolates
in the soil. Dickey (1961) examined the effect of a variety of soil factors on
Agrobacterium survival. Neither study distinguished between different species of
Aerobacterium. Several studies have stated that Agrobacterium is a normal

This difference in numbers cannot be attributed to galls formed by biovar 2 and
not by biovar 3 because the nonpathogenic strain Kl28 also maintained. high
populations on ungalled almoncl roots.

39
rhizosphere inhabitant with an ability to survive for long periods in the soil ( Patel,
L928;Patel,l929; Hildebrand, 1941; Dickey, 1961; Schroth et al., l97I).
In all the experiments performed in ttris study, there was a striking difference
between the relative ability of biovar 2 and 3 strains to colonize the root system of
almonds. Biova¡ 2 consistently colonized almond roots at levels at least 100- fold
higher than biovar 3 and levels of biovar 2 on almond were 10- to 100- fotd higher
than they were on vines. (;"s.nL)
Numbers of biovar 2 on almond roots dropped drastically in month 5 and the
data indicates that this drop could not be attributed to secondary thickening of the
roots but was in fact due to an absolute decline in Aerobacterium numbers. This may
have been at least in part due to the increase in soil temperatures as the decrease
coincided with the onset of the hot South Australian suÍrmer and AÊrobacterium
intolerance of hot conditions has been noted by Dickey (1961). In his work on
nursery populations of biovar 2 on almond, New (L972) also found that there were
no significant differences between bacterial numbers on roots with and without
secondary thickening. The numbers achieved by biovar 2 atthe height of its
colonization of the roots were comparable to those found by New around galled
almond trees in a nusery (106 to 107 biovar 2l gtoot).Both New (1972) and Shim
et al. (1987) suggest that absolute numbers of pathogenic isolates early in the season
may be important for gall formation and data presented in this study lend support to
that suggestion. Certainly the ability of an isolate to form a gall in vitro is not enough
for the formation of a gall in a natural infection, confirmed by the low pathogenicity
on almonds of the biovar 3 transconjugant carrying a biovar 2 Ti-plasmid in this
study. The delivery of the Ti-plasmid to the root by the bacterial chromosome in
sufficient numbers for infection would appear to be as much a determining factor in
pathogenicity as the presence of a Ti-plasmid capable of infecting that host plant. The
low pathogenicity of transconjugants and their restricted host range suggests that the
chromosome may play a part in the transfer of the Ti-plasmid to the plant cell.

40
The association between biovar 2 and stonefruit manifests itself in the high
levels of root colonization achieved by biovar 2. The highly specific interaction
between biovar 3 and grapevine appeals to be due to biovar 3's unique mode of
colonization. Actual levels of biovar 3 on grapevine roots were comparatively low
even in the period shortly after inoculation. Burr et al. (1987b) describe biovar 3 as a
'rhizosphere organism'; it would be diffrcult to completely agree with this statement.
From Burr's work on lesion formation by biovar 3 and from the evidence presented
in this study and those of others (Lehoczky, 1968; Burr & Katz,1983; Bu¡r &Katz,
L984; Tarbah & Goodman, 1986) that biovar 3 is able to colonize grapevine
systemically, it is possible that biovar 3 actually colonizes wound sites on the roots
(and susequently the lesions it forms at these sites) but is not necessarily efficiently
colonizing the vine root system as a whole. Biovar 3 is'rhizosphere-stimulated'to the
extent ttrat it survives around the root system at a higher level than it does in interrow
or fallow soil. Survival in both is very poor (Burr et al., 1987b; Bishop et al.,
unpublished data). Bishop et al. also demonstrated that biovar 3 survival in the oat
rhizosphere was higher than that in fallow soil and that survival in the vine
rhizosphere was higher than either of these. However, results from this study show
that biovar 3's ability to colonize vine roots is no bener than its ability to colonize a
'non-host' such as almond. It is tempting to speculate that because of the poor
saprophytic ability of biovar 3, under certain conditions (as yet undetermined) it
aggressively colonizes wound sites to form the sunken lesions through which there is
circumstantial evidence (Burr et al., 1987a) that it can colonize the vine's vascular
system. The results presented in this study show the systemic movement of a biovar 3
süain containing a biovar 2 Ti-ptasmid, demonstrating that colonization of the vine's
vascula¡ system is not associated with the biovar 3 Ti-plasmid. Burr et al. (1987b)
showed that both pathogenic and nonpathogenic biovar 3 strains were capable of
forming root lesions which indicates that lesion formation is also not Ti-plasmid
coded. It was puzzling that no galls were fomred on vines by proven grapevine-
pathogenic biovar 2 and3 isolates. It may be possible that agrobacteria must colonize
4l
vines systemically in order to form tumours and that not enough biovar 3 were
present in the vines in these experiments for this to occur. The numbers of biovar 3
isolated from stem segments were low in this study but wefe comparable to those
obtained by Tarbah and Goodman (1986). The conditions necessary for systemic
entry are unknown and it is possible that the conditions in these pot experiments were
not conducive to lesion formation and systemic movement. A correlation between
frost damage and crown gall has been observed (Burr, 1978; Lehoc*y,1978) and it
is possible that wounding due to low-temperature injury may facilitate systemic entry
of the bacteria. The ability to catabolize târtrate may be important in the ability of
Agrrobacterium to colonize grapevine, given the lack of ability of chrysanthemum
biovar 3 isolates to utilize taftrate (Bazzi & Rosciglione, 1982) and the ability of
biovar 1 and 3 vine isolates to do so. Ta¡trate catabolism is chromosomally-coded in
the isolates tested in this study but has been shown by others (Gallie et al., 1984) to
be coded for by a unique plasmid, pTAR, in some biovar 1 strains. It is interesting to
speculate on the origin of pTAR; perhaps biovar 1 acquired these genes in order to
extend its host range to grapevine. However, biovar 2 strains a¡e also able to
catabolize tartrate and, although ttrey are capable of colonizing vine roots as efficiently
as biovar 3 and they carry Ti-plasmids which are capable of infecting grapevine in
yitrg, biovar 2 arerarely found in grapevine galls (Peny & Kado,1982, Burr &Katz,
1983, Burr & Katz,1984). Biovar 1 strains can be found at low levels in the
grapevine vascular system (Burr &Kat2,1984) but never biovar 2. In this study,
biovar 2 srains were never isolated from systemic samples. Once again this points to
the essential importance of the ability of the bacteria to become systemic in grapevine
for a successful infection to occur. It is important to note that Burr et al. (1987b)
observed that biovar 3 strains could not form galls in artificial inoculations of vine
roots but could do so on grapevine shoos. Clearly there is a large amount still to be
understood but the data presented in this study and by others indicate that the
chromosomally-coded traits of lesion formation and movement into the vascular
system may be important in the infection process on vines. There is much interesting

42
\4rork to be done on the genetics of the infection process and on the factors leading to
actual plant cell transformation and gall formation once the bacteria have invaded the
vascular system of the vine.
In practical terms, the information available from this work and that of others
suggests that the soil is not the primary source of inoculum for grapevine infections
and that control methods should be targeted at detecting pathogenic biovar 3 in new
planting material. Cïown gall on grapevine has been vfutually unknown in South
Australia until very recently and it seems possible that inoculum is coming from
imported infected vines and not from the soil (unpublished data). The importance of
soil inoculum has not been established but the demonstated poor ability of biovar 3 to
survive in soil suggests that it may be much less important than the systemic bacærial
inoculum. From the work of Bur et al.(1987c), it appears that the bacteria cannot
move into young shoots so green tip propagation appears to be a promising way to
obtain clean planting material, even from infected vines. The poor survival of biovar 3
in soil observed in this study suggests that reinfection from soil inoculum would be
low although this must be shown experimentally. The number of bacte¡ia in the
vascular system required for infection must also be determined. Once detection
methods and levels are determined control of grapevine crown gall may be relatively
easily and inexpensively achieved.
3) Ti-plasmid and chromosome interactions
Because of their conjugative nature (Kerr, 1969; Ken,lg7l) and because all
Ti-plasmids studied to date belong to the same incompatibility group, Rh-1
(Hooykaas et a1.,1980), they would appeil to be completely transferable betr¡veen the
different ch¡omosomal backgrounds of Agrobacterium. Yet at the same time, Ti-
plasmids show tremendous genetic diversity ( Currier & Nester,1976;Perry &
Kado,1982; Sciaky et al., L978; Knauf et a1.,1983; Thomashow et a1.,1981) It is
evident that, although plasmid transfer is relaúvely easily achieved in vitro, in nature
there are specifrc plasmid types associated with each biova¡. Biovar 2 strains virtually

43
always contain nopaline Ti-plasmids and biovar 3 generally carry either wide- or
na¡row-host mnge octopine plasmids. Nopaline Ti-plasmids have been found in
biovar 3 sgains (Knauf et a1.,1983; this study) but are relatively rare and have only
very low homology with their biovar 2 counterparts. Octopine plasmids isolated from
biovars 1 and 3 also have very low (6 to l5%o) homology to each other (fhomashow
et a1.,1981; Knauf et a1.,1983). Therefore, there is a strong correlation between
distinct Ti-plasmid types and their ch¡omosomal backgrounds.
V/ork presented in ttris study suggests that there may be selection at the level
of the bacterial chromosome for particular plasmid types and that there are differences
between ch¡omosomal types in the stringency of that selection. The difference
between plasmid stability of the biovar 2 and 3 reciprocal transconjugants described in
this study in vivo compared with in vitro suggests that there also may be host plant
effects on this selection. The work of V/ang et al. (1986) with Rhizobium suggests
that there is selection by the plant on the plasmid-borne host range genes. That study
also suggested that some host plants were more 'discriminating' in this respect than
others and that selection for particular genes became stronger with successive
passages on the plant. The greater loss of the 'grapevine' plasmid, pTiK309, from the
biovar 2 strain K128 on almonds (807o) than on vines (307o) suggests that there was
selection against pTiK309 on almonds. It is difficult to make too many claims in this
regard but there is, at the least, selection by the biovar 2 chromosome against the
'foreign' biovar 3 plasmid in vivo. The host plant must have some effect on this
process because no plasmid instability was observed in this strain in vitro through
successive subcultures. Biovarl transconjugants which were isolated from grapevine
and found to contain biova¡ 3 Ti-plasmids were unstable in vitro (C.G.
Panagopoulos, personal communication). It could be suggested that the grapevine
host was positively selecting for a'grapevine'plasmid and when this selection was
absent, the Ti-plasmid was rejected. Strain K377 (pTiK27) was relatively stable in
vivo on both vines and almonds in this study. It is possible that some bacterial
44
chromosomal backgrounds or some host plants a¡e less stringent than others in
selecting for aparticular genome.
Knauf et al. (1984) observed that, although pTiA6 and pTiAgl62 are in the
same incompatibility group, the presence of the A9162 incompatibility region on a
cosmid resulted in a rate of establishment in A6 which was 104 lower tha¡r for
cosmids without the region. They termed this phenomenon'one-way
incompatibility'. It is evident that, despite the common incompatibility group of Ti-
plasmids, their acceptance in an Agrobacterium cell may be a more complex process.
Blocking the entry of some plasmids may be a way by which specific Ti-plasmid/
chromosome associations a¡e sustained. Perhaps the more limited host range biova¡ 3
plasmids, such as pTiAg162, are less promiscuous than thei¡ wide host range
counte{parts. The decreased virulence observed in this study of a biova¡ 2 strain
carrying a biovar 3 Ti-plasmid, pTiK309, and its low stability in vivo was
presumably a result of the poor replication and establishment of that plasmid in its
new background.
There was evidence throughout the experiments that plasmids in all
transconjugant strains re-isolated from soil were not completely stable. It would be
interesting to carry out a more controlled set of experiments to study plasmid stability
in vivo and to compare wild-type and transconjugant strains on host and non-host
plants. It is likely that some regions of the plasmid would be highly conserved but
genes involved in host range determination may be quite dynamic in vivo.
The Ti-plasmid has been shown to be the primary determinant of host range in
Agrobacterium (toper & Kado,1979; Thomashow et a1.,1980; Knauf et aI.,1982;
Unger et a1.,1985). The Ti-plasmid of the limited host-range grapevine strain, A9162,
has been mapped (Knauf et a1.,1984) and, in a comparative study of the plasmid of
that strain and a wide host-range plasmid, pTiA6, the involvement of cytokinin
biosynthetic genes in the T-DNA and two of the vir loci, virA and virC, in host range
determination was demonstrated (Yanofsky et al., 1985a;1985b). Yanofsþ et al.
(1985) showed that successful plant cell transformation by the wide host range
45
plasmid pTiA6 required the introduction of both the auxin and cytokinin loci. In
contrast, the timited hostrange plasmid appeafs to be defective at the c¡okinin
biosynthetic locus and it was suggested that plant hosts susceptible to infection by this
strain may have endogenous cytokinin levels high enough to ove¡come the deficiency.
The virA and virC loci also play a role in limiting host range and the role of virC may
be to control the number of T-DNA copies transferred to the plant cell (Yanofsþ et
al., 1985b; Yanofsþ & Nester,1986). Possibly some plant species may require
d.ifferent copy numbers of T-DNA for tumour formation to occur.
Obviously Ti-plasmid genes are essential in the determination of host
specificity. Data presented in this study have also shown chromosomally-encoded
host specificity. If there is indeed a much closer relationship betrreen specific
chromosomal and Ti-plasmid types than has been assumed then this would suggest
that there are 'layers' of host specificity with the host plant selecting for chromosomal
types which in tum are selecting or selected by'host-compatible'Ti-plasmids'
Data from Almond Ex. 4 and from Vine Ex. 2 comparing wild-type and
transconjugant s6ains on non-galled root systems, indicate that the Ti-plasmid has a
negligible effect on initial root colonization. For example, numbers of transconjugant
strain I¡377 (pTiK27) were comparable to those of its wild-type background and it
did not appear to be any more'ecologically competent' on almonds as a result of
carrying a biovar 2 Ti-plasmid. This result is similiar to that obtained in a study of the
effect of the Sym plasmid on the competitive ability of Rhizobium in the legume
rhizosphere (Brewin et al., 1983). In that investigation the plasmid had no effect on a
strain's colonization of the legume root surface. The situation of the biovar 2 strain
carrying a biovar 3 Ti-plasmid was more complex due to the considerable plasmid
loss in this strain. Because of this, strain K128 (pTiK309) as a whole was much less
ecologically competent.
46
4) Role of the opines in nature
The opine concept has been proposed by several authors (Petit et al., 1978a;
Tempe eta1]., 1979; Guyon eta!, 1930). This concept proposes that the main reasons
for the existence of the Ti-plasmid are the opine synthesis and catabolism functions.
By directing the plant to produce opines for its benefit, the Ti-plasmid is ensuring for
itself a selective advantage over non-opine catabolizers and, through the conjugative
functions of the opines, ensuring iS own propogation. To date there has been no
ecological data to support this proposition.
Data presented in this study show initial evidence in support of the opine
concept. In colonization studies on almond galls, two biovar 3 strains, K309 and
K377,which rwere not different from each other in their colonization of almond roots,
were signifrcantly different in their colonization of nopaline galls. The nopaline-
catabolizing strain, K377,was more numerous than K309, an octopine strain, both
inside and on the surface of galls. However, K377 did not maintain the high
population levels and its decline could be attributed either to the competitive effect of
the biovar 2 strain, KZJ, or to the demonstrated inability of biovar 3 strains to survive
at high levels in the rhizosphere.
Data obtained in Part A point to a model where the bacterial chromosome is
completely responsible for the early interaction with the plant root. Chromosomal
genes appear to determine both the level and the mode of colonization of the plant
host. The bacterial chromosome may have a significant amount of control over the
type of Ti-plasmid it caries given the specific associations between Ti-plasmid types
and Agrobacterium biova¡s. The Ti-plasmid is important after bacterial colonization of
the roots when, by inciting gall formation and subsequent opine synthesis, it then
exerts a con¡olling influence on the level of colonization through the expression of its
opine caøbolic functions. Other plant root exudates are likely to be important in the
early stages of colonization. Although acetosyringone has been shown to induce a
chemotactic response from some agrobacteria (Shaw, 1986), this may not tle the case
for all plant hosts or agrobacteria. It is likely that other exudates play a role in plant-

47
bacterial specifrcity. For example, tartrate may play a role in bacterial establishment on
the grapevine. The plant and bacterial factors involved in the formation of root lesions
by biovar 3 are completely unknown at present. Endogenous cytokinin and auxin
levels in the plant host appeü to be at least partially responsible for the host-specific
infection process and the opines produced as a result of infection then play a crucial
role in determining numbers of bacteria on galls.It remains to be shown whether the
conjugative role of the opines provides opine-catabolizing agrobacteria with a
selective advantage. It would be interesting to determine the amount of in vivo Ti-
plasmid transfer and its importance in the survival of the bacteria and on the level of
infection.
In summary, there appears to be a type of symbiotic relationship between the
Ti-plasmid and bacterial chromosome. The Ti-plasmid benefits from the
chromosome's ability to specifically colonize the plant host.In turn, the chromosomal
background benefits from gall formation by the Ti-plasmid because of the opine
substrate that they induce. This is an extension and affÏrmation of the opine concept
and the genetic colonization theory of Schell (1978; Schell et al. ,1979).
Many authors are beginning to view plasmids as discrete organisms (Datta,
1985). It is interesting to speculate on the evolution of the Tiplasmid/ chromosome
relationship in Aerobacterium in this light. Large numbers of nonpathogenic
agrobacteria can be found in natural, undisturbed soils (Bouzar & Moore, 1987).
Perhaps this nonpathogenic, nonspecific state is the'ancestral form'of
Agrobacterium and the Ti-plasmids have in fact'colonized'these nonspecific
chromosomal forms. The plasmid and chromosomal types have then co-evolved, in
the presence of the host and both plasmid and chromosome a¡e host-specific. This
would explain the very low homology between the different Ti-plasmid types and
between the different biova¡s of Aerobacterium and the amount of host specialization
found within the genus.
48
PART B : TAXONOMY OF AGROBACTERIUM ISOLATES FROM RUBUS
AND GRAPEVINE
INTRODUCTTON
Four species of Agrobacterium are described in the 1984 edition of Bergey's
manual- A. tumefaciens, A. radiobacter, A. rhizogenes and A. rubi (Kersters &
Deley,1984). It is recognized by many authors (Del.ey et a1,1966; Keane et
aL.,1970; White,1972; Kersters et a1.,1973; Holmes & Roberts,1981; Kersters &
Deley,1984) that this classification is inadequate. A. tumefaciens, AdfZ@S, and
A. radiobacter differ only in the presence or absence of a tumour-inducing (Ti) or
root-inducing.(Ri) plasmid, which is transferable benveen strains (Van Larebeke et
a1.,1975; Vy'atson et a1.,1975; Albinger & Beiderbeck,1977; Moore et al., 1979).
Therefore, species definitions are presently based solely on a highly unstable
characteristic. Suitable changes to the genus are unfornrnately very diff,rcult to make
because of the rules of bacterial nomenclature (Kersters & Det ey,1984) but it is
agreed that there are at least two well-def,rne{ distinct groups which can be separated
on the basis of chromosomally-coded characteristics, regardless of
phytopathogenicity (Deley et a1.,1966; Keane et a1.,1970; White,t9lZ; Kersters et
a1,L973; Kerr et a1.,1978; Holmes & Roberts,l981; Kersters & De[,ey,1984). These
two groups are considered separate species- A. tumefaciens and A. rhizogenes- by
some (Holmes & Roberts,l981) and different biova¡s or clusters by others (Keane et
a1.,1970; Deley et al.,1973; Kersters et aI..1973).
The position of other Agrobacterium isolates is less clear. The species
Agrobacterium rubi was described by Hildebrand (19a0) and at present only three
strains are included in A.rubi: TR3, TR2 and EU6. These are classified as a separate
species based on thefu low DNA homology with biovars 1 and 2 and their high
homology with each other (Kersters & Deley,1984).Isolates from grapevine have
been charactenzeÃas a separate group, biovar 3, which can be readily distinguished
phenotypically from biovars 1 and 2 (Kerr & Panagopoulos,l9T1; Panagopoulos et
49
a1.,1978; Sule,1978). Isolates from chrysanthemum have also been classified as
biovar 3 (Baz:zr & Rosciglione,1982). The relationship between these biovar 3
isolates and A. rubi is unclear. In a numerical taxonomic study, Holmes and Roberts
(1981) grouped the A. rubi type strain, TR3, with several biovar 3 isolates from
grapevine. However, DuPlessis et al. (1984) found differences between the same
grapevine isolates and the A. rubi strain, TR2, in a study of their protein
electrophoretic patterns.
The purpose of the taxonomic section of this work was to clarify the
relationship of the grapevine and Rubus isolates to the well-defined biovars I andZ.
Relatively recent isolates from both these groups have been used in this study and
compared in their growth characteristics, pathogenicity, opine utilization and their
reaction to a vadety of standard bacteriological tess. Numerical analysis of the
phenotypic data was performed. In addition, isolates have been compared with
respecr to their DNA homology as well as by serological methods. Throughout the
work, isolates conforming to the descriptions of biovars 1,2 and 3 are referred to as
such. The isolates from Scotland (see Table 18) are referred to as the Rubus cane gall
isolates and only the three strains TR2, TR3, and EU6 which presently comprise the
species A. rubi (Kersters & Deley,1984) are referred to as such.

50
PART B: MATERIALS AND METHODS
a) Bacterial strains and culture conditions
All strains used in taxonomic studies and their sources are listed in
Table 18. Bacteria were maintained on nutrient agar (NA) or yeast extract (YE) agar
at 28oC for short-term storage. Isolates in the A. rubi goup were maintained on YE
agar with the growth factors biotin (100 pgl100m1), nicotinic acid (20 pg,/100m1) and
calcium pantothenate (20 pgll00ml). Bacteria were maintained as lyophilized cultures
at 4oC for long-term storage. All culture media are described in Appendix A and
buffers and solutions are described in Appendix B.
b) Pathogenicity tests
The method used for pathogenicity testing is described in Part A,
Materials and Methods. The Rubus isolates were glown on YE agar with added
growth factors (see 'Culture Conditions'). Plants used in the taxonomic paft of this
work were those described in Pa¡t A as well as blackberry ßubus L. cv.
'Silvan')(McGregor & Kroon, 1984), boysenberry (Rubus L. cv.'Boysen') and
raspberry (Mus i¿eaus L.). For pathogenicity testing on boysenberry, inoculations
were made into the woody stems of the plants. Holes were drilled into stems using a
cordless ddll with a 1 mm bit and inoculations were made into the resulting hole using
a Pasteur pipette full of a turbid (109 cells/ml) suspension of the test strain. Results
were recorded afterlO weeks for all inoculations on raspberry, boysenberry and
blackberry.
c) Opine synthesis and catabolism
The presence of opines in gall tissue was confirmed by high voløge
paper electrophoresis GIVPE). Fresh sections of gall tissue (1 cm3) were macerated
in 500 ¡r.l to 1 ml of 70Vo erhanol. Samples were centrifuged for several minutes in an
Eppendorf centrifuge and 10 pl of the resulting supernatant was spotted directly onto

Table 18. Strains used and their origin
Srain CIher Grouping2designations
NCPPB 24373 ICPB TT3ATCC 23308
Biovar I
NCPPB 1OO1
c58Kl87
Isolaæd from Pathogeniol
I $apevlne
sall"gall
this study$uìpel¡rne
Í
Rubus cane
Rubus canegalls
A. rubi Euonymous gall
Additionalinformation
Braun's isolateB6
Romania,1952
A6
South Aust¡alia
South Australia
see Part Aex. T. Burr
Í
yes
yes
yesyes
yesyesfn
yesyesyesyesyesyesyesyesyesyesnoyesnoyesyes
yesyesyesnoyesyes
tnyesyes
yes isolatedBraun, 1
il
ATCC rß254K27K84 NCPPB 2407
scRr 509scRr 5rTscRr 518
NCPPB T856TR3TR3
Biovar
Biovar
A. rubi
Íti
2
3
peachpeach
K305K306K308K309K374r375K376K377K252K253
1(377DTi-cô 49
cG 484CG992K1059
grapeune
As57AES4
lrÍll
lr
sqlsÍltÍ
K864
K870K871K872
TR2NCPPB T8545ATCC 133355
EU6
K868K869
isolated atScottish Crops
Rese¿rch '.Institute
usA,1942
by950
181 - Yes from JJemPé,
ies grouping
3335 were received directly fromthe reçectivetype culture collections.

In some cases, the opine utilization test described by Lippincott et al. (1973) was
used in conjunction with the test for growth on solid medium, if the results on the latter
were not clear.

51
Whatman No. I paper. The apparatus of Tate (1968) was used and alt runs were
performed in 0.75 M formic acidll M acetic acid, pH 1.7 buffer at 3000 V for 15
min. Orange G was used as a reference standa¡d with an arbitrarily assigned relative
mobility (MO.C) of 1.0. The following detection reagants were used: alkaline silver
nitrate dip (frevelyan et al., 1950), modifred phenanthrenequinone reagant (Yamada
& Itano,1966), the Pauly reagant for imidazoles (Ames & Mitchell,1952), and the
xylose-aniline reagant (Smith & Spriestersbach, L954). Table 28 liss the opines
detected in this study, their detection reagants and their M9.6. at pH 1.7.
The minimal medium of Petit et al. (1978b) was used to test opine catabolism.
Filter-sterilized opine solutions (pH 6.0 in double-distilled water) were added to a
final concentr¿tion (w/v) of 0.2Vo when opines used as the sole source of carbon and
nitrogen or to 0.O47o when a carbon source (0.57o mannitol) was included. Fresh
cultures of the test isolates were streaked on the opine-containing media with positive
and negative control strains, incubated at 28oC and results recorded after 4-5days. ( trserà
Growth factors were included for all Rubus strains. Opines tested in this way were
octopine, nopaline, succinamopine and cucumopine. The former three opines were
synthesized by Dr. M.E. Tate in the Dept. of Agricultural Biochemistry. Crude extract
of a cucumber hairy root strain, positive for presence of cucumopine, was used in all
catabolism studies involving cucumopine.
d) Growth on selective media
The selective media used in this study are listed in Appendix A. All
plates were incubated at 28oC and results were recorded after 4to 6 days. Growth
factors (described below) were added for all tests involving Rubus cane gall isolates.
e) Growth factor requirement
The method used was based on that of Keane et al. (1970). Bacteria
from agar slopes were suspended in buffered saline, washed twice with sterile
distilled water and inoculated into broth containing either Petit's (Petit et al., 1978b)

Table 28: Common opines andtheir detection
Common name
Octopine
Structural name
Nopaline ¡2 -1t,3-dicarboxyt propyl)-L-arginine
Structure onlYpartially lnown2
fietection method(s)8
Alkaline silver nitrate4modifred phenanthrenequinone
reagant5
M -(o- t -carUoxyethYl)-L-arginine
1)2)
As above
Mo.c.1
-0.54
-0.45
-0.2rCucumopine
Succinamopine Xylose-aniline reagantT -0.04
1- MO.C. = Relative mobility to Orange G søndard in pH 1'7 buffer:-'
fi.O M acetic acid' 0.75 M formic acid)
2- Ryder, 1984
3- Chilton et aI.,1984a; 1984b
4- Trevelyan et al., 1950
5- Yamada andløno, 1966
6- Ames and Mitchell, 1952
7- Smith & SPriestersbach, 1954
8- detection after high.voltage paper electrophoresis (see Materials and Methods)
Pauly reagantfor imidazoles6

52
or Bergersen's (Bergersen,l961) salts, 17o mannitol and a source of nitrogen, either
with or without growth factors. Cultures \ilere glown for 4 days at 25oC on a rotary
shaker and results were recorded every 24 hours by measurement of optical density at
640 nm. Bacteria were also inoculated onto agil containing Petit's or Bergersen's
salts, 17o mannitol plus either a)O.47o NaNO3, b)0.4Vo NaNO plus 100 pg/100 rrìl
biotin, c) O.ZVo L-gtutamic acid plus 100 pgl100m1 biotin, d) O.2Vo Lglutamic acid
plus 100 ¡rg,/100 ml biotin, 20 ¡rg,/100 ml calcium pantothenate and 20 pglml nicotinic
acid. Plates were evaluated for bacterial $owth after 4 days'incubation at 28oC.
f) B acteriolo gical tests
3 -ketolactose Production
The method of Bernaerts and Deley (1963) was used.
Production of acid from carbon sources
The method of Haywardlg64) was modified to determine acid
production from dulcitol, adonitol, sorbitol, erythritol, melezitose and ethanol. The
indicator medium is described in Appendix A. Tubes were incubated at 25oC for 14
to 21 days.
Production of alkali from L-tarrate
The method of Ayers et al. (1919) was used to test for alkali
production from sodium(+)-tartrate. An alternate medium containing potassium
sod.ium tartrate was also used; both media are described in Appendix A. Tubes were
incubated at 25oC for 7 to 14 days.
Growth on 27o NaCl
Bacteria rwere streaked on nutrient agar with 2Vo (wlv) NaCl
added. Growth was evaluated after 48 h. at 28oC.
Growth at 379e
Bacteria were inoculated into 5 ml cultures of nutrient broth
amended with growth factors and were grown in a stationary water bath at 37oC.

53
Optical density (640 nm) was measured at 2l hour intervals and frnal results were
evaluated after 4 days.
Growth on aniline blue medium
The method of Riker et al. (1930) was used. Bacteria we¡e
streaked onto aniline blue medium (described in Appendix A) and the plates were
incubated at 28oC. Growth was evaluated after 24to 48 hours and reactions were
classified as Type 1 (white mucoid $owth with clearing of the medium) or Type 2
(blue, thin growth with no clearing of the medium).
g) Sensitivitv to agrocin 84
The method of Stonier (1960) was used to test for sensitivity of
isolates to strain K84.
h) Plasmid isolation and visualization
The method used is described in Section A, Materials and Methods.
i) Plasmid incompatibilitv
Strain 2-4 (see TablelA), containing a cloned fragment of the Inc
region of the biovar 1 strain, 46, was used in attempts to eliminate Ti-plasmids from
wild-type strains. This method is described in detail in Part A Results, Section 4.3 .
Transconjugants rwere screened by gel electrophoresis for loss of the Ti-plasmid and
acquisition of plasmid containing the Inc clone. Loss of the Ti-plasmid was further
confinned by checking pathogenicity on a suitable host plant.
j) DNA melting points
The midpoint of the thermal denaturation profile (Tm) was
determined by the method of Mandel and Marmur (1968) for selected strains. All Tm
determinations \ilere made on a Beclcnan DU-8 computing spectrophotometer. DNA
(see below for method of preparation) at a concentration of 50 to 100 pyml in 1 x

54
SSC was loaded into prewarmed (75oC) cuvettes. The temperature was raised in loC
increments to 90oC and in 0.2oC increments to102oC, with an interval time at each
temperarure of 2.2min. A blank containing 1 x SSC and a cuvette containing the type
strain for biovar 1 (NCPPB 2437) were included in each run. All Tm determinations
were made in triplicate. The ratio of absorbance at a given temperature over the initial
absorbance for each sample was plotted versus temperature and the midpoint of the
melting profile was determined graphically. The guanine plus cytosine (GC) content
of the DNA was determined from the equation: GC = (Tm - 69.3) 2.4. (Mandel &
Marmur,1968).
k) Growth rates
Relative growth rates were determined in both nutrient broth and
mannitol-glutamate (MG) b'roth (Appendix A) with and without growth factors (see
'Culture Conditions'). In nutrient broth, bacteria from 48 h cultures were added to
150 ml broth to give initial concentrations of 6 x 10⁶ celVml. Cells were gïown on a
rotary shaker atzsoc and 3 ml of culture were removed and the optical density (640
nm) measured every 2 hours for 42 hours, by which time all cultures hadreached
saturatron.
In mannitol-glutamate broth, bacteria from 48 h cultures were added to 150 ml
broth to give initial cell densities of 1.5 x 10⁵ cetls/rnl. Cultures \ilere grown as above
and optical density measured at th intervals for 5 days, by which time all culn¡res had
reached saturation. All isolates were tested at least in duplicate.
55
l) Serological studies
Preparation of anti gens
The method of Keane et al. (1970) was used.
Preparation of antisera
Antisera to strains K309, K377, and TR3 were prepared using
the method described by Keane et al. (1970). When antiserum titers dropped, 1 ml
booster injections were given intravenously and the rabbits were bled at7 tol4 day
intervals.
Tube agglutination tests
Successive twofold dilutions in buffered saline were made from
an initial serum dilution of'1:50 in buffered saline. Equal volumes (0.5 ml) of each
serum dilution and the bacterial suspension (108 ce[s/ml in buffered saline) were
mixed, incubated 3 h at 37oC and left overnight at 4oC before agglutination endpoints
were determined.
Gel diffusion tests
The method of Ouchterlony (1961) was used. Undiluted
antisera were added to central wells and turbid suspensions (9 x 10⁸ ce[s/rnl) of the
sonicated test isolates were added to peripheral wells.
m) Electron microscopy
Selected Agrobacterium strains were viewed by scanning electron
microscopy (SEM) and transmission electron microscopy (TEM) in order to
determine if flagella were present.
For SEM, two methods of sample preparation were compateÅ- freeze-drying
and critical point drying. For freeze-drying, 48 hour old cultures on YE agar plates
were flooded with SDW and left to sit at room temperature for t hour. The resulting
suspension was gently poured into tubes, centrifuged at 10009 for 15 min. and
resuspended in SDW. Samples were freeze-dried in a Centrifugal Freeze-Drying Unit

56
(Model CDl; Dynavac, Australia). For critical point drying, polycarbonate
membranes (0.22 m; Nuclepore Corp., USA) were floated for t hour on the surface
of plates which had been flooded as above. The membranes were then gently rinsed
with a gfaded series of I\Vo,4OVo,7O7o and 1007o ethanol; each rinse was for 5
minutes except for the two fînal rinses with 1007o ethanol which were for 10 minutes
each. The membranes were critically point dried immediately (CPD 750; Emscope,
UK) and stored in a vacuum dessicator until they were sputter-coated with gold
(Sputter Coater SC500; Emscope, UK) and viewed under a scanning electron
microscope (S tereoScan S E250 ; Cambridge, UK).
For TEM, grids were prepared in the following manner. Bacteria were grown
for 48 hours on Petit's minimal medium amended withD.2%o (NH¿)ZSO4 and 17o L-
glutamate or on YE agar. Formvar ca¡bon-coated grids (400 mesh) were floated for
60 minutes (or ovemight for biovar 3 srains) on the surface of the plates which had
been flooded with buffered saline. Grids were then transferred to LVo
phosphotungstic acid for 30 seconds and rinsed by flotation on sterile double-distilled
\¡/ater for 30 to 60 seconds. Grids were d¡ied on filter paper in petri dishes and
viewed under a transmission electron microscope (EM400; Philips, Australia).
n) Numerical anal)¡sis
The characters listed in Table 78 were used in the numerical
analysis. Results for'growth factor requirement' in both Petit's and Bergersen's salts
were coded separately. Results for all characters except aniline blue reaction and
growth at 37oC were coded as 1 for a positive reaction and 0 for a negative reaction.
Results for growth on aniline blue were coded as Typel or 2 reactions and results for
gtowth at3loc were recorded as final optical densities (640 nm) after 4 days
incubation. Numerical analysis was done on GENSTAT (Rothamsted Experimental
Sration, 1977). Strains were grouped by single linkage cluster analysis. Negative
matches were or were not inctuded as indicated. A minimum spanning tree was
constructed.

57
o) Motilitv
Motility was tested by three methods. Initially, isolates were viewed
under a light microscope in the hanging drop test. Bacteria were grown for 48 hours
on both YE agar and Petit's minimal medium amended tnth I7o Lglutamate and
O.27o (NLL¿)ZSO¿. Plates were flooded with buffered saline as described for TEM
and allowed to sit for t hour. A loopful of the resulting bacterial suspension was then
placed on a cover slip which was then inverted over a well in a glass slide. Slides
were then viewed under 100x magnifrcation.
Bacteria were also tested for motility by stabbing fresh cultures of each isolate
to be tested into a plate or tube of a) ll2} strength YE broth amended with0.3%o agar
or b) 1/5 strength Petit's agarplus LTol-ghutamate and O.2Vo (NH+)ZSO¿ amended
withO.37o agar. Plates and tubes were both assessed visually after 48 hours'
incubation rt25oC and, for plates, the diameter of the swarm was measured.
p) DNA Reassociation Studies
i) DNA preparation
For DNA extractions, bacteria from stock cultures were
inoculated into 5 ml YE broth, grown to saturation and inoculated into 500 ml YEB.
Bacteria were grown to late-loga¡ithmic phase and cells harvested by centrifugation.
DNA \ilas extracted and purified by the method of Marmur (1961), modified
to include O.ZVo Sarkosyl in the initial washing step and a deproteinizalon step using
proteinase K (200 pgrnl at 60oC for 45 minutes) before the addition of sodium
perchlorate. Ribonuclease was used at a concenration of 100 pglrnl.The purified
DNA was dissolved in 0.1 x saline sodium cirate (SSC) to a concentration of l-2
mg/rnl and was stored at 4oC with a few drops of chloroform. DNA was then shea¡ed
to an average fragment size of 400 to 800 base pairs by passing the DNA two to three
times through a French pressure cell at 12,000 to 15,000 psi. Fragment size was

58
confrmed by gel electrophoresis against a lambda Hind Itr marker (Fig lB). DNA
was quantified spectrophotometrically and ttre purity of each preparation ascertained
by measuring the 2601280 nm and 2ffi1230 nm absorbance ratios (Fig 2B). Before
use, fragmented DNA preparations were diluted to a concentration of 150 pgrnl.
Equal volumes of 4 x SSC and DNA were mixed to give final concentrations of 75
tlg/rnl DNA in 2 x SSC.
ii) DNA denaturation and reassociation
The method used was based on that of Deley et al. (1970). A
Beckman DU-8 tlV-visible computing spectrophotometer with a temperature
controlled sample holder and Tm Compuset Module was used for all reassociations.
Four or five cuvettes were filled with a blank containing 2 x SSC, DNA from each of
the strains to be compared and either one or two cuvettes containing a 1:1 mixture of
the two comparison strains. The wavelength was set at 260 nm with a read average of
4, an interval time of 60 sec between readings and a slit width of 1 nm. The cuvettes
were prewarmed to 75oC and the temperature was raised from 75oC to 90oC in
1oQ/min increments and from 90oC to 102oC in 0.2oclmin increments. All samples
were held at 102oC for 5 minutes in order to completely denature the DNA and the
temperature was then dropped to 75oC, the optimal reassociation temperature for
Aerobacterium (Det ey et a1.,1970). The absorbance was recorded every minute for
30 to 40 minutes.
iii) Sources of variation
According to Britten etal. (I974), the parameters which must be
controlled in order for reproducible reassociation values to be obtained are salt
concentration, temperature, DNA fragment size and DNA concentration. In this
study, all comparisons were made in at least duplicate and where there was poor
agreement between the two results up to 5 separate comparisons were performed

Figure 18. Agarose gel electrophoresis of fragmented
DNA preparations used for DNA reassociation
studies.
Lanes:
A. K872B. K871c. K869D. K868E. K309F. Lambda Hind Itr marker DNA(arrows indicate fragment size in bases)

tr-)
- <2027
<564

Figure 2B Typical absorbance profile of DNA used forDNA reassociation studies.
DNA from NCPPB 1854: 1/20 dilution ofDNA in sterile distilled water (SD\Ð. Blank
wasl/2O dilution of 0.1 x SSC in SDV/

EEI T!Ju35 HJ-3l.Jf 'l3r¡L!ï'1
¡B II IIH35 1: ___jttttiI.Ih¡ø' ETE ÜI }.¡Ng' EEE
,aa. Éì 1 ? UEJ L¿ ¡v
EE'e33
8t'¿Ë' T l,lllE'Erf.E
SË}þ'E I.JIJJ'5gEËÊËË'E I,ltJE'gSrE
gEi'eJE
T t¡lJg'g
ELI'E3Ë
EE1BE'BEEÊ-1t:i'EEFOEI'Èggl:J
59
DNA: In all cases, more than one preparation of DNA was used to avoid problems
with contaminants in the preparations which might affect reassociation. In several
cases, the DNA failed to denature properly and these runs were discarded. Ideally the
absorbance of the DNA should increase by 407o for complete denaturation but this is
rarely achieved (N. Scott, personal communication).In this study, absorbance
increase with heating to 102oC was25Vo to357o in all cases and any preparation
showing an increase of less that25Vo was not used.
At all times an effort was made to start each run with a DNA concentration of
75 ¡tglrr,lin all cuvettes. The concentrations were always between 65 and 85 ¡tg/ml
thus falling into the range in which second order kinetics apply (Det ey et al., 1970).
This was important in that it satisfies the assumptions behind the equation used to
calculate degree of binding. Each sample denatured by a slightly different amount and
there were denaturation differences between cuvettes (see below) so it was impossible
to achieve identical absorbance values in each cuvette at the beginning of the
reassociation. This is perceived as the major source of variation in the results.
Fragment size after shearing was checked on an agarose gel against a lamMa
Hind trI marker. In all cases, fragments were consistently in the 400 to 800 bp range
(FigurelB). This is the size range which has been shown to produce the most
accurate results (Del-ey 4!, L97O) so fragment size was not seen as a source of
variability in the results.
DNA purity was assessed spectrophotometrically. In all cases the 26O/280 and
260/230 absorbance ratios were 1.8 or greater. Figure 28 illustrates a t)?ical DNA
spectrum. The purity of all DNA preparations was checked in this way before and
after the shearing step. Protein contamination was thus not seen as an important
source of variation in the results. The same procedure was used for the preparation of
all samples and all DNA pellets were rinsed several times in 7O7o ethanol. However,
there is still some possibility of salt concenEation differences between samples which
may have contributed to denaturation differences.
60
Cuvette differences: Table 38 shows differences between individual
spectrophotometer cuvettes with respect to the amount of DNA denaturation and
renaturation observed when control runs were performed. In these runs, DNA from
the same preparation and dilution was loaded into different cuvettes and denaturation
and renaturation values were recorded. Not only was there variation be¡veen initial
absorbance values but there were differences between cuvettes in the amount of DNA
denaturation and especially renaturation. These differences were observed repeatedly.
Cuvettes were cleaned regularly with a 1/10 strength solution of Trace-Klean
(Beckman Instruments, USA) followed by 8 to 10 rinses with double glass-distilled
water. In order to eliminate any salt residues from cuvettes they were frlled with dilute
HCI (0.01 N) and heated to 40oC for 2 hours. This was followed by numerous rinses
with double distilled water. The latter treatrnent alleviated problems with cuvette
differences to a certain extent but the use of cuvette 4 was discontinued because it
gave consistently lower renaturation rates. Some of the variation between cuvettes
could have been due to differences in ttre temperatues achieved which in turn was
due to impurities in the cuvettes themselves or design problems in the temperature
control.
In summary, the major sources of error in this method were perceived to be
the variation in absorbance readings between cuvettes and the differences in DNA
concentration at the beginning of the renaturation. The latter was likely due to
differences in the starting DNA concenüation which were then compounded by a
certain amount of impurity in the DNA samples andvariation between cuvettes, with
regard to temperatue control. Modifications (described below) were developed in the
calculation of reassociation rates which were designed to take into account DNA
concentration and denaturation differences.
iv) Calculation of the Degree of Binding
Initially, the degree of binding was calculated as suggested by Deley
et al. (1970). The homologous and heterologous reassociations were plotted

Table 38. Differences between cuvettes observed in DNA reassociaúon studiesl
Comparison2
4z
K864Æ(864:denaturation3renaturation4
.341 163
.30.t245
.29.L343
.35.1189
.40.t125
.270508
.321101
.32.rt93
.0597
.35.079r
.32.1400
5
.27.2tt9
.25.0519
K8641K872:denaturationrenaturation
K868Æ(871:denaturationrenaturation
K869Æ(871:denaturationrenatu¡ation
K8691K872denaturationrenaturation
K868A(872denaturationrenaturation
.40
1- The reassociation method and calculation of denaturation andrenasturation rates are
described in Part B, Materials and Methods. Cuvette numbers refer to their position in
a temperature controlled sample holder used with a Beckrnan DU-8 UV-visiblecomputing spectrophotometer. In all cases, cuvette position 1 contained the blank.
2- DNA from the same homologous or heterologous mixture was loaded into different
cuvettes as indicated and run at the same time. DNA preparation for reassociation runs
is described in Part B, Materials and Methods.
3- Denatu¡ation was calculated as the change in absorbance from 75oC to 102oC
divided by the initial absorbance of the sample at 75oC.
4- Renaturation rates were calculated as described in Materials and Methods, Part 8..

61
(absorbance vs. time) graphically and the rates were calculated from the point where
the plots became linear. Figure 38 shows a plot of two closely related strains and
Figure 48 shows the reassociation of two more distantly related strains. Once the
rates were calculàted, the degree of binding (D) between the two strains was
determined from the equation (Deley et al., 1970): D = 4Vmix-VR-Vg/
2(VlVgX100). Vmix is the absorbance change per unit time for the linear portion of
the heterologous reassociation curve. V4 and Vg are the absorbance changes per unit
time for the linear portion of the homologous reassociation curves.
It was perceived that there were sources of va¡iation which may conEibute to
error in the calculated degree of binding so a modified method of calculation was
developed with the help of Dr. Nigel Scott, CSIRO Div. of Horticultural Research,
Adelaide.
In order to eliminate differences in initial DNA concentration values, the
absorbance at 102oC was divide by the initial absorbance at 75oC. This was done to
get an estimate of the amount of denaturation. The renaturation rates were calculated
as previously and divided by the denaturation value (e.g by 0.35 if the absorbance
increase from 75oC to 102oC was35Vo) to obtain adjusted values for V¡¡i¡ , V¡ and
Vg. The denaturation u/¿ìs thus used as an adjustment factor so that the renatu¡ation
rate was not as dependent on initial absorbance reading. Theoretically the adjustrnent
factor provides a more realistic assessment of how much DNA was actually denatured
and thus available for renaturation.
The new Vmix, V4 and Vg values were then used in the equation of DeIæy
et al. (1970) previously described Table 48 presents the recalculated values for D
versus the original values. The results are discussed fully in the next section and
presented in Tables 148 and 158.
In most cases the recalculated results were not very different from the original
results. Recalculated values showed less variation between repeated comparisons of
the same strains, a problem with the original results. Two problems remained. The
first is that there were a certain number of anomalous results; in two cases, very high
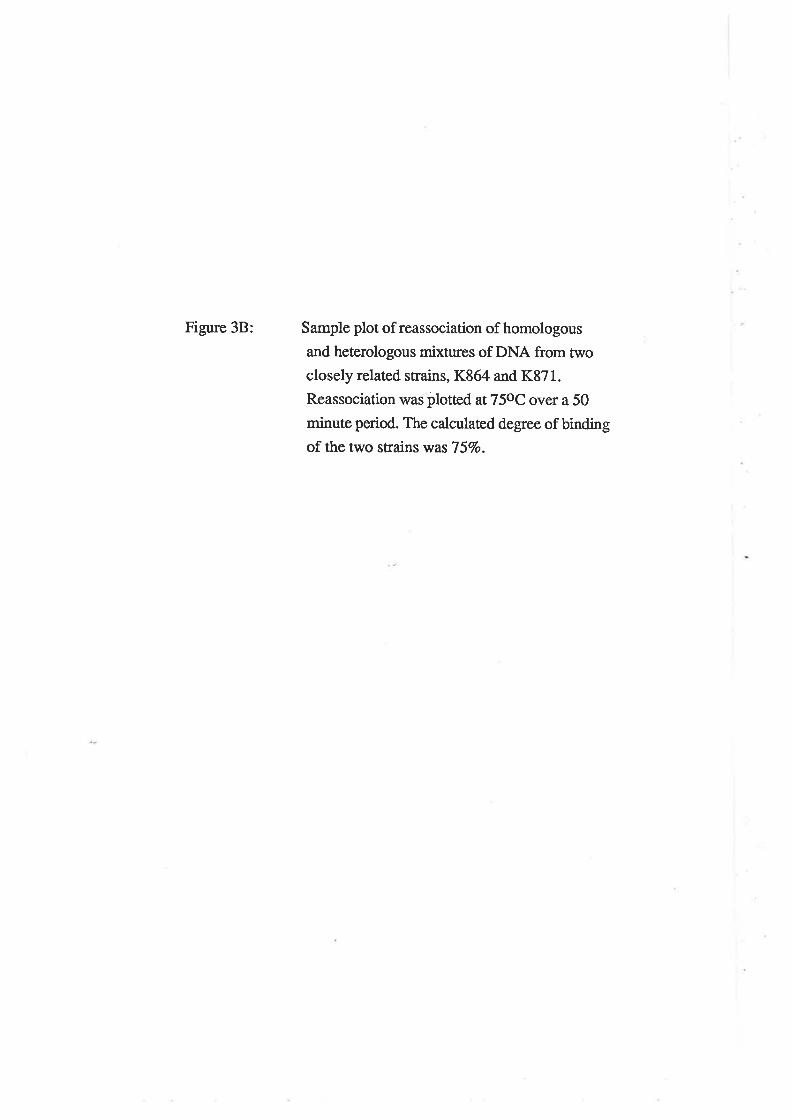
Figure 38: $amFle plot of reassociation of homologous
and heterologous mixtures of DNA from twoclosely rolated strains, K864 and K871.Reassociation waSþloned at 75oC over a 50minute period. The calculated degree of bindingof the two strains was757o.

E
L'scqoo(l)oC(ú-oLoU'-o
2.O
2.1
I
1.8
1.7
1
K871
mixture
K864
0 10 20 30 40 50minutes
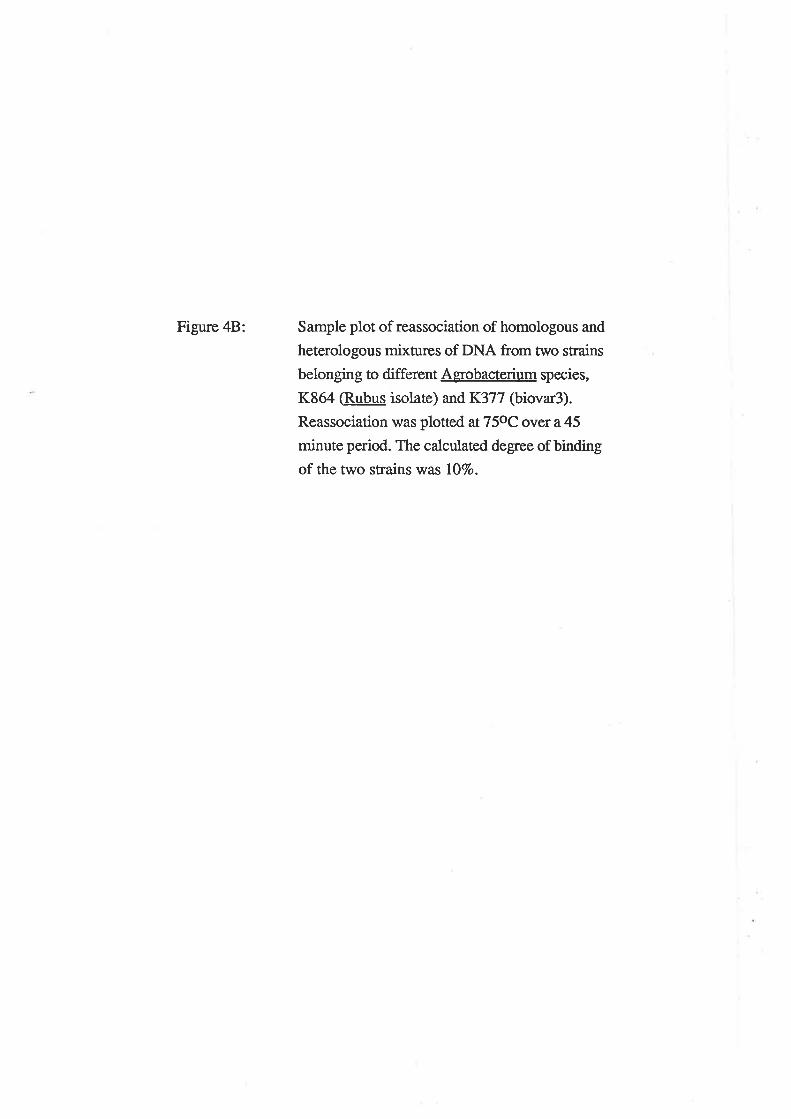
Figure 48: Sample plot of reassociation of homologous and
heterologous mixtures of DNA from two strains
belonging to different A erobacterium species,
K864 (Rubus isolate) andK377 (biovar3).
Reassociation was plotted at 75oC over a 45
minuteperiod. The calculated degree of bindingof the two strains was 107o.

2.0
Êc0-9Ì\doIo(Jc(ú€o.n-o
2.1
1.9
mixture
K377
K864
0 10 20 30 40 50minutes

Table 48. C-omparison of original and recalculated DNA degrees of bindingl
K864/K871
Replicate
1
2
1
2
1
2
1
2
1
2
1
2
1
2
1
2
1
2
1
2il
957l
9174
9078
t220
8180
293l
511
10081
6262
K8684(872
K8691K872
K869/K870
il
il
il
150
183T
I6968
9656
2736
2733
3448
2425
4540
2828
K868Æ(869
K3O9/NCPPB 2437It
K864/TR3
r<271K309
K8641K377 t311
1- All comparisons and all replicates of each comparison performed in this study are
not included in this table. Results for the DNA reassociation studies are presented inTables 148 and 15B.

62
degrees of binding were obtained for a comparison which had shown low homology
in all other runs. The only possible explanation seems to be that there may have been
salt contamination of those particular runs. The other phenomenon which was
difficult to explain was a low degree of binding between two strains (e.g K8721K868)
which were both highly related to a thi¡d strain, K864 (Table 15B). It was thought
that there were contaminants in the DNA preparations which may have been
responsible for the low degree of binding achieved in these comparisons. These runs
were repeated with new DNA preparations and the same results were obtained so they
must be considered a real result but they are diffrcult to explain in biological terms.
The author feels.that there are several problems with the DNA reassociation
method- It is very diffrcult to obtain identical DNA concentrations in all cuvettes and
denaturation and renaturation values vary with concenftation and, more alarmingly,
with the cuvette used, even after they were extensively cleaned. The problem of
anomalous values and comparisons is difficult to overcome. Ideally in a taxonomic
study a method such as this one should not be the only basis of comparison. Results
should be compared with those obtained from a comparison of phenotypic traits, as in
this study, or with another method such as protein electrophoresis or restriction
fragment length polymorphisms.

63
PART B: RESULTS
B.1 Characteristics of isolates from Rubus and grapevine
a) Pathogenicitv and host range
Table 58 shows the results of pathogenicity tests for biovar 3, Rubus
isolates and A. rubi group strains on a number of hosts. TR2 was completely non-
pathogenic on all host plants tested. Individual Rubus isolates va¡ied in their
pathogenicity on different hosts but were consistently limited in thei¡ host range in
comparison to biovar 3 strains tested and with the published host range of biovars 1
and2 @eCleene & Deley, L976).It was noted that, although only small galls were
formed on the woody stems of boysenberry, galls were not observed when the same
strains were inoculated onto green shoots of boysenberry.
b) Ooine catabolism and synthesis
Table 68 shows the opines catabolized and synthesized in the galls of a
range of biovar 3 and Rubus isolates. There are two opine utilization patterns found in
biovar 3. The presence of octopine and cucumopine (Fig 58) only is by far the most
common situation in vine galls; all samples from South Australian galls observed in
the course of this work contained octopine and cucumopine but not nopaline.
None of the Rubus isolates or EU6 and 181 were able to catabolize octopine;
generally they were able to catabolize either nopaline, succinamopine or both.

Table 5B: Pathogenicity and host range of isolates from Rubus andgraPevinel
Biovar 3
Host: Strain:
K377
+weak *
K309
GrapevineAlmondCarot discTomatoRaspberry
Rubus isolates and others
Host: Strain:
K864 K868 K869 K870 K871 K872 TR2 TR3
Carot discTomatoTobaccoRaspberryBlackberryBoysenberry
1- see Materials and Methods for method and host plant cultivars used forp athogenicity testing.
2- NT = ûot tested
3- Inoculations made into the woody stem of boysenberry (see Materials andMethods)
+
;
K252
+¡12++
NT
+++
+weak+
+++
+
;
++
;NT
+
+NT
+
;
EU6 181
NT NT
NT NT+++NT NT

Table 6B: Opine catabolism and synthesis by isolates from grapevineand Rubus
Opines catobolized: Stain:
K305 K308 K309 K374
I
I
I
I
I
I
Ooines svnthesized:
Cucumopine
Rubus isolates and others:
Ooines catabolized:
OctopineNopalineSuccinamopine
1- Max Tate, personal communication
2- NT = ûot tested
K377 K252
+++
NT
Strain:
TR2 TR3 K864 K868 K869 K870 K871 K872 EU6 181
:+
NT
l+
¡12
+++
:+
++
;+
iNTNT
OctopineNopaline
+
+
+
+
+
+
+
NT
;+
;+
+;++
+;+
+

Figure 58. High voltage paper electrophoresis of grapevine
gall extract showing presence of octopine
in gall tissue. Paper stained for presence ofguanidines and photographed under
LIV (302 nm) illumination.
Lanes: O. octopine standard
1,2. grapevine gall extract


64
c) Plasmids
All biovar 3 isolates tested have single,large (approximately 200 kb)
plasmids. When the ptasmids of K252, K374, K305 andK377 were eliminated by
pDP35 containing the cloned fragment of the incompatibility region of 46,
pathogenicity was lost by all strains. This confrms that the large plasmids were in
fact Ti-plasmids in the Rh-l incompatibility group described by Hooykaas et al.
(1930). In addition,K252 and K305 lost the ability to catabolize octopine but K374
andÍ377 did not (Fig 68), indicating that the genes for octopine catabolism are not
located on the Ti-plasmid in the latter srains.
Figure 78 shows the muttþle plasmid bands visible in Rubus isolates. The
incompatibility group of the Ti-plasmids of the Rubus strains was not established.
There are plasmids in each of the strains of a comparable size to the Ti-plasmid.
d) B iochemical differentiation
Results for all biochemical tess perfomred are listed in Table
78. The differential tests used to separate biovars I and2 have been well-described
previously (De tæy et a1.,1966; Keane et a1.,1970; White,1972; Kersters et a1.,L973;
Holmes & Roberts,1981; Kersters & Deley,1984) and these are confirmed by this
study. Biovar 3 strains can be differentiated from other groups on the basis of growth
on two selective media. They share with the Rubus isolates a negative result for
utilization of many of the carbon sources tested but the groups can be distinguished
by their growth at3Toc,reaction on aniline blue medium and the inability of cane gall
isolates to use Na-tartrate. Two sources of TR3, the type strain for A. rubi, ATCC
13335 and NCPPB 1854, were tested and found to differ from the Rubus isolates in
that they display only a partial requirement for growth factors in the culture medium.
In addition, they did not have the reaction on aniline blue medium typical of the
Scottish Rubus isolates.

Figure 6B: Growth of Ti-plasmidless biova¡ 3 strains on:
A. Minimal media plus0.2%o nopaline
B. Minimal media plus0.2Vo octopine
Strains:
r. K3772. 1<377
3. 1(377
4. Í3745. K374
(wild type)pTi- #1
pTi #2pTi- #1
pTi- #2
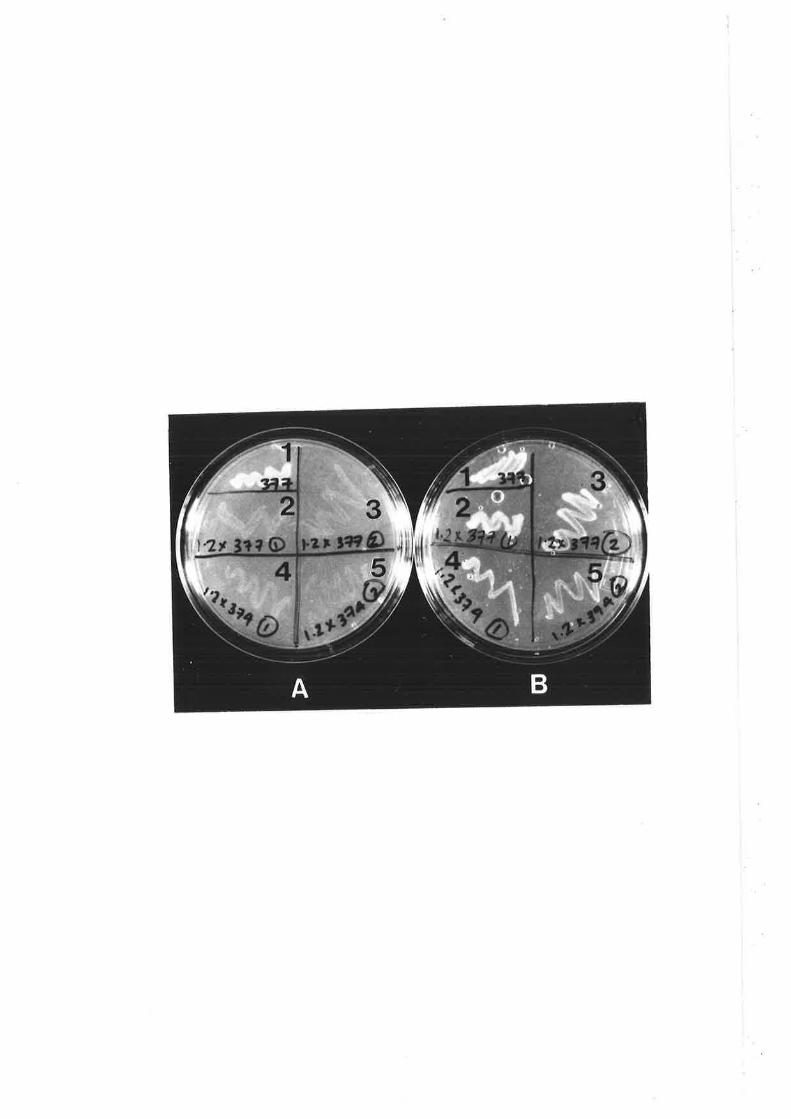

Figure 78. Agarose gel electrophoresis showing multipleplasmids in Scottish Rubus isolates.
Lanes:
A. EU6B. K874c. K871D. K870E. K868F. K864G. ATCC 13335 (=TR3)H. K187 (biovar 1)
Arow indicates chromosomat DNA.
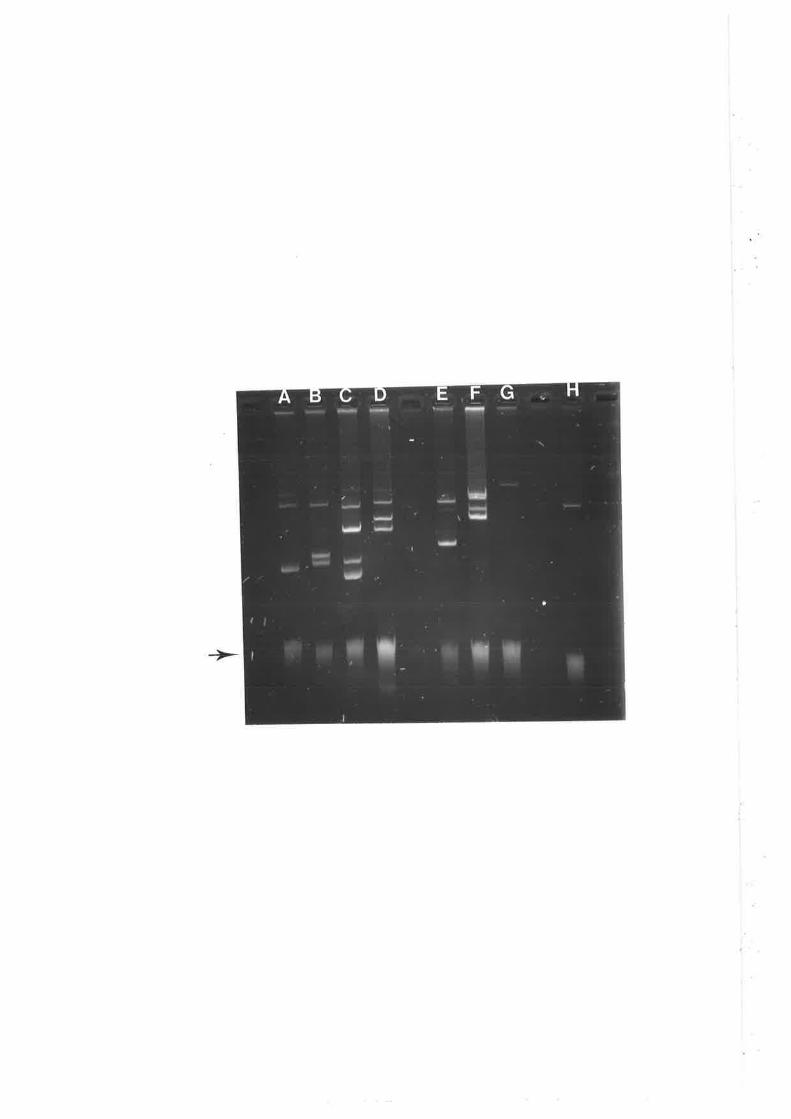
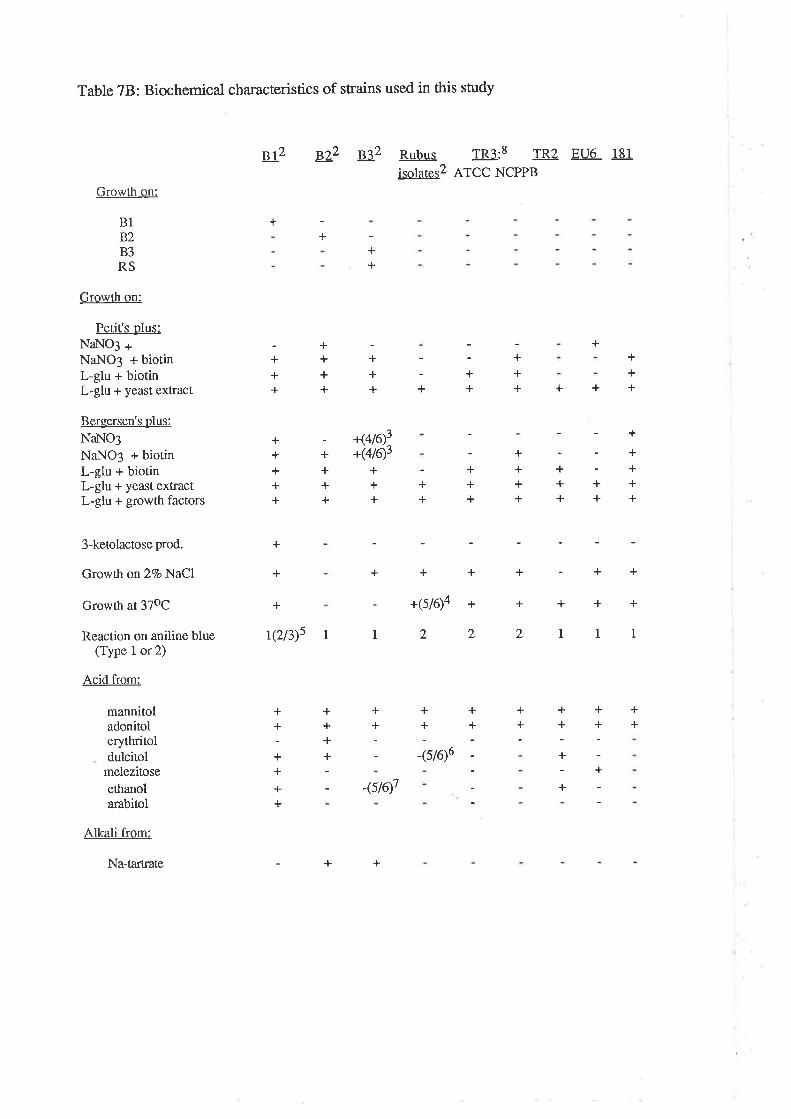
Table 78: Biochemical characteristics of strains used in this study
* ú B* Rubus TR3:8 rR2 EU6 181jsoktq2 ATcc NcPPB
Growth on:
B1BZB3RS
Growth on:
Petit's plus:Nal.{O3 aNaNO3 + biotinL-glu + biotinL-glu + yeast extract
Bergersen's plus:NaItIO3NaNO3 + biotinL-glu + biotinL-glu + yeast extractL-glu + growth factors
3-ketolactose prod.
Growth on 27o NaCl
Growth at 37oC
Reaction on aniline blue(Type 1 or 2)
Acid from:
mannitoladonitolerythritoldulcitol
melezitoseethanola¡abitol
Alkali from:
Na-tartrate
++
++
+++
+++
+++
++++
;++
+
+++++
+++++
++
+++
++++
+++
++
++++
+++++
+Ø/q?+(416)5
+++
+
+
+
+
+
I
+
+
I
+
I
+
+
2
+
+
2
++
11TQß)5
+(5/6)a
2
+++
l
+
l++++
++
++
-6rc)6
++
++
;
+
ll+
++
++
-(s/6)7
+ +

1- all methods listed in Part B,lvlaterials and Methods. Composition of all media used clisted in Appendix A.
2-T\e followins sBiovYarBiova¡Biova¡ lA52 (Ae 57)Rubus K872
All strains and their sor¡rces are listed in Table lB.
3- Both K377 andK376 are negative for these characters.
4- K871 is negative for this cha¡acter.
5- NCPPB 2137 gaveaType 2 reaction on anilineblue.
6- K864 positive for this character
7-f376 positive for this characær
8- Two separate sources of TR3 were tested, both received from type cultu¡æollections. ATCC = ATCC13335; NOPPB = NCPPB 1854

65
i) Growth cha¡acteristics in nutrient broth
Table 88 shows the results of three pammeters used to measure
growth rate for selected Agrobacterium strains. Biovar 2 and the Rubus isolates were
very slow-growing in comparison to biovars 1 and 3. Biovar 2 strains did not reach
the same final cell densities as strains from the other groups and took longer to initiate
logarithmic growth.
There was no effect of growth factor addition in nutrient broth for any of the
parameters measured except for the two strains, K868 atdK}7. Both strains showed
approximately 5O7o decreases in mean doubling time as well as increases in final cell
density, indicating a positive response to growth factor addition in nutrient broth.
ii) Growth characteristics in mannitol-glutamate broth
Table 98 shows growth parameters of selected isolates both
with and without addition of growth factors. Strains representing four Agobacterium
groups all showed a decrease in mean doubling time with the addition of growth
factors with the largest decreases shown by the biovar 2 strain ATCC LI325 and
Rubus isolate K868. As in nutrient broth, K868 showed an increase in frnal cell
density when growth factors were added. Lag times appeared to be relatively
unaffected by addition of growth factors. Growth was much slower in mannitol-
glutamate broth but the relative mean doubling times for the four Agrobacterium
groups were the s¿ìme as in nutrient broth. Biovar 2 and Rubus isolates were slower-
growing in both media and showed the largestresponse to the addition of growth
factors.
f) DNA melting points
The midpoins of the thermal denaturation profiles (Tm) of selected
Agobacterium strains are presented in Table 108, along with the corresponding GC

Table 88: Growth characteristics of Aerobacterium strains in nutrient broth
Strain: Grouping: Lag Time(h)4 Mean DoublingTime (min)2
Final Cell Density(cells/ml)3
Kl87c58
K869K868
Biovar 1 66
50.968.8
t72198
45.1
r37r67
2.3 x 1091.8 x 109
1.5 x 1091.5 x 109
2.2x L09
2.3 x 1091.8 x 109
ATCC 11325 Biovar 2K27 'i,
K377 Biovar 3
fl
lt
1010
Rubus isolate
6
86
1- see Materials and Methods; all values represent a mean of 2 replicates when mediadid not include growth factors
2- measured in early log phase of growth
3- cell density where no further growth occurred for 3 consecutive readings
4- time from initiation of experiment to beginning of logarithmic growth

Table 98: Effect of growth factor addiúon on gtowth characteristicsof Aerobacterium in mannitol-glutamate broth
Lag Time (h)4 Mean DoublingTime (min)2
Final CellDensity (cells/d¡3
Strain: Grouping: No GE5 GF No GF GF No GF GF
K187 Biova¡ 1 16 16 r82 167
Biovar 2 16 I 403 355
2.2x lO9
1.7 x 10⁹
1.9 x 10⁹
1.9 x 10⁹ATCCtt325
K377 Biovar 3 40 40 225 208 1.7 x 10⁹
K868 Rubus 24 24 281 218 1.1 x 10⁹isolate
1- experiments done in mannitol-glutamate broth as described in Materials andMethods; average of 2 reps
2- measured in early logarittrmic phase of growth
3- cell density where no further growth occurred for 3 consecutivereadings
4- time from initiation of experiment to beginning of logarithmic growth
5- GF - $owth factors (see'Culture Conditions')
2.3 x t09
1.6 x 10⁹

Table 108. DNA Melting Points of selected Agrobacterium strains
Grouping Tml Ge2
NCPPB 2437 Biovar I 94.3 +/- 0.23 61
K309 Biovar 3 93.6 +/- O.28 59.3
K868 Rubusisolate
94.3 +l- 0.8r 61
1- Tm : midpoint of thermal denaturation profile. Tm determinations weremade as described in Part B, Materials and Methods. Values presented are a mean of3 separate runs plus standard deviation.
2- GC = porcont guanine-plus-cytosine contenl GC content was determinedby the equation: GC = (Tm - 69.3)2.44 (Mandel & Marmur, 1968).

66
contents. The results agree very well with the published GC content of NCPPB 2437
(60.8) (Deley, 1970). The melting points of K309 and K868 are within the range
specifred for Agrobacterium (Kersters & Deley, 1984) with GC contents of 59.3 and
61 respectively.
g) Motilitv
Table 118 shows results of motility tests performed using three
separate methods, with bacteria grown on two different media.
When bacteria were grown on Petit's minimal medium amended with
L-glutamate and (NII+)ZSO+, all biovar 1 and 2 strains were motile but none of the
five biovar 3 strains tested were motile, when tested by the three methods. When YE
was used as the growth medium, biovar 1 and 2 strains were motile as well as 2 out
of the 5 biovar 3 strains tested. Onfy 1 out of the 3 A. rubi strains tested was motile
(K869), and it was motile when it was grown on either of the media. The results
indicate that there is an effect of nutrition on motility of biovar 3 and also that there is
variability between biova¡ 3 and A. rubi strains with respect to motility.'When
preparations were viewed by the hanging drop method, biovar 1 strains appeared to
be more highly motile than either biovar 3 or A. rubi. This was observedrepeatedly.
h) Electron microscop),
Figure 8B(a) shows the Rubus isolate K871 as viewed by
transmission electron microscopy CIEM). The strain is typical of the genus
Agrobacterium in length (1-2 pm), its rod shape and in arrangement of the flagella.
Flagella appear to originate laterally from the bacteria and are 4-5 times the length of
the cell, thus corresponding to the description of the genus (Kersters &DeI-ey,
1984). Figure 8B (b) shows biovar 3 strain K1059 as viewed by TEM. Cells are
typical of the genus in length and shape. Flagella originate laterally from the bacterial
cell but lack the sinuous appearance of functional flagella. A large proportion of
biovar 3 cells were without flagella, in comparison to a reference g¡id of a biovar 1

Table 118. Motility of Agrobacterium isolates
Strain
Biovar 1:
NCPPB2437
ClRS
Biovar 2:
K27
K84
Biovar 3:
K252
CG49
CG484
CG992
K1059
Rubus isolates:
K864
K869
K872
32
YE Minimal YE Minimal
+ + + +
+ +
NT4
NT
+
METHOD & MEDIA: I
Motilit], in tubes: 2
++
16
20
25
20
20
0
20
0
33
35
40
30
NT
NT
+
+
+
+
0
0
0
0
0
+
+
+
+
+
0
15
0
0
15
0
+
NT
NT
NT
++
NT
1- All methods and media described in Paft B, Materials and Methods. All tests weredone in duplicate.
2- Motility scored as positive if 'halo' observed around site of stabinoculation after 48 hours' incubation at25oC.
3- Diameter of swarrn (in mm) after 48 hours' incubation at2soc.Average of 2 plates.
4- NT = rot tested
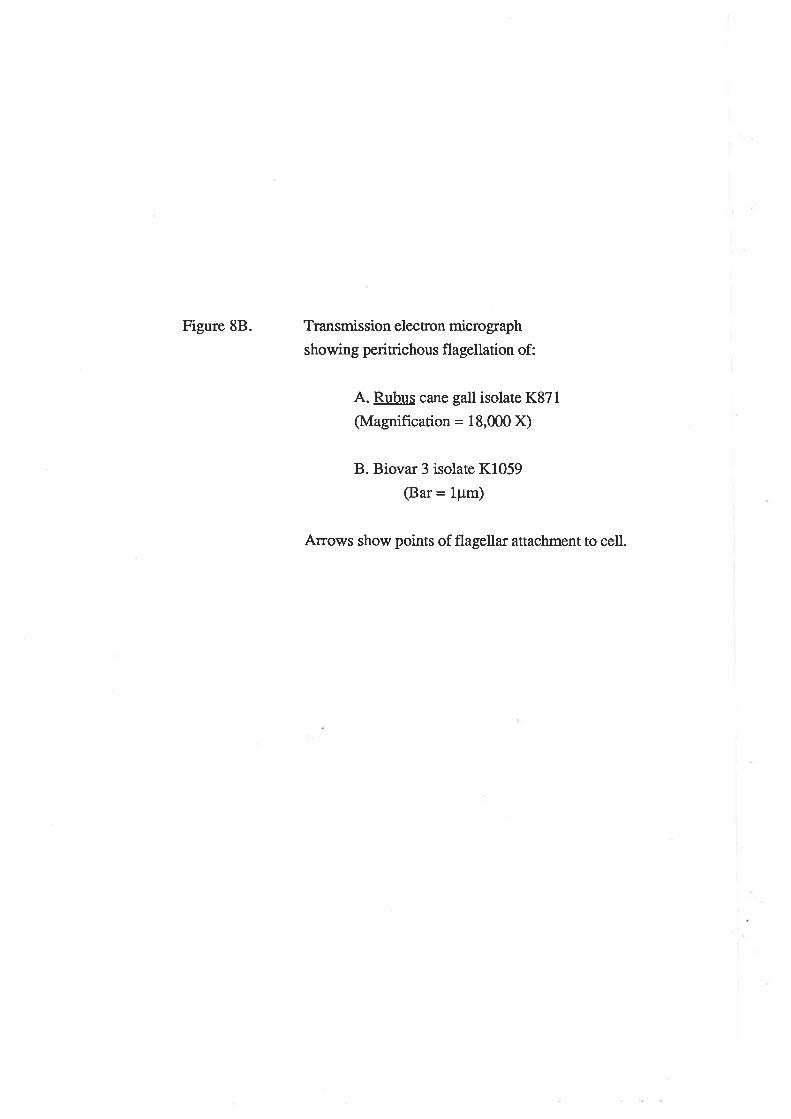
Figure 88. T¡ansmission electron micrograph
showing peritrichous flagellation of:
A. Rubus cane gall isolate K871(Magnification = 18,000 X)
B. Biovar 3 isolate K1059
@ar = 1pm)
Arrows show points of flagellar attachment to cell.


th
d
tL1
lt.î
,r* ¡3
.tr
1
aa
rla
I
{,ta'pa
I
aA
Jo
67
strain, K188. It was noted repeatedly that when grids were made of biovar 3 strains,
flotation on a flooded culture for 1 to 2 hours resulted in few, if any, cells adhering.
In order to obtain sufficient numbers of biovar 3 cells on the grid, it had to be floated
on the flooded culture for 12 to 18 hours. Possible explanatiorufor this
phenomenonorre that, unlike biovar 1, biovar 3 strains are not attracted to high oxygen
levels or biovar 3 strains have a different surface charge which affects their ability toadhere to the grid.
The preparation of bacteria for scanning electron microscopy (SEM) by freeze-
drying was ineffective. Few flagella were observed and the cells were badly
collapsed. 'When critical-point drying was used for SEM sample preparation, cells
were intact but few flagella were visible and those that were were largely
broken.'When sites of flagellar attachment were visible under SEM for strain K871,
flagella were attached peritrichously to the bacterial cell.
h) Sensitivitv to agrocin 84
All biova¡ 3 strains tested were much less sensitive to strain K84
relative to biovar 2 srains when tested by the method of Stonier (1960). Inhibition
zones of 8-12 mm were produced against the nopaline-type biovar 3 strains K374,
K376 andK377 in comparison with 45 mm zones against K27 , a sensitive biovar 2
strain. K84 produced no inhibition zones at all against any of the Scottish Rubus
isolates tested.
68
8.2 Relatedness among Agrobacterium strains
a) Numerical anal)rsis of phenotypic data/ Differentiation
of eroups
Dendrograms were constructed showing similia¡ities between strains based on
single linkage cluster analysis of the results of 25 biochemical tests. Figure 98 depicts
analysis when zero results were not matched and Figure 10B depicts the analysis
when zero matches were included.
'When zero results were not matched, four major groups, A-D, could be
discerned at the 857o similiarity level. Two of these, A and B, correspond to the
previously described biovars 1 and 2 respectively. A third group, C, comprises
strains isolated from grapevine, all of which have been previously described as biovar
3. The fourth g'oup, D, comprises strains isolated from cane galls on Rubus spp. as
well as strain EU6 which has been previously grouped in A. rubi (Kersters & Deley,
1984). At the 857o similiarity level, the two strains of TR3, ATCC 13335 and
NCPPB 1854, as well as the Rubus isolate K864, do not cluster with the other Rubus
strains but do so at the 77.5Vo level. Strain 181, a succinamopine-catabolizing isolate,
clusters with Group C, the grapevine strains, at the 77.5Vo level. Isolate TR2 is very
isolated phenotypically as it remains unclustered to the 657o similiarity level.
Holmes and Roberts (1981), in a study of Agrobacterium taxonomy based on
cluster analysis of a large number of characters clustered A. rubi strain TR3 with
isolates from grapevine. In that study, zero results were matched. Cluster analysis of
phenotypic data presented in this study was therefore performed with and without
using matched zero values in order to compare the result. Figure 108 depicts the
result when zero matches were included. The same four groups, A to D, were
discerned at the 907o similiarity level as were found in the previous analysis at the
S5Volevel. However, some differences do exist. The two TR3 strains, ATCC 13335
and NCPPB 1854, and K864 all cluster with Group D at the 907o similiarity level,
much higher than in the previous analysis. Strain 181, which was grouped with the

Figure 98. A dendrogram showing relationships between
strains based on single linkage cluster analysis.
Order of strains is as depicted on the minimumspanning tree. Negative matches were not included.
Groups A to D indicate clusters formed atthe&O%o
similarity level.

95 90
Percentage similaritY
85 70 65
ANCPPB 1OO1
c58
NCPPB 2,137
K8A+
NCPPB 1854
ATCÆ 13335
D
K868
KA72
K869
K871
K870
EI,J6
181
K305
K252
K309
K306
K377
K376
KA4
TCC 11325
K27
TR2
c
'þ
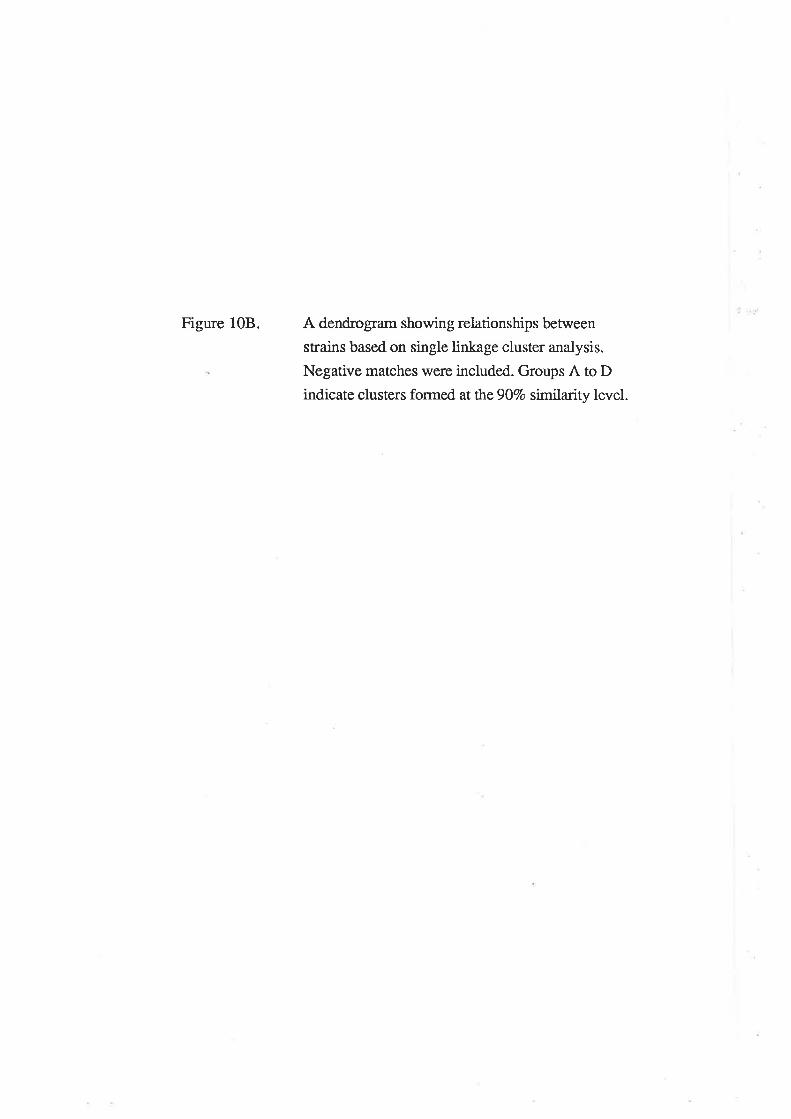
Figure 108. A dendrogram showing relationships between
strains based on single linkage cluster analysis.
Negative matches were included. Groups A to Dindicate clusters formed at the 907o similarity level.

Percentage similaritY
95 90 80
A
'l^
K868
K872
K869
K871
K870
EU6
K864
K305
K252
K309
K306
K377
K376
TR2
K84
TCC 11325
K27
NCPPB 1OO1
c58
NCFPB 2¡tÍ17
181
NCPPB 1854
ATCC 13335
D
c

69
grapevine isolates (Group C) previously now clusters with Group D atthe 857o
similiarity level. TR2 remains ungrouped until the 82.57o level. The major effect of
including matched zero results appears to be a 'tightening' of the clusters; all strains
cluster at a higher similiarity level. The actual makeup of each cluster was virtually
identical be¡reen analyses except for the position of strain 181. Its opine utilization
suggests it has more in common with the Rubus isolates, with which it clusters when
zero matches \¡/ere included than wittr the grapevine isolates, with which it clusters
when zero matches were not included.
Table 12B summarizes the differentiating characteristics of the major groups.
The differentiation of biovars 1 and 2 has been well-described previousþ (Deley et
a1.,1966; Keane et al.,L97O; White,1972; Kersters g]!e!., 1973; Holmes and
Roberts,1981; Kersters and Deley,1984). Biovar 3 strains can be differentiated from
other groups on the basis of their growth on selective media. The Rubus isolates can
be differentiated phenotypically from biovar 3 on the basis of their response on aniline
blue medium, their growth at37oc and their inability to use Na-tartrate. A major
distinguishing feature of the Rubus isolates is their requirement for the growth factors
biotin, nicotinic acid and calcium pantothenate in the growth medium.
b) Serological relationships between biovar 3 and Rubus isolates
Table 138 shows the reaction of biovar 3 and Rubus isolates to antisera raised
against K309, K377 and TR3 in both the gel diffusion and tube agglutination assays.
The antisera against biova¡ 3 strains appeared to be quite specific, reacting only with
the closely related strains within the biovar 3 group. The octopine strain, K252,from
Greece did not form precipitin bands with antisera against local octopine or nopaline
strains although these strains are phenotypically similiar (Table 7B). The antigenic
determinant is not Ti-plasmid coded as a pTi- strain of K377 forms precipitin bands
with the K377 antiserum.
None of the isolates tested, including TR3, formed precipitin bands with
antisera to TR3 in the gel diffusion assay. In the tube agglutination assay, the titre

Table 128: Summary: Differcntiation of ¡\¡g9þ4ç1¡9¡i¡¡¡q speciesl
Biovar 1 Biova¡ 2 Biovar 3 A. rubiGrowth on
selective mediæ
Growth factorrequiremenr
a) biotin only
b)^biotin,. calcium pantothenaæ¿k mcoûnrc acrd
3-keolacose production
Growth on 27o NaCl
Growth at 37oC
Aniline blue reaction2
Acidftom:
ethanolarabitol
Alkali fr,om:
Na-târtrate
1- see Table 7B for breakdown of biochemical test results by snain
2- see lvlaærials and Methods, Part B
B1B2B3RS
++
++
+ -l+r
+
+
+
I
;+++
+
+
+
+
2II
ervthrioldúlcitolmelezitose
+
:
++

Table 138: Serological relationships between biovar 3 and Rubus isolates3
Antiserumto:
K309 K377 TR3
AntisencDlT}2@TA@TA¡¡¡3NTNT
NTNTNT
NTNTNT
1- GD = gel diffusion; '+'indicates precipitin band formed; see Materialsand Methods
2-TA= tutle agglutination; number indicates titre; see Materials and Methods
3 - NT = not tested
4 - described in Table 1A
K305K306K308K309K374K375K376K377K252r{253K377P'ri- 4TR3K868K870K871TR2EU6
+++
i1600NT
6400160050NTNT100100NTNT<50NTNTNTNT<50
;+++
+
50NT<50<503200NTNT
1600400NTNT<50NTNTNTNT<50
NTNTNT200NTNTNT<50NTNTNT800<50400<50400200
NT
NTNT
NTNT

70
against TR3 was somewhat low and there was a low level of agglutination with
K870,TR2, and EU6 as well as with K309. None of the other Rubus isolates tested
orK377 showed any reaction with the TR3 antiserum.
c) DNA Homology Studies
i) Relationship of biovar 3 to other groups
Table 148 shows the degree of binding of the biovar 3 strains
to strains from the other Agrobacterium groups and to each other. The biovar 3
isolates tested all displayed a high degree (>70Vo) of binding with each other. K309
had a low degree of binding (40Vo) with the type strain of biovar 1 (NCPPB 2437)
and with two biovar 2 strains, K27 andthe type strain, ATCC 11325. Binding of
K309 andl377 with Rubus isolates was low (<26Vo) and moderately low (45Eo)
with EU6.
ii) Relationships between strains from Rubus and other aerobacteria
Table 15B shows the degree of binding between strains from
Rubus with each other and with isolates from other Agrobacterium groups. Isolates
K864, K868, K869, K870 and K871 all show a high (>8O7o) degree of binding with
each other. K872 has a high (82Vo) degree of binding with K864 but a low degree
(<287o) with both K868 and K869. Two Scottish Rubus isolates, K868 and K871,
were tested for homology to the two sources (ATCC 13335 and NCPPB 1854) of
TR3, the t)?e strain of A. rubi. Both of the Scottish isolates displayed a very high
degree of binding (>82Vo) with ATCC 13335 and a moderately high degree of
binding(>65%o) with NCPPB 1854. It should be noted that the two TR3 isolates
displayed a96Vo degreeof bindingwitheachother. StrainsK868,K869andEU6all
show a low degree of binding with the type strains of biovar 1 (NCPPB 2437) and
biovar 2 (ATCC 1L325) and with biova¡ 3 strains, K309 andK377.
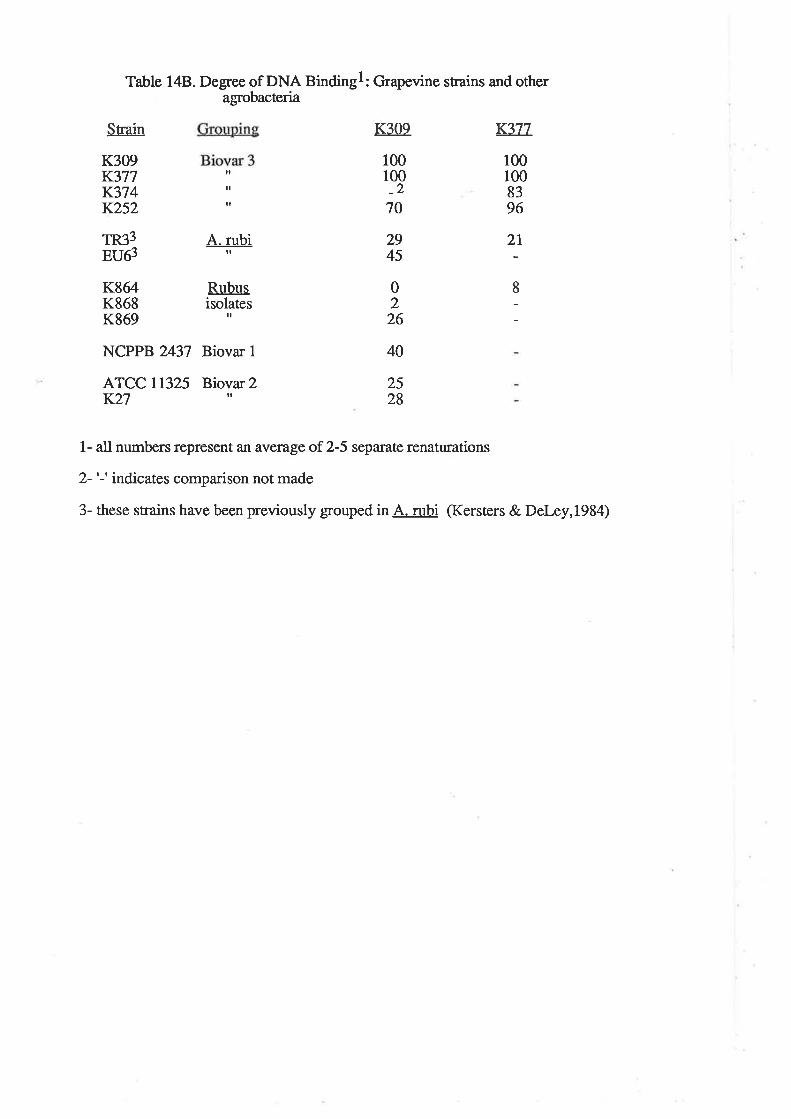
Table 14B. Degree of DNA Bindingl: Grapevine strains and otheragrobacteria
Strain K309 K377
K309K377K374K252
TR33EU63
K864K868K869
A. rubi
Rubusisolates
il
rÍtt
100100_270
1001008396
2945
0226
40
2528
2Til
8
NCPPB 2437 Biovar IATCC 11325 Biovar 2K27 '!,
1- all numbers represent an average of 2-5 separate renaturations
2- '-' indicates comparison not made
3- these strains have been previously grouped in A. rubi (Kersters & Deley,1984)

Table 15B. Degree of DNA Bindinglr Rubus isolates and other agrobacteria
Strain Groupins 8Ét 868 869 &Zt
TR3:3ATCC 13335 A. rubiNCPPB 1854 ',,
9l77
K864 Rubus isolates ioo 100 '.ã3
10081
NCPPB 2437
8826
0
t4
2
28
3
t4
26
8265
ß+
100
il
Ú
tttt
9083
8482
ATCC rr325
K309K377
Biovar 1
Biovar2
Biovar 3Biovar 3 8
1 - all numbers represent an average of 2-5 separate renaturations
2 -'-'indicates comparison not made
3 - TR3 has been previously grouped in A. rubi (Kersters & DeIæy, 1984)

7l
PART B: DISCUSSION
Results of numerical analysis of phenotypic data and DNA binding studies
indicate that there are four distinct groups within the genus Agrobacterium. Analysis
of growth characteristics lend further support to this conclusion. The four groups
identifred in this study, A-D, correspond to biovars 1,2,3 and A. rubi respectively.
Data obtained from biochemical tests, motility tests and melting point detemrinations
confirm that biovar 3 and A. rubi both warant inclusion in the genus Agrobacterium.
The separation of biovars 1. and2 has been well-documented (Keane et al.,
I97O; White, 1972; Kersters et al., 1973; Holmes & Roberts, 1981) and results
obtained in this study conf,rnn this separation. Kersters and Del-ey (1984) have
suggested that biovar 1 should ideally be named A. radiobacter with pathogenic
strains named as pv. tumefaciens and that biovar 2be a separate and as yet unnamed
species. Clearly this is a vast improvement on the existing nomenclature but this
proposal carinot be accepted at present due to the rules of bacterial nomenclature
(Kersters & Del-ey,1984). For the moment, the two groups are designated as biovars
of A. tumefaciens (for pathogenic strains), A. radiobacter (for non-pathogenic strains)
or A. rhizogenes (for rhizogenic strains).
Biovar 3, comprising largely isolates from grapevine, has been described by
several authors (Kerr & Panogopoulous,l9TT; Panogopoulous et a1.,1978;
Sule,1978). The cluster analysis ¡iresented in this study conf,rms the phenotypic
differences be¡ween biovar 3 and strains belonging to biovars I andZ. The DNA
binding studies confirm the sçparation of these groups at the genetic level.In their
numerical taxonomic study, Holmes and Roberts (1981) found that the type strain for
A. rubi, TR3, clustered with grapevine isolates. That finding was not confrrmed by
either numerical analysis or DNA binding studies in this work It is interesting to note
thatHolmes and Roberts included matching of negative results in their single linkage
cluster analysis. It was found in this study that when zero matches were included in
cluster analysis, all strains grouped at a higher similiarity level. Thus, if strains are
negative for a large number of characteristics, they may cluster together falsely. The
72
separation of A. rubi strains, including TR3, from the grapevine isolates is conf,rmed
by resuls obtained in the DNA homology studies.The species A. rubi was originally
described by Hildebrand (1940) as Phytomonas rubi. Ea¡lier authors (Banfield,1930;
Pinckard,1935) had suggested that the disease referred to as'cane gall'on Rubus
spp. ìwas distinct from'crown gall'. Reports indicate that isolations from crown gall
on Rubus yield predominantly biovar 2 strains (Perrf'& Kado,1982; M. Lopez, pers.
communication). Cane galls are characterized not only by being found above soil level
but galls are characteristically smaller and often found in long ridges along the cane-
rarely or never are galls found below soil level in these infections (Hildebrand,1940).
Hildebrand also found fundamental differences between the causal agents of these
diseases. Star (1946) used Hildebrand's original A. rubi isolates, TR2 and TR3
(NCPPB 1856 and 1854 respectively) to demonstrate the auxotrophic nature of A.
rubi; these isolates require L-glutamic acid and the vitamins biotin, calcium
pantothenate and nicotinic acid for gowth. This growth factor requi¡ement of the
strains referred to as the Rubus cane gall isolates was confirmed in this study. The
isolates, all from above-ground galls on Rubus spp., conform to the original
descriptions of A. rubi by Starr and Hildebrand. Based on both cluster analysis and
DNA homology,and emphasized by comparative colony morphology, growth rates,
host range and opine utilization patterns, this study indicates fundamental differences
between A. rubi and biovars 1,2 and 3.
Two sources of the type strain for A. rubi, TR3, were tested and both required
biotin for growth. the TR3 isolate received from the American Type Culture
Collection (ATCC 13335) required both L-glutamate and.biotin for growth. Thus,
neither of the TR3 isolates conformed completely to their original description in terms
of growth requirement but did so in all other respects. In preliminary work, not
included in this study, isolates of TR3 showed low DNA homology with the Scottish
Rubus isolates and did not confonn to the original description in terms of the growth
factor requirement or in terms of the range of carbon sources utilized. It was for this
reason that new source cultures of this strain were obtained. Because of the slow

73
growth of A. rubi and its growth factor requirement, it is likely easily contaminated
and this may be a reason for conflicting reports about the bèhaviour of TR3 in the
pasL When the fresh type cultures of TR3 were used, they showed a high degree of
DNA binding with other Rubus isolates, confrrming that all are the same species.
Strain EU6 and the Rubus strains clustered together in the numerical analysis,
conflicting with the results obtained by Holmes and Roberts (1981). However, in a
DNA binding study, Deley (L974) found high homology between EU6 and TR3.
This anomaly highlights the general problem of correlating phenotypic and genetic
data, a problem occurring in several places in this work. For example, strain K864
shows a high degree of DNA binding with other Rubus isolates but was somewhat
less related to these strains phenotypically, clustering in Group D only at the 77.5Vo
similiarity level, although when negative matches were included in analysis of the
same data, K864 clustered in Group D at9oVo. Conversely,K872 had a higher
degree of DNA binding with K864 than with the phenotlpically more similiar strains,
K868 and K869. Inherent inaccuracies in the methodology used for the measurement
of DNA homology (discussed in Materials and Methods) cannot fully explain the
anomalies which are symptomatic of the general dilemna of relating molecular and
morphological data in taxonomic studies (Mayr,1982).
Despite the problem of correlating phenotypic and genetic data, it is evident
that the Scottish Rubus isolates and TR3 correspond to [Iildebrand's (1940)
description of A. rubi and are a separate group from biovar 3, based on both
phenotypic and genetic data. It is interesting that the panern of opine utilization of
these two $oups is different. Biovar 3 strains are largely (but not always) octopine-
catabolizing (Perrl'& Kado,1982). Selected strains have also been shown to
catablize cucumopine (Table 68) which has been shown to be a conjugative opine
for these strains (4. Petig pers. communication). 'Whether or not this is a general
phenomenon for all biovar 3 strains is unknown. The Rubus isolates to date are all
nopaline and/or succinamopine-catabolizing strains. The conjugative opine(s) for the
Rubus isolates is as yet unknown. Although opine catabolism is generally a Ti- ''

74
plasmid coded trait (Bomhoff et al., 1986; Montoya et al., 1977; Guyon e]!3l.,
1980), it is inæresting that particular plasmid types are consisæntly associated with
particular chromosomal types. Similia¡ly, with respect to another plasmid-coded trait,
pathogenicity, Rubus isolates tested in this study appear to be largely limited in host
range (Iable 5B), confirming the observations of Banfield(l930) and
Hildebrand(1940). Although there are limited host range strains in the biovar 3
grouping (Panagopoulos & Psallidas, L973; Panogopoulous et al., 1978; Loper &
Kado, 1979; Thomashow et a1.,1980; Perry and Kado,1981; Knauf et a1.,1983),
these are limited to grapevine and more commonly biovar 3 srains have a relatively
wide host range (Sule,1978; Burr & Katz,1983).
Serological relationships between agrobacteria are not straighforward and are
not a reliable means for defining groups at the species level though they could be
useful for strain identification. Within biovar 3, there appeff to be at least three
serological subgroups using polyclonal antisera and probably there are more. Only
very similiar isolates were serologrcally related and although South Australian
octopine strains are serologically related, they do not react with phenotypically and
genetically similiar octopine strains from Greece. The serological heterogeneity within
biovars was recently confrrmed by Alarcon et al. (1987) in a comparative study using
several immunological assays as well as protein electrophoresis. The Rubus isolates
and biovar 3 isolates tested are serologically unrelated to TR3, which showed poor
specificity and had low titres even against itself. For this reason,the TR3 antiserum
appears to be unsatisfactory and further studies are required. Recently a monoclonal
antibody to biovar 3 was developed by Bishop et al. ( unpublished results) and has
been shown to react only with biovar 3 and not with biovars I and2 (T. Burr, pers.
communication) or A. rubi (data not shown). The phenomenon of serological
heterogeneity within Agobacterium spp. has been observed in other studies
(Graham,1971; Nesme et a1.,1987). The finding thatK377 andK3TTpTi reacted
serologically also confirms the finding of Hochster and Cole (1967) working with
isolate 86 that antigenic determinants ¿ìre not plasmid coded. Separate species of

75
A8robacterium do appear to be antigenically different from each other; this has been
shown previously by Keane e!-AL, (1970).
In terms of growth characteristics, Agobacterium groups differ in both
gowth rate, as measured by their mean doubling times, and in their response to
gowth factors. Both biovar 2 and Rubus isolates display a marked response to
gowth factor addition in a defined media Clable 9B); biovars 1 and 3 have a limited
response to growth factor addition. The lack of an obvious growth factor response in
nutrient broth as compared to mannitol-glutamate is probably due to the greater
availability of vitamins in the forrrer media.
Motility tess indicated an effect of media nutriúon on the motility of biovar 3
but not of the other Agrobacterium groups. Biovar 3 and A. rubi strains tested were
not all motile and those that were appeff to have a lower percentage of actively
swimming strains than either biovar I or 2 strains. Under TEM, biovar 3 strains
appeared to have a lower proportion of flagellated cells and the flagella look atypical,
in comparison to a biovar 1 isolate. It is possible that, because of the importance for
the grapevine and Rubus strains of 'passive' survival in the host's vascular system as
opposed to su¡vival and dissemination in the soil, that these strains a¡e less motile
than biovars 1 and 2.
Data from phenotypic, genetic and serological tess all indicate that there are at
least four separate groups within Agrobacterium. The low DNA homology between
groups (<257o in most cases) warants these groups being named as separate species.
Although the suggestions for nomenclatural changes to the genus proposed by
Kersters & De Ley(198a) would be ideal, they do not conform to taxonomic rules.
Therefore, it is proposed that Group A (biovar 1) in this study be designated A.
tumefaciens and Group B (biovar 2) be designated A. rhizogenes. Group C,
comprising strains identif,red as biovar 3, has no specific name at present.
Considering the very close association of these strains with grapevine, A. viti seems
appropriate and will be proposed. A. rubi should be retained for isolates conforming
to the original description of this species by Hildebrand (1940), Group D in this
76
study. It should be realized that the specific names forGroup A and B do not describe
pathogenicity which should be indicated by infi:a sub-specific epithets. This proposal
seems to be a less confusing alternative to the present taxonomy and one which
complies with the rules of bacterial nomenclanre.

77
PART C: OTHER OPINE-UTILIZING BACTERIA
INTRODUCTION
The theory of genetic colonization (Schell, 1978; Schell et al., 1979) and the
opine concept (Petit et al., 1978; Tempé et al., 1979; Guyon et al., 1980) botlt
postulate that the opine-related genes are the reason for the existence of the Ti-
plasmid. Since the discovery that the opine synthesis and catabolism genes are on the
Ti-plasmid (Bomhoff et al.,1976; Kerr & Roberts, 1976; Montoya et a1., 1977).,ít
has been theorized that these genes are providing the agrobacteria which carry them
with a competitive advantage in the galls- This theory is discussed and examined more
extensivoly in Part A of this thesis.
The opine concept was formulated at a time when it was presumed that opine
catabolism was exclusive to Ag¡obacterium spp. and that they could then
preferentially colonize galls. Since then there have been reports of Pseudomonas
(Kohn & Beiderbeck, 1982; Beaulieu et a1., 1983; Brisbane & Kerr, 1983; Rossignol
& Dion, 1935) and coryneform bacteria (Tremblay et al., 1987) existing in diverse
environments which can catabolize a number of the opines.
Pafi C of this thesis is divided into two sections. It looks at two separate
genera of bacteria which a¡e both capable of catabolizing opines- fluorescent
Pseudomonas spp. and fermentative bacteria which have not been identified. The
possible use of the former in a biological control strategy is discussed and
speculations are made on the role of these bacteria in the ecology of crown gall.

78
PART C- PSEI.JDOMONAS
MATERIALS AND METFIODS :
1. Strains used and their isolation
Soils were collected from around the base of uninfected, established vines in
three vineyards with no previous history of crown gall. The three sites were the V/aite
Agricultural Research Institute and two commercial vineyards in the Southern Vales
area south of Adelaide- Cambrai and Pirramimma. Ten 1 gram subsamples were taken
from each of the vineyard soil samples and suspended in 10 ml sterile distitled water
(SDV/), diluted and plated on one of the two selective media for biovar 3 and on
King's medium B and incubated at 28oC. Appendix A describes the composition of
all media used.
A second goup of isolates was obtained from galls on K5140 and Salt Creek
rootstocks. Galls were macerated in a mortar and pestle in SDW and five 100 pl
aliquos per gall were plated on nutrient agar and incubated at 28oC.
The final group of strains were isolated from K5140 rootstocks obtained from
the Vine Improvement Committee, Í,oxton, South Australia. These vines were being
checked for the presence of Agrobacterium biovar 3 in the vascular system by the
vacuum-flush method described in Part A, Materials and Methods. Several isolates
which grew on the biovar 3 selective medium of Roy & Sasser (1983) were found to
be positive for fluorescence on King's medium B and were used in this section of the
study. Strain K315 was isolated from grapevine in L977 andhad been found to be a
Pseudomonas spp. Its fluorescence on King's medium B was confirmed.
All isolates, from soil, galls and rootstocks, were purified by streaking for
single colonies on King's medium B and were stored in SDW at 10oC, according to
the method described by Sly (1983). All strains and their origin a¡e listed in Table lC.

Table lC. Str¿ins and their origin
A. Fluorescent isolatesl
Strain designation Isolated from2:
P-2
P-L4P-18
P-20
vineyard soil, Waite Institute octopme
octopine, dMGluoctopine
nopaline
octopine, nopaline
nopaline
octopine, nopaline
octopme
none
I
il
lt
I
il
il
Ir
r
Cambrai 2-6
Cambrai 2-3
Pirr 1-8
Hn l-2
SC4K51 #1
K51#5
v-16Y-2LY-n
K315
R-1
R-6R-16R-20R-25R-30
soil, Cambrai vineyard
soil, Piramimma vineyard
gall, Salt Creek rootstockgall, K5140 rootstock il
il
from vascular system, K5140il
il
from grapevine gall, South Australia octopme
B. Ogine catabolizing isolates from Rubus galls
Strain designation Opine(s) catabolized3
Rubus cv.'Silvan' galls nopalineI
il
r
il
ll
none
nopaline
none
il
1- these isolates are referred to as Pseudomonas in the text All are positive forfluorescein production on the medium of King et al., 1954.
2- see "Materials and Methods", Part C fo¡ details of the isolation of these strains.
3- see "'Materials and Methods", Part C.

79
2. Onine Catabolism
Isolates were checked for catabolism of the opines octopine, nopaline and
dMGlu (mannopinic acid; Dahl et al., 1983) as described in Section B, Materials and
Methods. The galls from which Pseudomonas isolations were made were found to
contain octopine and cucumopine when checked for opines by high-voltage paper
electrophoresis (Part B, Materials and Methods).
3. Biochemical Tests
Standard biochemical tess and tests for gtowth on selective media were
performed as described in Part B, Materials and Methods.-Production of the
fluorescein pigments characteristic of the fluorescent Pseudomonas group was tested
by streaking fresh cultures of each strain on to King's medium B, incubating for 24 to
48 hours at 28oC and checking for fluorescence under W (302 nm) illumination.
Utilization of D-glutamate, thought to be a selective characteristic for Agrobacterium
biovar 3 (Kerr & Brisbane, 1983) was tested by streaking fresh cultures of each strain
on the minimal medium of Petit (described in Appendix A), amended,with0.2%o
mannitol and0.057o D-glutamate. Plates were incubated at 28oC for 2to 4 days and a
biovar 3 strain was used as a positive control.
4.Inhibitory Activit)¡
In vitro: The method of Stonier (1960) was modified to check for inhibitory activity
of Pseudomonas isolates. A 10 pl aliquot of a suspension (108 cels/rnl) of a putative
inhibitory isolate was spotted on agar, allowed to dry and incubated at 28oC for 48
hours. Plates were then exposed to chloroform vapours for 10 minutes, allowed to air
for 15 minutes and a 3 ml agar overlay containing the indicator strain was poured over
the plate. Inhibitory activity was tested on a number of media- nutrient agar,
Pseudomonas minimal medium, King's medium B and King's B amended with either
10 mg/rnl FeEDTA, l0 pM FeCl3 or lmM tri-sodium citrate. The addition of an iron

80
source was rnade to investigate whether inhibitory activity was due to the production
of a siderophore (Kloepper eta!, 1980a) a¡rd the addition of tri-sodium ciuate was
made in order to remove all traces of iron in the medium. All media are described in
Appendix A.
In vivo: Selected Pseudomonas isolates which were inhibitory in in vitro assays were
further tested for inhibition of AÊrobacterium biovar 3 in vivo by several methods.
Coinoculations of Pseudomonas and Agrobacterium were made on tomato
stemsusingthemethodof KerrandHtay (L974). Varyingratios(1:100, L:L0, 1:1,
10:1, 100:1) of turbid (108 cells/ml) suspensions of Pseudomonas: Agrobacterium
were inoculated into tomato stenìs and results recorded after 4 weeks. Gall size
relative to control inoculations of biovar 3 was recorded.
A similiar assay was done on carrot discs (Materials and Methods, Part A)
using 1:1 and 10:1 inoculumratios of Pseudomonas: Agrobacterium. Aliquots (20 ttl)
of the mixed suspensions were inoculated onto the apical side of carrot discs
(described in Materials and Methods, Part A). Discs were inoculated as previously
described and results lilere recorded as gall weighs after 7 weeks. All tests were done
in duplicate.
One isolate (Cambrai 2-6) was chosen for use in an experiment to test in vivo
inhibition of biova¡ 3 isolates K309 andK377 on grapevine. Rooted Cabernet
Sauvignon cüttings were wounded just above the butt of the stem and dipped in a
turbid (9 x10⁸ ce[s/ml in SDW) suspension of isolate Cambrai 2-6for 5 minutes.
They were then planted directly nto25 cmpots conøining a moist, non-sterile 1:1
sand: loam mixture which had been mixed mechanically with 107 cels of K309 or
K377 per litre of soil. Plants were grown under glasshouse conditions. Numben of
both bacteria in soil were recorded af¡er 24 hours and again after 3 and 6 months. Dry
weights of galls were recorded after 3 and 6 months.

81
5. Pathogeniciw tests
Pseudomonas isolates were tested for pathogenicity on tomato stems and
carrot discs using the method described in Part A, Materials and Methods.
82
PART C- PSEI.JDOMONAS
RESULTS:
1. Occurrence and abundance of Pseudomonas
Pseudomonas were isolated from all soil samples; it should be noted that none
of the vineyards from which samples were taken had any history of crown gall.
Numbers of Pseudomonas in soil were 104 to 105 cfu/g soil in all cases. Similiar
isolates were obtained from crown galls and from the vascular washings of
grapevines, indicating that they are widespread and can systemically colonize vines.It
should also be noted that, in sepamte isolations, fluorescent Pseudomonas spp. were
found at levels of 103 to 104 cells/ c-2 root on both Ramsay and K5132 rootstocks
obtained from a Barossa Valley nursery.
2. Opine Utilization
Table lC lists the opines catabolized by representative isolates. A larger
number of isolates from each sample site were tested for opine catabolism and were
found to vary widely in this respect. Isolates from the vine galls, which contained
octopine and cucumopine, were all able to catabolize octopine but not nopaline.
Isolates from soil and vine roots varied in their opine catabolism; isolates from the
snme location could catabolize octopine, nopaline, neither or both. Approximately
807o of rootstock isolates could catabolize at least one of the opines; on the other
hand, only lïVo of the systemically-isolated Pseudomonas were capable of
catabolizing opines. Figure LC shows in vitro octopine catabolism of Pseudomonas
isolates from K5140 rootstocks.

Figure lC. Octopine utilization by pseudomonas isolates.
Growth after 3 days incubation at 28oC onPetit's minimal medium plus0.27o octopine.
K309: positive controlIsolates 1-11: Pseudomonas isolated fromvascular system of Ramsay and K5140dormant cuttings.

83
3. Biochemical tests
Table 2C lists the biochemical characteristics of representative Pseudomonas
isolates. All are positive for fluorescein production on King's medium B. All are able
to grow on the selective media for Agrobacterium, including that of Roy & Sasser in
many cases (1983), but most could be distinguished on the latter from biovar 3 by
their more mucoid colony morphology and lack of red centre. All strains tested were
able to utilize tarftate, a characteristic which is associated with biovar 3 Agrobacterium
strains, with some biovar 1 isolates from grapevine, as well as with biovar 2 strains
(see Part A). Ability to use D-glutamate was tested because this trait was the seleôtive
basis for the biovar 3 medium of Brisbane & Kerr (1983); however, over 507o of
Pseudomonas isolates tested were able to catabolize D-glutamate. There were no
consistent patterns observed in the 5 strains tested for ca¡bon source utilization and no
attempts were made to identify these isolates further.
4. Inhibitorv Activity
In vitro: Approximately 80Vo of fluorescent pseudomonads isolated in this study were
inhibitory to Agrobacterium in varying degrees. Table 3C shows the range of
inhibitory activity of representative Pseudomonas isolates to strains of Agrobacterium
biovars 1,2 and 3. None of the inhibitory Pseudomonas isolated in this study were
active in vitro against biovar 1 but all were inhibitory to the biovar 2 and 3 strains
tested (Figure 2C). Isolates P-2 and P-14 produced very sharply defrned zones of
inhibition against all biovar 2 isolates tested and generally produced larger, more
diffuse zones against biovar 3 isolates @gure 2C). Isolate P-18 differed in the sense
that it produced large, sharply deñned inhibition zones against both biovars 2 and 3.
Isolates V-21 a¡rd V-38 were tested for inhibitory activity against K869, a
representative of the Rubus cane gall group described in Part B. Both V-21 and V-38
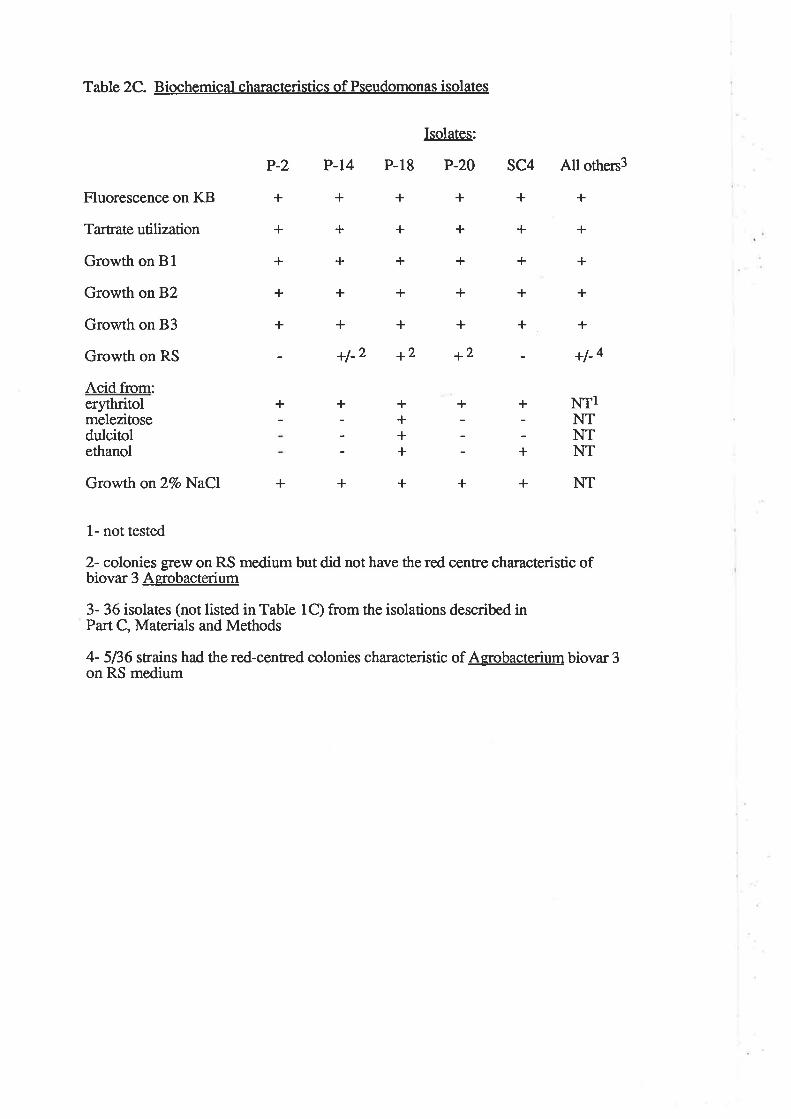
Table 2C. Biochemical characteristics of Pseudomonas isolates
Fluorescence on KB
Tartrate utilization
Growth on 81
Growth on 82
Growth on 83
Growth on RS
Acid from:er¡hritolmelezitosedulcitolethanol
Growth on27o NaCl
+
+
+
+
+
P-2 P-14
+
Isolates:
P-18 P-20
++++++++++a2 ¡2
SC4 All othen3
+
+
+
+
+
+l-4
NIINTNTNT
NT
+
+
+
+
+
+
+
+
+
+
+l-2
+ l+
+
+
+
++++
+
+
+
1- not tested
2- colonies grew on RS medium but did not have the red centre characteristic ofbiovar 3 Aerobacterium
3- 36 isolates (not listed in Table lC) from the isolations described inPart C, Materials and Methods
4- 5ß6 strains had the red-centred colonies characteristic of Agrobacterium biovar 3on RS medium

Table 3C. Specificity of in vitro inhibitory activity of Pseudomonas isolatesl
Inhibition of A grobacterium groups:(mm inhibition zone indicated in parenthesis)
Isolate: 814 P+ Y+
P-2P-14P-18
K51 #1 6
K51 #5 6
SC#46
v-38 7
Y-2t7Y-n 7
NTNTNT
8NTNTNT
+ (20-25\2+ (r6-2D2+ (21-40)2
+ (30)
+ (27)+ (32)+ (33)
+ (12-20)3
+ (16-4Ð 3
+ (40-50) 2
+ (32)+ (35)
+ (30)
+ (33)
+ (33)
+ (37)+ (37)
+ (38)
+ (40)
+ (30)
+ (31)
+ (27)+ (25)
1- assay for inhibitory activity described in Part C, Materials and Methods. Tests
performed on King's medium B and results recorded after Vl. hours. Range ofinhibition zone size (mm in diameter) indicated in parenthesis.
2- inhibition zones with clearly defined edges
3- inhibition zones more diffuse; edge of zone not well-defined4- Strains assayed against 10 strains of biovar 1 (B1), 8 strains of biovar 2 (82) and10 strains of biovar 3 (83), except where otherwise indicated.
5- tested against one isolate from each group: B1 (K188), 82 (K108), 83 (K309)6- tested against two 83 isolates (K309, K377)7- tested against one isolate of B 1 (K188), B2 (K108) and two 83 isolates(K309, K377)8- NT = not tested
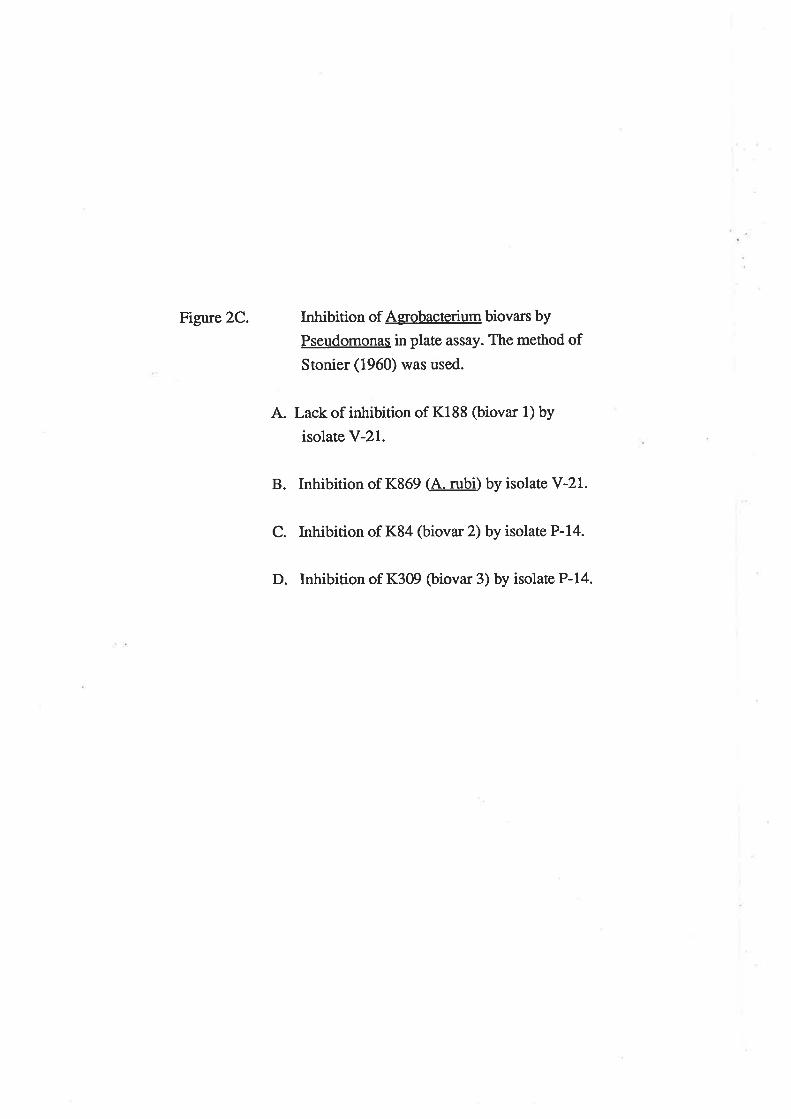
Figure 2C. Inhibition of Aerrobacterium biovars by
Pseudomonas in plate assay. The method ofStonier (1960) was used.
A. Lack of inhibition of K188 (biova¡ 1) by
isolate Y-21.
B. Inhibition of K869 (A.rubÐ by isolate Y-21.
C. Inhibition of K84 (biovar 2) by isolate P-14.
D. Inhibition of K309 (biovar 3) by isolate P-14.

B
.tù
84
produced large zones of inhibition ( 43 and 41 mm in diameter respectively) against
this isolate (Figure 2C).
Table 4C shows the effect of iron addition to media on the inhibition of biovar
3 strain, K309, by the Pseudomonas isolates. In all experiments, inhibition was not
reversed when 10 pM FeCl3 or l0mg/ml FeEDTA were added to the media. The
complete reversal of inhibition with added iron which has been noted by others
(Kloepper et al., 1980) was not observed with these isolates. In some cases (e.g.
isolate P-2), inhibition decreased on King's B medium when iron was added but
increased when iron was added to the minimal medium.
The effect of iron addition on the inhibition by P-2, P-14 and P-20 of 6 biovar
2 strains was also tested. Inhibition of biovar 2 was observed with and without iron
in all cases and, in some instances (Figure 3C), inhibition zones were larger when the
media was amended with iron. Properly replicated trials would have to be performed
to see if this was a statistically significant effect but once again the results confrm that
the mode of action of these isolates is not via iron-binding siderophores.
Table 5C compares the inhibitory activity of the biological control strain K84
and Pseudomonas isolate P-14. The rate of diffusion of the P-14 inhibitory molecule
suggests that it is of low molecula¡ weighf
In vivo: When tomato plants were coinoculated with Agrobacterium biovar 3 isolates
and Pseudomanas isolates, there were no differences in gall size between control
inoculations with biova¡ 3 only and those plants coinoculated with Pseudomonas.
'When carrot discs were coinoculated, there were reductions in gall size in
comparison with controls at a 10:1 ratio of Pseudomonas: Agrobacterium for three
Pseudomonas isolates, P-14, P-18 a¡rd K315. These differences were not significant
(P< 0.05) because of the large variation between sep¿uate inoculations on carrot discs.
On grapevine, no signifrcant (P< 0.05) differences were noted in gall weights
after 3 and 6 months between inoculations of biovar 3 only and coinoculations of
biovar 3 and Pseudomonas. Galls were formed on all treatrnents at both sample times.
Numbers of biovar 3 on vine roots were approximately 5 x 10⁵ cfr¡/cm2 root after 3
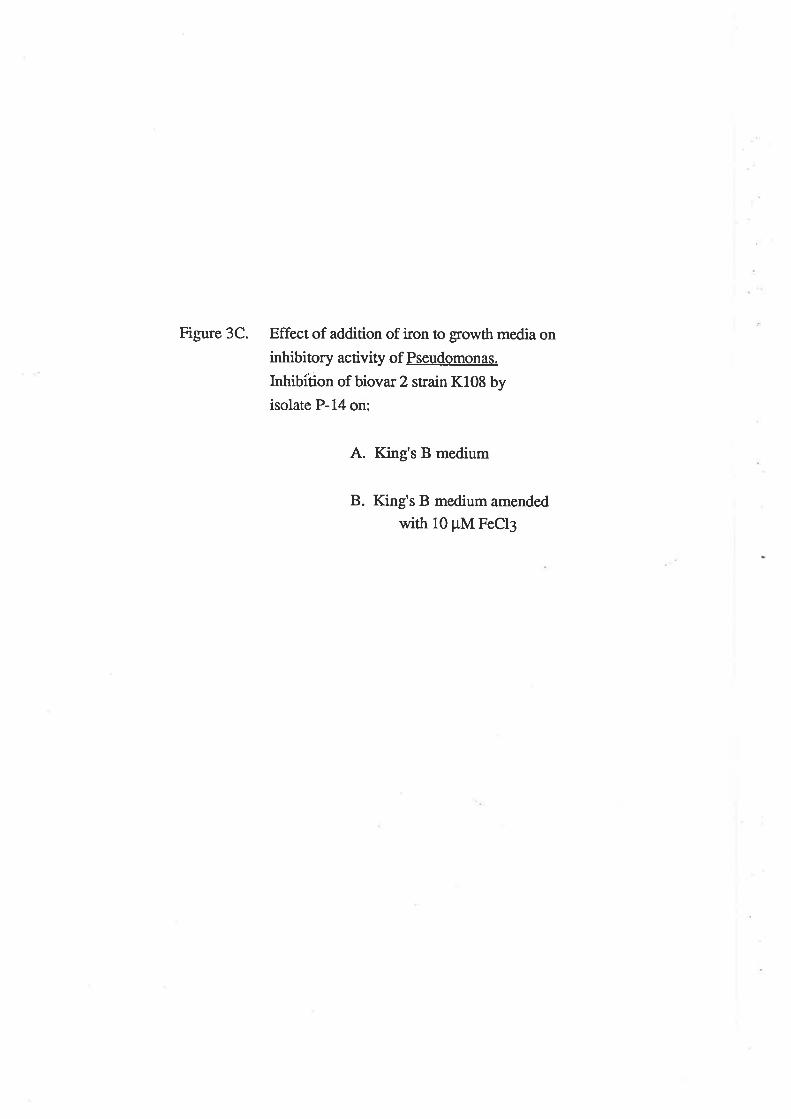
Figure 3C. Effect of addition of iron to growth media oninhibitory activity of Pseudomonas.
Inhibiúon of biovar 2 strain K108 byisolate P-14 on:
A. King's B medium
B. King's B medium amendedwith 10 pM FeCt3

KB t Fc-t{: tot
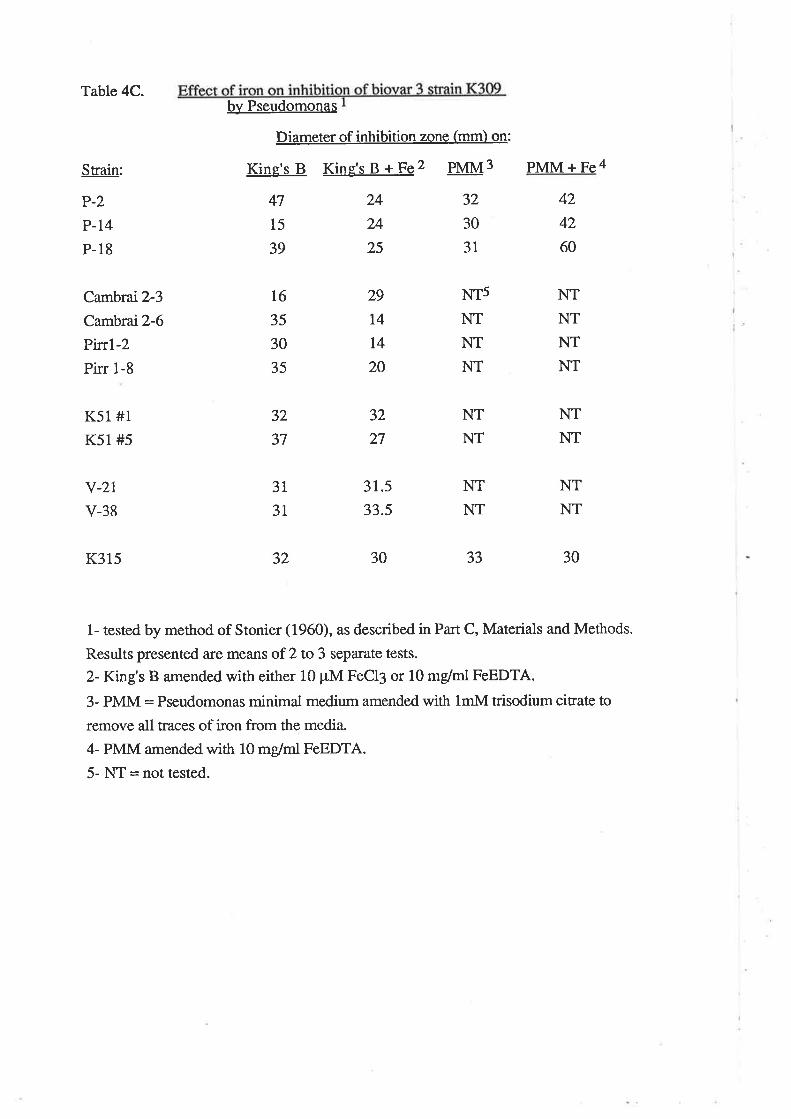
Table 4C.
Strain:
P-2P-14
P-18
Cambrai 2-3
Cambrai 2-6Ptrrl-2Pirr 1-8
K51#1K51#5
Y-21v-38
bv Pseudomonas
Diameterof inhibition zone (mm) on:
King's B King's B + Fe2 Pl¡tM3
47 24 32
15 24 30
39 25 31
29
74
t420
32
37
32
27
PMM+Fe4
16
35
30
35
424260
NTNTNTNT
NTNT
NTNT
30
¡1sNTNTNT
NTNT
NTNT
33
3l31
31.5
33.5
K315 32 30
L- tested by method of Stonier (1960), as described in PaÍ C, Materials and Methods.
Results presented are means of 2 to 3 separate tests.
2- King's B amended with either 10 pM FeCl3 or 10 mg/ml FeEDTA.
3- PMM = Pseudomonas minimal medium amended with lmM trisodium citrate to
remove all traces of iron from the media.
4- PMM amended with 10 mg/rnl FeEDTA.
5- NT = not tested.
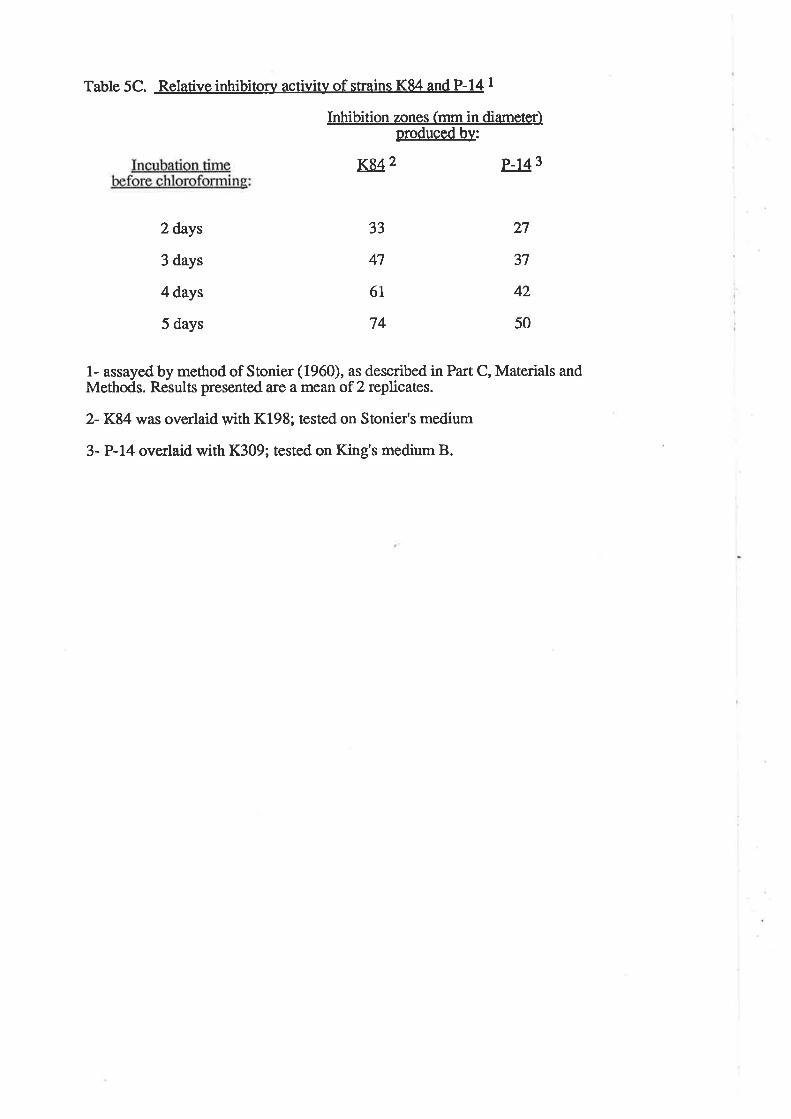
Table 5C. Relative inhibitory activity of snains K84 and P-14 I
Inhibition zones (mm in diameter)oroduced bv:
K84 2 P-r43
2 days
3 days
4 days
5 days
33
47
6l
74
27
37
42
50
1- assayed by method of Stonier (1960), as described in Part C, Materials andMethods. Results presented are a mean of 2 replicates.
2-K84 was overlaid with K198; tested on Stonier's medium
3- P-14 overlaid with K309; tested on King's medium B.
85
months and 5 x 10³ cfulctû root after 6 months for both K309 and K377. There
were no signifrcant differences be¡ween numbers of biovar 3 on vines with and
without Pseudomonas. Numbers of the Pseudomanas isolate, Cambrai 2-6, on
sampted roots were comparable to those of biovar 3, i.e. 5 x 10⁵ cfulcrfl root after 3
months and 3 x 10⁴ cfu/cm2 root after 6 months.

86
PART C- PSEUDOMONAS
DISCUSSION
Because biological control of grapevine crown gall cannot be achieved with
strain K84 (Ken & Panogopoulous,l9TT;Ken & Tate, 1984), it would be desirable
either to find or to genetically engineer a biological control agent effective against the
grapevine strains. Fluorescent Pseudomonas spp. isolated in this study appeared to
have some potential for this role from results obtained in in vitro inhibition assays.
The pseudomonads are capable of inhibiting biovar 3 Agrobacterium strains in plate
assays and they appear to have some specificity in that they inhibit biovar 2 and3
strains and the Rubus cane gall isolates but not biovar 1.
The mechanism by which inhibition occurs was not determined in this study
but it is clearly not via the iron-chelating siderophores. The importance of
siderophores in the inhibition of plant pathogens in the rhizosphere is not clear
(Hemming et al., 1982; Lockwood & Schippers, 1984) and the possible role of
antibiotic molecules produced by these strains also has been examined ( Strobel &
Lanier, 1981; Weller& Cook, 1983). Pseudomonads produce a wide variety of
secondary metabolites, including phytotoxins and antibiotics (tæisinger & Margnfl
1979) which are responsible for inhibitory activity in some isolates (Howell &
Stipanovic,1979:1980, V/eller & Cook, 1981; Colyer & Mount, 1984; Xu & Gross,
1986). No further work has been done on the isolates used in this study to determine
the nature of the inhibitory molecule(s) except to ascertain that they a¡e of low
molecular weight. The phenomenon of increased inhibition when iron is added to the
media, observed against biovar 2 isolates in this study, has been noted previously
(Hemming et al., 1982).It is possible thatmore than one inhibitory molecule is being
produced by isolates in this study; inhibition zones produced against biovars 2 and3
were distinctly different and the increased inhibition of biovar 2 but not biovar 3 when
iron was added supports this proposition.
Many of the pseudomonads isolated in this work were able to catabolize
opines and this combined with the fact that they were isolated from the vascular

The high percentage of Pseuclomonas isolates in this snrdy which could catabolize
opines may reflect the media from which they were isolated and may not reflect the
percentage of opine-catabolizing Pseudomonas in the field.

87
(i.ns"rl)system of grapevine, makes them potentially useful in biological control.^The 4't2ih+Y ol p.,:dorron,-
La>
.-okxlta<- +h+ yc..pevc;.re. ' is important given the systemic nature of the biovar 3 pathogens on
vines (discussed in Part A). However, the in vivo inhibition assays performed in this
study were uniformly unsuccessful both in decreasing numbers of Agrobacterium and
in controlling gaü formation. The in vivo assays were crude and limited in the number
of isolates studied. In order to properly determine whether these strains were capable
of controlling biovar 3, an in vivo assay on grapevines would have to be set up to
screen large numbers of isolates. It is probably overly simplistic to apply
Pseudomonas isolates to vine roots and a more interesting possibility for use of these
or other inhibitory isolates might be to introduce them into the vascular system of
'clean' rootstocks or scions as a protectant. The other possibility is to ransfer
antibiotic production from inhibitory strains such as these into nonpathogenic
Agrobacterium biovar 3 isolates; systemic entry into vines does not appeü to be Ti-
plasmid coded ( Bun et al., 1987b) so they would make ideal 'carriers' of antibiotic
genes.
The possible role of these pseudomonads in the ecology of crown gall disease
is discussed in the general discussion at the end of Part C.
88
PART C- FERMENTATTVE BACTERIA
MATERIALS AND METHODS
1. Isolation of strains
All strains used in this section of the study are listed in Table lC. All were
isolated from galls found on the roots or crown of Rubus cv. 'Silvan' (Mc Gregor &
Kroon,1984). Galts were surface-sterilized in one-tenth strength Milton's solution
(l6.5Vo sodium hypochlorite), rinsed with SDV/ and macerated in buffered saline
with a mortar and pestle. Dilutions were made in buffered saline andplated on yeast
extract (YE) agar or yeast mannitol (YM) agar with added gowth factors (Part B,
Materials and Methods). Large, mucoid colonies appeared after24 hours'incubation
at 28oC and were further purified on YM agar (isolates R-1, R-6, R-16, R-20).
Colonies which were slower-growing and less mucoid were isolated after 3 days and
were purified on nutrient agar with added growth factors (isolates R-25, R-30).
2. Opine catabolism and pathogenicity testing of isolates
Isolates were checked for their catabolism of octopine and nopaline, as
described in Part B, Materials and Methods. The galls from which the isolations were
made were found to contain nopaline (Figure 4C) when checked for opine content by
high-voltage papü electrophoresis (Part B, Materials and Methods).
Pathogenicity was tested as described for Agrobacterium isolates (Part A,
Materials and Methods). Indicator hosts used were tomato (L]¡cooersicon esculentum
Mill. va¡. 'Early Dwarf), blackberry ßubus L. cv.'Silvan'), tobacco (NicotianA
glauca Graham.) and broad bean C{icia faba L.). Inoculations were made on roots,
stems and at the crown on all hosts.
3. Biochemical tests
The procedures for all biochemical tests on the Rubus isolates are described in
Part B, Materials and Methods. Fluorescence on King's medium B was tested as
described in Part C (Pseudomonas). Fermentation of glucose was determined by the

Figure 4C. High voltage paper electrophoresis ofRubus cv. 'Silvan' gall extract.
Paper stained with phenanthrenequinone
reagant (Yamada & Itano, 1966) for the
presence of guanidines and photographed
under UV (302 nm) illumination.
Lanes:
1. nopaline standard
2. gall extract


89
merhod described by Fahy and Hayward (1983) using the basal medium of Hayward
(1964) (see Appendix A). An isolate of Erwinia carotovora, K80, was included as a
positive control in the fermentation assay.
4. Growth Rates
Growth rates of selected isolates were compared to those of agrobacteria in
nutrient broth (NB) bottt with and wittrout growth factors, using the method
described in Par:t B, Materials and Methods. Growth was followed by measuring the
optical density of the cultures at 640 nm and cell densities were calculated as
described previously.
5. Microscop]¡
Two isolates, R-1 and R-25, were Gram-stained using the method described
by Fahy and Hayward (1983) and viewed under oil immersion with a light
microscope. Isolate R-25 was also viewed by scanning electron microscopy (SEM).
Preparation for SEM viewing was by critical-point drying as described in Part B,
Materials and Methods.
6. DNA Melting Points
DNA of isolates R-6, R-25 and R-30 was prepared and the midpoint of the
thermal denaturation curves was determined by the methods described in Part B,
Materials and Methods.
7. Plasmid isolation
Plasmid isolations were made from isolates R-1, R-6, R-16, R-25 and
R-30 and visualized by agarose gel electrophoresis as described in Part A, Materials
and Methods. Plasmid DNA isolated from the biovar I strain, NCPPB 2437 (labte
1B), was included as a size marker.

90
PART C- FERMENTATTVE ISOLATES
RESULTS:
1. Biochemical characteristics
Table 6C lists the results of a range of determinative tests performed on the
isolates from Rubus galls. All strains are capable of fermenting glucose and produce
gas very stongly in that test. Their growth on aniline blue medium was different from
the reactions seen with Agrobacterium - bacterial growth was blue andvery mucoid
with no associated clearing of the media- Utilization of the 12 carbon sources tested
was not completely consistent between isolates of this group. Isolates R-16 and R-20,
which do not catabolize nopaline (Iable 6C), were atypical in their ability to utilize
both L-tarrate and ethanol. R-16 was also different in that it has a requirement for
biotin in the growth media and is able to utilize dulcitol. All isolates were able to
utilize the six sugars tested. Four out of the six isolates listed in Table lC were able to
catabolize nopaline; out of a total of 30 strains isolated from Rubus galls, 23 were
able to catabolize nopaline.
2. Growth rates
The growth of strains R-l and R-6 was rapid in comparison with
Agrobacterium strains (Table 8B) in nutrient broth. The mean doubling times for R-l
and R-6 in nutrient broth were 42 and 38 minutes respectively and neither strain was
affected signif,rcantly by the addition of growth factors. The lag phase was very short
for the Rubus isolates (2 hours in both cases), in comparison with lag times of 6 to 10
hours for all of the Agobacterium strains tested. The final cell densities achieved
were comparable to those of AÊrobacterium (109 ce[s/rnl).
3. Pathoeenicity
None of the Rubus strains were pathogenic on any of the host plants tested,
including Rubus cv. 'Silvan', from which they were isolated. In most cases, callus
formation was apparent 2 to 3 weeks after inoculation, giving the appearance of an

Table 6C. Biochemical characteristics of \ubus isolatesl
Isolate:
R-l Bú R-16 R-20 R-25 R-30Growth on selective media
for Aprobacterium:
B1B2RS
3- ketolactose production
Growth factor requirement
Agrocin 84 sensitivity
Growth on27o NaCl
Aniline bluereaction3
Growth at37oC
Fluorescence on KB
Fermentation of glucose
C source utilization:
mannitoldulcitolerythritolarabitolethanolmelezitoseL-tartrateD-galactoseL-arabinoseD-xyloseD-mannoseD-glucose
Opine utilization
nopalineoctopine
¡2
+
3
+
3
+ + +
3 3 3
+ +
aJ
+
++ + +
++
+
I+
;++++
:+
l;+++++
+
:
;+++++
+
l++++++++
;+++++++
;+++++
+++l

1- All tests are dessribed in Pan B, Materials and Methods except fluorescence on KBand fermentation of glucose which a¡e decribed in Part C, Materials and Methods.
2- Isolate R-16 had a requirement for biotin but not nicotinic acid or calciumpantothenate in the growth media. Part B, Materials and Mettrods describes the testfor growth factor requirement.
3- This test is described in Part B, Materials and Methods. Reactions of the isolates inthis table were of neither Typel nor Type 2. A reaction was considered'T¡te 3'when the bacterial growth on aniline blue medium was blue, mucoid and there was noclearing of the surrounding medium.

9T
unhealed wound but no blackening or rotúng of plant ússue was observed nor was
there any tnre gall formation. When the callus tissue was tested for the presence of
opines by high-voltage paper electrophoresis, none were found, indicating that no
plant cell transformation had occured.
4. Microscopy
'When strains R-l and R-25 were Gram-stained, both appeared as Gram-
negative short rods singly or in clusters. Under SEM, isolate R-25 appeared as a
short (1 pm) rod with a large number of protruberances on its surface (Figure 5C).
No flagella were visible in the preparations made by either freeze-drying or critical-
point drying.
5. DNA Melting Points
The midpoint of the thermal denauration profrle (T-) was determined for
DNA isolated from three strains inlx SSC. The melting points (and corresponding
guanine-plus-cytosine contents) of strains R-6, R-30 and R-25 were 94.1 (60.5),
92ß (57.3) and 92.8 (57.3) respectively.
6. Plasmids
Of the 5 strains tested, 2 strains, R-l and R-25 (Figure 6C), contained
plasmids in the size range of the Ti-plasmid of NCPPB 2437 GVIW = 131 x 10-6;
Sciaky et al., 1978). The presence of a plasmid is not correlated with ability to
catabolize nopaline because R-6 and R-30 were able to catabolize nopaline but there
were no visible bands in plasmid preparations of either isolate. The wide host range
mobilization plasmid, RP4 (described in Part A, Materials and Methods), was
introduced into both R-1 and R-25. Attempts were then made to mobilize the plasmids
of R-1 and R-25 into the plasmidless Agrobacterium strain, CIRS. The RP4 plasmid
was successfully transferred and maintained in C1RS but the plasmids from Rubus
isolates were not visible. When the plasmid, pDP35, carrying the cloned fragment of
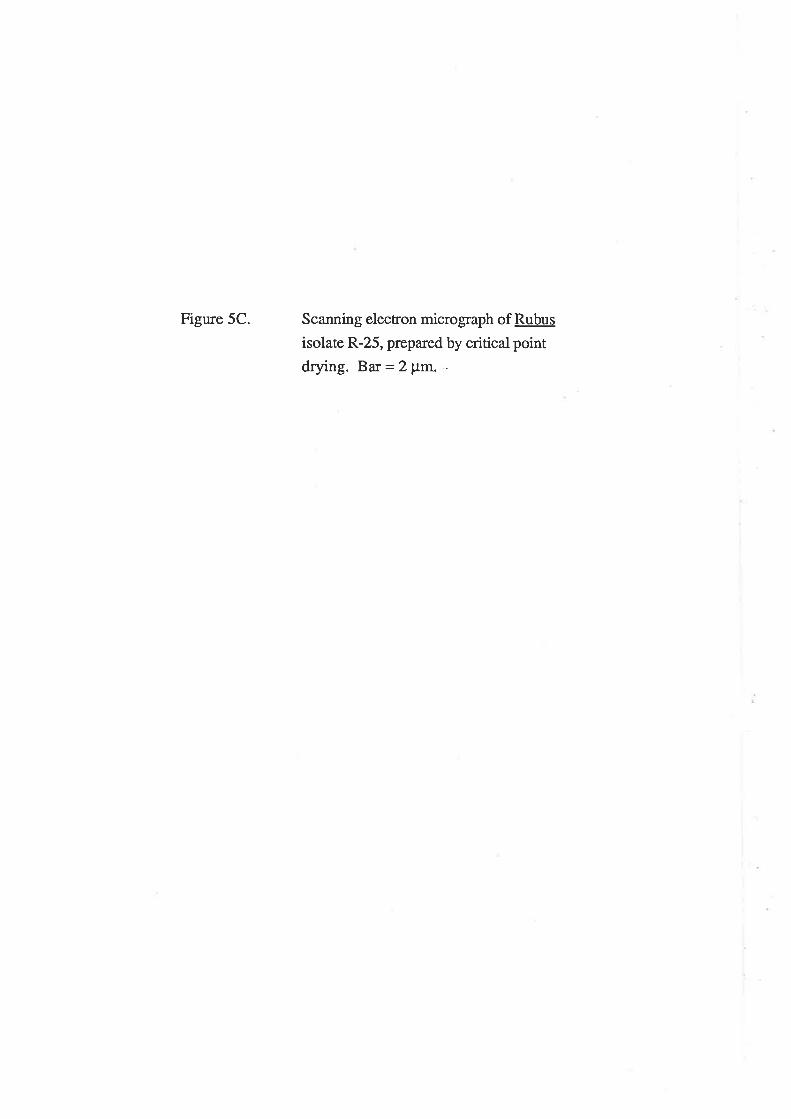
Figure 5C. Scanning electron micrograph of Rubus
isolate R-25, prepared by critical pointdrying. Bar=2p^. -


Figure 6C. Agarose gel electrophoresis showing plasmids offermentative isolates from Rubus galls.
Lanes:
A. Rubus isolate R-30B. " ' R-25c. " " R-16D.''R-6E.*"R-1F. K188 (biovar 1 Aerobacterium)
Anow indicates chromosomal DNA.

AB CD E F
\r/
- - +..>

92
the AÊrobacteriumplasmid incompatibility (Inc) region (Part A, Materials and
Methods) was introduced into R-l and R-25, it coexisted with the resident plasmids
of those strains. These results indicate that the plasmids resident in the Rubus stains
do not code for nopaline catabolism, are not in the same incompatibility group as Ti-
plasmids nor are they stable in an Agrobacterium background.

93
PART C. DISCUSSION
Initially, because of their opine catabolism, lack of fluorescence on King's
medium B and their DNA melting points, the isolates from Rubus galls were thought
to be agrobacteria. However, thei¡ fermentative nature, carbon source utilization and
appearance under SEM confirms that they are not. Thei¡ genus was not determined
but it is apparent from the results obtained with bottr the Pseudomonas and the
fermentative isolates that there are genera other than Agrobacterium which are capable
of catabolizing opines. This confirms and extends the reports of other workers (Kohn
& Beiderbeckw L982; Beaulieu et al., 1983; Brisbane & Kerr, 1983; Rossignol &
Dion, 1985; Tremblay et al., 1987) The largest number of these reports involved
species of Pseudomonas. It is interesting that opine-catabolizing Pseudomonas were
isolated in this study from vineyards where crown gall had never been observed- It
should then follow that opines had never been present in that environment. This
observation is consistent with the report of Bouzar & Moore (1987) who isolated
large numbers of non-Agrobacterium opine-utilizing bacteria in a natural oak savanna
and tallgrass prairie. Beaulieu et al. (1986) indicated lhat there is very little or no
homology between opine catabolic genes in Pseudomonas and Agrobacterium. This
suggests that Pseudomonas opine catabolic genes have evolved separately, possibly
via a mutation in a previously existing degradative pathway. Because of the size of the
plasmids isolated from the fermentative strains found in the Rubus galls in this study,
it was hypothesized that these could be Ti-plasmids which had been picked up from
pathogenic agrobacteria in the galls. However, the plasmids do not code for nopaJine
catabolism nor are they in the same incompatibility group as Ti-plasmids. Unless
there is a significant amount of plant cell transformation by Agrobacterium which
does not result in gall formation but still results in the production of opines, it is
diff,rcult to see why such diverse opine catabolic systems might have evolved.
Because of the large number of non-Agrobacterium opine-catabolizing bacteria
present in the galls themselves, it is also interesting to speculate on the role of these
bacteria in the ecology of the gall. It is obvious that agrobacteria face much greater

94
competition for available opines than was previously thought. The large number of
Pseudomonas strains inhibitory to Agrobacterium present in vine galls suggests that
pseudomonads aggressively compete with agrobacteria via antibiosis. The
fermentative strains from Rubus were isolated from very old, decayed galls. It is
possible that these very rapidly-growing isolates succeed the more slowly-growing
agrobacteria in the galls. Experiments could be designed to follow the succession of
opine-utilizing bacteria in the galls- it seems possible that pseudomonads and other
opine-utilizing bacteria have a major role in the late stages of the ecology of the gall.
Certainly they appear to exist in much higher numbers in older galls than agrobacteria
themselves.
V/ith their ability to colonize both vines and vine galls, the Pseudomonas
isolates found in ttris study would make interesting candidates for biological control
of presently uncontrolled crown gall of grapevine and Rubus spp. This possibility is
more extensively discussed in the section on the Pseudomonas strains. At the very
least, the presence of non-Agrobacterium opine-catabolizing bacteria, especially in
non-opine environments leads to a quesúoning of the exclusive relationship benreen
opines and Agobacterium and speculation on the reasons for evolution of these
genes.

95
GENERAL DISCUSSION
Host-pathogen specificity and is genetic determinants arc central areas of
research in plant pathology. The advent of molecular biological techniques has led to
increased understanding in this a¡ea and the Agrobacterium system has been one of
the most intensively studied in this respect.
There are a number of stages in plant pathogenesis where specific interactions
can occur. The initial stages of the pathogenic process for a soil-borne pathogen such
as Aerobacterium are the attraction to the plant root (chemotaxis) and subsequent
colonization of the root system. The latter involves attachment, multiplication of
bacteria on the root surface and spread throughout the root system or to the rest of the
plant Once Agobacterium has become established, there a¡e a series of steps leading
to gall formation. These are relatively well-understood- The virulence genes, located
on the Ti-plasmid, are induced by plant exudates. Through a series of steps the T-
DNA is excised, transferred and incorporated into the plant genome where it is then
expressed. Specifrcity may occur at any of these stages- for example, host-specif,rc
bacteria may differ in the number of copies of the T-DNA transferred and in the nanre
of the T-DNA itself, especially with respect to the auxin and cytokinin genes
(Yanofsþ 9]!¿!., 1985a; 1985b). Host specificity in the latter stages of pathogenesis
has been studied more intensively by others (Yanofsky et al. 1985a; 1985b; Yanofsþ
& Nester, 1986). The primary focus of this work was to determine if host specif,rcity
exists in the early stages of the plant-bacterial interaction and, if so, which part of the
bacterial genome codes for this specificity.?ngrJ on ii,æ, lvvtcÈcl nttmþê.( ol s*c,;n9 .|eskd vna,t@-¡ l-he results obtained in Part A indicate that there n specificity which manifests
itself quantitatively in the bacteria s colonization of the host or qualitativety in the
pattern of colonization. The association between biovm 2 and stonefruit is an example
of the former and the association between biovar 3 and grapevine is an example of the
latter. In both cases, colonization appears to be completely determined by the bacterial
ch¡omosome and the Ti-plasmid has no discernible effect at this stage. Understanding
96
the difference between the ¡wo species is of importance when devising new control
strategies- either biological or cultural.
It is interesting that the more host-specific biovar 3 isolates systemically
colonize their hoss as do the Rubus cane gall isolates, (A.rubÐ described in Part B
(Hildebnand, 1940; McKeen, 1954). A. rubi is also very host-specific and has only
been isolated from Rubus spp. Although the phenotypic and genetic data presented in
Part B indicate that biovar 3 and A. rubi are separate species, they have obviously
evolved a similiar strategy in terrns of host colonization. Neither species survives well
in the soil and perhaps loss of saprophytic ability is the tradeoff for increased host
specificity in both cases. Virtually the entire life cycle of these bacteria is spent in
association with the plant host. In both species, motility appeared to be variable
between strains and those strains which were motile appeared to be less so than
strains of biovars 1 and 2. Decreased motility in biovar 3 and A. rubi may be a
reflection of the decreased importance of survival and dissemination in the soil for
these species. Neither of these pathogens are controlled by strain K84 and when
control measures are considered, the systemic nature of A.rubi and biovar 3 will be an
important factor to consider. It would be of great interest to look at the genes for
systemic enbry into the host for both biovar 3 and A. rubi and to determine the amount
of homology both structurally and functionally benveen them. If the genes are highly
homologous in terms of their DNA composition one would expect that they have
evolved from a cornmon ancestor but have different chromosomally-coded
determinants governing which host plant they can colonize.
V/ith respect to the early interaction with plant hostb, the only other studies
using Agrobacterium have been concerned with the process of bacterial-plant cell
attachment. There is evidence (Shaw et al., 1986 ) that agrobacteria are chemotactic to
wound exudates, specifically those that induce the vir genes, but, as yet, no
specificity between host and bacteria has been determined in this interaction. It is
possible that the separate Agrobacterium goups could respond to different levels of
the inducer or that there are separate inducing molecules for different groups. The

97
latter was recently suggested by Leroux et al. (1987) and is supported by evidence
that biova¡ 3 strains sha¡e a unique virA locus (Ma et al., 1987). It is interesting to
note the parallels between the virulence functions of A8robacterium and the
nodulation functions of Rhizobium. In the fast-growing rhizobia, the nodulation
(no{) genes are located on the large symbiotic (Sym) plasmids (Djordjevic eta!,
1986; Evans & Downie, 1986; Kondorosi & Kondorosi, 1986). Flavanoid
compounds present in plant root exudates induce the expression of nod genes @eters
et al., 1986; Redmond et al., 1986). NodD is constituitively expressed and acts as a
positive regulator of the expression of the remaining nod genes (Mulligan & Long,
1985; Rossen e1!3!., 1985). Recent work has shown that the nodD gene products
from rhizobia with different host specificities react with different sensitivity to plant
exudates (Horvath et al., 1987; Spaink g1¡¿!, 1987). Wide host range rhizobia
recognize a broader set of plant exudates than the more limited host range strains. In
this sense, the nodD and virA loci appear to be functionally analogous. If virA plays a
comparable role in determining Agrobacterium host specifrcity, it would be interesting
to examine the range of compounds which induce the vir genes of strains from
grapevine and Rubus spp.
There is some confusion in the literature on the process of attachment.
Agrobacteria attach specifically to wound sites ( Lippincott & Lippincott, 1969;
Glogowski & Galksy, 1978) within minutes of inoculation (Matthyse g]!3!., 1981).
Agrobacteria appeu to cluster at wound sites where they form cellulose frbrils
(Matthyse et al., 1981), which are important in anchoring bacteria to plant cells and to
each other. These fibrils do not appeff to determine attachment as mutants retain
virulence and attachment ability (Matthyse, 1983). There is evidence that a
lipopolysaccharide (LPS) in the bacterial outer membrane (Whatley et al., L976) binds
with pectic fragments in the plant cell wall (Lippincott et al., 1977). Although there is
some evidence that the Ti-plasmid could alter the bacterial LPS (Lippincott et al.,
1978) and binding (Matthyse et al., 1978), most of the evidence suggests that
chromosomal genes a¡e involved in binding between plant and bacteria (Lippincott &

98
Lippincott, t969; \ilhatley e!._al, L976; Ma¡ton et al., L979; Douglas g]!¿!., 1982;
Draper et al., 1983; Douglas et al., 1985). Mutants in chvB, one of the two
chromosomal loci identifred GhvA and ghvB), have been shown to lack flagella
(Douglas et a1., 1985). There has been no evidence for specificity in the attachment
process to date.
This study, however, indicates that there is specifrcity coded for by the
bacterial chromosome in its early colonization of the root. This may be due to plant
root exudates, produced either by the root system as a whole or at a particular site e.g.
a wound or lenticel. The response of the bacteria may be not only to the qualiutive
natue of the exudate but also to the relative quantities produced. Multiplication of
bacteria on the plant root system is almost certainly a response to root exudates and is
likely to be different for different species. Entry into the plant host is important for A.
rubi and biovar 3 strains and appears to be chromosomally coded in the bacteria; on
grapevine systemic enury may be related to the abitity of biovar 3 strains to form root
lesions (Burr e]!3l., 1986b). Plant exudates may play a role in selecting for these host-
specifrc forms but little is known in this area. Lippincott and Lippincon (1969)
showed that addition of growth factors increased tumorigenicity of A. rubi strains
TR2 and TR3 but whether Rubus spp. produce these factors or whether this effect
occurs in vivo is unknown.
Host specificity after artificial inoculation of the plant appears to be largely Ti-
plasmid encoded (Loper & Kado, 1979; Thomashow et al., 1980; Knauf et al. , t982;
Unger et al., 1985), although there may be genes on the bacterial chromosome which
affect host range (Ga¡finkel & Nester, 1980). Tiplasmid encoded host specifrcity
was more extensively discussed both in the General Introduction and Part A
Discussion.
A compounding factor in the association of different Agrobacterium species
with particular host plants is the apparently specific association between Ti-plasmids
and their chromosomal backgrounds. This was observed in vivo in this study @art A)
when some trÍmsconjugant strains lost the introduced Ti-plasmid. In nature, the

99
specificity in early colonization and attachment which is largely chromosomally coded
appears also to be associated with specific Ti-plasmids. The Ti-plasmid carries genes
(cytokinin biosynthesis and vir genes) which enable it to be pathogenic on the specifrc
plant host. This parallels the sitr¡ation in the taxonomically similiar Rhizobium (Detæy
et al., 1966) to a certain extent. Root colonization by rhizobia appears to be
completely under chromosomal control (Brewin g!_ú, 1983) and the large S¡'rn
plasmids present in many Rhizobium spp. (Brewin et al., 1980; Hooykaas et al.,
1981) carry the genes which induce the symbiotic interaction and code for host range.
Wang et al., (1986) also suggest that there is plant host selection for certain plasmids
suggesting that in Rhizobium as well there is a close interrelationship benveen
plasmid, bacterial chromosome and the plant host.fuær) o¡ +V¡e- tr,'nrkd n*ttfu.r^ of eiuains +esþ¿t
'fhe data presented in the gall colonization studies in Part A of this thesis give pret.rnar/arj
evidence that, once tumour formation has occurred, the Ti-plasmid plays the primary
role in determining the level of colonization achieved on the galls. This is at least
preliminary evidence in support of the opine concept. The ability to utilize nopaline in
galls does give nopaline-catabolizing bacteria an advantage in that environment. There
are opines produced in Rhizobium nodules (Tempé & Petit, 1983) and the genes for
their synthesis and catabolism are closely linked and located on the Sym plasmid
(Murphy e][3l., 1987). If these opines also act to give catabolizing rhizobia a selective
advantage then presumably the catabolic genes could be cloned into an 'ecologically
competent'rhizobium enabling it to maintain a higher population after nodule
formation. Unless plant roots are engineered to produce opines it is difficult to see
how the advantage that they provide to agrobacteria could be utilized on apractical
level. It is also important to realize that the initial root colonization and colonization of
the ungalled parts of the root system are still determined by the bacterial chromosome.
Also, opines are not providing a selective advantage to agrobacteria alone but also to
other bacterial genera (Pat C) which can catabolize opines and aggressively colonize
galls and could presumably do the same on opine-containing roots.

100
It is yet to be shown experimentally that the conjugative opines give
agrobacteria an advantage either nutritionally or by promoting Ti-plasmid transfer. In
fact the importance and amount of plasmid transfer in vivo between pathogenic and
plasmidless strains is unknown. There are large numbers of non-pathogenic
agrobacteria in galls and in the soil around galled plants (Kerr, 1969; Schroth et a1.,
L97l; New, 1972) but their role in the infection process and as plasmid recipients has
not been studied.
The study of Bouzar & Moore (1987) indicates that non-pathogenic
agrobacteria ate present in relatively high numbers in soils where there has been no
crown gall and where there are few natural hosts. They are certainly capable of
survival in soil for long periods and are considered'normal rhizosphere inhabitants'
(Schroth e.!¿!., l97l). The Ti-plasmid plays a major role in determining bacterial
levels on the gall (Part A) and so this author agrees with Tempé and others ( Petit et
al.,1978a; Tempé et al., 1979; Guyon et a1.,1980) in the assertion that the opine-
related functions are the'raison d'etre' for the Ti-plasmid- Ti-plasmids certainly seem
to provide no obvious benefit to the bacteria in their survival and multiplication when
galls are not present but they do appear to be c,- determinant of survival onaf lects* tn )¡e((wÐ c>I lVteC alor ti! lo ca)uboLtzÊ. o?ne3.
the galls that they induce¡,In this respect they support the assertion of Sherrat (1982)
that plasmids 'provide non-essential, ephemerally useful functions that allow a
bacterium to occupy a particular ecological niche'. Shenat goes on to suggest that if a
plasmid was coding for traits that were continuously essential for bacterial survival itwould be integrated into the chromosome. So the Ti-plasmids are essential only to
induce gall formation and colonization and not throughout the rest of the bacterial life
cycle.
Once the gall has begutt to decay presumably the chromosomal genes alone are
important in terms of survival. Certainly the different AÊrobacterium species seem to
have evolved quite separately in this respect. Biovars I and2 are both capable of
surviving for long periods in the soil (Patel,1928; 1929; Hildebrand,lg4l; Dickey,
1961; Schroth et al., l97l: New, 1972) but both biovar 3 ( Part A) and A. rubi

(Hildebrand, 1940) do not maintain high populations in soil and systemic movement
into the plant host appears to be of central importance in their survival and
dissemination.
The different chromosomal forms or biovars of Agrobacterium are
taxonomically quite separate with less than25%o DNA homology between them and
they warrant being named as separate species. This and resulting suggestions for
changes to the taxonomy are discussed in Part B. Biovar I (4. tumçfagigns) is not
host-specific and is a very heterogenous group (Kersters & Deley, 1984). Biovar 2 (
A. rhizogenes) is more host-specific in that it is found in association with stonefruit
and rose (New,1972) and appears to be able to colonize its host at an exceptionally
high level (Part A). Biovar 3 and A. rubi are confined virtually exclusively to
grapevine and Rubus respectively. V/ide and na¡row host range Ti-plasmids are also
genetically distinct with only low DNA homology between them (Sciaky et a1., 1978;
Thomashow et al., 1981). Increased host specificity and a closer host association, as
séen with those species which survive systemically in the host, appear to go hand in
hand. Ti-plasmid and chromosome may have co-evolvedin the presence of the host
resulting in greater divergence of the Ti-plasmids and increased speciation.
Further work is needed to pinpoint the exact nature of chromosomally-coded
host specifrcity and much work remains to be done on the role of plant root exudates
in determining both the specificity and level of colonization. It would also be
interesting to look at root colonization in more detail. Bhuvaneswa¡i et al. (1980)
showed that infection sites for Rhizobium are localized to areas just behind the root
tþ. Sites for adherence for Rhizobium and Agrobacterium may be similiar as
suggested by work (Lippincott & Lippincoft,1977) which indicates that R.
leguminosarum competes with Aerobacterium for binding sites on isolated bean leaf
cell walls. Studies could be designed to look at this very localized colonization using
scanning electron microscopy. It would be of particula¡ interest to look atrelative
colonization levels of wound sites and lenticels for biovars 2 and 3 on their respective
hosts. Galls are largely formed on almond seedlings at the point where lateral roots

t02
emerge from the main taproot (Kerr, L972). Colonization patterns in these sites may
be quite different from the rest of the root system. There is also much to be done on
the nature of the specific interactions not only between the Ti-plasmid and the plant
host but also between the Ti-plasmid and the bacterial chromosome. It is probably too
simplistic to think that only one component of the system is of ultimate importance in
deterrnining host specificity. It is more likely that there is a series of messages back
and forth between the host, bacterial chromosome and the Ti-plasmiì and each step in
the pathogenic process involves selection and specifrcity ultimately resulting in the
production of a crown gall tumour.
103
APPENDD( A: CULTURE MEDIA
1. Yeast extract agar @odriguez & Tait, 1983)
nutrientbroth (Difco).yeast exEactsucroseMgSO4.7H2OBacto agardistilled water
2. TY medium (Beringer, 1974\
3. Yeastmannitol agar
KZHPO¿MgSO¿.7HzONaClCaCl2FeCl3yeast exEactmannitolBacto agardistilled water
L3.391.og5.og
0.24g15g
to 1lite
5g3g
1.3e15g
to 1 litre
1.oglog15g
to 1 litre
o.5g
0.01g
104
4. Petit's medium (modified from Petit & Tempé, 1978b)
Agar:
Solution 1:
Solution 2:
purifieddistilled
agarwater
2oe500 ml
1ml1ml
o.2e1ml
to 400 ml
10.5g4-5e
100 ml
CaCI2 (17o soln)FeSO4 (0.57o soln)MgSO4. THzOMnCIZ (0.2Vo soln)distilled water
KZHPO+KH2PO4distilled water
Na2HPO4. L2IJ1OMgSO4. lHzOCaCl2FeCl3thiaminebiotindistilled water
0.45go.1g
0.04g0.02g
1.0 mg0.25 mgto l lire
(pH to 7.0)
For 100 ml: add 40 ml Solution 1 and 10 ml Solution 2to 50ml agar
5. Bergersen's salts (Bergersen, 196l; modified by J. Tempé)
The salt solutions are stored as 5x concentrate. Yeast extract(100 mg,Â) may be used in place of thiamine and biotin.

105
lactoseye¡rst exEactBacto agardistilled water
7. Aniline blue medium (Riker et al., 1930)
L-glutamic acidmannitolMgSO4.7H2OKZFIPO¿NaClCaCDaniline blue*yeast extractBacto agardistilled water
*' - grind in pestle and mortar with 1 to 2 ml water
8. Stonier's medium (Stonier, 1960)
potassium citrateNH¿NO¡L- glutamic acidKZHPO¿NaH2P04MgSO¿.7HZONaClCaSO¿Fe (NO3)3MnCIZZnCI2biotinBacto agardistilled water
log1g
2oeto 1 litre
2g5.ogo.2eo.2eo.2eo.1go.1g1og15g
to 1 litre(pH to 7.0)
log2.7e2.oe
0.88go.3go.2eo.2eo.1g
5.0 mg0.1 mg0.5 mg
o.2e15g
to l lite(pH to 7.0)

106
9. Mannitol- slutamate broth
mannitolLglutamicK2HPO4MgSO4.7H2ONaClbiotindistilled water
L-a¡abitolNH¿NO¡KHzPO¿KzHPO+MgSO4.7H2Osodium taurocholatecrystal violet (0.17o)Bacto agardistilted water
erythritolNH¿NO¡KHZPO¿KZHPO¿MgSO4.'7H2Osodium taurocholateyeast exEact (l%o)malachite green (O.lEo)Bacto agardistilled water
Per 100 ml add:ac¡dione(2Vo)Na2SeO3. 5HZ0 (lVo)
acidlog2g
o.2eo.2e
200 mgto 1 lire
(pH to 7.0)
3.O4g0.1690.54g1.04g0.25g0.29g
2rrd,15g
to 1 lire
3.05g0.1690.54gr.04s0.259O.29g
lmt5ml15g
to 1 litre
1 rnl1 rnl
o.5g
10. Selective media for Agrobacterium biova¡s 1.2 and 3
a) Selective medium for biovar 1 ( Kerr & Brisbane, 1983)
Per 100 ml add:acÞrdtone(2Vo)Na2SeO3. 5}l2O (l7o)
1ml1ml
b) Selective medium for biovar 2 (Ken & Brisbane, 1983)
t07
c) Selective medium for biovar 3 (Kerr & Brisbane, 1983)
A. sodium tarEateD- gluømic acid*NaH2PO4.2H2ONa2FIPO¿NaClMgSO¿. 7It2Osodium taurocholateyeast extract(lVo)Congo Red (1%)distilled water
acndtone (ZVo)Na2SeO3. 5HZO (l%o)
5.75g15 ml6.25g4.2695.8490.25g0.29g
1mt2.5 ml
to 500 ml
* - 47o solution, pH 7.0
B. MnSO4. 4HZOBacto agardistilled water
Autoclave separately. Add 50 rnl (A) to 50 ml (B) and add:
to
2g5gml
1.1I
s00
1ml0.5 ml
d) Selective medium for biovar 3 (RS Medium)(Roy & Sasser, 1983)
MgSO4. TIIZOK2I7PO4KHZPO¿adonitolyeast extractNaClboric acidBacto agar
o.2eo.9go.7e4.og
0.1490.20g
1.og15g
(p}Jto7.2)

108
Add, after dissolving each in 2 ml water:
triphenyl tetrazolium chlorideD- cycloserinetrimethoprim*
* - add 1 drop dilute acid and heat to dissolve
11. Indicator medium (to test carbon source utilization)(modified from Hayward, 1964)
.o8g
.o2e
.o2g
12. Media used to test tartrate utilization
a) Medium 1
5x Bergersen's saltsbromothymol blue*biotin (100 mg/100 ml)nicotinic acid (2 mg/ 100 ml)calcium pantothenate
(2 mel 100 ml)L- glutamic acidBacto agardistilled water
(NII¿)zSO¿KZHPO¿KHZPO+NaClpotassium sodium tartrateyeast extractbromothymol blue (see above)agardistilled water
200 ml40 rnl2rnl
10 ml
10 rnl)a
1.5g750 ml
( pH to 7.0)
* - grind 0.2 g bromothymol blue with 40 rnl 0.01N NaOH in amortil and pestle. Add 60 ml distilled water.
Sterilize carbon sources (107o solutions) and add to a finalconcentrationof LVo in indicator medium.
2go.6go.4g
2g3g
o.1g20 rnl
1.5gto 1 litre
(pH to 7.0)

109
Sterilize sodium tartrate as l07o solution; add to medium 2to a final concentration of l7o in the basal medium.
b) Medium 2 (Ayers g!-al, 1919)NH¿HZPO¿KCIMgSO4. TLrzObromothymol blue (powder)distilted water
13. King's Medium B (King et al.. 1954)
Difco proteose peptone No. 3KZHPO¿MgSO+.7HzOglycerolBacto agardistilled water
14. Pseudomonas minimal medium (PMM)
Nt{¿HZPO¿KCIMgSO4. 7H2OBacto agardistilled water
To 90 ml basal medium, add 10 ml2Vo glucose.
1.ogo.2eo-2e
0.08gto 1 litre
(pH to 7.0)
1.ogo-2eo-2gL2g
to 900 ml( pH to 7.0)
2ogo.2e1.5g
10 ml15g
to l lire( pH to 7.2)

110
APPENDIX B. BUFFERS AND SOLUTIONS
1. Solutions for olasmid isolation and gel electrophoresis
a) TEB buffer: 50 mM Tris-HCl,20 mM EDTA, pH 8.0
e) Electrophoresis buffer: Tris (SigmaT-9)boric aciddisodium EDTAdistilled water
b) Solution 1: 50 mM glucose,25 mM Tris, 10 mM EDTA, pH 8.0.Lysozyme (2mglrnl) added just before use. Kept on ice.
c) Solution 2: 0.2 N NaOH, 17o SDS; made just before use.
d) Sodium acetate (3M): Dissolve 24.6 g sodium acetate in 50 mldistilled twater. Add glacial acetic acid to pH 5.2. Adddistilled water to 100 ml.
10.78 g5.5 g0.93 g
to 1 litre
f¡ Tracking d)¡e:2O7o Ficoll, 0.17o SDS, 0.02Vo bromophenol blue inelectrophoresis buffer.
g) Gel: Agarose (Seakem; 0.7 to 1.0 g) melted in 100 ml electrophoresisbuffer; cooled to 60oC and poured.
2. Solutions for DNA preparation and reassociation (Part B)
a) Saline sodium citrate (SSC) (Maniatis et al., 1982)
t-lre following recipe is for a stock solution of 20 x SSC:
NaCl 175.3 gsodiumcirate 88.2 gdistilled water to 1 lire
(pH to 7.0)
b) Proteinase K: A stock solution of proteinase K (from Tritirachiumalbum Type XI; Sigma Chemical Company, USA) was madein TNE buffer (described below) at a concentration of 5mg/ml, just before use.
c) TNE buffer (Maniatis etal., 7982): 10 mM Tris-HCl, 100 mM NaCl,1 mM EDTA, pH 8.0.
d) RibonucleaseRNase stock solution: RNase (Calbiochem, USA) at a
concentration of 5 mg/rnl was dissolved in 10mM Tris-HCl (pH 7.4),15 mMNaCl, 5Vo glycerol. The solution was heated ina boiling water bath for 20 minutes and allowedto cool before storage at -20oC.
e) Chloroform: a24:l mixture of chloroform: isoamyl alcohol was used.

111
3. Miscellaneous solutions
a) Benedict's reagant (for test of 3- ketolactose production)
Solution A: sodium citrate L7.3 gsodiumcarbonate f0 g
Dissolve in 60 ml distilled water by heating. Make up to 85 ml.
Solution B: CuSO4 1.8 gdistilled water to 15 ml
Slowly add solution B to solution A.
b) Buffered saline
For 200 mll. 0.2 M phosphate buffer (see below), 20 ml;NaCl,l.7 g; distilled \ryater, 180 ml.
0.2 M Phosphate buffer pH 7.3 (10 x conc.):
0.2 M Na2HPO40.2 M NaHZPO¿
81 ml19 rnl

tt2
APPENDD( C
The tables presented in this appendix represent data which has been
presented graphically in Part A of this thesis. The graph to which an
individual table refers is indicated.

Table AC-1. Root Populations: Almond Ex. 1 I
Month K27ß\2
Log cfu/ cm2 root
Treatments:3
K309(s) 2 K27(m\2
3.81 c 6.19 a
4.95b 5.57 a
3.80 c 6.42a
4.60 b 6.t4a
4.85 b 5.94a
3.68 b 5.02a
4.00 a 4.L6a
3.07 b 4.43 a
2.59 a 2.gg a
2.65 c 4.43 a
2.57 b 3.59 a
z.fib 3.54 a
June
July
August
September
October
November
December
fanuary
February
March
April
May
6.58 a
5.84 a
6.2L a
634a
6.23 a
5.14a
3.89 b
3.84a
3.07 a
4.09 aþ
3.86 a
3.50 a
K309(m) 2
5.57 b
5.00 b
5.02b
4.18 b
4.10 b
4.95 a
4.00 a
2.95b
2.9I a
3.20b,c
3.00 b
2.88 b
1- Almond Ex. 1 is described in Table 34. Procedures for sampling are described inPart A, Materials and Methods.
2- (Ð = single inoculations; data presented graphically in Fig. 2A(m) = mixed inoculations; data not presented elsewhere
3- Values with the same_letter are not significantly different. Data were analysed byone-way ANOVA and the least squares difference was used to determine diiferencesbetween means at each month.

Table AC-z. Root Populations: Vine Ex. 1l
I-og cfu/ cm2 root
Month
September
October
November
December
January
February
March
April
May
June
July
August
K27(.s)2
5.73 a
4.96 ^
4.94a
5.08 a
4.90 a
4.97 a
4.2I a
3.82a
3.56 a
2.91a
3.06 a
3.52a
Treatments: 3
K309(s) 2
4.49b
4.25 b
3.70 b
2.9L c
4.70 a
4.48 a
4.07 a
4.46 a
332a
3.00 a
3.61a
3.O7 a
K27în) 2
5.44 a
4.4r b
4.78 a
4.50 b
3.92 a
4.79 a
4.79 à
4.18 a
3-81 a
2.gg a
2.gl a
3.43 a
K309(m) 2
4.50 b
4.2tb
3.7tb
3.11 c
4.26a
4.73 a
434 a
4.00 a
3.22a
2.gg a
334 a
2.52 a
1- Vine Ex. 1 is described in Table 34. Procedures for sampling are described in PartA, Materials and Methods.
2- dataforK2T and K309 in single inoculations arc presonted graphically inFigure 34.
3- Values with the same letter are not significantly different. Data were analysed byone-rway ANOVA and the least squares difference was used to determine differencesbetween means at each month.
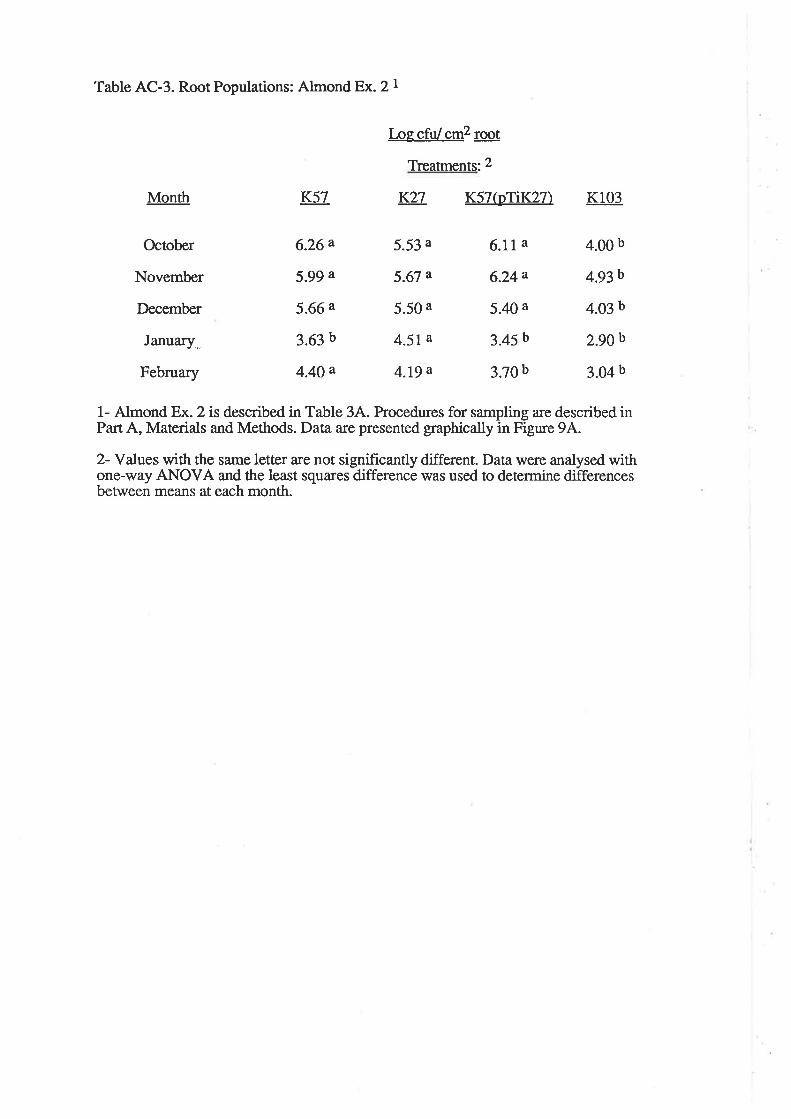
Table AC-3. Root Populations: Almond Ex. 2 I
Month K57
Log cfu/ cm2 rcg!
Treatments:2
K27 K57(pTiK27)
October
November
December
January.,
February
6.26a
5.99 ^
5.66 a
3.63 b
4.40 ^
5.53 a
5.67 a
5.50 a
4.51a
4.19 a
6.11 a
6.24î
5.40 a
3.45b
3.70b
K103
4.00 b
4.93b
4.03 b
2.90b
3.04 b
1- Almond Ex.2 is described in Table 3,A'. Procedures for sampling a¡e described inPart A, Materials and Methods. Data are presented graphically in Figure 94.
2- Values with the same letter Íre not significantly different. Data were analysed withone-way ANOVA and the least squares difference was used to determine differencesbetween means at each month.

Table AC-4. Gall Populations: Almond Ex. 3 1
Month
April
May
June
July
August
ii) Inside Galls:
Month
Ap.il
May
June
July
August
K27 3
5.48 a
6.96a
7.08 a
6.29 a
6.59 a
Iog cfu/cm2 g4
113
BIBLIOGRAPTIY
Alarcon, 8., M.M. Lopez, M. Cambra & J. Ortiz (1987). Comparative study ofAgrobacterium biotypes 1,2 and 3 by electrophoresis and serological methods. J.Appl. Bact. 62, 29 5-308.
Akiyoshi, D.E., H. KIee, R.M. Amasino, E.'W. Nester & M.P. Gordon (1984). T-DNA of Agrobacterium tumefaciens encodes an enzyme of cytokinin biosynthesis.Proc. Natl. Acad. Sci. USA 81, 5994-5998.
Albinger, G. & R. Beiderbeck (1977). Uebertragung der Faehigkeit zurWur¿elinduktion von Agrobacterium rhizogenes auf A. tumefaciens. Phytopath.Zeitschrift. 90, 306-3 10.
Ames, B.N. & H.K. Mitchell (1952). The paper chromatography of imidazoles. J.Am. Chem. Soc. 4252-251Anderson, A.R. & L.W. Moore (1979). Host specificity in the genusAgrobacterium. Phytopathology 69, 320-323.
Ayers,S.H., P. Rupp & W.T. Johnson (1919). A study of the alkali-formingbacteria in milk. USDA Bulletin 702.
Banfield, W.M. (1930). Cane gall of black raspberry (Abstr.). Phytopathology 20,t23-t24.
Banfield, W.M. (1935). Studies in cellular pathology. I. Effects of cane gall bacteriaupon gall tissue cells of the blackraspberry. Botanical Gazette 9l-193-239.
Barry, G.F., S.G. Rogers, R.T. Fraley & L. Brand (1984). Identification of acloned cytokinin biosynthetic gene. Proc. Natl. Acad. Sci. USA 81,4776-4780.
Bazzi, C. & B. Rosciglione (1982). Aerobacterium tumefaciens biotype 3, causalagent of crown gall on Chrysanthemum in Italy. Phytopath. Zeitschrift 103,280-284.
Beaulieu, C., L.J. Coulombe, R.L. Granger, B. Miki, C. Beauchamp, G. Rossignol& P. Dion (1983). Cha¡acterization of opine-utilizing bacteria isolated from Quebec.Phytoprotection 64, 61-68.
Beaulieu, C., L. Miville & P. Dion (1986). Hybridization studies betweencatabolism genes of Agrobacterium, Pseudomonas and Rhizobium (Abstr.)
opme.fn:"
Third Intemational Symposium on the Molecula¡ Genetics of Plant-MicrobeInteractions; Abstracts". McGill University, Montreal. p. 14.
Bergersen, F.J. (1961). The growth of Rhizobium in synthetic media. Aust. J. Biol.Sci. 14. 349-360.
Beringer, J.E. (1974). R Factor transfer in Rhizobium leguminosa¡um. J. Gen.Micro. 84, 188-198.
Bernaerts, M.J., & J. Deley (1963). A biochemical test for crown gall bacteria.Nature 197. 406-407.
Bevan, M.V/. & M.-D. Chilton (L982). T-DNA of the Agrobacterium TI and Rlplasmids. Ann. Rev. Genet. 16,357-384.

rt4
Bhuvaneswari, T.V., B.G. Turgeon & W.D. Bauer (1980). Early events in theinfection of soybean (Glycine max L. Merr.) by Rhizobium japonicum. 1.Localization of infectible root cells. Plant Physiol. 66,1027-103I.
Birnboim, H.C. & J. Doly (1979). A rapid alkaline extraction procedure forscreening recombinant plasmid DNA. Nucleic Acids Research 7,l5l3- 1523.
Bomhoff, G., P.M. Klapwijk, H.C.M. Kester & R.A. Schilperoort (1976).Octopine and nopaline synthesis and breakdown genetically controlled by aplasmidof Agobacterium tumefaciens. Mol. Gen. GeneL -145, 177-LïL.
Bouzar, H. & L.rW. Moore (1987). Isolation of different Aerrobacterium biovarsfrom a savanna and tallgrass prairie. Appl. Environ. Microbiol. 53,717-721.
Bradley, D.E., C.J. Douglas & J. Peschon (1984). Flagella-specif,rc bacteriophagesof Agrobacterium tumefaciens: demonstration of virulence of nonmotile mutants.Can. J. Micro. 30, 676-681.
Braun, A.C. (1958). A physiological basis for autonomous growth of crown galltumour cells. Proc. Natl. Acad. Sci. USA &3M-349.Brewin, N.J., J.E. Beringer & A.W.B. Johnston (1980). Plasmid-mediated transferof host-range specificity between two strains of Rhizobium leeuminosarum. J. Gen.Micro. I20.413-420.
Brewin, N.J., E.A. V/ood & J.P.W. Young (1983). Contribution of the symbioticplasmid to the competitiveness of Rhizobium leguminosarum. J. Gen. Micro. 129,2973-2977.
Brisbane, P.G. & A. Kerr (1983). Selective media for three biovars ofAgobacterium. J. Appt. Bact. 54, 425-43L.
Britten, R.J., D.E. Graham & B.R. Neufeld (1974). Analysis of repeating DNAsequences by reassociation.In: 'Methods in Fnzymology, Yol.ZTE'. L. Grossman &K. Moldave, eds. Academic Press, New York. pp. 363-406.
Buchanan-Vy'ollaston,V., J. E. Passiatore & F. Cannon (1987). The mob and oriTmobilization functions of a bacterial plasmid promote its transfer to plants. Nature328,172-t75.
Buchmann,I., F.-J. Marner, G. Schroder, S. Waffenschmidt & J. Schroder (1985)Tumour genes in plants: T-DNA encoded cytokinin biosynthesis. EMBO J. 4, 853-859.
Bucholz, W.G. & M.F. Thomashow (1984a). Comparison of the T-DNA oncogenecomplements of limited and wide hostrange tumor-inducing plasmids ofA grobacterium tumefaciens. J. Bact. 160, 319 -326.
Bucholz, V/.G. & M.F. Thomashow (1984b). Host range encoded by theAgrobacterium tumefaciens tumor-inducing plasmid pTiAg63 can be expanded bymodification of its T-DNA oncogene complement. J. Bact. 160,3n432.
Burr, T.J. (1978). Clown gall of grapevine. Vinifera Wine Growers Journal 5, 131-133.

115
Burr, T.J. & B. Hurwitz (1981). Occurrence of Agrobacterium radiobacter pv.tumefaciens (Smith & Townsend) Conn. biotype 3 on grapevine in New York Søte.(Abstr.) Phytopathology fu 206.
Burr, T.J. & B.H. Katz (1983). Isolation of Ag¡obacterium tumefaciens biovar 3from grapevine galls and sap and from vineyard soil. Phytopathology 73,163-165.
Burr, T.J. & B.H. Katz (1984). Grapevine cuttings as potential sites of survival andmeans of dissemination of Agrobacterium tumefaciens. Plant Disease 6E, 976-978.
Burr, T.J., B.H. Katz & A.L. Bishop (1987a). Populations of Agrobacterium invineyard and nonvineyard soils and gape roots in vineyards and nurseries. PlantDisease 71,617-620.
Burr, T.J., A.L. Bishop, B.H. Katz, L.M. Blancha¡d & C.Bazzi (1987b). A rootspecifrc decay of grapevine caused by Agrobacterium tumefaciens and A. radiobacterbiovar 3. Phytopathology (in press).
Burr, T.J., B.H. Katz, A.L. Bishop, C.A. Meyers & V.L. Mittak (1987c). Effect ofshoot age on systemic infestations of grape by Aerobacterium tumefaciens biovar 3and production of pathogen-free vines by shoot-tip culture. Am. J. Enol. Vitic. (inpress).
Bushby, H.V.A. (1981). Changes in the numbers of antibiotic resistant rhizobia inthe soil and rhizosphere of held-grown Vigna mungo cv. Regur. Soil Biol. Biochem.lL 24t-24s.
Caplan,,A.., L. Herrera-Estrella, D. Inze, E. van Haute, M. van Montagu & J. Schell(1983). Introduction of genetic material into plant cells. SciencaU,815-821.
Casse, F., C. Boucher, I.S. Julliot, M. Michel & J. Denarie (1979).Identificationand characterization of large plasmids in Rhizobium meliloti using agarose gelelectrophoresis. J. Gen. Micro. 113. 229-242.
Chen, X.Y. & W.N. Xiang (1986). A strain of Aerobacterium radiobacter inhibitsgrowth and gall formation by biotype III strains of A. tumefaciens from grapevine.Acta Microbiologica Sinica b 193-199.
Chilton, M.D., S.K. Farrand, R. Levin & E.W. Nester (1976). RP4 promotion oftransfer of a large Agrobacterium plasmid which confers virulence. Genetics 83, 609-618.
Chilton, M.-D., M.H. Drummond, D.J. Merlo, D. Sciaky, A.L. Montoya, M.P.Gordon & E.W. Nester (1977). Stable incorporation of plasmid DNA into higherplant cells: the molecular basis of crown gall tumorigenesis. Cell 11, 2$-nL.Chilton, M.-D., M.H. Drummond, D.J. Merlo & D. Sciaky (1978). Highly
consen¡ed DNA of Ti plasmids overlaps T-DNA maintained in plant tumors. Nature275,147-t49.
Chilton, M.-D., R.K. Saiki, N. Yadav, M.P.Gordon & E.rW. Nester (1980). T-DNA of Agrobacterium Ti plasmid is in the nuclear fraction of crown gall tumor cells.Proc. Natl. Acad. Sci. USA 77, 4060-4064.
Chilton,'W.S., J. Tempé, M. Matzke & M. D. Chilton (1984a). Succinamopine: anew crown gall opine. J. Bact. 157.357-362.

116
Chilton, Vy'.S., K.L. Kinehart & M.D. Chilton (1984b). Structure andstereochemistry of succinamopine. Biochemistry 23, 3290-3297 .
Clark, A.G. (1969). A selective medium for the isolation of Agrobacterium species.J. Appl. Bact. 32. 348-351.
Colyer, P.D. & M.S. Mount (1984). Bacteriazation of potatoes with Pseudomonasputida and its influence on postharvest soft rot diseases. Plant Disease 68, 703-706.
Cooksey, D.A. & L.W. Moore (1982). High frequency spontaneous mutations toAgrocin 84 resistance in Aerobacterium tumefaciens and A. rhizogenes. Physiol.Plant Path. 20, 129-135.
Costantino, P., P.J.J. Hooykaas, H. Den Dulk-Ras & R.A. Schilperoort (1980).Tumor formation and rhizogenicity of Aerobacterium rhizogenes carrying Tiplasmids. Gene lL 79-87.
Currier, T.C. & E.V/. Nester (1976). Evidence for diverse types of large plasmids intumor-inducing strains of Agrobacterium. J. Bact. 126, 157 -165.
Dahl, G.4., P. Guyon, A. Petit & J. Tempé (1983). Silver nitrate-positive opines incrown gall tumors. Plant Sci. Lett. 32,193-203.
Datta, N. (1985). Plasmids as organisms. In: 'Plasmids in Bacteria'. D.R. Helsinki,S.N. Cohen, D.B. Clewell, D.A. Jackson & A. Hollaender eds., P1enum Press,New York. pp. 3-16.
Dazzo, F.8., G.L. Truchet, J.E. Sherwood, E.M. Hrabak, M. Abe & S.H.Pa¡kratz (1984). Specific phases of root hair attachment in the Rhizobium trifolü-clover symbiosis. Appl. Environ. Microbiol. 48, 1 140-1 150.
DeCleene, M. & J. Deley (L976). The host mnge of crown gall. Bot. Rev. 42, 389-466.
Deep,I.V/., R.A. McNeilan & I.C. MacSwan (1968). Soil fumigants tested forcontrol of crown gall. Plant Dis. Reportar 2,102-105.
DeGreve, H., H.Decraemer, J. Seurinck, M. Van Montagu & J. Schell (1981). Thefunctional organization of the octopine Agrobacterium tumefaciens plasmid pTiB6S3.Plasmid 6,235-248.
Deley, J. (1970). Reexamination of the association between melting point, buoyantdensity, and chemical base composition of deoxyribonucleic acid. J. Bact. 101, 738-754.
Deley, J. (L974). Phylogeny of prokaryotes. Taxon 23,291-300.
Deley, J., M. Bernaerts, A. Rassel & J. Guilmot (1966). Approach to an improvedtaxonomy of the genus Agobacterium. J. Gen. Micro. 43,7-I7.
Deley, J., H. Cattoir & A. Reynaerts (1970). The quantitative measurement ofDNA hybridization from renaturation rates. Eur. J. Biochem. 12, L33-L42.
De[æy, J., J. Titjaet, J. DeSmedt & M. Michiels (L973). Thermal stability of DNA:DNA hybrids within the genus Agrobacterium. J. Gen. Micro. 78,241-252.
t17
Depicker,4., M.DeWilde, G. DeVos, R. DeVos, M. Van Montagu & J. Scell(1980). Molecular cloning of overlapping segments of the nopaline Ti plasmidpTiC58 as a means to restriction endonuclease mapping. Plasmid ?,193-211.
Depicker, 4., M. Van Montagu & J. Schell (1983). Plant cell transformation byAgrobacterium plasmids. In: 'Genetic Engineering of Plants: An AgriculturalPerspective. T. Kosuge, C.P. Meredith & A. Hollaender, eds. Plenum, New York.pp. r43-r76.
DeVos, G., M. De Beuckeleer, M. Van Montagu & J.Schell (1981). Addendum:Restriction endonuclease mapping of the octopine tumor-inducing plasmid pTiAch5of A srobacterium tumefaciens. Plasmid 6, 249 -253.
DeWeger, L.4., C.I.M. van der Vlugt, A.H.M. Wijtjes, P.A.H.M. Bakker, B.Schippers & B. Lugtenberg (1987). Flagella of a plant-growth-stimulatingPseudomonas fluorescens strain are required for colonization of potato roots. J. Bact.169.2769-2773.
Dickey, R.S. (1961). Relation of some edaphic factors to,{grobacteriumtumefaciens. Phytopathology 51, 607 -6L4.
Djordevic,M.C., R.'W. Innes, C.A. Wijffelman, P.R. Schofreld & B.G. Rolfe(1986). Nodulation of specific legumes is controlled by several distinct loci inRhizobium trifolii. Plant Mol. Biol. 6, 389-401.
Douglas, C., V/.Halperin & E.W. Nester (1982). Agrobacterium tumefaciensmutants affected in attachment to plant cells. J. Bact.l52,1265-1275.
Douglas, C.J., R.J. Staneloni, R.A. Rubin & E.W. Nester (1985). Identificationand genetic analysis of an Agrobacterium tumefaciens chromosomal virulence region.f. Bact. 161, 850-860.
Draper, J., I.A. MacKenzie, M.R. Davy & J.P. Freeman (1983). Attachment ofAErrobacterium tumefaciens to mechanically isolated AsparaÊus cells. Plant Sci. t ett.D,227-236.
DuPlessis, H.J., H.J.J. VanVuuren & M.J. Hattingh (1984). Biotypes andphenotypic goups of Agrrobacterium in South Africa. Phytopathology'z4, 524-529.
Ellis, J.G. & P.J. Murphy (1981). Four new opines from crown gall tumours- Theirdetection and properties, Mol. Gen. Genet. 181, 36-43.
Ellis, J.G., A. Kerr, M. Van Montagu & J. Schell (L979). AÊrobacterium: geneticltudie! on agrocin 84 production and the biological control of crown gall. Physiol.Plant Path. 15, 311-319.
Ellis, J.G., A. Kerr, A. Petit & J. Tempé, (1982). Conjugal rransfer of nopaline andagropine Ti-plasmids- the role of agrocinopines. Mol. Gén. Genet. 186,i69-274.
Engler, G., M. Holsters, M. Van Montagu, J. Schell, J.P. Hernalsteens & R.Schilperoort (1975). Agrocin 84 sensitivity: a plasmid determined property inAgrobacterium tumefaciens. Mol. Gen. Genet. 138, 345-349.
Evans,I.J. & J.A. Downie (1986). The nodl gene product of Rhizobiumlegrlmiqgsarum is closely related to ATP-binding bacterial transport proteins;nucleotide sequence analysis of the nodl and nodl genes. Gene 43, 9S-tOt.

118
Fahy, P.C. & A.C. Hayward (1983). Media and methods for isolation anddiagnostic tests. In: ' Plant Bacterial Diseases. A diagnostic guide.' P.C Fahy &G.J. Persley, €ds. Academic Press Australia, Sydney. pp.337-378.
Gallie, D.R., D. Zatthn, K.L. Perry & C.I. Kado (1984). Characterization of thereplication and stability regions of Agrobacterium tumefaciens plasmid pTAR. J.Bact. 157.739-745.
Ga¡finkel, D.J. & E.W. Nester (1980). Agrobacterium tumefaciens mutants affectedin crown gall tumorigenesis and octopine catabolism. J. Bact. 144,732-743.
Genetello, C., N. Van Larebeko, M. Holsters, A. Depicker, M. Van Montagu & J.Schell (L977). Ti plasmids of Agobacterium as conjugative plasmids. Nature 265,561-563.
Graham, P.H. (1971). Serological studies with A. radiobacter, A. tumefaciens andRhizobium strains. Arch. Mikrobiol. 7 8, 7 0-7 5.
Glogowski, W. & A.G. Galsky (1978). Agrobacterium tumefaciens site attachmentas a necessÍìry prerequisite for crown gall tumor formation on potato discs. PlantPhysiol.61 1031-1033.
Guyon, P., M.D. Chilton, A. Petit & J. Tempé (1980). Agropine in "null-qrpe"crown gall tumours: evidence for the generality of the opine concept. Proc. Natl.Acad. Sci. USA 77,2693-2697.
Hamilton, R.H. (1971). The loss of tumour-initiating ability in Agrobacteriumtumefaciens by incubation at high temperature. Experienti a 27, 229 -23O.
_Hayryg{, 4.C. (1964). Characteristics of Pseudomonas solanacearum. J. Appl.Bact.27.265-277.
Helton, A.W. & R.E. Williams (1968). Control of aerial crown gall disease in cherrytrees with spray-applied systemic fungicides. Phytopathology 58, 7 82-7 g7 .
Hemming,8.C., C. Orser, D.L. Jacobs, D.C. Sands & G.A. Strobel (1982). Theeffects of iron on microbial antagonism by fluorescent pseudomonads. J. PlantNutriúon 5,683-702.
_Hildebrand, E.M. (1940). cane gall of brambles caused by Phytomonas rubi. N.Sp.J.Agric Res. 61, 685-696.
Hitdebrand E.M. (1941). On the longevity of the crown gall organism in the soil.Plant Dis. Reporter 25,200-202.
Hille, J., J. Van Kan & R. Schilperoort (1984). Trans-acting virulence functions ofthe octopine Ti plasmid from Agrobacterium tumefaciens. J. Bacr 158,754-756.
flitano, S.S., E.V. Nordheim, D.C. Arny & C.D. Upper (1982). Lngnormal9iltribution 9f eprphytic bacterial populations on leaf s-urfaces. Appl. Environ.Microbiol. M,695-700.
Hirooka, T. & CJ. Kado (1986). Location of the right boundary of the virulenceregion on 4Eobagteriqm tumefggle4qplasmid pTiC58 and a hosl-specifying genenext to the boundary. J. Bact. 168,237-2+3.
Hirsch, P.R. & J.E. Beringer (1984). A physical map of pPHIJI and pJB4JI.Plasmid 2 L39-t41.

119
Hochster, R.M. & S.E. Cole (1967). Serological comparisons between strains ofAerrobacterium tumefaciens. Can. J. Micro. ß,569-572.
Hoekema, 4., B.S. dePater, A.J. Fellinger, P.J.J. Hooykaas & R.A. Schilperoot(1984). The limited host range of an Agrobacterium tumefaciens strain extended by acytokinin gene from a wide host range T-region. EMBO J.3,3043-3047.
Holmes, B. & P. Roberts (1981). The classification, identification and nomenclatureof agrobacteria. J. Appl. Bact. 50, 443-467.
Holsters, M., D. DeW'aele, A. Depicker, E. Messens, M. Van Montagu & J. Schell(1978a). Transfection and transformation of Agrobacterium tumefaciens. Mol. Gen.Genet. 163. 181-187.
Holsters, M., B. Silva, C. Genetello, G. Engler, F. Van Vliet, M. DeBlock, R.Villa¡oel, M. Van Montagu & J. Schell (1978b). Spontaneous formation ofcointegrates of the oncogenic Ti-ptasmid and the wide-host-range P plasmid RP4.Plasmid 1,456-467.
Holsters, M., B. Silva, F. Van Vliet, C. Genetello, M. DeBlock, P. Dhaese, A.Depicker, D.Inze, G. Engler, R. Villaroel, M. Van Monøgu & J. Schell (1980). Thefunctional organization of the nopaline Agrobacterium tumefaciens plasmid pTiC58.Plasmid 3,2L2-23O.
Holsters, M., J.P. Hernalsteens, M. Van Montagu & I. Schell (1982). Ti plasmidsof Agobacterium tumefaciens: The nature of the TIP. In: 'Molecular Biology of PlantTumours'. G. Kahl & J. Schell, eds. Academic Press, New York. pp.269-298.
Hooykaas, P.J.J. & R.A. Schilperoort (1986). The molecular basis of theAeTobacterium- plant interaction. Characteristics of Agrobacterium virulence genesand their possible occrurence in other plant-associated bacteria. In: ' Recognition inMicrobe-Plant Symbiotic and Pathogenic Interactions.' B. Lugtenberg, ed. Springer-Verlag, Berlin Heidelberg . pp. 189 -202.
Hooykaas, P.f.J., H. Den Dulk-Ras, G. Ooms & R.A. Schilperoon (1930).Interactions between octopine and nopaline plasmids in Agrobacterium tumefaciens.J. Bact. 143, 1295-1306.
Hooykaas, P.J.J., A.A.N. Van Brussel, H. Den Dulk-Ras, G.M.S. Van Slogteren& R.A. Schilperoort (1981). Sym plasmid of Rhizobium trifolii expressed in differentrhizobial species and A grobacterium tumefacien s. Nature 29 I, 351-353.
Hooykaas, P.J.J., M. Hofker, H. Den Dulk-Ras & R.A. Schilperoorr (1984). Acomparison of virulence determinants in an octopine Ti-plasmid, a nopaline Ti-plasmid and an Ri-plasmid by complementation analysisof Agrobacteriumtumefaciens mutants. Plasmid 11, 195-205.
Kondorosi ( 1987). Host-specificmediated by a plant signal, interacting848.
Howell, C.R. & R.D. Stipanovic (L979). Control of Rhizoctonia solani on cottonseedlings with Pseudomonas fluorescens and with an antibiotic produced by thebacterium. Phytopathology 69, 480-482.

t20
Howell, C.R. & R.D. Stipanovic (1980). Suppression of Pythium ultimum-induceddamping-off of cotton seedlings by Pseudomonas fluorescens and its antibiotic,pyoluteorin. Phytopathology 7 0, 7 l2-7 15.
Htay, K & A. Kerr (1974). Biological control of crown gall: seed and rootinoculation. J. Appl. Bact. 37, 525-530.
Inze,D., A. Follin, M. Van Lijsebettens, C. Simoens, C. Genetello, M. VanMontagu & J. Schell (1984). Genetic analysis of the individual T-DNA genes ofAgrobacterium tumefaciens: further evidence that two genes are involved in indole-3-acetic acid synthesis. Mol. Gen. Genet.194,265-274.
Jones, D.4., M.H. Ryder, B.G. Clare, S.K. Farrand & A. Kerr (1988).Construction of a Trr deletion mutant of pAgK84 to safeguard the biological controlof crown gall. Mol. Gen. Genet. (in press).
Kado, C.I. & M.G. Heskett (1970). Selective media for isolation of Ag¡obacterium,Corynebacterium, En4ini4, Pseudomon as and Xanthomonas. Phytopathology @,969-976.
Keane, P.J., A. Kerr & P.B. New (1970). Crown gall of stone fruit. Identificationand nomenclatue of Agrobacterium isolates. Aust. J. Biol. Sci. 23,585-595.
Kerr, A. (1969). Transfer of virulence between isolates of Agrobacterium. Nature223. rL15-rr76.
Kerr, A. (I97I). Acquisition of virulence by non-pathogenic isolates ofA grobacterium radiobacter. Physiol. Plant Path. l, 24L-246.
I(err, A. (1972). Biological control of crown gall: seed inoculation. J. Appl. Bact.31 493-497.
Kerr, A. (1980). Biological control of crown gall through production of agrocin 84.Plant Disease @, 25-30.
Kerr, A. & P.G. Brisbane (1983) Agrobacterium. In:'Plant Bacterial Diseases'.P.C. Fahy & G.J. Persley, eds. Academic Press Australia, Sydney. pp.27-43.
Ker, A. & K. Htay (1974). Biological control of crown gall through bacteriocinproduction. Physiol. Plant Path. 4, 37-44.
Kerr, A. & C.G. Panagopoulos (1977). Biotypes of Ag¡obacterium radiobacter var.tumefaciens and their biological control. Phytopath. Zeitsch¡ift W,I72-I79.Kerr, A. & V/.P. Roberts (1976). Agrobacterium: correlation between and transfer9!nagryttnicity, octopine and nopaline metabolism and bacteriocin sensitivity.Physiol. Plant Path. 2,205-211.
Kerr, A. & M.E. Tate (1984). Agrocins and the biological control of crown gall.Microbiol. Sci. 1, 1-4.
Kerr, 4., P. Manigault & J. Tempé (1977). Transfer of virulence in vivo and in vitroin Agrobacterium. Nature 265, 560-561.
Ken,4., J.M. Young & C.G. Panagopoulos (1978). Genus II. AgrobacteriumConn. 1942. N.Z. J. Agric Resea¡ch L 155-156.
t2l
Kersters, K. & J. Deley (1984). Genus Itr. Agr.obaçteri]¡m. In: " Bggey's manualof systematic bacteriology. Vol. 1." N:R_._Krieg & J.G. Holt, eds. rWilliam &Wilhns, Baltimore & London. pp.244-254.
Kersters, K.,I. Deley, P.H.A. Sneath & M. Sackin (L973). Numerical toronomicanalysis of Agrobacterium. J. Gen. Micro. 13,2n-239.
King, E.O., M.K. Ward & D.E. Raney (195a). Two simple media for thedemõnstration of pyocyanin and fluorescein. J. Laboratory & Clinical Medicine 44,301-307.
Schilperoort ( 1978). Coordinatedugative transfer of Ti-plasmids incommon regulatory gene and separate
Klee, H.J., M.F, Yanofsky & E.W, Nester (1985). Vectors for transformation ofhigher plants. Biotechnology 3, 637-642.
Klemmer, H.W., A.J. Riker & O.N. Allen (1955). Inhibition of crown gall byselected anúbiotics. Phytopathology 45, 618- 625.
plant growthon potato roots and
in vitro antibiosis of plant-and displacement of root
Kloepper, J.W., J. Leong, M.Teintze & M.N. Schroth (1980). Enhanced plantgrowth-by siderophores produced by plant growth promoting rhizobacteria. Nature286, 885-886.
Kloepper, J.W., M.N. Schroth & T.D. Miller (1980). Effects of rhizospherecolonization by plant growth promoting rhizobacteria on potato plant development andyield. Phytopathology 70, 1078- 1082.
Knauf, V.C. & E.W. Nester (1982). V/ide host range cloning vectors: a cosmidclone bank of an Agrobacterium Ti plasmid. Plasmid 8, 45-54.
Knauf, V.C., C.G. Panagopoulos & E.W. Nester (1982). Genetic factorscontrolling the host range of Aerobacterium tumefaciens. Phytopathology 72, 1545-t549.
Knauf, V.C., M.F. Yanofsky, M.P. Gordon & E.V/. Nester (1983). Geneticanalysis of host range expression by Agrobacterium. In: ' Molecular Genetics of theBacteria-Plant Interaction'. A. Puhler, ed. Springer-Verlag Berlin Heidelberg. pp240-247.
Knauf, V.C., M. Yanofsky, A. Montoya & E.W. Nester (1984). Physical andfunctional map of an Agrobacterium tumefaciens tumor-inducing plasmid that confersa narrow host range. J. Bact. 160. 564-568.
Kohn, S. & R. Beiderbeck (1982). Octopinverwerilng durch Pseudomonas spp.Phyropath. Zeitschrift. 105, 305-3 10.
lip_pincott, J.4., R. Beiderbeck.t B.B. Lippincott (1973). Utilization of octopineand nopaline by Agrobacterium. J. Bac. 116, 378-383.
122
Kondorosi, E. & A. Kondorosi (1986). Nodule induction on plant roots byRhizobium. Trends Biochem Sci. 11, 296-299.
Lehoczþ, I. (1968). Spread of Agrobacterium tumefaciens in the vessels of thegrapevine, after natural infection. Phytopath. Zeitschrift @, 239-4n6.
Lehoczky, J. (1971). Further evidences concerning the systemic spreading ofAgrobacterium tumefaciens in the vascular system of grapevines. Vitis 10,2t5-221.
Lehoczky, J. (1978). Root-system of the grapevine as a reseryoir of Agrobacteriumtumefaciens cells. In: " Proceedings of the Fourth International Conference on PlantPathogenic Bacteria". M. Ride, ed. INRA, Angers. pp.239-243.
I-eisinger, T. & R. Margraff (L979). Secondary metabolites of the fluorescentpseudomonads. Microbiol. Rev. 43, 422-442.
Leroux, 8., M.F. Yanofsky, S.C. Winans, J.E.'Ward, S.F. Ziegler & E.W. Nester(1987). Characterization of the virA locus of Agrobacterium tumefaciens: atranscriptional regulator and host range determinant. EMBO J ó, 849-856.
Lewis, D.M., E.S.P. Bromfield & L.R. Barran (1986). Rifampicin resistance andnodulating competitiveness in Rhizobium meliloti (Abstr.). In " Third IntemationalSymposium on the Molecular Genetics of Plant-Microbe Interactions; Abstracts".McGill University, Montreal. p. 120.
Lin, B.C. & C.I. Kado (L977). Studies on Agobacterium tumefaciens. VII.Avirulence induced by temperature and ethidium bromide. Can. J. Micro. 23, t554-1561.
Lippincott, B.B. & J.A. Lippincott (1969). Bacterial attachment to a specific woundsite as an essential stage in tumor initiation by Agrobacterium tumefaciens. J. Bact.y. 620-628.
Lippincott, J.A. & B.B. Lippincott (1969). Tumour-initiating ability and nutrition inthe genus Agrobacterium. J. Gen. Micro. 59,57-75.
Lippincott, J.A. & B.B. Lippincott(1977). Nature and specificity of the bacterium-host attachment in Aerobacterium infection. In:'Cell Wall Biochemisry Related toSpecificity in the Host-Plant Pathogen Interactions'. B. Solheim & J. Raa, eds.Norway Universitetsforlaget, Oslo. pp. 439 - 45 l.Lippincott, B.B, M.H. Whatley & I.A. L-ippincott (L977). Tumor induction by
Ag.rgbacterium involves attachment of the bacterium to a site on the host plant cellwall. Plant Physiol. 59, 388-390.
Lippincott, J.4., C.-C. Chang, V.R. Creaser-Pence, P.R. Birnberg, S.S. Rao. J.B.Margot, M.H. Whatley & B.B. Lippincott (1978). Genetic determinants governingenheancement of tumor initiation by avirulent agrobacteria, Agrobacterium-hostadherence and octopine synthesis. In:' Proc. Fourth Int. Conf. Plant Path. Bact.'INRA. Angers. pp.-189-i97.
I¡ckwood, J.L. &. B. Schippers (1984). Evaluation Of siderophores as a factor insoil mycostasis. Trans Brit. Mycol. Soc. 82, 589-594.
Loper, J.E. & C.I. Kado (1979). Host range conferred by the virulence-specifyingplasmid of Agobacterium tumefaciens. J. Bact. 139, 591-596.

123
I¡pet J.E., T.V. Suslow & M.N. Schroth (1984). l-ognomral distribution ofbacterial populations in the rhizosphere. Phytopathology 7 4, 145+L46O.
Ma, D., M.F. Yanofsþ, M.P. Gordon & E.W. Nester (1987). Characterization ofAg¡obacterium tumefaciens strains isolated from grapevine tumors in China. Appl.Environ. Microbiol. 53, 1338-1343.
Mandel, M. & J. Marmur (1968). Use of ultraviolet absorbance- temperatueprofiles for determining the guanine plus cytosine content of DNA. In: " Methods inEnzymology XII Part B". L. Grossman & K. Moldave, eds. Academic Press,London. pp. 195-206.
Maniatis, T., E.F. Fritsch & J. Sambrook (1982). Molecula¡ cloning: a laboratorymanual. Cold Spring Harbour Laboratory, New York, USA.
Marmur, J, (1961). A procedure for the isolation of deoxyribonucleic acid frommicroorganisms. J. Mol. Biol. 3, 208-218.
Marmur, J. & P. Doty (1962). Determination of the base composition ofdeoxyribonucleic acid from its thermal denaturation tempêrature. J. Mol. Biol. 5,109-1 18.
Marton, J., G.J. Wullems, L. Molendijk R.A. Schilperoort (1979). In vitrotransformation of cultured cells from Nicotiana tabacum by AEobacteriumtumefaciens. Nature 277, I29-13I.
Matthyse, A.G. (1983). Role of bacterial cellulose fibrils in Agrobacteriumtumefaciens infection. J. Bacr 154,906-915.
Matthyse, A.G. (1986). Anachment of Aerobacterium tumefaciens to plant hostcells. In: 'Recognition in Microbe-Plant Symbiotic and Pathogenic Interactions'. B.Lugtenberg, ed. Springer-Verlag, Berlin Heidelberg . pp.219-227 .
Matthyse, 4,G., P. M.'Wyman & K.V. Holmes (1978). Plasmid-dependentattachment of Agrobacterium tumefaciens to plant tissue culture cells-Infecl Immun.L st6-s22.
Matthyse,4.G., K.V. Holmes & R.H.G. Gurlitz (1981). Elaboration of cellulosefibrits by Agobacterium tumefaciens during attachment to carrot cells. J. Bact 145,583-595.
Muyr, E. (1982). The Growth of Biological Thought: Diversity, Evolution andInheritance. Belknap Press, Cambridge, Mass.
McGregor, G.R. & K.H. Kroon (1984). 'silvan' blackberry. Hortscience 19,732-735.
McKeen, W.E. (1954). A study of cane and crown galls on Vancouver Island and acomparison of the causal organisms. Phytopathology M,651-655.
. Mendez-Castro, F.4., & M. Alexander (1983). Method for establishing a bacterialinoculum on corn roots. Appl. Environ. Microbiol. 45,248-254.
Merlo, D.J. & E.V/. Nester (1977). Plasmids in avirulent strains of Agrobacterium.J. Bact. 129,76-80.
- Miller,_H.N. (1975). I-eaf, stem, crown and root galls induced in chrysanthemumby A8robacterium tumefaciens. Phytoparhology_$5, 805-8 I 1.

r24
Montoya,4., M.-D. Chilton, M.P. Gordon, D. Sciaky & E.tü/. Nester (1977).Octopine and nopaline metabolism in A8robacterium tumefaciens and crown-galltumor cells: role of plasmid genes. J. Bact. 729, L0I-'LO7.
Montoya,4.L., L.W. Moore, M.P. Gordon & E.W. Nester (1978). Multiple genescoding for octopine degrading enzymes in Agrobacterium. J. Bact. 136,909-915.
Moore, L.W. (1978). Practical use and success of Agrobacterium radiobacter strain84 for crorwn gall control. In: 'Biology and Control of Soil-Borne Plant Pathogens'.B. Schippers & W. Gams, eds. Academic Press, New York. pp. 553-568.
Moore, L.rW. & G. Warren (1979). Aerrobacterium radiobacter strain 84 andbiological control of crown gall. Ann. Rev. Phytopath. 17, 163-179.
Moore, L.W., G. 'Warren & G. Srobel (1979). Involvement of a plasmid in thehairy root disease of plants caused by Agrobacterium rhizogenes. Plasmid 2,617-626.
Moore, L.Vy'., A. Anderson & C.I. Kado (1980). Agrobacterium. In'LaboratoryGuide for Identifrcation of Plant Pathogenic Bacteria'. N.W. Schaad, ed. AmericanPhytopathological Society, St. Paul. pp. l7 -25.
Mulligan, J.T. & S.R. Long (1985). Induction of Rhiziobium meliloti nodCexpression by plant exudate requkes nodD. Proc. Natl. Acad. Sci. USA U,6609-6613.
Mu.phy.P.J., N. Heycke, Z. Banfalvi, M.E. Tate, F. DeBruijn, A. Kondorosi, J.Tempé & J. Schell (1987). Genes for the catabolism of an opine-like compound inRhizobium meliloti are closely linked and on the Sym plasmid. Proc. Natl. Acad. Sci.usA 84, 493-497.
Nesme, X., M.F. Michel & B. Digat (1987). Population heterogeneity ofAÊrobacterium tumefaciens in galls of Populus L. from a single nursery. AppLEnviron. Microbiol. 53, 655-659.
Nester, E.W. & T. Kosuge (1981). Plasmids specifying plant hyperplasias. Ann.Rev. Microbiol. 35, 531-565.
Nester, E.Vy'., M.P. Gordon, R.M. Amasino & M.F. Yanofsky (1984). Crown gall:a molecular and physiological analysis. Ann. Rev. Plant Phys. 35,387-413.
New, P.B. (1972). Studies on crown gall. PhD thesis, Univ. of Adelaide.
New, P.B. & A. Kerr (1971). A selective medium for Ag¡obacteriumradiobacterbiotype 2. J. Appl. Bact. 34. 233-246.
New, P.B. & A. Kerr (1972). Biological control of crown gall field measurementsand glasshouse experiments. J. Appl. Bact. 35, 279-287.
Newman, E.I. & H.J. Bowen (1974). Patterns of distribution of bacteria on rootsurfaces. Soil Biol. Biochem. 6,205-209.
Ouchterlony, O. (196.1). Interpretation of comparativg immgne precipitation patternsion-in-gel techniques. In: " Immunological approaches to problemsM. Heidelberger, O.J. Plescia & R.A. Day, eds. RutgersNew Brunswick.

t25
Panagopoulos, C.G. & P.G. Psallidas (L973). Characteristics of Greek isolates ofAgrrobàcterium tumefaciens (E.F. Smith & Townsend) Conn J. Appl. Bact.K,233-240.
Panagopoulos, C.G., P.G. Psallidas & A.S. Alivizatos (1978). Studies on biotype3 of AÊrobacterium tumefaciens var. tumefaciens. In: "Proceedings of the FourthInternational Conference on Plant Pathogenic Bacteria". M. Ride, ed.INRA, Angerspp.22l-228.
Panagopoulos, C.G., P.G. Psaltidas & A.S. Alivazatos (1979). Evidence of abreakdown in the effectiveness of biological control of crown gall. In: 'Soil-bornePlant Pathogens'. B. Schippers & W. Gams, eds. Academic Press, London.
Patel, M.K. (1928). A study of pathogenic and non-pathogenic strains ofPseudomonas tumefaciens Sm. & Town. Phytopathology 18, 331-343.
Patel, M.K. (1929). Viability of certain plant pathogenes in the soil. Phytopathology!9,295-300.
Perry, K.L. & C.I. Kado (1981). Agrobacterium tumefaciens biotypes 2 and 3 fromRubus and grape in California. (Abstr.) Phytopathology [, 249.
Perry, K.L. & C.I. Kado (1982). Cha¡acteristics of Ti plasmids from broad-host-range and ecologically specific biotype 2 and 3 strains of Agrobacterium tumefaciens.J. Bact. 151, 343-350.
Peters, N.K., J.W. Frost & S.R. Long (1986). A plant flavone,luteolin, inducesexpression of Rhizobium meliloti nodulation genes. Science 233,977-980.
Petit, A. & J. Tempé (1978). Isolation of Agrobacterium regulatory mutants. Mol.Gen. Genet. 767. 145-155.
Petit, 4., S. Delhaye, J. Tempé & G. Morel (1970). Recherches sur les guanidinesdes tissus de crown gall. Mise en evidence d'une relation biochimique specifiqueentre les souches d'Aerobacterium tumefaciens et les tumeurs qu'elles induisent.Physiol. Veg. 8, 205-213.
Petit,4., Y. Dessaux & J. Tempé (1978a). The biological significance of opines. I.A study of opine catabolism by Agrobacterium tumefaciens. In: "Proceedings of theFourth International Conference on Plant Pathogenic Bacteria". M. Ride, ed. INRA,Angers. pp. 143-152.
Petit, 4., J. Tempé, A. Kerr, M. Holsters, M. Van Montagu, & J. Schell (1978b).Substrate induction of conjugative activity of Aerobacterium tumefaciens Ti-plasmids.Nature 271.570-571.
Pinckard, J.A. (1935). Physiological studies of several pathogenic bacteria thatinduce cell stimulation in plants. J. Agr. Resea¡ch 50,933-952.
Pischl, D.L. & S.K. Fa¡rand (1983). Transposon-facilitated chromosomemobilization in Agrobacterium tumefaciens. J. Bact 153. 1451-1460.
Puvanesarajah, V., F.M. Schell, G. Stacey, C.J. Douglas & E.W. Nester (1985).Role for 2-linked-B-d-glucan in the virulence of Aerobacterium tumefaciens. J. Bact.164, to2-to6.

r26
Redmond, J.W., M. Batley, M.A. Djordevic, R.W. Innes, P.L. Kuempel & B.G.Rolfe (1986). Flavones induce expression of nodulation genes in Rhizobium. Nature323,632-635.
Riker, AJ. (1926). Studies on the influence of some environmental factors on thedevelopment of crown gall. J. Agr. Research32,83-96.
Riker, 4.J., V/.M. Banfield, W.H. Wright, G.V/. Keitt & H.E. Sagan (1930).Studies on infectious hairy root of nursery apple trees. J. Agr. Research 4L. 507-540.
Riker,4.J., E. Spoerl & A.E. Gutsche (1946). Some comparisons of bacterial plantgalls and of their causal agents. Bot. Rev. 72,57-82.
Rodriguez, R.L. & R.C. Tait (1983). Recombinant DNA Techniques: AnIntroduction. Addison-Wesley, Reading, Mass.
Rossen, L., C.A. Shearman, A.W.B. Johnston & J.A. Downie (1985). The nodDgene of Rhizobium leguminosarum is autoregulatory and in the presence of plantexudate induces the nodA,B,C genes. EMBO J.4,3369-3373.
Rossignol, G. & P. Dion (1985). Octopine, nopaline and octopinic acid utilization inPseudomonas. Can. J. Micro. 3L 68-74.
Rothamsted Experimental Station (1977). GENSTAT- a general statistical program.The Statistics Department, Rothamsted Experimental Station.
Rovira, A.D. (1956). A study of the development of the root sudace mic¡ofloraduring the initial stages of plant growth.I. Appl. Bact. 19,72-79.
Rovira, A.D. & R. Campbell (1974). Scanning electron microscopy ofmicroorganisms on the roots of wheat. Microb. Ecology l, L5-23.
Roy, M.A. & M. Sasser (1983). A medium selective for Agrobacterium tumefaciensbiotype 3. (Abstr.) Phytopathology 73, 810.
Ryder, M.H. (1984). Opines in crown gall and hairy root disease. PhD thesis,Univ. of Adelaide.
Schell, J. (1978). The use of the Ti-plasmid as a vector for the introduction offoreign DNA into plants. In: "Proceedings of the Fourth International Conference onPlant Pathogenic Bacteria". M. Ride, ed. INRA, Angers. pp. 115-126.
Schell, J., M.Van Montagu, M. DeBeuckeleer, M. DeBlock, A. Depicker, M.DeWilde, G. Engler, C. Genetello, J.P. Hemalsteens, M.Holsters, J. Seurinck, B.Silva, F. Van Vliet & R. Villa¡oel (1979).Interactions and DNA transfer betweenAgrobacterium tumefaciens, the Ti-plasmid and the plant host. Proc. R. Soc. LondonB 204.25t-266.
Schroder, G., S. Waffenschmidt, E.W. Weiler & J. Schroder (1983). The T-regionof Ti-plasmids codes for an enzyme synthesizing indole-3-acetic acid. Eur. J.Biochem. 138, 387-391..
Schroth, M.N. & V/.-P. Ting (1966). Attraction of Agrobacterium spp. ro roots.(Abstr.) Phytopathology 56, 899.
Schroth, M.N., I.P. Thompson & D.C. Hildebrand (1965). Isolation ofAgrobacterium tumefaciens- A. radiobacter group from soil. Phytopathology 55,645-647.
127
Schroth, M.N., A.R. Weinhold, A.H. McCain, D.C. Hildebrand & N. Ross(1971). Biology and control of Agrobacterium tumefaciens. Hilgardia 40,537-552.
Sciaky, D., A.L. Montoya & M.D. Chilton (1978). Fingerprints of AgrobacteriumTi-plasmids. Plasmid l, 238-253.
Shaw, C.H., A.M. Ashby & M.D. Watson (1986). Plant tumour induction (Letter).Nature 324,415.
Sheikholeslam, S., B.-C. Lin & C.I. Kado (L979). Multiple-size plasmids inAerobacterium radiobacter and A. tumefaciens. Phytopathology 69, 54-58.
Sherrat, D.J. (1982). The maintenance and propogation of plasmid genes in bacterialpopulations. J. Gen. Micro.128. 655-661.
Shim, J.S., S.K. Farand & A. Kerr (1987). Biological control of crown gall:Constuction and testing of new biocontrol agents. Phytopathology 77,463-466.
Siegler, E.A. (1938). Relations between crown gall andpH of the soil.Phytopathology 28, 858-859.
Slota, J.E. & S.K. Fa:rand (1982). Genetic isolation and physical cha¡acterizattonof pAgK84, the plasmid responsible for agrocin 84 production. Plasmid 8, 175-186.
Sly, L.I. (1983). Preservation of microbial cultures. In: 'Plant Bacterial Diseases. Adiagnostic guide.' P.C. Fahy & G.J. Persley, eds. Academic Press Australia,Sydney. pp.275-298.
Smith, E.F., N.A. Brown & C.O. Townsend (1911). Crown gall of plants: its causeand remedy. US Dept. Agr. Bur. Plant Indus. Bull. 213.215.
Smith, F. & D. Spriestersbach (1954). Paper chromatography of organic acids.Nature L74.466-467.
Spaink, H.P.? C.A. V/ijffelman, E. Pees, R.J.H. Okker & B.J.J. Lugtenberg(19_87). Rhizobium nodulation gene nodD as a determinant of host specifrcity. Nature328,337-340.
Stachel, SE & E.'W. Nester (1986). The genetic and transcriptional organization ofvir region of the A6 Ti-plasmid of Agrobacterium tumefaciens. EMBO I. 5, LMs-r454.
Stachel, S.E. & P.C. Zambryski (1986a). ylEA andy!¡G confol the plant-inducedactivation of the T-DNA transfer process of Agrobacterium tumefacièns . Cell46,325-333.
Stachel, S.E. & P.C.Zambryski (1986b). Aerobacterium tumefaciens and thesusceptible plant cell: A novel adaptation of extracellular recognition and DNAconjugation. Cell 47, 155-157 .
Stachel, S.E., B. Timmerman &.P.Z,ambryski (1986a). Generation of single-stranded T-DNA molecules during the initial stages of T-DNA transfer fromAgobacterium tumefaciens to plant cells. Nature 322,70G712.
Stachel, S.E., E.W. Nester & P.C. Zambryski (1986b). A plant cell factor inducesAgobacterium tumefaciens vir gene expression. Proc. Natl. Acad. Sci. USA 83,379-383.
t28
Starr, M.P. (1946). The nutrition of phytopathogenic bacteria. II. The genusAgobacterium. J. Bact. 2,187-194.
Stonier, T. (1960). Agrobacterium tumefaciens II. Production of an antibioticsubstance. J. Bact. Zg 889-898.
Strobel, G.A. & G.N. Lanier (1981). Dutch Elm Disease. Sci. Amer. 145,56-66.
Sule, S. (1978). Biotypes of Agrobacterium tumefaciens in Hungary. J. Appl. Bact4L 2O7-2r3.
Sykes, L.C. & A.G. Matthyse (1986). Time required for tumor induction byA grobacterium tumefacien s. Appl. Environ. Microbiol. 52, 597 -598.
Tarbah, F.A. & R.N. Goodman (1986). Rapid detection of Agfqbacteriumtumefaciens in grapevine propogating material and the basis for an efficient indexingsystem. Plant Disease 4, 566-568.
Tarbah, F. & R.N. Goodman (1987). Systemic spread of Agrobacteriumtumefaciens biovar 3 in the vascular system of grapes. Phytopathology 77 ,915-920.
Tate, M.E. (1968). Separation of myoinositol pentaphosphates by moving paperelectrophoresis. Anal. Biochem. 23, l4l-149.
Tate, M.8., P.J. Murphy, W.P. Roberts & A. Kerr (1979). Adenine N6- substituentof agrocin 84 determines its bacteriocin-like specificity. Nature 280,697-699.
Tempé, J. & A. Goldmann (1982). Occwrence and biosynthesis of opines. In:'Molecular Biology of Plant Tumors'. G. Kahl & J. Schell, eds. Acadèmic Press,New York. pp. 427-449.
Tempé, I. & A. Petit (1983). La Piste des Opines. In: 'Molecular Genetics of theBacteria Plant Interaction.' A. Puhler, ed. Springer, Berlin. pp.14-32.
Tempé, J., P. Guyon, D. Tepfer & A. Petit (1979). The role of opines in theecology of the Ti-plasmids of Ag¡obacterium.In: " Plasmids of medical,environmental and commercial importance". K.N. Timmis & A. Puhler, eds.Elsevier/ North Holland Biomedical Press, Amsterdam New York. pp. 353-363.
Tempé, J., A. Petit & S.K. Farrand (1984). Induction of cell proliferation by4grobacterium tumefaciens and A. rhizogenes: A parasite's point of view. In: 'PlantGene Research: Genes Involved In Microbe-Plant Interactions'. D.P.S. Verma & T.Hohn, eds. Springer-Verlag, Vienna. pp. 27 l-286.
_fhoryqs, C.M. (1981). Molecular genetics of the broad hostrange plasmid RK2.Plasmid 5, 10-19.
_ Thomashow, M.F., C.G. Panogopoulous, M.P. Gordon & E.W. Nester (1980).$.o¡t1q8e of Agrobacterium tumefaciens is determined by the Ti-plasmid. Nature283,794-796.
Knauf & E.V/. Nester (1981). Relationship between thee octopine-type Ti-plasmids of A grobacterium tumefaciens.
129
Thomashow, L., S. Reeves & M.F. Thomashow (1984). Crown gall oncogenesis:evidence that a T-DNA gene from the Agrobacterium Ti-ptasmid pTiA6 encodes anenzyme that catalyzes synthesis of indoleacetic acid. Proc. Natl. Acad. Sci. USA 81,5071-5075.
Thomson, J.A. (1986).The potential for biological control of crown gall disease ongrapevines. TIBSTECH. August 1986, 219-224.
Tremblay, G., Gagliardo, W.S. Chilton & P. Dion (1987). Diversity among opine-utilizing bacteria: Identification of coryneform isolates. AppL Environ. Microbiol. 53,L5L9-1524.
Trevelyan, W.E., D.P. Proctor & I.S. Harrison (1950). Detection of sugars onpaper chromatograms. Nature 766, 444-M5.
Unger, L., S.F. Ziegler, G.A. Huffman, V.C. Knauf, R. Peet, L.W. Moore, M.P.Gordon & E.V/. Nester (1985). New class of limited-host-range Agrobacteriummega-tumor-inducing plasmids lacking homology to the transfered DNA of a wide-host-range, tumor-inducing plasmid. J. B act. | 64, 7 23-7 30.
Van Larebeke, N., G. Engler, M. Holsters, S. Van der Elsocker,I.Z,aenen, R.A.Schilperoort & J. Schell (1974). Large plasmid in Agrobacterium tumefaciensessential for crown gall inducing activity. Nature 252,255-264.
Van Larebeke, N., C. Genetello, J. Schell, R.A. Schilperoort, A.K. Hermans, J.P.Hemalsteens & M. Van Montagu (1975). Acquisition of tumour-inducing ability bynon-oncogenic agrobacteria as a result of plasmid transfer. Nature 255, 7 42- 7 43 .
Van Larebeke, N., C. Genetello, J.P. Hernalsteens, A. Depicker, I.Zaenen,E.Messens, M. Van Montagu & J. Schell (1977). Transfer of Ti-plasmids betweenAerobacterium strains by mobilisation with the conjugative plasmid, RP4. Mol. Gen.Genet. I52. Ll9-124.
Van Montagu, M. & J. Schell (1979). The plasmids of Agrobacterium tumefaciens.In'Plasmids of Medical, Environmental and Commercial Importance'. K.N. Timmis& A. Puhler, eds. Elsevier/ North Holland Press, Amsterdam. pp.7l-95.
Wang, C.L., J.E. Beringer & P.R. Hirsch (1986). HostRhizobium leguminosarum biovars vicae and trifolii. J.2070.
plant effects on hybrids ofGen. Micro.132,2063-
'Watson,8., T.C. Currier, M.P. Gordon, M.D. Chilton & E.W. Nester (1975).Plasmid required for virulence of Agrobacterium tumefaciens. J. Bact. 123,255-264.'Webster, J., M. dos Santos & J.A. Thomson (1986). Agrocin-producing
4grobacterium tumefacienq strain active against grapevine isolaies. Appl. Environ.Microbiol. 52, 217 -219.
Weller, D.M. (1984). Distribution of a take-all suppressive strain of Pseudomonasfluorescens on seminal roots of winter wheat. Appl. Environ. Microbiol. 48,897-899.
'weller, D.M. & R.J. cook (1981). Pseudomonads from take-all conducive andsuppressive soils (Abstr.). Phytopathology 7 l, 264.
Weller, D.M. & R.J. Cook (1983). Suppression of take-all of wheat by seedtreatments with fl uorescent pseudomonads. Phytopathology 7 3, 463-469.

130
'Whatley, M.H., J.S. Bodwin, B.B. Lippincott & J.A. Lippincott (L976). Role forAgrobacterium cell envelope lipopolysaccharide in infection site attachment. Infect.Immun. 13, 1080-1083.
White, F.F. & E.rü/. Nester (1980). Hai.y roofi plasmid encodes virulence traits inAgrobacterium rhizogenes. J. Bact. 141, 1I34-II4I.
White, L.O. (1972). The t¿xonomy of the crown gall organism Agrobacteriumtumefaciens and its relationship to rhizobia and other agrobacteria. J. Gen. Micro.72,565-574.
Willmitzer, L., M. DeBeuckeleer, M. Lemmers, M. Van Montagu & J. Schell(1980). DNA from Ti-plasmid present in nucleus and absent from plastids of crowngall plant cells. Nature 287,359-361.
'Winans, S.C, P.R. Ebert, S.E. Stachel, M.P. Gordon & E.V/. Nester (1986). Agene essential for Aerobacterium virulence is homologous to a family of positiveregulatory loci. Proc. Natl. Acad. Aci. USA 83, 8278-8282.
Xu, G.-W. & D.C. Gross (1986). Field evaluations of the interactions amongfluorescent pseudomonads, Erwinia carotovora and potato yields. Phytopathologyre 4n-430.
Yadav, N.S., J. Vanderleyden, D.R. Bennett, W.M. Barnes & M.D. Chilton(1982). Short direct repeats flank the T-DNA on a nopaline Ti-plasmid. Proc. Natl.Acad. Sci. USA 79,6322-6326.
Yamada, S. & H.A. Itano (1966). Phenanthrenequinone as an analytical reagant forarginine and other mono-substituted guanidines. Biochimica et Biophysica Acta 130,538-540.
Yanofsky, M.F. & E.W. Nester (1986). Molecula¡ characterization of a host-range-determining locus from Aerobacterium tumefaciens. J. Bact. 168,244-250.
Yanofsky, M.F., A. Montoya, V. Knauf, B. Lowe, M. Gordon & E. Nester(1985a). Limited-host-range plasmid of Agobacterium tumefaciens: Molecula¡ andgenetic analyses of transferred DNA. J. Bact. 163,341-348.
Yanofsky, M.F., B. [-owe, A. Montoya, R. Rubin, \ry'. Krul, M. Gordon & E.Nester (1985b). Molecular and genetic analysis of factors controlling host range inA grobacterium tumefaciens. Mol. Gen. Gene t. 2OI, 237 -246.
Yanofsky, M.F., S.G. Porter, C. Young, L.M.Albright, M.P. Gordon & E.V/.Nester (1986). The vuD operon of Agrobacterium tumefaciens encodes a site-specif,rcendonuclease. Cell 47, 47 l-477.
Zaenen,I., N. Van Larebeke, H. Teuchy, M. Van Montagu & J. Schell (L974).Supercoiledcircular DNA in crown gall inducing Agrobacterium strains. J. Mol.Biol. 86, 109-127.
Zambryski, P., H.Goodman, M. Van Montagu & J. Schell (1983). Agrobacteriumtumor induction. In: 'Mobile Genetic Elements'. J. Shapiro, ed. Academic Press,New York. pp. 505-535.