Embed Size (px)
Citation preview

Page 1/24
Assessing Factors Affecting Drought, Earthquake,and Flood Risk Perception: Empirical Evidence FromBangladeshJaved Mallick
King Khalid UniversityRoquia Salam
Begum Rokeya UniversityRuhul Amin
Begum Rokeya UniversityA R M Tow�qul Islam ( tow�[email protected] )
Begum Rokeya University https://orcid.org/0000-0001-5779-1382Aznarul Islam
Aliah UniversityMd. Nur Alam Siddik
Begum Rokeya UniversityGM Monirul Alam
Bangabandhu Sheikh Mujibur Rahman Agricultural University
Research Article
Keywords: Disaster risk reduction, econometric model, probit regression, risk perception, Bangladesh
Posted Date: August 20th, 2021
DOI: https://doi.org/10.21203/rs.3.rs-776454/v1
License: This work is licensed under a Creative Commons Attribution 4.0 International License. ReadFull License

Page 2/24
AbstractUnderstanding household disaster risk perception is crucial to formulate and apply disaster risk reductionstrategies. Using survey data from 300 households from three highly disaster-prone areas of the lowerTeesta River basin in Bangladesh, this study explores households’ risk perception of drought, earthquake,and �ood at the local-level. The ordered probit regression model was applied to identify the factorsin�uencing household disaster risk perception. Most of the respondents perceived the likelihood ofoccurring drought, earthquake, and �ood hazards on large-scale in the selected areas which cause negativeimpacts on their quality of life and �nancial losses. They lacked knowledge on mitigation actions whichmakes them unable to control the devastating impacts of disasters. Econometric results show thathouseholds’ age, gender, education, and income-generating sources had signi�cantly in�uenced therespondent's drought, earthquake, and �ood risk perception (p < 0.01). Female participants perceived morerisks, less knowledge on mitigations actions, and are less capable of controlling the hazards than theircounterparts making them vulnerable group to the impacts of hazards. Urgent action is required to improvetheir socioeconomic conditions, to reduce the knowledge gap between male and female, as well as toimprove the household’s understanding of mitigation and preparedness for mitigating disaster risk.
1. IntroductionRisk perception (RP) is an essential constituent for formulating and implementing disaster risk reduction(DRR) approaches and plans (Peacock et al., 2005; Sattar and Cheung, 2019). Under the connotation ofcommunity participation in DRR strategies, the household’s RP has gained much attention in recent studies(Birkholz et al., 2014; Rana and Routray, 2016; Sattar and Cheung, 2019). Bangladesh is an extremedisaster-prone country ranked 5th position in terms of the occurrence of disasters in the world (Dastagir,2015). Floods, droughts, and earthquakes are the most challenging disasters among the frequentlyoccurring various natural hazards in the country (Barua et al., 2016; Islam et al., 2017; Rahman, 2019;Zhang et al., 2019). Every year millions of people lose their livelihoods, lands, and societal status due tothese frequently occurring disasters (Habiba et al., 2012; Alam et al., 2018).
The Lower Teesta Basin (LTB) of northern Bangladesh has been facing the di�culties of �oods anddroughts on a different scale every year. Although earthquake is not a frequently occurring event in northernBangladesh, this region is seismically active due to the Dauki fault and Shillong plateau in its north causinginfrastructure disruption, environmental disruption, and so on when it occurs (Paul and Bhuiyan, 2010;Haque, 2015; Islam et al., 2016). These disasters cause huge losses of crops resulted in regional andseasonal food insecurity, livelihood loss, migration-related crises, psychological problem, andenvironmental degradation (Paul, 1997; Paul, 1998; Azad et al., 2013; Islam et al., 2014; Barua et al., 2016;Rahman, 2017; Mardy et al., 2018; Haque et al., 2019). However, the degree of disaster risk and loss differfrom individual to individual based on the perception of the respective disaster (Fernandez et al., 2018).Consequently, clear perception and understanding of any disaster by the household might contribute toreducing the potential losses through forwarding planning of how and which initiatives are needed tolessen the disaster impacts. Reliable local level data is the primary prerequisite of getting the clear insightabout the contemporary level of the RP of the residents at local areas which is very essential to act

Page 3/24
accordingly to reduce the bad effects of extreme events arising from the lack of proper knowledge onhazards preparedness and mitigation at local areas. So, it is crucial to assess RP at local-scale, instead ofconstructing a generalize idea by considering a large area.
This is also crucial to understand the factors that in�uence household RP for adopting options bypolicymakers and planners for sustainable disaster management, especially for sustainable agriculturalcrop management (Islam et al., 2020). Several studies have found that socioeconomic characteristics suchas gender, education, age, family size, and monthly income are signi�cantly correlated with various risksperception variables such as controllability, knowledge of mitigation options, and perceived likelihood ofdisaster. These characteristics in�uence people to take appropriate measures for reducing disaster losses(Abid et al., 2015; Daramola et al., 2016; Qasim et al., 2016; Mills et al., 2016; Shah et al., 2017; Ahmad andAfzal, 2020). There is, however, a lack of studies on households’ RP in many Southeast Asian nations,including Bangladesh. Even after the great �ood in northern Bangladesh in August 2017, there found nonotable research on �ood RP (Islam and Haque, 2018). Previous studies on RP conducted in north-westernBangladesh considering in single risk perspective of drought (Habiba et al., 2012, Salam et al., 2021),Earthquake (Islam et al., 2016), Riverbank erosion (Alam et al., 2017), and �ood risk (Rahman, 2017).However, the integrated RP studies of drought, earthquake, and �ood are still unexplored in Bangladesh.Previous studies have mainly focused on reasons, outcomes, and measures for lessening the risks of thesedisasters in northern Bangladesh (Habiba et al., 2012; Azad et al., 2013; Habiba et al., 2014; Islam et al.,2014; Barua et al., 2016; Islam et al., 2016; Ferdous and Mallick, 2019; Rahman, 2019; Haque et al., 2019).To the best of the authors’ knowledge, no prior published studies have been explored the local level RP atthe household level and the factors in�uencing their simultaneous RP of drought, �ood, and earthquake inBangladesh. In northern Bangladesh, disaster risk management strategies had prepared at differentadministrative scales (Islam and Haque, 2018), without a deeper insight into the level of households RPand what provisions they had implemented to avoid disaster risks (Habiba et al., 2012). For motivatinglocal households to take disaster preparedness actions, it is very essential to recognize which factorsstimulate them taking cautionary actions. This study �lls the void in the gaps in RP research. Thus, thegoals of this study are: (i) to understand the local level of RP of drought, earthquake, and �ood among thelocal households at three disaster-affected areas of the LTB of northern Bangladesh; and (ii) to detect thesocio-economic and observed factors affecting households’ RP. The �ndings of this study will help thepolicymakers and practitioners to take precise DRR strategies.
2. Theoretical FrameworkRP is de�ned as commons views, attitudes, decisions, and emotional states on the possibility andsigni�cance of the events, or technologies (Fernandez et al., 2018). In other words, psychological, spiritual,cultural, social, indigenous knowledge of the individual which collectively regards as experiences of certainrisk factors can clearly de�ne any hazardous satiation and its fate known as RP. In a short term, theprogression of collection, selection, and interpretation of the impacts of certain unpredictable events denoteRP (Wachinger, 2013; Castro et al., 2017). Most scholars do believe that commons RP can in�uence theirpreparedness for, response to, and recovery from natural disasters (Grothmann and Reusswig, 2008; Ho et

Page 4/24
al., 2008; Salam et al., 2021). RP plays a vital role in managing any hazardous and disastrous event.Knowledge of RP may give a signi�cant understanding of common people’s readiness to implementcautionary measures and may assist government and non-governmental organizations (NGOs) DRRstrategies (Pidgeon, 1998, Rana and Routray, 2016). Researcher scholars reached a consensus that RP ismeasured in higher by scholars than the two vital features of risk: possibility and magnitude of effect (Ren,2001).
Now a day, the impacts of several disasters increased nearly exponentially throughout the world. Natureand extent of disaster impacts vary from place to place, season to season, and community to community.The mitigation actions, as well as adaptive strategies, are also depending on the respective communities’and places’ socio-economic and geographic characteristics, respectively. The lower Teesta basin (LTB) ofnorthern Bangladesh is susceptible to drought, earthquake, and �ood due to its geographic location,physical characteristics, and socio-economic characteristics of the people of that area (Haque, 2015; Islamet al., 2016; Mardy et al., 2018; Haque et al., 2019). Prolonged shortage of groundwater along with surfacewater for a considerable period due to rainfall de�ciency, extensive withdrawal of groundwater, anddeforestation causing extensive structural, environmental, agricultural, and socio-economic disruption of acertain community regarding as drought (Islam et al., 2017; Mardey et al., 2018; Ahmed et al., 2019).Earthquake is the most unpredictable and overwhelming geo-tectonic hazard in the earth history de�ned asthe sudden vibrating of the surface of the earth due to the intension of severe energy discharge mainlycaused by movement of plates and seismic activities (Paul and Bhuiyan, 2010; Choudhury et al., 2020). On28 April 2021, a strong earthquake measuring 6.0 magnitude on the Richter scale had been felt in almostall regions of Bangladesh and the epicenter of that ground shaking is situated 43 km west far-�ung AssamTezpur (The Daily Star, 2021). Due to its unpredictability a small-scale earthquake able to cause severestructural, hydrogeological, and environmental damages which then disrupts the normal economic andsocial life status of the affected community. A �ood is a hydro-meteorological event de�ned as theout�ows of water of the bank of the river which then �ows onto dry land and persists for a long time onthat land. Several natural, as well as anthropogenic factors, act as triggering elements for occurring �oodssuch as heavy rainfall, deforestation, unplanned structural establishment by grabbing river, and unplannedriver dredging (Tingsanchali, 2012; Azad et al., 2013). Therefore, the planners and policymakers must knowthe RP about a certain disaster to formulate appropriate rules, laws, and regulations for sustainable riskmanagement in a certain community.
2. Data And Methods
2.1 Study area descriptionThe LTB is the home of around 30 million people. About 71% area of the Teesta Basin has covered the LTBpositioned in the northwest part of Bangladesh. The present research has been selected the Upazilas (i.e.,sub-district) Kaunia, Lalmonirhat Sadar, and Char Rajibpur, respectively, from the districts Rangpur,Lalmonirhat, and Kurigram by taking consideration of the severity of drought, earthquake, and �ood (Fig.1). In Bangladesh, mouza has been recognized as the lowermost administrative unit made of one or more

Page 5/24
than one village (BBS, 2014). For this reason, mouza has been taken in consideration with a view tocollecting comparatively precise data. Data were collected from Haibat Khan (Kaunia), Madhuram(Lalmonirhat Sadar), and Swikar Pur (Char Rajibpur) mouza of Tepamadhupur, Rajpur, and Mohanganjunions, respectively.
An overview of the study areas is presented in Table S1 (please see the supplementary �le). Table S1shows the climatic condition of the three Upazilas. These areas are located in the northern part ofBangladesh, adjacent to the largest Teesta and Brahmaputra rivers. Heavy monsoon rain and water fromupstream sources have triggered rivers to raise its water levels. The rivers become dry for removing waterfrom its upstream in certain periods of the year, and this region is situated in the seismically active zone.For these reasons, these areas are highly vulnerable to �ooding, drought, and earthquake hazards. Severalnatural hazards have severely damaged the population leading to death tolls and property losses. Most ofthe people in this region depend on agriculture as their main source of income. The local people havecomparatively given priority to the indigenous knowledge they holding instead of scienti�c approaches forbuilding different types of disaster RP. All These reasons together have driven to choose these speci�careas for this study.
2.2 Ethical considerationInformed permission was taken before the questionnaire investigation. The �eld assistants were trainedbeforehand and consent were taken from the survey respondents. They were informed that the informationwill be used for research purposes. The authors took help for correctly reviewing and approving the contentof the questionnaire and the procedure of the survey from a committee of Department of DisasterManagement of Begum Rokeya University, Rangpur, Bangladesh that has been working for evaluatingproposal and considering the ethical issues.
2.3 Design of the questionnaire, collecting and coding thedataData has been collected by making some �eld visits with the intension of collecting the requiredinformation needed to complete the proposed study from the selected study areas. The total number ofpopulations of Haibat Khan, Madhuram, and Swikar Pur, respectively, are 2995, 2704, and 1098 (BBS, 2014;BBS, 2015). The present study has been utilized the method for calculating the total number of sample sizefor each area that had proposed by Cochran (1977). After applying the Cochran’s formula, the total numberof calculated sample size found for this study (p < 0.05 and error value at < ± 10%) were 98, 98, and 92,respectively, for Haibat Khan, Madhuram, and Swikar Pur mouza. This study has increased the number ofsample size up to 100 for each mouza of Haibat Khan, Madhuram, and Swikar Pur. Thus, the total numberof sample size taken for this study is 300. Before �nalizing the structured questionnaire, in early August2019, a pre-testing questionnaire survey was conducted for assessing the rationality along with thetopicality of the questions. By considering all the feedbacks collected from the participants of the pre-testing survey, the questionnaire was �nalized (see the supplementary �le). There are two parts in thequestionnaire: i) demographic information, and ii) risk perception items. The questionnaire consisted of 16

Page 6/24
questions, where 9 questions were for the basic demographic pro�le and disaster experience of therespondent and the remaining 7 questions were under risk perception items using a Likert scale 1–5.
The household head (both male and female) was selected as the respondent for the interview. Randomselection method was applied for selecting the respondents. Before commencing the interview, the purposeof the survey was informed to the participants. If any participant hesitated to talk, then the surveyors hasstepped forward to another one. From the time between August to September, 2019, in-person interviewswere conducted.
In case of the absence of the household head, an adult member of that household was interviewed. Whenboth household head and adult members were absent, data collectors were moved to the next-doorhousehold. The collected data were then coded and analyzed utilizing the software Statistical Package forthe Social Sciences (SPSS v23).
2.4 Econometric analysisPrevious studies on factors in�uencing households’ disaster RP employed the probit model, binary logitmodel, multinomial logit model, and ordered probit model (Gbetibouo, 2009; Mabe and Donkoh, 2014;Fadina and Barjolle, 2018; Fernandez et al., 2018; Ullah et al., 2018). Some scholars have argued for usingthe ordered probit model due to its robustness, simple statistical calculation, and reliable outcomes(Alauddin and Tisdell, 2006; McKelvey and Zavoina, 2007; Ho et al., 2008; Farnandez et al., 2018). Thisstudy also used an ordered probit model to explore the factors affecting drought, earthquake, and �ood riskperceptions of the households in the study areas. The model can be stated as follows Duncan et al. (1998):
y *= β'x+є (1)
Where, in this study, y* denotes dependent variable (i.e., perceived likelihood, dread or fear, threat to life,anticipation of �nancial loss, effect on the quality of life, knowledge of mitigation actions andcontrollability); β' denotes the vector of estimated parameters and x is the vector of explanatory variables(i.e., age, gender, education, monthly income, family size, income-generating source, housing type, andexperience of disasters); denotes error term. This model explored the factors affecting drought,earthquake, and �ood RP in the study areas. In recent decades, the ordered probit model has beenextensively used by several scholars from different parts of the world for exploring the factors in�uencingthe RP of �re, cyclone, and earthquake hazards (Alauddin and Tisdell, 2006; McKelvey and Zavoina, 2007;Ho et al., 2008; Farnandez et al., 2018).
According to the pre-survey outcomes, 7 dependent variables such as perceived likelihood (PL), threat to life(TL), effect on the quality of life (EQL), anticipation of �nancial loss (AFL), Dread/fear (DR/FR), knowledgeof migration actions (KMA) and controllability (CR), were measured using a 5-point Likert scale (see thesupplementary �le). The ordered probit model is appropriate for this analysis/ or/Since the dependentvariables are ordered categorical variables, therefore, ordered probit regression model is suitable for theanalysis. Relatively few studies have employed ordered probit regression model to analyze factorsaffecting household risk perception (Farnandez et al., 2018; Islam et al., 2020). The descriptions of the

Page 7/24
explanatory variables are presented in Table S2. Table S3 shows the description of the dependent variablesused in the model.
3. Results
3.1. Demographic informationThe Table S2 of supplementary document shows the mean, standard deviation, and description of theexplanatory variables. The mean age of the respondents is 39.96 (SD 13.60). The majority has noeducation (45%) and lived in a Teen-made house with the mean family size is 5.37 (SD 2.17). Most (58%)of them had a monthly household income of BDT 5100 to 10,000 from agriculture or farming (47%), as it istheir main income-generating source. The majority of the respondents (91%) had experienced droughtdisasters followed by �oods (90%) and earthquakes (78%) disaster (Table S2).
3.2 Perception of drought, earthquake, and �oodThe respondent's perception of drought, earthquake, and �ood is graphically represented by Fig. 2 and isnumerically presented by Table S4. Surprisingly, most of the respondents believe drought, earthquake, and�ood will likely happen in the upcoming years (Fig. 2a). About 42.9% of the respondents perceived �ood,52.1% drought, and 33.3% earthquake will occur largely in the upcoming years in the study areas (TableS4). Very few respondents perceived that drought (5.0%), earthquake (33%), and �ood (1.7%) will occur onsmall scale and a group of people was neutral to speak out about the future likelihood of drought (3.3%),earthquake (6.9%) and �ood (9.6%) (Fig. 2a).
Figure 2b illustrates the perception among the respondents about the threat created by drought, �ood, andearthquake in the study areas. Very few respondents were neutral on the topic. Few respondents perceivedthese disasters as a less threat to their life. Approximately, 58.4% of the respondents perceived �ood, and47.2% of respondents perceived drought as a very serious threat to their life (Table S4). Almost 46.5% ofthe respondents perceived that earthquake poses a little serious threat to their everyday life (Table S4).
Figure 2c describes the perception of the respondents about the impacts of the selected disasters on theirquality of life. Nearly three fourth number of the respondents perceived that these disasters have bothserious and very serious effects on their quality of life. About 38.2% of respondents thought that theearthquake had a little impact on their quality of life (Table S4). Very few didn’t give any perceptions andthe rest of the people thought that these disasters are not serious at all for altering the quality of their life(Fig. 2c).
A small number of respondents anticipated a little serious �nancial loss due to the disasters. About two-thirds of the respondents anticipated serious and very serious �nancial loss due to the disasters (Fig. 2d).About 52.8% of the respondents said �ood and 41.8% said drought was liable to very serious �nancial lossand earthquake (37.2%) posed a little serious �nancial problem in the study areas (Table S4).

Page 8/24
It is evident that most of the participants are afraid and very afraid of disasters (Fig. 2e). About 52.6% ofpeople are very afraid of �ood and 53.1% for drought and approximately 54.4% of people are afraid of theearthquake (Table S4). A few respondents who can face disaster or have some resources are not afraid ofany disaster at all. Very few respondents were neutral about their fear of disasters (Fig. 2e).
Figure 2f shows that about one third of the participants have unclear mitigation knowledge of thedisasters. Very few respondents pose very clear mitigation actions against the selected disasters.Surprisingly, many respondents (66%) pose unclear mitigation measures related to the earthquake. Nearly,35.3% and 44.2% of the respondents have unclear knowledge of mitigation strategies against �ood anddrought disasters, respectively (Table S4).
Many of the respondents assume that they have little control over the negative impacts of droughts,earthquakes, and �oods (Fig. 2g). One-third of the respondents believe that they cannot control thedisastrous impacts of drought, �ood, and earthquake at all. The rest of the respondents were neutral forgiving any perception and nearly 31.0% of the respondents were neutral about the controllability of theimpacts of the earthquake (Table S4).
3.3 Factors affecting drought risk perceptionThe values of the coe�cient estimated by ordered probit models for drought hazards are shown in Table 1.The model offers a good �t where all the explanatory variables show the expected sign. The result indicatesthat respondents’ age is signi�cantly correlated with their anticipation of �nancial loss (0.03, P < 0.01),dread/fear (0.020, P < 0.05), knowledge of mitigation actions (0.016, p < 0.05), and controllability (0.015, p < 0.1). Gender and education of the respondents’ have found a signi�cant positive relationship with theperceived likelihood (2.326 and 0.717, p < 0.1), threat to life (1.648 and 0.539, p < 0.01), and negativerelationship with the knowledge of mitigation actions (-2.191 and − 0.413, p < 0.1) and controllability(-1.273 and − 0.572, p < 0.1) respectively. Effects on quality of life (-0.194, p < 0.01), fear (-0.065, p < 0.05)and controllability (0.069, p < 0.1) signi�cantly in�uenced by the respondents' family size. Perceptions ofthe effects on quality of life (0.119, p < 0.05), knowledge of mitigation actions (-0.219, p < 0.01), andcontrollability (0.218, p < 0.01) signi�cantly in�uenced by the respondent's monthly income. People’sincome-generating sources (except fear and controllability) and housing type signi�cantly correlated withthe perception of the respondents related to drought events. Surprisingly, experiences of past droughthazards didn’t signi�cantly in�uence the respondent’s perception of that hazard (Table 1).

Page 9/24
Table 1Factors in�uencing drought risk perception of the respondents
Explanatoryvariables
PL TL EQL AFL DR/FR KMA CR
Age 0.010(0.010)
0.009(0.009)
0.005(0.009)
0.030***(0.009)
0.020**(0.008)
0.016**
(0.008)
0.015*
(0.008)
Gender 2.326***(0.280)
1.648***
(0.225)
1.454***(0.209)
2.501***(0.250)
1.485***(0.198)
-2.191***(0.220)
-1.273***
(0.180)
Education 0.717***(0.116)
0.539***(0.094)
0.671***(0.093)
0.187**(0.086)
0.166**(0.079)
-0.413***(0.081)
-0.572***(0.084)
Family size -0.037
(0.046)
-0.064
(0.040)
-0.194***
(0.040)
0.003
(0.042)
-0.065**
(0.036)
0.000
(0.038)
0.069*
(0.037)
Monthlyincome
-0.02(0.061)
-0.031(0.052)
0.119**(0.052)
0.079
(0.052)
0.013(0.048) -0.219***(0.051)
-0.218***(0.050)
Incomesource
0.146***(0.049)
0.108**(0.042)
0.136***(0.041)
0.249***(0.042)
0.048(0.037)
-0.071**(0.038)
-0.027
(0..038)
Housingtype
-0.464***(0.105)
-0.195**(0.091)
-0.497***(0.092)
-0.420***(0.092)
-0.142*(0.083)
-0.269***(0.089)
0.147*
(0.086)
Exp. ofDrought
-0.232(0.301)
-0.295(0.266)
-0.185(0.259)
-0.026(0.272)
-0.281(0.242)
0.041(0.240)
0.153
(0.241)
Number ofsamples
300 300 300 300 300 300 300
Note. N = 300. Standard errors are in parentheses. (***, **, and * indicates variable signi�cant at 1%, 5%and 10%, respectively).
3.4 Factors in�uencing earthquake risk perceptionThe results of the ordered probit model for the determinants of earthquake hazards are shown in Table 2.

Page 10/24
Table 2Factors in�uencing earthquake risk perception of the respondents
Explanatoryvariables
PL TL EQL AFL DR/FR KMA CR
Age -0.013*(0.007)
-0.015**
(0.007)
-0.005(0.007)
0.02***(0.007)
0.010(0.007)
0.004(0.008)
0.021***(0.007)
Gender 0.823***(0.163)
0.489***(0.162)
0.953***(0.163)
0.613
(0.162)
0.807***(0.170)
-0.932***(0.182)
-0.634***(0.164)
Education 0.115(0.072)
0.069(0.073)
0.056(0.072)
0.047
(0.072)
-0.253***(0.076)
-0.026
(0.076)
0.129*
(0.074)
Family size -0.076**(0.034)
-0.007(0.034)
-0.026(0.033)
-0.029(0.033)
0.014(0.035)
0.048
(0.035)
0.043
(0.034)
Monthlyincome
-0.011(0.045)
-0.040(0.046)
-0.008(0.045)
-0.007(0.045)
0.019(0.047)
-0.134***(0.049)
-0.003
(0.046)
Incomesource
0.104***(0.036)
0.018(0.036)
0.011(0.036)
0.073**(0.036)
0.108***(0.037)
-0.031
(0.039)
0.053
(0.036)
Housingtype
-0.270***(0.080)
0.175**
(0.082)
-0.008(0.080)
-0.050(0.079)
-0.079(0.083)
-0.319***(0.086)
-0.004
(0.082)
Exp. ofearthquake
-0.183(0.151)
0.082(0.153)
-0.051(0.151)
-0.196(0.150)
-0.137(0.155)
-0.075
(0.163)
0.068
(0.154)
Number ofsamples
300 300 300 300 300 300 300
Note. N = 300. Standard errors are in parentheses. (***, **, and * indicates variable signi�cant at 1%, 5%and 10%, respectively).
All the explanatory variables except education and experience of earthquake signi�cantly in�uenced theperceived likelihood of the respondents. Gender signi�cantly and positively in�uenced the respondents’perception of perceived likelihood (0.823, p < 0.01), threat to life (0.489 p < 0.01), effects on quality of life(0.953, p < 0.01), dread (0.807, p < 0.01) and signi�cant negative relationship with the knowledge ofmitigation actions (-0.932, p < 0.01) and controllability (-0.634, p < 0.01). The anticipation of �nancial losswas signi�cantly related to the respondent's age (0.02, p < 0.01) and income-generating sources (0.073, p < 0.05). Age and education are highly correlated with the controllability of earthquakes. Knowledge ofmitigation actions is signi�cantly in�uenced by respondents' monthly income and housing type. Educationand income-generating source were signi�cantly responsible for creating fear in the mind of the

Page 11/24
respondents. Perception of the threat to life created by earthquake signi�cantly in�uenced by therespondent's age (-0.015, p < 0.05), and housing type (0.175, p < 0.05). Experiences of past earthquakeevents didn’t signi�cantly in�uence the respondents on their perception of that hazard.
3.5 Factors in�uencing �ood risk perceptionThe values of the coe�cient estimated by the ordered probit model for �ood hazards are shown in Table 3.Gender and income-generating sources shows signi�cant positive correlation with perceived likelihood(0.415, p < 0.1 and 0.170, p < 0.01), threat to life (0.980, p < 0.01, and 0.205, p < 0.01), effects on quality oflife (0.197, p < 0.01 and 0.085, p < 0.05), anticipation on �nancial loss (0.803, p < 0.01 and 0.202, p < 0.01),dread (0.459, p < 0.01 and 0.198, p < 0.01), and signi�cant negative correlation with knowledge ofmitigation actions (-1.255, p < 0.01 and − 0.109, p < 0.01) and controllability (-0.756, p < 0.01 and − 0.081, p < 0.05), respectively. Following the drought and earthquake risk perception, experiences of past �ood eventsdid not signi�cantly in�uence the respondents on their perception of that hazard. Age has a signi�cantnegative relationship with perceived likelihood, threat to life, effects on quality of life, and anticipation of�nancial loss. Education is a signi�cant positive factor to in�uence perceived likelihood, threat to life,effects on quality of life and anticipation on �nancial loss, and signi�cant negative relationship withcontrollability. Respondent's family size signi�cantly in�uences perceived likelihood, threat to life,knowledge of mitigation action, and controllability. Housing type signi�cantly affects the quality of life(-0.163, p < 0.1), knowledge of mitigation actions (-0.177, p < 0.05), and controllability (0.321, p < 0.01) ofthe respondents. The monthly income of the respondents did not show any signi�cant correlation withperceived likelihood, the threat to life, and effects on quality of life (Table 3).

Page 12/24
Table 3Factors in�uencing �ood risk perception of the respondents
Explanatoryvariables
PL TL EQL AFL DR/FR KMA CR
Age -0.041***(0.009)
-0.030***(0.010)
-0.018**(0.009)
-0.055***(0.010)
0.024***(0.008)
-0.002
(0.008)
-0.002
(0.00)
Gender 0.415*
(0.196)
0.980***(0.238)
0.197***(0.209)
0.803***(0.231)
0.459***(0.170)
-1.255***(0.172)
-0.756***(0.211)
Education 0.730***
(0.094)
0.496***(0.100)
0.560***(0.094)
0.717***(0.109)
-0.103(0.076)
-0.093
(0.075)
-0.200**(0.087)
Family size -0.111***(0.039)
0.111***(0.042)
-0.053(0.039)
0.028(0.041)
0.047(0.036)
-0.062*(0.034)
-0.091**(0.042)
Monthlyincome
0.025
(0.051)
-0.013
(0.055)
-0.139**
(0.055)
0.072
(0.056)
0.086*
(0.049)
-0.126***
(0.047)
-0.102*
(0.053)
Incomesource
0.170***(0.040)
0.205***
(0.044)
0.085**
(0.042)
0.202***
(0.045)
0.198***(0.039)
-0.109***
(0.038)
-0.081**
(0.040)
Housingtype
0.017
(0.092)
-0.046
(0.101)
-0.163*
(0.095)
-0.162
(0.099)
0.084
(0.085)
-0.177**
(0.085)
0.321***
(0.094)
Exp. of�ood
-0.261
(0.260)
-0.139(0.264)
-0.275(0.261)
0.068(0.295)
0.015(0.231)
0.198
(0.225)
0.097
(0.253)
Number ofsamples
300 300 300 300 300 300 300
Note. N = 300. Standard errors are in parentheses. (***, **, and * indicates variable signi�cant at 1%, 5%and 10%, respectively).
3.6 Gender based drought, earthquake, and �ood riskperceptionRP varies from person to person, region to region, gender to gender. The present study also reveals thesame thing (Figs. 3, 4 and 5). In terms of the likelihood of the occurrence of the future hazards very fewrespondents believed that there will be very small and small chance. Several participants kept theiropinions private because of unknown reason. However, majority of the respondents thought that hazardswill be occurred on large or very large scale, except earthquake. As earthquake is rarely occurred, so peopleperceived little knowledge on it. Whereas, a number of female participants reported that earthquake will beoccurred on large scale at their locality. Female perceived higher threat (except earthquake), fear, and

Page 13/24
impacts (expect for �ood) on average. Approximately, similar degree of expected loss perceived by bothmale and female for fold and earthquake. On the contrary, male perceived higher degree of anticipated lossin terms of drought. Very clear knowledge of mitigation actions lacked among the respondents and ahandsome number of participants perceived very unclear knowledge. Overall, in respect of the knowledgeof mitigation action similar number of both male and female perceived the similar knowledge. Although,female participants perceived bit more very unclear knowledge of mitigation actions than theircounterparts. Like the knowledge of mitigation action, similar number of both male and female perceivedthe similar knowledge on controllability except drought. However, majority of the female believed that theywill not able to control the disasters at all. It can be stated that the female respondents perceived morerisks, lack enough knowledge, and will be less capable of controlling the upcoming hazards than male.
4. DiscussionMaximum respondents perceived the likelihood of occurring future hazards in the study areas. Two-third ofthe respondents perceived that �ood, drought, and earthquake creating a threat to life putting negativeimpacts on the quality of life and �nancial losses. During the hazardous or disastrous event, most of therespondents felt fear for any unpleasant situation. Very few respondents know mitigation actions forrespective disasters and can manage the disastrous or hazardous situation. Plapp and Werner (2006)reported that respondents perceived that the windstorm, �ood, and earthquake will occur frequently inGermany. Peacock et al (2005) explored that experience of the hazardous event help households to takemitigation options which in turn play a vital role in lowering the negative threat to their quality of life.
The study reveals that household income-generating source, gender, age, and education are signi�cantlycorrelated with most of the dependent variables of drought, �ood, and earthquake. Fernandez et al. (2018)found that age, gender, education, family size, housing type, and monthly household income were thein�uencing factors for �re, cyclone, and earthquake hazards in Myanmar. Reliable and permanent incomegenerating sources make a positive sense to the respondents to take all the possible initiatives to managethe upcoming disasters properly which could lower the risk of creating any threats or impacts on their life.On the contrary, unstable income sources that may lose any time act as the obstacle to thinking properly bythe respondents to take measures for lessening the impacts of upcoming disasters due to their monetaryconstraint.
Disasters RP differs signi�cantly from individual to individual, from community to community and this RPis signi�cantly associated with several explanatory variables as sex, income, occupation, education, andgeographical location that is frequently reported in many studies (For example, Kellens et al., 2011;Wachinger et al., 2013; Mills et al., 2016; Rana and Routray, 2016; Sarker, 2017; Sattar and Cheung, 2019)which is consistent with the �ndings of this study. RP also varies across gender. Females perceived highrisk than males. Aged and adult people can take proper decisions for managing any hazardous situationthan the lower aged people due to their past experiences. Ahmad and Afzal (2020) explored quite similarresults that gender, age, family size, monthly income, education, and location signi�cantly in�uencedpeople to take �ood mitigation actions at the household level in Pakistan.
Page 14/24
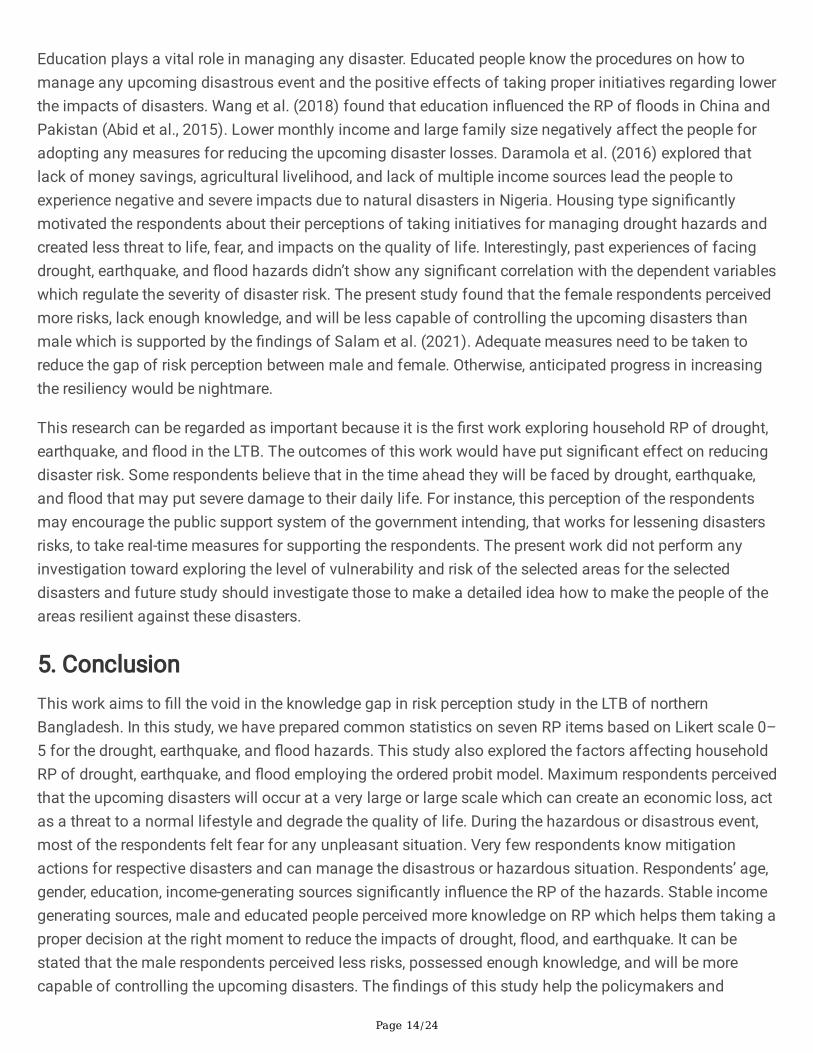
Education plays a vital role in managing any disaster. Educated people know the procedures on how tomanage any upcoming disastrous event and the positive effects of taking proper initiatives regarding lowerthe impacts of disasters. Wang et al. (2018) found that education in�uenced the RP of �oods in China andPakistan (Abid et al., 2015). Lower monthly income and large family size negatively affect the people foradopting any measures for reducing the upcoming disaster losses. Daramola et al. (2016) explored thatlack of money savings, agricultural livelihood, and lack of multiple income sources lead the people toexperience negative and severe impacts due to natural disasters in Nigeria. Housing type signi�cantlymotivated the respondents about their perceptions of taking initiatives for managing drought hazards andcreated less threat to life, fear, and impacts on the quality of life. Interestingly, past experiences of facingdrought, earthquake, and �ood hazards didn’t show any signi�cant correlation with the dependent variableswhich regulate the severity of disaster risk. The present study found that the female respondents perceivedmore risks, lack enough knowledge, and will be less capable of controlling the upcoming disasters thanmale which is supported by the �ndings of Salam et al. (2021). Adequate measures need to be taken toreduce the gap of risk perception between male and female. Otherwise, anticipated progress in increasingthe resiliency would be nightmare.
This research can be regarded as important because it is the �rst work exploring household RP of drought,earthquake, and �ood in the LTB. The outcomes of this work would have put signi�cant effect on reducingdisaster risk. Some respondents believe that in the time ahead they will be faced by drought, earthquake,and �ood that may put severe damage to their daily life. For instance, this perception of the respondentsmay encourage the public support system of the government intending, that works for lessening disastersrisks, to take real-time measures for supporting the respondents. The present work did not perform anyinvestigation toward exploring the level of vulnerability and risk of the selected areas for the selecteddisasters and future study should investigate those to make a detailed idea how to make the people of theareas resilient against these disasters.
5. ConclusionThis work aims to �ll the void in the knowledge gap in risk perception study in the LTB of northernBangladesh. In this study, we have prepared common statistics on seven RP items based on Likert scale 0–5 for the drought, earthquake, and �ood hazards. This study also explored the factors affecting householdRP of drought, earthquake, and �ood employing the ordered probit model. Maximum respondents perceivedthat the upcoming disasters will occur at a very large or large scale which can create an economic loss, actas a threat to a normal lifestyle and degrade the quality of life. During the hazardous or disastrous event,most of the respondents felt fear for any unpleasant situation. Very few respondents know mitigationactions for respective disasters and can manage the disastrous or hazardous situation. Respondents’ age,gender, education, income-generating sources signi�cantly in�uence the RP of the hazards. Stable incomegenerating sources, male and educated people perceived more knowledge on RP which helps them taking aproper decision at the right moment to reduce the impacts of drought, �ood, and earthquake. It can bestated that the male respondents perceived less risks, possessed enough knowledge, and will be morecapable of controlling the upcoming disasters. The �ndings of this study help the policymakers and

Page 15/24
planners to take proper initiatives to raise awareness, create stable livelihood options and motivate peopleto take appropriate mitigation strategies for reducing the disaster impacts for ensuring sustainabledisaster-resilient community.
DeclarationsAcknowledgements
The authors would like to thank all the survey participants in this research and the local people forassisting on numerous occasions. The authors also acknowledge the Department of Disaster Managementof Begum Rokeya University for all sorts of support to conduct this study.
Consent to Participate
Consents were taken following the standard ethics approval.
Consent to Publish
Consents were taken following the standard ethics approval.
Data availability
Data are available upon request to the corresponding author.
Funding
The authors extend their appreciation to the Deanship of Scienti�c Research at King Khalid University forfunding this work through Research Group under grant number (R.G.P.2 /194/42).
Author contributions
R.S., and R.A. designed, planned, conceptualized, and drafted the original manuscript; and R.S., and R.A.were involved in statistical analysis and interpretation; A.R.M.T.I., J.M., A.I., and G.M.M.A. contributed ininstrumental setup, and validation; A.R.M.T., A.I., and M.N.A.S. contributed in editing the manuscript,literature review, and proofreading; G.M.M.A, J.M., and A.R.M. T.I. were involved in mapping andproofreading during the manuscript drafting stage.
Con�ict of interest
No potential con�ict of interest was reported by the authors. There were no relevant �nancial or non-�nancial competing interests to report.
References

Page 16/24
1. Abid MEA, Scheffran J, Schneider UA, Ashfaq M (2015) Farmers’ perceptions of and adaptationstrategies to climate change and their determinants: the case of Punjab province, Pakistan. Earth SysDyn 6(1):225–243
2. Ahmad D, Afzal M (2020) Flood hazards and factors in�uencing household �ood perception andmitigation strategies in Pakistan. Environmental Science and Pollution Research, 1–13
3. Ahmed B, Kelman I, Kamruzzaman M, Mohiuddin H, Rahman MM, Das A, … Shamsudduha M (2019)Indigenous people’s responses to drought in northwest Bangladesh. Environmental Development29:55–66
4. Alam GMM, Alam K, Mushtaq S (2017) Climate change perceptions and local adaptation strategies ofhazard-prone rural households in Bangladesh. Climate Risk Management 17:52–63
5. Alam GMM, Alam K, Mushtaq S (2018) Drivers of food security of vulnerable rural households inBangladesh: Implications for policy and development. South Asia Economic Journal 19(1):43–63
�. Alauddin M, Tisdell CA (2006) Students' Evaluation of Teaching Effectiveness: What Surveys Tell andWhat They Do Not Tell (No. 1742-2016-140712)
7. Azad AK, Hossain KM, Nasreen M (2013) Flood-induced vulnerabilities and problems encountered bywomen in northern Bangladesh. International journal of disaster risk science 4(4):190–199
�. Barua U, Akhter MS, Ansary MA (2016) District-wise multi-hazard zoning of Bangladesh. Nat Hazards82(3):1895–1918
9. BBS (2014) Small Area Atlas Bangladesh, Bangladesh bureau of statistics, statistics and informationdivision, ministry of planning. Government of the People’s Republic of Bangladesh, Dhaka
10. BBS (2015) Small Area Atlas Bangladesh, Bangladesh bureau of statistics, statistics and informationndivision, ministry of planning. Government of the People’s Republic of Bangladesh, Dhaka
11. Birkholz S, Muro M, Jeffrey P, Smith HM (2014) Rethinking the relationship between �ood riskperception and �ood management. Science of the total environment 478:12–20
12. Castro CP, Sarmiento JP, Edwards R, Hoberman G, Wyndham K (2017) Disaster risk perception in urbancontexts and for people with disabilities: case study on the city of Iquique (Chile). Natural hazards86(1):411–436
13. Choudhury M, Verma S, Saha P (2016, December) Effects of earthquake on the surroundingenvironment: an overview. In Proceedings of International Conference on Recent Advances inMechanics and Materials
14. Cochran WG (1977) Sampling techniques, 3rd edn. John Wiley, New York
15. Daramola AY, Oni OT, Ogundele O, Adesanya A (2016) Adaptive capacity and coping responsestrategies to natural disasters: a study in Nigeria. International Journal of Disaster Risk Reduction15:132–147
1�. Dastagir MR (2015) Modeling recent climate change induced extreme events in Bangladesh: a review.Weather ClimExtrem 7:49–60
17. Della Lucia SM, Minim VPR et al (2013) Ordered probit regression analysis of the effect of brand nameon beer accepted by consumers. Food Science Technology 35(3):586–597

Page 17/24
1�. Duncan CS, Khattak AJ, Council FM (1998) Applying the ordered probit model to injury severity in truck-passenger car rear-end collisions. Transp Res Rec 1635(1):63–71
19. Fadina AMR, Barjolle D (2018) Farmers’ adaptation strategies to climate change and their implicationsin the Zou department of South Benin. Environments 5(1):15
20. Ferdous J, Mallick D (2019) Norms, practices, and gendered vulnerabilities in the lower Teesta basin,Bangladesh. Environmental Development 31:88–96
21. Fernandez G, Tun AM, Okazaki K, Zaw SH, Kyaw K (2018) Factors in�uencing �re, earthquake, andcyclone risk perception in Yangon, Myanmar. International journal of disaster risk reduction 28:140–149
22. Gbetibouo GA (2009), Understanding Farmers’ perception and adaptation to climate change andvariability: The case of Limpopo Basin, South Africa. In International Food Policy Research Institute(IFPRI), Discussion paper 00849
23. Grothmann T, Reusswig F (2006) People at risk of �ooding: why some residents take precautionaryaction while others do not. Nat Hazards 38(1–2):101–120
24. Habiba U, Shaw R, Takeuchi Y (2012) Farmer's perception and adaptation practices to cope withdrought: Perspectives from Northwestern Bangladesh. International Journal of Disaster Risk Reduction1:72–84
25. Habiba U, Shaw R, Takeuchi Y (2014) Farmers’ adaptive practices for drought risk reduction in thenorthwest region of Bangladesh. Natural hazards 72(2):337–359
2�. Haque CE, Azad M, Choudhury MUI (2019) Discourse of Flood Management Approaches and Policiesin Bangladesh: Mapping the Changes, Drivers, and Actors. Water 11(12):2654
27. Haque SM (2015) Seismic Risk Assessment in Bangladesh for Bogra, Dinajpur, Mymensingh, Rajshahi.Rangpur and Tangail City Corporation/Paurashava Areas, Bangladesh
2�. Ho MC, Shaw D, Lin S, Chiu YC (2008) How do disaster characteristics in�uence risk perception? RiskAnalysis: An International Journal 28(3):635–643. doi:10.1111/j.15396924.2008.01040.x
29. Islam ARMT, Shill BK, Salam R, Siddik MNA, Patwary MA (2020) Insight into farmers’ agriculturaladaptive strategy to climate change in northern Bangladesh. Environment, Development andSustainability, 1–26
30. Islam ARMT, Tasnuva A, Sarker SC, Rahman MM, Mondal MSH, Islam MMU (2014) Drought inNorthern Bangladesh: social, agroecological impact and local perception. International Journal ofEcosystem 4(3):150–158
31. Islam ARM, Shen S, Hu Z, Rahman MA (2017) Drought hazard evaluation in boro paddy cultivatedareas of western Bangladesh at current and future climate change conditions. Advances inMeteorology, 2017
32. Islam ARMT, Haque ME (2018) Recent �ood cause, consequence and adaptation strategies: People’sperception-based study on northern Bangladesh. Disaster Management Journal 1(1):49–64 (Banglajournal)

Page 18/24
33. Islam ARMT, Shil BK, Salam R, Siddik NA, Patwary MA (2020) Insight into farmers’ agriculturaladaptive strategy to climate change in northern Bangladesh, Environment, Development andSustainability. https://doi.org/10.1007/s10668-020-00681-6
34. Islam R, Islam MN, Islam MN (2016) Earthquake risks in Bangladesh: causes, vulnerability,preparedness and strategies for mitigation. ARPN J Earth Sci 5(2):75–90
35. Islam Z, Alauddin M, &Sarker MAR (2017) Farmers’ perception on climate change-driven riceproduction loss in drought-prone and groundwater-depleted areas of Bangladesh: An ordered probitanalysis (No. 579)
3�. Kellens W, Zaalberg R, Neutens T, Vanneuville W, De Maeyer P (2011) An analysis of the publicperception of �ood risk on the Belgian coast. Risk Analysis: An International Journal 31(7):1055–1068
37. Mabe FN, Sienso G, Donkoh S (2014) Determinants of choice of climate change adaptation strategiesin northern Ghana
3�. Mardy T, Uddin MN, Sarker M, Roy D, Dunn ES (2018) Assessing coping strategies in response todrought: A micro level study in the north-west region of Bangladesh. Climate 6(2):23
39. McKelvey RD, Zavoina W (2007) A statistical model for the analysis of ordinal level dependentvariables. Positive Changes in Political Science: The Legacy of Richard D. McK-elvey’s Most In�uentialWritings, 143 – 64
40. Mills M, Mutafoglu K, Adams VM, Archibald C, Bell J, Leon JX (2016) Perceived and projected �ood riskand adaptation in coastal Southeast Queensland, Australia. Climatic change 136(3–4):523–537
41. Paul BK (1997) Flood research in Bangladesh in retrospect and prospect: a review. Geoforum28(2):121–131
42. Paul BK (1998) Coping mechanisms practised by drought victims (1994/5) in North Bengal,Bangladesh. Applied geography 18(4):355–373
43. Paul BK, Bhuiyan RH (2010) Urban earthquake hazard: perceived seismic risk and preparedness inDhaka City. Bangladesh Disasters 34(2):337–359
44. Peacock WG, Brody SD, High�eld W (2005) Hurricane risk perceptions among Florida's single familyhomeowners. Landscape Urban Planning 73(2–3):120–135
45. Pidgeon N (1998) Risk assessment, risk values and the social science programme: why we do needrisk perception research. Reliab Eng Syst Saf 59(1):5–15
4�. Plapp T, Werner U (2006) Understanding risk perception from natural hazards: examples fromGermany. In: RISK21-coping with risks due to natural hazards in the 21st century. CRC Press, pp 111–118
47. Qasim S, Qasim M, Shrestha RP, Khan AN, Tun K, Ashraf M (2016) Community resilience to �oodhazards in Khyber Pukhthunkhwa province of Pakistan. International Journal of Disaster RiskReduction 18:100–106
4�. Rahman ML (2019) Risk perception and awareness of earthquake: the case of Dhaka. Internationaljournal of disaster resilience in the built environment

Page 19/24
49. Rahman MM (2017) Perceptions of �ood risk and investment decisions in Bangladesh (Doctoraldissertation, UNESCO-IHE)
50. Rana IA, Routray JK (2016) Actual vis-à-vis perceived risk of �ood prone urban communities inPakistan. International Journal of Disaster Risk Reduction 19:366–378
51. Renn O (2001) The need for integration: risk policies require the input from experts, stakeholders andthe public at large. Reliab Eng Syst Saf 72(2):131–135. http://dx.doi.org/10.1016/S0951-8320(01)00014-X
52. Sattar MA, Cheung KK (2019) Tropical cyclone risk perception and risk reduction analysis for coastalBangladesh: Household and expert perspectives. International Journal of Disaster Risk Reduction41:101283
53. Shah AA, Ye J, Abid M, Ullah R (2017) Determinants of �ood risk mitigation strategies at householdlevel: a case of Khyber Pakhtunkhwa (KP) province, Pakistan. Natural hazards 88(1):415–430
54. Sjöberg L (2000) Factors in risk perception, Risk Anal 20 (1), 1–12, http://dx.doi. org/10.1111/0272-4332.00001
55. Ullah W, Nihei Y, Nafees M, Zaman A, Ali M (2018) Understanding climate change vulnerability,adaptation and risk perceptions at household level in Khyber Pakhtunkhwa,Pakistan. Int J ClimChange Strateg Manag 10(3):359–378. DOI:10.1108/IJCCSM-02-2017-0038
5�. Wachinger G, Renn O, Begg C, Kuhlicke C (2013) The risk perception paradox—implications forgovernance and communication of natural hazards. Risk analysis 33(6):1049–1065
57. Wang Z, Wang H, Huang J, Kang J, Han D (2018) Analysis of the public �ood risk perception in a �ood-prone city: The case of Jingdezhen city in China. Water 10(11):1577
5�. Www.thedailystar.net (2021)
59. Zhang F, Chen Y, Zhang J, Guo E, Wang R, Li D (2019) Dynamic drought risk assessment for maizebased on crop simulation model and multi-source drought indices. Journal of cleaner production, 233,100–114. Tingsanchali, T. (2012). Urban �ood disaster management. Procedia engineering, 32, 25–37
�0. Salam R, Ghose B, Shill BK, Islam MA, Islam ARMT, Sattar MA, … Ahmed B (2021) Perceived and actualrisks of drought: household and expert views from the lower Teesta River Basin of northernBangladesh. Natural Hazards, 1–19
Supplementary TablesSupplemental tables are not available with this version.
Figures

Page 20/24
Figure 1
Location map showing the study area

Page 21/24
Figure 2
Respondent’s degree of perception about drought, earthquake, and �ood

Page 22/24
Figure 3
Perception of drought based on gender

Page 23/24
Figure 4
Perception of earthquake based on gender

Page 24/24
Figure 5
Perception of �ood based on gender