Embed Size (px)
Citation preview
econstorMake Your Publications Visible.
A Service of
zbwLeibniz-InformationszentrumWirtschaftLeibniz Information Centrefor Economics
Aldaba, Rafaelita M.
Working Paper
Twenty Years after Philippine Trade Liberalizationand Industrialization: What Has Happened andWhere Do We Go from Here
PIDS Discussion Paper Series, No. 2013-21
Provided in Cooperation with:Philippine Institute for Development Studies (PIDS), Philippines
Suggested Citation: Aldaba, Rafaelita M. (2013) : Twenty Years after Philippine TradeLiberalization and Industrialization: What Has Happened and Where Do We Go from Here,PIDS Discussion Paper Series, No. 2013-21, Philippine Institute for Development Studies(PIDS), Makati City
This Version is available at:http://hdl.handle.net/10419/126923
Standard-Nutzungsbedingungen:
Die Dokumente auf EconStor dürfen zu eigenen wissenschaftlichenZwecken und zum Privatgebrauch gespeichert und kopiert werden.
Sie dürfen die Dokumente nicht für öffentliche oder kommerzielleZwecke vervielfältigen, öffentlich ausstellen, öffentlich zugänglichmachen, vertreiben oder anderweitig nutzen.
Sofern die Verfasser die Dokumente unter Open-Content-Lizenzen(insbesondere CC-Lizenzen) zur Verfügung gestellt haben sollten,gelten abweichend von diesen Nutzungsbedingungen die in der dortgenannten Lizenz gewährten Nutzungsrechte.
Terms of use:
Documents in EconStor may be saved and copied for yourpersonal and scholarly purposes.
You are not to copy documents for public or commercialpurposes, to exhibit the documents publicly, to make thempublicly available on the internet, or to distribute or otherwiseuse the documents in public.
If the documents have been made available under an OpenContent Licence (especially Creative Commons Licences), youmay exercise further usage rights as specified in the indicatedlicence.
www.econstor.eu
For comments, suggestions or further inquiries please contact:
Philippine Institute for Development StudiesSurian sa mga Pag-aaral Pangkaunlaran ng Pilipinas
The PIDS Discussion Paper Seriesconstitutes studies that are preliminary andsubject to further revisions. They are be-ing circulated in a limited number of cop-ies only for purposes of soliciting com-ments and suggestions for further refine-ments. The studies under the Series areunedited and unreviewed.
The views and opinions expressedare those of the author(s) and do not neces-sarily reflect those of the Institute.
Not for quotation without permissionfrom the author(s) and the Institute.
The Research Information Staff, Philippine Institute for Development Studies5th Floor, NEDA sa Makati Building, 106 Amorsolo Street, Legaspi Village, Makati City, PhilippinesTel Nos: (63-2) 8942584 and 8935705; Fax No: (63-2) 8939589; E-mail: [email protected]
Or visit our website at http://www.pids.gov.ph
March 2013
DISCUSSION PAPER SERIES NO. 2013-21
Rafaelita M. Aldaba
Twenty Years after Philippine TradeLiberalization and Industrialization: What HasHappened and Where Do We Go from Here
1
EXECUTIVE SUMMARY
The paper aims to review our trade liberalization policy and its contribution to the
country’s industrial growth and performance. After more than twenty years of liberalization,
the overall performance of the manufacturing industry has been weak, growth has been slow
and contribution to value added and employment has been limited. Total factor productivity
growth declined from 1996 to 2006. The industrial structure has remained “hollow” or
“missing” in the middle and medium enterprises have never seriously challenged the large
entrenched incumbents. The linkages between SMEs and large enterprises have also remained
limited. SMEs have continued to face competitiveness problems along with difficulties in
finance and market access. Trade indicators show the heavy concentration of Philippine
exports on three major products groups: electronics, garments and textiles and auto parts.
Within these major product groups, exports are highly concentrated in low value added and
labor-intensive products sectors.
Our experience has shown that trade liberalization does not automatically lead to a
competitive domestic market economy. Imports are effective in disciplining domestic
manufacturing firms. However, to sustain the competitive gains derived from the presence of
imports, the government has an important role to play particularly in creating and maintaining
a competitive environment. The government needs to coordinate policies to implement
continued liberalization in tandem with necessary support measures that will address the
obstacles to the entry, exit and growth of domestic firms, particularly small and medium
enterprises.
Moreover, to effectively benefit from trade reforms, the government should
substantially increase investment spending and strengthen its weak institutional and
regulatory environment. If market reforms are to have their intended effects, “behind the
border” complementary policies that define the business environment must be addressed
including investment in human capital, infrastructure, the quality of governance in the
country, improve the investment climate, and boost the country’s competitiveness to enable
us to catch up with our neighbors.
For the manufacturing industry, there is a need to strengthen the domestic parts and
suppliers sector, particularly small and medium enterprises, and deepen their linkage with
domestic large enterprises and multinational companies. Equally important is for
manufacturing industries particularly electronics to move up the value chain and diversify the
export base. Hence, there is a need for strategic industrial policy and carefully designed
subsidies that would target improvement of firm level competitiveness such as innovation and
research and development activities and human resource development.
Key Words: Philippine manufacturing, trade liberalization, strategic industrial policy
2
TWENTY YEARS AFTER PHILIPPINE TRADE LIBERALIZATION AND INDUSTRIALIZATION : WHAT HAS HAPPENED AND
WHERE DO WE GO FROM HERE
Rafaelita M. Aldaba1
I. Introduction
In its quest for industrialization, the postwar Philippine economy adopted a complex
array of protective policies, investment incentive measures, and regulatory controls (see Table
1). Being one of the most favored industries by policy makers, the manufacturing sector
received heavy protection through high tariffs, quantitative restrictions and regulatory policies
that effectively controlled prices, domestic supply, and market entry. However, after more
than three decades of protectionism and import substitution, the policies failed to provide an
efficient mechanism for allocating domestic resources in the economy. It left a legacy that
implied not only high levels of industrial concentration that sheltered domestic markets and
concentration of economic wealth among a small number of families and groups but also the
lack of a culture of competition in the country.
Beginning in the early 1980s, the Philippine government was prompted to implement
policy reforms consistent with the requirements of a competitive market environment. To
increase competition, the trade regime was liberalized by removing tariffs and non-tariff
barriers. This was accompanied by privatization and deregulation policies that changed the set
of rules governing economic activities in the country. Reforms were initiated not only in the
financial sector but also in utilities covering telecommunications, power, water, air transport,
and shipping. Investment liberalization was also pursued by allowing foreign investment in
sectors that were not specified in the Negative List. A new Omnibus Investment Code was
legislated to simplify the investment incentive system. All these reforms were aimed at
removing barriers to competition and promoting factor mobility and firm growth to secure
both high and sustained economic growth and rapid poverty alleviation.
The trade reforms from the eighties till the early nineties were pursued on a unilateral
basis. Towards the mid-1990s, the tariffication and removal of import restrictions on
agricultural products was achieved through the General Agreement on Tariffs and Trade-
World Trade Organization (GATT-WTO). The latter was ratified by the Philippine Senate in
1994. In more recent years, however, the uncertainty in the successful conclusion of the
World Trade Organization (WTO)’s multilateral trade negotiations has led to a new wave of
1 Research Fellow, Philippine Institute for Development Studies. The author is grateful for the excellent research assistance of Mr. Donald Yasay and Ms. Jocelyn Almeda. A preliminary version of this paper was presented at the “Trade and Industry Development (TID) Talks” in January 2012, Board of Investments, Makati City and at the GEP Workshop held on October 14, 2010 at the University of Nottingham Malaysia Campus.
3
regionalism through the surge in free trade agreements. Since 2004, no major unilateral tariff
changes have been made; mostly the tariff reductions carried out were those covered by the
ASEAN Free Trade Area-Common Effective Preferential Tariff (AFTA-CEPT) scheme. The
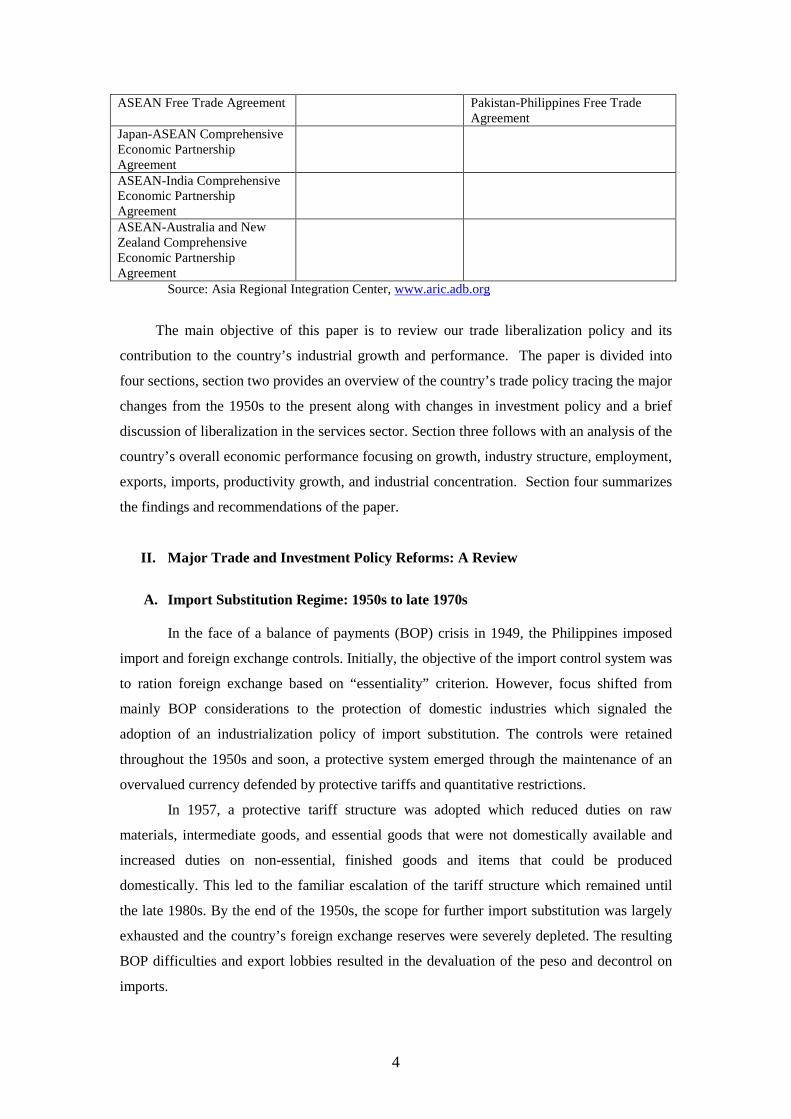
Philippines has been active in participating in free trade agreements. Table 2 presents a list of
concluded, under negotiation, and proposed free trade agreements (FTAs) of the Philippines.
Currently, the country has a total of 12 FTAs, seven are concluded (Japan-Philippines,
ASEAN-Korea, ASEAN-China, AFTA, ASEAN-Australia and New Zealand, ASEAN-India
and ASEAN-Japan), one is under negotiation (ASEAN-EU) and four are proposed.
Table 1: Major Trade and Investment Policies
Time Line Policy Regime Policy Description 1950s-1970s Import Substitution Phase
Restrictive Investment Policy
-Protectionist measures such as high tariffs, import quotas & other non-tariff barriers -Restricted foreign ownership to 40% in non-pioneer industries; 100% eligibility for foreign investment subject to Board of Investments’ approval -Complicated investment incentive system
1980s-1990s Unilateral Trade Liberalization Period Investment Liberalization Multilateral/Regional Trade Liberalization
-Trade Reform Program (TRP) I: reduced tariff range from 70-100% to 0-50% -TRP II: reduced tariff range to 3-30% -TRP III: further tariff changes towards a 5% uniform tariff -1987 Omnibus Investment Code (Board of Investments) -1991 Foreign Investment Act -Creation of Philippine Economic Zone Authority (1995), Subic Bay Metropolitan Authority (1992), & Clark Development Corporation (1993) -GATT-WTO (1995) -AFTA-CEPT (1993)
2000s Trade Facilitation Regionalism/Bilateralism through Free Trade Agreements
-Customs reforms (since mid-1990s) -Revised Kyoto Convention (2009) -National Single Window (2010) -China-ASEAN (2004); ASEAN-Japan (2008); ASEAN-Korea (2006); ASEAN-Australia New Zealand; ASEAN-India -Japan Philippines Economic Partnership Agreement (2007) -ASEAN+3, ASEAN+6 Talks
Table 2: Philippine Free Trade Agreements Concluded Under Negotiation Proposed Japan-Philippines Economic Partnership Agreement
ASEAN-EU Free Trade Agreement
East Asian (ASEAN+3) Free Trade Agreement
ASEAN-Korea Comprehensive Economic Partnership Agreement
Comprehensive Economic Partnership for East Asian (ASEAN+6)
ASEAN-China Comprehensive Economic Partnership Agreement
United States-Philippines Free Trade Agreement
4
ASEAN Free Trade Agreement Pakistan-Philippines Free Trade Agreement
Japan-ASEAN Comprehensive Economic Partnership Agreement
ASEAN-India Comprehensive Economic Partnership Agreement
ASEAN-Australia and New Zealand Comprehensive Economic Partnership Agreement
Source: Asia Regional Integration Center, www.aric.adb.org
The main objective of this paper is to review our trade liberalization policy and its
contribution to the country’s industrial growth and performance. The paper is divided into
four sections, section two provides an overview of the country’s trade policy tracing the major
changes from the 1950s to the present along with changes in investment policy and a brief
discussion of liberalization in the services sector. Section three follows with an analysis of the
country’s overall economic performance focusing on growth, industry structure, employment,
exports, imports, productivity growth, and industrial concentration. Section four summarizes
the findings and recommendations of the paper.
II. Major Trade and Investment Policy Reforms: A Review
A. Import Substitution Regime: 1950s to late 1970s
In the face of a balance of payments (BOP) crisis in 1949, the Philippines imposed
import and foreign exchange controls. Initially, the objective of the import control system was
to ration foreign exchange based on “essentiality” criterion. However, focus shifted from
mainly BOP considerations to the protection of domestic industries which signaled the
adoption of an industrialization policy of import substitution. The controls were retained
throughout the 1950s and soon, a protective system emerged through the maintenance of an
overvalued currency defended by protective tariffs and quantitative restrictions.
In 1957, a protective tariff structure was adopted which reduced duties on raw
materials, intermediate goods, and essential goods that were not domestically available and
increased duties on non-essential, finished goods and items that could be produced
domestically. This led to the familiar escalation of the tariff structure which remained until
the late 1980s. By the end of the 1950s, the scope for further import substitution was largely
exhausted and the country’s foreign exchange reserves were severely depleted. The resulting
BOP difficulties and export lobbies resulted in the devaluation of the peso and decontrol on
imports.
5
The import decontrol program had initial strong positive effect on the BOP from 1960
to 1962; however, the rapid rise in imports and declines in the country’s terms of trade led to
another large BOP deficits towards the end of the 1960s. Eventually, the BOP crisis led to the
floating of the peso in 1970. Import controls on consumer goods were restored which resulted
in a tremendous increase in import restrictions imposed during this period. In the beginning of
the 1970s, there were 1,307 product lines that were covered by import restrictions. By the end
of the decade, this rose to 1,820 product lines that were subject to import bans, import quotas,
and import licenses.
Combined with high tariffs, the system of import controls created a highly protective
and restrictive trade structure. Apart from these protectionist measures; various fiscal,
administrative and regulatory policies were introduced to support and promote domestic
industries. These included the granting of fiscal incentives like accelerated depreciation, net
operating loss carry-over, tax exemption on imported capital equipment, tax credit on
domestic capital equipment, tax credit for withholding tax on interest, exemption from all
revenue taxes except income tax, and targeted lending by the Development Bank of the
Philippines along with the imposition of regulations and controls on entry in “crowded
industries”. While these instruments promoted and stimulated investments in the early stages
of industrialization, over time they came to impose barriers to resource mobility and
encouraged rent-seeking behavior.
In evaluating the import substitution policy experience of the manufacturing industry in
the late seventies; Bautista, Power and Associates (1979) concluded that the protectionist
policies pursued by the country since the 1950s failed to provide an efficient mechanism for
allocating domestic resources in the economy. At the end of the 1970s, the restrictive trade
regime created unintended effects that were characterized by three major biases: (i) it led to
an import-dependent import substituting policy that discouraged backward linkages and
encouraged the use of artificially cheap imported inputs; (ii) it penalized exports; and (iii) it
artificially cheapened capital which promoted greater capital intensity among domestic
industries (Medalla 2002).
B. Major Trade Policy Reforms in Manufacturing: Early 1980s to Present
Since the early 1980s, the Philippines has liberalized its trade policy by reducing tariff
rates and removing import quantitative restrictions (see Table 3). The first tariff reform
program (TRP 1) initiated in 1981 substantially reduced the average nominal tariff and the
high rate of effective protection that characterized the Philippine industrial structure. TRP I
also reduced the number of regulated products with the removal of import restrictions on
1,332 lines between 1986 and 1989.
The second phase of the tariff reform program (TRP II) was launched in 1991. TRP II
6
introduced a new tariff code that further narrowed down the tariff range with the majority of
tariff lines falling within the three to 30 percent tariff range. It also allowed the tariffication
of quantitative restrictions for 153 agricultural products and tariff realignment for 48
commodities. With the country’s ratification of the World Trade Organization (WTO) in
1994, the government committed to remove import restrictions on sensitive agricultural
products except rice and replace these with high tariffs.
The government initiated another round of tariff reform (TRP III) in 1995 as a first
major step in its plan to adopt a uniform five percent tariff by 2005. This further narrowed
down the tariff range for industrial products to within three and ten percent range and reduced
the ceiling rate on manufactured goods to 30 percent while the floor remained at three
percent. It also created a four-tier tariff structure: three percent for raw materials and capital
equipment which were not locally available, 10 percent for raw materials and capital
equipment which were locally available, 20 percent for intermediate goods, and 30 percent for
finished goods.
Table 3: Major Episodes of Trade Policy Reform in the Philippines Year Trade Reform Description
1980 Tariff Reform Program I EO 609 and EO 632-A (January 1981)
TRP 1 reduced the level and dispersion of tariff rates from a range of zero to 100 percent in 1980 to a range of 10 percent to 50 percent and removed quantitative restrictions beginning in 1981 and ending in 1985
1990 EO 413 (July 1990) EO 413 aimed to simplify the tariff structure by reducing the number of rates to four, ranging from 3 percent to 30 percent over a period of one year, but was not implemented.
1991 Tariff Reform Program II EO 470 (July 1991)
TRP II reduced the tariff range to within a three percent to 30 percent tariff range by 1995
1992 EO 8 EO 8 tariffied quantitative restrictions for 153 agricultural products and tariff realignment for 48 commodities
1995 Tariff Reform Program III EO 264 (August 1995) EO 288 (December 1995)
EO 264 further reduced the tariff range to three percent and ten percent levels, reduced the ceiling rate on manufacture goods to 30 percent while the floor remained at three percent, and created a four-tier tariff schedule: three percent for raw materials, 10 percent for locally available raw materials and capital equipment, 20 percent for intermediate goods, and 30 percent for finished goods EO 288modified the nomenclature and import duties on non-sensitive agricultural products
1996 EO 313 (March 1996) RA 8178
EO 313 modified the nomenclature and increased the tariff rates on sensitive agricultural products
RA 8178 lifted the quantitative restrictions on three products and defined minimum access volume for these products
1998
EO 465 (January 1998) EO 486 (June 1998)
EO 465 corrected remaining distortions in the tariff structure and smoothened the schedule of tariff reduction in 23 industries identified as export winners EO 486 modified the rates on items not covered by EO 465
1999 EO 63 (January 1999)
EO 63 adjusted the tariff rates on six industries Freezing of tariff rates at 2000 level until 2001
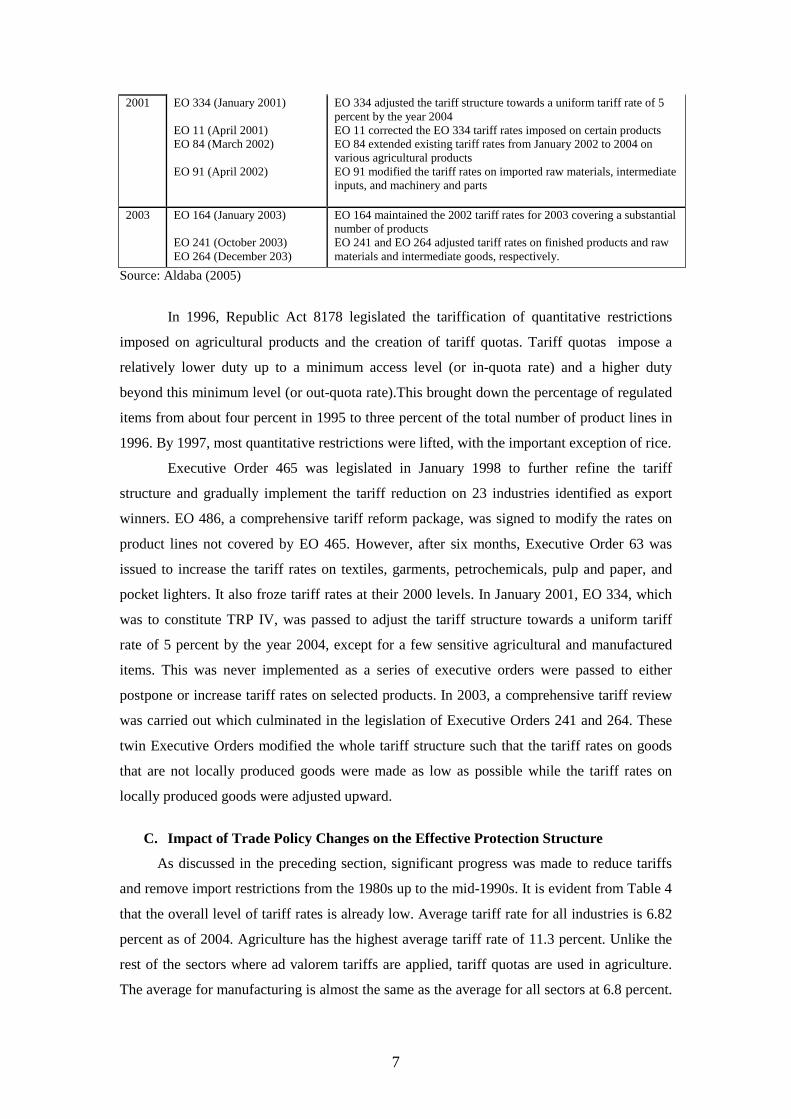
7
2001 EO 334 (January 2001) EO 11 (April 2001) EO 84 (March 2002) EO 91 (April 2002)
EO 334 adjusted the tariff structure towards a uniform tariff rate of 5 percent by the year 2004 EO 11 corrected the EO 334 tariff rates imposed on certain products EO 84 extended existing tariff rates from January 2002 to 2004 on various agricultural products EO 91 modified the tariff rates on imported raw materials, intermediate inputs, and machinery and parts
2003 EO 164 (January 2003) EO 241 (October 2003) EO 264 (December 203)
EO 164 maintained the 2002 tariff rates for 2003 covering a substantial number of products EO 241 and EO 264 adjusted tariff rates on finished products and raw materials and intermediate goods, respectively.
Source: Aldaba (2005)
In 1996, Republic Act 8178 legislated the tariffication of quantitative restrictions
imposed on agricultural products and the creation of tariff quotas. Tariff quotas impose a
relatively lower duty up to a minimum access level (or in-quota rate) and a higher duty
beyond this minimum level (or out-quota rate).This brought down the percentage of regulated
items from about four percent in 1995 to three percent of the total number of product lines in
1996. By 1997, most quantitative restrictions were lifted, with the important exception of rice.
Executive Order 465 was legislated in January 1998 to further refine the tariff
structure and gradually implement the tariff reduction on 23 industries identified as export
winners. EO 486, a comprehensive tariff reform package, was signed to modify the rates on
product lines not covered by EO 465. However, after six months, Executive Order 63 was
issued to increase the tariff rates on textiles, garments, petrochemicals, pulp and paper, and
pocket lighters. It also froze tariff rates at their 2000 levels. In January 2001, EO 334, which
was to constitute TRP IV, was passed to adjust the tariff structure towards a uniform tariff
rate of 5 percent by the year 2004, except for a few sensitive agricultural and manufactured
items. This was never implemented as a series of executive orders were passed to either
postpone or increase tariff rates on selected products. In 2003, a comprehensive tariff review
was carried out which culminated in the legislation of Executive Orders 241 and 264. These
twin Executive Orders modified the whole tariff structure such that the tariff rates on goods
that are not locally produced goods were made as low as possible while the tariff rates on
locally produced goods were adjusted upward.
C. Impact of Trade Policy Changes on the Effective Protection Structure
As discussed in the preceding section, significant progress was made to reduce tariffs
and remove import restrictions from the 1980s up to the mid-1990s. It is evident from Table 4
that the overall level of tariff rates is already low. Average tariff rate for all industries is 6.82
percent as of 2004. Agriculture has the highest average tariff rate of 11.3 percent. Unlike the
rest of the sectors where ad valorem tariffs are applied, tariff quotas are used in agriculture.
The average for manufacturing is almost the same as the average for all sectors at 6.8 percent.
8
Fishing and forestry has an average rate of six percent while mining and quarrying is the
lowest at 2.5 percent.
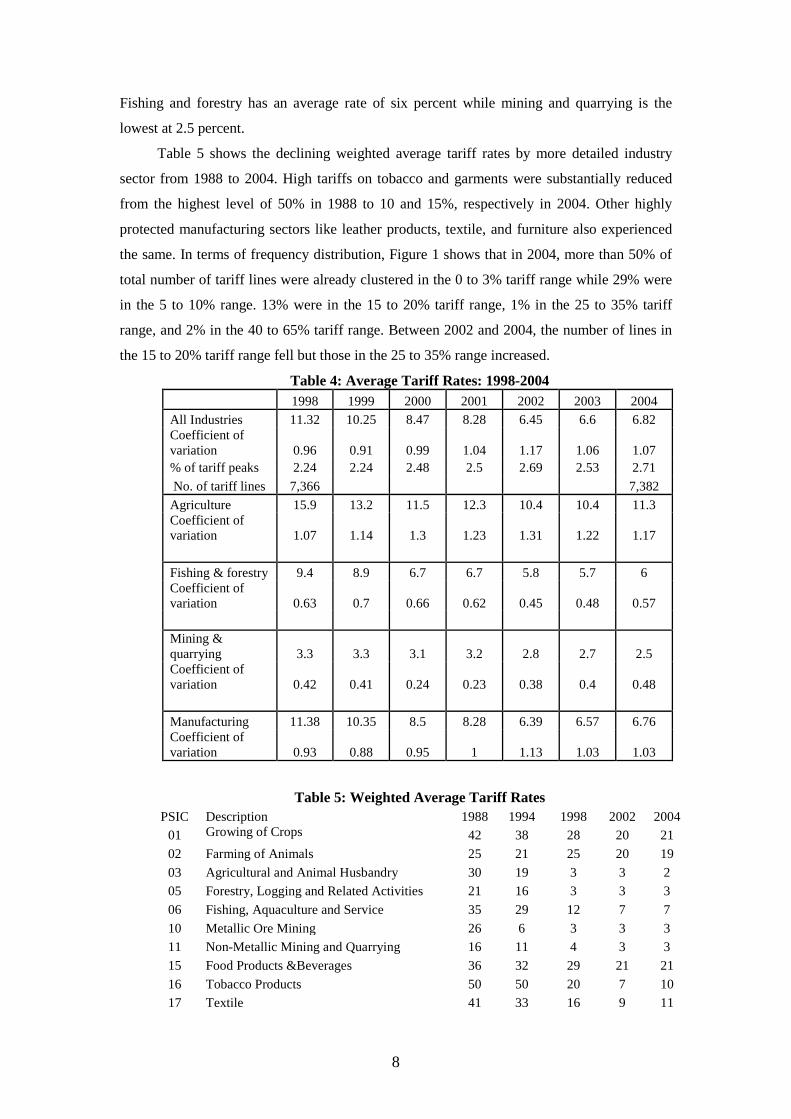
Table 5 shows the declining weighted average tariff rates by more detailed industry
sector from 1988 to 2004. High tariffs on tobacco and garments were substantially reduced
from the highest level of 50% in 1988 to 10 and 15%, respectively in 2004. Other highly
protected manufacturing sectors like leather products, textile, and furniture also experienced
the same. In terms of frequency distribution, Figure 1 shows that in 2004, more than 50% of
total number of tariff lines were already clustered in the 0 to 3% tariff range while 29% were
in the 5 to 10% range. 13% were in the 15 to 20% tariff range, 1% in the 25 to 35% tariff
range, and 2% in the 40 to 65% tariff range. Between 2002 and 2004, the number of lines in
the 15 to 20% tariff range fell but those in the 25 to 35% range increased.
Table 4: Average Tariff Rates: 1998-2004 1998 1999 2000 2001 2002 2003 2004 All Industries 11.32 10.25 8.47 8.28 6.45 6.6 6.82 Coefficient of variation 0.96 0.91 0.99 1.04 1.17 1.06 1.07 % of tariff peaks 2.24 2.24 2.48 2.5 2.69 2.53 2.71 No. of tariff lines 7,366 7,382 Agriculture 15.9 13.2 11.5 12.3 10.4 10.4 11.3 Coefficient of variation 1.07 1.14 1.3 1.23 1.31 1.22 1.17 Fishing & forestry 9.4 8.9 6.7 6.7 5.8 5.7 6 Coefficient of variation 0.63 0.7 0.66 0.62 0.45 0.48 0.57 Mining & quarrying 3.3 3.3 3.1 3.2 2.8 2.7 2.5 Coefficient of variation 0.42 0.41 0.24 0.23 0.38 0.4 0.48 Manufacturing 11.38 10.35 8.5 8.28 6.39 6.57 6.76 Coefficient of variation 0.93 0.88 0.95 1 1.13 1.03 1.03
Table 5: Weighted Average Tariff Rates PSIC Description 1988 1994 1998 2002 2004
01 Growing of Crops 42 38 28 20 21 02 Farming of Animals 25 21 25 20 19 03 Agricultural and Animal Husbandry 30 19 3 3 2 05 Forestry, Logging and Related Activities 21 16 3 3 3 06 Fishing, Aquaculture and Service 35 29 12 7 7 10 Metallic Ore Mining 26 6 3 3 3 11 Non-Metallic Mining and Quarrying 16 11 4 3 3 15 Food Products &Beverages 36 32 29 21 21 16 Tobacco Products 50 50 20 7 10 17 Textile 41 33 16 9 11
9
18 Wearing Apparel 50 50 25 15 15 19 Leather, Luggage, Handbags and Footwear 46 44 19 8 11 20 Wood, Wood Products & Cork 36 27 15 7 8 21 Paper and Paper Products 33 23 13 6 5
22 Publishing, Printing and Reproduction of Recorded Media 23 18 17 7 6
23 Coke, Refined Petroleum & other Fuel 16 11 4 3 3 24 Chemicals and Chemical Products 27 19 8 4 5 25 Rubber and Plastic Products 37 29 14 8 9 26 Other Non-Metallic Mineral products 37 23 12 5 7 27 Basic Metals 20 16 8 4 4
28 Fabricated Metal Products, Except Machinery and Equipment 31 26 13 7 7
29 Machinery and Equipment, n.e.c. 23 13 5 2 2 31 Electrical Machinery and Apparatus, n.e.c. 31 19 8 4 4
33 Medical, Precision and Optical Instruments, Watches and Clocks 23 18 6 3 3
34 Motor Vehicles, Trailers and Semi-Trailers 34 25 17 12 12 36 Furniture 47 33 21 12 13 37 Manufacturing ,n.e.c. 37 26 11 5 6
Note, however, that lower level of tariff rates does not always imply that the tariff
schedule is less distorting. The economic and trade distortions associated with the tariff
structure depend not only on the size of tariffs but also on the dispersion of these tariffs across
all products. In general, the more dispersion in a country’s tariff schedule, the greater the
distortions caused by tariffs on production and consumption patterns. Common measures of
dispersion used are percentage of tariff peaks and coefficient of variation. Tariff peaks are
represented by the proportion of products with tariffs exceeding three times the mean tariff
while the coefficient of variation is the ratio of the standard deviation to the mean.
Figure 1: Frequency Distribution of Tariff Rates
-
500
1,000
1,500
2,000
2,500
3,000
3,500
0 to 3 5 to 10 15 to 20 25 to 35 40 to 65 80
1998
2000
2002
2004
10
As Table 4 shows, while the average tariff rate for all industries dropped from 11.32
percent in 1998 to 6.82 percent in 2004, tariff dispersion widened as the coefficient of
variation went up from 0.96 to 1.07. The ad valorem tariffs for mining and quarrying as well
as those for fishing and forestry show the most uniformity while those for agriculture and
manufacturing exhibit the most dispersion. Growing of crops (21%) and farming of animals
(19%) along with food manufacturing (21%) have the highest weighted average tariffs (see
Table 5). The first two sectors are inputs to food manufacturing. Meanwhile, electrical and
non-electrical machinery have the lowest average tariff rates ranging from 2 to 4%.
Table 4 also indicates an increase in the percentage of tariff peaks (tariffs that are
greater than three times the mean tariff) from 2.24 in 1998 to 2.71 in 2004. The sectors with
tariff peaks consisted mostly of agricultural products with in- and out- quota rates. The sectors
with tariff peaks consisted of sugarcane, sugar milling and refining, palay, corn, rice and corn
milling, vegetables like onions, garlic, and cabbage, roots and tubers, hog, cattle and other
livestock, chicken, other poultry and poultry products, slaughtering and meat packing, coffee
roasting and processing, meat and meat processing, canning and preserving fruits and
vegetables, manufacture of starch and starch products, manufacture of bakery products
excluding noodles, manufacture of animal feeds, miscellaneous food products, manufacture of
drugs and medicines, manufacture of chemical products, and manufacture and assembly of
motor vehicles.
Figure 2: Effective Protection Rates (1985-2004)
Sources: Medalla, E.M. (1990), Tan, E. (1995), Manasan , R. and V. Pineda (1999), and Aldaba, R. (2005).
0
10
20
30
40
50
60
70
80
1985
1986
1988
1990
1991
1992
1993
1994
1995
1996
1997
1998
1999
2000
2001
2002
2003
2004
All Sectors
Agriculture
Manufacturing
Food Processing
11
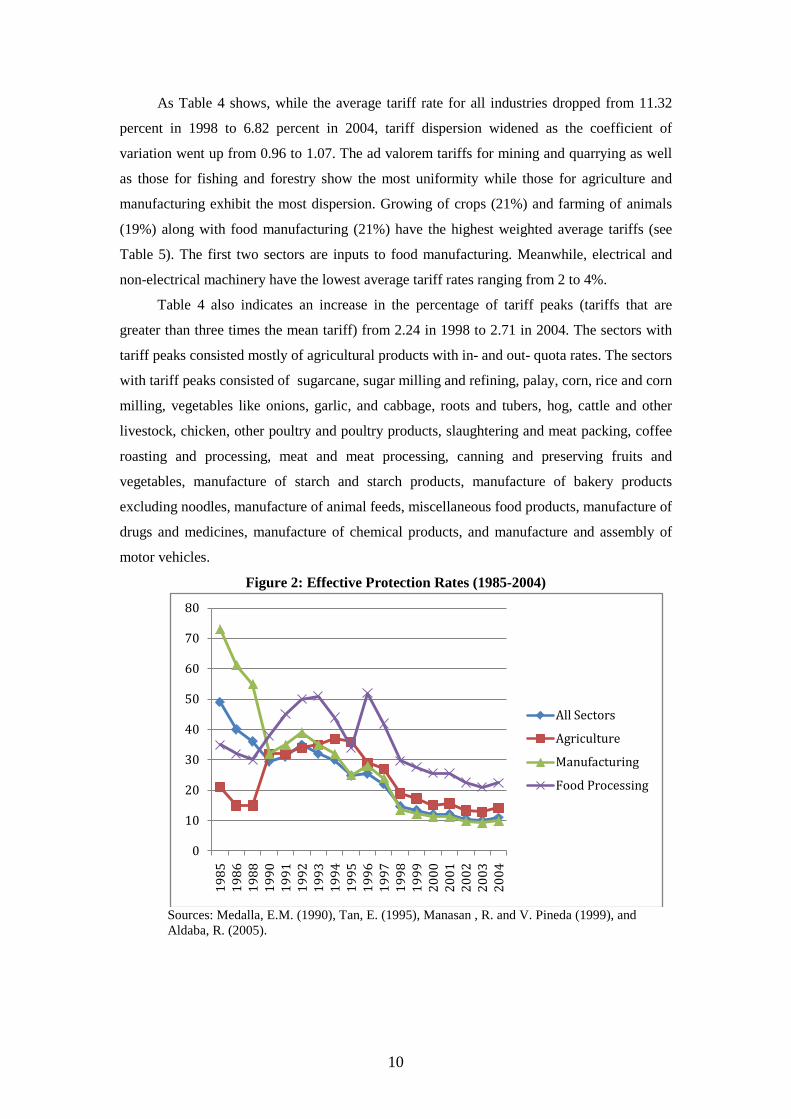
Compared to tariff rates, effective protection rates (EPRs)2 provide a more meaningful
indicator of the impact of the system of protection. EPRs measure the net protection received
by domestic producers from the protection of their outputs and the penalty from the protection
of their inputs. Figure 2 shows that average effective protection rates for all sectors declined
from 49% in 1985 to 36% in 1988. In 1995, this further dropped to around 25% and to 15% in
1998 and to 10.9% in 2004.
Note that while the average effective protection rates for all sectors declined,
substantial differences in average protection across sectors still prevail. With the tariffication
of quantitative restrictions in agricultural products in 1996, a shift in relative protection
occurred which resulted in higher protection for the agriculture sector relative to the
manufacturing industry. Though the two sectors had almost the same EPR in 1993, in
succeeding years, the agriculture sector received much higher protection than the
manufacturing sector. In 1995, agriculture had an EPR of 36 percent while manufacturing had
25 percent. This gap was narrowed in 1997 as agriculture EPR dropped to 27 percent while
manufacturing EPR was 24 percent. Within manufacturing, wide disparities in effective
protection have also been present. Food processing has remained the most highly protected
sub-sector over the last twenty years.
Table 6: Average Effective Protection Rate
1998 1999 2000 2001 2002 2003 2004 All Sectors 14.75 13.41 12.13 12.18 10.55 10.11 10.88 Importable 25.64 23.45 21.21 21.11 18.82 18.05 19.09 Exportable 3.45 2.99 2.72 2.92 1.98 1.88 2.36 CV 2.82 2.91 3.21 2.19 2.13 2.23 2.27 Agriculture, Fishing, & Forestry 18.98 17.29 15.12 15.63 13.38 12.86 14.15 Importable 22.67 20.35 19.01 19.48 17.97 17.26 18.09 Exportable 15.36 14.29 11.31 11.85 8.89 8.55 10.30 CV 0.75 0.71 0.77 0.83 0.88 0.82 0.77 Mining 2.52 2.60 2.65 2.67 2.41 2.36 2.28 Importable 3.86 3.80 3.44 3.33 2.77 2.71 2.57 Exportable 2.01 2.15 2.35 2.42 2.28 2.23 2.17 CV 0.79 0.76 0.68 0.66 0.68 0.69 0.69 Manufacturing 13.61 12.34 11.37 11.23 9.79 9.36 9.96 Importable 27.30 25.10 22.48 22.17 19.53 18.72 19.87 Exportable -1.57 -1.81 -0.96 -0.89 -1.02 -1.02 -1.04 CV 3.27 3.40 3.68 2.54 2.45 2.58 2.64 Source: Manasan, R. &V.Pineda (1999), Aldaba (2005). Note: CV or coefficient of variation is the ratio of the standard deviation to the mean.
2 EPRs are rates of protection of value added, are more meaningful than actual tariff rates and implicit tariff rates (representing excess of domestic price of a product over its international price) since it is value added rather than the value of the product that is contributed by the domestic activity being protected.
12
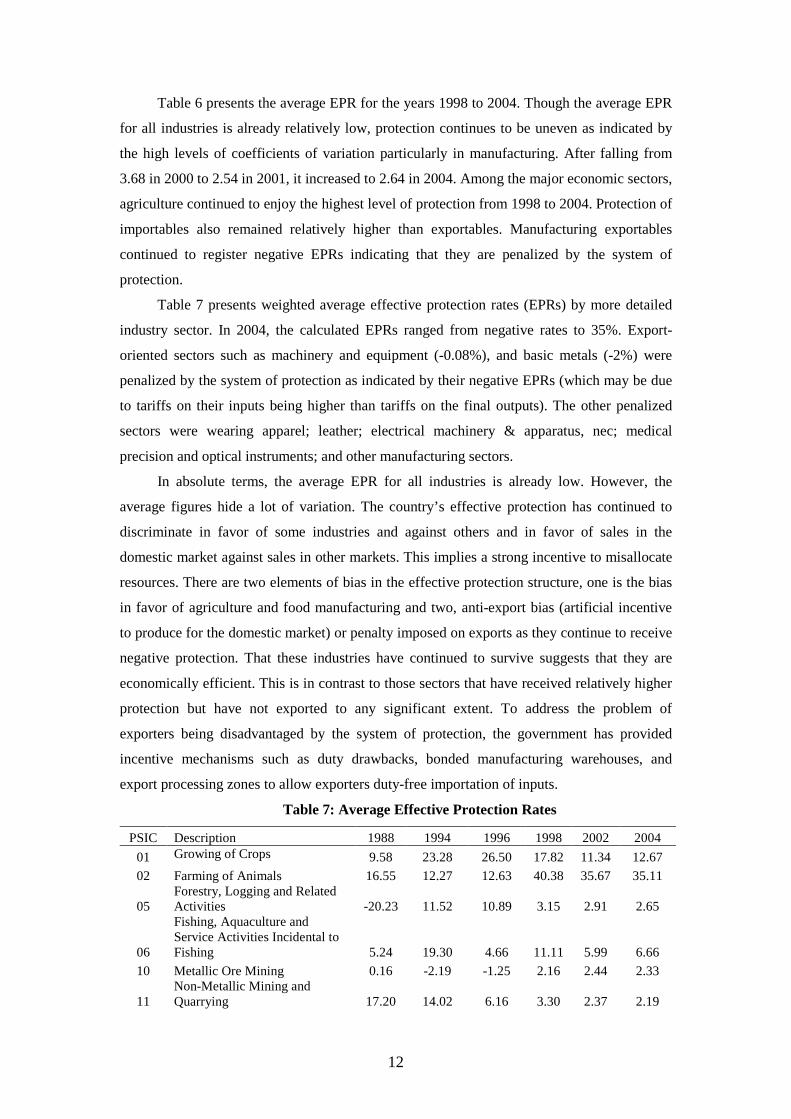
Table 6 presents the average EPR for the years 1998 to 2004. Though the average EPR
for all industries is already relatively low, protection continues to be uneven as indicated by
the high levels of coefficients of variation particularly in manufacturing. After falling from
3.68 in 2000 to 2.54 in 2001, it increased to 2.64 in 2004. Among the major economic sectors,
agriculture continued to enjoy the highest level of protection from 1998 to 2004. Protection of
importables also remained relatively higher than exportables. Manufacturing exportables
continued to register negative EPRs indicating that they are penalized by the system of
protection.
Table 7 presents weighted average effective protection rates (EPRs) by more detailed
industry sector. In 2004, the calculated EPRs ranged from negative rates to 35%. Export-
oriented sectors such as machinery and equipment (-0.08%), and basic metals (-2%) were
penalized by the system of protection as indicated by their negative EPRs (which may be due
to tariffs on their inputs being higher than tariffs on the final outputs). The other penalized
sectors were wearing apparel; leather; electrical machinery & apparatus, nec; medical
precision and optical instruments; and other manufacturing sectors.
In absolute terms, the average EPR for all industries is already low. However, the
average figures hide a lot of variation. The country’s effective protection has continued to
discriminate in favor of some industries and against others and in favor of sales in the
domestic market against sales in other markets. This implies a strong incentive to misallocate
resources. There are two elements of bias in the effective protection structure, one is the bias
in favor of agriculture and food manufacturing and two, anti-export bias (artificial incentive
to produce for the domestic market) or penalty imposed on exports as they continue to receive
negative protection. That these industries have continued to survive suggests that they are
economically efficient. This is in contrast to those sectors that have received relatively higher
protection but have not exported to any significant extent. To address the problem of
exporters being disadvantaged by the system of protection, the government has provided
incentive mechanisms such as duty drawbacks, bonded manufacturing warehouses, and
export processing zones to allow exporters duty-free importation of inputs.
Table 7: Average Effective Protection Rates
PSIC Description 1988 1994 1996 1998 2002 2004 01 Growing of Crops 9.58 23.28 26.50 17.82 11.34 12.67 02 Farming of Animals 16.55 12.27 12.63 40.38 35.67 35.11
05 Forestry, Logging and Related Activities -20.23 11.52 10.89 3.15 2.91 2.65
06
Fishing, Aquaculture and Service Activities Incidental to Fishing 5.24 19.30 4.66 11.11 5.99 6.66
10 Metallic Ore Mining 0.16 -2.19 -1.25 2.16 2.44 2.33
11 Non-Metallic Mining and Quarrying 17.20 14.02 6.16 3.30 2.37 2.19
13
15 Manufacture of Food Products and Beverages 27.90 37.25 42.37 29.70 22.54 22.49
16 Manufacture of Tobacco Products 61.12 52.68 31.00 20.02 6.57 11.21
17 Manufacture of Textile 44.24 18.72 11.80 12.07 6.67 7.70
18 Manufacture of Wearing Apparel 0.00 24.17 14.41 -3.84 -1.80 -2.44
19
Tanning and Dressing of Leather; Manufacture of Luggage, Handbags and Footwear 0.77 22.09 13.19 -0.72 -0.85 -0.47
20
Manufacture of Wood, Wood Products and Cork, Except Furniture; Manufacture of 26.94 17.90 20.02 2.96 0.68 0.91
21 Manufacture of Paper and Paper Products 177.50 24.06 19.63 6.89 2.60 2.57
22
Publishing, Printing and Reproduction of Recorded Media 436.80 19.92 18.52 6.79 2.65 1.71
23
Manufacture of Coke, Refined Petroleum and other Fuel Products 40.40 15.33 4.54 2.04 1.84 1.83
24 Manufacture of Chemicals and Chemical Products 226.58 14.64 9.45 5.00 2.88 3.45
25 Manufacture of Rubber and Plastic Products 40.08 25.79 19.80 2.87 0.77 0.88
26 Manufacture of Other Non-Metallic Mineral products 48.03 25.72 13.62 14.00 5.34 7.00
27 Manufacture of Basic Metals 70.76 11.77 6.18 -2.41 -1.68 -1.72
28
Manufacture of Fabricated Metal Products, Except Machinery and Equipment 71.10 31.87 28.09 8.99 4.20 5.11
29 Manufacture of Machinery and Equipment, n.e.c. 41.88 1.65 2.31 -0.24 -0.14 -0.08
31 Manufacture of Electrical Machinery and Apparatus, n.e.c. 9.60 12.76 7.42 -2.08 -0.54 -0.68
33
Manufacture of Medical, Precision and Optical Instruments, Watches and Clocks 19.96 21.05 15.60 -1.02 -0.55 -0.59
34 Manufacture of Motor Vehicles, Trailers and Semi-Trailers 25.50 26.31 19.60 18.55 15.84 15.70
36 Manufacture and Repair of Furniture 1.30 13.59 13.69 27.99 15.96 16.33
37 Manufacturing ,n.e.c. -58.73 13.45 9.61 -1.23 -0.71 -0.75
D. Investment Policy Reforms
Trade and investment policies have been the major policy tools for industrialization
in the Philippines. In the area of investment, the government provided generous fiscal
incentives to selected industries initially through the 1967 Investment Incentives Act
(Republic Act 5186). This also created the Board of Investments which was empowered to
determine preferred areas of investment through its Investment Priorities Plan (IPP) and to
administer the granting of incentives. The following incentives were provided to eligible
domestic enterprises: deduction of organizational and preoperating expenses from taxable
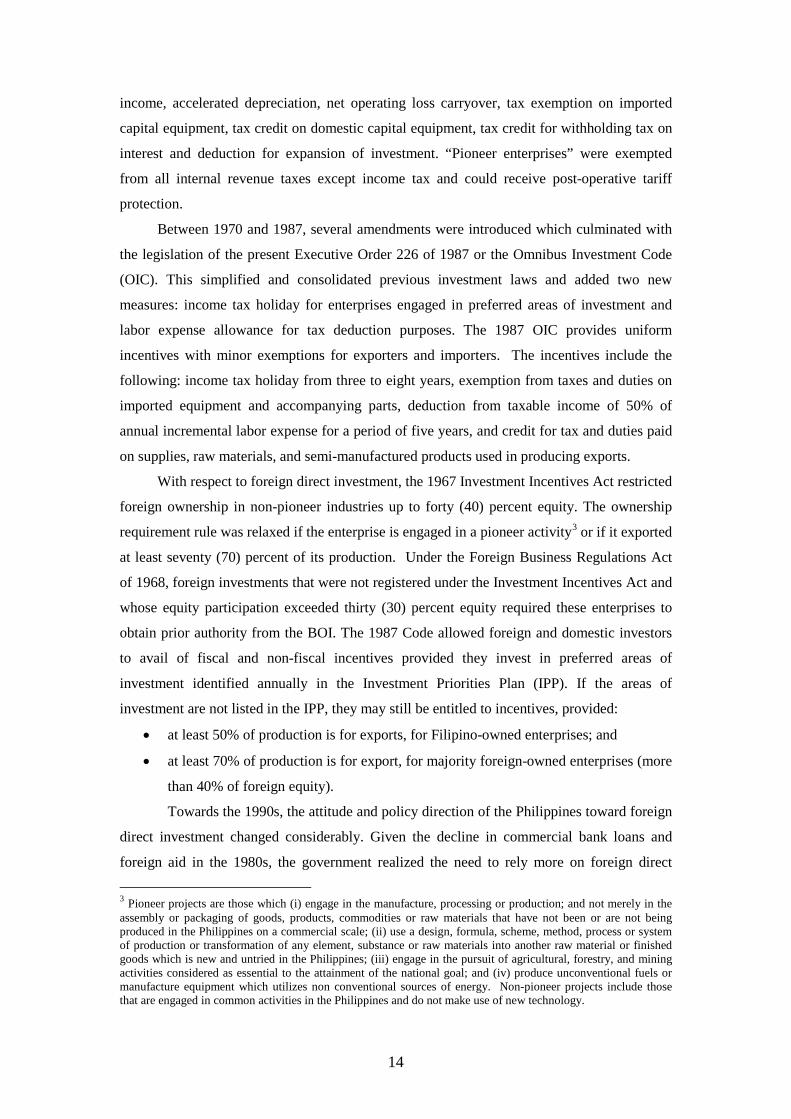
14
income, accelerated depreciation, net operating loss carryover, tax exemption on imported
capital equipment, tax credit on domestic capital equipment, tax credit for withholding tax on
interest and deduction for expansion of investment. “Pioneer enterprises” were exempted
from all internal revenue taxes except income tax and could receive post-operative tariff
protection.
Between 1970 and 1987, several amendments were introduced which culminated with
the legislation of the present Executive Order 226 of 1987 or the Omnibus Investment Code
(OIC). This simplified and consolidated previous investment laws and added two new
measures: income tax holiday for enterprises engaged in preferred areas of investment and
labor expense allowance for tax deduction purposes. The 1987 OIC provides uniform
incentives with minor exemptions for exporters and importers. The incentives include the
following: income tax holiday from three to eight years, exemption from taxes and duties on
imported equipment and accompanying parts, deduction from taxable income of 50% of
annual incremental labor expense for a period of five years, and credit for tax and duties paid
on supplies, raw materials, and semi-manufactured products used in producing exports.
With respect to foreign direct investment, the 1967 Investment Incentives Act restricted
foreign ownership in non-pioneer industries up to forty (40) percent equity. The ownership
requirement rule was relaxed if the enterprise is engaged in a pioneer activity3 or if it exported
at least seventy (70) percent of its production. Under the Foreign Business Regulations Act
of 1968, foreign investments that were not registered under the Investment Incentives Act and
whose equity participation exceeded thirty (30) percent equity required these enterprises to
obtain prior authority from the BOI. The 1987 Code allowed foreign and domestic investors
to avail of fiscal and non-fiscal incentives provided they invest in preferred areas of
investment identified annually in the Investment Priorities Plan (IPP). If the areas of
investment are not listed in the IPP, they may still be entitled to incentives, provided:
• at least 50% of production is for exports, for Filipino-owned enterprises; and
• at least 70% of production is for export, for majority foreign-owned enterprises (more
than 40% of foreign equity).
Towards the 1990s, the attitude and policy direction of the Philippines toward foreign
direct investment changed considerably. Given the decline in commercial bank loans and
foreign aid in the 1980s, the government realized the need to rely more on foreign direct
3 Pioneer projects are those which (i) engage in the manufacture, processing or production; and not merely in the assembly or packaging of goods, products, commodities or raw materials that have not been or are not being produced in the Philippines on a commercial scale; (ii) use a design, formula, scheme, method, process or system of production or transformation of any element, substance or raw materials into another raw material or finished goods which is new and untried in the Philippines; (iii) engage in the pursuit of agricultural, forestry, and mining activities considered as essential to the attainment of the national goal; and (iv) produce unconventional fuels or manufacture equipment which utilizes non conventional sources of energy. Non-pioneer projects include those that are engaged in common activities in the Philippines and do not make use of new technology.
15
investments to achieve sustainable economic growth. At the same time, the government
recognized the need to expand exports and the potential economic contribution of FDI
through the transfer of knowledge and experience. The nineties witnessed a policy shift as the
Philippines adopted more open and flexible policies toward FDI. This was almost carried out
simultaneously with the country’s market-oriented reforms consisting of trade liberalization,
privatization, and economic deregulation in the 1980s up to 1990s. The country accelerated
the FDI liberalization process through the legislation of Republic Act 7042 or the Foreign
Investment Act (FIA) in June 1991.
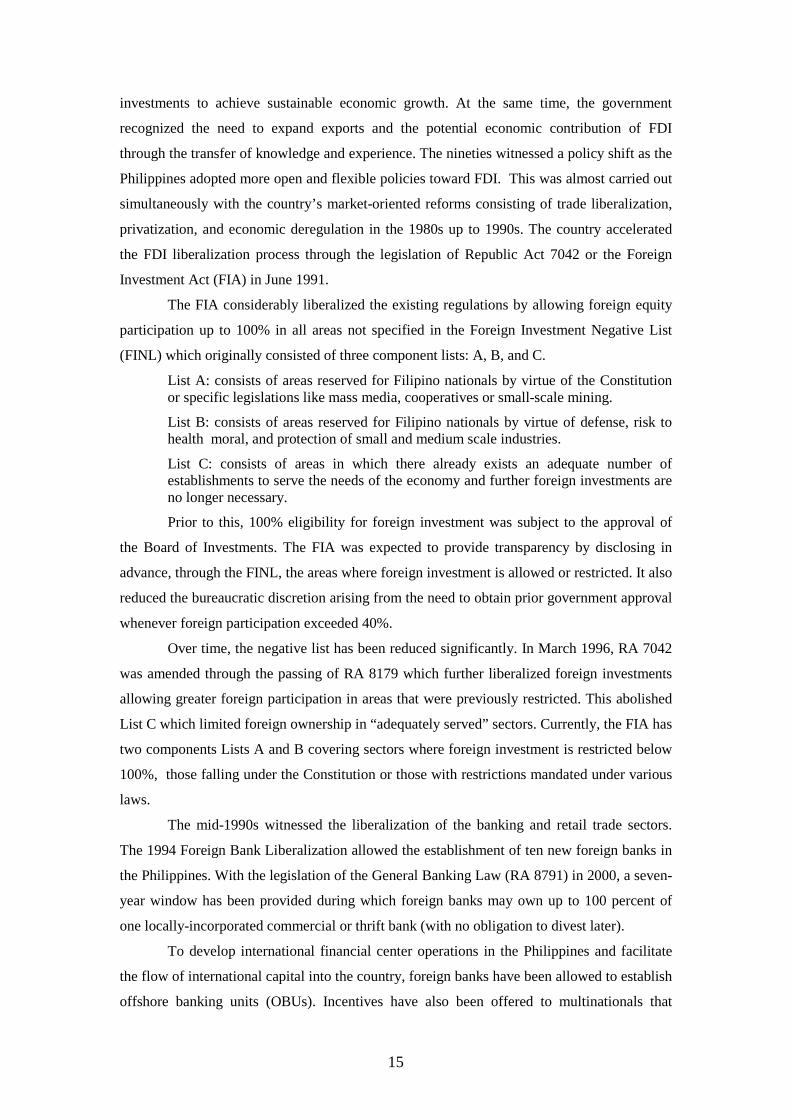
The FIA considerably liberalized the existing regulations by allowing foreign equity
participation up to 100% in all areas not specified in the Foreign Investment Negative List
(FINL) which originally consisted of three component lists: A, B, and C.
List A: consists of areas reserved for Filipino nationals by virtue of the Constitution or specific legislations like mass media, cooperatives or small-scale mining.
List B: consists of areas reserved for Filipino nationals by virtue of defense, risk to health moral, and protection of small and medium scale industries.
List C: consists of areas in which there already exists an adequate number of establishments to serve the needs of the economy and further foreign investments are no longer necessary.
Prior to this, 100% eligibility for foreign investment was subject to the approval of
the Board of Investments. The FIA was expected to provide transparency by disclosing in
advance, through the FINL, the areas where foreign investment is allowed or restricted. It also
reduced the bureaucratic discretion arising from the need to obtain prior government approval
whenever foreign participation exceeded 40%.
Over time, the negative list has been reduced significantly. In March 1996, RA 7042
was amended through the passing of RA 8179 which further liberalized foreign investments
allowing greater foreign participation in areas that were previously restricted. This abolished
List C which limited foreign ownership in “adequately served” sectors. Currently, the FIA has
two components Lists A and B covering sectors where foreign investment is restricted below
100%, those falling under the Constitution or those with restrictions mandated under various
laws.
The mid-1990s witnessed the liberalization of the banking and retail trade sectors.
The 1994 Foreign Bank Liberalization allowed the establishment of ten new foreign banks in
the Philippines. With the legislation of the General Banking Law (RA 8791) in 2000, a seven-
year window has been provided during which foreign banks may own up to 100 percent of
one locally-incorporated commercial or thrift bank (with no obligation to divest later).
To develop international financial center operations in the Philippines and facilitate
the flow of international capital into the country, foreign banks have been allowed to establish
offshore banking units (OBUs). Incentives have also been offered to multinationals that
16
establish regional headquarters (RHQ) or a regional operating headquarters (ROHQ) in the
Philippines. Both RHQs and ROHQs are entitled to the following incentives: exemption from
all taxes, fees, or charges imposed by a local government unit except real property tax on land
improvements and equipment; tax and duty free importation of training materials and
equipment; and direct importation of new motor vehicles, subject to the payment of the
corresponding taxes and duties.
In March 2000, the legislation of the Retail Trade Liberalization Act (Republic Act
8762) allowed foreign investors to enter the retail business and own them 100% as long as
they put up a minimum of US$7.5 million equity. Singapore and Hong Kong have no
minimum capital requirement while Thailand sets it at US$250,000. A lower minimum
capitalization threshold ($250,000) is allowed to foreigners seeking full ownership of firms
engaged in high-end or luxury products. R.A. 8762 also allowed foreign companies to engage
in rice and corn trade.
While substantial progress has been made in liberalizing the country’s FDI policy,
certain significant barriers to FDI entry still remain The sectors with foreign ownership
restriction include mass media, land ownership where foreign ownership is limited to 40%,
natural resources, firms that supply to government-owned corporations or agencies (40%),
public utilities (40%), and Build-Operate-Transfer (BOT) projects (40%).
In the 1990s, several other laws containing investment incentive packages were
legislated; the most important of which are RA 7227 known as the Bases Conversion and
Development Act of 1992 and RA 7916 or the Special Economic Zone Act of 1995. RA
7227, or the Bases Conversion and Development Act of 1992, was enacted into law in March
1992 with the objective of accelerating the development of the former United States military
bases into special economic zones. The Act created two administrative bodies, the Bases
Conversion and Development Authority (BCDA) and the Subic Bay Metropolitan Authority
(SBMA), tasked with adopting, preparing and implementing a comprehensive development
program for the conversion of the Clark and Subic military reservations into special economic
zones. The BCDA is mandated to oversee and implement the conversion and development of
Clark and other military stations; while the SBMA is mandated to oversee the implementation
of the development programs of the Subic Bay Naval Station and surrounding communities.
In 1993, Executive Order No. 80 was issued establishing the Clark Development Corporation
(CDC) as the implementing arm of the BCDA for the Clark Special Economic Zone. In July
2005, the Supreme Court revoked the incentives for Clark locators under RA 7227; although
these were restored through an amendment of RA 7227 in 2007.
In 1995, RA 7916 was legislated to shift the focus away from government EPZs
towards private industrial zones. Focus has also shifted from the traditional EPZ in which
firms must be 100 % export-oriented and engaged in recognized manufacturing activities
17
towards industrial parks which allow all industries regardless of market orientation and a
separate, fenced-in EPZ for wholly export-oriented firms. Republic Act 7916 also replaced
the EPZA and created the Philippine Economic Zone Authority (PEZA) to manage and
operate government-owned zones and administer incentives to special economic zones
(ecozones). RA 7916 allowed greater private sector participation in zone development and
management through the provision of incentives for private zone developers and operators.
Zone developers are allowed to supply utilities to tenants by treating them as indirect
exporters. Activities permitted within the economic zones have also been expanded.
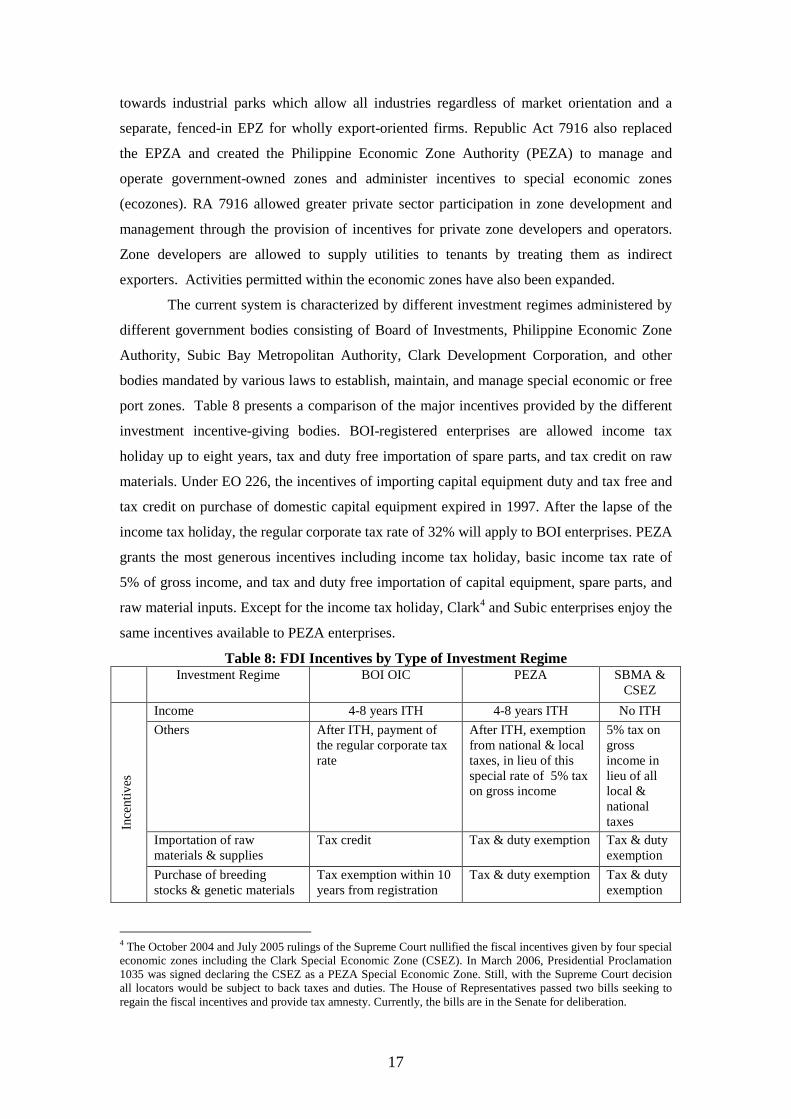
The current system is characterized by different investment regimes administered by
different government bodies consisting of Board of Investments, Philippine Economic Zone
Authority, Subic Bay Metropolitan Authority, Clark Development Corporation, and other
bodies mandated by various laws to establish, maintain, and manage special economic or free
port zones. Table 8 presents a comparison of the major incentives provided by the different
investment incentive-giving bodies. BOI-registered enterprises are allowed income tax
holiday up to eight years, tax and duty free importation of spare parts, and tax credit on raw
materials. Under EO 226, the incentives of importing capital equipment duty and tax free and
tax credit on purchase of domestic capital equipment expired in 1997. After the lapse of the
income tax holiday, the regular corporate tax rate of 32% will apply to BOI enterprises. PEZA
grants the most generous incentives including income tax holiday, basic income tax rate of
5% of gross income, and tax and duty free importation of capital equipment, spare parts, and
raw material inputs. Except for the income tax holiday, Clark4 and Subic enterprises enjoy the
same incentives available to PEZA enterprises.
Table 8: FDI Incentives by Type of Investment Regime Investment Regime
BOI OIC PEZA SBMA &
CSEZ
Ince
ntiv
es
Income 4-8 years ITH
4-8 years ITH
No ITH Others After ITH, payment of
the regular corporate tax rate
After ITH, exemption from national & local taxes, in lieu of this special rate of 5% tax on gross income
5% tax on gross income in lieu of all local & national taxes
Importation of raw materials & supplies
Tax credit Tax & duty exemption Tax & duty exemption
Purchase of breeding stocks & genetic materials
Tax exemption within 10 years from registration
Tax & duty exemption Tax & duty exemption
4 The October 2004 and July 2005 rulings of the Supreme Court nullified the fiscal incentives given by four special economic zones including the Clark Special Economic Zone (CSEZ). In March 2006, Presidential Proclamation 1035 was signed declaring the CSEZ as a PEZA Special Economic Zone. Still, with the Supreme Court decision all locators would be subject to back taxes and duties. The House of Representatives passed two bills seeking to regain the fiscal incentives and provide tax amnesty. Currently, the bills are in the Senate for deliberation.
18
Imported capital equipment, spare parts, materials & supplies
Tax & duty exemption on spare parts (duty & tax free importation of capital equipment expired in 1997)5
Tax & duty exemption Tax & duty exemption
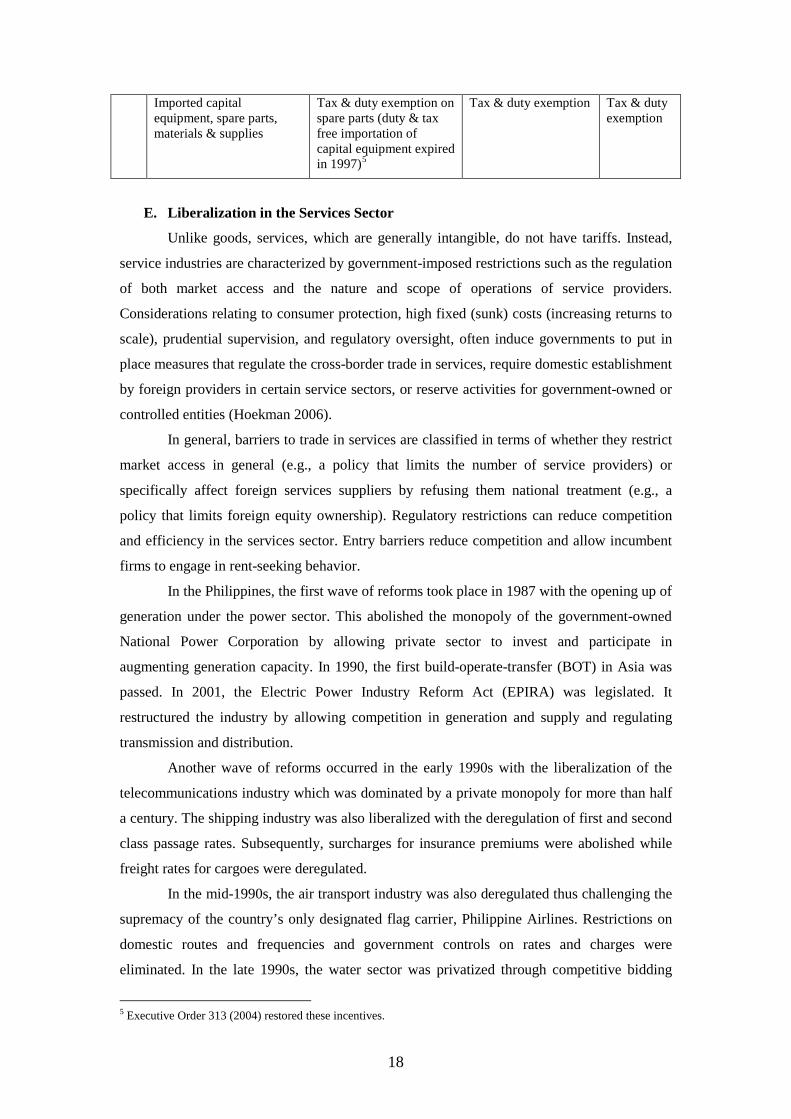
E. Liberalization in the Services Sector
Unlike goods, services, which are generally intangible, do not have tariffs. Instead,
service industries are characterized by government-imposed restrictions such as the regulation
of both market access and the nature and scope of operations of service providers.
Considerations relating to consumer protection, high fixed (sunk) costs (increasing returns to
scale), prudential supervision, and regulatory oversight, often induce governments to put in
place measures that regulate the cross-border trade in services, require domestic establishment
by foreign providers in certain service sectors, or reserve activities for government-owned or
controlled entities (Hoekman 2006).
In general, barriers to trade in services are classified in terms of whether they restrict
market access in general (e.g., a policy that limits the number of service providers) or
specifically affect foreign services suppliers by refusing them national treatment (e.g., a
policy that limits foreign equity ownership). Regulatory restrictions can reduce competition
and efficiency in the services sector. Entry barriers reduce competition and allow incumbent
firms to engage in rent-seeking behavior.
In the Philippines, the first wave of reforms took place in 1987 with the opening up of
generation under the power sector. This abolished the monopoly of the government-owned
National Power Corporation by allowing private sector to invest and participate in
augmenting generation capacity. In 1990, the first build-operate-transfer (BOT) in Asia was
passed. In 2001, the Electric Power Industry Reform Act (EPIRA) was legislated. It
restructured the industry by allowing competition in generation and supply and regulating
transmission and distribution.
Another wave of reforms occurred in the early 1990s with the liberalization of the
telecommunications industry which was dominated by a private monopoly for more than half
a century. The shipping industry was also liberalized with the deregulation of first and second
class passage rates. Subsequently, surcharges for insurance premiums were abolished while
freight rates for cargoes were deregulated.
In the mid-1990s, the air transport industry was also deregulated thus challenging the
supremacy of the country’s only designated flag carrier, Philippine Airlines. Restrictions on
domestic routes and frequencies and government controls on rates and charges were
eliminated. In the late 1990s, the water sector was privatized through competitive bidding
5 Executive Order 313 (2004) restored these incentives.
19
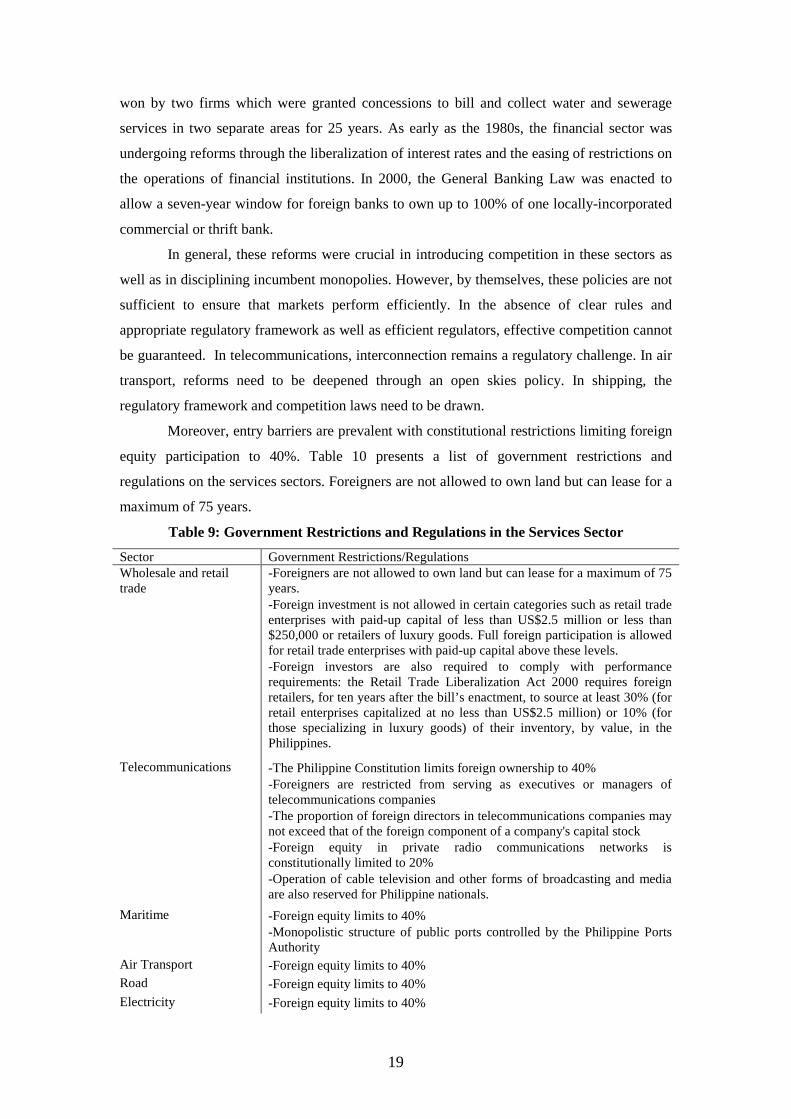
won by two firms which were granted concessions to bill and collect water and sewerage
services in two separate areas for 25 years. As early as the 1980s, the financial sector was
undergoing reforms through the liberalization of interest rates and the easing of restrictions on
the operations of financial institutions. In 2000, the General Banking Law was enacted to
allow a seven-year window for foreign banks to own up to 100% of one locally-incorporated
commercial or thrift bank.
In general, these reforms were crucial in introducing competition in these sectors as
well as in disciplining incumbent monopolies. However, by themselves, these policies are not
sufficient to ensure that markets perform efficiently. In the absence of clear rules and
appropriate regulatory framework as well as efficient regulators, effective competition cannot
be guaranteed. In telecommunications, interconnection remains a regulatory challenge. In air
transport, reforms need to be deepened through an open skies policy. In shipping, the
regulatory framework and competition laws need to be drawn.
Moreover, entry barriers are prevalent with constitutional restrictions limiting foreign
equity participation to 40%. Table 10 presents a list of government restrictions and
regulations on the services sectors. Foreigners are not allowed to own land but can lease for a
maximum of 75 years.
Table 9: Government Restrictions and Regulations in the Services Sector
Sector Government Restrictions/Regulations Wholesale and retail trade
-Foreigners are not allowed to own land but can lease for a maximum of 75 years.
-Foreign investment is not allowed in certain categories such as retail trade enterprises with paid-up capital of less than US$2.5 million or less than $250,000 or retailers of luxury goods. Full foreign participation is allowed for retail trade enterprises with paid-up capital above these levels.
-Foreign investors are also required to comply with performance requirements: the Retail Trade Liberalization Act 2000 requires foreign retailers, for ten years after the bill’s enactment, to source at least 30% (for retail enterprises capitalized at no less than US$2.5 million) or 10% (for those specializing in luxury goods) of their inventory, by value, in the Philippines.
Telecommunications -The Philippine Constitution limits foreign ownership to 40% -Foreigners are restricted from serving as executives or managers of
telecommunications companies -The proportion of foreign directors in telecommunications companies may
not exceed that of the foreign component of a company's capital stock -Foreign equity in private radio communications networks is
constitutionally limited to 20% -Operation of cable television and other forms of broadcasting and media
are also reserved for Philippine nationals. Maritime -Foreign equity limits to 40%
-Monopolistic structure of public ports controlled by the Philippine Ports Authority
Air Transport -Foreign equity limits to 40% Road -Foreign equity limits to 40% Electricity -Foreign equity limits to 40%
20
Water -Foreign equity limits to 40% Health services -Foreign equity ownership limited to 40% for hospitals
-Full foreign ownership allowed for health maintenance organizations Postal services -Government Monopoly
III. Analysis of Changes in Economic Growth, Performance, and Structure
A. Overall Economy
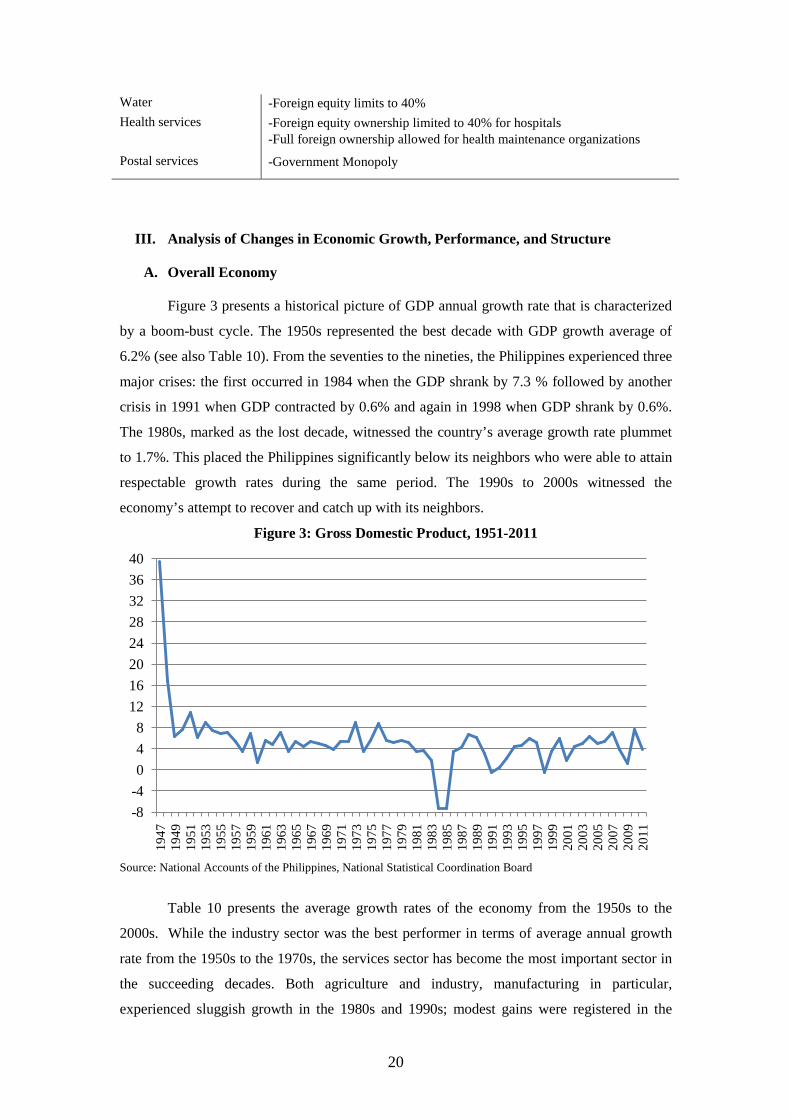
Figure 3 presents a historical picture of GDP annual growth rate that is characterized
by a boom-bust cycle. The 1950s represented the best decade with GDP growth average of
6.2% (see also Table 10). From the seventies to the nineties, the Philippines experienced three
major crises: the first occurred in 1984 when the GDP shrank by 7.3 % followed by another
crisis in 1991 when GDP contracted by 0.6% and again in 1998 when GDP shrank by 0.6%.
The 1980s, marked as the lost decade, witnessed the country’s average growth rate plummet
to 1.7%. This placed the Philippines significantly below its neighbors who were able to attain
respectable growth rates during the same period. The 1990s to 2000s witnessed the
economy’s attempt to recover and catch up with its neighbors.
Figure 3: Gross Domestic Product, 1951-2011
Source: National Accounts of the Philippines, National Statistical Coordination Board
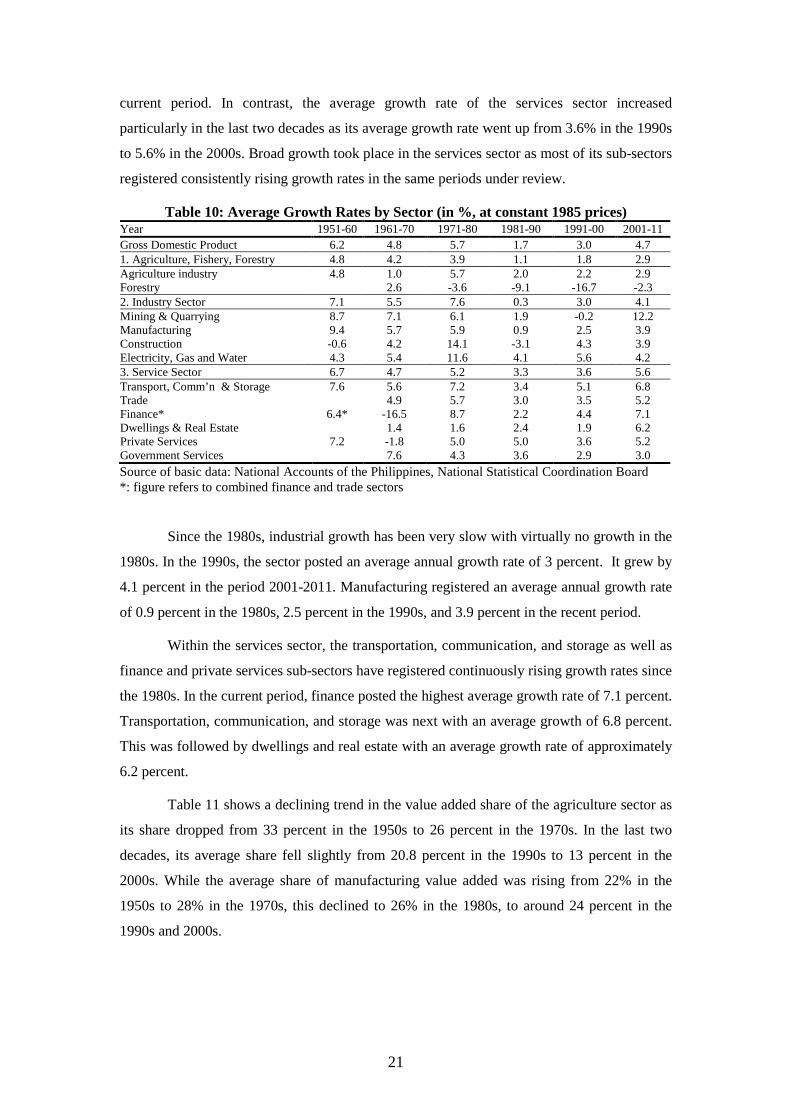
Table 10 presents the average growth rates of the economy from the 1950s to the
2000s. While the industry sector was the best performer in terms of average annual growth
rate from the 1950s to the 1970s, the services sector has become the most important sector in
the succeeding decades. Both agriculture and industry, manufacturing in particular,
experienced sluggish growth in the 1980s and 1990s; modest gains were registered in the
-8-4048
1216202428323640
1947
1949
1951
1953
1955
1957
1959
1961
1963
1965
1967
1969
1971
1973
1975
1977
1979
1981
1983
1985
1987
1989
1991
1993
1995
1997
1999
2001
2003
2005
2007
2009
2011
21
current period. In contrast, the average growth rate of the services sector increased
particularly in the last two decades as its average growth rate went up from 3.6% in the 1990s
to 5.6% in the 2000s. Broad growth took place in the services sector as most of its sub-sectors
registered consistently rising growth rates in the same periods under review.
Table 10: Average Growth Rates by Sector (in %, at constant 1985 prices) Year 1951-60 1961-70 1971-80 1981-90 1991-00 2001-11 Gross Domestic Product 6.2 4.8 5.7 1.7 3.0 4.7 1. Agriculture, Fishery, Forestry 4.8 4.2 3.9 1.1 1.8 2.9 Agriculture industry 4.8 1.0 5.7 2.0 2.2 2.9 Forestry 2.6 -3.6 -9.1 -16.7 -2.3 2. Industry Sector 7.1 5.5 7.6 0.3 3.0 4.1 Mining & Quarrying 8.7 7.1 6.1 1.9 -0.2 12.2 Manufacturing 9.4 5.7 5.9 0.9 2.5 3.9 Construction -0.6 4.2 14.1 -3.1 4.3 3.9 Electricity, Gas and Water 4.3 5.4 11.6 4.1 5.6 4.2 3. Service Sector 6.7 4.7 5.2 3.3 3.6 5.6 Transport, Comm’n & Storage 7.6 5.6 7.2 3.4 5.1 6.8 Trade 4.9 5.7 3.0 3.5 5.2 Finance* 6.4* -16.5 8.7 2.2 4.4 7.1 Dwellings & Real Estate 1.4 1.6 2.4 1.9 6.2 Private Services 7.2 -1.8 5.0 5.0 3.6 5.2 Government Services 7.6 4.3 3.6 2.9 3.0 Source of basic data: National Accounts of the Philippines, National Statistical Coordination Board *: figure refers to combined finance and trade sectors
Since the 1980s, industrial growth has been very slow with virtually no growth in the
1980s. In the 1990s, the sector posted an average annual growth rate of 3 percent. It grew by
4.1 percent in the period 2001-2011. Manufacturing registered an average annual growth rate
of 0.9 percent in the 1980s, 2.5 percent in the 1990s, and 3.9 percent in the recent period.
Within the services sector, the transportation, communication, and storage as well as
finance and private services sub-sectors have registered continuously rising growth rates since
the 1980s. In the current period, finance posted the highest average growth rate of 7.1 percent.
Transportation, communication, and storage was next with an average growth of 6.8 percent.
This was followed by dwellings and real estate with an average growth rate of approximately
6.2 percent.
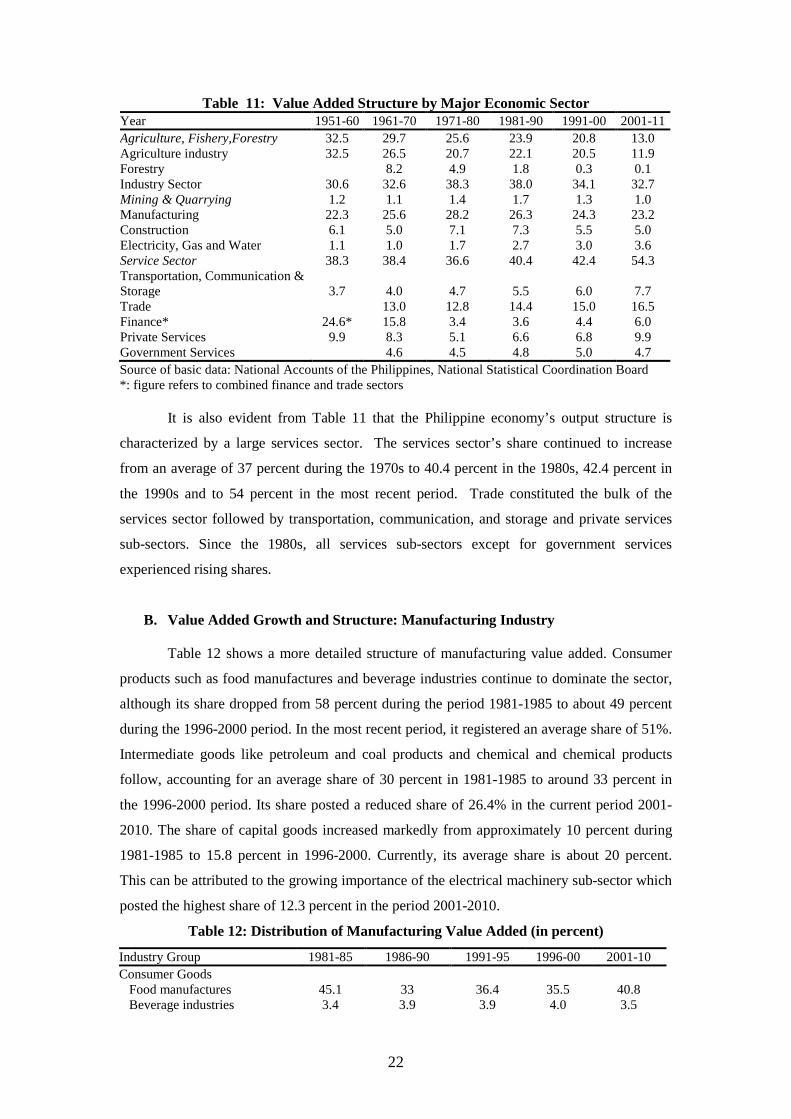
Table 11 shows a declining trend in the value added share of the agriculture sector as
its share dropped from 33 percent in the 1950s to 26 percent in the 1970s. In the last two
decades, its average share fell slightly from 20.8 percent in the 1990s to 13 percent in the
2000s. While the average share of manufacturing value added was rising from 22% in the
1950s to 28% in the 1970s, this declined to 26% in the 1980s, to around 24 percent in the
1990s and 2000s.
22
Table 11: Value Added Structure by Major Economic Sector Year 1951-60 1961-70 1971-80 1981-90 1991-00 2001-11 Agriculture, Fishery,Forestry 32.5 29.7 25.6 23.9 20.8 13.0 Agriculture industry 32.5 26.5 20.7 22.1 20.5 11.9 Forestry 8.2 4.9 1.8 0.3 0.1 Industry Sector 30.6 32.6 38.3 38.0 34.1 32.7 Mining & Quarrying 1.2 1.1 1.4 1.7 1.3 1.0 Manufacturing 22.3 25.6 28.2 26.3 24.3 23.2 Construction 6.1 5.0 7.1 7.3 5.5 5.0 Electricity, Gas and Water 1.1 1.0 1.7 2.7 3.0 3.6 Service Sector 38.3 38.4 36.6 40.4 42.4 54.3 Transportation, Communication & Storage 3.7 4.0 4.7 5.5 6.0 7.7 Trade 13.0 12.8 14.4 15.0 16.5 Finance* 24.6* 15.8 3.4 3.6 4.4 6.0 Private Services 9.9 8.3 5.1 6.6 6.8 9.9 Government Services 4.6 4.5 4.8 5.0 4.7 Source of basic data: National Accounts of the Philippines, National Statistical Coordination Board *: figure refers to combined finance and trade sectors
It is also evident from Table 11 that the Philippine economy’s output structure is
characterized by a large services sector. The services sector’s share continued to increase
from an average of 37 percent during the 1970s to 40.4 percent in the 1980s, 42.4 percent in
the 1990s and to 54 percent in the most recent period. Trade constituted the bulk of the
services sector followed by transportation, communication, and storage and private services
sub-sectors. Since the 1980s, all services sub-sectors except for government services
experienced rising shares.
B. Value Added Growth and Structure: Manufacturing Industry
Table 12 shows a more detailed structure of manufacturing value added. Consumer
products such as food manufactures and beverage industries continue to dominate the sector,
although its share dropped from 58 percent during the period 1981-1985 to about 49 percent
during the 1996-2000 period. In the most recent period, it registered an average share of 51%.
Intermediate goods like petroleum and coal products and chemical and chemical products
follow, accounting for an average share of 30 percent in 1981-1985 to around 33 percent in
the 1996-2000 period. Its share posted a reduced share of 26.4% in the current period 2001-
2010. The share of capital goods increased markedly from approximately 10 percent during
1981-1985 to 15.8 percent in 1996-2000. Currently, its average share is about 20 percent.
This can be attributed to the growing importance of the electrical machinery sub-sector which
posted the highest share of 12.3 percent in the period 2001-2010.
Table 12: Distribution of Manufacturing Value Added (in percent)
Industry Group 1981-85 1986-90 1991-95 1996-00 2001-10 Consumer Goods Food manufactures 45.1 33 36.4 35.5 40.8 Beverage industries 3.4 3.9 3.9 4.0 3.5
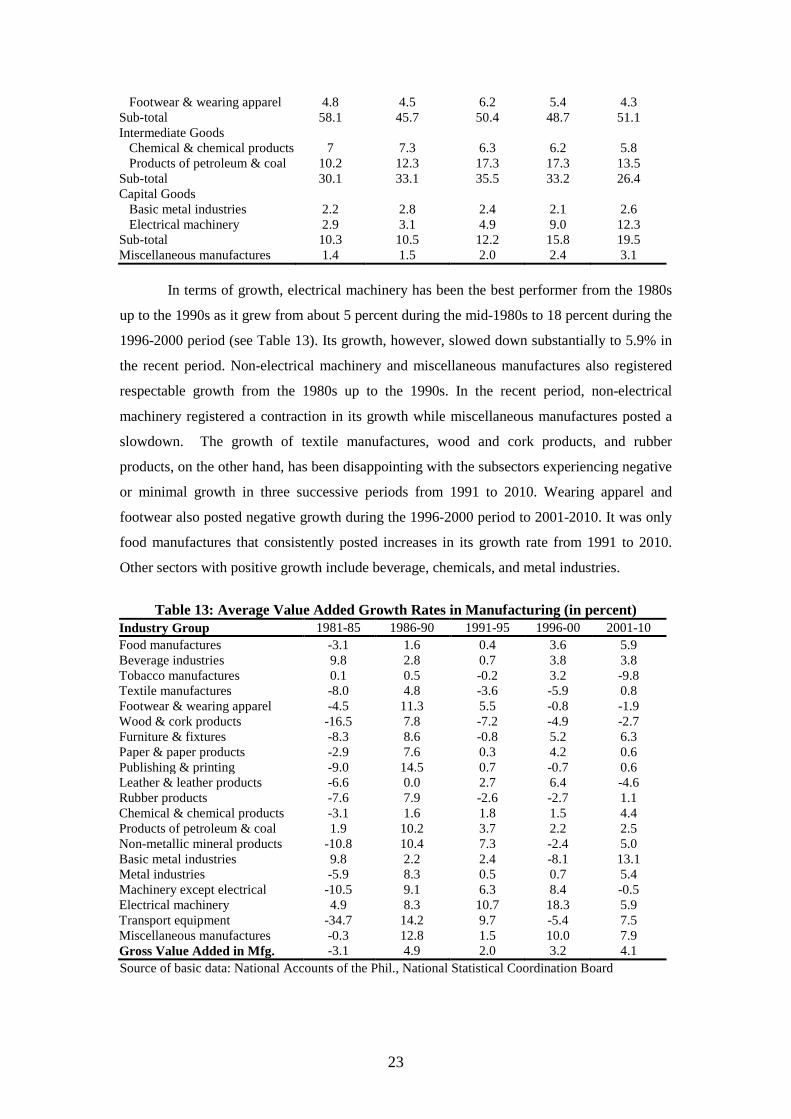
23
Footwear & wearing apparel 4.8 4.5 6.2 5.4 4.3 Sub-total 58.1 45.7 50.4 48.7 51.1 Intermediate Goods Chemical & chemical products 7 7.3 6.3 6.2 5.8 Products of petroleum & coal 10.2 12.3 17.3 17.3 13.5 Sub-total 30.1 33.1 35.5 33.2 26.4 Capital Goods Basic metal industries 2.2 2.8 2.4 2.1 2.6 Electrical machinery 2.9 3.1 4.9 9.0 12.3 Sub-total 10.3 10.5 12.2 15.8 19.5 Miscellaneous manufactures 1.4 1.5 2.0 2.4 3.1
In terms of growth, electrical machinery has been the best performer from the 1980s
up to the 1990s as it grew from about 5 percent during the mid-1980s to 18 percent during the
1996-2000 period (see Table 13). Its growth, however, slowed down substantially to 5.9% in
the recent period. Non-electrical machinery and miscellaneous manufactures also registered
respectable growth from the 1980s up to the 1990s. In the recent period, non-electrical
machinery registered a contraction in its growth while miscellaneous manufactures posted a
slowdown. The growth of textile manufactures, wood and cork products, and rubber
products, on the other hand, has been disappointing with the subsectors experiencing negative
or minimal growth in three successive periods from 1991 to 2010. Wearing apparel and
footwear also posted negative growth during the 1996-2000 period to 2001-2010. It was only
food manufactures that consistently posted increases in its growth rate from 1991 to 2010.
Other sectors with positive growth include beverage, chemicals, and metal industries.
Table 13: Average Value Added Growth Rates in Manufacturing (in percent)
Industry Group 1981-85 1986-90 1991-95 1996-00 2001-10 Food manufactures -3.1 1.6 0.4 3.6 5.9 Beverage industries 9.8 2.8 0.7 3.8 3.8 Tobacco manufactures 0.1 0.5 -0.2 3.2 -9.8 Textile manufactures -8.0 4.8 -3.6 -5.9 0.8 Footwear & wearing apparel -4.5 11.3 5.5 -0.8 -1.9 Wood & cork products -16.5 7.8 -7.2 -4.9 -2.7 Furniture & fixtures -8.3 8.6 -0.8 5.2 6.3 Paper & paper products -2.9 7.6 0.3 4.2 0.6 Publishing & printing -9.0 14.5 0.7 -0.7 0.6 Leather & leather products -6.6 0.0 2.7 6.4 -4.6 Rubber products -7.6 7.9 -2.6 -2.7 1.1 Chemical & chemical products -3.1 1.6 1.8 1.5 4.4 Products of petroleum & coal 1.9 10.2 3.7 2.2 2.5 Non-metallic mineral products -10.8 10.4 7.3 -2.4 5.0 Basic metal industries 9.8 2.2 2.4 -8.1 13.1 Metal industries -5.9 8.3 0.5 0.7 5.4 Machinery except electrical -10.5 9.1 6.3 8.4 -0.5 Electrical machinery 4.9 8.3 10.7 18.3 5.9 Transport equipment -34.7 14.2 9.7 -5.4 7.5 Miscellaneous manufactures -0.3 12.8 1.5 10.0 7.9 Gross Value Added in Mfg. -3.1 4.9 2.0 3.2 4.1 Source of basic data: National Accounts of the Phil., National Statistical Coordination Board
24
Table 14 compares the value added structure of the Philippines with other East Asian
countries. It is evident from the data that our neighboring countries registered reductions in
the share of agriculture and substantial increases in the share of industry during the period
1990 to 2010. In comparison, the share of Philippine agriculture dropped from 22 percent to
18 percent, industry declined from 34 percent to 33 percent while services, which constituted
a large portion of Philippine output, rose sharply from 44 percent in 1990 to 55 percent in
2010.
Table 14: Structure of Output (as percentage of GDP) Sector Philippines Thailand Indonesia Malaysia China
90 99 10 90 99 10 90 99 10 90 99 10 90 99 10
Agriculture 22 18 12 12 10 12 19 19 15 15 11 11 27 18 10 Industry 34 30 33 37 40 45 39 43 47 42 46 44 42 49 47
Manufacturing 25 21 21 27 32 35 21 25 25 24 32 26 33 32 30 Services 44 52 55 50 50 43 41 37 38 43 43 45 31 33 43
Source: World Bank, 2010 World Development Indicators.
In contrast, the share of agriculture in Thailand dropped from 12 percent in 1990 to
10 percent in 1999, but this increased to 12 percent in 2010. In Malaysia, agriculture declined
from 15 percent to 11 percent. In China, the share of agriculture fell from 27 percent to 10
percent. The same trend is observed in Indonesia as agriculture declined from 19 percent to
15 percent. In terms of industry share, in Thailand this went up from 37 percent to 45 percent,
in Indonesia, it increased from 39 percent to 47 percent, in Malaysia, it rose from 42 percent
to 44 percent and in China, from 42 percent to 47 percent. The bulk of industry,
manufacturing, witnessed significant increases in its share for all the countries under review
except for the Philippines with Thailand and China registering the highest shares of 35% and
30%, respectively. The share of services dropped in Thailand, Indonesia, and Malaysia while
China posted a rising trend.
C. Employment
In terms of employment contribution, the services sector has become the largest
provider of employment in the most recent period (Table 15). The share of the labor force
employed in the sector consistently increased, from around 32 percent in the mid-1970s to
about 49 percent in 2000-2011. The share of industry to total employment has been almost
stagnant at 15% from the mid 1970s to the most recent period under review.
Table 15: Structure of Employment (in percent) Major Sector 1975-78 1980-89 1990-99 2000-11 Agriculture, Fishery and Forestry 52.83 49.60 43.16 36.07 Industry 15.23 14.49 15.98 15.10 Mining and Quarrying 0.46 0.66 0.59 0.42 Manufacturing 11.29 9.93 10.01 9.08 Electricity, Gas and Water 0.35 0.36 0.44 0.40 Construction 3.13 3.54 4.94 5.22
25
Services 31.87 35.90 40.94 48.82 Wholesale and Retail Trade 10.32 12.55 14.54 18.65 Transportation, Storage & Communication 4.08 4.45 5.80 7.46 Financing, Insurance, Real Estate & Business Services 4.55 1.79 2.18 3.55 Community, Social & Personal Services 14.05 17.11 18.42 19.17 Industry not Elsewhere Classified 0.49 0.02 0.05 0.00 Sources: Yearbook of Labor Statistics (1980-2000) and Current Labor Statistics (2001-2002), Bureau of Labor and Employment Statistics, Department of Labor and Employment and Employed Persons by Major Industry Group, National Statistics Office Labor Force Survey (1970, 1975-1976, 1977-1978, 2003-2009).
The manufacturing sector has failed in creating enough employment to absorb new
entrants to the labor force as well as those who move out of the agricultural sector. Its share
dropped from 11 percent in the mid-1970s to 9 percent in the 2000-2011 period. While the
share of agriculture has been declining, the sector has remained an important source of
employment. From 52.8 percent in the mid-1970s, the agriculture sector’s share in total
employment continuously declined in the succeeding decades and is currently around 36
percent.
D. Productivity
The traditional way of measuring productivity at the plant level is to compute value-
added per worker6. On the average, labor productivity in manufacturing declined substantially
from around P84,000 during the 1980s to P78,000 in the 1990s (see Figure 4 and Table 16),
although in the current period, this improved to around P98,000.
Figure 4: Average Labor Productivity in Manufacturing, in '000 pesos
Table 16: Labor Productivity (in thousand pesos, 1985 constant prices)
6 While this is easy to calculate and reflects labor productivity, it focuses productivity measurement only on labor which can be misleading.
7678808284868890929496
1970s 1980s 1990s 2000s
84.09 83.98
78.02
97.54
Avg. Labor Productivity
Economic Sector 1976-1978 1980s 1990s 2000-2010 Agriculture, Fishery and Forestry 15.87 15.18 15.56 19.56 Industry 87.76 84.00 68.28 82.26 Mining and Quarrying 96.56 82.20 85.80 153.07 Manufacturing 84.09 83.98 78.02 97.54 Construction 90.44 70.61 35.21 33.66 Electricity, Gas and Water 178.96 230.34 216.24 304.82
26
Table 16 compares the levels and trends in the productivity of labor across the
different economic sectors from the mid-1970s to the current period. The results indicate that
labor productivity is low and disparities across the three major sectors are wide. Industry has
the highest labor productivity, which declined from the mid-seventies to the nineties but
showed some improvement in the current period, although it still has not reached its highest
average level registered in the mid-1970s. The average labor productivity in the services
sector has declined from the mid-1970s to the 1990s but improved in 2000-2010. The
agriculture, fishery, and forestry sector has the lowest level of labor productivity which
remained stagnant from the mid-1970s up to the nineties but increased slightly in the current
period. Herrin and Pernia (2003) attributed the deterioration in the country’s labor
productivity from the mid-1970s to the 1990s to three factors: the failure of firms to invest in
state-of-the-art technology and implement best practice, the lack of investments in human
capital due to rapid population growth, and the relatively quick expansion of employment in
low productivity services sector.
Table 17 shows total factor productivity (TFP)7 growth figures for manufacturing
which are normalized and interpreted as growth relative to 1996. From 1996 to 2006,
aggregate productivity gains are evident in leather, textile, furniture, other manufacturing, and
basic metals and fabricated metal sectors. Leather grew by 9.5%, textile by 2.4%, other
manufacturing by 2.9%, furniture by 1.9% and basic metals by 1.3%.
Table 17: TFP Growth in the Manufacturing Industry
Industry description Year TFP Industry description Year TFP
food, beverages, & tobacco
1997 0.45
non-metallic products
1997 0.11 1998 3.01 1998 1.47 2000 -0.82 2000 -1.12 2002 -1.83 2002 -7.38 2003 -2.25 2003 -2.20 2005 -1.36 2005 0.39 2006 -1.44 2006 -0.65
textile
1997 1.80
basic metal & fabricated metal
1997 -0.20 1998 1.01 1998 -4.39 2000 0.95 2000 -1.77 2002 -0.46 2002 -3.18 2003 1.20 2003 -2.70 2005 6.00 2005 -4.47
7 Total factor productivity was estimated using the methodology of Levinsohn and Petrin (2001).
Services 38.39 34.75 33.00 36.90 Transportation, Storage & Communication 40.79 38.10 32.56 41.74 Wholesale and Retail Trade 41.19 35.79 32.80 33.82 Financing, Insurance, Real Estate & Business Services 184.89 272.14 242.67 201.45 Community, Social & Personal Services 12.21 8.54 8.73 8.80
27
2006 2.35 2006 1.32
garments
1997 1.12
machinery & equipment, motor vehicles & other transport
1997 0.37 1998 2.46 1998 -4.92 2000 0.51 2000 0.90 2002 0.49 2002 -2.00 2003 0.62 2003 -2.75 2005 -0.75 2005 -1.70 2006 -0.99 2006 -0.86
leather
1997 -1.35
furniture
1997 1.16 1998 0.81 1998 1.64 2000 0.63 2000 3.12 2002 7.20 2002 3.46 2003 12.10 2003 2.03 2005 8.09 2005 2.59 2006 9.54 2006 1.86
wood, paper, & publishing
1997 0.61
Other manufacturing
1997 -0.18 1998 0.29 1998 3.01 2000 -2.46 2000 0.27 2002 -1.06 2002 1.49 2003 -3.85 2003 0.63 2005 -3.64 2005 1.18 2006 -5.39 2006 2.87
coke, petroleum, chemicals & rubber
1997 -0.61
All manufacturing
1997 -0.23 1998 -2.68 1998 -1.59 2000 2.94 2000 -0.44 2002 -6.65 2002 -4.86 2003 4.19 2003 -1.00 2005 -1.11 2005 -2.53 2006 -4.76 2006 -3.37
Source: Aldaba (2010)
Out of the 11 manufacturing sectors, six sectors covering food, beverages, and tobacco;
garments; wood, paper, and publishing; coke, petroleum, chemicals and rubber; non-metallic
products; basic metal and fabricated metal products as well as machinery and equipment,
motor vehicle and other transport registered negative productivity growth rates from 1996 to
2006. On the whole, the manufacturing sector’s aggregate productivity declined by 3.4% from
1996 to 2006.
E. Imports and Exports
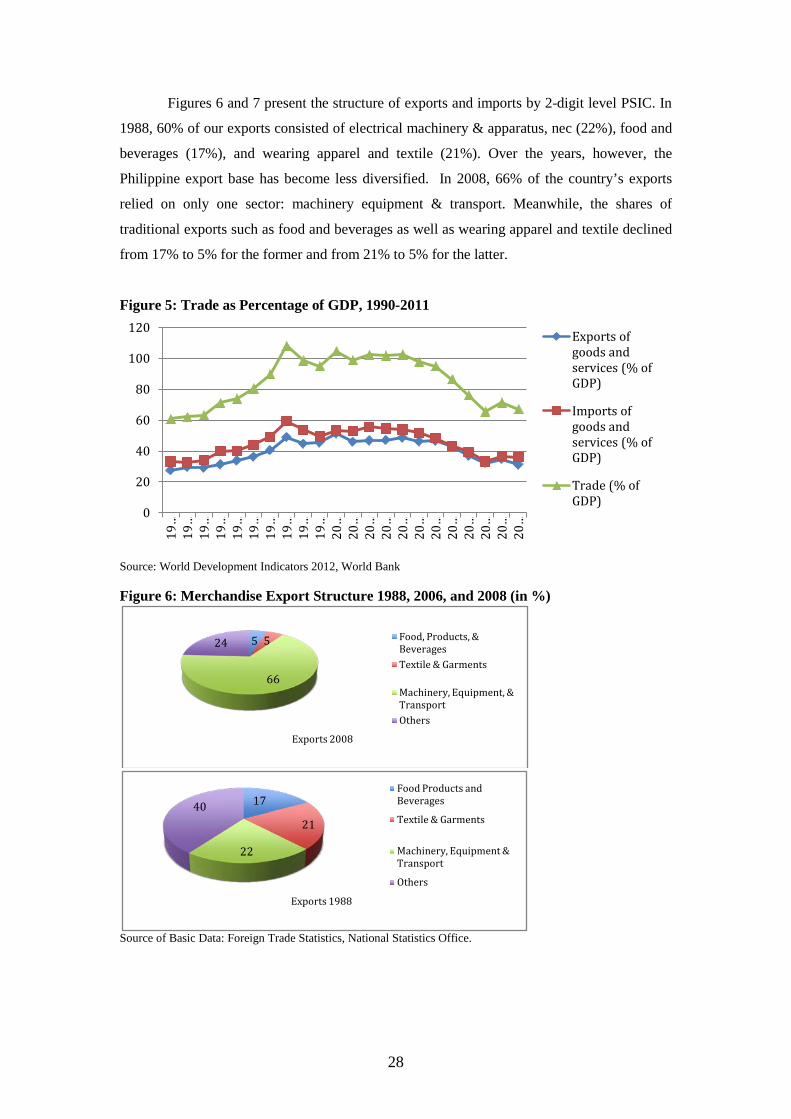
Trade (exports plus imports of goods and services) increased from an average of
around 82% of GDP in the 1990s to 89% in the 2000s (Figure 5). On average, exports of
goods & services as % of GDP rose from 38% to 43% during the same period, and imports
from 44% to 47%. Trade balance, however, has been unfavorable with imports surpassing
exports except in 1999-2000 (Aldaba et al, 2010).
28
Figures 6 and 7 present the structure of exports and imports by 2-digit level PSIC. In
1988, 60% of our exports consisted of electrical machinery & apparatus, nec (22%), food and
beverages (17%), and wearing apparel and textile (21%). Over the years, however, the
Philippine export base has become less diversified. In 2008, 66% of the country’s exports
relied on only one sector: machinery equipment & transport. Meanwhile, the shares of
traditional exports such as food and beverages as well as wearing apparel and textile declined
from 17% to 5% for the former and from 21% to 5% for the latter.
Figure 5: Trade as Percentage of GDP, 1990-2011
Source: World Development Indicators 2012, World Bank Figure 6: Merchandise Export Structure 1988, 2006, and 2008 (in %)
Source of Basic Data: Foreign Trade Statistics, National Statistics Office.
0
20
40
60
80
100
120
19…
19…
19…
19…
19…
19…
19…
19…
19…
19…
20…
20…
20…
20…
20…
20…
20…
20…
20…
20…
20…
20…
Exports of goods and services (% of GDP)
Imports of goods and services (% of GDP)
Trade (% of GDP)
5 5
66
24
Exports 2008
Food, Products, & BeveragesTextile & Garments
Machinery, Equipment, & TransportOthers
17
21
22
40
Exports 1988
Food Products and Beverages
Textile & Garments
Machinery, Equipment & Transport
Others
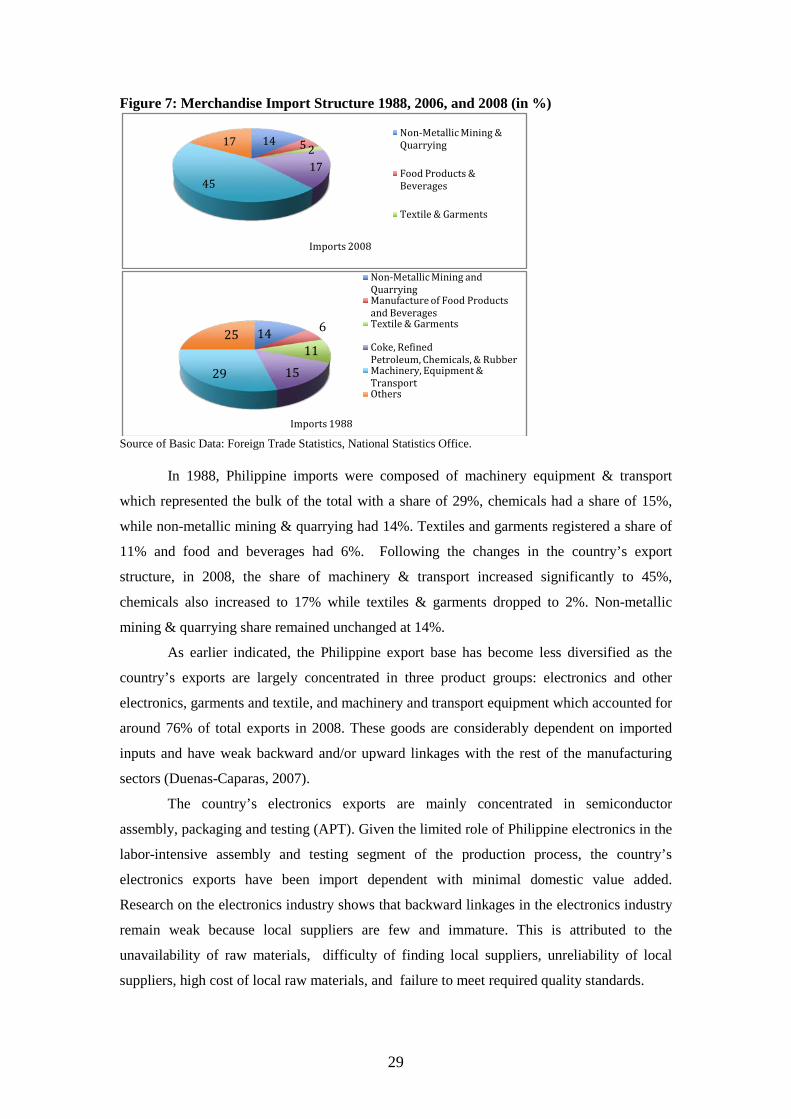
29
Figure 7: Merchandise Import Structure 1988, 2006, and 2008 (in %)
Source of Basic Data: Foreign Trade Statistics, National Statistics Office.
In 1988, Philippine imports were composed of machinery equipment & transport
which represented the bulk of the total with a share of 29%, chemicals had a share of 15%,
while non-metallic mining & quarrying had 14%. Textiles and garments registered a share of
11% and food and beverages had 6%. Following the changes in the country’s export
structure, in 2008, the share of machinery & transport increased significantly to 45%,
chemicals also increased to 17% while textiles & garments dropped to 2%. Non-metallic
mining & quarrying share remained unchanged at 14%.
As earlier indicated, the Philippine export base has become less diversified as the
country’s exports are largely concentrated in three product groups: electronics and other
electronics, garments and textile, and machinery and transport equipment which accounted for
around 76% of total exports in 2008. These goods are considerably dependent on imported
inputs and have weak backward and/or upward linkages with the rest of the manufacturing
sectors (Duenas-Caparas, 2007).
The country’s electronics exports are mainly concentrated in semiconductor
assembly, packaging and testing (APT). Given the limited role of Philippine electronics in the
labor-intensive assembly and testing segment of the production process, the country’s
electronics exports have been import dependent with minimal domestic value added.
Research on the electronics industry shows that backward linkages in the electronics industry
remain weak because local suppliers are few and immature. This is attributed to the
unavailability of raw materials, difficulty of finding local suppliers, unreliability of local
suppliers, high cost of local raw materials, and failure to meet required quality standards.
14 5 217
45
17
Imports 2008
Non-Metallic Mining & Quarrying
Food Products & Beverages
Textile & Garments
14 6
111529
25
Imports 1988
Non-Metallic Mining and QuarryingManufacture of Food Products and BeveragesTextile & Garments
Coke, Refined Petroleum, Chemicals, & RubberMachinery, Equipment & TransportOthers
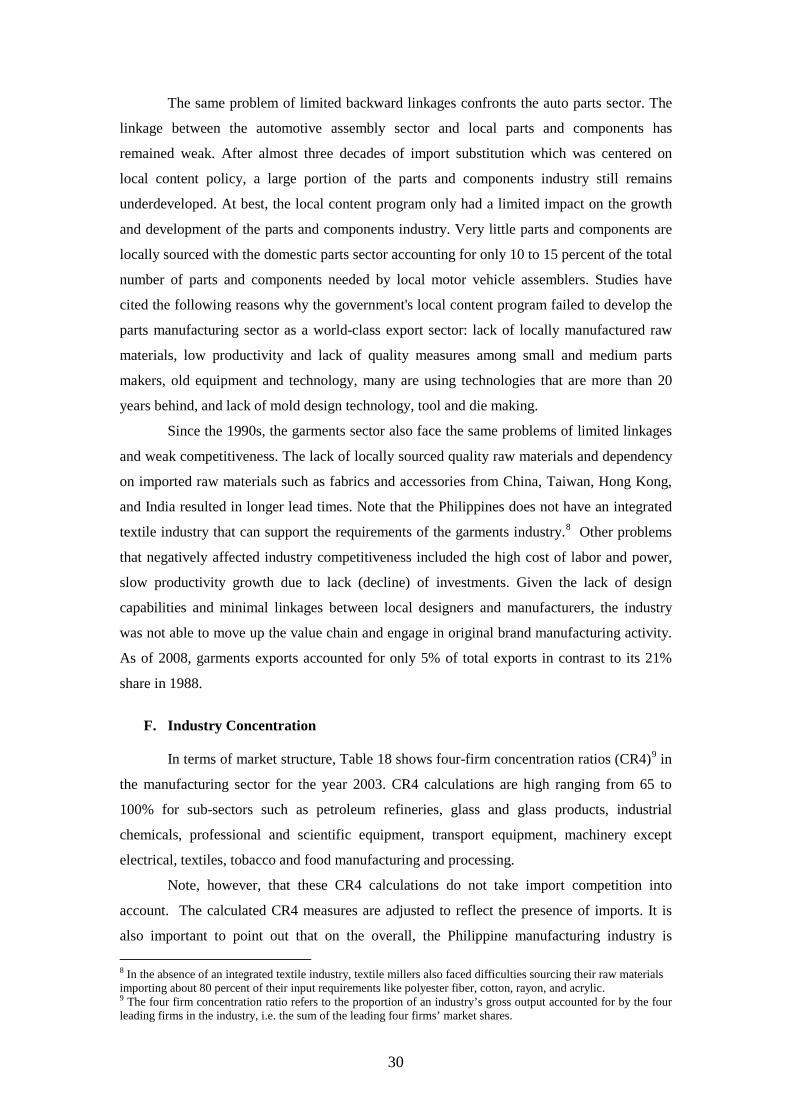
30
The same problem of limited backward linkages confronts the auto parts sector. The
linkage between the automotive assembly sector and local parts and components has
remained weak. After almost three decades of import substitution which was centered on
local content policy, a large portion of the parts and components industry still remains
underdeveloped. At best, the local content program only had a limited impact on the growth
and development of the parts and components industry. Very little parts and components are
locally sourced with the domestic parts sector accounting for only 10 to 15 percent of the total
number of parts and components needed by local motor vehicle assemblers. Studies have
cited the following reasons why the government's local content program failed to develop the
parts manufacturing sector as a world-class export sector: lack of locally manufactured raw
materials, low productivity and lack of quality measures among small and medium parts
makers, old equipment and technology, many are using technologies that are more than 20
years behind, and lack of mold design technology, tool and die making.
Since the 1990s, the garments sector also face the same problems of limited linkages
and weak competitiveness. The lack of locally sourced quality raw materials and dependency
on imported raw materials such as fabrics and accessories from China, Taiwan, Hong Kong,
and India resulted in longer lead times. Note that the Philippines does not have an integrated
textile industry that can support the requirements of the garments industry.8 Other problems
that negatively affected industry competitiveness included the high cost of labor and power,
slow productivity growth due to lack (decline) of investments. Given the lack of design
capabilities and minimal linkages between local designers and manufacturers, the industry
was not able to move up the value chain and engage in original brand manufacturing activity.
As of 2008, garments exports accounted for only 5% of total exports in contrast to its 21%
share in 1988.
F. Industry Concentration
In terms of market structure, Table 18 shows four-firm concentration ratios (CR4)9 in
the manufacturing sector for the year 2003. CR4 calculations are high ranging from 65 to
100% for sub-sectors such as petroleum refineries, glass and glass products, industrial
chemicals, professional and scientific equipment, transport equipment, machinery except
electrical, textiles, tobacco and food manufacturing and processing.
Note, however, that these CR4 calculations do not take import competition into
account. The calculated CR4 measures are adjusted to reflect the presence of imports. It is
also important to point out that on the overall, the Philippine manufacturing industry is 8 In the absence of an integrated textile industry, textile millers also faced difficulties sourcing their raw materials importing about 80 percent of their input requirements like polyester fiber, cotton, rayon, and acrylic. 9 The four firm concentration ratio refers to the proportion of an industry’s gross output accounted for by the four leading firms in the industry, i.e. the sum of the leading four firms’ market shares.
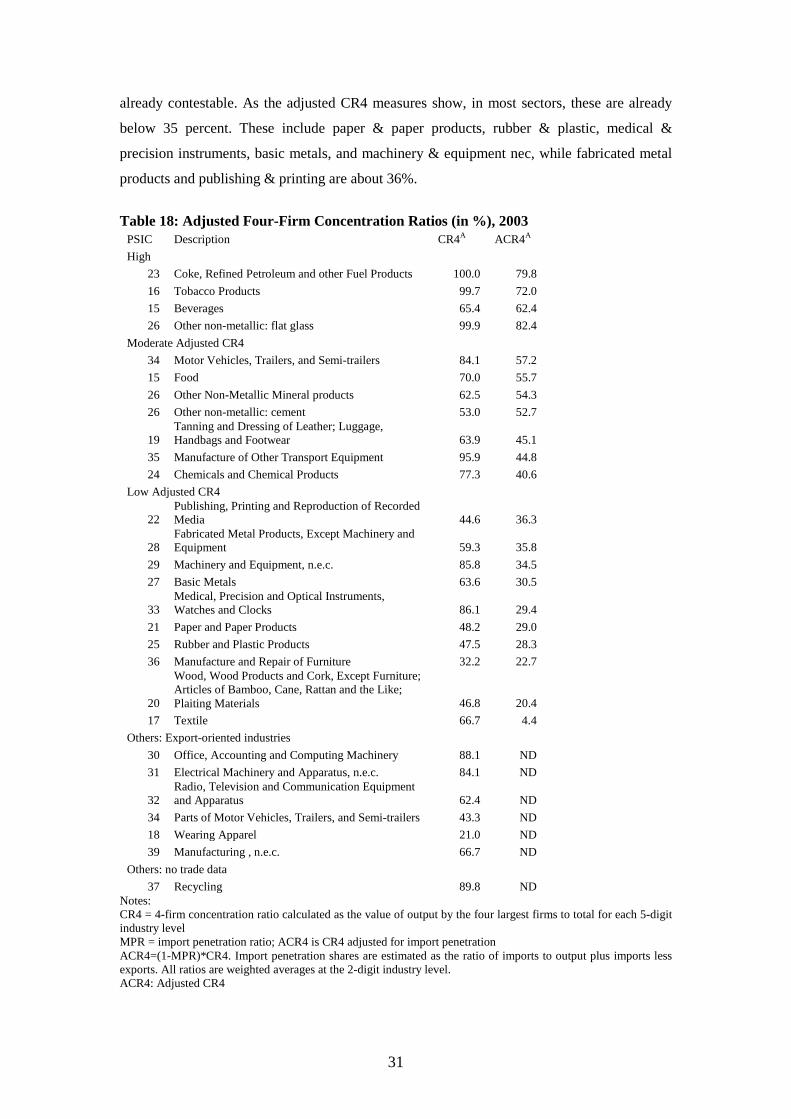
31
already contestable. As the adjusted CR4 measures show, in most sectors, these are already
below 35 percent. These include paper & paper products, rubber & plastic, medical &
precision instruments, basic metals, and machinery & equipment nec, while fabricated metal
products and publishing & printing are about 36%.
Table 18: Adjusted Four-Firm Concentration Ratios (in %), 2003
PSIC Description CR4A ACR4A High
23 Coke, Refined Petroleum and other Fuel Products 100.0 79.8 16 Tobacco Products 99.7 72.0 15 Beverages 65.4 62.4
26 Other non-metallic: flat glass 99.9 82.4 Moderate Adjusted CR4
34 Motor Vehicles, Trailers, and Semi-trailers 84.1 57.2 15 Food 70.0 55.7 26 Other Non-Metallic Mineral products 62.5 54.3
26 Other non-metallic: cement 53.0 52.7
19 Tanning and Dressing of Leather; Luggage, Handbags and Footwear 63.9 45.1
35 Manufacture of Other Transport Equipment 95.9 44.8 24 Chemicals and Chemical Products 77.3 40.6
Low Adjusted CR4
22 Publishing, Printing and Reproduction of Recorded Media 44.6 36.3
28 Fabricated Metal Products, Except Machinery and Equipment 59.3 35.8
29 Machinery and Equipment, n.e.c. 85.8 34.5 27 Basic Metals 63.6 30.5
33 Medical, Precision and Optical Instruments, Watches and Clocks 86.1 29.4
21 Paper and Paper Products 48.2 29.0 25 Rubber and Plastic Products 47.5 28.3 36 Manufacture and Repair of Furniture 32.2 22.7
20
Wood, Wood Products and Cork, Except Furniture; Articles of Bamboo, Cane, Rattan and the Like; Plaiting Materials 46.8 20.4
17 Textile 66.7 4.4 Others: Export-oriented industries
30 Office, Accounting and Computing Machinery 88.1 ND 31 Electrical Machinery and Apparatus, n.e.c. 84.1 ND
32 Radio, Television and Communication Equipment and Apparatus 62.4 ND
34 Parts of Motor Vehicles, Trailers, and Semi-trailers 43.3 ND 18 Wearing Apparel 21.0 ND 39 Manufacturing , n.e.c. 66.7 ND
Others: no trade data 37 Recycling 89.8 ND
Notes: CR4 = 4-firm concentration ratio calculated as the value of output by the four largest firms to total for each 5-digit industry level MPR = import penetration ratio; ACR4 is CR4 adjusted for import penetration ACR4=(1-MPR)*CR4. Import penetration shares are estimated as the ratio of imports to output plus imports less exports. All ratios are weighted averages at the 2-digit industry level. ACR4: Adjusted CR4
32
For chemicals & chemical products, adjusted CR4 is 41% while other transport
equipment is about 45%. For motor vehicles, non-metallic products, and food, CR4 is
moderately high ranging from 54% to 57%. For some sectors such as refined petroleum,
tobacco, and beverages, the adjusted concentration ratios still remain high ranging from 60 to
over 80%.
For office, accounting & computing machinery and electrical machinery & apparatus,
which both have high import penetration and export intensity ratios, the high unadjusted CR4
may not be a significant measure of industrial concentration. The same may hold for other
manufacturing products nec.
G. Size Structure
In 2006, micro enterprises dominated the economy accounting for 92% of the total
while small and medium enterprises (SMEs) accounted for only 7.04 % (Table 19).10 Since
2003, the total number of enterprises has fallen from 839,114 to 783,165 in 2006. In terms of
employment contribution, micro and large enterprises registered the same employment share
of 33% in 2006 while SMEs recorded a share of 34%.
Table 19: Total Number of Enterprises and Employees in the Philippines Number of Enterprises Year Micro % Small % Medium % Large % Total
1995 449950 91 39848 8 2712 1 2447 0.5 495057 2000 747740 91 67166 8 3070 0.4 2984 0.4 821060 2003 762573 91 69175 8 3521 0.4 3745 0.4 839114 2006 720191 92 57439 7 2839 0.4 2596 0.3 783165
Number of Employees Year Micro % Small % Medium % Large % Total
1995 1345175 31 945401 22 366890 8 1664076 39 4321603 2000 2165100 37 1522227 26 416686 7 1798173 30 5902256 2003 2214278 34 1556206 24 485891 8 2218419 34 6474860 2006 1667824 33 1279018 26 381013 8 1657028 33 4984950
Source: National Statistics Office
Within manufacturing, micro enterprises accounted for 89.5% of total establishments
while SMEs recorded a share of 9.7% (Table 20). Accounting for only 0.8% of total
enterprises, large firms contributed the highest share of employment at 53%. SMEs
contributed 28% and micro enterprises 19%. Medium size enterprises constitute a small share
not only of the SME sector but also of the overall manufacturing and total Philippine industry
structure, such that the country’s industrial structure has remained “hollow”. Lack of new 10 Micro enterprises have from 1-9 employees. Small enterprises are defined as having 10-99 employees; medium as having 100-199 employees; and large as having over 200 employees (The National Statistics Office and Small and Medium Enterprise Development Council Resolution No. 1, Series 2003).
33
medium-sized entrants may indicate that large incumbent firms do not face credible threat of
potential competition. The linkages of small and medium enterprises with large domestic and
multinational corporations has remained weak; hence growth experienced by large enterprises
has failed to spillover to the SME sector. Compared with large enterprises, SMEs continue to
face growth and market entry difficulties due to underdeveloped financial markets, overly
complex administrative arrangements, and poor infrastructure. Subdued SME performance
has not generated sufficient manufacturing value added and employment to increase market
contestability and improve the country’s industrial structure.
Table 20: Manufacturing Total Number of Enterprises and Employees
Number of Enterprises Year Micro % Small % Medium % Large % Total 1995 86900 88.8 8928 9.1 1027 1.0 982 1.0 97837 2000 108998 86.9 14121 11.3 1110 0.9 1238 1.0 125467 2003 107398 88.6 11910 9.8 853 0.7 1024 0.8 121184 2006 105083 89.5 10274 8.8 1004 0.9 985 0.8 117346
Number of Employees
Year Micro % Small % Medium % Large % Total 1995 271699 22.0 227949 18.0 137384 11.0 615874 49 1252906 2000 354025 22.0 354328 22.0 150734 9.0 730127 46 1589214 2003 360576 25.0 285027 19.0 118896 8.0 698173 48 1462672 2006 259664 18.9 252931 18.4 132332 9.6 727984 53 1372911
Source: National Statistics Office
H. Foreign Direct Investment
Figure 8 presents the inward FDI flows in the Philippines from the 1970s to 2011.
FDI inflows from the 1970s to the 1980s were small and erratic, due mainly to the political
and economic instability that characterized the country in these decades. As a result, it failed
to take advantage of the rapid growth of Japanese FDI in the mid-1980s following the 1985
Plaza Accord. In the 1990s, overall FDI inflows improved substantially as well as in the
2000s. However, competition has become much fiercer especially given China’s growing
share. FDI as percentage of gross domestic product (GDP) reached 3% in 2000, and about 2%
in 2007, however, the ratio dropped to 0.9% in 2008 primarily due to the global economic
crisis. Note also that gross domestic investment as a percentage of GDP has been low and
declining from 25% in 1997 to 14% in 2009. The average for the Philippines for the period
2000-2009 was about 16.5%. Compared with other countries, it has lagged significantly
behind Indonesia (with an average of 25% during the same period), Korea (30%), Malaysia
(22%), and Thailand (26%).11
11 Table 1.9: Gross Domestic Investment as Percentage of GDP in Aldaba et al (2010).
34
Figure 8: FDI Performance
Source: World Development Indicators and UNCTAD Statistics.
Table 21 presents a sectoral breakdown of FDI12 or non-residents’ total equity for
periods 1980-1989, 1990-1999, 2000-2009 as well as 2010 and 2011. It can be seen that
manufacturing FDI dominated total inflows with its share of 45 percent during the 1980s and
50 percent in the 1990s. However, its share dropped to 38 percent in the 2000s while in 2010
where total foreign equity is negative, much of it was from the manufacturing sector.
The share of the financial sector rose from 8 percent in the 1980s to 16 percent in the
1990s but declined to about 10 percent in 2000-2009. Transport, storage and communication
sector also witnessed an increase in its share from 1 percent to 12 percent between the 1980s
and the 1990s, but this declined to an average of around 10 percent in the current period. The
share of mining and quarrying was reduced from 32 percent in the 1980s to 6 percent in the
1990s. This further went down to 4 percent during the 2000s. Wholesale and retail witnessed
a slight increase in share from 3 percent to 4 percent between the 1980s and the 1990s, but
this was reduced to roughly 2 percent in the 2000s.
Table 21: Net FDI by Sector, average percentage share to total, 1980 – 2011 Industry 1980-89 1990-99 2000-09 2010 2011 Manufacturing 44.7 50.1 38.2 311.6 20.0 Mining and quarrying 32.4 5.7 4.3 -68.9 -47.0 Financial intermediation 8.1 15.5 9.5 -14.6 41.4 Trade/commerce 2.9 3.9 1.6 -7.9 6.0 Real estate and business services 7.6 8.7 26.6 -71.8 25.8 Transport, storage and communications 1.1 11.9 6.3 -26.0 51.4 Construction 0.5 3.0 1.4 0.4 5.5 Electricity, gas and water
11.8 3.6 -4.4
Source of basic data: Bangko Sentral ng Pilipinas. (Note that this does not include “Others not elsewhere classified” which could not be broken down by sector).
12 The total FDI does not include “Others, Not Elsewhere Specified” defined as non-residents’ equity capital investments in non-banks sourced from the cross-border transactions survey and in local banks, no sectoral breakdown is available.
-1
0
1
2
3
4
0 500
1,000 1,500 2,000 2,500 3,000 3,500
1975
1977
1979
1981
1983
1985
1987
1989
1991
1993
1995
1997
1999
2001
2003
2005
2007
2009
2011
FDI Inflows (US$ Million) FDI/GDP (%)
35
Electricity, gas and water registered a share of 10 percent in the most recent period.
Construction share also rose from less than 1 percent in the 1980s to 3 percent during the
1990s and 2 percent on the average in the 2000s. Real estate, renting and business services’
share went up from 8 percent in the 1980s to 9 percent in the 1990s and to 18 percent in the
2000s.
Figure 9: Distribution of Manufacturing FDI (in %)
Source of basic data: Bangko Sentral ng Pilipinas (BSP)
Within manufacturing, FDI inflows have been dominated by the food and beverage
sector increasing substantially from a share of 27 percent in the 1990s to 57 percent during
the 2000-2009 period (see Figure 9). The share of basic metals and chemical products which
dominated manufacturing in the 1980s fell from 47 percent to 14 percent in the 1990s to 11
percent in the 2000s. The share of coke, refined petroleum, and other fuel products rose from
7 percent in the 1980s to 20 percent in the 1990s but this dropped to only 7 percent in the
2000s. Similarly; FDI inflows in machinery, apparatus and supplies and radio, tv, and
communications equipment increased from zero to 21 percent between the 1980s and the
1990s but this dropped to 12 percent in the 2000s. There is also a decline in the share of
transport equipment and motor vehicles from 10 percent in the 1980s to 6 percent in the
1990s to 3 percent in the 2000s.
Up to the 1980s, the US was the country’s largest source of FDI inflows with a
cumulative share of 60 percent (see Figure 10). However, this dropped significantly to only
15 percent in the 1990s but increased to 17 percent in the 2000s. US dominance has been
substantially diluted by the increasing presence of Japan, UK, and Singapore. Japan’s share
increased from 15 percent in the 1980s to 27 percent in the 1990s, although this fell to 17
percent in the 2000s. Singapore increased its share from less than one percent during the
1980s to four percent in the 1990s and to 9 percent in the recent period. The share of the
Netherlands rose from six percent to 11 percent, but declined to just 2.5 percent in 2000-2008.
In addition, during 2009 to 2011, Netherlands had negative inflows to the country. The share
010203040506070
1980-89 1990-99 2000-2009
Basic Metals & Chemicals
Coke, Refined Petroleum and Other Fuel Products
Food Products and Beverages
Transport & Motor vehicles
Mach, App, Suppl.& Radio, TV & Communications eqipment
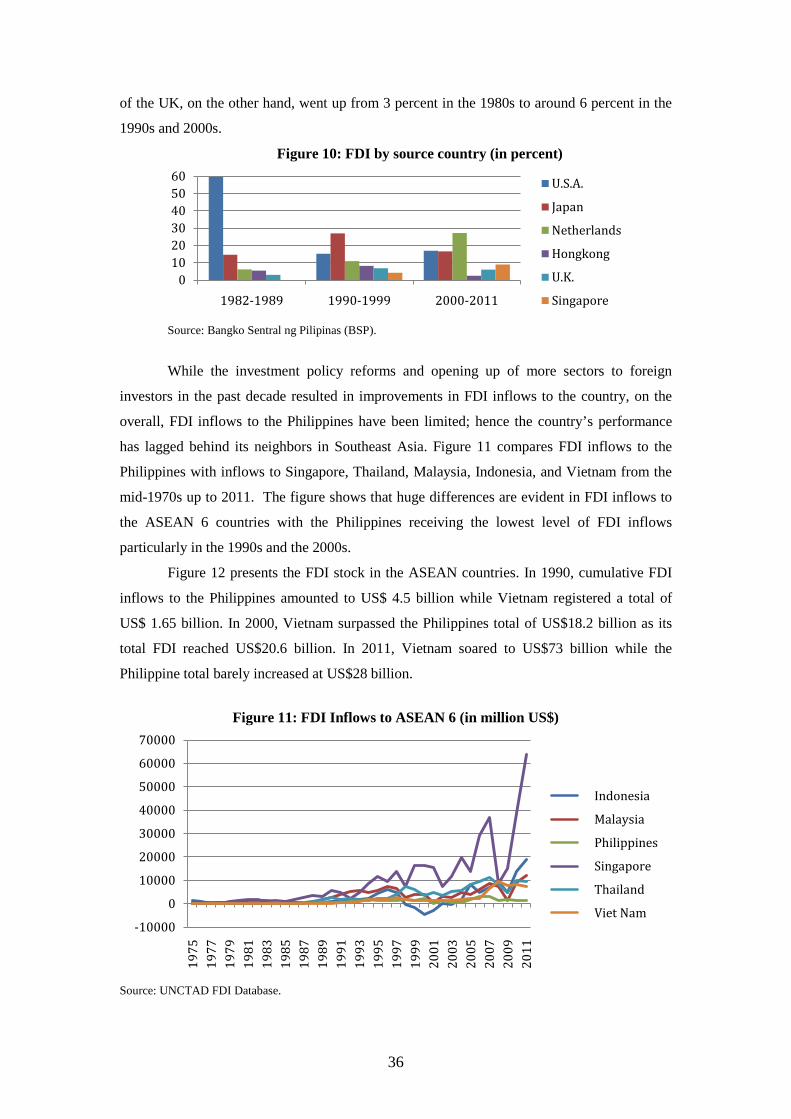
36
of the UK, on the other hand, went up from 3 percent in the 1980s to around 6 percent in the
1990s and 2000s.
Figure 10: FDI by source country (in percent)
Source: Bangko Sentral ng Pilipinas (BSP).
While the investment policy reforms and opening up of more sectors to foreign
investors in the past decade resulted in improvements in FDI inflows to the country, on the
overall, FDI inflows to the Philippines have been limited; hence the country’s performance
has lagged behind its neighbors in Southeast Asia. Figure 11 compares FDI inflows to the
Philippines with inflows to Singapore, Thailand, Malaysia, Indonesia, and Vietnam from the
mid-1970s up to 2011. The figure shows that huge differences are evident in FDI inflows to
the ASEAN 6 countries with the Philippines receiving the lowest level of FDI inflows
particularly in the 1990s and the 2000s.
Figure 12 presents the FDI stock in the ASEAN countries. In 1990, cumulative FDI
inflows to the Philippines amounted to US$ 4.5 billion while Vietnam registered a total of
US$ 1.65 billion. In 2000, Vietnam surpassed the Philippines total of US$18.2 billion as its
total FDI reached US$20.6 billion. In 2011, Vietnam soared to US$73 billion while the
Philippine total barely increased at US$28 billion.
Figure 11: FDI Inflows to ASEAN 6 (in million US$)
Source: UNCTAD FDI Database.
0102030405060
1982-1989 1990-1999 2000-2011
U.S.A.
Japan
Netherlands
Hongkong
U.K.
Singapore
-10000
0
10000
20000
30000
40000
50000
60000
70000
1975
1977
1979
1981
1983
1985
1987
1989
1991
1993
1995
1997
1999
2001
2003
2005
2007
2009
2011
Indonesia
Malaysia
Philippines
Singapore
Thailand
Viet Nam
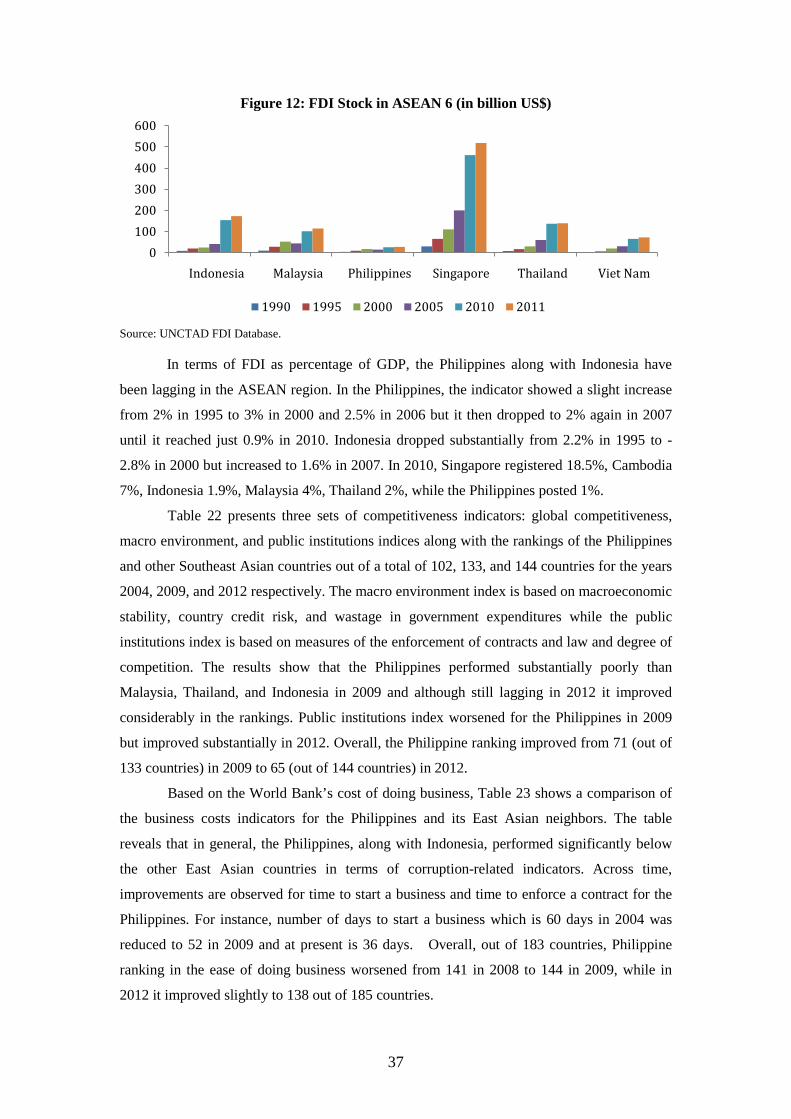
37
Figure 12: FDI Stock in ASEAN 6 (in billion US$)
Source: UNCTAD FDI Database. In terms of FDI as percentage of GDP, the Philippines along with Indonesia have
been lagging in the ASEAN region. In the Philippines, the indicator showed a slight increase
from 2% in 1995 to 3% in 2000 and 2.5% in 2006 but it then dropped to 2% again in 2007
until it reached just 0.9% in 2010. Indonesia dropped substantially from 2.2% in 1995 to -
2.8% in 2000 but increased to 1.6% in 2007. In 2010, Singapore registered 18.5%, Cambodia
7%, Indonesia 1.9%, Malaysia 4%, Thailand 2%, while the Philippines posted 1%.
Table 22 presents three sets of competitiveness indicators: global competitiveness,
macro environment, and public institutions indices along with the rankings of the Philippines
and other Southeast Asian countries out of a total of 102, 133, and 144 countries for the years
2004, 2009, and 2012 respectively. The macro environment index is based on macroeconomic
stability, country credit risk, and wastage in government expenditures while the public
institutions index is based on measures of the enforcement of contracts and law and degree of
competition. The results show that the Philippines performed substantially poorly than
Malaysia, Thailand, and Indonesia in 2009 and although still lagging in 2012 it improved
considerably in the rankings. Public institutions index worsened for the Philippines in 2009
but improved substantially in 2012. Overall, the Philippine ranking improved from 71 (out of
133 countries) in 2009 to 65 (out of 144 countries) in 2012.
Based on the World Bank’s cost of doing business, Table 23 shows a comparison of
the business costs indicators for the Philippines and its East Asian neighbors. The table
reveals that in general, the Philippines, along with Indonesia, performed significantly below
the other East Asian countries in terms of corruption-related indicators. Across time,
improvements are observed for time to start a business and time to enforce a contract for the
Philippines. For instance, number of days to start a business which is 60 days in 2004 was
reduced to 52 in 2009 and at present is 36 days. Overall, out of 183 countries, Philippine
ranking in the ease of doing business worsened from 141 in 2008 to 144 in 2009, while in
2012 it improved slightly to 138 out of 185 countries.
0100200300400500600
Indonesia Malaysia Philippines Singapore Thailand Viet Nam
1990 1995 2000 2005 2010 2011
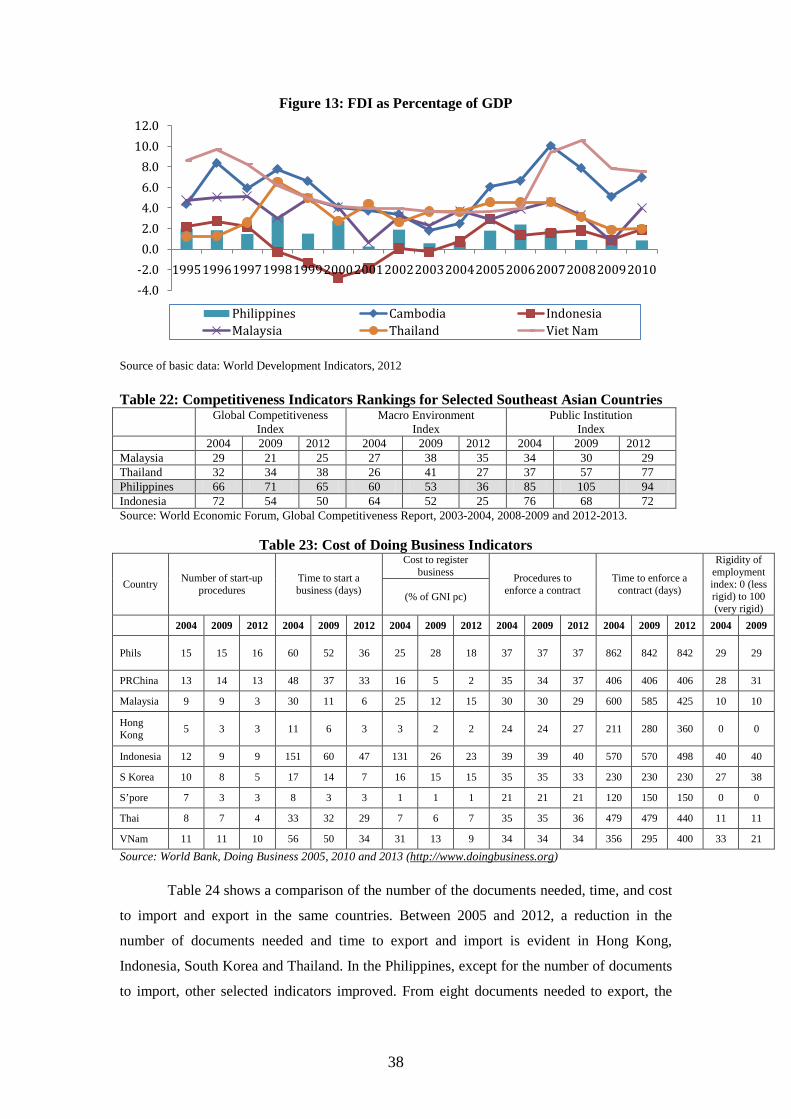
38
Figure 13: FDI as Percentage of GDP
Source of basic data: World Development Indicators, 2012 Table 22: Competitiveness Indicators Rankings for Selected Southeast Asian Countries
Global Competitiveness Index
Macro Environment Index
Public Institution Index
2004 2009 2012 2004 2009 2012 2004 2009 2012 Malaysia 29 21 25 27 38 35 34 30 29 Thailand 32 34 38 26 41 27 37 57 77 Philippines 66 71 65 60 53 36 85 105 94 Indonesia 72 54 50 64 52 25 76 68 72 Source: World Economic Forum, Global Competitiveness Report, 2003-2004, 2008-2009 and 2012-2013.
Table 23: Cost of Doing Business Indicators
Country Number of start-up procedures
Time to start a business (days)
Cost to register business Procedures to
enforce a contract Time to enforce a
contract (days)
Rigidity of employment index: 0 (less rigid) to 100 (very rigid)
(% of GNI pc)
2004 2009 2012 2004 2009 2012 2004 2009 2012 2004 2009 2012 2004 2009 2012 2004 2009
Phils 15 15 16 60 52 36 25 28 18 37 37 37 862 842 842 29 29
PRChina 13 14 13 48 37 33 16 5 2 35 34 37 406 406 406 28 31
Malaysia 9 9 3 30 11 6 25 12 15 30 30 29 600 585 425 10 10
Hong Kong 5 3 3 11 6 3 3 2 2 24 24 27 211 280 360 0 0
Indonesia 12 9 9 151 60 47 131 26 23 39 39 40 570 570 498 40 40
S Korea 10 8 5 17 14 7 16 15 15 35 35 33 230 230 230 27 38
S’pore 7 3 3 8 3 3 1 1 1 21 21 21 120 150 150 0 0
Thai 8 7 4 33 32 29 7 6 7 35 35 36 479 479 440 11 11
VNam 11 11 10 56 50 34 31 13 9 34 34 34 356 295 400 33 21
Source: World Bank, Doing Business 2005, 2010 and 2013 (http://www.doingbusiness.org)
Table 24 shows a comparison of the number of the documents needed, time, and cost
to import and export in the same countries. Between 2005 and 2012, a reduction in the
number of documents needed and time to export and import is evident in Hong Kong,
Indonesia, South Korea and Thailand. In the Philippines, except for the number of documents
to import, other selected indicators improved. From eight documents needed to export, the
-4.0-2.00.02.04.06.08.0
10.012.0
1995199619971998199920002001200220032004200520062007200820092010
Philippines Cambodia IndonesiaMalaysia Thailand Viet Nam
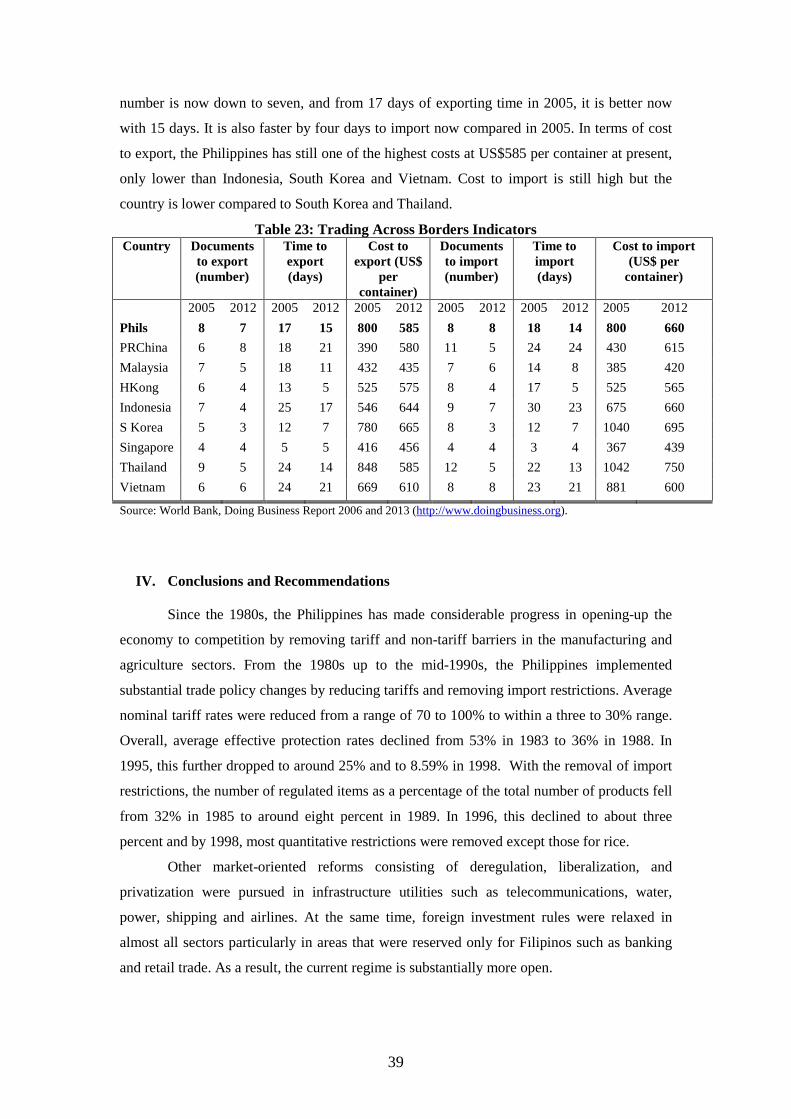
39
number is now down to seven, and from 17 days of exporting time in 2005, it is better now
with 15 days. It is also faster by four days to import now compared in 2005. In terms of cost
to export, the Philippines has still one of the highest costs at US$585 per container at present,
only lower than Indonesia, South Korea and Vietnam. Cost to import is still high but the
country is lower compared to South Korea and Thailand.
Table 23: Trading Across Borders Indicators Country Documents
to export (number)
Time to export (days)
Cost to export (US$
per container)
Documents to import (number)
Time to import (days)
Cost to import (US$ per
container)
2005 2012 2005 2012 2005 2012 2005 2012 2005 2012 2005 2012 Phils 8 7 17 15 800 585 8 8 18 14 800 660 PRChina 6 8 18 21 390 580 11 5 24 24 430 615 Malaysia 7 5 18 11 432 435 7 6 14 8 385 420 HKong 6 4 13 5 525 575 8 4 17 5 525 565 Indonesia 7 4 25 17 546 644 9 7 30 23 675 660 S Korea 5 3 12 7 780 665 8 3 12 7 1040 695 Singapore 4 4 5 5 416 456 4 4 3 4 367 439 Thailand 9 5 24 14 848 585 12 5 22 13 1042 750 Vietnam 6 6 24 21 669 610 8 8 23 21 881 600
Source: World Bank, Doing Business Report 2006 and 2013 (http://www.doingbusiness.org).
IV. Conclusions and Recommendations Since the 1980s, the Philippines has made considerable progress in opening-up the
economy to competition by removing tariff and non-tariff barriers in the manufacturing and
agriculture sectors. From the 1980s up to the mid-1990s, the Philippines implemented
substantial trade policy changes by reducing tariffs and removing import restrictions. Average
nominal tariff rates were reduced from a range of 70 to 100% to within a three to 30% range.
Overall, average effective protection rates declined from 53% in 1983 to 36% in 1988. In
1995, this further dropped to around 25% and to 8.59% in 1998. With the removal of import
restrictions, the number of regulated items as a percentage of the total number of products fell
from 32% in 1985 to around eight percent in 1989. In 1996, this declined to about three
percent and by 1998, most quantitative restrictions were removed except those for rice.
Other market-oriented reforms consisting of deregulation, liberalization, and
privatization were pursued in infrastructure utilities such as telecommunications, water,
power, shipping and airlines. At the same time, foreign investment rules were relaxed in
almost all sectors particularly in areas that were reserved only for Filipinos such as banking
and retail trade. As a result, the current regime is substantially more open.
40
In the literature, there are three main channels through which trade liberalization
affects a country’s economic performance. First, there are static gains arising from trade
liberalization as resource allocation improves within and across industries. Second, there are
dynamic gains through technical change, learning, and growth that leads to improved
productivity growth. Third, there are competitive effects arising from domestic competition.
Despite the breadth and depth of market-oriented reforms, the impact on the growth,
employment, investment, and productivity has been limited. The performance of the overall
manufacturing industry has been weak. From the 1980s up to the early 20s, manufacturing
growth was very slow; growing on the average by 0.9 percent in the 1980s, by 2.5 percent in
the 1990s, and by 3.5 percent in the early 20s. Its share to total industrial output remained
unchanged during the same periods; it accounted for 28 percent of total output in the 1970s,
26 percent in the 1980s, and 24 percent in the 1990s. In terms of employment generation, the
industry failed in creating enough employment to absorb new entrants to the labor force as its
share to total employment dropped from 11.3 percent in the mid-1970s to 9.7 percent in the
2001-2003 period. The industry’s total factor productivity growth was negative from 1996 to
2006.
As percentage of gross domestic product (GDP), FDI inflows increased from an
average of 0.51% of GDP in the seventies to 0.9% in the eighties and to 1.8 percent of GDP
during the nineties. In the current period, FDI inflows represented an average of 1.6 percent
from 2000 to 2008. The Philippines has lagged behind its neighbors in terms of FDI
performance. FDI data show huge differences in FDI inflows to the ASEAN countries with
the Philippines receiving the lowest level of FDI inflows particularly in the 1990s and the
2000s.
Studies on Philippine economic development have extensively discussed the
constraints to growth, investment, and employment generation in the country (World Bank,
2007; ADB, 2007). The most important ones include tight fiscal condition due to huge fiscal
deficits, lack of infrastructure, and weak investor confidence arising from governance issues
like corruption and political instability.
The shift from a highly protected and highly distorted economic regime towards a
more market-oriented has not been a smooth one for the Philippine economy. Trade
liberalization in the manufacturing industry has been a long and tedious process with many
stops and starts due to the policy reversals that took place. The more than two decades of
trade liberalization have not yet led to rapid industrial growth. Medalla (2002) attributed the
lackluster performance to the adjustment and restructuring process that the manufacturing
industry is still undergoing. She noted that new investments are only starting to be made in
the more recent years. This delayed response may be due to the failure of the government to
implement necessary complementary measures particularly with respect to the exchange rate.
41
The prolonged peso appreciation inhibited much of the potential growth from a more open
economy.
The industrial structure has remained “hollow” or “missing” in the middle and
medium enterprises have never seriously challenged the large entrenched incumbents. The
linkages between SMEs and large enterprises have also remained weak. SMEs have continued
to face competitiveness problems along with difficulties in finance and market access. Trade
indicators show the heavy concentration of Philippine exports on three major products
groups: electronics, garments and textiles and auto parts. Within these major product groups,
exports are highly concentrated in low value added and labor-intensive products sectors.
Our experience has shown that trade liberalization does not automatically lead to a
competitive domestic market economy. Imports are effective in disciplining domestic
manufacturing firms and to sustain the competitive gains derived from the presence of
imports, the government has an important role to play particularly in creating and maintaining
a competitive environment. The government needs to coordinate policies to implement
continued liberalization and deregulation policies in tandem with necessary support measures
that will address the obstacles to the entry, exit and growth of domestic firms, particularly
small and medium enterprises. Note that policy reversals can substantially reduce the
credibility of reforms since reversals can foster rent-seeking behavior and dampen firms’
incentives to become efficient. To achieve this, well-functioning institutions and regulatory
agencies are necessary.
Competition can be lessened significantly by government regulatory policies,
behavioral restraints and structural characteristics of the market that can act as barriers to
entry (see WB-OECD, 1999)13. It is important to point out that the strength of competition is
a function not only of the regulatory policies, behavior of firms, and structural barriers but
also of the external environment within which firms compete. This includes the state of
transport and communication, framework of laws and regulations, effectiveness of the
financial system in matching investment resources with entrepreneurial opportunities, as well
as information available to consumers. Carlin and Seabright (2000) call this external
environment “competitive infrastructure” referring to both physical and institutional
infrastructure. When this “competitive infrastructure” is inadequate, competition becomes
weak.
13 Regulatory barriers are barriers imposed by government policies including investment licensing, tariff and non-tariff measures, antidumping and countervailing duties along with safeguard measures, special permits, license to operate, regulations influencing the use of some inputs, discriminatory export practices, exclusionary lists, and ownership restrictions. Behavioral barriers are associated with abuse of dominant position where “relatively large” firms engage in anti-competitive conduct by preventing entry or forcing exit of competitors through various kinds of monopolistic conduct including predatory pricing and market foreclosure. Structural barriers are due solely to conditions outside the control of market participants. Economies of scale (increasing returns to scale) is an example of a structural barrier.
42
Good infrastructure and efficient institutions are necessary to support the new
economic environment arising from trade reforms. To effectively benefit from these reforms,
it should substantially increase investment spending and strengthen its weak institutional and
regulatory environment. Many complementary policies and institutions that are necessary to
support the reforms and generate supply-side responses leading to employment and growth
are missing. If market reforms are to have their intended effects, “behind the border”
complementary policies that define the business environment must be addressed including
investment in human capital, infrastructure, the quality of governance in the country, improve
the investment climate, and boost the country’s competitiveness to enable us to catch up with
our neighbors. The Aquino government should make full use of its popularity and wide
support from broad sectors in society to carry out these badly needed institutional and
regulatory reforms together with huge infrastructure spending.
For the manufacturing industry, there is a need to strengthen the domestic parts and
suppliers sector, particularly small and medium enterprises, and deepen their linkage with
domestic large enterprises and multinational companies. Equally important is for
manufacturing industries particularly electronics to move up the value chain and diversify the
export base. To achieve these, there is a need for strategic industrial policy and carefully
designed subsidies that would target improvement of firm level competitiveness such as
innovation and research and development activities and human resource development. Apart
from diversifying our export base, we also need to diversify our FDI partners. Strong
investment promotion should be carried out particularly in countries such as South Korea and
Taiwan.
References: Aldaba, R. 2010. “Micro Study: Does Trade Protection Improve Firm Productivity? Evidence from the
Philippines. Paper submitted to Economic Research Institute for ASEAN and East Asia, Jakarta. http://www.eria.org/pdf/research/y2009/no2/CH05_Micro-Data.pdf
Aldaba, Rafaelita M. 2005. “Impact of market reforms on competition, structure, and performance of
the Philippine economy”, PIDS Discussion Paper 2005-24, Philippine Institute for Development Studies, Makati City. Also in www.worldbank.org.ph/productivity.
Aldaba, R., Dorothea Lazaro, Erlinda Medalla, and Gilbert Llanto. 2010. “ERIA Study to Further
Improve the ASEAN Economic Community Scorecard: the Philippines”. Paper submitted to Economic Research Institute for ASEAN and East Asia, Jakarta.
Asian Development Bank. 2007. “Country Diagnostics Studies Highlights Philippines Critical
Development Constraints” Mandaluyong City, Philippines. Bautista, R., J. Power and Associates. 1979. Industrial Promotion Policies in the Philippines. Makati
City: Philippine Institute for Development Studies. Research Paper Series No. 94-03. Makati City: Philippine Institute for Development Studies.
Carlin, W. & P. Seabright. 2000. “The importance of competition in developing countries for
productivity and innovation”, background paper for the World Development Report.
43
Dueñas-Caparas, M. 2007. Firm-Level Determinants of Export Performance: Evidence from the
Philippines. Philippine Journal of Development 62, 1st Semester 2007(XXXIV-1): 1–26. Herrin, A.N. and E.M. Pernia. 2003. Population, human resources, and employment. In The Philippine
economy: development, policies and challenges, edited by A. Balisacan and H. Hill. New York: Oxford University Press.
Hoekman, B. 2006. Liberalizing Trade in Services: A Survey. World Bank Policy Research Working
Paper 4030. The World Bank. Washington DC, US. Manasan, Rosario and Virginia Pineda. 1999. “Assessment of Philippine Tariff Reform: 1998 Update.”
AGILE Program Study Report. Medalla, E. 2002. Trade and Industrial Policy Beyond 2000: An Assessment of the Philippine
Economy. Chapter 5 in Yap, J., ed. The Philippines Beyond 2000: An Economic Assessment. Makati City: Philippine Institute for Development Studies
World Bank. 2007. “Philippines invigorating growth, enhancing its impact”, Report No. 39226-PH,
PREM Unit East Asia and Pacific Region. World Bank and the Organisation for Economic Cooperation and Development (OECD). 1998. A
Framework for the Design and Implementation of Competition Law and Policy