Embed Size (px)
Citation preview

STRENGTHENING AREA-BASED CONSERVATION TO SUPPORT BIODIVERSITY
AND PEOPLE’S WELLBEING: A PERSPECTIVE FROM TROPICAL REGIONS
Tesis entregada a la Pontificia Universidad Católica de Chile en cumplimiento parcial de
los requisitos para optar al Grado de Doctor en Ciencias con mención en Ecología
Por
JANETH DEL CARMEN LESSMANN ESCALONA
Director:
Dr. Pablo Marquet
Junio 2021

2
Acknowledgements
First and foremost, I want to thank my supervisor Dr Pablo Marquet for his incredible
support, supervision, and guidance at every stage of my PhD study. I am also grateful for
his many inspiring discussions on science, for introducing me to exceptional working
groups in conservation, and for always encouraging me to pursue my research interests.
I could not have achieved this without the support of Dr Jonas Geldmann, who has been
deeply involved in this research. I appreciate his kindness, enthusiasm, guidance, and
commitment throughout these years.
I also want to thank Dr Javier Fajardo. His expertise, patient, encouragement, and
unwavering support were crucial to complete this research work.
I am deeply grateful to my committee members, Dr Javier Simonetti, Dr Patricio Pliscoff,
and Dr María Fernanda Pérez, for encouraging me to step out of my comfort zone and
enriching this investigation with their suggestions. I extend my gratitude to Dr Elisa
Bonaccorso, Aaron Brunner, Dr Andrew Balmford, Dr William Sutherland, and Dr Tatsuya
Amano, who provided valuable insights into this thesis.
I want to thank my colleagues in the PhD program and lab mates for their companionship
and support. I also thank María Teresa Pino, Elizabeth Ly Valenzuela, Diego Bustamante,
and Daniela Mora, who were always there to assist us throughout these years.
Finally, I am very grateful to my parents, sisters, and friends, who always have encouraged
me to pursue my goals.
This work is funded by Programa Capital Humano Avanzado from CONICYT (21150159).

3
Table of Contents
Resumen ............................................................................................................................... 11
Abstract ................................................................................................................................. 13
Introduction .......................................................................................................................... 15
Chapter 1 - Does money matter? The role of funding in the performance of Latin American
protected areas ...................................................................................................................... 21
Abstract ............................................................................................................................. 21
1. Introduction ................................................................................................................... 22
2. Methods ........................................................................................................................ 25
3. Results ........................................................................................................................... 31
4. Discussion ..................................................................................................................... 36
5. Appendices .................................................................................................................... 39
6. References ..................................................................................................................... 39
Chapter 2 - Cost-effective protection of biodiversity in the western Amazon ..................... 45
Abstract ............................................................................................................................. 45
1. Introduction ................................................................................................................... 46
2. Methods ........................................................................................................................ 49
3. Results ........................................................................................................................... 58
4. Discussion ..................................................................................................................... 65
5. Conclusions ................................................................................................................... 70
6. Appendices .................................................................................................................... 71
Chapter 3 - Protected areas for positive futures for nature and people in the Andes ........... 79
Abstract ............................................................................................................................. 79
1. Introduction ................................................................................................................... 80
2. Conservation gaps in the Andean protected areas ........................................................ 85
3. Challenges of expanding protected areas in the Andes ................................................ 90
4. Opportunities for expanding the protected areas in the Andes ..................................... 93

4
5. Conclusions ................................................................................................................. 101
6. Methods ...................................................................................................................... 102
7. Supplementary Information ........................................................................................ 104
8. References ................................................................................................................... 104
Chapter 4 - Large-scale deforestation poses a threat to the world’s cultural diversity ...... 114
Abstract ........................................................................................................................... 114
1. Introduction ................................................................................................................. 115
2. Impacts of large-scale forest loss and degradation on cultural systems ..................... 120
3. Cultural diversity exposed to 21st-century deforestation in the tropics ..................... 129
4. Halting the impact of deforestation on cultural diversity ........................................... 134
5. Conclusions ................................................................................................................. 139
6. Methods ...................................................................................................................... 140
7. Appendices .................................................................................................................. 146
8. References ................................................................................................................... 146
General Discussion ............................................................................................................. 163
Conclusions ........................................................................................................................ 176
References .......................................................................................................................... 180
Appendices – Chapter 1 ...................................................................................................... 187
Appendices – Chapter 2 ...................................................................................................... 213
Appendices – Chapter 3 ...................................................................................................... 226
Appendices – Chapter 3 ...................................................................................................... 232

5
List of Tables
Table 1.1.Explanatory variables tested in the models of PA impact and PA funding
deficits. We analyze the response variables at two administration levels: PA level within
Ecuador and PA-system level for Latin American countries. Justification for the selection
of explanatory variables and their description is given in Supporting Information. ............ 30
Table 1.2. Summary of the most parsimonious model for explaining (a) the impact of
PAs within Ecuador, (b) the impact of PA systems among Latin American countries, (c)
funding deficits of PAs within Ecuador, and (d) funding deficits of PA systems of Latin
America. This table presents the modeling results for the variable of impact transformed
as “permitted deforestation” (i.e., one minus impact). Therefore, an explanatory variable
with a positive estimate indicates an increase in PA ineffectiveness. 2nd order
polynomials are indicated by superscript. Significance of regression coefficients: *** p <
0.001, ** p < 0.01, * p < 0.05 ............................................................................................. 34
Table 2.1. Predictor variables for management cost models of protected areas in the western
Amazon. Location variables reflect the geography characteristics and anthropogenic
pressures of the protected areas. Information on these variables were obtained from the
sources specified in the Supplementary Information. .......................................................... 53
Table 2.2. Best regression models for protected-area management cost per year and unit
area (in log scale) for the western Amazon. The General Model was built with all predictor
variables, whereas the Context Model used only evaluated variables related to the location
of the protected areas. ........................................................................................................... 59
Table 2.3. Conservation costs of priority-area networks in the western Amazon identified
under different scenarios. Annual costs for an effective management were estimated from
the General Model, whereas opportunity costs correspond to adapted profits from
agriculture. * LCL: Lower Control Limit; UPL: Upper Control Limit (UCL). ................... 63

6
List of Figures
Figure 1.1. Study area. We evaluated the impact in avoiding deforestation of (a) 27 PAs
within Ecuador and (b) national PA systems of 17 Latin American countries. ................ 25
Figure 1.2. Impact of PAs in avoiding deforestation. This impact metric shows how far PAs
have changed baseline deforestation rates (i.e., in matched control sites). Results are
expressed as percentages for (a) individual PAs of Ecuador (2003-2010) and (b) national
PA systems in Latin American countries (2000-2010). Negative impact values (red)
indicate PAs with higher deforestation rates than in matched unprotected sites, while
positive values (green) correspond to PAs that managed to reduce baseline deforestation. 33
Figure 1.3. Marginal effects plots for the most parsimonious models (according to AICc).
Models explain the variation in the impact in avoiding deforestation for (a) individual PAs
of Ecuador and (b) national PA systems of Latin American countries. Additional models
were built to explore the factors behind the levels of funding deficits for (c) individual PAs
of Ecuador and (d) national PA systems of Latin America. Each plot shows the relationship
between the response variable and the indicated explanatory variable while adjusting for
interference from other explanatory variables. Grey shadows are 95% confidence intervals.
.............................................................................................................................................. 35
Figure 2.1. Western Amazon (Colombia, Ecuador and Peru). Amazonian protected areas
with estimates of costs for effective management are highlighted in red, whereas those
protected areas without available economic estimates are cleared. ...................................... 50
Figure 2.2. Maps of potential conservation costs of protected areas in the western Amazon.
(A) Annual costs per-area for an effective management based on the location attributes of
protected areas. (B) Opportunity cost is the result of combining information on the net
profits of crops and livestock, with the likelihood of land conversion................................. 60
Figure 2.3. Priority-area networks identified under different scenarios. (A) Cost-optimized
priority areas, (B) priority areas when considering uniform costs, (C) priority areas when
excluding indigenous lands from the selection, and (D) priority areas when assuming non-
international collaboration among the western Amazon countries. ..................................... 62

7
Figure 2.4. Efficiency on investment of the priority areas identified in the western Amazon.
For the cost-optimized prioritization, we calculated the efficiency of each priority area as its
contribution to achieve species conservation targets divided by its total cost. The 20 most
efficient areas (green) are those that contribute more to achieve the targets at lower costs. 64
Figure 3.1. Protected areas in the Andes. (A) The Andes limits, according to Körner et al.
18. Andean countries have built an extensive network of protected areas with diverse
governance (National, Regional, Municipal or Private). (B) Percentage of the Andes
covered by protected areas according to the governance type and country, and (C)
according to IUCN categories of management objectives (blue: categories that imply strict
protection of resources, green: categories that allow multiple uses of resources). .............. 81
Figure 3.2. Studies on spatial conservation planning in the Andes that focus on biodiversity
and/or NCPs features. (A) Number of studies (from 2009 to 2019) that directly analyze
different features of biodiversity (n = 43) or one of the 18 general categories of NCPs (n =
7). (B) Number of the studies focusing on biodiversity or NCPs by country. One study can
assess more than one feature and country. ........................................................................... 89
Figure 3.3. Configuration of ecoregions and species geographic range in the Andes. (A)
Ecoregions in the Andes 104 (shown in an orange scale of colors), which are oriented
predominantly north-south. (B) Maximum north-south and east-west dimensions of the
geographic ranges of 131 mammal endemic species in the Andes 105. Geographic ranges of
equal dimensions would fall on the diagonal line 106. Andean species tend to exhibit a great
altitudinal replacement and narrow ranges oriented north-south (above the diagonal), since
major climatic belts and biome types that influence species distribution also run north-
south. Given this species configuration, improving biodiversity protection in the Andes
requires establishing multiple conservation areas of small sizes distributed along the
altitudinal gradient. ............................................................................................................... 91
Figure 3.4. Number of species shared among Andean countries. A large proportion (~ 55%)
of Andean plant and vertebrate species is distributed in more than one country of the
region, which calls for better cross-border collaboration when planning for species
conservation. These estimates were based on the geographic ranges or occurrence records

8
available for 16,708 plant species 126 and for 4,516 species of birds, mammals, reptiles, and
amphibians 105. .................................................................................................................... 100
Figure 4.1. Global distribution of language diversity and forest loss. For 1-degree cells, we
show (a) the number of languages (Lewis 2017) in a logarithmic scale, and (b) the
accumulated forest loss between 2000 and 2016 (Hansen et al. 2013). The figure also shows
the extent of the forest zones of the world (Potapov et al. 2017). ...................................... 117
Figure 4.2. Examples of ethnolinguistic groups in tropical forests that are experiencing
negative effects of forest loss and degradation on their livelihoods and cultures. These
ethnolinguistic groups are communities that have traditionally inhabited tropical forests.
For each group, the language name and 3-characters ISO identification is shown (Lewis
2017). The geographic range of each group is highlighted in dark black, while borders for
neighbor groups are shown in a lighter grey. Gridded data from yellow to red indicate forest
loss (km2) between 2000 and 2016, with red representing the highest loss by 1 km2 cell (see
Fig. 4.2b). Descriptions of the impacts from forest loss and degradation on each group were
obtained from: (A) Guidi (2014); Mateo-Vega et al. (2018); Minority Rights Group
International (2020a), (B) Wallace (2016); Paiva et al. (2020), (C) Church & Page (2017);
Minority Rights Group International (2020b), (D) Morelli & Wilkie (2000); Gay (2001),
(E) Human Rights Watch (2019); Pahlevi & Butler (2019), (F) Kolinjivadi (2011). ........ 119
Figure 4.3. Connections between forest loss and degradation and cultural change in forest
IPLCs. Circular symbols represent specific socio-environmental transformations driven by
forest loss and degradation that forest IPLCs could face. Numbers indicate the pathways in
which these transformations might affect the generation, maintenance, and transmission of
cultural information. Traits that can confer groups resiliency and lead to adaptation of their
cultural systems include having a large population size, strong sovereignty, social cohesion,
and communication, among others. Instead, having smaller population sizes, undermined
autonomy, exposure to unequal power relationships are traits associated with increased
vulnerability to cultural erosion and assimilation in the face of deforestation. Furthermore,
positive feedback (dashed line) increasing forest loss and degradation might result when
cultural erosion involves disconnection between people and nature via the loss of
conservation attitudes and the decline of traditional ecological knowledge. ..................... 121

9
Figure 4.4. Forest ethnolinguistic diversity in the tropics of the world. Number of minority
ethnolinguistic groups with (A) high overlap (≥ 50 %) with forest cover by 2000 (n =
3478), and (B) with high overlap (≥ 50 %) with intact forests by 2000 (n = 475). Data is
summarized by the United Nations’ regions. The analysis was limited to the forests in the
Neotropics, Afrotropics, and Indo‐Malayan biogeographic realms, with the Papua New
Guinea portion of the Australasian realm included. ........................................................... 131
Figure 4.5. Forest reduction (2000 - 2016) across forest ethnolinguistic groups from
tropical regions. Bars show the percentage of ethnolinguistic groups under each level of
forest reduction rate. Results are shown separately for reductions in (A) forest cover and
(B) intact forest cover. Reductions in intact forests combine forest cover loss and the
increase of human intervention and fragmentation of forests (Potapov et al. 2017). ......... 133

10
List of Boxes
Box 1. Evidence of the exceptional value of the Andean mountain range to the conservation
of global nature diversity. ..................................................................................................... 83
Box 2. Balancing conservation of biodiversity and NCPs in the Andes .............................. 95

11
Resumen
Las naciones de las regiones tropicales tienen la responsabilidad de preservar los lugares
más biodiversos de la Tierra y de gestionarlos para garantizar la provisión de las
“Contribuciones de la Naturaleza a la calidad de vida de las Personas” (NCP). Las medidas
de conservación basadas en áreas, como las áreas protegidas (AP), son instrumentos que
estas naciones han implementado para cumplir con dicha responsabilidad. Sin embargo,
fallas persistentes en la gestión y ubicación de las AP han disminuido su contribución a la
biodiversidad y el bienestar humano. En esta tesis, exploro los retos y las alternativas que
tienen las regiones tropicales para fortalecer tres aspectos clave de la conservación basada
en áreas: la sostenibilidad financiera, la representatividad ecológica y la gestión equitativa.
En el Capítulo 1, evalúo si una financiación adecuada para el manejo de AP conduce a una
protección más efectiva de los bosques. Los resultados indican que déficits en la
financiación han reducido el impacto de las AP de Ecuador en evitar la deforestación,
mientras que niveles más bajos de desarrollo humano en los países de Latinoamérica se
asocian a sistemas AP con impactos más bajos. En el Capítulo 2, investigo cómo expandir
las AP en la Amazonia occidental para aumentar la representación de la biodiversidad al
menor costo posible de manejo y de oportunidad por actividades agrícolas. Para alcanzar
este objetivo, encuentro que las priorizaciones deben incorporar información espacial sobre
la variación de costes de conservación de la tierra, considerar a los territorios indígenas e
implementar colaboración internacional. En el Capítulo 3, identifico cuáles son las brechas
más críticas en la representación ecológica y de NCP en las áreas de conservación de los
Andes. Con base en una revisión de artículos y ejercicios de priorización, determino que la
planificación de la región necesita tres acciones transformadoras para cerras tales brechas:

12
(1) integrar a los NCP en análisis de priorizaciones para la conservación de la
biodiversidad, (2) diversificar la gobernanza y objetivos de manejo de las AP, y (3)
fortalecer la colaboración entre los países andinos y el financiamiento privado e
internacional. En el Capítulo 4, examino los riesgos a los que se enfrenta la diversidad
cultural humana debido a la deforestación. Mediante la revisión de estudios de caso, detecto
tres vías por las que la pérdida de bosques transforma los sistemas culturales de poblaciones
locales. Simultáneamente, análisis espaciales muestran que la deforestación de este siglo se
ha expandido rápidamente hacia los territorios de ~1.400 grupos etnolingüísticos, lo que
puede suponer una amenaza para al menos el 20% de la diversidad mundial. Aunque
investigaciones demuestran que las AP son un instrumento eficaz para frenar deforestación,
la falta de equidad en su gestión también es una amenaza a las culturas locales.
Esta tesis demuestra que una protección efectiva de la biodiversidad tropical requiere una
expansión sustancial de áreas de conservación en los lugares adecuados y un incremento
significativo de recursos para su gestión. Además, los resultados sugieren que el
establecimiento y manejo de áreas de conservación exitosas y el bienestar de las
comunidades locales están fuertemente conectados, lo que exige una mejor comprensión de
estos vínculos al planificar la expansión y gestión de áreas de conservación. Con base en
estos hallazgos, propongo cinco áreas de acción para mejorar la sostenibilidad financiera, la
representación ecológica y la equidad social de la conservación basada en áreas, y que, en
conjunto, buscan armonizar la protección de la biodiversidad con las necesidades de los
actores locales. Estas y otras perspectivas de las regiones tropicales sobre cómo fortalecer
la conservación basada en áreas también son fundamentales para informar los acuerdos
globales sobre protección de la biodiversidad.
13
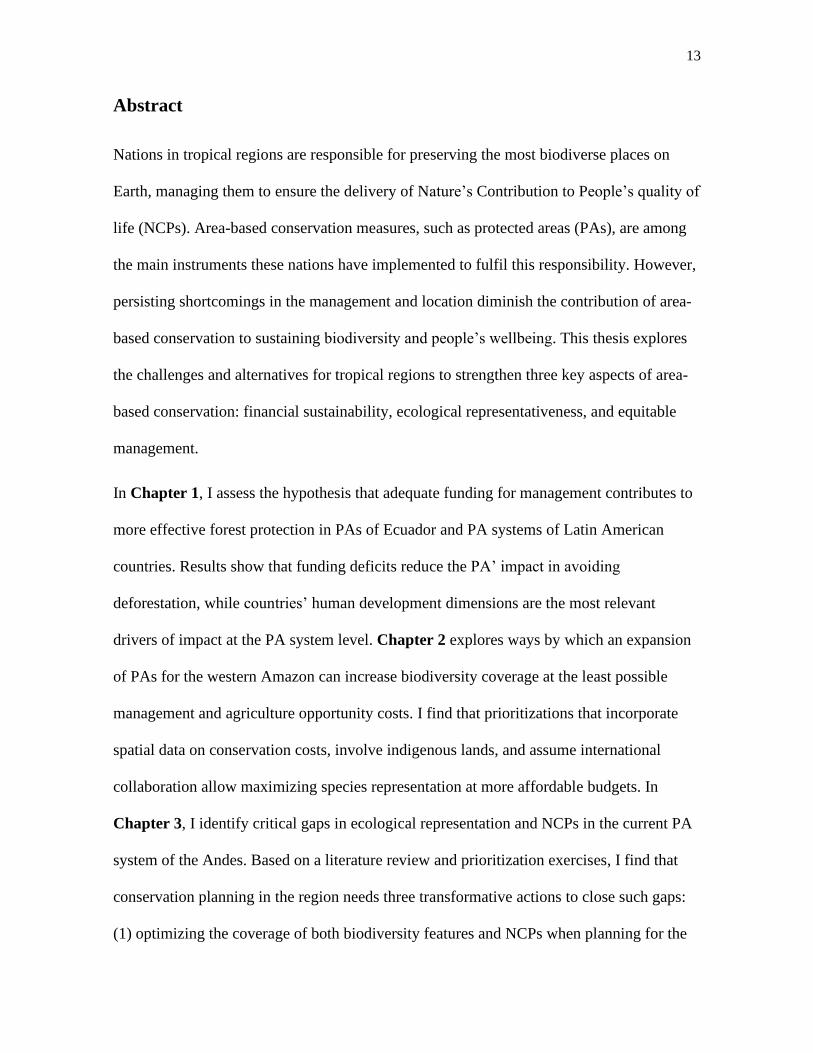
Abstract
Nations in tropical regions are responsible for preserving the most biodiverse places on
Earth, managing them to ensure the delivery of Nature’s Contribution to People’s quality of
life (NCPs). Area-based conservation measures, such as protected areas (PAs), are among
the main instruments these nations have implemented to fulfil this responsibility. However,
persisting shortcomings in the management and location diminish the contribution of area-
based conservation to sustaining biodiversity and people’s wellbeing. This thesis explores
the challenges and alternatives for tropical regions to strengthen three key aspects of area-
based conservation: financial sustainability, ecological representativeness, and equitable
management.
In Chapter 1, I assess the hypothesis that adequate funding for management contributes to
more effective forest protection in PAs of Ecuador and PA systems of Latin American
countries. Results show that funding deficits reduce the PA’ impact in avoiding
deforestation, while countries’ human development dimensions are the most relevant
drivers of impact at the PA system level. Chapter 2 explores ways by which an expansion
of PAs for the western Amazon can increase biodiversity coverage at the least possible
management and agriculture opportunity costs. I find that prioritizations that incorporate
spatial data on conservation costs, involve indigenous lands, and assume international
collaboration allow maximizing species representation at more affordable budgets. In
Chapter 3, I identify critical gaps in ecological representation and NCPs in the current PA
system of the Andes. Based on a literature review and prioritization exercises, I find that
conservation planning in the region needs three transformative actions to close such gaps:
(1) optimizing the coverage of both biodiversity features and NCPs when planning for the

14
expansion of PAs, (2) diversifying administration regimes and management objectives of
PAs, and (3) increasing collaboration among Andean countries, engaging with private and
international financial support. Finally, Chapter 4 examines the risks that human cultural
diversity faces due to deforestation in tropical regions. By reviewing case studies, I detect
three pathways by which forest loss can transform forest people cultures. Also, spatial
analyses show that this century’s deforestation has rapidly expanded into the territories of ~
1,400 ethnolinguistic groups, posing a threat to at least 20% of the world’s linguistic
diversity. Although research suggests that PAs are an effective instrument to curb
deforestation, the lack of social equity in their management also poses a threat to local
cultures.
This thesis shows that effective protection of tropical biodiversity requires a substantial
expansion of areas-based conservation targeted at the right places, and a better allocation of
funds for its management. Results also suggest that the establishment and management of
successful area-based conservation and the wellbeing of local communities are strongly
connected, which calls for a better understanding and consideration of these links when
planning the expansion of conservation areas. Considering this requirement, I propose five
areas of action to enhance the financial sustainability, ecological representation, and social
equity of area-based conservation efforts, which together also seek to harmonize
biodiversity protection with the concerns and aspirations of local actors. These and other
perspectives from tropical regions on how to strengthen area-based conservation are also
critical to inform global agreements on biodiversity protection.

15
Introduction
Global agendas for biodiversity conservation and sustainability will be moving
forward in this decade. The United Nations declared the 2020s “a decade of action” to meet
the Sustainable Development Goals (UN 2020). The Convention on Biological Diversity
(CBD) has also called for “transformative” actions to achieve the vision of world nations
for 2050 of ‘Living in Harmony with Nature’ (CBD 2018). As a part of this vision,
countries are negotiating an ambitious expansion of area-based conservation coverage to
protect at least 30% of the planet’s land and oceans before 2030 (~15.3% and 7.5% of the
terrestrial and marine realm are currently protected, respectively; CBD 2020). Area-based
conservation includes protected areas (PAs), geographically defined areas designated and
managed to achieve the long-term conservation of nature (CBD 2011). Objectives of PAs
also incorporate the promotion of sustainable use of natural resources by local
communities, an adequate provision of Nature’s Contributions to People’s good quality of
life (NCPs), climate change mitigation and adaptation, and the protection of cultural values
associated with biodiversity (Dudley 2008; Stolton & Dudley 2010; Hannah et al. 2020).
Thus, PAs serve as a fundamental tool to maintain diverse values of nature and the benefits
it provides people, contributing to the CBD’s aim of building a sustainable relationship
between humanity and nature.
Countries from tropical regions are crucial partners in achieving the aspirations of the
CBD’s agreement, as global priority sites for biodiversity protection concentrate in the
tropics (e.g., Wilson 2016; Hannah et al. 2020; Dinerstein et al. 2020). Many of these
priority areas are also shared with thousands of indigenous people and local communities
(IPLCs), who directly rely on nature for their livelihoods, commercial activities, and

16
identities (Devenish & Gianella 2012; Garnett et al. 2018). Thus, perspectives from tropical
regions on how to set goals for area-based conservation are especially relevant for building
an actionable global agreement with high biological and social impact. This agreement will
also require actions to address persisting problems that undermine the long-term success of
tropical PAs in curbing environmental degradation, preserving biodiversity, and
contributing to people’s wellbeing (Laurance et al. 2012; Pringle 2017). Among several
deficiencies, PAs in tropical regions urgently need to enhance their financial sustainability,
balance their ecological representativeness, and strengthen social equity in management,
which are often hindered by ecological characteristics and socioeconomic constraints
shared by tropical regions.
A sound area-based conservation system should be financially sustainable, which
means that countries and relevant institutions are able to cover all costs associated with
effective management that ensure the protection of nature (Bovarnick et al. 2010). In
tropical regions, most PAs are dependent on public funding (Bovarnick et al. 2010; Aseres
& Sira 2020). However, many tropical countries are low income, which combined with
competing social needs, often prevents the allocation of adequate resources for PAs
(Bradshaw et al. 2009; Büscher et al. 2017). Consequently, PAs in the tropics are usually
underfunded, compromising their ability to manage wildlife, restore degraded landscapes,
enforce conservation and control of threats within their borders, among other actions
(Bovarnick et al. 2010; Laurance et al. 2012; Coad et al. 2019). Lack of funding also
hampers compensation to local people for the opportunity costs resulting from foregone
incomes when land is declared protected (Aseres & Sira 2020). Underfunding is also the
result of the misconception that just declaring new PAs is enough to produce positive

17
impacts on conservation, regardless of funds for enforcing management. To fight this
assumption, empirical evidence on the links among funding, human pressures, and
conservation outcomes in PAs are urgently needed for tropical regions (Flores & Bovarnick
2016).
Ecological representativeness is the degree to which an area-based network covers
the full variety of biodiversity facets (e.g., target taxa, habitat types) in a way that
contributes to their long-term persistence (Kukkala & Moilanen 2013). Achieving an
ecologically representative conservation network is particularly challenging in biologically
rich regions such as the tropics, as it has been shown this would demand a large extent of
conservation areas and resources compared to higher latitudes (Rodrigues & Gaston 2001;
Jenkins et al. 2013). This goal has been further complicated because of flawed historical
decisions on where to locate PAs, which created a bias towards protecting places with low
economic value that contribute little to represent important groups, such as threatened
vertebrate species (Rodrigues et al. 2004; Venter et al. 2018). Consequently, a large part of
the tropical biodiversity remains unprotected and exposed to anthropogenic threats
(Butchart et al. 2015; Maxwell et al. 2020; Hannah et al. 2020). Also, there is limited
knowledge of the extent to which tropical PAs cover important areas for retaining and
providing NCPs, such as freshwater services, non-timber forest products, or sacred places
(Neugarten et al. 2020). Thus, science needs to provide clear guidance to tropical regions
on where to allocate the limited resources for expanding conservation areas in order to
maximize the representation of biodiversity and demanded NCPs by local and global
human populations.

18
Equity is closely related to social justice aspects concerning all involved stakeholders
when conservation areas are established (Franks et al. 2018). Achieving equitable
management in PAs is critical in tropical regions since they are home to a large rural
population and most of the indigenous peoples of the world, whose livelihoods are sensitive
to the land-use regulations that PAs imposes (Chazdon et al. 2009; Oldekop et al. 2016;
Garnett et al. 2018). Although numerous tropical PAs are known to deliver benefits to
neighboring IPLCs and rural populations, such as poverty reduction (Andam et al. 2010;
Ferraro & Hanauer 2014; Naidoo et al. 2019), there are also cases of PAs with deficiencies
in equitable management. Specifically, reports have shown deficiencies in terms of
effective participation in decision-making, access to justice in conflicting situations, respect
of identity and cultural differences, and recognition of customary and ancestral rights to
land and natural resources (Martin et al. 2016; Zafra-Calvo et al. 2019). These social
inequities diminish the quality of life of local communities and often undermine the PA
impact on biodiversity conservation (Oldekop et al. 2016). Thus, a successful expansion of
equitable PAs in the tropics requires a sound understanding and sensitive considerations of
the long-term interactions between local people and nature and how the establishment of
PAs can alter these interactions and affect people’s wellbeing, cultural continuity, and
natural resource use (Agnoletti & Rotherham 2015; Linnell et al. 2015).
New agreements in the post-2020 global biodiversity framework are expected to
create a new momentum in the expansion of area-based conservation. Therefore, it is timely
for conservation science to inform decision makers about actions that might help enhance
PA financing, ecological representativeness, and social equity. Many recent global and
regional studies have provided helpful guidance on where and how much land should be set

19
aside for protection across the tropics to enhance biodiversity representation (e.g., Wilson
2016; Pimm et al. 2018; Hannah et al. 2020). However, these studies seldom explore the
consequences that might arise from the proposed conservation-area expansions, such as its
financial feasibility, impacts on local and national economies, as well as on rural and
indigenous populations inhabiting areas of high biological value (Mehrabi et al. 2018; Ellis
& Mehrabi 2019; Schleicher et al. 2019). Thus, these studies might offer limited guidance
to decision-makers on how to navigate the complex decisions and actions needed to
strengthen area-based conservation for people and nature (Knight et al. 2006; Kuempel et
al. 2020). Contrastingly, a more effective, fair, and actionable global strategy for
biodiversity conservation needs to be informed by research that addresses how to overcome
the persisting financial, ecological, and social shortcomings of area-based conservation in a
more integrated and comprehensive way.
This thesis explores the challenges and alternatives of tropical regions for building
more financially sustainable, ecologically representative, and socially equitable area-based
conservation systems. The thesis consists of four independent research chapters focusing on
specific study areas and dealing with the knowledge gaps in area-based conservation
presented in this introduction. The objective of each Chapter 1s:
- Chapter 1. To assess whether funding for management contributed towards effective
forest protection in Ecuadorian PAs and Latin American PA systems. Here, I use
counterfactual analysis to isolate PAs’ impact in curbing deforestation. Then, I
explore the socioeconomic circumstances in which proper funding is more critical for
PAs to deliver positive outcomes. Based on these results, I discuss actions to enhance
the financial sustainability of PAs and maximize their conservation impact.

20
- Chapter 2: To design a potential expansion for the PA system in the Western
Amazon that increases species representation at minimum management and
opportunity costs. As a first step, I explore the main drivers of the costs associated
with PAs in the region. This information is used in spatial prioritization exercises to
identify additional sites that would protect species at more affordable management
costs and minimize conflicts with agricultural production.
- Chapter 3: To identify spatial conservation needs in the Andes for biodiversity
protection and people’s wellbeing. In this research, I provide a comprehensive review
of critical gaps on ecological representation and NCPs in the current PA system of the
Andes. I also examine location and management alternatives for PAs to close these
gaps and make area-based conservation more equitable and financially viable.
- Chapter 4: To examine the risks faced by human cultural diversity due to this
century’s unprecedented deforestation in the global tropics. The chapter builds on a
literature review and spatial analysis to delve into the relationships between nature
and human cultural evolution in forest landscapes. This analysis also serves as a basis
for understanding the positive and negative impacts that PA governance and
management might have on the cultural continuity and wellbeing of forest-dependent
people.

21
Chapter 1 - Does money matter? The role of funding in the performance
of Latin American protected areas
Janeth Lessmann1,2, Jonas Geldmann3,4, Javier Fajardo5, Pablo A. Marquet1,2,6,7
1 Departamento de Ecología, Pontificia Universidad Católica de Chile, Santiago, Chile. 2 Instituto de Ecología y Biodiversidad (IEB), Santiago, Chile. 3 Conservation Science Group, Department of Zoology, University of Cambridge,
Cambridge, UK. 4 Center for Macroecology, Evolution and Climate, GLOBE Institute, University of
Copenhagen, Copenhagen, Denmark 5 UN Environment Programme World Conservation Monitoring Centre (UNEP-WCMC),
Cambridge, UK. 6 The Santa Fe Institute, Santa Fe, USA. 7 Laboratorio Internacional de Cambio Global (LINCGlobal) and Centro de Cambio Global
UC, Pontificia Universidad Católica de Chile, Santiago, Chile.
Abstract
Conservationists have long argued that inadequate funding for managing protected areas
(PAs) jeopardizes their ability to achieve conservation goals. However, this claim has rarely
been substantiated by quantitative evaluations. Here, we examined whether funding
contributed towards more effective forest protection in 27 individual PAs in Ecuador and
17 PA systems of Latin American countries. We found that although most of the PAs
reduced deforestation between 2000 and 2010, these conservation impacts were highly
variable. Within the PA system of Ecuador, lower PA impacts were associated with larger
funding deficits, especially for PAs facing major human pressures on forests. At the system
level, human development scores of countries partially explained the variation on impact.
We, therefore, emphasize that maximizing the conservation impact of Latin American PAs

22
needs a multi-level approach that includes better resource allocation for PAs, combined
with strategies for strengthening institutions and governance of PA systems.
Keywords: management, budget, deforestation, effectiveness.
1. Introduction
Protected areas (PAs) are one of the chief instruments for conserving biodiversity
(CBD 2010) and have been instrumental in slowing the loss of forests in the face of
increasing human pressures (e.g., Joppa Lucas & Pfaff 2011; Geldmann et al. 2013; Pfaff et
al. 2015). However, while PAs are losing less forests than non-protected forests, PAs are
not immune to forest loss, with an estimated 21.9 million hectares of forests cleared
between 2000 and 2012 globally within PAs (Heino et al. 2015) - an area similar to the size
of Guyana or Great Britain. Moreover, examining the average effect across national or
regional PA networks hide considerable variation in effectiveness of individual PAs within
the same study area (Nolte et al. 2013; Eklund et al. 2016; Schleicher et al. 2017). Thus,
understanding what factors contribute to delivering successful PA outcomes is critical for
realizing the full potential of PAs (Geldmann et al. 2018, 2019).
Most PAs around the world only receive a fraction of the required resources for their
management. The annual cost of managing the global networks of terrestrial and marine PA
is estimated to be US$ 68 billion, but spending is closer to US$ 24 million per year
(Waldron et al. 2020). It is thus argued that underfunding PAs jeopardizes their impact in
achieving conservation goals (Watson et al. 2014; Coad et al. 2019). However, the quantity

23
of empirical evidence supporting this statement is limited and inconclusive (IPBES 2018).
In fact, few studies have investigated the connections between funding and PA impact (Gill
et al. 2017; Geldmann et al. 2018, 2019; Schleicher et al. 2019b), probably in part, because
reliable and high-quality data on financial spending and needs in PAs is incredibly rare
(Lindsey et al. 2018). Moreover, some studies have suggested that governance types, law
enforcement, and corruption are more important than management and financial factors in
influencing conservation outcomes (Nolte et al. 2013; Amano et al. 2018; Schleicher et al.
2019b). Thus, understanding what levels of funding are needed to achieve conservation
outcomes under different contexts remains one of the most important knowledge-gap
related to PA effectiveness.
Latin American countries are at the forefront of global forest conservation. Over the
past two decades, the region has built an impressive PA system that covers the largest
extent of protected forests in the world (Heino et al. 2015; FAO 2016). The forests of Latin
America are home to an unparalleled biological and cultural diversity, provide essential
ecosystem services that contribute to the economies of the countries and are essential for
global carbon and water cycling (FAO 2016; Potapov et al. 2017; Lovejoy & Nobre 2018).
Thus, ensuring effective management of Latin American protected forests is a task of
global importance. In response to this need, in 2010, a joint effort of national governments
and international NGOs estimated the financial requirements for managing the national PA
systems (Bovarnick et al. 2010). The report found that Latin American PA systems had
only 55% of their basic budget covered (Bovarnick et al. 2010). In parallel, these PAs
suffered significant forest degradation of about 1,097,618 hectares between 2004 and 2009
— an area the size of Jamaica (Leisher et al. 2013). Such chronic underfunding could

24
negatively affect the impact of Latin American PAs in preserving forests. However, the
region lacks indicators on the positive impact of funding, which hinders the possibilities to
persuade government offices to increase PAs’ budget and attract additional international
support for PAs (Flores & Bovarnick 2016).
Here, we use two unique datasets on PA funding to assess the degree to which
financial resources contributed to the impact of Latin American PAs in avoiding
deforestation for the period of 2000 to 2010. We examine the role of funding at two levels
at which precise data on spending for PA management was available for this period (Fig.
1.1): (1) for individual PAs within a country; analyzing 27 PAs of Ecuador as a case study
(Galindo et al. 2005), and (2) for national PA systems of 17 out of 24 Latin American
countries (Bovarnick et al. 2010). To estimate the PA impact, we use a counterfactual
approach (i.e., statistical matching) that compares deforestation rates of PAs with the
unprotected landscape that has similar contextual attributes as the PAs (Schleicher et al.
2019a). We then test the influence of different potential drivers of impact, including
funding deficits. We also explore drivers behind the variation in PA funding deficits to
provide additional insights on how to improve the financing and performance of the PAs in
the region. Our analysis is the largest to date to test the relationship between actual
conservation spending in terrestrial PAs and conservation outcomes. It provides evidence
on the importance of strengthening the countries’ governance structures and improving the
budget of PAs, as these factors appear to be critical for reducing forest loss within PAs.

25
Figure 1.1. Study area. We evaluated the impact in avoiding deforestation of (a) 27 PAs
within Ecuador and (b) national PA systems of 17 Latin American countries.
2. Methods
2.1. Protected area financial data
We examined the role of funding deficits on PA impact in avoiding deforestation at
two administration levels (Fig. 1.1). First, at the PA level, focusing on all native-forest PAs
of Ecuador declared by 2003 (27 PAs). This analysis level is critical to assess the role of

26
funding since most activities that deliver forest protection take place in individual PAs
(e.g., control and monitoring). Ecuador is also an excellent country for such an assessment,
being one of the few nations of the region that built specific financial data for each PA over
the 2000’s decade. Second, we focused on the PA-system level, defined as the aggregation
of individual PAs within a country and central operations that affect all PAs (e.g., budget
management, setting PA fees; (Bovarnick et al. 2010). Thus, available funding for
managing the systems might help explain the overall impact of the PA systems across
countries. For this assessment, we included the national PA systems of 17 Latin American
countries for which financial data was available. See Supporting Information (Section 1)
for more detail on the PA data set.
Funding deficits for PA management was defined as the percentage of the funds
required to meet the basic management needs of PA systems or individual PAs not covered
by the allocated budget. Basic management refers to the minimum funding needed to
operate key conservation programs, including sustaining ecosystem functions in PAs
(Bovarnick et al. 2010). This management scenario typically includes administration,
participatory planning, and control and surveillance activities in PAs (Galindo et al. 2005).
For Ecuador, financial data was from a survey led by the Minister of Environment (Galindo
et al. 2005), with the participation of park managers and stakeholders, and it covered the
period 2003-2010. Funding deficit data for the PA systems of each country were based on
reports verified by individual governments and used for evaluating trends among countries
(Bovarnick et al. 2010). This data was primarily constructed with information ranging from
2003 to 2008, and we used them as a broad indicator of the financial situation of the PA
systems over the entire decade (2000-2010).

27
2.2. Forest cover change data
Data on forest cover change was obtained from the Global Forest Change (GFC)
time-series analysis (Hansen et al. 2013). The GFC data is a remote sensing product of the
percentage of canopy cover per grid cell (30 x 30 m) for all vegetation taller than 5 meters.
Forest loss is defined as a stand-replacement disturbance or a change from a forest to a non-
forest state. Following Heino et al. (2015), we aggregated data on forest cover and forest
loss extent to ~0.5 km2 and ~1 km2 cell resolution (at the equator) for the analyses at the PA
level and PA-system level, respectively. For the PA systems in Latin America, we
estimated the forest cover of each cell in 2000 and the forest loss between 2000 and 2010,
which approximates the period covered in the financial report. For the Ecuador analysis,
accumulated forest loss was calculated from 2003 to 2010. We discuss the caveats of this
forest cover dataset in Supporting Information, Section 2.
2.3. Assessing the protected-area impact
We used matching to account for the potential bias in the locations of PAs when
estimating the impact. Statistical matching allows us to compare deforestation rates
between treatment sites (i.e., PA sites) and unprotected sites (i.e., control sites) that are
similar in respect to a set of covariates hypothesized to affect both the location and impact
of protection. Matching was performed in R using the MatchIt package (Ho et al. 2011) and
the propensity score matching (PSM) method, after also testing Coarsened Exact Matching
(CEM), which did not perform as well as PSM for our dataset (Supporting Information,
Section 3). Matching was done without replacement using the nearest neighbor method and
a caliper of 0.25 standard deviations of the propensity score as a cutoff for included

28
matches (Stuart 2010). Based on the literature (e.g., Nolte et al. 2013; Carranza et al. 2014;
Schleicher et al. 2017; Cuenca et al. 2018) and available spatial information for each level
of analysis, selected covariates were related to (1) accessibility, (2) agricultural suitability,
(3) initial tree cover, (4) topography and (5) human pressure on the environment.
Additionally, sites were matched by exact ecoregion in the case of the PAs within Ecuador
and by the exact biome for the analysis across PA systems. See Supporting Information
(Section 3) for detailed methods on the matching analysis.
Following matching, we estimated the PA impact as the baseline deforestation
avoided by PAs. Specifically, this metric shows how far baseline deforestation rates (those
in matched control sites) have been changed by protection, thereby allowing for comparing
results of countries or regions with very different baselines (Carranza et al. 2014). For each
PA in Ecuador, we calculated the difference between the deforestation rate in the pool of
matched control sites and the deforestation rate in the pool of matched PA sites, divided by
the deforestation rate found in the pool of matched controls. We used the same metric for
estimating the impact at the system level. In this case, we pooled sites across the entire PA
system (and their matched controls) without considering which sites belong to which
individual PA (Carranza et al. 2014). In this way, each matched PA site had equal weight in
the estimation of the system impact. Positive values indicate deforestation rates inside PAs
are lower than in control sites. We also use this metric as an indicator of deforestation
pressure on protected areas (see below).

29
2.4. Statistical analyses
As explanatory variables of PA impact, we included factors that have been shown to
influence deforestation rates and PA impact (Geldmann et al. 2018), such as (1)
socio−economic and governance attributes of countries, (2) direct and indirect human
pressures on forests, and (3) PA design and management characteristics (Table 1.1). We
also assess whether money is flowing to the places most in need and why some PAs are
funded better than others. To investigate this, we produced additional models that explore
the circumstances influencing the variations in the funding deficit itself for PAs within
Ecuador and among PA systems of Latin America (Table 1.1). As explanatory variables for
the variation of funding deficit within Ecuador, we included: years since PA establishment
(newer PAs might need more time for financial consolidation), elevation and slope (PAs in
the Andean mountain range usually receive more revenues from tourism), size (smaller PAs
are usually more expensive to manage per unit area), whether the PA had a management
plan (which may facilitate the allocation of resources), and deforestation rates in its control
sites, as an indicator of the overall pressure on protected forests (PAs under intense human
pressures are usually more expensive to manage). For the analysis of funding deficits
among PA systems of Latin America, we tested the relevance of the socio-economics
variables (countries with healthier economies and better governance may cover the PA
needs), PA average size, and deforestation rate in control sites.

30
Table 1.1. Explanatory variables tested in the models of PA impact and PA funding
deficits. We also analyze the response variables at two administration levels: PA level
for Ecuador and PA-system level for Latin American countries. Justification for the
selection of explanatory variables and their description is given in Supporting Information.
Explanatory variable Response variable
Socio-economic and governance Impact Funding deficits
Gross Domestic Product (GDP) at purchasing power parity
(USD) of countries System level System level
GDP growth (%) of countries System level System level
Human Development Index (0−1) of countries System level System level
Percentage of the rural population (%) of countries System level System level
Corruption index perception (0−10) of countries System level System level
Polity index (-10−10) of countries System level System level
Rule of law (-2.5−2.5) of countries System level System level
Poverty index of the municipality (0−1) where PAs are
located PA level
Direct and indirect human pressure on forests
Human population density (per km2) of countries System level
Average human population density (per km2) in the buffer
zone of PAs (10 km) System level
Human population density growth (%) of countries System level
Population growth (%) of countries System level
Percentage of agricultural land (%) of countries System level
Average travel time to cities (h) from the PA system System level
Average travel time to cities (h) from PAs in the system PA level
Average opportunity cost for agriculture of (USD per Ha,
year) System level
Average opportunity cost for agriculture of the PA (USD
per Ha, year) PA level
Average PA slope (º) PA level
Average PA elevation (m) PA level
PA perimeter (%) under pressure (top quintile of Human
Footprint scores) PA level
Deforestation rate (%) in the pool of matched control sites System and PA
levels
PA design and management
Average size (km2) of PAs System level System level
PA size (km2) PA level PA level
PA perimeter-area ratio PA level
Funding deficits (%) of the PA system System level
Funding deficits (%) of the individual PA PA level
Type of PA management (0: Strict (I-II), and 1: that allow
use (III-VI), according to IUCN categories) PA level
Years since the PA establishment PA level PA level
Management plan (0: no, 1: yes) PA level PA level
Overlap of the PA with indigenous lands (0: no, 1: yes) PA level

31
We used Generalized Linear Models in R (R Core Team 2014) to fit models for the
PA impact in avoiding deforestation. We transformed the variable of impact (which is
continuous, negatively skewed and with negative values) into “permitted deforestation”
(i.e., one minus the impact) and fitted models using a Gamma distribution (log link
function). In the case of funding deficits, we fitted Beta Regression models since data is
proportional and ranging from zero to 1 (Cribari-Neto & Zeileis 2010). We tested models
with all possible combinations of explanatory variables for each level of analysis (site and
system), included testing polynomials (orthogonal squares, Barnes et al. 2016). We selected
the best models based on Akaike Information Criteria (corrected for small sample sizes,
AICc), excluding models containing collinear explanatory variables (those with a
correlation coefficient higher than 0.5, Burnham & Anderson 2002). Trailing models with
higher AICc are reported in Supporting Information (Section 5). Results from model
selection were consistent when tested for sensitivity to outliers and different matching
parameters (Supporting Information, Section 5).
3. Results
3.1 Impact of protected areas within Ecuador
Twenty-three out of 27 PAs within Ecuador had lower deforestation rates than their
matched unprotected landscapes between 2003 and 2010 (Fig. 1.2a). The PA with the best
performance avoided 99.5% of deforestation, while the PA with the lowest impact had a
deforestation rate 157% higher than a similar unprotected area (i.e., for every hectare lost
outside, the PA lost ca. 2.7 hectares). Simultaneously, funding deficits for management
ranged from 33% to 100%. According to the most parsimonious models, based on AICc

32
(Table 1.2, Fig. 1.3a), a lower impact in avoiding deforestation was associated with larger
funding deficits (β = 0.028, p = 0.021). Moreover, avoided deforestation was smaller for
PAs that overlap with indigenous lands (β = 1.042, p = 0.031) and PAs with most of their
perimeter under human pressure (β = 0.018, p = 0.025). Together, these variables explained
36% of the deviance of the dataset.
3.2 Impact of protected-area systems of Latin American countries
Between 2000 and 2010, 16 out of 17 Latin American countries had lower
deforestation rates in their PA systems than in matched unprotected sites (Fig. 1.2b). Brazil
had the PA systems with the highest conservation impact, avoiding 82% of the baseline
deforestation. In contrast, Honduras was the only country with higher rates of forest loss
inside PAs than matched forests outside (8% higher). According to the financial report,
deficits for covering the basic management needs of the evaluated PA system of Latin
America ranged from 5% (Bolivia) to 87% (Paraguay).
Based on the AICc, our most parsimonious model explained 62% of the deviance in
the data and showed that more positive impacts on avoiding deforestation were associated
with higher scores on national Human Development Index (β = -5.23, p = 0.001; Table 1.2,
Fig. 1.3b). Thus, this model suggests that countries with healthier societies, access to a
good education, and a higher standard of living are better at protecting forests. The average
size of PAs in the system was also retained in the most parsimonious model (β = -0.00001,
p = 0.03), but only if including the influential data from Bolivia (Supporting Information,
Section 5). The funding deficit was not retained in the most parsimonious model when
looking across countries at the level of their entire PA system.

33
Figure 1.2. Impact of PAs in avoiding deforestation. This impact metric shows how far
PAs have changed baseline deforestation rates (i.e., in matched control sites), expressed as
percentage. Results are shown for (a) individual PAs of Ecuador (2003-2010) and (b)
national PA systems in Latin American countries (2000-2010). Negative impact values
(red) indicate PAs with higher deforestation rates than in matched unprotected sites, while
positive values (green) correspond to PAs that managed to reduce baseline deforestation.
3.3 Drivers of funding deficits
Among several explanatory variables tested, we found that PAs in Ecuador (Table
1.2, Fig. 1.3c) with smaller deficits in funding were those with a management plan (β = -
1.291, p < 0.001), and located at steeper slopes (β = -0.044, p < 0.001, 64% of the variance
explained). Funding deficits in PA systems (Table 1.2, Fig. 1.3d) were higher in countries
with higher deforestation pressure (β = 2.453, p = 0.001) as described by the rate of forest
loss in matched unprotected sites (41% of the variance explained). Contrary to what we

34
expected, countries with higher economic growth (measured as changes in GDP) did not
spend more resources to close funding deficits for PA management (β = 0.008, p = 0.02).
Table 1.2. Most parsimonious model (according to AICc) for explaining (a) the impact of
PAs in Ecuador, (b) the impact of national PA systems in Latin America, (c) funding
deficits of PAs in Ecuador, and (d) funding deficits of national PA systems of Latin
America. This table presents the modeling results for the variable of impact transformed
as “permitted deforestation” (i.e., one minus impact). Thus, explanatory variables with a
positive estimate indicate an increase in PA ineffectiveness. 2nd order polynomials are
indicated by superscript. Significance of regression coefficients: ***p < 0.001, **p <
0.01, *p < 0.05
Model Explanatory
variables
Estimate SE t
p Explained
deviance
a. (1 – impact)
of PAs of
Ecuador
Intercept -4.458 1.014 -4.396 < 0.001*** 0.36
PA perimeter (%)
under pressure
0.018 0.007 2.401 0.025*
Funding deficits
(%)
0.028 0.011 2.486 0.021*
Overlap with
indigenous lands
(yes: 1; no: 0)
1.042 0.452 2.304 0.031*
b. (1 – impact)
of PA systems
Intercept 2.869 0.849 3.382 0.004* 0.62
HDI -5.295 1.229 -4.306 0.001***
Average PA size
(km2)
-0.00001 0.000 -2.422 0.03*
Model Explanatory
variables
Estimate SE z
p Pseudo R2
c. Funding
deficits of PAs
of Ecuador
Intercept 2.425 0.332 7.313 < 0.001*** 0.64
Management
plan (yes: 1; no:
0)
-1.291 0.305 -4.228 < 0.001***
Slope (º) -0.044 0.015 -2.933 0.003**
d. Funding
deficits of PA
systems
Intercept -1.511 0.487 -3.103 0.002** 0.41
GDP growth (%) 0.008 0.003 2.326 0.02*
Deforestation
(%) in control
sites
2.453 0.764 3.212 0.001**
Deforestation
(%) in control
sites 2
-1.539 0.767 -2.008 0.045*

35
Figure 1.3. Marginal effects plots for the most parsimonious models (according to AICc).
Models explain the variation in the impact in avoiding deforestation for (a) individual PAs
of Ecuador and (b) national PA systems of Latin American countries. Additional models
were built to explore the factors behind the levels of funding deficits for (c) individual PAs
of Ecuador and (d) national PA systems of Latin America. Each plot shows the relationship
between the response variable and the indicated explanatory variable while adjusting for
interference from other explanatory variables. Grey shadows are 95% confidence intervals.

36
4. Discussion
Over the decade between 2000 and 2010, most individual Ecuadorian PAs had
significantly less forest loss than matched control sites. Similarly, most national PA
systems of Latin American countries experienced lower deforestation rates than analogous
areas in the unprotected landscape. These findings are encouraging and suggest that PAs
have helped to avoid deforestation. However, our results also show that none of the PA
systems was able to completely prevent losses of forest cover, with some PAs being
ineffective. Thus, our results concur with other studies in the region (e.g., Cuenca et al.
2016; Herrera et al. 2019; Schleicher et al. 2019b) in making clear that merely declaring
PAs does not guarantee long-term preservation of forests in Latin America.
Our analysis is the first to explicitly explore the relationships between funding
allocation and conservation outcomes at a PA level within a country, and at the system
level for multiple countries. Results show that funding deficits are a significant driver of
PA impact within Ecuador. Moreover, PAs were less effective when insufficient funding
for management was coupled with intense human pressures. Other studies have found
similar links between human pressure and PA impact but without being able to show the
effects of funding (Geldmann et al. 2019). By contrast, PAs in remote areas of the Amazon,
with low human pressures, were effective in abating deforestation almost entirely, even
when severely underfunded. While these results show that ensuring adequate funding and
active management in PAs is critical, particularly in areas under higher pressure, we
caution that this may lead to neglecting more remote areas that often harbor the last of
Earth’s wild places and will likely come under increased pressure (Watson et al. 2016).

37
We also found that avoided deforestation was lower in PAs of Ecuador that overlap
with indigenous lands, as similar analyses for the Ecuadorian Amazon have also detected
(Holland et al. 2014). This finding does not imply that PAs located in indigenous lands are
ineffective. Indeed, several studies have shown that indigenous lands can be as effective or
more effective than PAs (e.g., Schleicher et al. 2017; Herrera et al. 2019). Instead, this
result likely reflects that PAs in indigenous lands per definition are inhabited and might
have multiple objectives besides strict preservation of forests, such as subsistence crop
production (Vasco et al. 2018). We also stress that effective forest protection in PAs
requires the genuine participation of local communities in the decisions of rules that
regulate the use of forest resources (Ostrom 2015). However, in Ecuador, indigenous and
local communities often have little input in PA management decisions (Negru et al. 2020).
Thus, future research could explore whether factors related to equitable management helps
explain the conservation impact of PAs inhabited by indigenous people.
When looking across countries, national human development scores (as an indicator
of governance) better described the PA-system impact. Lower human development has
been associated with weak law enforcement, high corruption, and intense pressure on forest
resources by populations in poverty, which together can undermine ecological outcomes of
PAs (Barnes et al. 2016; Amano et al. 2018; Geldmann et al. 2019) and increase forest loss
rates in the countries (Jha & Bawa 2006; Kauppi et al. 2018). Thus, it is perhaps not
surprising that national socioeconomic factors were the most influential variable in
determining deforestation rates at the country level, which in turn sets the “baseline” for
deforestation rates within the PA systems. Results from Ecuador suggest that once country-
level effects kept constant across all PAs, funding plays a key role in explaining the PA

38
impact. We also emphasize that funding deficits tended to be higher in national PA systems
exposed to larger deforestation pressures, precisely where resources would have the most
significant conservation impact. As a consequence of this non-random resource allocation,
analyses may not detect a relationship between funding and avoided deforestation across
PA systems, even if the actual underlying relationship is positive (Schleicher et al. 2019b).
By contrast, within Ecuador, funding deficits were not biased towards PAs experiencing
higher deforestation pressure, which partially explains why this analysis could capture the
influence of funding in the impact of individual PAs.
Our use of a counterfactual approach allowed for isolating the impact of PAs as
compared to more appropriate controls than comparing to all non-protected land
(Schleicher et al. 2019a). Moreover, since our indicator of PA impact was based on remote
sensed forest cover, it was not influenced by the resource allocation in PAs. This
independence is crucial for ensuring an unbiased evaluation of the effect of funding on PA
impact. We also analyze unique data on funding deficits at a PA-system level, which
offered an uncommon opportunity to explore trends on the role of funding at a regional
scale. Still, methods to estimate these financial needs were not 100% uniform among
countries (Bovarnick et al. 2010). Therefore, to improve the precision of future analysis,
countries must develop, update, and standardize the documentation on financial needs and
resource allocation for individual PAs, including information on how much money these
PAs lose because of inefficient use of resources (Flores 2010).
According to our results, the impact of PAs on preserving forests can be significantly
improved through a multi-level approach that includes better resource allocation for PAs,
combined with considerations of the national socioeconomic conditions that support PA

39
management. Our exploration of the forested PAs in Ecuador shows that closing funding
gaps is likely to have a greater impact on curbing deforestation if funds are directed first to
PAs experiencing stronger anthropogenic pressures. Moreover, investing in developing
proper management plans for each PA seems to facilitate allocating the required budget and
reducing the gap (Flores & Bovarnick 2016). These findings are informative for managing
individual PAs in other Latin American countries, where many forest PAs lack proper
planning, are experiencing large funding deficits and high pressure from economic
activities, as occurred in Ecuador (Flores & Bovarnick 2016; Coad et al. 2019). Our results
also show a need of strengthening institutions and governance of PA systems to improve
their impact. This approach will also require a holistic strategy focuses on poverty
alleviation and improving the livelihood of rural populations (Jha & Bawa 2006; Barnes et
al. 2016). The fact that national PA systems under higher pressures tended to have larger
funding deficits merits serious attention. Thus, to increase the impact of PAs on halting
biodiversity loss, we encourage future global conservation agreements to generate
mechanisms to assist biodiverse countries financially and to establish more ambitious
goals in terms of the quality of national PA governance.
5. Appendices
Supplementary Information. Extended methods.
6. References
Amano T, Székely T, Sandel B, Nagy S, Mundkur T, Langendoen T, Blanco D, Soykan

40
CU, Sutherland WJ. 2018. Successful conservation of global waterbird populations
depends on effective governance. Nature 553:199–202.
Barnes MD, Craigie ID, Harrison LB, Geldmann J, Collen B, Whitmee S, Balmford A,
Burgess ND, Brooks T, Hockings M, Woodley S. 2016. Wildlife population trends in
protected areas predicted by national socio-economic metrics and body size. Nature
Communications 7:12747.
Bovarnick A, Baca JF, Galindo J, Negret H. 2010. Financial Sustainability of Protected
Areas in Latin America and the Caribbean: Investment Policy Guidance. United Nations
Development Programme and The Nature Conservancy.
Burnham KP, Anderson DR. 2002. Model Selection and Multimodel Inference: A Practical
Information-Theoretic Approach (2nd ed.). Springer-Verlag, New York, USA.
Carranza T, Balmford A, Kapos V, Manica A. 2014. Protected Area Effectiveness in
Reducing Conversion in a Rapidly Vanishing Ecosystem: The Brazilian Cerrado.
Conservation Letters 7:216–223.
CBD C on BD. 2010. Decision X/2: Strategic Plan for Biodiversity 2011-2020. Convention
on Biological Diversity, Nagoya, Japan.
Coad L, Watson JEM, Geldmann J, Burgess ND, Leverington F, Hockings M, Knights K,
Di Marco M. 2019. Widespread shortfalls in protected area resourcing undermine efforts
to conserve biodiversity. Frontiers in Ecology and the Environment 17:259–264.
Cribari-Neto F, Zeileis A. 2010. Beta Regression in R. Journal of Statistical Software 34:1–
24.
Cuenca P, Arriagada R, Echeverría C. 2016. How much deforestation do protected areas
avoid in tropical Andean landscapes? Environmental Science & Policy 56:56–66.
Cuenca P, Robalino J, Arriagada R, Echeverría C. 2018. Are government incentives

41
effective for avoided deforestation in the tropical Andean forest? PLOS ONE
13:e0203545.
Eklund J, Blanchet FG, Nyman J, Rocha R, Virtanen T, Cabeza M. 2016. Contrasting
spatial and temporal trends of protected area effectiveness in mitigating deforestation in
Madagascar. Biological Conservation 203:290–297.
FAO. 2016. Global Forest Resources Assessment 2015: How are the world’s forest
changing?Second Edi. Food and Agriculture Organization of The United Nations, Rome.
Flores M, Bovarnick A. 2016. Guía para mejorar el presupuesto y el financiamiento de los
sistemas nacionales de áreas protegidas. Lecciones aprendidas en Chile, Guatemala y
Perú. PNUD.
Galindo J, Calvopiña J, Baus C, Ayllón F, Vela S. 2005. Análisis de necesidad de
financiamiento del Sistema Nacional de Áreas Protegidas (SNAP) del Ecuador.
Ministerio del Ambiente del Ecuador, Quito, Ecuador.
Geldmann J, Barnes M, Coad L, Craigie ID, Hockings M, Burgess ND. 2013. Effectiveness
of terrestrial protected areas in reducing habitat loss and population declines. Biological
Conservation 161:230–238.
Geldmann J, Coad L, Barnes MD, Craigie ID, Woodley S, Balmford A, Brooks TM,
Hockings M, Knights K, Mascia MB, McRae L, Burgess ND. 2018. A global analysis of
management capacity and ecological outcomes in terrestrial protected areas.
Conservation Letters 11:1–10.
Geldmann J, Manica A, Burgess ND, Coad L, Balmford A. 2019. A global-level
assessment of the effectiveness of protected areas at resisting anthropogenic pressures.
Proceedings of the National Academy of Sciences 116:23209–23215.
Gill DA et al. 2017. Capacity shortfalls hinder the performance of marine protected areas

42
globally. Nature 543:665–669.
Hansen MC, Potapov P V, Moore R, Hancher M, Turubanova SA, Tyukavina A, Thau D,
Stehman S V, Goetz SJ, Loveland TR, Kommareddy A, Egorov A, Chini L, Justice CO,
Townshend JRG. 2013. High-Resolution Global Maps of 21st-Century Forest Cover
Change. Science 342:850–853.
Heino M, Kummu M, Makkonen M, Mulligan M, Verburg PH, Jalava M, Räsänen TA.
2015. Forest Loss in Protected Areas and Intact Forest Landscapes: A Global Analysis.
PLOS ONE 10:e0138918.
Herrera D, Pfaff A, Robalino J. 2019. Impacts of protected areas vary with the level of
government: Comparing avoided deforestation across agencies in the Brazilian Amazon.
Proceedings of the National Academy of Sciences 116:14916–14925.
Ho D, Imai K, King G, Stuart EA. 2011. MatchIt: Nonparametric Preprocessing for
Parametric Causal Inference. Journal of Statistical Software 1:1–28.
Holland MB, de Koning F, Morales M, Naughton-Treves L, Robinson BE, Suárez L. 2014.
Complex Tenure and Deforestation: Implications for Conservation Incentives in the
Ecuadorian Amazon. World Development 55:21–36.
IPBES. 2018. The IPBES regional assessment report on biodiversity and ecosystem
services for the Americas. Page (Rice J, Seixas CS, Zaccagnini ME, Bedoya-Gaitán M,
Valderrama N, editors). IPBES, Bonn, Germany.
Jha S, Bawa KS. 2006. Population Growth, Human Development, and Deforestation in
Biodiversity Hotspots. Conservation Biology 20:906–912.
Joppa LN, Pfaff A. 2011. Global protected area impacts. Proceedings of the Royal Society
B: Biological Sciences 278:1633–1638.
Kauppi PE, Sandström V, Lipponen A. 2018. Forest resources of nations in relation to

43
human well-being. PLOS ONE 13:e0196248.
Leisher C, Touval J, Hess MS, Boucher MT, Reymondin L. 2013. Land and Forest
Degradation inside Protected Areas in Latin America.
Lindsey PA et al. 2018. More than $1 billion needed annually to secure Africa’s protected
areas with lions. Proceedings of the National Academy of Sciences 115:10788–10796.
Lovejoy TE, Nobre C. 2018. Amazon Tipping Point. Science Advances 4.
Negru C, Gaibor ID, Hălălișan A-F, Popa B. 2020. Management Effectiveness Assessment
for Ecuador’s National Parks.
Nolte C, Agrawal A, Silvius KM, Soares-Filho BS. 2013. Governance regime and location
influence avoided deforestation success of protected areas in the Brazilian Amazon.
Proceedings of the National Academy of Sciences 110:4956.
Ostrom E. 2015. Governing the commons: The evolution of institutions for collective
action. Page Governing the Commons: The Evolution of Institutions for Collective
Action.
Pfaff A, Robalino J, Sandoval C, Herrera D. 2015. Protected area types, strategies and
impacts in Brazil’s Amazon: public protected area strategies do not yield a consistent
ranking of protected area types by impact. Philosophical Transactions of the Royal
Society B: Biological Sciences 370:20140273.
Potapov P, Hansen MC, Laestadius L, Turubanova S, Yaroshenko A, Thies C, Smith W,
Zhuravleva I, Komarova A, Minnemeyer S, Esipova E. 2017. The last frontiers of
wilderness: Tracking loss of intact forest landscapes from 2000 to 2013. Science
Advances 3:e1600821.
R Core Team. 2014. R: A language and environment for statistical computing. R
Foundation for Statistical Computing, Vienna, Austria.

44
Schleicher J, Eklund J, D. Barnes M, Geldmann J, Oldekop JA, Jones JPG. 2019a.
Statistical matching for conservation science. Conservation Biology 34:538–549.
Schleicher J, Peres CA, Amano T, Llactayo W, Leader-Williams N. 2017. Conservation
performance of different conservation governance regimes in the Peruvian Amazon.
Scientific Reports 7:11318.
Schleicher J, Peres CA, Leader-Williams N. 2019b. Conservation performance of tropical
protected areas: How important is management? Conservation Letters 2019:e12650.
Struhsaker TT, Struhsaker PJ, Siex KS. 2005. Conserving Africa’s rain forests: problems in
protected areas and possible solutions. Biological Conservation 123:45–54.
Vasco C, Bilsborrow R, Torres B, Griess V. 2018. Agricultural land use among mestizo
colonist and indigenous populations: Contrasting patterns in the Amazon. PLOS ONE
13:e0199518.
Waldron A et al. 2020. Protecting 30% of the planet for nature: costs, benefits and
economic implications.
Watson JEM, Dudley N, Segan DB, Hockings M. 2014. The performance and potential of
protected areas. Nature 515:67–73.
Watson JEM, Shanahan DF, Di Marco M, Allan J, Laurance WF, Sanderson EW, Mackey
B, Venter O. 2016. Catastrophic Declines in Wilderness Areas Undermine Global
Environment Targets. Current Biology 26:2929–2934.

45
Chapter 2 - Cost-effective protection of biodiversity in the western
Amazon
Published in Biological Conservation, Volume 235, July 2019, Pages 250-259
https://doi.org/10.1016/j.biocon.2019.04.022
Janeth Lessmann 1 2 3, Javier Fajardo 4 5, Elisa Bonaccorso 6 7, Aaron Bruner 8
1 Departamento de Ecología, Facultad de Ciencias Biológicas, Pontificia Universidad
Católica de Chile, Alameda 340, 8331150 Santiago, Chile 2 Instituto de Ecología y Biodiversidad (IEB), Casilla 653, Santiago, Chile 3 Centro de Investigación de la Biodiversidad y Cambio Climático, Universidad
Tecnológica Indoamérica, Machala y Sabanilla, Cotocollao, EC170103 Quito, Ecuador 4 Real Jardín Botánico (RJB-CSIC), Claudio Moyano 1, 28014 Madrid, Spain 5 Universidad Internacional Menéndez Pelayo (UIMP), Isaac Peral 23, 28040 Madrid, Spain 6 Instituto BIÓSFERA, Colegio de Ciencias Biológicas y Ambientales, Universidad San
Francisco de Quito, Pámpite y Diego de Robles, Cumbayá 170157, Ecuador 7 Biodiversity Institute, University of Kansas, Lawrence, KS, USA 8 Conservation Strategy Fund, Washington, DC, USA
Abstract
The western Amazon needs to expand its protected-area system to ensure the conservation
of its immense and threatened biodiversity. However, potential expansions often meet with
resistance because of scarce government resources and competing social priorities. Here,
we proposed an expansion of the protected-area system for the western Amazon that
increases biodiversity conservation at minimum costs. We started by evaluating biological
data to establish conservation targets for enhancing the protection of 2419 species of plants
and vertebrates. We then built a map that shows the variation in costs of effectively
managing lands as protected areas. We also adapted an opportunity cost layer for

46
agriculture and livestock to approximate realistic foregone incomes when a particular
extent of land is protected. These cost estimates were used in a decision-support tool to find
the most inexpensive places to achieve the conservation targets. We found that this cost-
optimized expansion would reduce annual costs by 22% in comparison to an expansion
planned without cost data. Moreover, without collaboration with indigenous peoples and
without cooperation among the western Amazon countries costs would be 39% and 49%
higher, respectively. The cost of the proposed expansion, estimated at US$ 100 million
annually, is only a fraction of the regional Gross Domestic Product (0.018%). Thus, this
study may help governments and conservation agencies to improve the financial planning
of the region’s reserve network by maximizing species protection at more affordable costs.
Keywords: management cost, opportunity cost, systematic conservation planning,
protected-area budget.
1. Introduction
Establishment of protected areas is a fundamental strategy to preserve the large
biodiversity of the western Amazon. This region, which includes the Amazon of Colombia,
Ecuador, and Peru, stands out as one of the most biodiverse places in the world for
amphibians, birds, mammals, fish, and vascular plants (Bass et al. 2010; Jenkins et al.
2013). Moreover, the western Amazon still retains large tracts of intact tropical forests
(Potapov et al., 2017) and is home to at least 140 indigenous peoples (RAISG 2012).
However, the biological and cultural diversity of the region faces numerous threats
resulting from the expansion of oil extraction, mining, hydroelectric projects, illegal

47
logging, agriculture, and large-scale road infrastructure (Finer et al. 2015; Finer and Jenkins
2012; RAISG 2012; Venter et al. 2016). To address these threats and maintain the integrity
of ecosystems, Colombia, Ecuador, and Peru have established large protected area systems
that harbor the most preserved ecosystems of the region and, in several cases, have been
proved to be successful in curbing anthropogenic threats and conserving biodiversity
(Rodriguez et al. 2013; Schleicher 2018; Schulman et al. 2007).
Unfortunately, the protected areas of the western Amazon have serious deficiencies in
funding and biological representation. According to economic studies, several Amazonian
protected areas face large funding shortfalls that hinder their effective management and
jeopardize their ability to accomplish the conservation targets they pursue (Bovarnick et al.
2010; Ministerio del Ambiente 2015). At the same time, Amazonian protected areas have
numerous gaps in terms of biodiversity representation, which means that many species and
ecosystems are insufficiently covered or are absent from protected-area systems (Fajardo et
al. 2014; Lessmann et al. 2016; Lessmann et al. 2014; Schulman et al. 2007). In this
context, the long-term persistence of Amazonian biodiversity requires both meeting the
funding needs of protected areas and expanding protected-area systems for improving
biodiversity representation.
Given the limited budget destined to protected areas and the competing social
priorities in the western Amazon, the resources for expanding its protected-area system
should be allocated efficiently (Brown et al. 2015; Margules and Pressey 2000). As the cost
of protecting sites varies widely (Armsworth 2014), a cost-efficient expansion requires a
thoughtful design that identifies places which protection optimizes increases in biodiversity
representation at the least possible costs, such as management and opportunity costs.

48
Management costs are those associated with enforcing and maintaining protected areas,
including personnel and operating costs (Naidoo et al. 2006). Prioritizing the protection of
areas that would have low management needs implies lower budgets and better chances for
these areas to be adequately funded (Armsworth et al. 2018; Green et al. 2012). Moreover,
protecting sites of minimal opportunity costs, which reflects foregone incomes when land is
protected, may reduce the conflicts between resource users and conservationists, the annual
payments to compensate for lost incomes, and the land acquisition costs (Ban et al. 2011;
Naidoo et al. 2006).
Originally formulated in the conservation biology field, the prioritization of
conservation areas has more focused on fulfilling biological needs, while economic factors
have been rarely integrated into the planning framework (Albers et al. 2016). In addition,
detailed spatial data on land-conservation costs for the western Amazon remains poorly
explored. Therefore, several prioritization studies in the region have not been able to
evaluate the direct costs of land protection (e.g. Cuesta et al. 2017; Lessmann et al. 2016;
Rodriguez and Young 2000). Instead, they have focused on minimizing surrogates of costs,
such as the amount of land to be protected or the ecological impact of human activities in
these areas. Such lack on explicit cost data may have limited our ability to identify priority
areas of high cost-effectiveness.
This study addresses two fundamental questions for conservation planning in the
western Amazon (Fig. 2.1): 1) what is the most cost-effective way to expand the region’s
protected-area system? and, 2) how much resources would that expansion save? As a first
step, we drew on published studies to build regional models of the cost for effectively
managing current protected areas. Based on these models, we built a map for the western

49
Amazon that reflects the different costs of managing lands if they are protected. In addition,
we used existing information on current and potential crop revenues as the starting point for
creating a map of opportunity costs for agriculture and livestock. These cost layers,
together with species distribution maps, were used to identify priority areas that increase
the representation of the region’s species diversity at the least possible costs. We also
estimated the savings resulting from incorporating conservation costs into the prioritization
and discussed the challenges and the recommendations for expanding the protected-area
system of the western Amazon in a cost-effective way.
2. Methods
2.1 Study area
The western Amazon (Fig. 2.1) covers 1 414 641 km2 and represents 43% of the surface of
Colombia, 38% of Ecuador, and 63% of Peru (RAISG 2012; Sierra 1999). This region is
classified into three sub-regions according to elevation (Hoekstra et al. 2010): Amazonian
lowlands (<250 m), Amazonian foothills (250–800 m), and Andean Amazon (>800 m). The
region has an extensive reserve network composed of 67 state-protected areas partially or
totally located within the western Amazon: 18 in Colombia, 13 in Ecuador, and 36 in Peru.
These protected areas occupy 20% (287 412 km2) of the region and approximately 20% of
the Amazon of each country and sub-region. Thirty-three percent of the western Amazon
and 16% of its protected areas overlap with indigenous lands, which include titled lands,
ancestral lands, and areas inhabited by people in voluntary isolation (RAISG 2012).

50
Figure 2.1. Western Amazon (Colombia, Ecuador and Peru). Amazonian protected areas
with estimates of costs for effective management are highlighted in red, whereas those
protected areas without available economic estimates are cleared.
2.2 Estimating land conservation costs for the western Amazon
We evaluated and mapped two types of costs associated with land conservation: (1)
costs of effectively managing land as a protected area, and (2) opportunity costs from
foregone agriculture and livestock when setting a piece of land for conservation. Both maps
were used to guide the prioritization towards areas with the greatest species value per cost.

51
2.2.1 Costs for an effective management
Previous studies at global and continental scale have modeled the costs of effectively
managing protected areas (e.g. Balmford et al. 2003; Bruner et al. 2004; Moore et al. 2004).
According to these studies, the size, location, and design of protected areas explain a
significant percentage of their differences in management costs. Therefore, these models
could be spatially projected to build a map that reflects the management costs of protecting
a specific site. Also, these models may guide the design of new protected areas to minimize
their management costs. Here, we built models at a regional scale that consider drivers that
may influence the management costs of Amazonian protected areas. As the independent
variable for this modeling, we used available estimates of the costs of basic and effective
management of current protected areas in Ecuador (Galindo et al. 2005), Peru (León 2005),
and Colombia (Londoño 2013). While current spending is insufficient, estimated costs of
effective management are the funds required to ensure basic operations within protected
areas (Balmford et al. 2003). A total of 44 out of the 67 Amazonian protected areas had
specific estimates of their annual basic management cost: 11 from Ecuador, 31 from Peru,
and two from Colombia (Fig. 2.1; Supplementary Information). Although few Colombian
protected areas had management cost data, the Amazon regions of the three countries share
many natural and social characteristics, justifying the adequacy of building a regional
model from the available data.
We constructed linear regression models to explain the variation in the annual
management cost per-area (US$/year per km2). As a preliminary step, we inflated these
management costs to 2016 values (COIN NEWS 2016) and transformed the values using a
base-10 logarithm scale (Balmford et al. 2003; Bruner et al. 2004). As predictor variables,

52
we evaluated the following attributes of Amazonian protected areas that may influence
management costs: size, management objectives, years since their establishment,
inaccessibility, human population density inside them, average human footprint, distance to
the nearest other protected area, distance to villages, average slope, presence of indigenous
lands, proportion of land under operative oil blocks, and national Gross Domestic Product
per capita of the country where the protected area is located. When needed, we transformed
predictor variables to improve the normality of data. The potential importance of each
variable on management costs is specified in Table 2.1.
We constructed two regression models. For the first one (hereafter, General Model)
we tested all predictor variables, and therefore, it represents a best estimate of the drivers of
variation in management costs. However, this model may depend on attributes of potential
new protected areas that are difficult to pre-establish in a prioritization exercise, such as
their size (which is a result of the prioritization algorithm) or management objectives. Thus,
we built a second model (the Context Model) which only includes variables that describe
the location of protected areas (Table 2.1) and that we projected spatially to build a map of
the costs of managing sites (using square cells of 1 km2) as protected areas.
Models were obtained by using both forward and backward stepwise procedures, with
the alpha-to-enter and alpha-to-exit value set at 0.05. Best models were selected according
to their Akaike Information Criterion (AIC), Bayesian Information Criterion (BIC), and
explanatory power (R2) values. Models containing collinear predictors (those with
correlation Pearson coefficient higher than 0.7) were discarded. We also tested if the
interaction between the selected variables improved the explanatory power of models. We
performed all the analyses in R (R Core Team 2014).

53
Table 2.1. Predictor variables for management cost models of protected areas in the
western Amazon. Location variables reflect the geography characteristics and
anthropogenic pressures of the protected areas. Information on these variables were
obtained from the sources specified in the Supplementary Information.
Variable Transformation Importance
Non-location related
Size (km2) Log10 x
Larger protected areas have been
associated with lower management cost
per-area.
Management objectives. Strict
protection (0: I-IV categories)
or sustainable use (1: V and VI
categories).
Categorical
variable
Different management objectives may
require different activities and
expenditures.
Years since establishment √x Recent protected areas may need more
budget for their consolidation.
Location
Average inaccessibility (travel
time to major cities) √x
Inaccessible protected areas may be less
vulnerable to human activities, requiring
lower costs for protection.
Average population density
(inhabitants / km2) Log10 (x+1)
Protected areas in highly populated zones
may require more funding to resist
pressures.
Average human intervention (1-
100) Not needed
Protected areas in highly intervened zones
may require more funding to control and
restore ecosystems.
Average distance to villages
(km) Log10 x
Protected areas close to populated areas
may suffer greater human pressure,
requiring more funding.
Average distance to the other
protected areas (km) √x
Nearby protected areas may reduce the
overall human pressure, decreasing
management costs of neighbor areas.
Average slope
(0-90) -
Protected areas with greater average slope
may be more complex to access,
decreasing the threats and the surveillance
costs.
Presence of indigenous lands
(0: no, 1: yes)
Categorical
variable
Indigenous territories may be a support
for protected area management, reducing
overall costs.
Proportion in operative oil
blocks (0-100) √x
An overlap with oil blocks may increases
the management costs in order to address
the environmental impacts of this
industry.
Gross Domestic Product per
capita, PPP. -
Countries with higher GDP have been
related to expensive reserves.

54
2.2.2 Opportunity cost map
We created a map layer of opportunity costs of clearing land based on the global map of
gross economic rents from agricultural lands and cattle rising produced by (Naidoo and
Iwamura 2007). Since this map reflects gross earnings (i.e., costs of production are not
included), we made an adjustment to net profits, assuming a profit margin of 15% for all
types of crops (Busch et al. 2009; Strassburg et al. 2008). In Naidoo and Iwamura’s original
map, profits from clearing for agriculture are mainly based on the characteristics of climate
and soil, rather than actual production or potential productivity as dependent on
accessibility (Naidoo and Adamowicz 2006). To adjust for this, we multiplied the net
profits by the probability of land conversion (ranging between 0 and 1), which is based on
the concurrence of current and projected roads in the area from (Soares-Filho et al. 2006).
All profits were adjusted to 2016 values (COIN NEWS 2016). Opportunity costs related to
other economic activities in the western Amazon, such as oil extraction and mining, were
not considered since the potential and current profits have not been systematized and are
difficult to access in the region. Moreover, since oil blocks cover a large portion of the
western Amazonia (RAISG 2012), conservation planning at a regional scale has been
forced to coexist with these blocks, despite of the negative impact of this economic activity
on local biodiversity.
2.3 Target species
We based the identification of priority areas on birds, amphibians, mammals, reptiles, and
vascular plants. For these species, there are more complete inventories across the western
Amazon, as well as available references about their taxonomy and distribution

55
(Supplementary Information). Occurrence records for these species were gathered from
specimen databases of natural history collections (Supplementary Information). Then, we
approximated the geographic distributions of these species by building species distribution
models with Maxent (Phillips et al. 2006), using the bioclimatic variables from Worldclim
1.4 at ~1 km2 spatial resolution as ecological predictors. We also included the modeled
distribution maps of 62 species (42 amphibians, 15 birds, and 5 mammals) endemic to the
east slope of the Andes in Peru, generated by (Young et al. 2007). As a result, the species
set was composed of 1,445 birds, 132 mammals, 327 amphibians, 219 reptiles, and 296
endemic vascular plants (a total of 2,419 species). See the Supplementary Information for
more information on species distribution modelling and its caveats for conservation
planning.
To guide the selection of priority areas maximizing species representation, it is
necessary to establish conservation targets, here defined as the minimum proportion of each
species’ distribution to be included in a protected-area system. When these targets are met,
species are considered as represented. Ideally, conservation targets should be established
for each species according to their sensitivity to forest loss and habitat disturbance (Ardron
et al. 2008). However, assessing species sensitivity requires specific information on their
particular ecological requirements, which are not available for all species included in our
study. Instead, we used species geographic range size to inform the establishment of
conservation targets. The geographic range size is strongly related to the probability of
species persisting in degraded habitats, with populations of narrow-ranged species being
more vulnerable to local extinction in human-disturbed land (Newbold et al. 2018). Thus,
we scaled the targets between 50% of the distribution for species with a range of 2,000 km2

56
and smaller, and 5% for those with ranges larger than 200 000 km2 (Rodrigues et al. 2004).
Moreover, for species classified as vulnerable, endangered, and critically endangered
(IUCN 2014) the maximum possible target was set to 75% of their distribution. Thus,
species of high priority for conservation (those with small ranges and threatened) received
the highest conservation targets. See the Supplementary Information for more information
on the definition of species conservation targets.
2.4. Identification of priority areas of high cost-effectiveness
We used the decision support tool Marxan (Ball et al. 2009) to identify areas of high cost-
effectiveness. Marxan’s simulated annealing algorithm permits the selection of a set of
planning units (PUs, squares of ~ 13 km2) that meet predefined species conservation
targets, while minimizing the total cost of protecting the selected PUs. For this
prioritization, we followed a complementary-based approach, in which the proportion of
species distributions already protected were considered for the target achievement.
Information on costs generated as described in the previous sections was included in
Marxan in two ways. First, the cost of each PU was calculated as the sum of its
management and opportunity costs, taken from both cost maps. Hence, the selection of PUs
in relatively more expensive sites was minimized. Second, since small protected areas have
higher management cost per unit area (see Results), we calibrated Marxan’s Boundary
Length Modifier (BLM) parameter to prioritize larger, better connected areas, rather than
smaller and scattered areas. To accomplish this task, Marxan may add sites that connect
smaller areas to make a single larger protected area, but such land addition may increase
opportunity costs. Thus, to generate optimal results, we calibrated the algorithm by
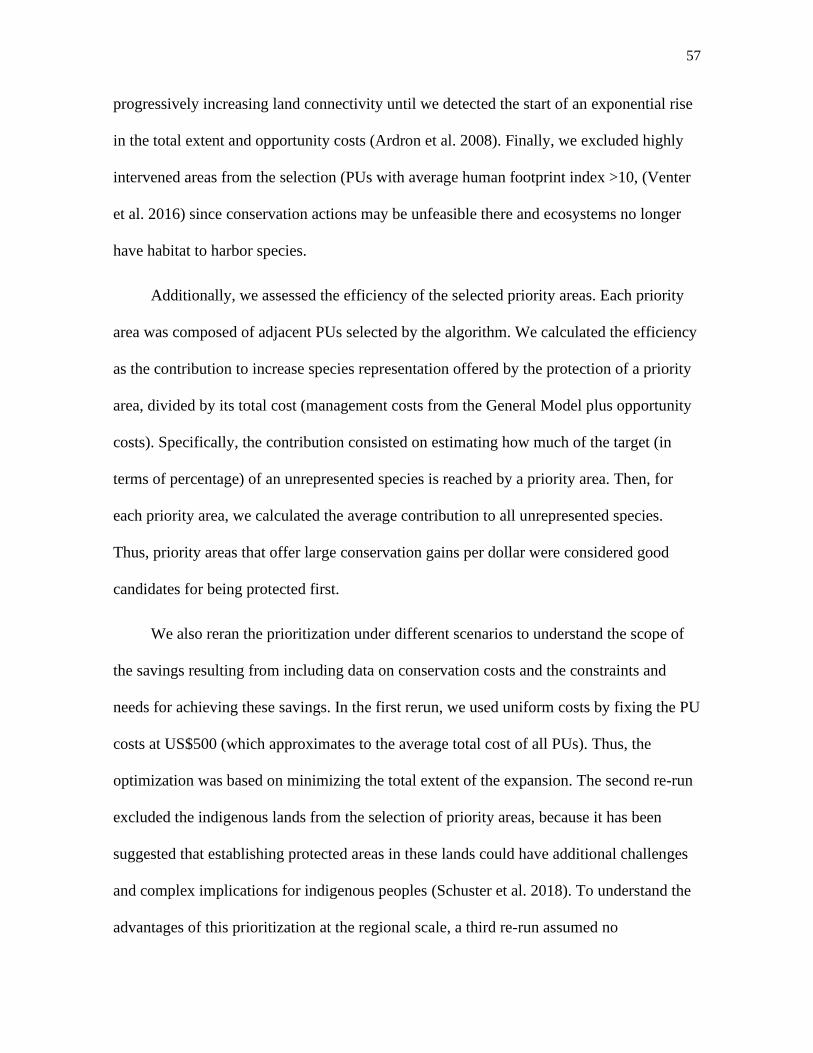
57
progressively increasing land connectivity until we detected the start of an exponential rise
in the total extent and opportunity costs (Ardron et al. 2008). Finally, we excluded highly
intervened areas from the selection (PUs with average human footprint index >10, (Venter
et al. 2016) since conservation actions may be unfeasible there and ecosystems no longer
have habitat to harbor species.
Additionally, we assessed the efficiency of the selected priority areas. Each priority
area was composed of adjacent PUs selected by the algorithm. We calculated the efficiency
as the contribution to increase species representation offered by the protection of a priority
area, divided by its total cost (management costs from the General Model plus opportunity
costs). Specifically, the contribution consisted on estimating how much of the target (in
terms of percentage) of an unrepresented species is reached by a priority area. Then, for
each priority area, we calculated the average contribution to all unrepresented species.
Thus, priority areas that offer large conservation gains per dollar were considered good
candidates for being protected first.
We also reran the prioritization under different scenarios to understand the scope of
the savings resulting from including data on conservation costs and the constraints and
needs for achieving these savings. In the first rerun, we used uniform costs by fixing the PU
costs at US$500 (which approximates to the average total cost of all PUs). Thus, the
optimization was based on minimizing the total extent of the expansion. The second re-run
excluded the indigenous lands from the selection of priority areas, because it has been
suggested that establishing protected areas in these lands could have additional challenges
and complex implications for indigenous peoples (Schuster et al. 2018). To understand the
advantages of this prioritization at the regional scale, a third re-run assumed no

58
collaboration between the three western Amazon countries (Colombia, Ecuador, and Peru).
Here, priority areas were specified to meet the targets independently within each country,
overlooking the potential contribution of the other western Amazonian countries to achieve
overall species representation.
3. Results
3.1. Management and opportunity cost estimates
Observed annual cost per unit-area for an effective management varied widely among
current protected areas of the western Amazon, from US$ 7 per km2 to US$ 9,156 per km2
(average US$ 871 per km2). The size of protected areas alone explained 76% of this cost
variation. Therefore, the General Model, which includes only the protected-area size and
whether they overlap with indigenous lands, was highly explicative (R2 = 0.81). This model
indicates that management cost per unit-area is higher in smaller protected areas and in
protected areas outside indigenous lands (Table 2.2).
The Context Model, which excluded protected area size, was less explicative than the
General Model, but was still able to explain much of the variation in management costs (R2
= 0.55) through the incorporation of accessibility. Specifically, management costs were
higher for protected areas located in accessible zones, as well as (again) outside indigenous
lands (Table 2.2). An interaction between indigenous lands and inaccessible areas was also
significant and positive, which means that managing protected areas in indigenous lands
that are accessible is particularly cost-efficient.

59
Table 2.2. Best regression models for protected-area management cost per year and unit
area (in log scale) for the western Amazon. The General Model was built with all predictor
variables, whereas the Context Model used only evaluated variables related to the location
of the protected areas.
Dependent variable
(log10 US$/ year, km2)
Selected predictor variables Coefficient P-value
General Model
R2 = 0.81
P < 0.001
Intercept 4.799 < 0.001
Size (log10) -0.696 < 0.001
Indigenous lands -0.336 0.0028
Context Model
R2 = 0.55
P < 0.001
Intercept 4.361 < 0.001
Inaccessibility (√x) -0.047 < 0.001
Indigenous lands -1.783 0.0011
Inaccessibility (√x) *
Indigenous lands
0.036 0.0112
The map of management cost built from the Context Model (Fig. 2.2A) showed that
the Andean Amazon concentrates areas of high management cost for protection, whereas
Amazonian lowlands are, in general, less expensive. This pattern is generally mirrored by
opportunity costs, as the highest opportunity costs also occur in the Andean Amazon (Fig.
2.2B). Although several remote lowland areas in the western Amazon have high
agricultural potential, their access to markets is limited, resulting in low opportunity costs.

60
Figure 2.2. Maps of potential conservation costs of protected areas in the western Amazon.
(A) Annual costs per-area for an effective management based on the location attributes of
protected areas. (B) Opportunity cost is the result of combining information on the net
profits of crops and livestock, with the likelihood of land conversion.
3.2 Cost-effective priority areas
A total of 1,777 out 2,419 analyzed species were adequately covered by the current
protected area systems according to the established targets. Thus, an expansion of the
protected areas is still needed to cover 27% of the species (n = 642). Importantly, a
percentage as large as 70% of these insufficiently protected species are partially or totally
restricted to the Andean Amazon sub-region (Fig. 2 in Supplementary Information). As a

61
result, the Andean Amazon is the sub-region with the highest proportion of its extent in
priority areas for expansion (38%), followed by Amazonian foothills (14%), and
Amazonian lowlands (9%). Overall, we identified 297 priority areas (Fig. 2.3A), most of
them of small size (˂ 100 km2) and with different levels of accessibility, from very remote
(5 days of travel to major cities) to highly accessible lands (6 min of travel; average of all
priority areas = 1,079 min). Together, priority areas occupy 16% of the western Amazon
(223 622 km2) and, with the current protected areas, achieved the targets for 2,411 species
(99.7% of the assessed species).
Using the General Model of management cost, we calculated that an expansion of the
protected-area system based on the selected priority areas would cost US$ 71.4 million
per year to cover for effective management. According to the 95% confidence interval
associated to our model, this estimate on management cost could range between US$ 48
million and US$ 108 million per year. An additional US$ 28.5 million correspond to
opportunity costs (Table 2.3). Thus, the annual total cost of the priority areas ranged from
to US$ 68 per km2 to US$ 6,399 per km2 (average US$ 1,925 per km2). Most priority areas
are located in Peru, thus US$ 68 million per year of the total cost would corresponds to this
country, US$ 23 million to Colombia, and US$ 8 million to Ecuador (Table 2 in
Supplementary Information). Moreover, our analysis of efficiency (Fig. 2.4) suggests that
there are priorities even within these priorities. The 20 most efficient priority areas would
only cost US$ 20 million per year (US$ 9.3 million for management, and US$ 10.7 million
for opportunity costs), cover as little as 7% of the western Amazon, and contribute to
achieve the conservation target of 437 species (67% of those insufficiently protected).

62
Figure 2.3. Priority-area networks identified under different scenarios. (A) Cost-optimized
priority areas, (B) priority areas when considering uniform costs, (C) priority areas when
excluding indigenous lands from the selection, and (D) priority areas when assuming non-
international collaboration among the western Amazon countries.

63
Table 2.3. Conservation costs of priority-area networks in the western Amazon identified
under different scenarios. Annual costs for an effective management were estimated from
the General Model, whereas opportunity costs correspond to adapted profits from
agriculture. * LCL: Lower Control Limit; UPL: Upper Control Limit (UCL).
Prioritization
scenarios
Cost (US$ million / year) of the priority-
area network
Area
(km2)
Cost per
represented species
(US$/ # species,
year) Management Oppor-
tunity
Total
Estimate 95%
LCL
95%
UCL
Cost-
optimized
71.3 47.9 108.2 28.6 99.9 223,622 41,476
Uniformed
costs
94.9 59.1 156.8 32.3 127.3 182,687 52,791
Excluding
indigenous
lands
108.2 68.3 175.9 31.2 139.3 198,805 58,103
Without
international
collaboration
109.1 70.3 173.6 40.4 149.5 325,104 62,005
Regarding alternative prioritization scenarios (Fig. 2.3, Table 2.3), we found that
priority areas resulting from the rerun that assumed uniform costs (i.e., simulating
expansion planned without using cost information) implies an annual investment of US$
127 million (US$ 95 and US$ 32 million per year for management and opportunity
costs, respectively). Therefore, this scenario, although it encompasses 13% of the western
Amazon, increases costs by 27% in comparison to the planning that considered cost
variation. When indigenous lands were excluded from the selection, the total extent of the
priority areas encompasses 14% of the western Amazon and requires an investment 39%
higher (total costs US$ 139 million) than the original solution. Under the assumption of
no international collaboration, the area needed to achieve targets increases to ~23% of the
western Amazon, and it is 49% more expensive (total costs US$ 149 million) than a

64
conservation plan developed with international collaboration. Finally, the uniform-cost
scenario and the non-international collaboration scenario had the same target achievement
as the cost-optimized solution (99.7% of species represented). By contrast, when the
indigenous lands were excluded, the target achievement dropped to 99% (20 species
unrepresented). See the Supplementary Information for more details on these scenarios.
Figure 2.4. Efficiency on investment of the priority areas identified in the western Amazon.
For the cost-optimized prioritization, we calculated the efficiency of each priority area as its
contribution to achieve species conservation targets divided by its total cost. The 20 most
efficient areas (green) are those that contribute more to achieve the targets at lower costs.

65
4. Discussion
4.1 What is the most cost-effective approach to expand the protected-area system in the
western Amazon?
In the western Amazon, protected areas that are large, have low accessibility, and lie within
indigenous lands, are associated with lower costs per unit area for an effective
management. According to our modeling, annual management cost per-area and size of
protected area were related in a log scale, which implies that larger protected areas achieve
great savings in management costs, compared to the smallest ones. These savings are the
result of the smaller perimeter/surface relationship that large reserves have, which limits the
incursion of threats towards their core and hence, reduces the overall costs for surveillance
(Cantú-Salazar and Gaston 2010). More importantly, large protected areas in the western
Amazon are usually situated in remote zones, where there are fewer socio-economical
impediments to create big protected areas. Thus, the lower human pressure around and
within these remote protected areas allows for less intensive surveillance, reducing the total
management costs, even though inaccessible protected areas demand higher transportation
costs for operations. Given this relationship between the size of reserves and their location,
size can be understood to explain costs both due to reduced perimeter per area, and also as a
good indicator of remoteness and less complex management needs. Moreover, since the
lower costs of large protected areas could be associated with the low pressure of the places
where they are usually created, the Context Model (and the management cost map) could
explain much of the variation in management costs, mainly through the inaccessibility
level.

66
The livelihoods and cultural practices of many indigenous people from the western
Amazon depend on natural resources. This relationship has long encouraged indigenous
communities to take special measures to prevent forest fires and to control hunters, loggers,
miners (Kaimowitz 2015; Zimmerman 2013). In this manner, the traditional protection,
collaboration, and governance of local indigenous peoples appears to lower the
management costs that need to be assumed by protected-area agencies. Surprisingly,
management costs of protected areas in indigenous lands that are accessible were even
lower. Indeed, indigenous peoples in the Peruvian Amazon that live close to large
population centers and whose lands are titled have had a pronounced effect in maintaining
their forests probably because of their closeness to regulatory-agency offices (Blackman et
al., 2017).
These non-uniform distributions of land-conservation costs in the western Amazon
influenced the selection of cost-effective priority areas. Particularly, the Andean Amazon
sub-region concentrates areas that are expensive to manage given their high accessibility
and limitations to create large protected areas. Also, soils and climate in this region make it
highly suitable for crop expansion, which combined with better accessibility to markets,
increases opportunity costs for agriculture. Since the decision-support algorithm we used is
directed by the minimization of costs while increasing biodiversity representation, the
selection of priority areas towards the lowland Amazon was favored in comparison to an
expansion planned with uniform costs (Fig. 2 in the Supplementary Information).
Moreover, within the Andean Amazon, the selection of several areas expensive areas was
replaced by less accessible lands when cost data were considered. Together, these lowlands
and less accessible sites selected would be more affordable and just as important for

67
achieving the species conservation targets as some expensive zones at higher elevations.
Nevertheless, the set of priority areas in the cost-optimized solution also included several
accessible, productive, and small areas in the Andean Amazon and Foothills that, although
expensive, are highly irreplaceable given their large concentration of unprotected and
restricted-range species. In fact, 47% of the areas selected in the cost-optimized solution
(mostly in the Andean Amazon) were also present in the expansion planned without cost
because of their unique species composition that make them crucial to achieve the targets,
independently of their costs. Thus, to achieve a cost-effective solution, a combination of
sites with different sizes, human pressure levels, and costs needs to be included in the
protected-area system expansion of the western Amazon.
4.2 How much resources would the cost-optimized expansion save?
Our cost-optimized expansion of the protected-area system would cost 78% of an
expansion only based on minimizing the total extent of land to be protected (i.e., 67sing
uniform costs). Thus, as other studies have found (Armsworth 2014), considering cost
variation when prioritizing generated more cost-effective alternatives. Moreover, we found
that the collaboration between countries generates is vital to cost-effective solutions. When
collaborating, less expensive opportunities to protect species arise from the larger territory
under planning, and redundancies can be avoided through accounting for the contribution
of the regional protected-area system (Kark et al. 2009). As a result, without international
collaboration, much more land and costs are needed to achieve the conservation targets.
Our study also highlights that, in economic terms, it is more efficient to expand the
protected areas in collaboration with indigenous groups, given comparatively lower

68
management costs and their contribution to close current gaps in biodiversity coverage.
However, such an expansion of protected areas in indigenous lands has implications that
need to be accounted for. First, partnerships between indigenous peoples and federal or
state governments should be encouraged, including informed consent and true participation
in design (Schuster et al. 2018). Second, the design and management of any new reserve
must consider the particular aspirations for agricultural use, forest resources and other basic
needs that each indigenous people may have (Beltrán 2000). On some occasions,
conservation strategies in indigenous lands may require efforts towards reconciling and
coordinating biodiversity and indigenous needs within the same territory. For example,
rates of wildlife harvest have been found to often exceed maximum sustainable levels for
several indigenous communities in the Amazon (e.g. Zapata-Ríos et al. 2009). However,
any access restrictions should be agreed on with the communities concerned, and
appropriate compensation should be given in cases where such restrictions are considered
necessary by all parties (Beltrán 2000). These considerations also apply for any priority
area that overlap with other traditional forest communities in the western Amazon, which
often produce positive results at avoiding deforestation (Porter-Bolland et al. 2012).
The proposed expansion of the protected-area system at US$ 99.9 million annually
(for both management and opportunity costs) far exceeds current spending but seems
feasible and affordable for governments and the international community. This expansion
represents only a small fraction of the annual GDP of the western Amazon countries
(0.018%) and of other government spending priorities, such as the military expenditure
(2.2% of the GDP; World Bank 2016). Moreover, according to the management cost model
that incorporate the size of the protected areas, the management costs could be lowered if

69
the priority areas adjacent to existing protected areas are managed as an extension of the
last ones, rather than as new reserves. Nevertheless, protected-area agencies in the western
Amazon will still need to reduce funding gaps in current protected areas and increase the
annual budget to manage new reserves. In this context of high investment, the efficiency
analysis of the priority areas is an additional piece of information to help deciding which
areas may be protected first. Specifically, the 20 most efficient areas would cost 20% of the
total priority area system, while they contribute to reach the conservation targets for 67% of
the insufficiently protected species.
4.3 Final considerations
Besides the economic efficiency of priority areas, other criteria are also relevant to inform
conservation planning. For example, several identified priority areas of high cost-efficiency
have a relatively high risk of tree cover loss for the next years (Soares-Filho et al. 2006,
Fig. 3 in the Supplementary Information). Thus, a strategy with high impact on
conservation could be to focus on protecting those efficient and more vulnerable areas.
Further studies may also evaluate the trade-offs of prioritizing areas with high vulnerability
and immediate threats instead of areas with a high return-on investment in terms of species
representation. In any case, ensuring the proper funding for managing these vulnerable
areas will be crucial, since the exposition of these areas to large pressures make them more
dependent of funding to reduce the threats and ensure their effectiveness (Galindo et al.
2005). Finally, the urgency of protecting any of the identified priority areas also depends on
the degree at which the forest landscapes are effectively preserved by other management
strategies implemented in the western Amazon, such as private and municipal reserves, or

70
local programs of economic incentives to protect private and communitarian lands (e.g.,
Socio Bosque or Bosques Protectores in Ecuador). While incorporation of relevant laws
and strategies is beyond the scope of this analysis, the cost-effective conservation areas
identified may be useful for other approaches to conservation as well.
Protected areas in the western Amazon are experiencing a complex dynamic.
Several events of downgrading, downsizing and degazetting of protected areas have been
reported, mainly as a response of increasing extractive pressure on nature resources
(Mascia and Pailler 2011). But at the same time, at least 18 new state reserves have been
created in the last 10 years (UNEP-WCMC and IUCN 2019), which reflects the region’s
commitment to enhancing biodiversity protection. In this context, the long-term success of
the protected-area expansion in the western Amazon may depend on careful decisions
informed with a combination of biological, social and economic information. To
accomplish that goal, our assessment on cost-effective protection offers valuable and new
information that, together with other prioritization criteria, different forest management
strategies, in situ evaluations and social aspirations, could enhance the feasibility and
effectiveness of future expansions of protected areas.
5. Conclusions
Our study demonstrates the challenge in seeking to adequately protect the remarkable
biodiversity of the western Amazon since many unprotected species are concentrated in
expensive areas. In this context, we provided a map of priority areas for expansion that
would reduce annual costs by 25%. Moreover, we highlight the importance of international
collaboration when defining conservation targets, as well as of involving indigenous lands

71
in planning to propose cost-effective solutions. Therefore, this contribution may help
governments and institutions to improve the financial planning of the region and to achieve
scientifically based biodiversity conservation objectives at more affordable costs.
6. Appendices
Supplementary Information. Extended methods and results
7. References
Albers, H.J., Maloney, M., Robinson, E.J.Z., 2016. Economics in Systematic Conservation
Planning for Lower-income Countries: A Literature Review and Assessment.
International Review of Environmental and Resource Economics 10, 145-182.
Ardron, J.A., Possingham, H.P., Klein, C.J., 2008. Marxan Good Practices Handbook.
Pacific Marine Analysis and Research Association, Vancouver.
Armsworth, P.R., 2014. Inclusion of costs in conservation planning depends on limited
datasets and hopeful assumptions. Annals of the New York Academy of Sciences 1322,
61-76.
Armsworth, P.R., Jackson, H.B., Cho, S.-H., Clark, M., Fargione, J.E., Iacona, G.D., Kim,
T., Larson, E.R., Minney, T., Sutton, N.A., 2018. Is conservation right to go big?
Protected area size and conservation return-on-investment. Biological Conservation 225,
229-236.
Ball, I.R., Possingham, H.P., Watts, M.E., 2009. Marxan and relatives: Software for spatial
conservation prioritisation, In Spatial conservation prioritisation: Quantitative methods

72
and computational tools. Eds A. Moilanen, K.A. Wilson, H.P. Possingham, pp. 185-195.
Oxford University Press, Oxford, UK.
Balmford, A., Gaston, K.J., Blyth, S., James, A., Kapos, V., 2003. Global variation in
terrestrial conservation costs, conservation benefits, and unmet conservation needs.
PNAS 100, 1046-1050.
Ban, N.C., Adams, V., Pressey, R.L., Hicks, J., 2011. Promise and problems for estimating
management costs of marine protected areas. Conservation Letters 4, 241-252.
Bass, M.S., Finer, M., Jenkins, C.N., Kreft, H., Cisneros-Heredia, D.F., McCracken, S.F.,
Pitman, N., English, P.H., Swing, K., Villa, G., Di Fiore, A., Voigt, C.C., Kunz, T.H.,
2010. Global Conservation Significance of Ecuador’s Yasunı´ National Park. PloS ONE
5, e8767.
Beltrán, J., 2000. Indigenous and Traditional Peoples and Protected
Areas: Principles, Guidelines and Case Studies. IUCN and WWF International., Gland,
Switzerland
and Cambridge, UK.
Bovarnick, A., Baca, J.F., Galindo, J., Negret, H., 2010. Financial Sustainability of
Protected Areas in Latin America and the Caribbean: Investment Policy Guidance.
United Nations Development Programme (UNDP) and The Nature Conservancy (TNC).
Brown, C.J., Bode, M., Venter, O., Barnes, M.D., McGowan, J., Runge, C.A., Watson,
J.E.M., Possingham, H.P., 2015. Effective conservation requires clear objectives and
prioritizing actions, not places or species. Proceedings of the National Academy of
Sciences 112, E4342.

73
Bruner, A.G., Gullison, R.E., Balmford, A., 2004. Financial Costs and Shortfalls of
Managing and Expanding Protected-Area Systems in Developing Countries. BioScience
54, 1119-1126.
Busch, J., Strassburg, B., Cattaneo, A., Lubowski, R., Boltz, F., Ashton, R., Bruner, A.,
Rice, R., Creed, A., 2009. Comparing climate and cost impacts of reference levels for
reducing emissions from deforestation. Environmental Research Letters 4, 044006.
Cantú-Salazar, L., Gaston, K.J., 2010. Very large protected areas and their contribution to
terrestrial biological conservation. BioScience 60, 808-818.
COIN NEWS, 2016. US Inflation Calculator.
Cuesta, F., Peralvo, M., Merino-Viteri, A., Bustamante, M., Baquero, F., Freile, J.F.,
Muriel, P., Torres-Carvajal, O., 2017. Priority areas for biodiversity conservation in
mainland Ecuador. Neotropical Biodiversity 3, 93-106.
Fajardo, J., Lessmann, J., Bonaccorso, E., Devenish, C., Muñoz, J., 2014. Combined Use of
Systematic Conservation Planning, Species Distribution Modelling, and Connectivity
Analysis Reveals Severe Conservation Gaps in a Megadiverse Country (Peru). PloS
ONE 9, e114367.
Finer, M., Babbit, B., Novoa, S., Ferrarese, F., Pappalardo, S.E., De Marchi, M., Saucedo,
M., Kumar, A., 2015. Future of oil and gas development in the western Amazon.
Environmental Research Letters 10, 024003.
Finer, M., Jenkins, C.N., 2012. Proliferation of Hydroelectric Dams in the Andean Amazon
and Implications for Andes-Amazon Connectivity. PloS ONE 7, e35126.
Galindo, J., Calvopiña, J., Baus, C., Ayllón, F., Vela, S., 2005. Análisis de necesidad de
financiamiento del Sistema Nacional de Áreas Protegidas (SNAP) del Ecuador.
Ministerio del Ambiente del Ecuador, Quito, Ecuador.

74
Green, J.M.H., Burgess, N.D., Green, R.E., Madoffe, S.S., Munishi, P.K.T., Nashanda, E.,
Kerry Turner, R., Balmford, A., 2012. Estimating management costs of protected areas:
A novel approach from the Eastern Arc Mountains, Tanzania. Biological Conservation
150, 5-14.
Hoekstra, J.M., Molnar, J.L., Jennings, M., Revenga, C., Spalding, M.D., Boucher, T.M.,
Robertson, J.C., Heibel, T.J., Ellison, K., 2010. The Atlas of Global Conservation:
Changes, Challenges, and Opportunities to Make a Difference ed. J.L. Molnar.
University of California Press, Berkeley.
IUCN, 2014. IUCN Red List of Threatened Species. Version 2014.3.
Jenkins, C., Pimm, S.L., Joppa, L.N., 2013. Global patterns of terrestrial vertebrate
diversity and conservation. PNAS 110, 2602-2610.
Kaimowitz, D., 2015. Indigenous Peoples and Deforestation in Latin America, In On the
Edge: The State and Fate of the World’s Tropical Rainforests. Eds C. Martin, T.E.
Lovejoy. Greystone Books, Vancouver BC.
Kark, S., Levin, N., Grantham, H.S., Possingham, H.P., 2009. Between-country
collaboration and consideration of costs increase conservation planning efficiency in the
Mediterranean Basin. PNAS 106, 15368-15373.
Lessmann, J., Fajardo, J., Muñoz, J., Bonaccorso, E., 2016. Large expansion of oil industry
in the Ecuadorian Amazon: biodiversity vulnerability and conservation alternatives.
Ecology and Evolution 6, 4997-5012.
Lessmann, J., Muñoz, J., Bonaccorso, E., 2014. Maximizing species conservation in
continental Ecuador: a case of systematic conservation planning for biodiverse regions.
Ecology and Evolution 4, 2410-2422.

75
León, F., 2005. Análisis de las Necesidades de Financiamiento del SINANPE 2005-2014.
SINANPE & PROFONANPE, Lima.
Londoño, N., 2013. Ejercicio de cálculo de la brecha financiera de las áreas protegidas del
Sistema de Parques Nacionales Naturales. Oficina Asesora de Planeación, Parques
Nacionales Naturales de Colombia, Bogotá, Colombia.
Margules, C.R., Pressey, R.L., 2000. Systematic conservation planning. Nature 405, 243-
253.
Mascia, M.B., Pailler, S., 2011. Protected area downgrading, downsizing, and
degazettement (PADDD) and its conservation implications. Conservation Letters 4, 9-
20.
Ministerio del Ambiente, 2015. Estrategia de Sostenibilidad Financiera del Sistema
Nacional de Áreas Protegidas (SNAP) del Ecuador. Ministerio del Ambiente del
Ecuador, Quito, Ecuador.
Moore, J., Balmford, A., Allnutt, T., Burgess, N.D., 2004. Integrating costs into
conservation planning across Africa. Biological Conservation 117, 343-350.
Naidoo, R., Adamowicz, W.L., 2006. Modeling Opportunity Costs of Conservation in
Transitional Landscapes. Conservation Biology 20, 490-500.
Naidoo, R., Balmford, A., Ferraro, P.J., Polasky, S., Ricketts, T.H., Rouget, M., 2006.
Integrating economic costs into conservation planning. Trends in Ecology and Evolution
21, 681-687.
Naidoo, R., Iwamura, T., 2007. Global-scale mapping of economic benefits from
agricultural lands: Implications for conservation priorities. Biological Conservation 140,
40-49.

76
Newbold, T., Hudson, L.N., Contu, S., Hill, S.L.L., Beck, J., Liu, Y., Meyer, C., Phillips,
H.R.P., Scharlemann, J.P.W., Purvis, A., 2018. Widespread winners and narrow-ranged
losers: Land use homogenizes biodiversity in local assemblages worldwide. PLOS
Biology 16, e2006841.
Phillips, S.J., Anderson, R.P., Schapire, R.E., 2006. Maximum entropy modeling of species
geographic distributions. Ecological Modelling 190, 231-259.
Porter-Bolland, L., Ellis, E.A., Guariguata, M.R., Ruiz-Mallén, I., Negrete-Yankelevich, S.,
Reyes-García, V., 2012. Community managed forests and forest protected areas: An
assessment of their conservation effectiveness across the tropics. Forest Ecology and
Management 268, 6-17.
R Core Team, 2014. R: A language and environment for statistical computing. R
Foundation for Statistical Computing, Vienna, Austria.
RAISG, 2012. Amazonía Bajo Presión.
Rodrigues, A.S.L., Andelman, S.J., Bakarr, M.I., Boitani, L., Brooks, T.M., Cowling, R.M.,
Fishpool, L.D.C., da Fonseca, G.A.B., Gaston, K.J., Hoffmann, M., Long, J.S., Marquet,
P.A., Pilgrim, J.D., Pressey, R.L., Schipper, J., Sechrest, W., Stuart, S.N., Underhill,
L.G., Waller, R.W., Watts, M.E.J., Yan, X., 2004. Effectiveness of the global protected
area network in representing species diversity. Nature 428, 640-643.
Rodriguez, L.O., Young, K.R., 2000. Biological diversity of Peru: Determining priority
areas for conservation. Ambio 29, 329-337.
Rodriguez, N., Armenteras, D., Retana, J., 2013. Effectiveness of protected areas in the
Colombian Andes: deforestation, fire and land-use changes. Regional Environmental
Change 13, 423-435.

77
Schleicher, J., 2018. The environmental and social impacts of protected areas and
conservation concessions in South America. Current Opinion in Environmental
Sustainability 32, 1-8.
Schulman, L., Ruokolainen, K., Junikka, L., Sääksjärvi, I.E., Salo, M., Juvonen, S.-K.,
Salo, J., Higgins, M., 2007. Amazonian biodiversity and protected areas: do they meet?
Biodiversity and Conservation 16, 3011-3051.
Schuster, R., Germain, R., Bennett, J., Reo, N., Secord, D., Arcese, P., 2018. Biodiversity
on Indigenous lands equals that in protected areas. bioRxiv.
Sierra, R., 1999. Propuesta preliminar de un sistema de clasificación de vegetación para el
Ecuador continental. Proyecto INEFAN/GEF-BIRF y Ecociencia, Quito.
Soares-Filho, B.S., Nepstad, D.C., Curran, L.M., Cerqueira, G.C., Garcia, R.A., Ramos,
C.A., Voll, E., McDonald, A., Lefebvre, P., Schlesinger, P., 2006. Modelling
conservation in the Amazon basin. Nature 440, 520-523.
Strassburg, B., Turner, T., Fisher, B., Schaeffer, R., Lovett, A., 2008. An Empirically-
Derived Mechanism of Combined Incentives to Reduce Emissions from Deforestation.
CSERGE Working Paper.
UNEP-WCMC and IUCN, 2019. Protected Planet: The World Database on Protected
Areas. UNEP-WCMC and IUCN, Cambridge, UK.
Venter, O., Sanderson, E.W., Magrach, A., Allan, J.R., Beher, J., Jones, K.R., Possingham,
H.P., Laurance, W.F., Wood, P., Fekete, B.M., Levy, M.A., Watson, J.E.M., 2016.
Sixteen years of change in the global terrestrial human footprint and implications for
biodiversity conservation. Nature Communications 7, 12558.
World Bank, 2016. World Bank Development Indicators. World Bank.

78
Young, B., Beck, S., Córdova, J., Embert, D., Franke, I., Hernandez, P., Herzog, S.,
Pacheco, V., Timaná, M., Tovar, C., Vargas, J., 2007. Digital distribution maps of
species endemic to the east slope of the Andes in Peru and Bolivia, ed. NatureServe,
Arlington, Virginia, USA.
Zapata-Ríos, G., Urgilés, C., Suárez, E., 2009. Mammal hunting by the Shuar of the
Ecuadorian Amazon: is it sustainable? Oryx 43, 375-385.
Zimmerman, B., 2013. Rain Forest Warriors: How Indigenous Tribes Protect the Amazon,
In National Geographic.

79
Chapter 3 - Protected areas for positive futures for nature and people in
the Andes
Janeth Lessmann 1,2, Javier Fajardo 3, Pablo A. Marquet 1,2,4,5
1 Departamento de Ecología, Pontificia Universidad Católica de Chile, Santiago, Chile. 2 Instituto de Ecología y Biodiversidad (IEB), Santiago, Chile. 3 UN Environment Programme World Conservation Monitoring Centre (UNEP-WCMC),
Cambridge, UK. 4 The Santa Fe Institute, Santa Fe, USA. 5 Laboratorio Internacional de Cambio Global (LINCGlobal) and Centro de Cambio Global
UC, Pontificia Universidad Católica de Chile, Santiago, Chile.
Abstract
We present the most comprehensive review to date of the spatial conservation needs for
both biodiversity and Nature’s Contributions to People (NCP) in the Andes, a mountain
range that hosts immense biodiversity and supports the livelihoods of more than 100
million people, but that is also under rapid environmental change. Although protected areas
cover ~21% of the Andes, we found that several critical areas for species and ecosystems
conservation remain unprotected. Closing these gaps would require protecting large land
areas with high economic costs associated. Also, there is little information on which areas
should be protected to ensure the provision of NCP. To overcome these limitations and
achieve positive futures for biodiversity and people in the Andes, the upcoming protected
area agendas in the region need to: (1) mind about their cost-effectiveness when designing
reserves while optimizing the protection of both biodiversity and benefits from nature to
people, (2) diversify governance regimes and management objectives of protected areas,
with indigenous and local communities at the forefront of the decision making process, and

80
(3) call for collaboration among Andean countries, accompanied by global financial
support. These transformative actions can make protected areas more supportive of nature
and people’s well-being in mountain landscapes.
Keywords: conservation planning, nature’s contribution to people, biodiversity, mountain
systems, indigenous peoples, human well-being.
1. Introduction
The Andes are not only the longest continental mountain range of the world 1 (Fig.
3.1). This region displays unparalleled terrestrial and freshwater biodiversity levels that are
the result of strong environmental gradients and complex topography 2,3. The long history
of interactions between people and nature in the Andes has also produced a distinct and rich
agrobiological diversity that has been shaped by an astonishing cultural diversity, currently
made up by more than 200 indigenous groups (~ 28 million people) 4–6. The livelihoods and
well-being of these indigenous groups depend on Nature’s Contributions to People (NCPs)
5,7 provided by Andean ecosystems, such as food, materials, water, energy, health security,
supporting identities, or learning and inspiration 8,9. In addition to indigenous groups, more
than 80 million upland and lowland inhabitants benefit from the NCPs provided by this
mountain range. The Andes is clearly a region of exceptional biological and cultural value
that, however, is under a large pressure from human actions (Box 1).

81
Figure 3.1. Protected areas in the Andes. (A) The Andes limits, according to Körner et al. 18. Andean countries have built an extensive network of protected areas with diverse
governance (National, Regional, Municipal or Private). (B) Percentage of the Andes
covered by protected areas according to the governance type and country, and (C)
according to IUCN categories of management objectives (blue: categories that imply strict
protection of resources, green: categories that allow multiple uses of resources).
Human occupation in Andean ecosystems has shaped the landscapes since pre-
hispanic times 10,11. During the last century, productive activities such as agriculture,
mining, and power generation through hydroelectric plants have expanded and gained
relevance for the Andean nations’ economies 5,6. These activities, together with growing
urbanization and migration, unsustainable exploitation of natural resources, and climate

82
change significantly transform the ecosystems 12, threatening Andean biodiversity 13, and
reducing nature’s capacity to provide water, food, or support the identities of indigenous
and local communities 14–17. Today the Andes are home to critical biodiversity hotspots
(Box 1) and some of the poorest and most marginalized local communities on the planet 6.
This crisis highlights the need for sustainable development strategies in the Andes,
including greater support for the conservation of biodiversity and provision of NCPs, while
respecting the rights of human communities settled in this mountain range.
Worldwide, protected areas have been crucial for sustaining mountain biodiversity
and ensuring its sustainable use 42,43. In the case of the Andes, the region is repeatedly
identified as a critical region for expanding the current protected area network and thus,
safeguard much of the world’s biodiversity (Box 1). This expansion is often suggested as a
vehicle to increase the current representation of biodiversity under protection, which means
to ensure that a sample of each required biodiversity feature is included within protected
areas and separated from human pressures 44,45. Aside from preserving biological richness,
there is growing interest in securing mountain NCPs that underpin the quality of life of
millions, and protected areas have been recognized as a means by which to help satisfy this
need 46–48. Decision-makers from the Andes thus need guidance on where and how the
expansion of protected areas can maximize the protection of biodiversity and multiple
NCPs.

83
Box 1. Evidence of the exceptional value of the Andean mountain range to the conservation
of global nature diversity.
Biodiversity
The tropical Andes (which spans from
western Venezuela to northern Chile and
Argentina) stand out by having a high
cross-taxon congruence of total species
richness, threatened species, and endemic
species 19,20. Specifically, this region is of
global botanical importance based on its
high plant endemism 21,22. It also stands out
for its high concentration of restricted-
range bird species 23 and endemic
amphibians 24.
The Andes also concentrate areas in need
of urgent protection since their high
irreplaceability regarding plants and
vertebrate species (and their ranges of
environmental conditions) are poorly
covered by protected areas 25–29. Eleven
Global 200 Ecoregions 30 are found in the
Andes, those with high priority of
protection since they represent the world’s
most unique, irreplaceable, and
biologically diverse regions. The tropical
Andes are also a global priority region for
protecting places that capture high species
richness, evolutionary potential, and
ecosystem functions 31.
Agrobiodiversity
The Andes are a center of origin for
domesticated plants and traditional
agriculture systems 32,33. The region also
harbors a high richness of globally relevant
Crop Wild Relatives. Therefore, several
priority areas for wild relatives
conservation are located in the Andes (e.g.,
potato, common bean, quinoa, squash) 34,35.
Biocultural diversity
A great diversity of species and native
languages (>100) co-occur in the Andes 36.
The region also overlaps with critical
Global Language Hotspots, places with
extremely high diversity, very little
documentation, and immediate threats of
endangerment 37.
Biodiversity and habitat loss
The Andes harbor two global Biodiversity
Hotspots (Tropical Andes and Chilean
Winter Rainfall-Valdivian Forests). These
are regions with an exceptional
concentration of endemic species
undergoing accelerated loss of habitat and
where in-situ conservation actions are
required 24,38. Tropical Andes are also
considered a Hyper Hotspot, a priority
hotspot for conservation investment in light
of its exceptional totals of endemic species 13.
Biodiversity and climate change
The Andes are an especially vulnerable
biodiversity hotspot given that >2,000
endemic plant species could become
extinct because of climate change 39. The
ecosystems of the region are also
vulnerable to vegetation shifts due to
climate change 40. The Andes also
concentrate a large coverage of high
priority areas that would minimize the
extinction risk of tropical species in future
climates 41.

84
Drawing concrete recommendations for protected-area location and management
actions in the Andes is, however, extremely challenging because of the intricate patterns of
Andean biodiversity 49, resource conflicts among different actors, accelerated human
population growth 17,50 and political borders 51. With the aim to find solutions to this
multidimensional choice problem 52, several studies on spatial conservation prioritization
have used transparent objectives and methods to identify important sites in the Andes that
should be protected to promote the persistence of biodiversity and other natural values 45,53.
These studies have also evaluated different conservation targets, planning approaches,
spatial scales, and socioeconomic constraints, delivering diverse proposals for conservation.
Crucially, these results must be systematized and integrated to identify consensus areas for
protection, the most adequate governance and management actions, as well as persisting
knowledge gaps, similarly to what has been done in other regions (e.g., Amazonian
savannahs 54 or Mediterranean Basin 55). Such analysis will set a sound basis for a
coordinated and effective protected area strategy in the Andes.
Here, we provide the first comprehensive review of the spatial conservation needs for
biodiversity and nature’s contributions to people in the Andes. We started by examining
studies published in the last decade on spatial conservation planning for Andean systems in
order to identify the current and most critical representation gaps in the region’s protected
areas in terms of biodiversity and NCPs. We also highlight the main challenges and
opportunities for efficiently expanding and managing the protected area network, thus
narrowing the conservation gaps of the Andes, and ensuring benefits to local communities.
With this contribution, we aim to help guide future agendas on protected areas to achieve
better outcomes for nature and the quality of life of Andean people. As major providers of

85
global goods and reservoirs of unique biodiversity, mountain ecosystems of the world need
to be the target of specific assessments, as the one presented here, to address with
sensitivity and specificity their needs when planning, designing, and managing protected
areas 42.
2. Conservation gaps in the Andean protected areas
Currently, the Andes display an impressive network of protected areas. This network
covers 21.6% of the region (Fig. 3.1, See Methods), exceeding the proportion of global
terrestrial surface area in protected areas (15.1%) 56 and the Aichi Biodiversity Target of
protecting 17% of important terrestrial ecosystems by 2020 57. Most of the land protected is
under strict protection of resources (IUCN categories from I to IV; 14.5% of the Andes)
and administered by national governments (16.1% of the Andes) (Fig. 3.1). This large
network of protected areas harbors key sites for Andean biodiversity conservation. For
instance, some regions with high species richness have a large concentration of protected
areas, such as the humid Yungas systems in Peru, Bolivia and Argentina or the pluvial
mountain forests in the tropical Andes 58,59. In the eastern Andean slopes of Peru and
Bolivia, protected areas partially cover four-fifth of the endemic bird species 60. Overall, the
largest richness of plant species captured throughout the protected sites in South America is
located in the Andes, 61. Similarly, the representation of species diversity of vertebrates in
protected areas is higher for the Andes than for other regions of tropical countries, such as
coastal forests in Ecuador 62,63, or the Llanos region in Venezuela 64.
Despite exceeding the target of protecting 17% of its total area, severe deficiencies in
the Andean protected-area system remain. Historically, many protected areas in the Andes

86
have been located towards upper elevations and low productive lands that usually have low
conservation costs and limited biological value 65,66. These biases have contributed to
creating recurring biological representation gaps in the protected area system 67. Here, we
reviewed 43 studies published between 2009 and 2019 that report gaps and priorities areas
for conservation in the Andes (see Methods). All Andean countries are represented in this
set of studies, but the vast majority of research was conducted in the tropical Andes
(Colombia, Ecuador, Peru, and Bolivia; Fig. 3.2). Most of the reviewed studies also
focused on assessing the representation of the diversity of vertebrate (23) and plant species
(20) in protected areas (Fig. 3.2, Supplementary Information), concluding that more land
conservation efforts should be directed towards:
• Subandean forests (500 m – 2000 m) in Colombia, Ecuador, and Peru, which have a
striking taxonomic diversity of plants and vertebrates per unit area that is also under a
high fragmentation and threats from migratory agriculture, illegal crops, and human
settlements. These forests have a lower species representation in reserves than the
more widely protected highlands ecosystems or lowland Amazonian forests 68–72.
• Species and ecosystems in the Western Andean slopes in Colombia, Ecuador and
Peru, which have lower levels of representation in protected areas compared to the
Eastern slopes and the transition to the Amazon forests 12,62,69,73–76. This insufficient
protection is especially alarming for the western slopes of Colombia and Ecuador
given their high diversity of endemic plants and birds and rates of environmental
degradation.
• Important endemism centres in the eastern slopes from Peru to Bolivia, which are
only partially covered by protected areas 12,60,77,78.

87
• Tropical dry and xeric forests and shrub remnants (e.g., in the inter-Andean valleys
and foothills of the mountain range), often less represented than tropical moist forests
58,73,77,79. Many tropical dry ecosystems have been preferred zones for agriculture and
human settlement, reducing the original vegetation and threatening a large richness of
endemic plants and birds.
• Montane forests and inter valleys from the South of Ecuador to the North of Peru,
which concentrate significant gaps in plants and vertebrate protection 62,63,76,80–82.
• Ecosystems and species located in the biologically rich and highly populated Central
Chile, which are extremely under-represented compared to the high Andes and the
Southern Andes in the country 65,83,84. Also, Chilean arid ecosystems are poorly
covered by protected areas 65,85.
• Endemic or nearly endemic and threatened species in the Andes, which are among the
worst covered groups 59,63,78,86–90. Species groups with more restricted ranges, such as
amphibians and reptiles, often have lower representation than birds 78,87,91.
• Important sites required to cover shifting species distributions and support species
migration under climate change, which often lack protection and concentrate in the
high Andes (>2000 m) and eastern foothills of tropical countries 69,81,86,88,92,93.
Preserving the habitats of these critical species and ecosystems can also underpin
NCPs in the Andes 7. Still, priority areas for protecting biodiversity and sustaining diverse
NCPs do not always overlap 94,95. Thus, it is fundamental to assess the spatial conservation
needs for NCPs, especially in the Andes, where millions of people directly depend on

88
natural resources. However, only seven of the 43 studies for conservation planning in the
Andes explicitly assessed elements of nature that contribute to people’s quality of life (Fig.
3.2). For example, according to three of these studies, most of the assessed crop wild
relatives (CWR) of potato in Bolivia, pseudocereals in Argentina, and chile peppers in the
Andes lack protection 96–98. Expanding such evaluations for diverse CWR across the Andes
is crucial because CWR are associated with various categories of NCPs, such as Medicinal,
biochemical and genetic resources, Food and Feed, Supporting Identities, and Learning and
Inspiration of local communities. Another example of NCP assessment needs comes from
Chile, where protected areas and priority sites for biodiversity poorly represent carbon
storage, agricultural production and plant productivity (related NCPs: Regulation of
Climate, Food and Feed) 66. Also, in Central Chile, protected areas play an essential role in
preserving forests at high altitudes, but their biased locations have limited the access of
people with lower incomes to the cultural services that these protected areas provide
(related NCPs: Learning and Inspiration, Physical and Physiological Experiences) 99. In the
Central Andes of Colombia, protected areas have a low overlap with priority vertebrate
species and natural areas with multiple benefits to people (related NCPs: Learning and
Inspiration, Physical and Physiological Experiences, Regulation of Water Quantity) 100.
Finally, in the Ecuadorian Andes, agriculture is a crucial resource for local economies. A
study shows that priority areas for plant diversity conservation and agriculture production
overlap (NCP: Food and Feed) in the Northern and Southern dry forests, suggesting that
land-sharing approaches to sustain and manage both features are needed 82.
We did not detect studies on conservation planning directly assessing other
components of NCPs relevant in the Andes, such as traditional landraces of crops,

89
culturally important species, or pollination provided by wild bees 101. Consequently, critical
areas for sustaining and providing NCPs in the Andes may be overlooked. The lack of
studies is probably due to the fact that spatial conservation planning has been traditionally
developed from a more naturalistic ecological perspective, focusing heavily on ecosystems
component and species rather than in social and biocultural diversity, but also because the
spatial modelling of NCPs and ecosystems services and their integration in prioritizations
have remained a major challenge 95.
Figure 3.2. Studies on spatial conservation planning in the Andes that focus on biodiversity
and/or NCPs features. (A) Number of studies (from 2009 to 2019) that directly analyze
different features of biodiversity (n = 43) or one of the 18 general categories of NCPs (n =
7). (B) Number of the studies focusing on biodiversity or NCPs by country. One study can
assess more than one feature and country.

90
3. Challenges of expanding protected areas in the Andes
Large land area extent needed
At the global level, the exact percentage of land needed to safeguard habitats and
species is unknown and a matter of discussion 44, as available estimates also depend on
target groups and target levels of protection. Still, most studies indicate that the Andes
needs a considerably large expansion of protected areas, such as doubling the current
coverage 69,71. This requirement is partially due to its high number of endemic and narrow-
ranged species demanding coverage of their particular geographic extent 41,71,102(Fig. 3.3).
By contrast, the broad and congruent geographic ranges of the species in Amazonian
lowlands allow a smaller number of well-chosen conservation areas to cover many species
71,103. Because a large extent of the Andes is already protected, such an expansion via
traditional protected areas (centralized governance with strict use of resources) would have
considerable impacts on different actors such as indigenous communities, who are
important stewards of the environment and have ancestral rights to land management 107.
However, the reviewed studies on conservation planning in the Andes poorly addressed or
mentioned social values, equity and environmental justice concerns, acceptability, and
feasibility of the proposed large expansions of conservation areas 108.

91
Figure 3.3. Configuration of ecoregions and species geographic range in the Andes. (A)
Ecoregions in the Andes 104 (shown in an orange scale of colors), which are oriented
predominantly north-south. (B) Maximum north-south and east-west dimensions of the
geographic ranges of 131 mammal endemic species in the Andes 105. Geographic ranges of
equal dimensions would fall on the diagonal line 106. Andean species tend to exhibit a great
altitudinal replacement and narrow ranges oriented north-south (above the diagonal), since
major climatic belts and biome types that influence species distribution also run north-
south. Given this species configuration, improving biodiversity protection in the Andes
requires establishing multiple conservation areas of small sizes distributed along the
altitudinal gradient.
Costly protected area expansion
Developing a much more representative network of protected areas is expected to be
expensive in the Andes, compared to the conservation costs of Amazonian reserves. In
general, a better representation of Andean biodiversity requires protecting many small areas
(e.g., less than 10,000 ha) with ecosystem fragments remnants that contain important

92
populations of endemic species 78,109, as well as protecting and restoring degraded habitats
where generalist species persist 2. Many of these areas, especially in the northern Andes,
are highly accessible, close to urban centres, or in the transition toward ecosystems where
people graze their cattle 59,87. This means that priority areas are exposed to considerable
human pressures, and they would require large budgets for restoring, managing and
preserving them 61,71. Moreover, due to economies of scale, protecting these small patches
leads to higher management costs than the same total extent arranged in large-sized areas
61,71. These reasons explain why estimated average annual management costs of priority
areas in the Amazon regions of Colombia, Ecuador and Peru, with lower human
intervention level and larger sizes, are four-time lower than those in the Andean slopes
71,110. The Andes is also characterized by a good climate and appropriate soils for cropping,
and better accessibility to markets than many regions in the Amazon, which leads to high
opportunity costs for agriculture and land acquisition costs for establishing new reserves
60,71,75.
National budgets available to manage protected areas are usually very deficient in the
Andean countries 111, making the scenario of a large expansion of protected areas with strict
protection and governmental administration even more difficult. Adequate funding is
crucial because it fosters the ability of protected areas to safeguard biodiversity and
prevents protected-area downsizing and degazettement events 112,113. Thus, although it is
regrettable that countries have not been able to protect all that is needed in the Andes, it is
also alarming that current or future protected areas lack proper funding to secure their long-
term functioning and persistence.

93
The urgency for a rapid response
Most of the priority areas in the Andes urgently need direct conservation efforts.
These places represent the last opportunities to protect natural ecosystems where much of
their original extent has been converted. Moreover, these priority areas still face massive
conversion and little protection. For example, priority areas for dry valleys of the Tropical
Andes 69 or invertebrates in the Southern Andean Yungas in Argentina 114 include the last
remnants of these regions and face severe pressure from intensive agriculture. Overall,
opportunities for establishing site-based conservation in wildland areas are much less
abundant in the Andes (60% of the non-protected surface) than in the Amazon forests (86%
of the non-protected surface) 115. Climate change effects on species range also demand
rapid response to enhance the in-situ protection of thousands of species that will undergo
reductions of their climatic niche or are expected to migrate towards unprotected sites,
particularly in the Andes 86,88. Therefore, there is a pressing need for planning and
implementing spatial conservation strategies. Still, limitations in resources and competing
land uses pose a serious challenge to practitioners and governments for timely
implementation.
4. Opportunities for expanding the protected areas in the Andes
A conservation plan for expanding Andean protected areas that is ecologically sound,
feasible and socially equitable 43 needs to address the socioeconomic challenges mentioned
above. We argue that opportunities still exist to expand conservation areas and help change
current negative trends for biodiversity and NCPs in the Andes. To achieve this goal, we
identified three main tasks for the region’s conservation planning: (1) mind about the cost-

94
effectiveness of protected areas securing biodiversity and NCP preservation, (2)
diversifying governance regimes and management objectives of protected areas, and (3)
calling for regional coordination for supporting the protection of Andean biodiversity
accompanied by global financial support. We desperately need a “biodiversity diplomacy”
that would help coordinate efforts across political boundaries in the region, improving the
cost-effectiveness of conservation.
Cost-effective expansion of protected areas for people and nature
In the Andes, competing land uses, the conservation of critical species and
ecosystems gaps, and multiple nature values can converge in the same territory. Thus,
future expansion of conservation areas in the Andes should aim at reconciling views and
needs in order to gain feasibility and long-term stability. For this, it could focus on places
that satisfy diverse conservation needs at the least possible costs and bring direct benefits to
Andean people 116. Thus, when possible, reserve planning could take the supply, demand
and flow of relevant NCPs into account 48,94. In this way, local people’s social, economic,
and cultural needs are attended together with the protection of biodiversity. For example,
the protection of known range-restricted plant species (which is a traditional conservation
object in the region) might confer a limited benefit to the protection of CWR of importance
in the Andes (such as wild potato, beans, or cereals) (Box 2). Instead, integrating both
groups into conservation planning would increase CWR representation in reserves with a
minimal decrease of benefits for range-restricted species. Thus, we ensure that preserving
these areas from environmental degradation would simultaneously contribute to mitigating

95
biodiversity loss, sustain people’s nutrition and the traditional agricultural practices and
identities of local communities.
Box 2. Balancing conservation of biodiversity and NCPs in the Andes
Conservation planning in the Andes overwhelmingly focuses on prioritizing areas that sustain
intrinsic values of biodiversity. For example, many studies highlight important areas for
protecting range-restricted plant species (RR) 77,78, which are highly diverse in the northern
Tropical Andes (A). However, reserve planning could also seek to maximize the protection and
access of other Nature’s Contribution to People (NCPs). For example, Crop Wild Relatives
(CWR), which are the wild plant cousins of cultivated crops, harbour a vast resource of genetic
diversity that is critical for underpinning the long-term resilience of the crops 119. CWR reach
high levels of richness in the Central Andes (A), where indigenous and local communities have
traditionally planted CWR alongside crops to promote the natural crossing of beneficial traits 120,121. Currently, climate change and land-use change are threatening with extinction of landraces
and CWR of importance for the Andes and the world 122–124. However, CWR have rarely been a
target of biological inventories or explicitly included in spatial prioritizations 35,122.
Here, we balanced protection for both RR plants and CWR when expanding the protected
coverage from 16% to 30% 41,125 of the Andes (B). This exercise used the Zonation algorithm to
find priority areas for conservation with low levels of human intervention and that complement
current protected areas. A total of 1726 species of SR plants 126 and 118 CWR 127 were
simultaneously included as target groups, allowing us to identify areas that retain a higher
probability of species occurrence from both groups. Identified priority areas could increase the
average protection of species distributions from the current 10% coverage to 41% for CWR, and

96
from 14% to 36% for RR plants (B). Although a conservation-planning scenario based only on
RR plants achieves similar benefits for this group, this scenario confers a much lower coverage
for CWR (average protection of species distributions: 26%) (B). This exercise shows how
directly incorporating NCP indicators can help enrich the value and benefit that zoned protected
areas provide whilst optimizing the efficient investment of resources.
The identified priority areas and current protected areas
could have different management priorities based on the
diversity levels of RR plants and CWR they harbour. For
example, several priority areas in Bolivia retain the most
significant areas of many CWR (yellow areas). Actions
to manage and monitor the genetic diversity in natural
populations of CWR are essential in these areas 128.
Efforts to assist the protection of RR plants would be
especially relevant in the selected areas in the North of
Ecuador and Central Chile (green areas), where the
diversity of RR plants is high. However, most priority
and protected areas have equally high conservation
values for both RR plants and CWR (red areas), which
demands simultaneous actions for managing these
groups 128.
Protected and priority areas in the Andes also embrace
landscapes that sustain a large part of the region’s
cultural diversity (A). This network overlaps with the
geographic ranges 129 of 91 of the 100 indigenous
linguistic groups in the Andes, with an average of 38%
of their ranges retained (B). Thus, to guarantee these
cultures’ right to thrive, a land conservation strategy for
the Andes must include indigenous and local
communities’ aspirations and perspectives and ensure
their access and management of biodiversity and NCPs,
including CWR of interest.
(See Supplementary Information for the methodological
details of this prioritization).

97
In addition, future studies on conservation planning in the Andes should integrate
indigenous and local communities’ conceptions and values of nature and biodiversity at the
core of plans and decisions 116,117. It is also important to keep in mind that integrative
conservation planning combining NCPs, social values, and biodiversity must assess if
protection goals and management strategies for the different targets are compatible 118, or if
integrating multiple NCPs could mask key biodiversity areas for protection 48. Other
significant research gaps in cost-effective planning for the Andes that should be addressed
are (Fig. 3.2): (1) assessment of other taxa with poor data available, such as invertebrates,
fungi, fish species, and the effects of climate change in these groups, and (2)
complementary metrics of biodiversity, such as functional and genetic diversity.
Diversifying models of protected areas
Most of the current protected areas in the Andes are centralized and conceived for
restricting the use of natural resources (Fig. 3.1). To overcome the socioeconomic
challenges mentioned above, the Andes need to encourage protected areas under more
diverse governance regimes and management objectives that respond to specific
conservation needs and socioeconomic contexts. For example, given the fine-scale of
protection required to preserve endemisms and their closeness to human centres and
agricultural lands, many of the small-sized priority areas for conservation could be taken
over by local communities, private owners and foundations 78,109. These areas could use
innovative ways to combine revenues for their managers and positive outcomes for
biodiversity 60,77,109. In other cases, highly vulnerable biodiversity might need strict
protection, such as paramos in the Northern Andes 130. New protected areas could also

98
integrate the management and use of diverse NCPs while contributing to biodiversity
protection. In Peru, the Potato Park is an example of the potential that new protected-area
models have in contributing to the maintenance of local livelihoods and biocultural
diversity in traditional agricultural landscapes 50. Local communities lead this conservation
model, and it focuses on the conservation and sustainable use of plant genetic resources
through traditional Andean approaches to agrobiodiversity and landscape protection 50.
Overall, we emphasize the importance of supporting diverse conservation-based area
models where people are acknowledged as an integral element of protected areas,
particularly indigenous people, and traditional economic practices.
The expansion of in-situ protection in the Andes could also rely on other effective
area-based conservation measures (OECM), that deliver effective protection despite not
listing biodiversity conservation as their primary objective 131. For example, in the
Mediterranean region of Chile Central, where less than 2% of extent is formally protected,
there are sustainability programs at vineyards that seek to promote practices compatible
with biodiversity protection and enhance the cultural benefits of nature 132. Integrating
OECM into a regional strategy has the potential to make area-based conservation more
socially equitable, as they are managed to deliver positive outcomes for biodiversity
conservation and landowners, especially where natural resources are major components to
sustain livelihoods 133.
Regional collaboration and international support
The Andes often lack a coordinated and regional vision for the conservation of its
biodiversity and NCPs. For instance, most reviewed studies on systematic conservation

99
planning in the Andes (26 out of 43) were carried within national boundaries. However, the
geographical range of many species and ecosystems, watersheds, etc., are not restricted by
national borders (Fig. 3.4). Therefore, national analyses can miss opportunities to identify
less expensive opportunities to protect species arise from the larger territory under planning
71,87. Moreover, within the tropical Andes, high number of mammal and bird species are
projected to move across political borders under climate change 51. These species
movements demand regional planning and proactive cooperation among countries to
identify macro corridors for the dispersion and flow of species with high mobility 134. Thus,
such national-scale analyses, although relevant, provides little basis for a regional
protected-area strategy. Similarly, spaces for regional collaboration and cooperation are
scarce in the Andes (such as Alianza para las Montañas). By contrast, the protection of
Amazon biome counts on several initiatives where scientists, local communities, NGOs,
and governments across countries collaborate (e.g., Science Panel for the Amazon, Red
Amazónica de Información Socioambiental Georreferenciada RAISG, the Amazon
Conservation Vision, Amazon Sustainable Landscapes Program, among others). Creating
these opportunities for the Andes is crucial to enhance its biodiversity and NCP
conservation. In these spaces, local and regional actors can share capacities and experiences
of successful outcomes in protected areas and mobilize different perspectives to change the
current direction towards a positive future for nature and people in the Andes.
The economic investment required for the rapid response to enlarge conservation
needed by the Andes is considerably high. At the same time, public financing for the
management of Andean protected areas has historically been insufficient 111. It is clear that
Andean nations could increase their investment in protecting nature 135. However,

100
international cooperation for financing a more extensive protected-area network is not only
well justified but urgently needed. The vulnerability and importance of the contribution of
Andean ecosystems to other ecosystems in the region and the Amazon in particular, makes
it an important component of world’s well-being, a worth of supporting their conservation
as ‘global common good’ 42,136 under the mechanism proposed by the new Global
Agreement for Biodiversity 137. In this agreement, besides establishing a global target for
land protection, wealthier countries and private industries could commit to assist
conservation in developing and biodiverse regions, such as the Andes, by setting specific
financial support.
Figure 3.4. Number of species shared among Andean countries. A large proportion (~
55%) of Andean plant and vertebrate species is distributed in more than one country of the
region, which calls for better cross-border collaboration when planning for species
conservation. These estimates were based on the geographic ranges or occurrence records
available for 16,708 plant species 126 and for 4,516 species of birds, mammals, reptiles, and
amphibians 105.

101
5. Conclusions
This study presents the most comprehensive review to date of the spatial conservation
needs of the Andes, a region where nature and quality of life of people are strongly
interconnected. Our review makes it evident that critical areas for species and ecosystems
remain unprotected, but more importantly, that nature contributions to people are not
usually taken into account in these assessments. We consider that, when possible, an
expansion of area-based conservation in the Andes should integrate the protection and
access of critical NCPs associated with human welfare while maintaining and restoring
habitats that support biodiversity. Moreover, indigenous peoples and local communities
need to be at the centre of the discussions, decisions, and governance to respect their land
rights, recognizing the value of traditional knowledge to manage biodiversity and NCPs.
These suggestions involve coordinated cross-boundary efforts, moving towards
multifunctional protected areas, and redefining their current purpose in the Andes, which is
mainly the protection of biodiversity via restricted resource use. Implementing these and
other transformative changes also require tracking their positive and negative impact on
biodiversity, indigenous and local communities, and land managers. Although protected
areas are only some of the possible interventions in nature conservation, they have an
unequalled potential to make human-dominated landscapes more supportive of biodiversity
and people’s well-being from mountain systems.

102
6. Methods
Coverage of protected areas in the Andes
We used the definition and spatial information of Körner et al. 2016 18 to set the
limits of the Andes mountain range (Fig. 3.1). Based on these limits, the Andes cover 2.9
million km2 distributed across Venezuela (4% of the Andes), Colombia (12%), Ecuador
(4%), Peru (24%), Bolivia (15%), Chile (22%) and Argentina (19%). The Andes occupy a
large extent of these countries, ranging from 11% of Venezuela to 84% of Chile’s terrestrial
extent. To calculate the surface of the Andes that is covered by protected areas, we gathered
the most updated information (by 2020) of the protected-area boundaries from national
agencies or the Minister of Environment offices of each country. We included reserves that
are part of national, regional, municipal, and private conservation networks when available
and applicable. We could not access comprehensive spatial data for private reserves in
Venezuela and Bolivia, which consequently were not included in the analyses.
Literature review
We conducted a state-of-the-art review 138 of articles on spatial prioritizations and
protected area evaluations that have assessed Andean regions. This includes regional,
national, or subnational-scale studies across the seven countries that comprise the Andes:
Venezuela, Colombia, Ecuador, Peru, Bolivia, Chile, and Argentina. The first selection of
articles, written in English or Spanish, used the search engine Web of Science and the
following combinations of words in the topic (TS): (Andes OR Andean) AND (“protected
areas” OR “priority areas” OR prioritization OR “gap analysis” OR “conservation

103
planning” OR “systematic conservation planning” OR “reserve selection”). We also
conducted the search in Google using the same combination of keywords to identify theses,
governmental or NGOs reports not published in scientific databases (grey literature). The
search was applied to published works between 2009 and 2019 to obtain information
relevant to the decision-makers, as these studies are based on more updated protected area
coverage. Since the Andes cover a high proportion of the continental extent of Chile
(~84%), we included all studies on conservation planning carried out national level.
We explored abstracts and full texts to filter articles including insights of spatial
conservation priorities for the Andes explicitly, with a focus on (1) reviewing existing
protected areas based on their coverage of different conservation objects and/or (2)
identifying additional areas to protect according to different objectives and approaches,
such as closing representation gaps, retaining nature’s benefits to people, preserving
wilderness, endemism centers, etc. Filtering by these criteria resulted in 43 articles, reports,
or documents for reviewing (Supplementary Information). We extracted the following
information from each item: (1) year of publication and type of study (published article in a
peer-reviewed journal or grey literature), (2) study location and country, (3) whether the
study is intended at protecting biodiversity or/and nature features and services directly
related to people’s quality life (i.e. NCPs), (4) specific target feature assessed (biodiversity:
species, ecosystems/ecoregions, functional diversity, genetic diversity, morphological
diversity; or NCP categories), (5) whether the study considered the effect of climate
change, (6) representation of features in protected areas, (7) characteristics of the identified
priority areas (if including a prioritization), and (9) highlighted challenges and
opportunities to protect these areas. To classify the NCPs, we used the 18 categories of the

104
IPBES generalizing perspective 7. Finally, we stress that evaluating protection effectiveness
of biodiversity features and NCPs (which can affect their representation level) is beyond
the scope of this paper.
7. Supplementary Information
1. List of reviewed studies.
2. Detailed methods for “Box 2 - Balancing conservation of biodiversity and NCPs in
the Andes”.
3. List of species used in “Box 2 - Balancing conservation of biodiversity and NCPs in
the Andes”.
8. References
1. Borsdorf, A. & Stadel, C. The Andes: a geographical portrait. (Springer Geography,
2015).
2. Fjeldsa, J. & Irestedt, M. Diversification of the South American avifauna: Patterns
and implications for conservation in the Andes. Ann. Missouri Bot. Gard. 96, 398–
409 (2009).
3. Raven, P. H. et al. The distribution of biodiversity richness in the tropics. Sci. Adv. 6,
eabc6228 (2020).
4. Young, K. R. Andean land use and biodiversity: humanized landscapes in a time of
change. Ann. Missouri Bot. Gard. 96, 492–507 (2009).
5. Devenish, C. & Gianella, C. 20 years of Sustainable Mountain Development in the
Andes - from Rio 1992 to 2012 and beyond. (CONDESAN, 2012).
6. FAO. Cordillera de Los Andes, una oportunidad para la integración y desarrollo de
América del Sur. (FAO y Alianza para las Montañas, 2014).
7. Díaz, S. et al. Assessing nature’s contributions to people. Science (80-. ). 359, 270–
272 (2018).
8. Martín-López, B. et al. Nature’s contributions to people in mountains: A review.

105
PLoS One 14, e0217847 (2019).
9. Payne, D., Spehn, E. M., Snethlage, M. & Fischer, M. Opportunities for research on
mountain biodiversity under global change. Curr. Opin. Environ. Sustain. 29, 40–47
(2017).
10. Fjeldsa, J. The relationship between biodiversity and population centres: the high
Andes region as an example. Biodivers. Conserv. 16, 2739–2751 (2007).
11. Armenteras, D., Rodríguez, N., Retana, J. & Morales, M. Understanding
deforestation in montane and lowland forests of the Colombian Andes. Reg. Environ.
Chang. 11, 693–705 (2011).
12. Young, B. E. et al. Ecosystem profile: Tropical Andes biodiversity hotspot. (2015).
13. Brooks, T. M. et al. Habitat Loss and Extinction in the Hotspots of Biodiversity.
Conserv. Biol. 16, 909–923 (2002).
14. Balthazar, V., Vanacker, V., Molina, A. & Lambin, E. F. Impacts of forest cover
change on ecosystem services in high Andean mountains. Ecol. Indic. 48, 63–75
(2015).
15. Barreau, A., Tomas Ibarra, J., Wyndham, F. S., Rojas, A. & Kozak, R. A. How can
we teach our children if we cannot access the forest? Generational change in
Mapuche knowledge of wild edible plants in Andean temperate ecosystems of Chile.
J. Ethnobiol. 36, 412–432 (2016).
16. Clerici, N., Cote-Navarro, F., Escobedo, F. J., Rubiano, K. & Villegas, J. C. Spatio-
temporal and cumulative effects of land use-land cover and climate change on two
ecosystem services in the Colombian Andes. Sci. Total Environ. 685, 1181–1192
(2019).
17. Pedraza, S. et al. Perception of conservation strategies and nature’s contributions to
people around Chingaza National Natural Park, Colombia. Environ. Conserv. 47,
158–165 (2020).
18. Körner, C. et al. A global inventory of mountains for bio-geographical applications.
Alp. Bot. 127, 1–15 (2017).
19. Orme, C. D. L. et al. Global hotspots of species richness are not congruent with
endemism or threat. Nature 436, 1016–1019 (2005).
20. Grenyer, R. et al. Global distribution and conservation of rare and threatened
vertebrates. Nature 444, 93–96 (2006).
21. Barthlott, W., Mutke, J., Rafiqpoor, D., Kier, G. & Kreft, H. Global Centers of
Vascular Plant Diversity. Nov. Acta Leopoldina 92, 61–83 (2005).
22. Humphries, C. J. Centres of Plant Diversity. A Guide and Strategy for their
Conservation. New Phytol. 135, 567–574 (1997).
23. BirdLife International. Endemic Bird Areas of the world: priorities for biodiversity
conservation. (BirdLife International, 1998).
24. Myers, N., Mittermeier, R. A., Mittermeier, C. G., Da Fonseca, G. A. B. & Kent, J.
Biodiversity hotspots for conservation priorities. Nature 403, 853–858 (2000).

106
25. Rodrigues, A. S. L. et al. Global Gap Analysis: towards a representative network of
protected areas. Advances in Applied Biodiversity Science (Conservation
International, 2003).
26. Rodrigues, A. S. L. et al. Global gap analysis: priority regions for expanding the
global protected-area network. Bioscience 54, 1092–1100 (2004).
27. Cantú-Salazar, L., Orme, C. D. L., Rasmussen, P. C., Blackburn, T. M. & Gaston, K.
J. The performance of the global protected area system in capturing vertebrate
geographic ranges. Biodivers. Conserv. 22, 1033–1047 (2013).
28. Montesino Pouzols, F. et al. Global protected area expansion is compromised by
projected land-use and parochialism. Nature 516, 383–386 (2014).
29. Hanson, J. O. et al. Global conservation of species’ niches. Nature 580, 232–234
(2020).
30. Olson, D. M. & Dinerstein, E. The Global 200: Priority Ecoregions for Global
Conservation. Ann. Missouri Bot. Gard. 89, 199–224 (2002).
31. Brum, F. T. et al. Global priorities for conservation across multiple dimensions of
mammalian diversity. Proc. Natl. Acad. Sci. 114, 7641–7646 (2017).
32. Vavilov, N. I. Origin and geography of cultivated plants. (Cambridge University
Press, 1952).
33. Hawkes, J. G. The Diversity of Crop Plants. (Harvard University Press, 1993).
34. Maxted, N., Kell, S., Ford-Lloyd, B., Dulloo, E. & Toledo, Á. Toward the
Systematic Conservation of Global Crop Wild Relative Diversity. Crop Sci. 52,
(2012).
35. Vincent, H. et al. Modeling of crop wild relative species identifies areas globally for
in situ conservation. Commun. Biol. 2, 136 (2019).
36. Gorenflo, L. J., Romaine, S., Mittermeier, R. A. & Walker-Painemilla, K. Co-
occurrence of linguistic and biological diversity in biodiversity hotspots and high
biodiversity wilderness areas. Proc. Natl. Acad. Sci. 109, 8032–8037 (2012).
37. Living Tongues Institute for Endangered Languages. Language Hotspots.
38. Brooks, T. M. et al. Global Biodiversity Conservation Priorities. Science (80-. ). 313,
58–61 (2006).
39. Malcolm, J. R., Liu, C. R., Neilson, R. P., Hansen, L. & Hannah, L. Global warming
and extinctions of endemic species from biodiversity hotspots. Conserv. Biol. 20,
538–548 (2006).
40. Gonzalez, P., Neilson, R. P., Lenihan, J. M. & Drapek, R. J. Global patterns in the
vulnerability of ecosystems to vegetation shifts due to climate change. Glob. Ecol.
Biogeogr. 19, 755–768 (2010).
41. Hannah, L. et al. 30% land conservation and climate action reduces tropical
extinction risk by more than 50%. Ecography (Cop.). 43, 943–953 (2020).
42. UNEP & GRID-Arenda. Elevating Mountains in the post-2020 Global Biodiversity

107
Framework. (2019).
43. Kollmair, M., Gurung, G. S., Hurni, K. & Maselli, D. Mountains: Special places to
be protected? An analysis of worldwide nature conservation efforts in mountains.
Int. J. Biodivers. Sci. Manag. 1, 181–189 (2005).
44. Kuempel, C. D., Chauvenet, A. L. M., Possingham, H. P. & Adams, V. M.
Evidence-Based Guidelines for Prioritizing Investments to Meet International
Conservation Objectives. One Earth 2, 55–63 (2020).
45. Margules, C. R. & Pressey, R. L. Systematic conservation planning. Nature 405,
243–253 (2000).
46. Stolton, S. & Dudley, N. Arguments for Protected Areas. Multiple Benefits for
Conservation and Use. (Earthscan, 2010).
47. Yu, Y., Li, J., Zhou, Z., Ma, X. & Zhang, X. Response of multiple mountain
ecosystem services on environmental gradients: How to respond, and where should
be priority conservation? J. Clean. Prod. 123264 (2020).
48. Ramel, C. et al. Integrating ecosystem services within spatial biodiversity
conservation prioritization in the Alps. Ecosyst. Serv. 45, 101186 (2020).
49. Hazzi, N. A., Moreno, J. S., Ortiz-Movliav, C. & Palacio, R. D. Biogeographic
regions and events of isolation and diversification of the endemic biota of the
tropical Andes. Proc. Natl. Acad. Sci. 115, 7985–7990 (2018).
50. Amend, T., Brown, J., Kothari, A., Phillips, A. & Stolton, S. Protected Landscapes
and Agrobiodiversity Values. (IUCN & GTZ, 2008).
51. Titley, M. A., Butchart, S. H. M., Jones, V. R., Whittingham, M. J. & Willis, S. G.
Global inequities and political borders challenge nature conservation under climate
change. Proc. Natl. Acad. Sci. 118, e2011204118 (2021).
52. Gregory, R. et al. Structured decision making: a practical guide to environmental
management choices. (John Wiley & Sons, 2012).
53. Moilanen, A., Wilson, K. & Possingham, H. Spatial conservation prioritization:
quantitative methods and computational tools. (Oxford University Press, 2009).
54. de Carvalho, W. D. & Mustin, K. The highly threatened and little known Amazonian
savannahs. Nat. Ecol. Evol. 1, 100 (2017).
55. Micheli, F. et al. Setting Priorities for Regional Conservation Planning in the
Mediterranean Sea. PLoS One 8, e59038 (2013).
56. UNEP-WCMC & IUCN. Protected Planet: The World Database on Protected Areas
(WDPA), January 2020 version. (2020).
57. CBD, C. on B. D. Strategic plan for biodiversity 2011-2020 and the Aichi targets.
(2010).
58. Cuesta, F., Peralvo, M. & Valarezo, N. Los bosques montanos de los Andes
Tropicales. Una evaluación regional de su estado de conservación y de su
vulnerabilidad a efectos del cambio climático. Serie Investigación y Sistematización
#5 (Programa Regional ECOBONA – INTERCOOPERATION, 2009).

108
59. Godoy-Buerki, A. C., Ortega-Baes, P., Sajama, J. M. & Aagesen, L. Conservation
priorities in the Southern Central Andes: mismatch between endemism and diversity
hotspots in the regional flora. Biodivers. Conserv. 23, 81–107 (2014).
60. Young, B. F. et al. Using spatial models to predict areas of endemism and gaps in
the protection of Andean slope birds. Auk 126, 554–565 (2009).
61. Ramirez-Villegas, J., Jarvis, A. & Touval, J. Analysis of threats to South American
flora and its implications for conservation. J. Nat. Conserv. 20, 337–348 (2012).
62. Lessmann, J., Muñoz, J. & Bonaccorso, E. Maximizing species conservation in
continental Ecuador: a case of systematic conservation planning for biodiverse
regions. Ecol. Evol. 4, 2410–2422 (2014).
63. Cuesta, F. et al. Priority areas for biodiversity conservation in mainland Ecuador.
Neotrop. Biodivers. 3, 93–106 (2017).
64. Delgado, M. Evaluation and design of protected areas for priority conservation
mammals, birds, and amphibians in Venezuela. (Universidad Internacional
Menéndez Pelayo, 2012).
65. Martinez-Tilleria, K. et al. A framework for the classification Chilean terrestrial
ecosystems as a tool for achieving global conservation targets. Biodivers. Conserv.
26, 2857–2876 (2017).
66. Durán, A. P., Casalegno, S., Marquet, P. A. & Gaston, K. J. Representation of
Ecosystem Services by Terrestrial Protected Areas: Chile as a Case Study. PLoS One
8, e82643 (2013).
67. Tognelli, M. F., de Arellano, P. I. R. & Marquet, P. A. How well do the existing and
proposed reserve networks represent vertebrate species in Chile? Divers. Distrib. 14,
148–158 (2008).
68. Galindo, G., Cabrera, E., Otero, J., Bernal, N. R. & Palacios, S. Planificación
ecorregional para la conservación de la biodiversidad en los Andes y en el
Piedemonte amazónico colombianos. Serie Planificación Ecorregional para la
Conservación de la Biodiversidad, No. 2. (Instituto de Investigación de Recursos
Biológicos Alexander von Humboldt, Agencia Nacional de Hidrocarburos, The
Nature Conservancy e Instituto de Hidrología, Meteorología y Estudios Ambientales,
2009).
69. Fajardo, J. et al. A crucial time to balance protected-area networks in the tropical
Andean countries. (Universidad Internacional Menéndez Pelayo, 2019).
70. Asner, G. P., Martin, R. E., Tupayachi, R. & Llactayo, W. Conservation assessment
of the Peruvian Andes and Amazon based on mapped forest functional diversity.
Biol. Conserv. 210, 80–88 (2017).
71. Lessmann, J., Fajardo, J., Bonaccorso, E. & Bruner, A. Cost-effective protection of
biodiversity in the western Amazon. Biol. Conserv. 235, 250–259 (2019).
72. Thomassen, H. A. et al. Mapping evolutionary process: a multi-taxa approach to
conservation prioritization. Evol. Appl. 4, 397–413 (2011).
73. Londono-Murcia, M. C., Tellez-Valdes, O. & Sanchez-Cordero, V. Environmental

109
heterogeneity of World Wildlife Fund for Nature ecoregions and implications for
conservation in Neotropical biodiversity hotspots. Environ. Conserv. 37, 116–127
(2010).
74. Mateo, R. G., de la Estrella, M., Felicísimo, A., Muñoz, J. & Guisan, A. A new spin
on a compositionalist predictive modelling framework for conservation planning: A
tropical case study in Ecuador. Biol. Conserv. 160, 150–161 (2013).
75. Ocampo-Penuela, N. & Pimm, S. L. Setting Practical Conservation Priorities for
Birds in the Western Andes of Colombia. Conserv. Biol. 28, 1260–1270 (2014).
76. Reyes-Puig, C., Almendáriz, A. & Torres-Carvajal, O. Diversity, threat, and
conservation of reptiles from continental Ecuador. Amphib. Reptil. Conserv. 11, 51–
58 (2017).
77. Banda-R, K. et al. Plant diversity patterns in neotropical dry forests and their
conservation implications. Science (80-. ). 353, 1383 (2016).
78. Swenson, J. J. et al. Plant and animal endemism in the eastern Andean slope:
challenges to conservation. Bmc Ecol. 12, (2012).
79. Josse, C. et al. Mapa de Ecosistemas de los Andes del Norte y Centro. Bolivia,
Colombia, Ecuador, Perú y Venezuela. (Secretaría General de la Comunidad Andina,
Programa Regional ECOBONA, CONDESAN-Proyecto Páramo Andino, Programa
BioAndes, EcoCiencia, NatureServe, LTA-UNALM, IAvH, ICAE-ULA, CDC-
UNALM, RUMBOL SRL, 2009).
80. Fajardo, J., Lessmann, J., Bonaccorso, E., Devenish, C. & Muñoz, J. Combined use
of systematic conservation planning, species distribution modelling, and connectivity
analysis reveals severe conservation gaps in a megadiverse country (Peru). PLoS
One 9, (2014).
81. SPARC. Spatial Planning for Area Conservation in Response to Climate Change:
Conservation priorities in response to climate change. (2019).
82. Quintana, C., Girardello, M. & Balslev, H. Balancing plant conservation and
agricultural production in the Ecuadorian Dry Inter-Andean Valleys. PeerJ 7, e6207
(2019).
83. Pliscoff, P. & Fuentes-Castillo, T. Representativeness of terrestrial ecosystems in
Chile’s protected area system. Environ. Conserv. 38, 303–311 (2011).
84. Marquet, P. A. et al. Biodiversidad y cambio climático en Chile: Evidencia científica
para la toma de decisiones. Informe de la mesa de Biodiversidad. (Comité Científico
COP25, Ministerio de Ciencia, Tecnología, Conocimiento e Innovación, 2019).
85. Schutz, J. Creating an integrated protected area network in Chile: A GIS assessment
of ecoregion representation and the role of private protected areas. Environ. Conserv.
45, 269–277 (2018).
86. Velasquez-Tibata, J. et al. Effects of climate change on species distribution,
community structure, and conservation of birds in protected areas in Colombia. Reg.
Environ. Chang. 13, 235–248 (2012).
87. Bax, V. & Francesconi, W. Conservation gaps and priorities in the Tropical Andes

110
biodiversity hotspot: Implications for the expansion of protected areas. J. Environ.
Manage. 232, 387–396 (2019).
88. Avalos, V. del R. & Hernández, J. Projected distribution shifts and protected area
coverage of range-restricted Andean birds under climate change. Glob. Ecol.
Conserv. 4, 459–469 (2015).
89. Tognelli, M. F. et al. Assessing conservation priorities of endemic freshwater fishes
in the Tropical Andes region. Aquat. Conserv. Mar. Freshw. Ecosyst. 29, 1123–1132
(2019).
90. Ferretti, N., González, A. & Pérez–Miles, F. Identification of priority areas for
conservation in Argentina: quantitative biogeography insights from mygalomorph
spiders (Araneae: Mygalomorphae). J. Insect Conserv. 18, 1087–1096 (2014).
91. Espinel, M., Cáceres-Martínez, C. & Acevedo, A. Protected areas assessment for the
conservation of threatened amphibians in the Cordillera Oriental of Colombia.
Herpetol. Notes 10, 685–696 (2017).
92. Cuesta, F. et al. Escenarios de impacto del cambio climático sobre la biodiversidad
del Ecuador continental y sus implicaciones en el sistema nacional de áreas
protegidas. (Ministerio de Ambiente del Ecuador. CONDESAN. Escuela de
Ciencias Biológicas, Pontificia Universidad Católica del Ecuador, 2015).
93. Bennett, M., Marquet, P. A., Sillero-Zubiri, C. & Marino, J. Shifts in habitat
suitability and the conservation status of the Endangered Andean cat Leopardus
jacobita under climate change scenarios. Oryx 53, 356–367 (2019).
94. Durán, A. P., Duffy, J. P. & Gaston, K. J. Exclusion of agricultural lands in spatial
conservation prioritization strategies: consequences for biodiversity and ecosystem
service representation. Proc. R. Soc. London B Biol. Sci. 281, (2014).
95. Chaplin-Kramer, R. et al. Global modeling of nature’s contributions to people.
Science (80-. ). 366, 255–258 (2019).
96. Cadima, X. et al. Endemic wild potato (Solanum spp.) biodiversity status in Bolivia:
Reasons for conservation concerns. J. Nat. Conserv. 22, 113–131 (2014).
97. Curti, R. N., Sajama, J. & Ortega-Baes, P. Setting conservation priorities for
Argentina’s pseudocereal crop wild relatives. Biol. Conserv. 209, 349–355 (2017).
98. Khoury, C. K. et al. Modelled distributions and conservation status of the wild
relatives of chile peppers (Capsicum L.). Divers. Distrib. 26, 209–225 (2020).
99. Martinez-Harms, M. J. et al. Inequality in access to cultural ecosystem services from
protected areas in the Chilean biodiversity hotspot. Sci. Total Environ. 636, 1128–
1138 (2018).
100. García Márquez, J. R. et al. Effectiveness of conservation areas for protecting
biodiversity and ecosystem services: a multi-criteria approach. Int. J. Biodivers. Sci.
Ecosyst. Serv. Manag. 13, 1–13 (2017).
101. IPBES. The IPBES regional assessment report on biodiversity and ecosystem
services for the Americas. (IPBES, 2018).

111
102. Rodrigues, A. S. L. & Gaston, K. J. How large do reserve networks need to be? Ecol.
Lett. 4, 602–609 (2001).
103. Fjeldsa, J. & Rahbek, C. Priorities for conservation in Bolivia, Illustrated by a
continent-wide analysis of bird distributions. in Biodiversity: A Challenge for
Development Research and Policy (eds. Barthlott, W., Winiger, M. & Biedinger, N.)
313–327 (Springer Berlin Heidelberg, 2001).
104. Dinerstein, E. et al. An Ecoregion-Based Approach to Protecting Half the Terrestrial
Realm. Bioscience 67, 534–545 (2017).
105. IUCN. IUCN Red List of Threatened Species. (2020). Available at:
www.iucnredlist.org. (Accessed: 10th December 2020)
106. Brown, J. H. & Maurer, B. A. Macroecology: The Division of Food and Space
among Species on Continents. Science (80-. ). 243, 1145–1150 (1989).
107. Armesto, J. J., Smith‐Ramirez, C. & Rozzi, R. Conservation strategies for
biodiversity and indigenous people in Chilean forest ecosystems. J. R. Soc. New
Zeal. 31, 865–877 (2001).
108. Schleicher, J. et al. Protecting half of the planet could directly affect over one billion
people. Nat. Sustain. 2, 1094–1096 (2019).
109. Wilson, S. J. & Rhemtulla, J. M. Small montane cloud forest fragments are
important for conserving tree diversity in the Ecuadorian Andes. Biotropica 50, 586–
597 (2018).
110. Galindo, J., Calvopiña, J., Baus, C., Ayllón, F. & Vela, S. Análisis de necesidad de
financiamiento del Sistema Nacional de Áreas Protegidas (SNAP) del Ecuador.
(Ministerio del Ambiente del Ecuador, 2005).
111. Bovarnick, A., Baca, J. F., Galindo, J. & Negret, H. Financial Sustainability of
Protected Areas in Latin America and the Caribbean: Investment Policy Guidance.
(United Nations Development Programme and The Nature Conservancy, 2010).
112. Mascia, M. B. et al. Protected area downgrading, downsizing, and degazettement
(PADDD) in Africa, Asia, and Latin America and the Caribbean, 1900–2010. Biol.
Conserv. 169, 355–361 (2014).
113. Keles, D., Delacote, P., Pfaff, A., Qin, S. & Mascia, M. B. What Drives the Erasure
of Protected Areas? Evidence from across the Brazilian Amazon. Ecol. Econ. 176,
106733 (2020).
114. Ovando, X. M. C., Miranda, M. J., Loyola, R. & Cuezzo, M. G. Identifying priority
areas for invertebrate conservation using land snails as models. J. Nat. Conserv. 50,
125707 (2019).
115. Gosling, J. et al. A global mapping template for natural and modified habitat across
terrestrial Earth. Biol. Conserv. 108674 (2020).
116. Whitehead, A. M. Y. L. et al. Integrating Biological and Social Values When
Prioritizing Places for Biodiversity Conservation. Conserv. Biol. 28, 992–1003
(2014).

112
117. Pascual, U. et al. Biodiversity and the challenge of pluralism. Nat. Sustain. (2021).
118. Barros, A., Monz, C. & Pickering, C. Is tourism damaging ecosystems in the Andes?
Current knowledge and an agenda for future research. Ambio 44, 82–98 (2015).
119. Dempewolf, H. et al. Past and Future Use of Wild Relatives in Crop Breeding. Crop
Sci. 57, 1070–1082 (2017).
120. Guevara, J. T. & Rondinel, F. P. Parientes silvestres de plantas nativas cultivadas
andinas (Perú): Los Sachas. (Coordinadora de Ciencia y Tecnología en los Andes,
2008).
121. Fagandini Ruiz, F., Bazile, D., Drucker, A. G., Tapia, M. & Chura, E. Geographical
distribution of quinoa crop wild relatives in the Peruvian Andes: a participatory
mapping initiative. Environ. Dev. Sustain. (2020).
122. Vincent, H. et al. A prioritized crop wild relative inventory to help underpin global
food security. Biol. Conserv. 167, 265–275 (2013).
123. Velásquez-Milla, D., Casas, A., Torres-Guevara, J. & Cruz-Soriano, A. Ecological
and socio-cultural factors influencing in situ conservation of crop diversity by
traditional Andean households in Peru. J. Ethnobiol. Ethnomed. 7, 40 (2011).
124. Stokstad, E. The new potato. Science (80-. ). 363, 574 LP – 577 (2019).
125. Waldron, A. et al. Protecting 30% of the planet for nature: costs, benefits and
economic implications. (2020).
126. Enquist, B. J., Condit, R., Peet, R. K., Schildhauer, M. & Thiers, B. M.
Cyberinfrastructure for an integrated botanical information network to investigate
the ecological impacts of global climate change on plant biodiversity. PeerJ Prepr.
4, e2615v2 (2016).
127. Khoury, C. K. et al. Data for the calculation of an indicator of the
comprehensiveness of conservation of useful wild plants. Data Br. 22, 90–97 (2019).
128. Hunter, D., Maxted, N., Heywood, V., Kell, S. & Borelli, T. Protected areas and the
challenge of conserving crop wild relatives. Park. Int. J. Prot. Areas Conserv. 18,
87–98 (2012).
129. Lewis, M. P. Ethnologue: languages of the world, 21st edn. (2017).
130. Vásquez, D. L. A., Balslev, H. & Sklenář, P. Human impact on tropical-alpine plant
diversity in the northern Andes. Biodivers. Conserv. 24, 2673–2683 (2015).
131. IUCN-WCP. Guidelines for Recognizing and Reporting Other Effective Area‐based
Conservation Measures. (IUCN, 2019).
132. Marquez-Garcia, M., Jacobson, S. K. & Barbosa, O. Wine with a Bouquet of
Biodiversity: Assessing Agricultural Adoption of Conservation Practices in Chile.
Environ. Conserv. 46, 34–42 (2019).
133. Maxwell, S. L. et al. Area-based conservation in the twenty-first century. Nature
586, 217–227 (2020).
134. Groves, C. R. et al. Planning for biodiversity conservation: putting conservation

113
science into practice. Bioscience 52, 499–512 (2002).
135. Hardner, J. The Problem of Financing Protected Areas in the Andes-Amazon
Region. Economics and Conservation in the Tropics: A Strategic Dialogue (2008).
136. Debarbieux, B. & Price, M. F. Mountain Regions: A Global Common Good? in
Globalization and Marginalization in Mountain Regions: Assets and Challenges in
Marginal Regions (eds. Chand, R. & Leimgruber, W.) 45–53 (Springer International
Publishing, 2016).
137. Barbier, E. B., Burgess, J. C. & Dean, T. J. How to pay for saving biodiversity.
Science (80-. ). 360, 486 (2018).
138. Grant, M. J. & Booth, A. A typology of reviews: an analysis of 14 review types and
associated methodologies. Heal. Inf. Libr. J. 26, 91–108 (2009).

114
Chapter 4 - Large-scale deforestation poses a threat to the world’s
cultural diversity
Janeth Lessmann1,2, Jonas Geldmann3,4, Javier Fajardo5, Pablo A. Marquet1,2,6,7
1 Departamento de Ecología, Pontificia Universidad Católica de Chile, Santiago, Chile. 2 Instituto de Ecología y Biodiversidad (IEB), Santiago, Chile. 3 Conservation Science Group, Department of Zoology, University of Cambridge,
Cambridge, UK. 4 Center for Macroecology, Evolution and Climate, GLOBE Institute, University of
Copenhagen, Copenhagen, Denmark 5 UN Environment Programme World Conservation Monitoring Centre (UNEP-WCMC),
Cambridge, UK. 6 The Santa Fe Institute, Santa Fe, USA. 7 Laboratorio Internacional de Cambio Global (LINCGlobal) and Centro de Cambio Global
UC, Pontificia Universidad Católica de Chile, Santiago, Chile.
Abstract
Effects of deforestation on biodiversity and climate change are widely recognized. Here we
show that this century’s deforestation also poses a significant threat to the world’s cultural
diversity. We gathered emerging evidence that forest loss often precipitates processes of
cultural erosion in forest dwellers through three pathways: (1) restricting people’s
interactions with their biocultural landscape, (2) increasing their exposure to dominant
cultural groups, and (3) reducing their cultural group size. We also examined changes in
forest cover between 2000 and 2016 in the distributions of all ethnolinguistic groups linked
to tropical forests. Our results raise concern about the prospects for cultural survival of
~1,400 ethnolinguistic groups (20% of the world’s diversity), whose territories have been
exposed to significant rates of forest loss. To halt cultural loss from forests, world
governments must substantially advance in recognizing indigenous peoples’ land tenure

115
rights, which are critical for strengthening indigenous’ organizations, reducing
deforestation, and mitigating climate change. Furthermore, national and international
environmental agendas should promote actions for forest protection that respect cultural
identities and customary use of biodiversity.
Keywords: indigenous and local communities, cultural evolution, cultural extinction, land
rights, protected areas, forest loss and degradation.
1. Introduction
Renowned for their biological diversity (Giam 2017), forest landscapes are also
regions of high cultural diversity. Thousands of indigenous peoples and local communities
(IPLCs) live in forests (Garnett et al. 2018; Watson et al. 2018; Fa et al. 2020). Although
IPLCs constitute a numerical minority, they are the vessel of unique languages, rituals,
spirituality, and traditional knowledge that are inextricably linked to forests and that
together embody a large part of the world’s cultural diversity (Fig. 4.1a) (Sutherland 2003;
Loh & Harmon 2014; IPBES 2018a; Begotti & Peres 2020). However, this diversity is
currently vanishing at an alarming rate, as reflected in the extinction and endangerment of
thousands of indigenous languages (Austin & Sallabank 2011; Anderson 2011; Amano et
al. 2014; Loh & Harmon 2014) and the marked erosion of local ecological knowledge from
forests (Gómez-Baggethun et al. 2013; Aswani et al. 2018). This cultural erosion from
forests is part of the global crisis of cultural extinction, in which it is estimated that around
90% of the world’s 6,000 languages will disappear by the end of the 21st century
(UNESCO Ad Hoc Expert Group on Endangered Languages 2003).

116
With this cultural loss, the world loses valuable ecological knowledge that is
instrumental in promoting the sustainable management of biodiversity, as well as notions
and philosophies that are crucial to make humanity more adaptive and resilient in the face
of changes (Dunn 2008; Robbins 2015; Lyver et al. 2019). For many forest IPLCs, cultural
erosion is also associated with losing an individual sense of belonging, purpose, social
support, and spirituality, among other experiences, that are positively related to good
mental health and well-being (Shepherd et al. 2017; Díaz et al. 2018; Ferguson &
Weaselboy 2020). In this context, the relevance of having a culturally diverse humanity
calls for a better understanding of the factors that endanger the cultures that inhabit forests.
Large-scale deforestation for commodity production, infrastructure projects and
energy generation is burgeoning and intensifying in tropical regions where countless of
IPLCs survive as distinct people (Fig. 4.1b) (Geist & Lambin 2002; Lewis et al. 2015;
Allan et al. 2020; Fa et al. 2020; FAO & FILAC 2021). Even though IPLCs have been
shown to be effective guardians of tropical forests, many of them are reporting a rapid
forest loss and depletion of biodiversity in their territories that is resulting in an undesired
and pronounced erosion of their cultural systems and well-being (IPBES 2018b, Fig. 4.2).
Despite these claims, there is little research on the cumulative impact of forest loss on
global, regional, or local cultural diversity. By contrast, most of the attention has focused
on studying the role of socioeconomic factors, such as global economic integration,
modernization, or economic growth, as underlying drivers of recent losses in cultural
diversity (Nettle & Romaine 2000; Mufwene 2004; Austin & Sallabank 2011; Amano et al.
2014).

117
Figure 4.1. Global distribution of language diversity and forest loss. For 1-degree cells, we
show (a) the number of languages (Lewis 2017) in a logarithmic scale, and (b) the
accumulated forest loss between 2000 and 2016 (Hansen et al. 2013). The figure also shows
the extent of the forest zones of the world (Potapov et al. 2017).
Today, it is widely recognized that cultural diversity is an important part of
biodiversity and nature, and its emergence is driven by a process similar to the one driving
the rest of biodiversity and natural processes. An example of this is the high global spatial
correlation between species and linguistic richness (Gorenflo et al. 2012; Loh & Harmon
2014; Hamilton et al. 2020). However, the interconnections between ecological changes

118
and cultural transformations have been largely overlooked in the literature, in part because
these are complex and multidimensional (Austin & Sallabank 2011; Pérez-Llorente et al.
2013; Dunn 2018), and thus it is unclear to what extent and under which conditions forest
loss and degradation can undermine human cultural diversity (Pérez-Llorente et al. 2013;
Cámara-Leret et al. 2019a). Closing this knowledge gap is instrumental to effectively
approximate the conservation status of forest cultural diversity and project their future
trajectory, as well as to investigate and accommodate better policies that support IPLCs to
adapt or prevent the impacts of forest loss.
In this perspective, we discuss whether this century’s deforestation poses a significant
threat to the world’s human cultural diversity. We start by examining recent case studies
looking at connections between forest loss and degradation and changes in cultural systems
of IPLCs. We then take a spatial approach to estimate how many and which cultural groups
from tropical regions could be at risk due to the loss and degradation of forests on which
people depend. Finally, we summarize actions that might reduce deforestation impacts on
cultural diversity and discuss the success and challenges for their implementation. This
piece brings together sources primarily from anthropology, geography, and ecology to
delve into the intertwinement of cultures and their natural environments and demonstrate
that the maintenance of the world cultural diversity necessarily includes forest protection
and access of IPLCs to them. We acknowledge that we are non-indigenous researchers
addressing a global issue that affects indigenous people and other traditional communities
and that our knowledge systems influence our position concerning the impact of
deforestation on cultural survival. Our point of view embraces the notion that we, as just
another species, become what we are through cumulative cultural evolution, a process that

119
takes place in an ecological context and that affects our technological complexity,
settlement pattern, and ideological repertories and which can change and eventually
disappear as ecosystems and their contributions to people change (Boyd et al. 2011;
Marquet et al. 2012; Santoro et al. 2017; Weinberger et al. 2017).
Figure 4.2. Examples of ethnolinguistic groups in tropical forests that are experiencing
negative effects of forest loss and degradation on their livelihoods and cultures. These
ethnolinguistic groups are communities that have traditionally inhabited tropical forests.
For each group, the language name and 3-characters ISO identification is shown (Lewis

120
2017). The geographic range of each group is highlighted in dark black, while borders for
neighbor groups are shown in a lighter grey. Gridded data from yellow to red indicate forest
loss (km2) between 2000 and 2016, with red representing the highest loss by 1 km2 cell (see
Fig. 4.2b). Descriptions of the impacts from forest loss and degradation on each group were
obtained from: (A) Guidi (2014); Mateo-Vega et al. (2018); Minority Rights Group
International (2020a), (B) Wallace (2016); Paiva et al. (2020), (C) Church & Page (2017);
Minority Rights Group International (2020b), (D) Morelli & Wilkie (2000); Gay (2001),
(E) Human Rights Watch (2019); Pahlevi & Butler (2019), (F) Kolinjivadi (2011).
2. Impacts of large-scale forest loss and degradation on cultural systems
Culture can be defined as information that affects behavior and is passed among
individuals and across generations through social learning (Boyd & Richerson 1996;
Whiten et al. 2017). This information constantly evolves through generating changes in the
environment that can become selective pressures on the population that generated the
change, giving rise to evolution through niche construction, and thus, to persistence or
extinction, adaptation, or disappearance in response to changing conditions (Laland et al.
2001). This process is also expected to be species-dependent and idiosyncratic. Despite the
dynamic nature of cultural systems, multiple assessments, mainly based on language
diversity, suggest that we, humans, are currently facing a global cultural loss crisis
(Sutherland 2003; Maffi & Woodley 2010; Austin & Sallabank 2011; Loh & Harmon
2014).
Here, we gathered recent research and IPLCs views detailing how forest loss and
degradation can result in extensive direct and cascading impacts on multiple traits of
IPLCs’ cultural systems. This body of research is largely based on individual case studies
for specific ethnic groups and forest regions. We analyzed and synthesized this information
into three non-excluding pathways (and feedback mechanisms) by which forest loss and

121
degradation transform the socio-environmental context of forest people (Fig. 4.3). Often,
these transformations result in the erosion and a cultural tipping point (section 2.1), or
instead, it can lead to cultural adaptation and renovation (section 2.2).
Figure 4.3. Connections between forest loss and degradation and cultural change in forest
IPLCs. Circular symbols represent specific socio-environmental transformations driven by
forest loss and degradation that forest IPLCs could face. Numbers indicate the pathways in
which these transformations might affect the generation, maintenance, and transmission of
cultural information. Traits that can confer groups resiliency and lead to adaptation of their
cultural systems include having a large population size, strong sovereignty, social cohesion,
and communication, among others. Instead, having smaller population sizes, undermined
autonomy, exposure to unequal power relationships are traits associated with increased
vulnerability to cultural erosion and assimilation in the face of deforestation. Furthermore,
positive feedback (dashed line) increasing forest loss and degradation might result when
cultural erosion involves disconnection between people and nature via the loss of
conservation attitudes and the decline of traditional ecological knowledge.

122
2.1 Cultural erosion and assimilation
Pathway 1- Deforestation reduces access and interactions with the biocultural landscape.
Traditional ecological knowledge, management systems, identities, or languages of
many IPLCs have been shaped by time and land (Robbins 2015; Ferguson & Weaselboy
2020; Ford et al. 2020). Thus, the continuity and evolution of these cultural systems rely on
the interactions of people with land and local environment as a spiritual and material source
(Lyver et al. 2019; Ferguson & Weaselboy 2020; Ford et al. 2020). Simultaneously,
traditional communities can influence the landscapes that they inhabit. For example, in the
Amazon forests, IPLCs have contributed to creating a cultural landscape that is the product
of their traditional land use, including the introduction of novel combinations of wild and
domesticated species (Lombardo et al. 2020). Traditional land-use might also include forest
clearing but, because this use often involves sustainable practices or because many IPLCs
live at low densities, most IPLCs have been able to maintain forest cover extent historically
and some of the most biodiverse areas remaining on Earth (Freitas et al. 2004; Frainer et al.
2020; FAO & FILAC 2021; Ellis et al. 2021).
In contrast to traditional land uses, large-scale deforestation can profoundly change
the biophysical environment and trigger a cycle of disconnection between IPLCs and the
natural landscapes they inhabit. For instance, there is mounting evidence that plantations
and deforestation erode landscapes that have served as cultural inspiration, alter sacred
places, deplete culturally significant and useful species, and make traditional lifestyles no
longer viable (Garibaldi & Turner 2004; Tang & Gavin 2016; Cámara-Leret et al. 2019a).
Also, the loss and degradation of rainforests can undermine critical ecosystem services and
the basis for the economic self-sufficiency of many IPLCs, often forcing them to migrate to

123
urban settlements where their lifestyles may finally become alienated from forests (Austin
& Sallabank 2011; Tang & Gavin 2016). As a result of long-term declines in access to
forests and the disruption of interactions with the biocultural context, IPLCs lose
opportunities for acquiring, maintaining, and transmitting traditional knowledge, rituals,
vocabulary, and ways of life related to the environment (Pyle 2003; Reyes-García et al.
2013a; Kai et al. 2014). This is supported by comparative studies which have found that
traditional communities or members exposed to larger declines on access, extent, and
quality of native forests, or its local biodiversity, tend to exhibit major losses on cultural
traits associated with forests (e.g., Kai et al. 2014; Atreya et al. 2018; Paneque-Gálvez et al.
2018; Cámara-Leret et al. 2019a; Parra et al. 2019; Turvey et al. 2021). Similarly, studies
based on interviews and case reviews describe how several IPLCs have abandoned cultural
practices and lost traditional knowledge partially due to the loss of native forests and the
biodiversity that sustain such practices (e.g., Reyes-García et al. 2013a; Kodirekkala 2015;
Kim et al. 2017; Ukam 2018). Noteworthy, loss of knowledge might occur at a slower pace
than land-use change, which results in a time-delayed erosion of knowledge, a process
similar to biological “extinction-debt” (Parra et al. 2019). Thus, the impacts of more recent
deforestation events on cultural traits could emerge or be more evident years ahead.
Pathway 2 - Deforestation increases the risks of cultural shift and assimilation towards
dominant cultures.
The cultural extinction crisis is often the result of processes that force or foster
minority groups to disrupt the transmission of their cultural systems and adopt or assimilate
that of more dominant groups (i.e., demographically or due to power or affluence)

124
(Weinreich 1953; Austin & Sallabank 2011). Thus, although interaction and exchange
among cultures can be a key driver of cultures evolving (Axelsen & Manrubia 2014), under
some circumstances it can also trigger cultural shifts and assimilation tipping points, in
which the recovery of the former cultural expression state becomes unlikely (Mufwene
2004; Lyver et al. 2019).
Large-scale deforestation is likely to boost the contact between traditional people
from forests and dominant outsider groups, increasing the risk of cultural shifts. In tropical
regions, forest loss often comes in hand with an increase in accessibility and a large influx
of foreigners, extractive industries and market economies into previously remote and
sparsely populated forest areas (Curtis et al. 2018; Vilela et al. 2020). Under this
socioeconomic change, IPLCs might voluntarily leave behind their traditional ways of life,
cultural values and languages to adjust to the new conditions and access more competitive
salaries, health system and consumer goods (Nettle & Romaine 2000; Mufwene 2004;
Reyes‐García et al. 2005; Austin & Sallabank 2011; Reyes-García et al. 2013a; Bozigar et
al. 2016). Studies from the Amazon confirms such processes finding that communities that
are closer to main roads and with higher access to urban settlements, market economies,
and extractive centers usually experience greater cultural changes and erosion than those
communities living in more pristine and less accessible forest areas (Peralta & Kainer 2008;
Suárez et al. 2009; Pérez-Llorente et al. 2013; Reyes-García et al. 2013a; Vasco et al. 2018;
Castro et al. 2020). In other cases, the arrival of extractive industries and intensive
agriculture might lead to land conflicts, serious human rights abuses, and forced
displacements of IPLCs to urban or rural centers where they are assimilated into dominant
cultures (Nettle & Romaine 2000; Austin & Sallabank 2011). A case example is the palm

125
oil industry in Malaysia and Indonesia, which has acquired large expanses of land for
production, leading to the evictions and impoverishment of local indigenous communities
with customary rights of use upon them (Colchester 2011).
Pathway 3 - Deforestation is linked to processes that can reduce the size of cultural groups.
Deforestation also associates with processes that increase violence and deaths in
IPLCs. Large scale illegal activities, such as mining, logging and colonization, frequently
occur inside the territories of many indigenous people in tropical regions (e.g., Escobar
2020; Baragwanath & Bayi 2020). These illegal activities increase the contact of
indigenous people with outsiders (miners, loggers) who may bring infectious diseases to
which indigenous people have no immunity or cure if they do not have access to health
systems (Walker et al. 2015). For example, a recent study for the Brazilian Amazon
estimates that illegal miners are the main vector of coronavirus transmission in the territory
of Yanomami indigenous people, leading 40% of the population at risk of contracting
COVID-19 (ISA 2020). Worldwide, illegal economic activities are also known to be
associated with cases of brutal violence that takes the lives of many members of indigenous
groups or coerces many others to migrate (Fraser 2017; Andreoni & Casado 2019). In this
context, the last group members can also be forced to assimilate into more dominant or
prosperous cultures to survive as individuals (Nettle & Romaine 2000). Since the
generation, learning, and maintenance of cultural information benefits from the presence of
conspecifics and their interactions, rapid reductions of group size, via displacements or
deaths, ultimately leads to a pronounced deterioration of their knowledge systems,

126
language, practices, triggering a process of cultural simplification (Carneiro 1967; Henrich
2004; Kline & Boyd 2010; Prochazka & Vogl 2017).
Feedback mechanisms among forest loss, climate change, and cultural erosion
Tropical deforestation is one of the main drivers of current climate change,
accounting for about 12% of anthropogenic carbon emissions (Baccini et al. 2012; IPCC
2020). Indigenous territories are stewards of huge forest carbon pools, containing 34% of
all above-ground carbon stored in tropical forests (Walker et al. 2014; Woods Hole
Research Center & Environmental Defense Fund 2015). If lost, these would lead to the
release of 168.3 Gt CO2, or three times the global emissions in 2014 (Woods Hole Research
Center & Environmental Defense Fund 2015). Impacts of climate change can also lead to
significant alterations on native forests, such as increased frequency and intensity of
wildfires, higher temperatures, changes in species compositions, and land conversion and
degradation (Voggesser et al. 2014). IPLCs are among the first to witness and experience
these impacts on forests, as well as on their livelihoods and cultures (Parrotta & Agnoletti
2012; Voggesser et al. 2014; Dunn 2018). Overall, climate change impacts on forests can
boost socioenvironmental changes that lead to the three cultural transformation pathways
(see Fig. 4.3). For example, in New Guinea, more than 700 endemic plant species used by
forest indigenous people are projected to suffer contractions of their geographic ranges due
to climate change, which pose a threat to the practice and transmission of knowledge and
traditions associated with the use of these plants (Cámara-Leret et al. 2019b). In the
Amazon forest, the number of wildfires within indigenous lands dramatically increased in
the last few years, driven by a combination of illegal fires and changes in climate, such as

127
more prolonged drought (Brando et al. 2020; IPCC 2020). These wildfires have increased
respiratory diseases among native peoples and affected food sources of uncontacted groups,
pushing them from their homes and increasing their exposure to other cultures and new
diseases (Hanbury 2020). Importantly, climate change impacts are more intense in
deforested areas but also reach out to IPLCs in more remote landscapes (Vargas Zeppetello
et al. 2020).
The disconnection between nature and IPLCs triggered by deforestation, climate
change, and other socioeconomic drivers can precipitate further forest clearing and
degradation (Zent 2009; Pérez-Llorente et al. 2013; Paneque-Gálvez et al. 2018; Lyver et
al. 2019). For instance, modifications on conservation behavior in many indigenous
communities in the Amazon (e.g., adherence to traditional hunting norms, environmental
awareness) and losses of their traditional knowledge related to sustainable resource use
have been associated with an increase in deforestation (Fernández-Llamazares et al. 2015;
Pérez & Smith 2019). Similarly, many groups in the Amazon have replaced sustainable
forest-based activities with market-oriented activities requiring forest clearing, such as
commercial agriculture and logging (Vadez et al. 2004; Castro et al. 2020). This
deterioration of forests, due to the reduced engagement of IPLC with their environment, is
then a feedback that reinforces cultural erosion (Zent 2009; Lyver et al. 2019).
2.2 Cultural resilience and adaptation in the face of forest loss and degradation
Cultural erosion and homogenization are not the only possible outcome of
deforestation. Many IPLCs have a wealth of traditional knowledge that help them adapt to
climatic, environmental, and social changes and avoid cultural assimilation (Reyes-García

128
et al. 2013b; Davis et al. 2017). For example, some forest local communities in Honduras
and Bolivia have responded to exposure to market economies by using and enriching their
ecological knowledge to trade timber, non-timber forest, and fisheries goods (Godoy et al.
1998; Reyes-García et al. 2007; Aswani et al. 2018). Input from other cultures is, of course,
not only a pressure on existing practices. Traditional knowledge, practices, and beliefs can
evolve and adapt through hybridization with other cultures to create new forms and systems
(Gómez-Baggethun et al. 2013; Aswani et al. 2018). For instance, despite being exposed to
external economies and formal education, some Andean Quechua communities have
enriched their knowledge on plant medicinal uses by incorporating species from other
ecological belts and exchanging knowledge with Amazonian communities at local markets
(Mathez-Stiefel et al. 2012).
These examples evidence the resilient and adaptive nature of IPLCs’ cultural systems
in the face of socio-environmental changes (Reyes-García et al. 2013b). Although IPLCs
may lose specific pieces of cultural traits, they can also retain the ability to generate,
transform, and transmit their cultural information, including their language, worldview, and
values through social learning (Gómez-Baggethun et al. 2013; Reyes-García et al. 2013b;
Lyver et al. 2019). This cultural adaptation process is likely to occur when key factors such
as collective actions, sovereignty and communication are secured and reinforced in IPLCs
(Gómez-Baggethun et al. 2013; Ford et al. 2020). However, the speed and magnitude of
forest loss and degradation are usually too large for many cultural systems to regenerate
and adapt (Fernández-Llamazares et al. 2015; Robbins 2015; Lyver et al. 2019; Ford et al.
2020). Moreover, deforestation usually comes in hand with unequal power relationships,
with companies and governments sometimes directly seeking to weaken social cohesion

129
within IPLCs through limiting their autonomy and ability to interact with the land on their
own terms (Gómez-Baggethun et al. 2013; Bozigar et al. 2016; Lyver et al. 2019). This
ultimately affects their possibilities to escape from cultural assimilation. Thus, rapid forest
loss and degradation pose a significant challenge for many IPLCs, even for those with traits
that potentially confer them resilience and the ability to cope with environmental changes
(see Fig. 4.3).
Our examination of case studies shows that deforestation can have complex
interactions with intrinsic and extrinsic factors related to IPLCs, such as group size, their
historical contacts, the degree of diversification of their livelihoods, their social cohesion,
sovereignty and recognition of their land rights, the political context, or additional
socioeconomic drivers associated to cultural loss. As a result of these interactions, IPLCs’
cultures can have different long-run prospects for survival that are difficult to predict with
accuracy. Nevertheless, the evidence shows that large-scale deforestation has the potential
to increase the risk of cultural erosion and assimilation, and that such risks must be
addressed and mitigated.
3. Cultural diversity exposed to 21st-century deforestation in the tropics
Despite all the emerging evidence of the negative impact of deforestation on local
cultures, there have not been efforts to quantify how many and which forest-dependent
cultures across the tropics might be facing this threat. To explore this, we assessed the
overlap between forest cover reduction from 2000 to 2016 (Hansen et al. 2013) and the

130
geographic range of all living ethnolinguistic groups from tropical regions whose
livelihoods and cultures are likely to rely on forests (Lewis 2017), as we exemplified in
Figure 4.2. To get a close identification of forest-dependent ethnolinguistic groups, we
used a spatial perspective, in which a group living within forests is a useful proxy for forest
dependence (Newton et al. 2016, 2020). We selected only minority ethnolinguistic groups
with at least 50% of their ranges overlapping with forest cover by 2000, as these are more
likely to have a larger part of their cultural system related to forests (see Methods for more
details in this analysis). This spatial criterion comprises many traditional and indigenous
communities inhabiting forests for many generations (Newton et al. 2016).
According to our analysis, forest ethnolinguistic groups in the tropics (n = 3478)
represent almost half of all known living languages (49%) concentrated in only 7% of the
land surface of the world (~ 9.9 million km2). Most of the forest linguistic groups inhabit
Melanesia (28% of the forest diversity), South-Eastern Asia (28%), Middle Africa (12%),
and South America (9%) (Fig 4.4a). Within this diversity, 475 ethnolinguistic groups
overlapped, at least in half of their range, with the last remaining “intact” forests in the
world by 2000. The number of groups living in intact forests is higher in South America (n
= 155), followed by South-Eastern Asia (n = 123) (Fig. 4.4b). Intact forests are unbroken
expanses of forests without remotely detected signs of human intervention (Potapov et al.
2017). These forests are also home to forest people with limited contact with the outside
world, including traditional hunter-gatherer, semi-nomadic and horticultural societies
(Watson et al. 2018; Begotti & Peres 2020). Therefore, these groups in intact forests are
considered highly vulnerable to the rush of development and environmental transformations
(Fraser 2017; Watson et al. 2018; Ford et al. 2020).

131
Figure 4.4. Forest ethnolinguistic diversity in the tropics of the world. Number of minority
ethnolinguistic groups with (A) high overlap (≥ 50 %) with forest cover by 2000 (n =
3478), and (B) with high overlap (≥ 50 %) with intact forests by 2000 (n = 475). Data is
summarized by the United Nations’ regions. The analysis was limited to the forests in the
Neotropics, Afrotropics, and Indo‐Malayan biogeographic realms, with the Papua New
Guinea portion of the Australasian realm included.

132
Between 2000 and 2016, about 41% of forest ethnolinguistic groups (n = 1436)
experienced reductions in forest cover or intact forest cover ranging between 5% (0.33%
annual) to 100% (6.7% annual) (Fig. 4.5). Such rates on forest loss might exceed those
expected from the traditional land use by forest dwellers. For example, in the territories of
indigenous agricultural communities in Indonesia, and indigenous communal lands in the
Amazon basin, Costa Rica, and Zambia, annual forest loss rates from indigenous
management are less than 0.3% (Blackman & Veit 2018; Nugroho et al. 2018; RRI 2020).
Therefore, our finding suggests that almost half of forest ethnolinguistic diversity has
recently faced high environmental degradation levels, which raises concern about their
prospects for survival. Moreover, 40% of ethnolinguistic groups from intact forests (n =
191) had high intact forest reductions (Fig. 4.5b). The livelihoods and cultural systems of
many of these groups are particularly susceptible to sharp socioenvironmental changes. For
example, uncontacted, or in voluntary isolation, indigenous people are part of the
ethnolinguistic groups facing intact forest reductions, such as: Awá in Brazil (47% of intact
forest reduction), Yanomami in Brazil (5% of intact forest reduction), Cacataibo in Peru
(37% of intact forest reduction), and Arará in Brazil (16% of intact forest reduction. It is
also worrying that 31% (438) of the forest groups facing forest reductions already have low
intergenerational language transmission (EGIDS: 6b-9), as registered by the language
vitality indicator in the global database (Lewis 2017). This erosion of language
transmission can weaken the practice and learning of their traditional ecological knowledge
that is crucial to face climate change and deforestation impacts (Ford et al. 2020).

133
Figure 4.5. Forest reduction (2000 - 2016) across forest ethnolinguistic groups from
tropical regions. Bars show the percentage of ethnolinguistic groups under each level of
forest reduction rate. Results are shown separately for reductions in (A) forest cover and
(B) intact forest cover. Reductions in intact forests combine forest cover loss and the
increase of human intervention and fragmentation of forests (Potapov et al. 2017).
Forest reduction rates within ethnolinguistic groups varied regionally (Fig. 4.5). The
regions with the largest percentage of groups overlapping with high rates of forest cover
loss were Western Africa, South-Eastern Asia, and Eastern Asia have (56%, 46% and 46%
of their diversity, respectively; Fig. 4.5a). Considering only the groups inhabiting intact
forests, Melanesia and South-East Asia are the regions that include the highest proportion
of groups facing intact forest reductions (57% and 48%, respectively; Fig. 4.5b). Overall,

134
these results highlight South-Eastern Asia and Melanesia as the regions with the highest
richness of forest ethnolinguistic groups exposed to deforestation. Although our study does
not aim at addressing the factors behind this pattern, we detected some potential
explanations. Ethnolinguistic groups from Melanesia and South-Eastern Asia have very
small geographic areas (median: 183 km2 and 715 km2, respectively), in contrast to those in
South America or Middle Africa (median: 3034 km2 and 1948 km2, respectively). Having
small ranges increases the likelihood that deforestation and other stochastic events affect
large proportions of their geographic ranges and speakers (Amano et al. 2014). In the last
decades, these regions also exhibited the largest reductions of their forest and intact forest
cover, mainly driven by commodity production and industrial logging (Rosa et al. 2016;
Potapov et al. 2017; Curtis et al. 2018). Other factors, such as lack of recognition of many
IPLCs’ land rights and weak governmental environmental regulation (see below), might
also contribute to the advance of forest reduction into the territories of ethnolinguistic
groups from these regions.
4. Halting the impact of deforestation on cultural diversity
Our study gathers IPLCs’ views and research evidence that exposes the connection
between forest loss and degradation and the erosion of many forest cultures (Fig. 4.3).
Threats to IPLCs from forest loss and degradation seem clear and have the potential to
affect a large part of cultural diversity across tropical regions (Fig. 4.5). In this context, we
argue that actions for revitalizing cultures and curbing their erosion must consider
enhancing the protection of the forests and biodiversity that sustain cultures. We underscore
that supporting forest cultural diversity needs a more integrative approach involving: (1)

135
greater efforts at tracking the impact of forest change on cultural systems of IPLCs, (2)
ensuring IPLCs’ land rights, and (3) incorporating IPLCs voices and needs into forest
governance and conservation strategies.
4.1. Tracking the impact of forest change on cultural systems
Globally, there is a lack of assessments and databases explicitly designed for tracking
temporal changes in different cultural traits of a group (Reyes-García et al. 2013a). For
example, information on speaker numbers is a useful indicator for evaluating language
endangerment (Lewis 2017). However, the available information for all ethnolinguistic
groups is not always updated, limiting our ability to assess the impact of recent
environmental change on cultural groups. This problem is exemplified by the case of Doso
and Ukuriguma ethnolinguistic groups in Papua New Guinea, whose intact forests
completely degraded between 2000 and 2016, but our current knowledge in their speaker
numbers dates from 1973 and 2003 respectively (Lewis 2017).
As deforestation and land degradation advance, it is urgent to collect long-continued
datasets based on large samples on how different cultural traits of IPLCs change over time
and how these changes relate to forest loss and other social drivers of change (Pérez-
Llorente et al. 2013). Combined with data about intrinsic and extrinsic factors related to
cultural groups, this information would help (1) drawing robust, global, and regional scale
conclusions about their short- and long-term impact of environmental degradation on
cultures, (2) understanding the factors that help IPLCs retain the ability to generate,
transform, and transmit their culture in the face of a rapid environmental change, as well as
(3) designing strategies to support IPLCs coping with change.

136
4.2 Ensuring IPLCs’ collective land rights
In many countries, progress has been made in recognizing and granting land titles as
common property to indigenous people who have traditionally occupied and claimed these
territories (Alden Wily 2018; Tubbeh & Zimmerer 2019; Tauli-Corpuz et al. 2020). This
measure provides IPLCs with legal rights to manage forests crucial for their livelihood,
cultural development and revitalization, and to take legal actions against those who would
illegally or unethically exploit resources (Newton et al. 2016; Ferguson & Weaselboy 2020;
Baragwanath & Bayi 2020). As a result, areas with secured community land rights are more
prone to the successful implementation of conservation initiatives (Ostrom & Nagendra
2006; Santika et al. 2017; Griffiths 2018) and tend to report lower annual deforestation
rates than other forms of governance (Araujo et al. 2009; Porter-Bolland et al. 2012; Nolte
et al. 2013; Robinson et al. 2014; Blackman et al. 2017), although the latter is not always
the case (Krishna et al. 2017; Busch & Ferretti-Gallon 2017).
Unfortunately, many other IPLCs throughout tropical regions lack proper conditions
to exercise their land and autonomy rights. Therefore, their communal lands have become
spaces of vulnerability and depletion of natural resources (Tubbeh & Zimmerer 2019). In
many cases, governments have opposed conferring final decisions on indigenous peoples
over export-oriented agriculture and industrial projects in their lands (Colchester 2011;
Tubbeh & Zimmerer 2019; Tomlinson 2019; He et al. 2019). In countries with high forest
cultural diversity, such as Brazil, Indonesia, and Papua New Guinea, there has been no
significant effort to protect legal indigenous lands from deforestation and violence from
illegal mining, logging, and expansion of forestry corporations (Laurance et al. 2011;
Wallace 2016; Harris 2019). Also, in Brazil, recent presidential decrees are undermining

137
Indigenous Peoples’ rights to their traditional lands (Begotti & Peres 2020). Furthermore,
there seems to be an increase in the forced displacement of IPLCs globally driven by a
sharp acceleration in the acquisition of traditional lands by foreign investors (Gilbert 2017).
Thus, significant challenges remain in restoring, implementing, and ensuring land rights as
part of strategies to support forest people’s cultures and secure their livelihoods and
autonomy.
4.2. Incorporating IPLCs’ voices into forest governance and conservation
Safeguarding cultural diversity in tropical forests requires effective governance that
protects forest integrity and functioning and equitable governance that employs inclusive
processes and produces fair outcomes for IPLCs (Bennett & Satterfield 2018; FAO &
FILAC 2021). For instance, in Indonesia, a weak regulation and insufficient local
governance capacity undermined certification systems for sustainable palm oil that aimed
to reduce the negative impacts of these industries on forests and local communities
(McCarthy & Zen 2010). In Brazil, central forest governance created complex registration
and permitting requirements for legal timber certification that puts this market out of reach
of many Amazonian local communities, whose practices are precisely more sustainable and
beneficial for local economies than those implemented by large logging industries in the
area (McDermott et al. 2015).
Effective and equitable governance is also critical for protected areas. Globally, about
21% of indigenous peoples’ lands are within protected areas, encompassing at least 40% of
the global terrestrial area under protection (Garnett et al. 2018). In the tropics, protected
areas have an important role in maintaining natural landscapes that are culturally and

138
economically vital for many IPLCs (Lockwood et al. 2006). For instance, Communal
Reserves in Peru are co-managed protected areas declared at the local communities’ request
to safeguard biodiversity for the benefit and sustainable use by these communities (Amend
et al. 2017). However, the establishment of protected areas has not always have resulted in
positive experiences for forest IPLCs. Worldwide, many IPLCs have perceived a general
loss of access and their rights over land and natural resources due to inequitable
management and governance of protected areas (RRI 2020; Tauli-Corpuz et al. 2020). In
the Congo Basin, the expansion of protected areas has displaced several indigenous pygmy
communities from their lands and prohibited traditional hunting, devastating the livelihoods
of these communities, and eroding their cultural identity (Pemunta 2019) (Fig. 4.2). This
critical situation reflects the need of securing IPLCs rights in and around protected areas,
grating participatory management, and managing the potential conflicts with the
conservation aims of administrative authorities of protected areas (Worboys et al. 2015;
Pemunta 2019). Equitable management in protected areas is also critical for effective forest
conservation. When local communities are genuinely engaged in decisions regarding rules
affecting natural resource use, the likelihood of following the rules and monitoring others is
greater than when an external authority imposes the rules (Ostrom & Nagendra 2006).
Nevertheless, IPLCs are highly diverse in their land use and views on nature protection
(Gray & Bilsborrow 2020; Pascual et al. 2021), which includes the fact that not all IPLCs
could be interested in managing their forest for nature-conservation objectives (Garnett et
al. 2018).
Recognizing IPLC’s voices and rights also has important implications for designing
future actions and goals for biodiversity conservation. Some conservationists are proposing

139
expanding conservation areas to cover half the Earth by 2030 (Wilson 2016). Based on this
goal, “intact” areas have been identified as good candidates to focus on proactive nature
conservation efforts, including protected areas (Riggio et al. 2020). Our study underscores
that many of these low impact lands are also reservoirs of high cultural diversity linked to
forests. Therefore, the design of such ambitious conservation goals should explicitly
address local acceptability and guarantee the right of local cultures to thrive. It is also
critical to ensure that IPLCs voices are effectively articulated in international forums and
policy-related processes for biodiversity conservation, such as the Intergovernmental
Science-Policy Platform on Biodiversity and Ecosystem Services and the Post-2020
Biodiversity Targets framework in preparation by the Convention on Biological Diversity
(Tauli-Corpuz et al. 2020; McElwee et al. 2020). These articulations have the potential to
encourage governments to adopt policies that secure the rights of IPLCs to cultural
distinction when designing actions for the protection of forests and other ecosystems.
5. Conclusions
Worldwide, research on deforestation has mostly focused on its drivers and impacts
on biodiversity loss (Gibson et al. 2011; Busch & Engelmann 2017; Alroy 2017), erosion
of ecosystem services (IPBES 2018a), or climate change (IPCC 2020). In this perspective,
we underscore that deforestation can also erode natural diversity, from microbes to human
cultures. Evidence from case studies illustrates the vital importance of the forest-culture
connection, showing that forest loss and degradation might precipitate cultural erosion and
homogenization processes in many IPLCs. Considering this, a large part of the world's
cultural diversity could be at risk, with at least one-fifth of all living ethnolinguistic groups

140
witnessing substantial losses of forest cover in their territories since 2000. Unfortunately,
there is a lack of global efforts to monitor and project how these cultural groups could
respond and adapt to this change. Nonetheless, we do know that many of them have already
low intergenerational transmission of language and that they often lack recognition of land
rights, limiting their ability to cope and adapt without eroding their cultural systems. This
cultural extinction crisis advocates for the creation of the subdiscipline of anthropological
conservation, to advance our understanding of the global changes in cultural traits and
drivers. We also underscore the immediate need for global and national environmental
policies and agreements that recognize the vital values of forests for sustaining human
diversity, as well as the importance of ensuring land rights and autonomy of IPLCs to
guarantee cultural adaptation and continuity. Overall, the outstanding cultural diversity
contained in forest dwellers provides a global service that involves assets of innovations,
knowledge, and wellbeing that merits increased political protection and financial support,
particularly in the face of climate change.
6. Methods
This section details the spatial analysis for assessing the overlap between forest
reduction (from 2000 to 2016) and cultures from tropical regions that are potentially linked
to forests. Our analysis is a first attempt to approximate the extent that the impact of
deforestation can have in terms of the number of cultural groups affected.

141
6.1 Forest cover dataset
Our analysis used two types of indicators of forest cover. First, we gathered data on
forest cover and loss from the Global Forest Watch (Hansen et al. 2013). This dataset
provides annual tree cover loss (since 2000) as a binary presence/absence value, defined as
complete stand replacement or a change from a forest to a non-forest state within a pixel
with a resolution of 30x30 m. We acknowledge that this product addresses tree cover and is
unable to separate the natural forest from forest plantations in regions such as Southeast
Asia. To reduce this source of error, we considered as non-forests all tree cover that
overlapped with plantations (of native or introduced species) according to the Tree
Plantation data, also available in Global Forest Watch. Second, we evaluated the changes in
the intact forest landscapes of the world (Potapov et al. 2017). While global tree cover
includes forests of different levels of intervention, intact forest landscapes refer to forests
without remotely detected signs of human activity or habitat fragmentation. The estimation
of the reduction of intact forests considers the tree-cover loss and the increase of
fragmentation and anthropogenic disturbances that may negatively affect the provision of
forest resources and expose IPLCs to different threats. Finally, for each linguistic group
(see below), we estimated the percentage of its geographic range overlapping with forest
cover and intact forest cover in 2000 and the rate of forest reduction and intact forest
reduction until 2016.
6.2. Cultural diversity dataset
We used the geographic range of living languages from the 21st Edition of
Ethnologue Database (Lewis 2017) as an indicator of cultural diversity (Cámara-Leret et al.

142
2019b). Language is the primary medium of cultural transmission, and thus, the ability of
many societies to name, identify, use and share knowledge about their surrounding
resources is linked to each language group (Cámara-Leret et al. 2019b; Ferguson &
Weaselboy 2020). Thus, in many cases, a group of people that share a common ethnicity,
territorial identity, and cultural heritage also share the same language (Barrett 2003).
Hereafter, we refer to these languages as ethnolinguistic groups. Ethnologue maps use
polygons to show the approximate boundaries of the traditional homelands of each
ethnolinguistic group. When possible, this dataset also shows the number of speakers, level
of endangerment, and other traits for each group. Nevertheless, no precise information on
the year of the data used to build the map is indicated, and no claim is made for precision in
the placement of these boundaries. These limitations might reduce the precision of our
analysis. Still, Ethnologue is the most comprehensive and trusted geographic data set of the
locations of the world’s ethnolinguistic peoples. There have been important efforts to map
the geographic ranges of indigenous groups (see Garnett et al. 2018), which is also a useful
indicator of cultural diversity. However, this spatial information is still absent in some
culturally diverse tropical countries, such as Papua New Guinea.
6.3. Identification of cultures potentially linked to forests
Currently, there is not available systematized information on which cultures of the
world rely on forests for their survival. Moreover, the criteria for defining “forest-
dependent people” (i.e., people that get benefits to some degree from forests) vary
considerably in the literature (Newton et al. 2016, 2020). In this context, we used two
criteria to identify groups whose survival and culture are probably linked to forests in the

143
three major tropical biogeographic regions – the Neotropics, Afrotropics, and Southeast
Asian tropics (Dinerstein et al. 2017). First, we followed a spatial perspective, in which
people living in forests might be more likely to interact directly with forests and depend on
them for their livelihoods, traditional practices, and well-being, compared to people living
farther from forests (Newton et al. 2016, 2020). From the language database, we filtered
ethnolinguistic groups, whose geographic range overlapped in more than a half (≥ 50%)
with forest cover by 2000 (Hansen et al. 2013). Using this large percentage as a threshold,
we expected to increase the probabilities of identifying groups with stronger connections
and dependence on forests. From this set, we also distinguished those linguistic groups that
also overlap with intact forest landscapes in at least half (≥ 50%) of their range. As a
second criterium, we filtered linguistic groups with small size (those with less than one
million speakers; Canvin & Tucker 2018) because people that heavily rely on forests
usually are minority groups or live in low population densities (e.g., less than 100,000
people in the case of the indigenous lands of Brazil; (Begotti & Peres 2020).
The use of these criteria resulted in a set of 3478 ethnolinguistic groups from tropical
forests. Altogether, this set of forest linguistic groups has at least 158 million speakers
worldwide. Reports suggest there are 200 million indigenous peoples that depend on forests
and 1.6 billion rural people depending upon forests to some extent (Chao 2012; Newton et
al. 2020). Thus, our estimates of forest linguistic groups are probably closer to reflect the
diversity of forest indigenous peoples and other local or tribal communities. Furthermore,
when possible, we consulted available literature, reports and news to verify the nature of
the relationship between these linguistic groups and forests (e.g. world information
http://www.forestpeoples.org/, https://www.survival.es/, https://www.iwgia.org/,

144
https://minorityrights.org/, or national database such as Brazil:
https://pib.socioambiental.org/, Peru: https://bdpi.cultura.gob.pe/). We found that this set is
composed by an array of groups with different ways of life and associations with forests,
such as isolated indigenous peoples in the Amazon basin, traditional agriculture and hunter
gatherers tribes in Papua New Guinea, or semi-nomadic communities in the Congo Basin
(e.g., Fig. 4.2). Nevertheless, for most ethnolinguistic groups in the world, especially for
Melanesia, there is no available and detailed information on their specific ways of life,
economy or demography.
Our analysis used conservative thresholds in forest cover and speaker population size
to reduce commission errors when identifying ethnolinguistic groups that are potentially
linked to forests. However, this might have erroneously excluded other groups linked to
forests, for which a long history of deforestation may have reduced their forest cover below
50% by 2000 (such as the Xavantes people in Brazil or Mapuches in Chile). Thus, we
carried out a sensitivity analysis where we assessed the results of (1) increasing the
threshold of speaker number from 1 million to 10 million, and (2) allowing the inclusion of
linguistic groups overlapping with forest cover in at least 25% of their geographic range
(Supplementary Information). Compared to the principal analysis, combined both criteria
increased the number of identified forest ethnolinguistic groups from 3478 to 4167,
representing an increase from 49% to 59% of all living languages of the world,
respectively. Moreover, the number of ethnolinguistic groups exposed to significant forest
loss rates (5% - 100%) also increased from 20% to 25% of the living languages. By
expanding the analysis towards ethnolinguistic groups with smaller forest coverage, we also
consider territories with vulnerable forests to degradation events (due to their smaller sizes)

145
or that have been under deforestation pressures for a long time. This explains why this
additional analysis offers a more critical picture of the deforestation rates and advance in
cultural groups.
6.4. Additional caveats
The present spatial analysis has some caveats to be aware of. First, in some cases, the
same linguistic group could include very distinct IPLCs with unique traditional knowledge,
rituals, or organizations that could be exposed to different rates of forest loss. Second,
although spatial proximity is a useful proxy of forest dependence, some IPLCs might rely
on neighboring forests, which means that their livelihoods and culture could be affected by
deforestation even if they do not overlap with a large extent of forests or if the deforestation
event occurs outside their territory (Newton et al. 2020). Third, our analysis assesses
deforestation rates between 2000 and 2016 in the territories of cultural groups, overlooking
previous deforestation events. For example, in the 1970s and 1990s, deforestation first
accelerated in the Amazon and South-East Asia, respectively (Rosa et al. 2016). Overall,
these caveats might lead us to underestimate the accumulated impact of deforestation on the
world’s cultural diversity. Thus, there is room for future studies to improve the precision of
this analysis. However, we require better data on the current and historical location of
different cultural groups and the nature of their relationships with forests.

146
7. Appendices
1. Summary of the ethnolinguistic diversity associated with forests and deforestation
rates in these territories according to the world's regions.
2. Results of the sensitivity test for the criteria used to identify ethnolinguistic groups
associated with forests.
8. References
Alden Wily L. 2018. Collective Land Ownership in the 21st Century: Overview of Global
Trends. Land 7:68.
Allan J, Possingham H, Venter O, Biggs D, Watson J. 2020. The Extraordinary Value of
Wilderness Areas in the Anthropocene. Pages 158-168, in Michael I. Goldstein and D.
A. DellaSala, editors. Reference Module in Earth Systems and Environmental
Sciences. Encyclopedia of the World’s Biomes.
Alroy J. 2017. Effects of habitat disturbance on tropical forest biodiversity. Proceedings of
the National Academy of Sciences 114:6056–6061.
Amano T, Sandel B, Eager H, Bulteau E, Svenning J-C, Dalsgaard B, Rahbek C, Davies
RG, Sutherland WJ. 2014. Global distribution and drivers of language extinction risk.
Proceedings of the Royal Society of London B: Biological Sciences 281:20141574.
Amend S, Alca Castillo J, Arenas Aspilcueta M, Franco O. 2017. Reservas Comunales de
Perú. Co-gestión entre Pueblos Indígenas y Estado para la Conservación y Desarrollo.
SERNANP, Lima, Peru.
Anderson GDS. 2011. Language Hotspots: what (applied) linguistics and education should
do about language endangerment in the twenty-first century. Language and Education
25:273–289.
Andreoni M, Casado L. 2019. Guardian’ of the Amazon Killed in Brazil by Illegal Loggers.
The New York Times. Available from

147
https://www.nytimes.com/2019/11/04/world/americas/brazil-indigenous-amazon.html.
Araujo C, Bonjean CA, Combes J-L, Combes Motel P, Reis EJ. 2009. Property rights and
deforestation in the Brazilian Amazon. Ecological Economics 68:2461–2468.
Aswani S, Lemahieu A, Sauer WHH. 2018. Global trends of local ecological knowledge
and future implications. PLOS ONE 13:e0195440.
Atreya K, Pyakurel D, Thagunna KS, Bhatta LD, Uprety Y, Chaudhary RP, Oli BN, Rimal
SK. 2018. Factors Contributing to the Decline of Traditional Practices in Communities
from the Gwallek–Kedar area, Kailash Sacred Landscape, Nepal. Environmental
Management 61:741–755.
Austin PK, Sallabank J. 2011. The Cambridge Handbook of Endangered Languages.
Cambridge University Press, United Kingdom.
Axelsen JB, Manrubia S. 2014. River density and landscape roughness are universal
determinants of linguistic diversity. Proceedings of the Royal Society of London B:
Biological Sciences 281:20141179.
Baccini A, Goetz SJ, Walker WS, Laporte NT, Sun M, Sulla-Menashe D, Hackler J, Beck
PSA, Dubayah R, Friedl MA, Samanta S, Houghton RA. 2012. Estimated carbon
dioxide emissions from tropical deforestation improved by carbon-density maps.
Nature Climate Change 2:182–185.
Baragwanath K, Bayi E. 2020. Collective property rights reduce deforestation in the
Brazilian Amazon. Proceedings of the National Academy of Sciences 117:20495–
20502.
Barrett R. 2003. Handbook of Language and Ethnic Identity. Journal of Linguistic
Anthropology 13:239–241.
Begotti RA, Peres CA. 2020. Rapidly escalating threats to the biodiversity and
ethnocultural capital of Brazilian Indigenous Lands. Land Use Policy 96:104694.
Bennett NJ, Satterfield T. 2018. Environmental governance: A practical framework to
guide design, evaluation, and analysis. Conservation Letters 11:e12600.
Blackman A, Corral L, Lima ES, Asner GP. 2017. Titling indigenous communities protects

148
forests in the Peruvian Amazon. Proceedings of the National Academy of Sciences
114:4123–4128.
Blackman A, Veit P. 2018. Titled Amazon Indigenous Communities Cut Forest Carbon
Emissions. Ecological Economics 153:56–67.
Boyd R, Richerson PJ. 1996. Why culture is common, but cultural evolution is rare. Pages
77–93 Evolution of social behaviour patterns in primates and man. Oxford University
Press, New York, NY, US.
Boyd R, Richerson PJ, Henrich J. 2011. The cultural niche: Why social learning is essential
for human adaptation. Proceedings of the National Academy of Sciences 108:10918–
10925.
Bozigar M, Gray CL, Bilsborrow RE. 2016. Oil Extraction and Indigenous Livelihoods in
the Northern Ecuadorian Amazon. World Development 78:125–135.
Brando P, Macedo M, Silvério D, Rattis L, Paolucci L, Alencar A, Coe M, Amorim C.
2020. Amazon wildfires: Scenes from a foreseeable disaster. Flora 268:151609.
Busch J, Engelmann J. 2017. Cost-effectiveness of reducing emissions from tropical
deforestation, 2016–2050. Environmental Research Letters 13:15001.
Busch J, Ferretti-Gallon K. 2017. What Drives Deforestation and What Stops It? A Meta-
Analysis. Review of Environmental Economics and Policy 11:3–23.
Cámara-Leret R, Fortuna MA, Bascompte J. 2019a. Indigenous knowledge networks in the
face of global change. Proceedings of the National Academy of Sciences 116:9913–
9918.
Cámara-Leret R, Raes N, Roehrdanz P, De Fretes Y, Heatubun CD, Roeble L, Schuiteman
A, van Welzen PC, Hannah L. 2019b. Climate change threatens New Guinea’s
biocultural heritage. Science Advances 5:eaaz1455.
Canvin M, Tucker I. 2018. Mapping Linguistic Vitality and Language Endangerment BT -
Handbook of the Changing World Language Map. Pages 1–17 in S. D. Brunn and R.
Kehrein, editors. Springer International Publishing, Cham.
Carneiro RL. 1967. On the Relationship between Size of Population and Complexity of

149
Social Organization. Southwestern Journal of Anthropology 23:234–243.
Castro VS, Bilsborrow RE, Gray C. 2020. Cambios socioeconómicos en el siglo XXI en
poblaciones indígenas amazónicas: retos actuales. Estudios Demográficos y Urbanos
35:83–116.
Chao S. 2012. Forest peoples: Numbers across the world. Forest Peoples Programme,
United Kingdom.
Church F, Page T. 2017. Living on the edge: Cameroon’s Baka Pygmies face an uncertain
future. CNN. Available from https://edition.cnn.com/2017/08/16/africa/baka-
cameroon-pygmies/index.html.
Colchester M. 2011. Palm Oil and Indigenous Peoples of South East Asia: land acquisition,
human rights violations and indigenous peoples on the palm oil frontier. Moreton-in-
Marsh and Rome.
Curtis PG, Slay CM, Harris NL, Tyukavina A, Hansen MC. 2018. Classifying drivers of
global forest loss. Science 361:1108–1111.
Davis J, Sellers S, Gray C, Bilsborrow R. 2017. Indigenous Migration Dynamics in the
Ecuadorian Amazon: A Longitudinal and Hierarchical Analysis. The Journal of
Development Studies 53:1849–1864.
Díaz S, Pascual U, Stenseke M, Martín-López B, Watson RT, Molnár Z, Hill R, Chan
KMA, Baste IA, Brauman KA, Polasky S, Church A, Lonsdale M, Larigauderie A,
Leadley PW, van Oudenhoven APE, van der Plaat F, Schröter M, Lavorel S,
Aumeeruddy-Thomas Y, Bukvareva E, Davies K, Demissew S, Erpul G, Failler P,
Guerra CA, Hewitt CL, Keune H, Lindley S, Shirayama Y. 2018. Assessing nature’s
contributions to people. Science 359:270–272.
Dinerstein E, Olson D, Joshi A, Vynne C, Burgess ND, Wikramanayake E, Hahn N,
Palminteri S, Hedao P, Noss R, Hansen M, Locke H, Ellis EC, Jones B, Barber CV,
Hayes R, Kormos C, Martin V, Crist E, Sechrest W, Price L, Baillie JEM, Weeden D,
Suckling K, Davis C, Sizer N, Moore R, Thau D, Birch T, Potapov P, Turubanova S,
Tyukavina A, de Souza N, Pintea L, Brito JC, Llewellyn OA, Miller AG, Patzelt A,
Ghazanfar SA, Timberlake J, Klöser H, Shennan-Farpón Y, Kindt R, Lillesø J-PB, van

150
Breugel P, Graudal L, Voge M, Al-Shammari KF, Saleem M. 2017. An Ecoregion-
Based Approach to Protecting Half the Terrestrial Realm. BioScience 67:534–545.
Dunn CP. 2008. Biocultural diversity should be a priority for conservation. Nature 456:315.
Dunn CP. 2018. Climate change and its consequences for cultural and language
endangerment. Page in K. L. Rehg and L. Campbell, editors. The Oxford Handbook of
Endangered Languages. Oxford University Press.
Ellis EC, Gauthier N, Klein Goldewijk K, Bliege Bird R, Boivin N, Díaz S, Fuller DQ, Gill
JL, Kaplan JO, Kingston N, Locke H, McMichael CNH, Ranco D, Rick TC, Shaw
MR, Stephens L, Svenning J-C, Watson JEM. 2021. People have shaped most of
terrestrial nature for at least 12,000 years. Proceedings of the National Academy of
Sciences 118:e2023483118.
Escobar H. 2020. Deforestation in the Brazilian Amazon is still rising sharply. Science
369:613–613.
Fa JE, Watson JEM, Leiper I, Potapov P, Evans TD, Burgess ND, Molnár Z, Fernández-
Llamazares Á, Duncan T, Wang S, Austin BJ, Jonas H, Robinson CJ, Malmer P,
Zander KK, Jackson M V, Ellis E, Brondizio ES, Garnett ST. 2020. Importance of
Indigenous Peoples’ lands for the conservation of Intact Forest Landscapes. Frontiers
in Ecology and the Environment 18:135– 140.
FAO, FILAC. 2021. Forest governance by indigenous and tribal peoples. An opportunity
for climate action in Latin America and the Caribbean. Santiago.
Ferguson J, Weaselboy M. 2020. Indigenous sustainable relations: considering land in
language and language in land. Current Opinion in Environmental Sustainability 43:1–
7.
Fernández-Llamazares Á, Díaz-Reviriego I, Luz AC, Cabeza M, Pyhälä A, Reyes-García
V. 2015. Rapid ecosystem change challenges the adaptive capacity of Local
Environmental Knowledge. Global Environmental Change 31:272–284.
Ford JD, King N, Galappaththi EK, Pearce T, McDowell G, Harper SL. 2020. The
Resilience of Indigenous Peoples to Environmental Change. One Earth 2:532–543.

151
Frainer A, Mustonen T, Hugu S, Andreeva T, Arttijeff E-M, Arttijeff I-S, Brizoela F,
Coelho-de-Souza G, Printes RB, Prokhorova E, Sambou S, Scherer A, Shadrin V, Pecl
G. 2020. Opinion: Cultural and linguistic diversities are underappreciated pillars of
biodiversity. Proceedings of the National Academy of Sciences 117:26539–26543.
Fraser B. 2017. Maps reveal how Amazon development is closing in on isolated tribes.
Science. Lima, Peru. Available from
https://www.sciencemag.org/news/2017/08/maps-reveal-how-amazon-development-
closing-isolated-tribes.
Freitas CEC, Kahn JR, Rivas AAF. 2004. Indigenous people and sustainable development
in Amazonas. International Journal of Sustainable Development & World Ecology
11:312–325.
Garibaldi A, Turner N. 2004. Cultural Keystone Species: Implications for Ecological
Conservation and Restoration. Ecology and Society 9:1.
Garnett ST, Burgess ND, Fa JE, Fernández-Llamazares Á, Molnár Z, Robinson CJ, Watson
JEM, Zander KK, Austin B, Brondizio ES, Collier NF, Duncan T, Ellis E, Geyle H,
Jackson M V, Jonas H, Malmer P, McGowan B, Sivongxay A, Leiper I. 2018. A
spatial overview of the global importance of Indigenous lands for conservation. Nature
Sustainability 1:369–374.
Gay K. 2001. Rainforests of the World: A Reference Handbook, 2nd Edition. ABC-CLIO,
Santa Barbara, California.
Geist HJ, Lambin EF. 2002. Proximate Causes and Underlying Driving Forces of Tropical
Deforestation: Tropical forests are disappearing as the result of many pressures, both
local and regional, acting in various combinations in different geographical locations.
BioScience 52:143–150.
Giam X. 2017. Global biodiversity loss from tropical deforestation. Proceedings of the
National Academy of Sciences 114:5775–5777.
Gibson L, Lee TM, Koh LP, Brook BW, Gardner TA, Barlow J, Peres CA, Bradshaw CJA,
Laurance WF, Lovejoy TE, Sodhi NS. 2011. Primary forests are irreplaceable for
sustaining tropical biodiversity. Nature 478:378–381.

152
Gilbert J. 2017. Land grabbing, investments & indigenous peoples’ rights to land and
natural resources. Case studies and legal analysis. IWGIA, Copenhagen.
Godoy R, Brokaw N, Wilkie D, Colón D, Palermo A, Lye S, Wei S. 1998. Of Trade and
Cognition: Markets and the Loss of Folk Knowledge among the Tawahka Indians of
the Honduran Rain Forest. Journal of Anthropological Research 54:219–234.
Gómez-Baggethun E, Corbera E, Reyes-García V. 2013. Traditional Ecological Knowledge
and Global Environmental Change: Research findings and policy implications.
Ecology and Society 18.
Gorenflo LJ, Romaine S, Mittermeier RA, Walker-Painemilla K. 2012. Co-occurrence of
linguistic and biological diversity in biodiversity hotspots and high biodiversity
wilderness areas. Proceedings of the National Academy of Sciences 109:8032–8037.
Gray C, Bilsborrow R. 2020. Stability and change within indigenous land use in the
Ecuadorian Amazon. Global Environmental Change 63:102116.
Griffiths T. 2018. Closing the Gap: rights-based solutions for tackling deforestation. Page
(Forest Peoples Programme, editor). Moreton-in-Marsh, United Kingdom.
Guidi R. 2014. Balu Wala, or the Kuna ‘good life’: how one indigenous tribe is passing on
its traditions. Mongabay.com. Available from
https://news.mongabay.com/2014/10/balu-wala-or-the-kuna-good-life-how-one-
indigenous-tribe-is-passing-on-its-traditions-photos/.
Hamilton MJ, Walker RS, Kempes CP. 2020. Diversity begets diversity in mammal species
and human cultures. Scientific Reports 10:19654.
Hanbury S. 2020. Survival of Indigenous communities at risk as Amazon fire season
advances. Mongabay.com. Available from
https://news.mongabay.com/2020/09/survival-of-indigenous-communities-at-risk-as-
amazon-fire-season-advances/.
Hansen MC, Potapov P V, Moore R, Hancher M, Turubanova SA, Tyukavina A, Thau D,
Stehman S V, Goetz SJ, Loveland TR, Kommareddy A, Egorov A, Chini L, Justice
CO, Townshend JRG. 2013. High-Resolution Global Maps of 21st-Century Forest
Cover Change. Science 342:850–853.

153
Harris H. 2019. Corruption and the forestry industry in Papua New Guinea: transnational
actors, local dynamics and environmental impact. Asia Pacific Journal of
Environmental Law 22:48–65.
He Y, Baldiviezo JP, Agrawal A, Candaguira V, Perfecto I. 2019. Guardians of the Forests:
How Should an Indigenous Community in Eastern Bolivia Defend Their Land and
Forests under Increasing Political and Economic Pressures? Case Studies in the
Environment 3:1–14.
Henrich J. 2004. Demography and Cultural Evolution: How Adaptive Cultural Processes
can Produce Maladaptive Losses: The Tasmanian Case. American Antiquity 69:197–
214.
Human Rights Watch. 2019. Indonesia: Indigenous Peoples Losing Their Forests.
Available from https://www.hrw.org/news/2019/09/22/indonesia-indigenous-peoples-
losing-their-forests.
IPBES. 2018a. Summary for policymakers of the assessment report on land degradation
and restoration of the Intergovernmental Science-Policy Platform on Biodiversity and
Ecosystem Services. Page (Scholes R, Montanarella L, Brainich A, Barger N, ten
Brink B, Cantele M, Erasmus B, Fisher J, Gardner T, Holland TG, Kohler F, Kotiaho
JS, Maltitz G Von, Nangendo G, Pandit R, Parrotta J, Potts MD, Prince S, Sankaran
M, Willemen L, editors). IPBES, Bonn, Germany.
IPBES. 2018b. The IPBES regional assessment report on biodiversity and ecosystem
services for the Americas. Page (Rice J, Seixas CS, Zaccagnini ME, Bedoya-Gaitán
M, Valderrama N, editors). IPBES, Bonn, Germany.
IPCC. 2020. An IPCC Special Report on climate change, desertification, land degradation,
sustainable land management, food security, and greenhouse gas fluxes in terrestrial
ecosystems.
ISA. 2020. O impacto da pandemia na Terra Indígena Yanomami. Instituto Socioambiental.
Kai Z, Woan TS, Jie L, Goodale E, Kitajima K, Bagchi R, Harrison RD. 2014. Shifting
Baselines on a Tropical Forest Frontier: Extirpations Drive Declines in Local
Ecological Knowledge. PLOS ONE 9:e86598.

154
Kim S, Li G, Son Y. 2017. The Contribution of Traditional Ecological Knowledge and
Practices to Forest Management: The Case of Northeast Asia. Forests 8:496.
Kline MA, Boyd R. 2010. Population size predicts technological complexity in Oceania.
Proceedings of the Royal Society B: Biological Sciences 277:2559–2564.
Kodirekkala KR. 2015. External Intervention, Local Environment, and Knowledge Erosion:
A Forest-Based Community of South India. Culture, Agriculture, Food and
Environment 37:124–129.
Kolinjivadi V. 2011. Losing our pigs and our ancestors: threats to the livelihoods and
environment of Papua New Guinea. Mongabay.com. Available from
https://news.mongabay.com/2011/10/losing-our-pigs-and-our-ancestors-threats-to-the-
livelihoods-and-environment-of-papua-new-guinea/.
Krishna V V, Kubitza C, Pascual U, Qaim M. 2017. Land markets, Property rights, and
Deforestation: Insights from Indonesia. World Development 99:335–349.
Laland KN, Odling-Smee J, Feldman MW. 2001. Cultural niche construction and human
evolution. Journal of Evolutionary Biology 14:22–33.
Laurance WF, Kakul T, Keenan RJ, Sayer J, Passingan S, Clements GR, Villegas F, Sodhi
NS. 2011. Predatory corporations, failing governance, and the fate of forests in Papua
New Guinea. Conservation Letters 4:95–100.
Lewis MP. 2017. Ethnologue: languages of the world, 21st edn. SIL International, Dallas.
Lewis SL, Edwards DP, Galbraith D. 2015. Increasing human dominance of tropical
forests. Science 349:827–832. American Association for the Advancement of Science.
Lockwood M, Worboys GL, Kothari A. 2006. Protected areas management: a global guide.
Earthscan, London, Sterling.
Loh J, Harmon D. 2014. Biocultural Diversity: Threatened species, endangered languages.
WWF Netherlands, Zeist, The Netherlands.
Lombardo U, Iriarte J, Hilbert L, Ruiz-Pérez J, Capriles JM, Veit H. 2020. Early Holocene
crop cultivation and landscape modification in Amazonia. Nature 581:190–193.
Lyver PO, Timoti P, Davis T, Tylianakis JM. 2019. Biocultural Hysteresis Inhibits

155
Adaptation to Environmental Change. Trends in Ecology & Evolution 34:771–780.
Maffi L, Woodley E. 2010. Biocultural Diversity Conservation: A Global Sourcebook.
Earthscan, London & Washington DC.
Marquet PA, Santoro CM, Latorre C, Standen VG, Abades SR, Rivadeneira MM, Arriaza
B, Hochberg ME. 2012. Emergence of social complexity among coastal hunter-
gatherers in the Atacama Desert of northern Chile. Proceedings of the National
Academy of Sciences 109:14754–14760.
Mateo-Vega J, Spalding AK, Hickey GM, Potvin C. 2018. Deforestation, Territorial
Conflicts, and Pluralism in the Forests of Eastern Panama: A Place for Reducing
Emissions from Deforestation and Forest Degradation? Case Studies in the
Environment 2:1–12.
Mathez-Stiefel S-L, Brandt R, Lachmuth S, Rist S. 2012. Are the Young Less
Knowledgeable? Local Knowledge of Natural Remedies and Its Transformations in
the Andean Highlands. Human Ecology 40:909–930.
McCarthy J, Zen Z. 2010. Regulating the Oil Palm Boom: Assessing the Effectiveness of
Environmental Governance Approaches to Agro-industrial Pollution in Indonesia.
Law & Policy 32:153–179.
McDermott CL, Irland LC, Pacheco P. 2015. Forest certification and legality initiatives in
the Brazilian Amazon: Lessons for effective and equitable forest governance. Forest
Policy and Economics 50:134–142.
McElwee P, Fernández-Llamazares Á, Aumeeruddy-Thomas Y, Babai D, Bates P, Galvin
K, Guèze M, Liu J, Molnár Z, Ngo HT, Reyes-García V, Roy Chowdhury R, Samakov
A, Shrestha UB, Díaz S, Brondízio ES. 2020. Working with Indigenous and local
knowledge (ILK) in large-scale ecological assessments: Reviewing the experience of
the IPBES Global Assessment. Journal of Applied Ecology 57:1666–1676.
Minority Rights Group International. 2020a. Kuna. Available from
https://minorityrights.org/minorities/kuna/.
Minority Rights Group International. 2020b. Ba’Aka and related groups. Available from
https://minorityrights.org/minorities/baaka-related-groups/.

156
Morelli DS, Wilkie GA. 2000. Forest Foragers: A Day in the Life of Efe Pygmies in the
Democratic Republic of Congo. Cultural Survival Quarterly Magazine. Available from
https://www.culturalsurvival.org/publications/cultural-survival-quarterly/forest-
foragers-day-life-efe-pygmies-democratic-republic.
Mufwene SS. 2004. Language Birth and Death. Annual Review of Anthropology 33:201–
222.
Nettle D, Romaine S. 2000. Vanishing Voices: The Extinction of the World’s Languages.
Oxford University Press, Oxford.
Newton P, Kinzer AT, Miller DC, Oldekop JA, Agrawal A. 2020. The Number and Spatial
Distribution of Forest-Proximate People Globally. One Earth 3:363–370.
Newton P, Miller DC, Byenkya MAA, Agrawal A. 2016. Who are forest-dependent
people? A taxo nomy to aid livelihood and land use decision-making in forested
regions. Land Use Policy 57:388–395.
Nolte C, Agrawal A, Silvius KM, Soares-Filho BS. 2013. Governance regime and location
influence avoided deforestation success of protected areas in the Brazilian Amazon.
Proceedings of the National Academy of Sciences 110:4956.
Nugroho HYSH, van der Veen A, Skidmore AK, Hussin YA. 2018. Expansion of
traditional land-use and deforestation: a case study of an adat forest in the Kandilo
Subwatershed, East Kalimantan, Indonesia. Journal of Forestry Research 29:495–513.
Ostrom E, Nagendra H. 2006. Insights on linking forests, trees, and people from the air, on
the ground, and in the laboratory. Proceedings of the National Academy of Sciences
103:19224–19231.
Pahlevi A, Butler RA. 2019. Indigenous Iban community defends rainforests, but awaits
lands rights recognition. Mongabay.com. Available from
https://news.mongabay.com/2019/07/indigenous-iban-community-defends-rainforests-
but-awaits-lands-rights-recognition/.
Paiva PFPR, de Lourdes Pinheiro Ruivo M, da Silva Júnior OM, de Nazaré Martins Maciel
M, Braga TGM, de Andrade MMN, dos Santos Junior PC, da Rocha ES, de Freitas
TPM, da Silva Leite TV, Gama LHOM, de Sousa Santos L, da Silva MG, Silva ERR,

157
Ferreira BM. 2020. Deforestation in protect areas in the Amazon: a threat to
biodiversity. Biodiversity and Conservation 29:19–38.
Paneque-Gálvez J, Pérez-Llorente I, Luz AC, Guèze M, Mas J-F, Macía MJ, Orta-Martínez
M, Reyes-García V. 2018. High overlap between traditional ecological knowledge and
forest conservation found in the Bolivian Amazon. Ambio 47:908–923.
Parra SA, Folchi M, Simonetti JA. 2019. Knowledge of Native Edible Plants in a
Monoculture Plantation-Dominated Landscape. Journal of Ethnobiology 39:567–583.
Parrotta JA, Agnoletti M. 2012. Traditional Forest-Related Knowledge and Climate Change
BT - Traditional Forest-Related Knowledge: Sustaining Communities, Ecosystems
and Biocultural Diversity. Pages 491–533 in J. A. Parrotta and R. L. Trosper, editors.
Springer Netherlands, Dordrecht.
Pascual U, Adams WM, Díaz S, Lele S, Mace GM, Turnhout E. 2021. Biodiversity and the
challenge of pluralism. Nature Sustainability.
Pemunta NV. 2019. Fortress conservation, wildlife legislation and the Baka Pygmies of
southeast Cameroon. GeoJournal 84:1035–1055.
Peralta PA, Kainer KA. 2008. Market Integration and Livelihood Systems: A Comparative
Case of Three Asháninka Villages in the Peruvian Amazon. Journal of Sustainable
Forestry 27:145–171.
Pérez-Llorente I, Paneque-Gálvez J, Luz AC, Macía MJ, Guèze M, Domínguez-Gómez JA,
Reyes-García V. 2013. Changing indigenous cultures, economies and landscapes: The
case of the Tsimane’, Bolivian Amazon. Landscape and Urban Planning 120:147–157.
Pérez CJ, Smith C. 2019. Indigenous Knowledge Systems and Conservation of Settled
Territories in the Bolivian Amazon. Sustainability 11:6099.
Porter-Bolland L, Ellis EA, Guariguata MR, Ruiz-Mallén I, Negrete-Yankelevich S, Reyes-
García V. 2012. Community managed forests and forest protected areas: An
assessment of their conservation effectiveness across the tropics. Forest Ecology and
Management 268:6–17.
Potapov P, Hansen MC, Laestadius L, Turubanova S, Yaroshenko A, Thies C, Smith W,

158
Zhuravleva I, Komarova A, Minnemeyer S, Esipova E. 2017. The last frontiers of
wilderness: Tracking loss of intact forest landscapes from 2000 to 2013. Science
Advances 3:e1600821.
Prochazka K, Vogl G. 2017. Quantifying the driving factors for language shift in a
bilingual region. Proceedings of the National Academy of Sciences 114:4365–4369.
Pyle RM. 2003. Nature matrix: reconnecting people and nature. Oryx 37:206–214.
Reyes-García V, Guèze M, Luz AC, Paneque-Gálvez J, Macía MJ, Orta-Martínez M, Pino
J, Rubio-Campillo X. 2013a. Evidence of traditional knowledge loss among a
contemporary indigenous society. Evolution and Human Behavior 34:249–257.
Reyes-García V, Luz AC, Gueze M, Paneque-Gálvez J, Macía MJ, Orta-Martínez M, Pino
J. 2013b. Secular trends on traditional ecological knowledge: An analysis of changes
in different domains of knowledge among Tsimane’ men. Learning and Individual
Differences 27:206–212.
Reyes-García V, Vadez V, Huanca T, Leonard WR, McDade T. 2007. Economic
Development and Local Ecological Knowledge: A Deadlock? Quantitative Research
from a Native Amazonian Society. Human Ecology 35:371–377.
Reyes‐García V, Vadez V, Byron E, Apaza L, Leonard WR, Perez E, Wilkie D. 2005.
Market Economy and the Loss of Folk Knowledge of Plant Uses: Estimates from the
Tsimane’ of the Bolivian Amazon. Current Anthropology 46:651–656.
Riggio J, Baillie JEM, Brumby S, Ellis E, Kennedy CM, Oakleaf JR, Tait A, Tepe T,
Theobald DM, Venter O, Watson JEM, Jacobson AP. 2020. Global human influence
maps reveal clear opportunities in conserving Earth’s remaining intact terrestrial
ecosystems. Global Change Biology 26:4344– 4356.
Robbins P. 2015. Eroding Cultures and Environments: What a Rapidly Changing Earth
Means for the Richness of Human Experience. Georgetown Journal of International
Affairs 16:132–139.
Robinson BE, Holland MB, Naughton-Treves L. 2014. Does secure land tenure save
forests? A meta-analysis of the relationship between land tenure and tropical
deforestation. Global Environmental Change 29:281–293.

159
Rosa IMD, Smith MJ, Wearn OR, Purves D, Ewers RM. 2016. The Environmental Legacy
of Modern Tropical Deforestation. Current Biology 26:2161–2166.
RRI. 2020. Rights-Based Conservation: The path to preserving Earth’s biological and
cultural diversity? Washington, DC.
Santika T, Meijaard E, Budiharta S, Law EA, Kusworo A, Hutabarat JA, Indrawan TP,
Struebig M, Raharjo S, Huda I, Sulhani, Ekaputri AD, Trison S, Stigner M, Wilson
KA. 2017. Community forest management in Indonesia: Avoided deforestation in the
context of anthropogenic and climate complexities. Global Environmental Change
46:60–71.
Santoro CM, Capriles JM, Gayo EM, de Porras ME, Maldonado A, Standen VG, Latorre C,
Castro V, Angelo D, McRostie V, Uribe M, Valenzuela D, Ugalde PC, Marquet PA.
2017. Continuities and discontinuities in the socio-environmental systems of the
Atacama Desert during the last 13,000years. Journal of Anthropological Archaeology
46:28–39.
Shepherd SM, Delgado RH, Sherwood J, Paradies Y. 2017. The impact of indigenous
cultural identity and cultural engagement on violent offending. BMC Public Health
18:50.
Suárez E, Morales M, Cueva R, Utreras Bucheli V, Zapata-Ríos G, Toral E, Torres J, Prado
W, Vargas Olalla J. 2009. Oil industry, wild meat trade and roads: indirect effects of
oil extraction activities in a protected area in north-eastern Ecuador. Animal
Conservation 12:364–373.
Sutherland WJ. 2003. Parallel extinction risk and global distribution of languages and
species. Nature 423:276–279.
Tang R, Gavin MC. 2016. A Classification of Threats to Traditional Ecological Knowledge
and Conservation Responses. Conservation and Society 14:57–70.
Tauli-Corpuz V, Alcorn J, Molnar A, Healy C, Barrow E. 2020. Cornered by PAs:
Adopting rights-based approaches to enable cost-effective conservation and climate
action. World Development 130:104923.
Tomlinson K. 2019. Indigenous rights and extractive resource projects: negotiations over

160
the policy and implementation of FPIC. The International Journal of Human Rights
23:880–897.
Tubbeh RM, Zimmerer KS. 2019. Unraveling the Ethnoterritorial Fix in the Peruvian
Amazon: Indigenous Livelihoods and Resource Management after Communal Land
Titling (1980s-2016). Journal of Latin American Geography 18:33–59.
Turvey ST, Bryant J V, McClune KA. 2021. Differential loss of components of traditional
ecological knowledge following a primate extinction event. Royal Society Open
Science 5:172352. Royal Society.
Ukam LE. 2018. The Effects of the Erosion of Biodiversity on Culture: The Experience of
Erei People in Biase Local Government Area of Cross River State Nigeria. Journal of
Climatology & Weather Forecasting:6:S1.
UNESCO Ad Hoc Expert Group on Endangered Languages. 2003. Language Vitality and
Endangerment. Paris.
Vadez V, Reyes-García V, Godoy RA, Apaza VL, Byron E, Huanca T, Leonard WR, Pérez
E, Wilkie D. 2004. Brief Communication: Does Integration to the Market Threaten
Agricultural Diversity? Panel and Cross-Sectional Data From a Horticultural-Foraging
Society in the Bolivian Amazon. Human Ecology 32:635–646.
Vargas Zeppetello LR, Parsons LA, Spector JT, Naylor RL, Battisti DS, Masuda YJ, Wolff
NH. 2020. Large scale tropical deforestation drives extreme warming. Environmental
Research Letters 15:84012.
Vasco C, Bilsborrow R, Torres B, Griess V. 2018. Agricultural land use among mestizo
colonist and indigenous populations: Contrasting patterns in the Amazon. PLOS ONE
13:e0199518.
Vilela T, Malky Harb A, Bruner A, Laísa da Silva Arruda V, Ribeiro V, Auxiliadora Costa
Alencar A, Julissa Escobedo Grandez A, Rojas A, Laina A, Botero R. 2020. A better
Amazon road network for people and the environment. Proceedings of the National
Academy of Sciences 117:7095–7102.
Voggesser G, Lynn K, Daigle J, Lake FK, Ranco D. 2014. Cultural impacts to tribes from
climate change influences on forests BT - Climate Change and Indigenous Peoples in

161
the United States: Impacts, Experiences and Actions. Pages 107–118 in J. K.
Maldonado, B. Colombi, and R. Pandya, editors. Springer International Publishing,
Cham.
Walker RS, Sattenspiel L, Hill KR. 2015. Mortality from contact-related epidemics among
indigenous populations in Greater Amazonia. Scientific Reports 5:14032.
Walker W, Baccini A, Schwartzman S, Ríos S, Oliveira-Miranda MA, Augusto C, Ruiz
MR, Arrasco CS, Ricardo B, Smith R, Meyer C, Jintiach JC, Campos EV. 2014.
Forest carbon in Amazonia: the unrecognized contribution of indigenous territories
and protected natural areas. Carbon Management:1–7.
Wallace S. 2016. Illegal Loggers Wage War on Indigenous People in Brazil. National
Geographic. Available from
https://www.nationalgeographic.com/news/2016/01/160120-brazil-illegal-logging-
indigenous-people-Amazon-Basin-Awa-ibama/.
Watson JEM, Evans T, Venter O, Williams B, Tulloch A, Stewart C, Thompson I, Ray JC,
Murray K, Salazar A, McAlpine C, Potapov P, Walston J, Robinson JG, Painter M,
Wilkie D, Filardi C, Laurance WF, Houghton RA, Maxwell S, Grantham H, Samper
C, Wang S, Laestadius L, Runting RK, Silva-Chávez GA, Ervin J, Lindenmayer D.
2018. The exceptional value of intact forest ecosystems. Nature Ecology & Evolution
2:599–610.
Weinberger VP, Quiñinao C, Marquet PA. 2017. Innovation and the growth of human
population. Philosophical Transactions of the Royal Society B: Biological Sciences
372:20160415.
Weinreich U. 1953. Languages in contact, linguistic circle of New York. Publication 1:64–
65.
Whiten A, Ayala FJ, Feldman MW, Laland KN. 2017. The extension of biology through
culture. Proceedings of the National Academy of Sciences 114:7775–7781.
Wilson EO. 2016. Half-earth: our planet’s fight for life. Liveright Publishing Corporation,
New York and London.
Woods Hole Research Center, Environmental Defense Fund. 2015. Tropical Forest Carbon

162
in Indigenous Territories: A Global Analysis. A report prepared for UNFCCC COP21.
Worboys G, Lockwood M, Kothari A, Feary S, Pulsford I. 2015. Protected Area
Governance and Management. ANU Press, Canberra.
Zent S. 2009. Traditional ecological knowledge (TEK) and biocultural diversity: a close-up
look at linkages, delearning trends and changing patterns of transmission. Pages 103–
121 in P. Bates, M. Chiba, S. Kube, and D. Nakashima, editors. Learning and knowing
in indigenous societies today. UNESCO, Paris, France.

163
General Discussion
It is well established that future expansions of area-based conservation should place a
particular focus on protecting and restoring tropical ecosystems, given their exceptionally
high biodiversity value. The research presented in this thesis goes a step further and delves
into the economic, ecological, and social challenges that tropical regions will face to
expand and build a system of area-based conservation that is able to contribute
meaningfully to biodiversity conservation and people’s wellbeing.
In Chapter 1, I assessed the relationship between funding and the performance of PAs
in Latin America using unique and precise financial data and state-of-the-art statistical
matching to explore how funding shortfalls affected the ecological outcomes of PAs. Our
results offer novel insights on the drivers of PAs effectiveness and how they operate and
interrelate at regional and national scales. When looking across Latin America, I found that
the quality of national governance is the strongest predictor of impact, suggesting that
protected area performance is first and foremost a result of the overall country-level
policies that affect forest loss inside and outside PAs. But when looking within a specific
country, I detected that funding plays a crucial role in improving the impact of individual
PAs. Thus, I show that to improve PA effectiveness, we need to address both country-level
governance structures as well as to ensure sufficient funding for site-level management,
especially for PAs facing major human pressures on forests.
Many tropical regions lack high-quality data related to the cost of expanding their PA
system. The absence of reliable cost data precludes the ability to assess cost-effectiveness
when identifying conservation priority areas. In Chapter 2, I generated spatial information

164
on PA costs (management and opportunity) and combined it with species distribution maps
to identify cost-effective priority areas for conservation in the western Amazon. This
contribution may thus help governments and conservation institutions to achieve
biodiversity conservation objectives while maximizing scarce conservation resources. It
also helps to understand the conditions that enable less expensive conservation, such as
collaboration with indigenous peoples and among countries. Moreover, this analysis offers
the first geospatial model that explains the variation in the annual management costs of
Amazonian PAs, which conservation planners and scientists could use to estimate the
budget needed for different prioritization scenarios.
Chapter 3 enables a view of the Andes as a single entity, whose high biological and
cultural diversities are an important heritage that needs to be preserved and managed in an
integrated manner. Based on this view, I provide the most comprehensive review of the
current spatial protection needs for biodiversity and Nature’s Contribution to People
wellbeing along the Andes. I also delve into the economic challenges associated with
enhancing such protection, and recognize the diversity of actors living in the region and
how their different interests need to be made compatible. Thus, this study seeks to enable
transboundary, effective, and fair conservation planning that maintains the critical socio-
environmental services that the region provides to the local and global human population.
Worldwide, hundreds of indigenous and local communities claim that undesired and
rapid deforestation in their territories negatively affects their livelihoods and erodes their
cultural systems. As a response to this claim, in Chapter 4, I reviewed individual case
studies to build the first conceptual model that explains the connections between forest loss
and cultural change in local communities. Moreover, through spatial analysis, I detect that,

165
since 2000, rapid deforestation has been taking place in the territories of ~1,400 cultural
groups across the tropics, which might threaten a large part of the world’s cultural diversity.
These results point out the need for a more integrative approach to support cultural
continuity; preserving and documenting languages, beliefs, and practices will achieve little
at curbing cultural erosion if not accompanied by the protection of the landscapes that
support those cultures. We urgently need to support stronger forest protection policies and
the rights of local communities to the land and resources that allow their cultures to thrive.
Lessons learned and action areas to strengthen area-based conservation
In this section, I integrate the main findings of the four chapters of this thesis into five
areas of actions, which together could enhance the financial sustainability, ecological
representativeness, and equitable management of conservation areas (Fig. 1). Below, I
provide arguments for these actions and discuss the conditions and challenges of their
implementation.
Figure 1. Areas of actions (A-E) to build more financially sustainable, ecological
representative, and socially equitable networks of area-based conservation in tropical
regions. Each arrow connects an action to the aspects of conservation areas that are

166
expected to be improved. Dark arrows indicate direct positive impacts, while dashed arrows
refer to additional positive impacts.
Action A. Secure adequate funding and financial transparency.
This thesis provides evidence that current and future PAs should be accompanied by
effective governance and adequate funding to avoid the proliferation of “paper parks” with
low conservation success (Chapter 1). Ensuring a proper budget is critical for PAs
exposed to high human pressures since their effectiveness is more vulnerable to
underfunding (Chapter 1). The budget needed for covering basic management in current
and new PAs represents a small percentage of the gross domestic product of, at least, some
Latin American countries, suggesting that moderate increases in government spending
could reduce financial and ecological gaps (Chapter 2). However, some countries have
critical economic constraints, PAs under chronic underfunding and large deforestation
pressure (Chapter 1). Thus, increased and stable international and private financing is
particularly relevant for supporting these countries in covering PA management needs in
the short term (Chapter 1, Chapter 2).
A financially sustainable and effective PA system also requires nations to produce
transparent reports on PA budget, investment allocation, and resource use efficiency
(Chapter 1). In this context, conservation cost modelling can help governments to project
and plan more adequate budgets for PAs (Chapter 2). This thesis has discussed other
actions that can also contribute to achieving a financially sustainable system, such as
protecting places that deliver high return of investment for biodiversity (see Action C) or
that provide NCPs that are valued by the population and are potential sources of revenues

167
(Action D) or governing conserved areas in partnership with diverse landowners to fairly
share the costs and benefits of protection (Actions E and D).
Action B. Focus on efficiency when expanding conservation areas.
Findings of this thesis support the need to expand area‐based conservation efforts but
targeted at the right places. Analyses for the western Amazon (Chapter 2) and the Andes
mountain range (Chapter 4) show that significant additions of conservation areas are
needed to achieve a higher and more balanced representation of species, ecosystems, or
NCPs of interest. Importantly, future investments in expanding areas under protection
should be efficient, which means that PA additions must be strategically targeted at places
with high biodiversity conservation value. Efficiency is crucial because it minimizes the
risk of constructing a PA system that is unnecessarily too large and expensive to manage
(Chapter 2). As this thesis exemplifies, areas of high value for biodiversity are not evenly
distributed in space. In the western Amazon (Chapter 2) and the Andes (Chapter 3),
systematic conservation planning exercises detected specific areas that represent cost-
effective solutions to the goal of covering species and ecosystems currently lacking
protection. Overall, to guide efficient decisions, national or regional policies should
encourage the documentation of the value of all sites of significance for biodiversity (e.g.,
wilderness retention, restoration, connectivity, prevention of species extinctions under
climate change) and establish representation targets for them (Watson et al. 2016; Di
Marco et al. 2016; Visconti et al. 2019). These different values could lead to overlapping
spatial plans but also to distinct suggestions on where to locate PAs that would need to be
further discussed by decision-makers and stakeholders.

168
Action C. Consider nature’s contribution to people when expanding and managing
conservation areas.
Natural and semi natural areas represent the main source of subsistence and cultural
identity for countless IPLCs in the tropics (Chapters 3, Chapter 4). Therefore, current and
future PAs must ensure the integrity of people-nature interactions that sustain significant
ecological and cultural values (Chapters 3, Chapter 4). In addition to targeting
biodiversity representation, Systematic Conservation Planning may include among its
objectives safeguarding and providing demanded NCPs and other values of nature. This
would contribute towards promoting conservation schemes that enhance the equitable
distribution of the benefits delivered by protection, while also helping to justify funding
and investment opportunities (Chapter 3). In this context, spatial prioritization can be used
to boost the efficiency of PA systems by identifying areas whose protection would close
ecological representation gaps while also capturing demanded NCPs (Chapter 3). Overall,
it is clear that the design of future PAs is sensitive to people’s needs and how they value
nature. Negotiations with various interest groups are therefore critical to achieving a more
satisfactory conservation planning for people and nature.
Action D. Promote area-based conservation with diversified management and governance.
Many of the sites identified in this thesis as priority for improving biodiversity
representation overlap with lands that sustain the livelihoods and cultures of thousands of
people and with territories managed by indigenous people and other smallholders
(Chapter 2, Chapter 3). Therefore, protecting these priority sites requires strategies that
address the aspirations, needs, and rights of local actors. This could be achieved by

169
promoting alternative governance and management schemes to the widely implemented
state-owned strict protection, which usually restrict human activity and lead to social
conflict. For example, an alternative is to document and recognize landscapes that are well-
managed by private owners and local communities and support their efforts as “Other
Effective area-based Conservation Measures” (OECMs) (Chapter 3). Moreover, since
processes and actors that influence the impact of PAs can occur at multiple levels (e.g.,
indigenous communities at site-PA level, and the governance quality at a national level,
Chapter 1), a polycentric institutional scheme can provide a useful framework of
governance (i.e., with multiple centers of semiautonomous decision making, Nagendra &
Ostrom 2012).
By combining diverse governance schemes and management objectives of reserves and
OECMs it is possible to complement biodiversity representation, improve protection
effectiveness and connectivity while providing a range of benefits for local actors.
Moreover, by engaging with local actors managing other areas (e.g., community lands,
private owners), the conservation costs of closing ecological representation gaps can be
shared (Chapter 2). Still, there are major challenges related to private rights and
conservation success that policies need to overcome, such as determining and negotiating
the responsibilities that accompany private conservation and what conservation outcomes
are expected from it (Moon et al. 2021).

170
Action E. Ensure IPLCs’ land rights and recognize their contribution to biodiversity
conservation and diverse ways of valuing nature.
In tropical regions, the establishment and management of PAs can have a profound impact
on the wellbeing of IPLCs, who in turn are central actors to achieve successful PAs. For
instance, in the western Amazon and Andes, an efficient PA expansion for biodiversity
conservation needs IPLCs as allies because sites for closing representation gaps often
overlap with territories inhabited by IPLCs (Chapter 2, Chapter 3). Moreover,
establishing new PAs in Amazonian indigenous lands is associated with more affordable
management costs (Chapter 2). IPLCs’ traditional knowledge can also help achieve
sustainable management of biodiversity and NCPs within PAs (Chapter 3). IPLCs might
also influence the impact of PAs in avoiding deforestation (Chapter 1). Likewise, PAs can
positively affect the prospects of cultural survival of IPLCs by protecting the forests that
sustain these communities. However, PAs can also affect them negatively by evicting
IPLCs from their territories against their will (Chapter 4). All of this suggests that, to
deliver positive outcomes for IPLCs and nature, conservation planning in tropical regions
must investigate and address these interconnections. For instance, PAs need to guarantee
IPLCs access to their biocultural environment and space for reproducing their biocultural
practices because this is a key factor to sustain their traditional ecological knowledge and
conservation attitudes that also benefits PAs (Chapter 4). Also, since traditional
indigenous management seems to lead to more effective forest protection than other
governance regimes (Chapter 4), many suggest that enforcing collective IPLCs’ tenure
rights and advocating indigenous-led conservation is a more cost-effective policy for
improving ecological representation and social equity than establishing state and strict

171
forest PAs (RRI 2020; Tauli-Corpuz et al. 2020). Nevertheless, the success of community
rights-based conservation needs a sound understanding of the conditions that have
traditionally enabled the long-term protection of biodiversity. For example, there is
concern that the rising global demand for palm oil and rubber could lead to upward shifts
in land prices in Indonesia, which could provide new incentives for local communities to
sell their lands or cultivate plantation crops compromising biodiversity (Krishna et al.
2017). IPLCs are also highly diverse, and in some cases, their aspirations, economic
interests, or perspectives on how to manage biodiversity might not be compatible with the
views of conservation science (Pascual et al. 2021, Chapter 4). In such situations, efforts
towards recognizing, negotiating, and coordinating actions for biodiversity and IPLC’s
perspectives are required to come up with fairer conservation interventions within the same
territory (Chapter 2, Chapter 4). Overall, scientific findings support the conservation role
of IPLCs, but it is important to avoid uniform policies that homogenize indigenous groups
and their socioeconomic contexts (Gray & Bilsborrow 2020).
The five areas of actions recognize the tropics as highly biodiverse and as human-
inhabited landscapes, where there are close and long-term interdependencies between
people’s wellbeing and nature (Fa et al. 2020; Ellis et al. 2021). These actions also align
with the “inclusive conservation perspective” (Tallis et al. 2014) or “People and Nature”
approach (Mace 2014), in which different visions of biodiversity values and conservation
area management, ranging from biodiversity-centered to socio-economically driven
motivations, are balanced to achieve ecologically and socially relevant outcomes.
Nevertheless, the implementation of these actions may involve trade-offs and unintended

172
consequences. For example, it has been suggested that sharing conservation areas for
sustaining biodiversity and NCPs may deliver poor outcomes for both goals compared to
lands managed exclusively for biodiversity or NCP utilization (Karp et al. 2015; Ellis &
Mehrabi 2019). Overall, measuring the success of area-based conservation and optimizing
trade-offs is difficult when nature and people are considered together (Mace 2014). Thus, it
is critical for science to produce coherent, inclusive, and measurable metrics on the social
and biological impact of area-based conservation (Faith et al. 2010; Mace 2014).
Informing global agendas for area-based conservation
The world’s nations are currently defining the post-2020 Global Biodiversity
Framework to set the planet on a path to a sustainable future for biodiversity. This
framework will formulate a new and ambitious target for area-based conservation (“Target
2”) that involves increasing its effectiveness and coverage by 2030 (CBD 2020). Here, I
based on the main findings of this thesis on how to strengthen area-based conservation in
the tropics, I discuss the proposed Target 2, as presented in the Update of the Zero Draft of
the Post 2020 Global Biodiversity Framework (CBD 2020):
“Target 2. By 2030, protect and conserve through well connected and effective
system of protected areas and other effective area-based conservation
measures at least 30 per cent of the planet with the focus on areas particularly
important for biodiversity.”

173
According to the results of this thesis, the following elements of Target 2 fit the needs
of area-based conservation in the tropics: (1) scaling up the proportion of land that is
covered by conservation areas focusing on areas of importance for biodiversity, (2) through
PAs and OECMs, and (3) highlighting the need for building a well-connected network and
with effective management (which demands proper funding). However, there are two
aspects relevant to tropical regions that are not directly addressed in the currently proposed
target and suggested indicators to track its progress.
First, the proposed Target 2 focuses solely on preserving important areas for
biodiversity. Thus, its implementation might fail to recognize the need for building a
system of conservation areas that maximize the provision of a broader range of nature’s
benefits and services required by people (Action C). Likewise, this target overlooks the role
of PAs in meeting different United Nations’ Sustainable Development Goals (e.g., poverty
alleviation, food and water security, disaster risk reduction) and supporting climate change
mitigation deals (Bhola et al. 2020; Arneth et al. 2020).
Second, the current draft for Target 2 lacks explicit recognition of IPLCs’ land
sovereignty and contribution to biodiversity conservation (Action E). Moreover, it does not
address the importance of ensuring equitable management, which was explicit in the former
area-based target in the 2011-2020 Biodiversity Framework). Consequently, the current
wording has raised concern in the Global South about the negative social impact that a
massive scaling up of conservation area coverage might have on IPLCs, small landowners,
and rural population who inhabit priority places for biodiversity protection (Büscher et al.
2017; Ellis & Mehrabi 2019; Minority Rights Group et al. 2020; RRI 2020; Agrawal et al.
2021). This thesis has treated some of these risks, including the loss of access to land and

174
resources, the erosion of cultural systems, or the reduction of life opportunities (RRI 2020;
Agrawal et al. 2021). Moreover, although the CBD and the OECM framework identify
indigenous-conserved lands (e.g., ICCAs) as a critical governance regime, their recognition
remains in practice marginal compared to state PAs and other OECMs (Tauli-Corpuz et al.
2020).
Given the ambitious expansion of conservation-based areas proposed by Target 2
(covering at least 30% of the planet), I argue that this target should be adapted to better
accommodate the needs of both nature and local people and avoid unintended negative
social impacts. For this, Target 2 should reflect on the types of areas-based conservation
that are promoted and how they are going to be sustained. Although there is no single
strategy to solve these challenges, I suggest that a more ecologically sound, cost-effective,
and socially just proposal for Target 2 would be:
By 2030, protect and conserve through a well-connected, effectively, and
equitably managed system of protected areas and other effective area-based
conservation measures, in partnerships with lands owned or governed by
indigenous peoples and local communities, at least 30% of the planet with the
focus on areas particularly important for biodiversity and other nature’s
contributions to people’s wellbeing.
This alternative formulation of Target 2 seeks to reconcile an ambitious expansion of
conservation areas with the needs and aspirations of diverse sectors and local communities.

175
In this manner, the target for area-based conservation aligns better with the 2050 Vision for
Biodiversity of “living in harmony with nature” that was adopted as part of the Strategic
Plan for Biodiversity (CBD 2018).

176
Conclusions
Chapter 1 – Impact of funding deficit on conservation effectiveness
• Most assessed PAs within Ecuador and PA systems in Latin America curbed
deforestation compared to unprotected lands, which evidences their contribution to
biodiversity conservation.
• Within a PA system (Ecuadorian case), lower PA impact was associated with larger
funding deficit, especially in PAs facing major human pressure over their forests.
Low human development reduces the overall impact of a country’s PA system in
curbing deforestation.
• PA impact can be maximized with better resource allocation for individual PAs,
combined with strategies for strengthening institutions and governance of PA
systems.
• PA systems under higher deforestation pressure tended to have larger funding
deficits, which calls for better international funding to support nations in closing
these shortfalls in the short term.
Chapter 2 – Cost-effective protection of biodiversity
• Costs associated with PAs are not uniform in the western Amazon. Lands with
lower management costs (per unit area) have lower accessibility, offer opportunities
to create large reserves, and overlap with indigenous lands. High opportunity costs

177
from agriculture occur in mountain landscapes, where land is highly suitable for
crop expansion combined with better accessibility to markets.
• Prioritizations that incorporate spatial data on conservation costs, involve
indigenous lands, and assume international collaboration allow maximizing species
representation at lower management and opportunity costs.
• Based on our modeling, the aggregated management cost of current and
complementary proposed PAs far exceed the current spending but seems feasible
and affordable for governments and the international community.
Chapter 3 – Andean protected areas for nature and people
• Closing species and ecosystem representation gaps in the Andes is particularly
challenging; this requires many small conservation areas in places with relatively
high economic and social costs.
• To address these challenges while meeting local people’s needs, three actions for
area-based conservation are required: integrating NCPs when planning for cost-
effective expansion of biodiversity protection, diversifying administration regimes
and management, and enhancing regional collaboration and international financial
support.

178
Chapter 4 – Deforestation threats to cultural diversity
• Forest loss and degradation can precipitate processes of cultural erosion and
assimilation in forest-dwellers by three pathways: (1) reducing people’s interactions
with their biocultural landscape, (2) increasing their exposure to dominant cultural
groups, and (3) reducing cultural group sizes.
• The prospect for the survival of ~1,400 ethnolinguistic groups from tropical forests
(20% of the world’s diversity) is likely jeopardized by the significant expansion of
forest loss towards their territories during this century.
• Guaranteeing land tenure rights of IPLCs is often a cost-effective strategy to
preserve forests, mitigate climate change, and avoid cultural erosion.
• Curbing deforestation within PAs may not be sufficient to safeguard forest-
dependent cultures. It is also needed that PA management ensures IPLCs’ land
rights, guarantees their access to natural resources and their participatory role in
forest management.
Integrated conclusions
• The success of area-based conservation and the wellbeing of IPLCs are strongly
connected, which calls for a better understanding of these links and their sensible
consideration when planning the expansion and management of conservation areas
in tropical regions.
• Five areas of actions can help to enhance the financial sustainability, ecological
representation and social equity of area-based conservation in the tropics: (1)

179
enhancing international and private funding support and transparent financial
reporting, (2) continuing the expansion of conservation areas focusing on preserving
sites that efficiently improve biodiversity protection and (3) NCP retention , (4)
through a combination of diverse models of PAs and OECMs, and (5) in
partnerships with IPLCs.
• To deliver higher benefits for nature and people, post-2020 global agreements for
area-based conservation should incorporate actions that harmonize biodiversity
protection needs with the concerns and aspirations of the local human population.

180
References
Agnoletti M, Rotherham ID. 2015. Landscape and biocultural diversity. Biodiversity and
Conservation 24:3155–3165.
Agrawal A et al. 2021. An Open Letter to the Lead Authors of ‘Protecting 30% of the
Planet for Nature: Costs, Benefits and Implications. Available from
https://openlettertowaldronetal.wordpress.com/.
Andam KS, Ferraro PJ, Sims KRE, Healy A, Holland MB. 2010. Protected areas reduced
poverty in Costa Rica and Thailand. Proceedings of the National Academy of Sciences
107:9996.
Arneth A, Shin Y-J, Leadley P, Rondinini C, Bukvareva E, Kolb M, Midgley GF,
Oberdorff T, Palomo I, Saito O. 2020. Post-2020 biodiversity targets need to embrace
climate change. Proceedings of the National Academy of Sciences 117:30882 – 30891.
Aseres SA, Sira RK. 2020. Estimating visitors’ willingness to pay for a conservation fund:
sustainable financing approach in protected areas in Ethiopia. Heliyon 6:e04500.
Bhola N, Klimmek H, Kingston N, Burgess ND, van Soesbergen A, Corrigan C, Harrison J,
Kok MTJ. 2020. Perspectives on area-based conservation and its meaning for future
biodiversity policy. Conservation Biology 35:168–178.
Bovarnick A, Baca JF, Galindo J, Negret H. 2010. Financial Sustainability of Protected
Areas in Latin America and the Caribbean: Investment Policy Guidance. United Nations
Development Programme and The Nature Conservancy.
Bradshaw CJA, Sodhi NS, Brook BW. 2009. Tropical turmoil: a biodiversity tragedy in
progress. Frontiers in Ecology and the Environment 7:79–87.
Büscher B, Fletcher R, Brockington D, Sandbrook C, Adams WM, Campbell L, Corson C,

181
Dressler W, Duffy R, Gray N, Holmes G, Kelly A, Lunstrum E, Ramutsindela M,
Shanker K. 2017. Half-Earth or Whole Earth? Radical ideas for conservation, and their
implications. Oryx 51:407–410.
Butchart SHM et al. 2015. Shortfalls and Solutions for Meeting National and Global
Conservation Area Targets. Conservation Letters 8:329–337.
CBD. 2011. Article 2. Use of Terms. Convention on Biological Diversity. UN Environment
Programme.
CBD. 2018. 14/2. Scenarios for the 2050 Vision for Biodiversity. Sharm El-Sheikh, Egypt.
CBD. 2020. Update of the Zero Draft of the Post-2020 Global Biodiversity Framework.
Convention on Biological Diversity. UN Environment Programme.
Chazdon RL, Harvey CA, Komar O, Griffith DM, Ferguson BG, Martínez-Ramos M,
Morales H, Nigh R, Soto-Pinto L, Van Breugel M, Philpott SM. 2009. Beyond Reserves:
A Research Agenda for Conserving Biodiversity in Human-modified Tropical
Landscapes. Biotropica 41:142–153.
Coad L, Watson JEM, Geldmann J, Burgess ND, Leverington F, Hockings M, Knights K,
Di Marco M. 2019. Widespread shortfalls in protected area resourcing undermine efforts
to conserve biodiversity. Frontiers in Ecology and the Environment 17:259–264.
Devenish C, Gianella C. 2012. 20 years of Sustainable Mountain Development in the
Andes - from Rio 1992 to 2012 and beyond. CONDESAN, Lima, Peru.
Di Marco M, Watson JEM, Venter O, Possingham HP. 2016. Global Biodiversity Targets
Require Both Sufficiency and Efficiency. Conservation Letters 9:395–397.
Dinerstein E, Joshi AR, Vynne C, Lee ATL, Pharand-Deschênes F, França M, Fernando S,
Birch T, Burkart K, Asner GP, Olson D. 2020. A “Global Safety Net” to reverse
biodiversity loss and stabilize Earth’s climate. Science Advances 6:eabb2824.

182
Dudley N. 2008. Guidelines for Applying Protected Area Management Categories. IUCN,
Gland, Switzerland.
Ellis EC, Gauthier N, Klein Goldewijk K, Bliege Bird R, Boivin N, Díaz S, Fuller DQ, Gill
JL, Kaplan JO, Kingston N, Locke H, McMichael CNH, Ranco D, Rick TC, Shaw MR,
Stephens L, Svenning J-C, Watson JEM. 2021. People have shaped most of terrestrial
nature for at least 12,000 years. Proceedings of the National Academy of Sciences
118:e2023483118.
Ellis EC, Mehrabi Z. 2019. Half Earth: promises, pitfalls, and prospects of dedicating Half
of Earth’s land to conservation. Current Opinion in Environmental Sustainability 38:22–
30.
Fa JE et al. 2020. Importance of Indigenous Peoples’ lands for the conservation of Intact
Forest Landscapes. Frontiers in Ecology and the Environment 18:135– 140.
Faith DP, Magallón S, Hendry AP, Conti E, Yahara T, Donoghue MJ. 2010. Evosystem
services: an evolutionary perspective on the links between biodiversity and human well-
being. Current Opinion in Environmental Sustainability 2:66–74.
Ferraro PJ, Hanauer MM. 2014. Quantifying causal mechanisms to determine how
protected areas affect poverty through changes in ecosystem services and infrastructure.
Proceedings of the National Academy of Sciences 111:4332–4337.
Flores M, Bovarnick A. 2016. Guía para mejorar el presupuesto y el financiamiento de los
sistemas nacionales de áreas protegidas. Lecciones aprendidas en Chile, Guatemala y
Perú. PNUD.
Franks P, Booker F, Roe D. 2018. Understanding and assessing equity in protected area
conservation. International Institute for Environment and Development, London.
Garnett ST et al. 2018. A spatial overview of the global importance of Indigenous lands for

183
conservation. Nature Sustainability 1:369–374.
Gray C, Bilsborrow R. 2020. Stability and change within indigenous land use in the
Ecuadorian Amazon. Global Environmental Change 63:102116.
Hannah L et al. 2020. 30% land conservation and climate action reduces tropical extinction
risk by more than 50%. Ecography 43:943–953.
Jenkins C, Pimm SL, Joppa LN. 2013. Global patterns of terrestrial vertebrate diversity and
conservation. PNAS 110:2602–2610.
Karp DS, Mendenhall CD, Callaway E, Frishkoff LO, Kareiva PM, Ehrlich PR, Daily GC.
2015. Confronting and resolving competing values behind conservation objectives.
Proceedings of the National Academy of Sciences 112:11132–11137.
Knight AT, Cowling RM, Campbell BM. 2006. An Operational Model for Implementing
Conservation Action. Conservation Biology 20:408–419.
Krishna V V, Kubitza C, Pascual U, Qaim M. 2017. Land markets, Property rights, and
Deforestation: Insights from Indonesia. World Development 99:335–349.
Kuempel CD, Chauvenet ALM, Possingham HP, Adams VM. 2020. Evidence-Based
Guidelines for Prioritizing Investments to Meet International Conservation Objectives.
One Earth 2:55–63.
Kukkala AS, Moilanen A. 2013. Core concepts of spatial prioritisation in systematic
conservation planning. Biological Reviews 88:443–464.
Laurance WF et al. 2012. Averting biodiversity collapse in tropical forest protected areas.
Nature 489:290–294.
Linnell JDC, Kaczensky P, Wotschikowsky U, Lescureux N, Boitani L. 2015. Framing the
relationship between people and nature in the context of European conservation.
Conservation Biology 29:978–985.

184
Mace GM. 2014. Whose conservation? Science 345:1558–1560.
Martin A, Coolsaet B, Corbera E, Dawson NM, Fraser JA, Lehmann I, Rodriguez I. 2016.
Justice and conservation: The need to incorporate recognition. Biological Conservation
197:254–261.
Maxwell SL, Cazalis V, Dudley N, Hoffmann M, Rodrigues ASL, Stolton S, Visconti P,
Woodley S, Kingston N, Lewis E, Maron M, Strassburg BBN, Wenger A, Jonas HD,
Venter O, Watson JEM. 2020. Area-based conservation in the twenty-first century.
Nature 586:217–227.
Mehrabi Z, Ellis EC, Ramankutty N. 2018. The challenge of feeding the world while
conserving half the planet. Nature Sustainability 1:409–412.
Minority Rights Group, Survival International, Rainforest Foundation UK. 2020. NGO
concerns over the proposed 30% target for protected areas and absence of safeguards for
Indigenous Peoples and local communities.
Moon K, Marsh D, Cvitanovic C. 2021. Coupling property rights with responsibilities to
improve conservation outcomes across land and seascapes. Conservation Letters
14:e12767.
Nagendra H, Ostrom E. 2012. Polycentric governance of multifunctional forested
landscapes. International Journal of the Commons 6:104–133. International Journal of
the Commons.
Naidoo R, Gerkey D, Hole D, Pfaff A, Ellis AM, Golden CD, Herrera D, Johnson K,
Mulligan M, Ricketts TH, Fisher B. 2019. Evaluating the impacts of protected areas on
human well-being across the developing world. Science Advances 5:eaav3006.
Neugarten RA et al. 2020. Trends in protected area representation of biodiversity and
ecosystem services in five tropical countries. Ecosystem Services 42:101078.

185
Oldekop JA, Holmes G, Harris WE, Evans KL. 2016. A global assessment of the social and
conservation outcomes of protected areas. Conservation Biology 30:133–141.
Pascual U, Adams WM, Díaz S, Lele S, Mace GM, Turnhout E. 2021. Biodiversity and the
challenge of pluralism. Nature Sustainability.
Pimm SL, Jenkins CN, Li B V. 2018. How to protect half of Earth to ensure it protects
sufficient biodiversity. Science Advances 4:eaat2616.
Pringle RM. 2017. Upgrading protected areas to conserve wild biodiversity. Nature
546:91–99.
Rodrigues ASL et al. 2004. Effectiveness of the global protected area network in
representing species diversity. Nature 428:640–643.
Rodrigues ASL, Gaston KJ. 2001. How large do reserve networks need to be? Ecology
Letters 4:602–609.
RRI. 2020. Rights-Based Conservation: The path to preserving Earth’s biological and
cultural diversity? Washington, DC.
Schleicher J, Zaehringer JG, Fastré C, Vira B, Visconti P, Sandbrook C. 2019. Protecting
half of the planet could directly affect over one billion people. Nature Sustainability
2:1094–1096.
Stolton S, Dudley N. 2010. Arguments for Protected Areas. Multiple Benefits for
Conservation and Use. Earthscan, London.
Tallis H et al. 2014. Working together: A call for inclusive conservation. Nature 515:27–
28.
Tauli-Corpuz V, Alcorn J, Molnar A, Healy C, Barrow E. 2020. Cornered by PAs:
Adopting rights-based approaches to enable cost-effective conservation and climate
action. World Development 130:104923.

186
UN. 2020. Decade of Action. Ten Years to transform our world. Available from
https://www.un.org/sustainabledevelopment/decade-of-action/ (accessed April 15,
2021).
Venter O, Magrach A, Outram N, Klein CJ, Possingham HP, Di Marco M, Watson JEM.
2018. Bias in protected-area location and its effects on long-term aspirations of
biodiversity conventions. Conservation Biology 32:127–134.
Visconti P, Butchart SHM, Brooks TM, Langhammer PF, Marnewick D, Vergara S,
Yanosky A, Watson JEM. 2019. Protected area targets post-2020. Science 364:239–241.
Watson JEM, Darling ES, Venter O, Maron M, Walston J, Possingham HP, Dudley N,
Hockings M, Barnes M, Brooks TM. 2016. Bolder science needed now for protected
areas. Conservation Biology 30:243–248.
Wilson EO. 2016. Half-earth: our planet’s fight for life. Liveright Publishing Corporation,
New York and London.
Zafra-Calvo N, Garmendia E, Pascual U, Palomo I, Gross-Camp N, Brockington D, Cortes-
Vazquez J-A, Coolsaet B, Burgess ND. 2019. Progress toward Equitably Managed
Protected Areas in Aichi Target 11: A Global Survey. BioScience 69:191–197.

187
Appendices – Chapter 1
1. Protected area dataset
We gathered spatial information on the limits of the protected areas (PAs) of Latin
American systems and Ecuador that were evaluated by Bovarnick et al. (2010) and Galindo
et al. (2005), respectively (Tables S1 and S2). For the analysis across Latin America, we
excluded Venezuela, the Guyanas, Haiti, and Belize due to lack of financial data, and
Uruguay due to its reduced native forest cover within PAs already at the beginning of the
study period. When possible, PA limits for each country were obtained from national PA
national agencies. Otherwise, we used the Protected Planet Database (IUCN & UNEP-
WCMC 2015). For some countries, we were able to analyze a higher representation of the
PA systems that were assessed in the financial study (e.g., 100% of the PAs of Bolivia were
included) than for others (e.g., 42% of the PAs of Peru). This is due to the different
availability of spatial data on PAs in each country, and because some systems encompass
many PAs without forest cover (e.g., savannas, arid ecosystems, etc.), which are beyond
our objective. In general, financial estimates applied to those systems managed directly by
the central government and depending on data availability, some countries could include
PAs with other governance types (e.g., private, or federal PAs).

188
Table 1. Dataset on the PA systems of Latin American countries analyzed in this study.
Country Spatial data source *
PAs included in the analysis
(i.e., those evaluated in the
financial studies, with forest
cover, and available spatial
data)
Funding
deficit of the
PA system
(%)
Avoided
deforestation
(%)
Number
Percentage
of the entire
PA system
Argentina National agency 30 81 21 0.7585
Bolivia National agency 22 100 5 0.7483
Brazil National agency 175 62 56 0.8210
Chile National agency 92 55 49 0.7888
Colombia National agency 44 83 20 0.5448
Costa Rica WDPA 119 73 7 0.6989
Cuba WDPA 47 48 33 0.5462
Dominican Republic WDPA 39 49 54 0.4168
Ecuador National agency 25 64 41 0.5761
El Salvador WDPA 59 53 14 0.4665
Guatemala WDPA 74 100 48 0.5423
Honduras WDPA 66 71 38 -0.0796
Mexico National agency 124 80 33 0.7177
Nicaragua WPDA 69 57 73 0.1305
Panama WDPA 39 46 52 0.6722
Paraguay WDPA 27 52 87 0.7836
Peru National agency 29 42 48 0.7437
* World Database on Protected Areas https://www.protectedplanet.net/

189
Table 2. Dataset on the PAs of Ecuador analyzed in detail in this study.
Protected area Forest cover (%) Funding
deficits (%)
Avoided
deforestation (%)
Antisana Ecological Reserve 42 77 0.804
Arenillas Ecological Reserve 27 89 0.964
Cajas National Park 11 33 0.681
Cayambe Coca National Park 52 59 0.669
Chimborazo Wildlife Reserve 15 54 0.801
Cofan Bermejo Ecological Reserve 81 80 0.880
Cotacachi Cayapas Ecological Reserve 59 67 0.929
Cotopaxi National Park 7 59 0.878
Cuyabeno Wildlife Reserve 75 79 0.503
El Angel Ecological Reserve 10 77 -1.755
El Condor Biological Reserve 100 100 0.971
La Chiquita Wildlife Refuge 104 99 -1.621
Limoncocha Biological Reserve 73 64 0.891
Llanganates National Park 37 66 0.871
Los Ilinizas Ecological Reserve 72 88 -0.820
Machalilla National Park 57 63 0.859
Mache Chindul Ecological Reserve 98 77 -0.143
Manglares Cayapas Mataje Ecological Reserve 27 72 0.809
Manglares Churute Ecological Reserve 44 57 0.817
Manglares el Salado Wildlife Reserve 33 99 0.995
Parque Lago National Recreation Area 42 100 -0.598
Pasochoa Wildlife Refuge 82 45 0.864
Podocarpus National Park 60 64 0.904
Pululahua Geological Reserve 83 67 0.855
Sangay National Park 40 61 0.683
Sumaco Napo-Galeras National Park 75 59 0.759
Yasuni National Park 79 75 0.879

190
2. Limitations of forest loss data from Global Watch Forest
Tree cover data set from Global Watch Forest (GWF) represents the most comprehensive
globally and regionally available spatial information on forest loss. Thus, GWF data have
been used by other studies to assess the effectiveness of PAs at preserving forests (Heino et
al. 2015; Bowker et al. 2017; Potapov et al. 2017; Leberger et al. 2020). However, GWF
data present important limitations to be discussed. Tree cover loss estimates from GWF
have been criticized for inaccuracies in distinguishing vegetation types at the local scale
(Tropek et al. 2014), such as plantations. This limitation could lead to considering losses in
plantations as deforestation of natural forests, when in fact reflects the harvest of products
grown explicitly for human extraction. To reduce this source of error for the analysis of PA
impact within Ecuador, we excluded from the analysis all plantations by 2000 (Socio
Bosque 2012). In the case of other Latin American countries, analyses have shown that the
majority of tree cover loss (~90%) detected in Brazil, Peru, and Colombia for 2013-2014
was likely loss of natural forests (Petersen et al. 2016).
Global error rates of GWF at classifying tree cover data in forest loss are relatively low
compared to similar data sets (Hansen et al. 2013). Thus, there is high confidence in using
the data to examine trends and patterns at large scales (e.g., global, regional, national)
(Weisse & Petersen 2015). Moreover, some studies have found that GWF performed almost
as well as the more resource-demanding, locally calibrated data (Burivalova et al. 2015).
For example, in Brazil, GWF more accurately detects forest loss than the coarser-resolution
FORMA or Brazil’s national-level PRODES product (Milodowski et al. 2017). However,
GWF usually underestimates the rate of loss for losses driven by small-scale disturbances
(Milodowski et al. 2017). Similarly, in the case of Ecuador, we found that GWF reports
lower deforestation rates (39,000 Ha per year) than the national data (77,000 Ha per year)
(Socio Bosque 2012), during 2000-2008. Still, we detected a strong and positive correlation
(Pearson coefficient r: 0.71, p < 0.0001) between the extent of forest cover loss in PAs of
both data set for this period. It is important to emphasize that national estimates for Ecuador
also used GWF information to eliminate areas without information due to clouds.

191
3. Matching analysis
Comparison of matching methods
We assessed our data using Coarsened Exact Matching (CEM) and Propensity Score
Matching (PSM). Comparing the two matching methods showed that PSM performed
better than CEM in terms of successfully matching more treatment sites within Ecuador
(73% vs 10% out of 81 733 treatment sites) and in maintaining the properties of the original
treatment sites (Table 3). In other words, for all covariates, post-matching treatments were
closer to pre-matched with PSM than CEM. For instance, in the case of CEM, most of the
treatment sites from Andean PAs (those at high elevations) were not matched. We obtained
similar results when analyzing other Latin American countries, such as El Salvador (Table
4).
Table 3. Performance comparison between PSM and CEM for the analysis of PAs within
Ecuador. Green colors indicate which of PSM and CEM best matched the original
characteristics of PAs.
Treatment Control Absolut difference
(matched and pre-
matching treatment
sites)
Variables Pre
matching
CEM PSM Pre
matching
CEM PSM CEM PSM
Distance 0.52 0.28 0.43 0.13 0.27 0.38 0.245 0.094
Elevation 1442.61 587.29 1260.59 914.78 607.10 1279.19 855.320 182.024
Travel time 1415.96 1217.58 1272.06 520.51 1205.84 1161.67 198.384 143.898
Human footprint 2.12 1.49 2.37 6.48 1.70 2.62 0.625 0.251
Initial tree cover 0.42 0.44 0.42 0.37 0.44 0.41 0.016 0.004
Rain 189.69 236.00 197.66 172.16 236.97 196.04 46.307 7.962
Distance to
towns 11.21 7.95 9.92 4.11 7.86 8.83 3.258 1.286
Distance to
urban areas 55.19 90.31 57.76 38.35 90.33 58.66 35.118 2.567
Slope 3.25 0.83 2.95 2.62 0.85 2.94 2.427 0.303
Ecoregions 31.53 39.32 33.35 37.28 39.32 33.35 7.790 1.826

192
Table 4. Performance comparison between PSM and CEM for the analysis of PA system of
El Salvador. Green colors indicate which of PSM and CEM best matched the original
characteristics of PAs.
Treatment Control Absolut difference
(matched and pre-
matching treatment
sites)
Variables Pre
matching
CEM PSM Pre
matching
CEM PSM CEM PSM
Distance 0.131 0.050 0.067 0.029 0.042 0.066 0.081 0.064
Initial tree cover 0.579 0.556 0.567 0.399 0.546 0.555 0.023 0.012
Travel time 111.831 84.333 104.983 88.309 85.957 111.961 27.498 6.848
Elevation 374.907 487.889 576.139 455.220 511.790 516.788 112.982 201.233
Human footprint 13.285 13.043 12.929 14.884 13.018 13.634 0.241 0.356
Rain 156.254 99.158 156.169 152.725 103.077 155.662 57.096 0.085
Human population
density
44.153 4.548 47.245 417.723 4.592 99.345 39.605 3.092
Opportunity costs
for agriculture
149.483 158.049 117.913 142.592 158.406 139.831 8.567 31.569
Slope 3.715 48.444 5.560 3.750 62.957 4.568 44.730 1.845

193
Selection of control sites
To account for potential effects of local leakage, we excluded a 5 km buffer around PAs to
be selected as control sites (Schleicher et al. 2017). For the analysis of PA impact within
Ecuador, we also excluded as possible control sites all PAs established after 2003 and other
types of forest governance regimes, such as Protected Forests or lands under the payment
for ecosystem services (Socio Bosque program) (data from Sistema Nacional de
Información 2015). Although indigenous lands may have a strong influence on forest
protection, we did not exclude them as potential control sites because they occupy a large
proportion of the national territory.
For the analysis across Latin American countries, we excluded as control sites any
state, private, regional, and municipal PAs established after 2000. Nevertheless, the region
has a great diversity of other governance regimes not consistent across all countries (e.g.,
military bases in Brazil, Reserved Zones in Peru). Moreover, spatial information on
indigenous lands is not homogenous or available for all countries. Thus, control sites
throughout the region were unavoidably composed of different forms of governance and
varying legal restrictions on natural resource extraction, which can influence deforestation
rates (Schleicher et al. 2017). Therefore, future impact assessments would benefit from
standardized regional data on such governance types and the level of protection they offer.

194
Covariates
Table 5. Set of covariates used for the matching analysis. The level of analysis refers to the
two different matching analysis carried out in this study: for the PAs across Latin American
countries and for PAs within Ecuador. For each scale of analysis, we used a different set
based on data availability. Layers of these covariates were resampled at 1 km2 and 0.5625
km2 of resolution for each analysis, respectively. Covariates were also selected following
the literature (Nolte et al. 2013; Carranza et al. 2014; Schleicher et al. 2017; Potapov et al.
2017; Cuenca et al. 2018).
Type of
variable
Variables Level of
analysis
Description
Accessibility Travel time to major
cities (h)
PA system The time needed to travel from the nearest
city to a given point, through the network
of roads and rivers. Data from Nelson
(2008).
PA
Distance to the nearest
town (km)
PA Euclidian distance to the nearest town,
sourced from Instituto Geográfico Militar
del Ecuador (2014)
Distance to the nearest
urban area (km)
PA Euclidian distance to the nearest urban
area, sourced from Instituto Geográfico
Militar del Ecuador (2014)
Agricultural
suitability
Opportunity cost for
agriculture (USD/ha,
year)
PA system Potential economic benefits from
agricultural lands. Data from Naidoo &
Iwamura (2007).
Rain (mm) PA system Mean annual precipitation data were
obtained from the WorldClim Global
Climate data (~1950-2000) provided at 30
arc-seconds. Data from Hijmans et al.
(2005).
PA
Human
pressure
Human population
density (per km2)
PA system Global population data from Bright et al.
(2011).
Human footprint
(index)
PA system Describe levels of human impact and
resource use on Earth by 1993. Data from
Venter et al. (2016). PA
Topography Elevation (m) PA system Elevation was based on the Shuttle Radar
Topographic Mission (SRTM) 90m digital
elevation. Data from Jarvis et al. (2006). PA
Slope (º) PA system Derived from an elevation model at 90m
resolution. PA
Biophysics Initial forest cover
(km2)
PA system Extent of forest cover in each pixel by
2000 in the case of Latin America, and by
2003 in the case of Ecuador. Data from
Hansen et al. (2013).
PA

195
Checking balance for the analysis in Ecuador
After matching, we assessed the resulting balance between the control and treatment sites
across all covariates. For the analysis in Ecuador, all covariates had a standardized
difference in mean below 0.25 (Schleicher et al. 2017), which indicates that covariate
distributions are relatively close in the two groups (Table 6).
Table 6. Covariate balance after matching data for PAs within Ecuador, using an exact
match by ecoregions. Covariates Means
Treatment
Means
Control
SD
Control
Std. Mean
Difference
eCDF
Med
eCDF
Mean
eCDF
Max
PSM distance 0.4268 0.383 0.24 0.1598 0.0427 0.0513 0.1014
Elevation 1260.588 1279.193 1296.27 -0.0133 0.0072 0.0124 0.1895
Travel time 1272.061 1161.667 692.86 0.1424 0.0317 0.0316 0.0708
Human footprint 2.3679 2.6158 3.23 -0.0927 0.022 0.0228 0.0477
Initial tree cover 0.4244 0.4148 0.138 0.07 0.0372 0.0354 0.3241
Rain 197.6562 196.0375 102.172 0.0203 0.0662 0.0762 0.1781
Distance to towns 9.9212 8.8307 7.46 0.1517 0.0051 0.0152 0.1418
Distance to urban
areas
57.7581 58.6618 46.362 -0.0229 0.0224 0.0255 0.0569
Slope 2.9502 2.9383 4.139 0.0028 0.0082 0.0102 0.1347
Ecoregions 33.3541 33.3541 16.53 0 0 0 0
The presence of indigenous lands can influence deforestation rates. However, a
matching analysis using an exact match by ecoregions and indigenous lands,
simultaneously, resulted in a low percentage of successfully matched treatment sites.
Therefore, in an additional analysis for Ecuador, we used an exact match by the presence or
absence of indigenous lands, instead of an exact match by ecoregion. This analysis
performed well in terms of the balance of covariates (Table 7), but it was slightly inferior in
maintaining the properties of the original treatment sites (Table 8). Thus, we based our
main results on the analysis using an exact match by ecoregions. Then, we compared these
results with those from an exact match by indigenous lands (see 5.3. Testing the sensitivity
of model selection).

196
Table 7. Covariate balance after matching data for PAs within Ecuador, using an exact
match by the presence of indigenous lands. Variables Means
Treatment
Means
Control
SD
Control
Std. Mean
Difference
eCDF
Med
eCDF
Mean
eCDF
Max
PSM Distance 0.42 0.38 0.25 0.13 0.04 0.04 0.07
Elevation 1278.34 1371.87 1248.25 -0.07 0.03 0.04 0.24
Travel time 1252.25 1127.65 719.94 0.16 0.03 0.04 0.08
Human footprint 2.47 2.84 3.09 -0.14 0.04 0.05 0.10
Initial tree cover 0.42 0.42 0.13 0.00 0.02 0.04 0.31
Rain 195.28 186.47 99.90 0.11 0.09 0.08 0.15
Distance to
towns
9.79 8.37 7.62 0.20 0.01 0.02 0.17
Distance to
urban areas
58.64 52.94 43.11 0.14 0.04 0.04 0.09
Slope 2.98 3.45 4.35 -0.11 0.04 0.04 0.14
Indigenous lands 0.50 0.50 0.50 0.00 0.00 0.00 0.00
Table 8. Performance comparison between the matching analysis using an exact match by
the presence of indigenous lands (IL) and by ecoregions of Ecuador. Green colors indicate
which analysis best matched the original characteristics of PAs.
Treatment Control
Absolut difference
(matched treat and pre-
matching treat)
Pre
matching
Match
by IL
Match by
ecoregions
Pre
matching
Match
by IL
Match by
ecoregions
Match
by IL
Match by
ecoregions
Distance 0.52 0.42 0.43 0.13 0.38 0.38 0.10 0.09
Elevation 1442.61 1278.34 1260.59 914.78 1371.87 1279.19 164.27 182.02
Travel
time 1415.96 1252.25 1272.06 520.51 1127.65 1161.67 163.71 143.90
Human
footprint 2.12 2.47 2.37 6.48 2.84 2.62 0.35 0.25
Tree cover 0.42 0.42 0.42 0.37 0.42 0.41 0.001 0.004
Rain 189.69 195.28 197.66 172.16 186.47 196.04 5.58 7.96
Distance to
towns 11.21 9.79 9.92 4.11 8.37 8.83 1.42 1.29
Distance to
urban areas 55.19 58.64 57.76 38.35 52.94 58.66 3.45 2.57
Slope 3.25 2.98 2.95 2.62 3.45 2.94 0.28 0.30

197
Checking balance for the analysis in Latin American countries
Matching analysis was carried out separately by each country, using the same nine
covariates (Table 3). This approach allows us to compare the impact of the PA systems
across all countries while controlling for the same bias of PA location and effect of the
treatment. However, four countries showed covariates with a standardized mean difference
above the recommended 0.25 (Table 9), which means that in these cases, treatment sites
were matched to control sites with important differences in the covariates. Thus, we ran a
second type of matching analysis in which we chose the covariates that maximized the
number of covariates with standardized differences in mean below 0.25 (Schleicher et al.
2017) (Table 9). As a result, three out of four countries showed an increase in the impact of
their PA systems. Thus, we compared model selection results from both analyses (see 5.3.
Testing the sensitivity of model selection).
Table 9. Comparison of the balance after matching data under two different approaches of
covariate selection across Latin American PA systems.
Country
Matching using the same covariates for
all countries (nine covariates)
Matching using different sets of
covariates, with standardized difference
lower than 0.25
Covariates with a
standardized
difference higher than
0.25
Avoided
deforestation % Covariates excluded
Avoided
deforestation %
Argentina Initial tree cover, rain 75.8
Initial tree cover,
rain, elevation 82.4
Bolivia 0 74.8 74.8
Brazil 0 82.1 82.1
Chile 0 78.8 78.8
Colombia 0 54.5 54.5
Costa Rica 0 69.9 69.9
Cuba Population density 54.6 Population density 56.7
Dominican Republic Population density 41.7 Population density 37.7
Ecuador 0 57.6 57.6
El Salvador 0 46.6 46.6
Guatemala Initial tree cover 54.2 Rain, slope 61.6
Honduras 0 -7.9 -7.9
Mexico 0 71.8 71.8
Nicaragua 0 13 13
Panama 0 67.2 67.2
Paraguay 0 78.4 78.4
Peru 0 74.4 74.4

198
Matching success of treatment sites
The percentage of treatment sites that were successfully matched to control sites
varied among countries (Fig. 1) and among PAs within Ecuador (Fig. 2). This result means
that countries such as Paraguay and Peru (100% of treatment sites with a match) had a
better representation of their PAs in the assessment of impact than Honduras, Guatemala, or
Costa Rica (with ~ 50% of treatment sites with a match). For these last countries, we
explored the characteristics of not matched treatment sites. We found that, overall, they
belong to PAs with low human pressures. For example, these sites exhibited higher
inaccessibility (measured as travel time to cities) than matched sites (Fig. 3). The low
availability of proper controls for these PA sites in these countries might be due to the
absence of remote areas in the unprotected landscape, or because these PAs protect
remnants of forests that already disappeared outside PAs. Similarly, PAs in the Andean
mountain range of Ecuador had the lowest percentages of matched treatment sites (e.g.,
Cotopaxi and Llanganates National Parks). Probably, these PAs harbor remnants of Andean
forests, which in Ecuador have been exploited by humans for centuries.
The bias of successfully matching towards treatments with high accessibility might
have underestimated the impact of the PA systems, especially for Guatemala or Costa Rica,
whose treatment sites without a match show lower deforestation rates than the matched
ones (Fig. 4). To test the influence of this bias in our results, we included the percentage of
successfully matched sites as a potential explanatory variable of the impact in additional
models (see 5.3. Testing the sensitivity of model selection).

199
Figure 1. Matching success of treatment sites of the PA system of each
country in Latin America.
Figure 2. Matching success of treatment sites of PAs within Ecuador.

200
Figure 3. Comparison of the average travel to time to cities among (1) all treatment sites,
(2) treatment sites without a match and (3) treatment sites with a match, for Costa Rica,
Guatemala, and Honduras.
Figure 4. Comparison of total deforestation rates (%) (2000-2010) cities among (1) all
treatment sites, (2) treatment sites without a match and (3) treatment sites with a match, for
Costa Rica, Guatemala, and Honduras.

201
4. Explanatory variables
Table 10. Description of the explanatory variables tested in the models of PA impact. The
level of analysis refers to the different modeling carried out in this study: across Latin
American PA systems, and for PAs within Ecuador. The expected direction of the
relationship between the variable and avoided deforestation is indicated as positive (+),
negative (-), or both.
Variable Scale of
analysis
Description and source Importance for the PA
impact at avoiding
deforestation
Expected
relationship
Socio-economic variables and governance
Gross Domestic
Product (GDP) at
purchasing power
parity (USD) of
countries
PA
system
Average from 2000-2010. Data from The
World Bank.
GDP improves
conservation capacity to
respond to increased
pressure, but it could also
be associated with higher
pressures on the
environment (Balmford et
al. 2003; Barnes et al.
2016)
+ or -
GDP growth (%) of countries
PA
system
From 2000 to 2010. Data from The World
Bank.
Human
Development
index of
countries
HDI (0-1)
PA
system
Average from 2000 to 2010. HDI
measures income, health, and education.
Data from the United Nations
Development Program
(http://hdr.undp.org).
More developed
nations might have more
money and capacity
available for PAs (Barnes
et al. 2016; Geldmann et al.
2019).
+
Percentage of
rural population
(%) of countries
PA
system
Average from 2000 to 2010, for each
country. Data from The World Bank.
Some studies have found
that rural population is not
associated with forest loss
(DeFries et al. 2010), while
others suggest that
depopulating rural
landscapes will reduce
pressures on forests
(Wright & Muller-Landau
2006).
+ or -
Corruption index
perception
(0−10) of
countries
PA
system
For 2010. Perceived levels of public sector
corruption. High values associated with
low corruption perceptions. Data from
Transparency International
(http://www.transparency.org/).
High levels of corruptions,
week democracies and
absence of the rule of law
are associated with
deficiencies in
management, funding,
transparent administration,
and enforcement of PAs
(Heino et al. 2015; Abman
2018).
-
Polity index (-10
− 10) of countries
PA
system
For 2010. Low polity index corresponds
with low democracy. Data from Marshall
& Gurr (2014).
+
Rule of law ( -2.5
− 2.5) of
countries
PA
system
For 2010. Perceptions of the confidence in
the rules of society, contract enforcement,
property rights, the police, the courts. Data
from The Worldwide Governance
Indicators project
(https://info.worldbank.org).
+
Poverty index of
the municipality
(0-1)
PA Data from SENPLADES (2007). While in some cases, land
areas with high poverty
appear to be cleared more
rapidly (Kerr et al. 2004),
there is yet no consensus
regarding the link between
both aspects.
+ or -

202
Direct and indirect human pressure on forest
Human
population
density (per km2)
PA
system
Average from 2000 to 2010, for each
country. Data from The World Bank. Large human population
and growth are likely to
increase pressure on forests
(Jha & Bawa 2006; Wright
& Muller-Landau 2006).
-
PA Average human population density in
buffer zones (10 km) of PAs. Population
data from SENPLADES (2007).
Human
population
density growth
(%)
PA
system
From 2000 to 2010, for each country. Data
from The World Bank.
-
Population
growth (%)
PA
system
Average from 2000 to 2010, for each
country. Data from The World Bank.
-
Percentage of
agricultural land
(%)
PA
system
Average from 2000 to 2010, for each
country. Data from The World Bank.
Globally assessment
showed forest loss having a
strong connection with
agricultural land extent
(Heino et al. 2015).
-
Travel time to
cities (h)
PA
system
Average estimates of the PAs. The time
needed to travel from the nearest city to a
given point, through the network of roads
and rivers. Data from Nelson (2008).
Remote areas are less likely
to suffer a stronger human
pressure on forests (Bruner
et al. 2004).
+
PA
Opportunity cost
for agriculture of
the PAs (USD
per Ha, year)
PA
system
Average estimates of the PAs. Economic
benefits from agricultural lands. Data from
Naidoo & Iwamura (2007).
High opportunity costs
indicate major incentives to
agricultural expansion
towards these PAs.
-
PA
Slope (º) PA Average estimates of the PAs. Derived
from an elevation model at 90m
resolution. Data from (Jarvis et al. 2006).
Protected areas with greater
average slope may be more
complex to access,
decreasing the threats and
the costs of surveillance
(Joppa & Pfaff 2009).
+
Elevation (m) PA Average elevation of each PA.
PAs at higher elevations
tend to be further from
areas of high human
population densities and are
often less agriculturally
suitable (Joppa & Pfaff
2009).
+
Protected area
perimeter under
pressure (%)
PA Percentage of the PA perimeter under
zones with high human footprint index
(top quintile of the country). Data from
Venter et al. (2016).
This indicator is considered
by the Ecuadorian
government to evaluate the
human pressure on PAs
(Galindo et al. 2005).
-
PA design and management
PA size (km2) PA
system
Average size of forested PAs that were
included in the analysis.
Large PAs are associated
with lower pressures
towards their core (Cantú-
Salazar & Gaston 2010).
The management costs per
unit area of larger PAs are
usually lower than for small
PAs.
+
PA Total size of each PA.
Perimeter-area
ratio
PA PA perimeter in km divided by PA area in
km2.
PAs with boundaries are
more prone to edge effects
(Barnes et al. 2016)
-
Funding deficits
for management
(%)
PA
system
Data from Bovarnick et al. (2010) Without adequate funds,
PAs cannot conserve
biodiversity or provide
healthy functioning
ecosystems (Bovarnick et
-
PA Data from Galindo et al. (2005)

203
al. 2010)
Type of
management
(0/1)
PA 0: Strict PAs (I-II), and 1: PAs that allow
use (III-VI), according to IUCN
categories.
PAs that allow use may
experience more pressure
on their forests. However,
studies have shown mixed
results for the impact of
PAs when comparing strict
vs multi-use reserves
(Nelson & Chomitz 2011;
Nolte et al. 2013).
0: +
1: -
Years since
establishment
PA Since the PA official declaration. Newer PAs may require
more efforts (e.g., funding,
monitoring) to consolidate
their effectiveness (Barnes
et al. 2016).
+
Overlap of PAs
with indigenous
lands (0: no; 1:
yes)
PA Data from Minister of Environment of
Ecuador (http://suia.ambiente.gob.ec/) and
Kingman (2007)
Some lands managed by
indigenous people have
proved to be effective in
preserving forests (e.g., at
avoiding forest fires).
0: -
1: +
Management
plan by 2007 (0:
no, 1: yes)
PA According to Kingman (2007) PA management plans act
as the foundation for all
cost estimates and key
activities required to
achieve management
objectives (Bovarnick et al.
2010).
0: -
1: +

204
5. Model selection
Sub-optimal models
Table 11. Summary output for the three most parsimonious set of models for explaining the
impact (a) of PAs within Ecuador, (b) of PA systems among Latin American countries,
funding deficits of (c) PAs within Ecuador, and (d) of PA systems of Latin America. 2nd
order polynomials are indicated by superscript. These tables present the modeling results
for the variable of impact transformed as “permitted deforestation” (i.e., one minus impact).
Thus, a variable with positive estimate indicates an increase in PA ineffectiveness.
Significance of regression coefficients: *** p < 0.001, ** p < 0.01, * p < 0.05
(a) “Permitted” deforestation (1-impact) among the PAs within Ecuador
Model
rank
Standardized coefficients of selected variables
AICc ΔAICc Weight Funding
deficits
Overlap with
indigenous lands
Perimeter
under pressure
Opportunity
costs for
agriculture
1 0.028 * 1.042 * 0.018 * 11.74 0 0.366
2 0.028 * 0.014 * 11.98 0.236 0.325
3 0.025 * 0.781 0.015 * 12.08 0.337 0.309
(b) “Permitted” deforestation (1- impact) among the national PA systems in Latin America
Model
rank
Standardized coefficients of selected variables
AICc ΔAICc Weight HDI
Average
PA size
Opportunity costs for
agriculture
1 -5.295 *** -0.00001* -13.41 0 0.485
2 -5.444 ** -12.31 1.108 0.279
3 -5.220 ** 0.003 -11.97 1.445 0.236
(c) Funding deficits (proportion) among the PAs within Ecuador
Model
rank
Standardized coefficients of selected variables AICc ΔAICc Weight
Management
plan Slope Elevation Years
phi
1 -1.291 *** -0.044
**
13.26
*** -36.818 0 0.457
2 -1.230 *** -0.0002 ** 13.06
*** -36.243 0.575 0.343
3 -0.953 ** -0.0002 ** -0.018 14.07
*** -35.161 1.656 0.2

205
(d) Funding deficits (proportion) among the national PA systems in Latin America
Model
rank
Standardized coefficients of selected variables
AICc ΔAICc Weight Deforestation
rate in
control sites
Deforestation
rate in
control sites 2
GDP
growth Corruption
phi
1 2.453 ** -1.539 * 0.008
*
7.37
** -0.216 0 0.448
2 1.888 * -0.945 5.58
** 0.284 0.5 0.349
3 -0.193 4.2 ** 1.377 1.592 0.202

206
Scatter plots between response and explanatory variables
Figure 5. Plots of the selected explanatory variables in the most parsimonious model for (a)
the impact of PAs within Ecuador, (b) the impact of national PA systems of Latin American
countries, (c) funding deficits of the PAs within Ecuador and (d) funding deficits of
national PA systems of Latin America.

207
Testing the sensitivity of model selection
We tested the sensitivity of our model selection by running additional models under
different scenarios. Overall, results from additional model selection were consistent with
those reported in our study (Table 12 and Table 13). HDI remains as an important
explanatory variable of avoided deforestation among the PA systems, with similar
parameter estimates.
Table 12. Summary output for the most parsimonious models (AICc) when testing
additional scenarios of modeling for the impact of PAs within Ecuador.
Scenario Response
variable
Description Selected explanatory
variables
Standardize
coefficients
Explained
variance
(a) (1- impact)
of the PAs
within
Ecuador
Impact calculation from a
matching analysis that
used an exact match by
the presence of
indigenous lands (see
Table 7).
Overlap with indigenous
lands (%)
Funding deficits (%)
Opportunity costs for
agriculture ($/ha, year)
-0.564 ***
-0.305 *
-0.401 **
0.59
(b) (1- impact)
of the PAs
within
Ecuador
Inclusion of matched
treatment sites (%) of
each PA as a possible
explanatory variable (see
Fig. 2).
Overlap with indigenous
lands (%)
Funding deficits (%)
Opportunity costs for
agriculture ($/Ha, year)
1.520 **
0.055 *
0.028 ***
0.55

208
Table 13. Summary output for the most parsimonious models (AICc) when testing
additional scenarios for modeling the impact and funding deficits of PA systems in Latin
America. Scenario Response
variable
Description of the model Selected explanatory
variables
Estimates Explained
variance
(a) (1- impact)
of the PA
systems
Inclusion of matched treatment
sites (%) of each PA system as
a possible explanatory variable
(see Fig. 1).
HDI
Matched treatment
sites (%)
-4.68 **
-0.0097 *
0.62
(b) (1- impact)
of the PA
systems
Impact estimate based on the
matching analysis that used a
different set of covariates for
each country (see Table 9).
HDI
Average PA size
-5.295 **
-0.00001*
0.62
(c) (1- impact)
of the PA
systems
Removing Bolivia from input
data since it was identified as a
possible outlier according to
Cook’s distance leverage plots
of the model residuals.
HDI -5.823 *** 0.58
(d) Funding
deficit of the
PA systems
Removing Guatemala from
input data since it was
identified as a possible outlier
according to Cook’s distance
leverage plots of the model
residuals.
Deforestation rates
in control sites (%)
Deforestation rates
in control sites (%) 2
GDP growth (%)
2.94 ***
0.593
0.0061
0.5

209
References
Abman R. 2018. Rule of Law and Avoided Deforestation from Protected Areas. Ecological
Economics 146:282–289.
Balmford A, Gaston KJ, Blyth S, James A, Kapos V. 2003. Global variation in terrestrial
conservation costs, conservation benefits, and unmet conservation needs. PNAS
100:1046–1050.
Barnes MD, Craigie ID, Harrison LB, Geldmann J, Collen B, Whitmee S, Balmford A,
Burgess ND, Brooks T, Hockings M, Woodley S. 2016. Wildlife population trends in
protected areas predicted by national socio-economic metrics and body size. Nature
Communications 7:12747.
Bovarnick A, Baca JF, Galindo J, Negret H. 2010. Financial Sustainability of Protected
Areas in Latin America and the Caribbean: Investment Policy Guidance. United
Nations Development Programme (UNDP) and The Nature Conservancy (TNC).
Bowker JN, De Vos A, Ament JM, Cumming GS. 2017. Effectiveness of Africa’s tropical
protected areas for maintaining forest cover. Conservation Biology 31:559–569.
Bright EA, Coleman PR, Rose AN, Urban ML. 2011. LandScan 2011. Oak Ridge National
Laboratory, Oak Ridge, TN.
Bruner AG, Gullison RE, Balmford A. 2004. Financial Costs and Shortfalls of Managing
and Expanding Protected-Area Systems in Developing Countries. BioScience
54:1119–1126.
Burivalova Z, Bauert MR, Hassold S, Fatroandrianjafinonjasolomiovazo NT, Koh LP.
2015. Relevance of Global Forest Change Data Set to Local Conservation: Case Study
of Forest Degradation in Masoala National Park, Madagascar. Biotropica 47:267–274.
Cantú-Salazar L, Gaston KJ. 2010. Very large protected areas and their contribution to
terrestrial biological conservation. BioScience 60:808–818.
Carranza T, Balmford A, Kapos V, Manica A. 2014. Protected Area Effectiveness in
Reducing Conversion in a Rapidly Vanishing Ecosystem: The Brazilian Cerrado.
Conservation Letters 7:216–223.
Cuenca P, Robalino J, Arriagada R, Echeverría C. 2018. Are government incentives
effective for avoided deforestation in the tropical Andean forest? PLOS ONE
13:e0203545.
DeFries RS, Rudel T, Uriarte M, Hansen M. 2010. Deforestation driven by urban
population growth and agricultural trade in the twenty-first century. Nature
Geoscience 3:178–181.
Galindo J, Calvopiña J, Baus C, Ayllón F, Vela S. 2005. Análisis de necesidad de
financiamiento del Sistema Nacional de Áreas Protegidas (SNAP) del Ecuador.

210
MInisterio del Ambiente del Ecuador, Quito, Ecuador.
Geldmann J, Manica A, Burgess ND, Coad L, Balmford A. 2019. A global-level
assessment of the effectiveness of protected areas at resisting anthropogenic pressures.
Proceedings of the National Academy of Sciences. National Academy of Sciences.
Hansen MC, Potapov P V, Moore R, Hancher M, Turubanova SA, Tyukavina A, Thau D,
Stehman S V, Goetz SJ, Loveland TR, Kommareddy A, Egorov A, Chini L, Justice
CO, Townshend JRG. 2013. High-Resolution Global Maps of 21st-Century Forest
Cover Change. Science 342:850–853.
Heino M, Kummu M, Makkonen M, Mulligan M, Verburg PH, Jalava M, Räsänen TA.
2015. Forest Loss in Protected Areas and Intact Forest Landscapes: A Global
Analysis. PLOS ONE 10:e0138918.
Hijmans RJ, Cameron SE, Parra JL, Jones P, Jarvis A. 2005. Very high resolution
interpolated climate surfaces for global land areas. International Journal of
Climatology 25:1965–1978.
Instituto Geográfico Militar del Ecuador. 2014. Cartografía Temática.
IUCN, UNEP-WCMC. 2015. The World Database on Protected Areas (WDPA). UNEP-
WCMC, Cambridge, UK.
Jarvis A, Reuter HI, Nelson A, Guevara E. 2006. Hole-filled SRTM for the globe Version
4. 90m Database. CGIAR-CSI SRTM.
Jha S, Bawa KS. 2006. Population Growth, Human Development, and Deforestation in
Biodiversity Hotspots. Conservation Biology 20:906–912.
Joppa LN, Pfaff A. 2009. High and Far: Biases in the Location of Protected Areas. PLoS
ONE 4:e8273.
Kerr S, Pfaff A, Cavatassi R, Davis B, Lipper L, Sanchez-Azofeifa GA, Timmins J. 2004.
Effects of Poverty on Deforestation: Distinguishing behaviour from location. Page
ESA Working Paper No. 04-19.
Kingman S. 2007. Áreas Protegidas y Pueblo Indígenas. Un Estudio de Caso en Ecuador.
REdParques. Organización de las Nacionales Unidas para la Agricultura y la
Alimentación.
Leberger R, Rosa IMD, Guerra CA, Wolf F, Pereira HM. 2020. Global patterns of forest
loss across IUCN categories of protected areas. Biological Conservation 241:108299.
Marshall M, Gurr T. 2014. Polity IV Project, Political Regime Characteristics and
Transitions, 1800–2013. Center for Systematic Peace.
Milodowski DT, Mitchard ETA, Williams M. 2017. Forest loss maps from regional
satellite monitoring systematically underestimate deforestation in two rapidly
changing parts of the Amazon. Environmental Research Letters 12:94003.

211
Naidoo R, Iwamura T. 2007. Global-scale mapping of economic benefits from agricultural
lands: Implications for conservation priorities. Biological Conservation 140:40–49.
Nelson A. 2008. Travel time to major cities: A global map of Accessibility. European
Commission and the World Bank.
Nelson A, Chomitz KM. 2011. Effectiveness of Strict vs. Multiple Use Protected Areas in
Reducing Tropical Forest Fires: A Global Analysis Using Matching Methods. PLOS
ONE 6:e22722.
Nolte C, Agrawal A, Silvius KM, Soares-Filho BS. 2013. Governance regime and location
influence avoided deforestation success of protected areas in the Brazilian Amazon.
Proceedings of the National Academy of Sciences 110:4956.
Petersen R, Goldman ED, Harris N, Sargent S, Aksenov D, Manisha A, Esipova E,
Shevade V, Loboda T, Kuksina N, Kurakina I. 2016. Mapping tree plantations with
multispectral imagery: preliminary results for seven tropical countries. Washington,
DC.
Potapov P, Hansen MC, Laestadius L, Turubanova S, Yaroshenko A, Thies C, Smith W,
Zhuravleva I, Komarova A, Minnemeyer S, Esipova E. 2017. The last frontiers of
wilderness: Tracking loss of intact forest landscapes from 2000 to 2013. Science
Advances 3.
Schleicher J, Peres CA, Amano T, Llactayo W, Leader-Williams N. 2017. Conservation
performance of different conservation governance regimes in the Peruvian Amazon.
Scientific Reports 7:11318.
SENPLADES. 2007. II Informe Nacional de los objetivos de desarrollo del milenio,
Ecuador 2007: alianzas para el desarrollo.
Sistema Nacional de Información. 2015. Archivos de Información Geográfica. Secretaria
Técnica Planifica Ecuador. Available from https://sni.gob.ec/coberturas.
Socio Bosque. 2012. Estimación de la Tasa de Deforestación del Ecuador continental.
Ministerio del Ambiente del Ecuador, Quito.
The World Bank. (n.d.). World development indicators. Washington, D.C. : The World
Bank.
Tropek R, Sedláček O rej, Beck J, Keil P, Musilová Z, Š\’\imová I, Storch D. 2014.
Comment on “High-resolution global maps of 21st-century forest cover change.”
Science 344:981. American Association for the Advancement of Science.
Venter O, Sanderson EW, Magrach A, Allan JR, Beher J, Jones KR, Possingham HP,
Laurance WF, Wood P, Fekete BM, Levy MA, Watson JEM. 2016. Sixteen years of
change in the global terrestrial human footprint and implications for biodiversity
conservation. Nature Communications 7:12558.
Weisse M, Petersen R. 2015. How accurate is accurate enough. Examining the GLAD

212
global tree cover change data. Part 2. Global Forest Watch.
Wright SJ, Muller-Landau HC. 2006. The Future of Tropical Forest Species1. Biotropica
38:287–301.

213
Appendices – Chapter 2
1. Extended Methods
Data used for the management-cost models
Table 1. Protected areas of the western Amazon with information on their costs for an
effective management (basic scenario). PN: Parque Nacional, RB: Reserva Biológica, RE:
Reserva Ecológica, RPF: Reserva de Produccion Faunística, BP: Bosque Protector, RC:
Reserva Comunal, RN: Reserva Natural, SH: Santuario Histórico, SN: Santuario Nacional.
Country Protected Area Management cost
(US$/year, km2)
Area (km2)
Colombia PN LA PAYA 7,02 5128,29
Colombia PN PURACÉ 40,56 947,83
Ecuador PN Cayambe Coca 117,00 4.082,85
Ecuador PN Llanganates 75,83 2.211,45
Ecuador PN Podocarpus 259,40 1.384,93
Ecuador PN Sangay 85,48 4.867,29
Ecuador PN Sumaco Napo-Galeras 138,16 2.061,62
Ecuador PN Yasuní 42,49 10.152,13
Ecuador RB El Cóndor 248,38 79,04
Ecuador RB Limoncocha 2.302,31 28,09
Ecuador RE Antisana 364,10 1.205,81
Ecuador RE Cofán Bermejo 377,21 550,26
Ecuador RPF Cuyabeno 46,52 5.852,36
Peru BP Alto Mayo 115,92 1.777,50
Peru BP de Pagaibamba 9.156,47 20,31
Peru BP de San Matias San Carlos 198,40 1.493,24
Peru BP Pui Pui 885,28 545,05
Peru PN Alto Purús 30,43 25.147,75
Peru PN Bahuaja Sonene 23,12 11.020,66
Peru PN Cordillera Azul 71,79 13.531,98
Peru PN Cutervo 1.871,69 82,38
Peru PN del Manu 62,18 16.985,55
Peru PN Güeppí-Sekime 191,90 2.036,29
Peru PN Ichigkat Muja-Cordillera del Cóndor 350,86 885,22
Peru PN Otishi 94,45 3.059,73
Peru PN Río Abiseo 324,17 2.724,08

214
Peru PN Tingo María 3.783,39 47,78
Peru PN Yanachaga-Chemillén 518,14 1.136,14
Peru RC Amarakaeri 202,42 4.038,14
Peru RC Ashaninka 203,17 1.844,67
Peru RC El Sira 63,33 6.164,17
Peru RC Huimeki 206,03 1.412,34
Peru RC Machiguenga 203,17 2.189,06
Peru RC Purus 202,56 2.026,43
Peru RC Tuntanain 804,20 949,87
Peru RC Yanesha 836,84 333,89
Peru RN Allpahuayo Mishana 804,20 580,69
Peru RN Pacaya Samiria 48,68 21.702,47
Peru RN Tambopata 158,58 2.802,35
Peru SH Machupicchu 2.534,39 373,03
Peru SN de Ampay 4.794,42 38,53
Peru SN Megantoni 203,17 2.158,69
Peru SN Pampa Hermosa 4.453,11 115,44
Peru SN Tabaconas Namballe 823,07 322,74
Table 2. Data source of the predictor variables (attributes of protected areas) used in the
modeling of management costs.
Predictor variables Source
Size Shapefiles and database of protected areas were
obtained from national agencies:
Colombia (Parques Nacionales de Colombia 2015),
Ecuador (Instituto Geográfico Militar del Ecuador
2014) and Peru (SERNANP 2015).
Management objective (IUCN
categories)
Years since establishment
Distance to the nearest protected area
Inaccessibility (Nelson 2008)
Human population density (Bright et al. 2012)
Human intervention (Human Footprint) (Sanderson et al. 2002)
Distance to villages
Map of villages:
Ecuador (Instituto Geográfico Militar del Ecuador
2014), Peru (Secretaria de Gobierno Digital 2015),
Colombia (DANE 2015)
Slope Derived from an elevation model (Jarvis et al. 2006)
Presence of indigenous lands (RAISG 2012) and Instituto del Bien Común, Peru
(http://www.ibcperu.org/)
Overlap degree with operative oil blocks
Colombia: (Agencia Nacional de Hidrocarburos 2014)
Ecuador: (Secretaría de Hidrocarburos del Ecuador
2013)
Perú: (Perupetro 2014)

215
Species dataset
We used a set of species as biodiversity surrogates. To achieve maximum representation of
biodiversity, we tried to include the largest possible number of species from several
taxonomic groups (terrestrial vertebrates and plants).
Species occurrences were obtained from specimen databases (GBIF 2014; Vertnet
2014) of the following museums: Missouri Botanical Garden Tropicos Database, American
Museum of Natural History; Academy of Natural Sciences of Drexel University; The
University of Colorado Museum of Natural History; Delaware Museum of Natural History;
Denver Museum of Nature & Science; Museum of Natural History University of Kansas;
Natural History Museum of Los Angeles County; Louisiana State University Museum of
Natural Science; Museum of Comparative Zoology-Harvard University; Michigan State
University Museum; The Museum of Vertebrate Zoology at Berkeley; Oklahoma Museum
of Natural History; Royal Ontario Museum; Santa Barbara Museum of Natural History;
San Diego Natural History Museum, Alabama Museum of Natural History; The University
of Arizona Museum of Natural History; Museum of Zoology, University of Michigan;
Museum of the University of Nebraska State Museum; Smithsonian Institution National
Museum of Natural History; University of Washington Burke Museum of Natural History
and Culture; Yale Peabody Museum of Natural History.
See the list of target species on:
https://ars.els-cdn.com/content/image/1-s2.0-S0006320718316264-mmc2.xlsx
Species distribution models
To construct species distribution models (SDMs), we used Maxent, a machine-learning
algorithm based on the principle of maximum entropy. Maxent is an adequate technique for

216
our goal because it performs adequately when modeling presence-only occurrence data
with low sample sizes, and with moderate errors in their georeferencing (Elith et al. 2006;
Graham et al. 2008). Thus, based on studies about Maxent performance with low sample
sizes (Pearson et al. 2007), only species with five or more data records were modeled,
excluding species with high uncertainty and obvious errors in their locality records.
Moreover, for a better sampling of the species environmental niche, these occurrences were
obtained for the bounding-box delimited by -79.67/ -66.79 decimal degrees of longitude
and 4.99/ -14.52 degrees of latitude, thus incorporating records from a large extent of the
Andean range.
We used 11 of the 19 Worldclim1.4 bioclimatic variables as ecological predictors
(bio 01, bio 02, bio 04, bio 05, bio 06, bio 07, bio 10, bio 11, bio 12, bio 13, bio 16), at a 1
km2 spatial resolution. The other bioclimatic variables we excluded from the modeling
process because they show unlikely climatic patterns over the western Amazon.
Species occurrence records in the western Amazon are biased towards main roads,
large river and urban centers. To reduce the impact of this bias in the modeling, SDMs were
constructed using their presence localities as background data. Thus, these backgrounds
reflect the same sample selection bias as the occurrence data, improving the performance of
the SDMs (Phillips et al. 2009).
SDMs were developed with Maxent 3.3.3e setting the convergence threshold to
10−5, maximum iterations to 500, and the regularization parameter to ‘auto’. We discarded
species’ SDMs that had AUC values below 0.7 (Elith and Leathwick 2007). To reclassify
the 0.0–1.0 suitability map into presence/absence areas, we used the Maximum Training
Sensitivity Plus Specificity threshold, which minimizes the false-positive errors that may

217
identify reserve areas that do not actually contain the target species (Jiménez-Valverde and
Lobo 2007).
Other variables, such as the soil properties, are important predictor of plant species
range in Amazonia. However, and although digital soil data have recently become
available, they have limitations when they are used to infer species edaphic niches, such as
(1) insufficient resolution and thematic accuracy, (2) georeferencing problems, and (3)
absence of relevant variables (Moulatlet et al. 2017).
SDM algorithms generally indicate the geographic region with the appropriate set of
abiotic factors for each species, but there are other factors influencing their distributions,
such as biotic interactions, dispersal abilities or geographical barrier, and biographic history
that are not addressed by the models (Soberón and Peterson 2005). Therefore, to obtain
more accurate approximations of species distributions, we evaluated the species models by
comparing them with species distributions in the literature Thus, when necessary, we
removed areas of over-prediction and discarded models whose distributions were very
different to those reported by other sources (e.g. (IUCN 2014; Ridgely and Greenfield
2007; Tirira 2007).
Using SDMs for systematic conservation planning as important caveats. For
example, SDMs may generate false species absences due to the bias sampling, missing the
opportunity to protect other valuable areas for the biodiversity (Lessmann et al. 2016). Still,
SDMs usually provide more realistic outcomes than species geographic ranges (Carvalho et
al. 2010; Rondinini et al. 2006), especially at fine geographic scales (Pineda and Lobo
2012). For example, in contrast to point maps and geographic ranges, SDMs improve
reliability of species distribution estimates by minimizing both commission (false species
presences) and omission errors (false species absences) in the estimated distributions

218
(Bombi et al. 2011). However, we recommend that any initiative for protecting the
identified priority areas should first conduct proper field validations and rapid biological
inventories.
Species conservation targets
Targets were setted in order to favor the increase of protection for the most vulnerable
species, and to generate achievable solutions in terms of the extent of the priority areas and
resources needed. Specifically, targets were selected through a sensitivity test analysis. We
first tested targets of 100% for restricted-range species and 10% for species with wide
ranges, following Rodrigues et al. (2004). For species with ranges of intermediate
distribution size, the target was interpolated linearly between the target extremes. However,
given the high number of endemic species across the western Amazon, protecting the 100%
of these species involved unachievable goals for many species and require unfeasible large
conservation areas across the region (~ 60 % of the Andean Amazon, for example). Thus,
in order to produce more feasible proposals, small-ranged species received maximal targets
of 50% (for non-threatened species) and 75% (for threatened species). At the same time, we
changed the minimal conservation target from 10% to 5% for species that have wide
ranges.
2. Extended Results
Species representation in current protected areas of the western Amazon
Species richness maps for the western Amazon, which show the number of species by ~1
km2, were generated for all species and insufficiently protected species, by summing all
individual SDMs (Fig 1).

219
Figure 1. Richness of all species evaluated by our study (A), and richness of insufficiently
protected species according to established conservation targets (B).

220
Identification of cost-effective areas
Table 1. Land conservation costs for priority areas in the western Amazon. Annual costs
for an effective management were estimated from the General model, whereas opportunity
costs correspond to adapted profits from agriculture.
Amazon countries Cost for priority conservation areas (US$ millions per year)
Management Opportunity Total
Estimate 95% LCL 95% UCL
Colombia 13.5 9.7 20.3 9.8 23.3
Ecuador 4.5 3.1 6.6 3.7 8.2
Peru 53.4 35.1 81.2 15 68.4
Western Amazon 71.4 47.9 108.1 28.5 99.9
* LCL: Lower Control Limit; UPL: Upper Control Limit (UCL)

221
Figure 2. Spatial overlap between the priority areas selected in the cost-optimized scenario
and in the cost-uniform scenario.

222
Figure. 3. Vulnerability and efficiency of the cost-optimized priority areas. Vulnerability
was measured as the risk of forest loss according to the agriculture expansion and road
projects in the western Amazon (Soares-Filho et al. 2006). All priority areas of high
vulnerability had an average probability of deforestation higher than 0.3 (values ranged
between 0-1). The 60 most efficient priority areas were considered of higher efficiency.
References
Agencia Nacional de Hidrocarburos, 2014. Mapa de Tierras. Ministerio de Energía y
Minas, República de Colombia, Bogotá.
Bombi, P., Luiselli, L., D'Amen, M., 2011. When the method for mapping species matters:
defining priority areas for conservation of African freshwater turtles. Diversity and
Distributions 17, 581-592.

223
Bright, E.A., Coleman, P.R., Rose, A.N., Urban, M.L., 2012. LandScan 2011. Oak Ridge
National Laboratory, Oak Ridge, TN.
Carvalho, S.B., Brito, J.C., Pressey, R.L., Crespo, E., Possingham, H.P., 2010. Simulating
the effects of using different types of species distribution data in reserve selection.
Biological Conservation 143, 426-438.
DANE, 2015. Geoportal - Información Estratégica de Colombia.
Elith, J., Graham, C.H., Anderson, R.P., Dudík, M., Ferrier, S., Guisan, A., Hijmans, R.J.,
Huettmann, F., Leathwick, J., Lehmann, A., Li, J., Lohmann, L.G., Loiselle, B.A.,
Manion, G., Moritz, C., Nakamura, M., Nakazawa, Y., McC. Overton, J., Peterson,
T.A., Phillips, S.J., Richardson, K.S., Scachetti-Pereira, R., Schapire, R.E., Soberón,
J., Williams, S., Wisz, M.S., Zimmermann, N.E., 2006. Novel methods improve
prediction of species’ distributions from occurrence data. Ecography 29, 129-150.
Elith, J., Leathwick, J., 2007. Predicting species distributions from museum and herbarium
records using multiresponse models fitted with multivariate adaptive regression
splines. Diversity and Distributions 13, 265-275.
GBIF, 2014. http://www.gbif.org/.
Graham, C.H., Elith, J., Hijmans, R.J., Guisan, A., Peterson, T.A., Loiselle, B.A., 2008.
The influence of spatial errors in species occurrence data used in distribution models.
Journal of Applied Ecology 45.
Instituto Geográfico Militar del Ecuador, 2014. Cartografía Temática, In
http://www.igm.gob.ec.
IUCN, 2014. IUCN Red List of Threatened Species. Version 2014.3.
Jarvis, A., Reuter, H.I., Nelson, A., Guevara, E., 2006. Hole-filled SRTM for the globe
Version 4. 90m Database. CGIAR-CSI SRTM.

224
Jiménez-Valverde, A., Lobo, J.M., 2007. Threshold criteria for conversion of probability of
species presence to either-or presence-absence. Acta Oecologica 31, 361-369.
Lessmann, J., Fajardo, J., Muñoz, J., Bonaccorso, E., 2016. Large expansion of oil industry
in the Ecuadorian Amazon: biodiversity vulnerability and conservation alternatives.
Ecology and Evolution 6, 4997-5012.
Moulatlet, G.M., Zuquim, G., Figueiredo, F.O.G., Lehtonen, S., Emilio, T., Ruokolainen,
K., Tuomisto, H., 2017. Using digital soil maps to infer edaphic affinities of plant
species in Amazonia: Problems and prospects. Ecology and Evolution 7, 8463-8477.
Nelson, A., 2008. Travel time to major cities: A global map of Accessibility. European
Commission and the World Bank.
Parques Nacionales de Colombia, 2015. Datos Abiertos.
Pearson, R.G., Raxworthy, C.J., Nakamura, M., Peterson, T.A., 2007. Predicting species
distributions from small numbers of occurrence records: a test case using cryptic
geckos in Madagascar. Journal of Biogeography 34, 102-117.
Perupetro, 2014. Mapa de lotes de contratos, cuencas sedimentarias, y áreas protegidas.
Phillips, S.J., Dudík, M., Elith, J., Graham, C.H., Lehmann, A., Leathwick, J., Ferrier, S.,
2009. Sample selection bias and presence-only distribution models: implications for
background and pseudo-absence data. Ecological Applications 19, 181–197.
Pineda, E., Lobo, J.M., 2012. The performance of range maps and species distribution
models representing the geographic variation of species richness at different
resolutions. Global Ecology & Biogeography 21, 935-944.
RAISG, 2012. Amazonía Bajo Presión.
Ridgely, R., Greenfield, P.J., 2007. Aves del Ecuador. Volumen II Guía de Campo.
Fundación Jocotoco, Quito.

225
Rondinini, C., Wilson, K.A., Boitani, L., Grantham, H.S., Possingham, H.P., 2006.
Tradeoffs of different types of species occurrence data for use in systematic
conservation planning. Ecology Letters 9, 1136-1145.
Sanderson, E.W., Jaiteh, M., Levy, M.A., Redford, K.H., Wannebo, A.V., Woolmer, G.,
2002. The Human Footprint and the Last on the Wild. BioScience 52, 891-904.
Secretaria de Gobierno Digital, 2015. GEOIDEP - Portal de Información de Datos
Espaciales del Perú.
Secretaría de Hidrocarburos del Ecuador, 2013. Ronda Suroriente.
SERNANP, 2015. Areas Naturales Protegidas.
Soberón, J., Peterson, T.A., 2005. Interpretation of models of fundamental ecological
niches and specie's distributional areas. Biodiversity Informatics 2, 1-10.
Tirira, D., 2007. Guía de Campo de los mamíferos del Ecuador. Ediciones Murciélago
Blanco, Publicación especial sobre los mamíferos del Ecuador 6, Quito.
Vertnet, 2014. www.vertnet.org/

226
Appendices – Chapter 3
1. List of reviewed studies on conservation planning that include the Andes.
Reference Study area
Cuesta et al. 2009 Montane forests of tropical Andean countries
Galindo et al. 2009 Andes and Amazon foothills of Colombia
Josse et al. 2009 Tropical Andes
Young et al. 2009 Eastern Andean slope of Peru and Bolivia
Londono-Murcia et al. 2010 Andes of Colombia and Ecuador
Londono-Murcia & Sanchez-Cordero 2011 Tropical Andes of Colombia and Ecuador
Pliscoff & Fuentes-Castillo 2011 Chile
Thomassen et al. 2011 Ecuador
Delgado-Jaramillo 2013 Venezuela
Ramirez-Villegas et al. 2012 South America
Swenson et al. 2012 Eastern Andean slopes in Peru and Bolivia
Velasquez-Tibata et al. 2012 Andes and Tumbes-Choco-Magdalena hostspot of
Colombia
Durán et al. 2013 Chile
Mateo et al. 2013 Ecuador
Cadima et al. 2014 Bolivia
Ferretti et al. 2014 Argentina
Godoy-Buerki et al. 2014 Southern Central Andes of Argentina
Lessmann et al. 2014 Ecuador
Ocampo-Penuela & Pimm 2014 Western Andes of Colombia
Avalos & Hernández 2015 Andes of Boliva and Peru
Cuesta et al. 2015 Ecuador
Fajardo et al. 2014 Peru
Lessmann et al. 2019 Eastern Andean slopes and Amazon forests in
Colombia, Ecuador, and Peru
Schutz 2015 Chile
Young et al. 2015 Tropical Andes biodiversity hotspot
Banda-R et al. 2016 Neotropical dry forests
García Márquez et al. 2016 Central Colombia
Asner et al. 2017 Andean Amazon of Peru
Cuesta et al. 2017 Ecuador
Curti et al. 2017 Argentina
Espinel et al. 2017 Eastern Cordillera of Colombia
Martinez-Tilleria et al. 2017 Chile
Reyes-Puig et al. 2017 Ecuador
Martinez-Harms et al. 2018 Chilean biodiversity hotspot
Bax & Francesconi 2019 Tropical Andes
Bennett et al. 2019 Distribution of Andean cats Leopardus jacobita
(High Andes)
Fajardo et al. 2019 Tropical Andean countries
Khoury et al. 2019 Distribution of chile pepper genus (includes the
Andes, except Chile)

227
Marquet et al. 2019 Chile
Ovando et al. 2019 Argentina
Quintana et al. 2019 Ecuadorian Dry Inter-Andean Valleys
SPARC 2019 Countries in the Neotropics and Tropical Andes
Tognelli et al. 2019 Tropical Andes
See details on the reviewed studies in: https://doi.org/10.5281/zenodo.4890967
2. Detailed methods for “Box 2 - Balancing conservation of biodiversity and NCPs in
the Andes”.
Objective
To understand the extent to which Crop Wild Relatives (CWR) in the Andes can benefit
from range-restricted (RR) plant conservation actions and whether CWR protection can be
increased through integrated planning for both groups. This reserve planning was aimed to
increase the surface area under protection from 16% (national protected areas) to 30% of
the Andes. The analysis covered the limits of the Andean mountain range 1 (~ 2.9 million
km2).
Species distribution dataset
We collected available information for the species distribution of RR plants and CWR in
the Andes. For RR plants, we consulted the integrated Botanical Information and Ecology
Network (BIEN) v4.12. BIEN has produced estimated range maps for over 88 000 species
of New World plants, mostly using maximum entropy (MaxEnt) algorithm and climatic
variables. We included species with range sizes below ~500 000 m2, the median value 3 for
all species in BIEN database with at least half of their potential distribution in the Andes.
These criteria resulted in 1726 plant species selected for the prioritization analysis.
In the case of Andean CWR, we used the database of Useful Wild Plants 4, a recent effort
for gathering spatial information on useful plants worldwide. This database provides
geographic ranges of the potential native distribution of CWR (species with recorded uses
in crop breeding or close relatives to cultivated crops). Potential ranges were built with

228
MaxEnt from occurrence data, using climatic and other eco-geographic covariates. We
included all CWR species with potential distribution estimates and at least 10% of their
range within the Andes limits, resulting in 118 species of CWR. This set comprises CWR
of peanut, chile peppers, quinoa, tobacco, beans, potato, golden berry, nuts, among others.
Only nine of these 118 species are also mapped in BIEN database, which highlights how
CWR are poorly covered by general plant inventories and databases, and therefore,
probably excluded from most spatial prioritizations.
Priority conservation areas
Decision support tool
We used Zonation 4.0.0rc 5 to identify priority areas for the conservation of RR plants and
CWR in the Andes. Zonation establishes a hierarchical prioritization (ranking) of areas of
the study region, allowing the identification of top priority areas for the conservation of
species based on their distributions. These priority areas are identified by a
complementarity-based and balanced ranking of conservation value over the entire
landscape, maximizing species occurrence.
Zonation setup
The intems below present the Zonation setup used in the final analyses.
Target features: We ran two different planning scenarios where the set of target features
varied. In the first scenario, we used all RR plant species for running the identification of
the priority areas; while in a second analysis, we used species from both RR plants and
CWR. For both scenarios, we searched for the top 30% fraction of the Andes that produces
the highest benefits for the target features.
Cell removal rule: We used Core Area Zonation (CAZ) rule because this configuration
helps to identify high-priority areas that have a high occurrence level for each species
separately. In this way, we were able to enhance the representation level for most of the
species, especially for species occurring in areas with low species richness. Instead, ABF
cell removal rule, despite leading to results that can reach higher average proportion of

229
feature distributions retained, would have resulted in very small protection for species
occurring over areas with low overall richness, as is the case of many CWR.
Weights: all features had the same weight in the analysis.
Condition: We used the Global Terrestrial Human Footprint's map 6 as a condition layer.
This last step prevented the software from selecting highly modified areas and assigning
them with high conservation value.
Connectivity: We used a boundary length penalty (0.1) to produce a more compact reserve
network solution. Prioritizations were run with the "edge removal" option to remove cells
from the edges of remaining landscape, increasing connectivity of priority and protected
areas in the landscape.
Costs: the use cost layer is not recommended with the CAZ cell removal rule.
Hierarchical mask: national protected areas were included using a hierarchical mask, an
approach developed to select areas of the landscape for optimal and balanced expansion of
existing PAs (which are preferably selected as the first option in the analysis).
Spatial resolution: All variables for the final priority analyses were used at a spatial
resolution of ~10 km2, which is the finer resolution at which RR plant species data was
available. Cells with more than 49% of their surface covered by PAs were considered as
protected in the hierarchical mask.
Comparison of planning scenarios
We compared the results of the two scenarios in terms of the average and minimum
proportion of the species ranges of RR plants and CWR that would be under protection in
the top 30% fraction of the landscape included in solutions. Based on this comparison, the
second scenario was the most cost-effective solution, since it increases the protection of
CWR for a small reduction in RR plants benefits.

230
Potential management zoning of selected areas
The species richness for CWR and RR plants have different spatial patterns in the Andes.
Therefore, the selected priority areas might have differentiated contributions to the
protection of each group that are important to distinguish. To do so, we compared the
distribution of the ranking of cells for RR and CWR, separately, within the resulting
network of priority and protected areas (which cover 30% of the Andes that is most
valuable for conservation). Based on this assessment, areas that comprises the network can
be classified in four types: (1) areas with the highest priority for CWR management, as
those within the top 15% of the Andes for CWR but that for RR plants have lower priority
(within the top 30%-15%), (2) areas with the highest priority for managing RR plants, as
those within the top 15% for RR plants but lower priority for CWR, (3) areas that are the
most priority places for simultaneously managing RR plants and CWR (those that were the
top 15% for both groups), and (4) the remaining areas (30% top priority for CWR and RR
plants), which are also important for the conservation of both groups but have lower
priorities than the previous.
3. List of species used in “Box 2 - Balancing conservation of biodiversity and NCPs in
the Andes”
https://doi.org/10.5281/zenodo.4890967
References
1. Körner, C. et al. A global inventory of mountains for bio-geographical applications.
Alp. Bot. 127, 1–15 (2017).
2. Enquist, B. J., Condit, R., Peet, R. K., Schildhauer, M. & Thiers, B. M.
Cyberinfrastructure for an integrated botanical information network to investigate
the ecological impacts of global climate change on plant biodiversity. PeerJ Prepr.
4, e2615v2 (2016).
3. Jenkins, C., Pimm, S. L. & Joppa, L. N. Global patterns of terrestrial vertebrate
diversity and conservation. PNAS 110, 2602–2610 (2013).

231
4. Khoury, C. K. et al. Data for the calculation of an indicator of the
comprehensiveness of conservation of useful wild plants. Data Br. 22, 90–97 (2019).
5. Moilanen, A. Reserve selection using nonlinear species distribution models. Am.
Nat. 165, 695–706 (2005).
6. Venter, O. et al. Sixteen years of change in the global terrestrial human footprint and
implications for biodiversity conservation. Nat. Commun. 7, 12558 (2016).

232
Appendices – Chapter 3
1. Summary of the ethnolinguistic diversity associated with forests and deforestation
rates in these territories according to the world's regions.
https://doi.org/10.5281/zenodo.4890967
2. Results of the sensitivity test for the criteria used to identify ethnolinguistic groups
associated with forests.
https://doi.org/10.5281/zenodo.4890967