Embed Size (px)
Citation preview

ALTERATIONS IN BODY COMPOSITION WITH SODIUM LOADINGAND POTASSIUM RESTRICTION IN THE RAT: THE TOTAL
BODY SODIUM, NITROGEN, MAGNESIUM ANDCALCIUM 1
By DONALD B. CHEEK AND CLARK D. WEST WITH THE TECHNICAL ASSISTANCE OFCATHERINE CARTER GOLDEN
(From The Children's Hospital Research Foundation and the Department of Pediatrics, Uni-versity of Cincinnati, Cincinnati, 0.)
(Submitted for publication October 27, 1955; accepted March 15, 1956)
Alterations of muscle composition and acid basebalance during potassium deficiency have been thesubject of previous investigations (1, 2). Duringmetabolic alkalosis and potassium deficiency thereis a loss of cellular potassium and a lesser or dis-proportionate increase in muscle cell sodium(3-5).The changes in chloride metabolism have not
been clearly defined. During potassium depletionand sodium loading in humans, the presence ofedema has been recorded (6) and during experi-ments concerning potassium deficiency in rats again in weight was noted (7). The volume ofdistribution of bromide in malnourished infantswith chronic diarrhea subjected to sodium chlo-ride loading and potassium restriction predictedan increase in total body chloride on a total weightbasis (8). On the other hand, balance studies ontwo patients with chronic diarrhea demonstratedsignificant deficits of body chloride (9) and dataare at hand from rats indicating that muscle chlo-ride content during potassium depletion may below (2) or high (10). Analysis of the whole ratunder these circumstances by one group disclosedno significant alteration of body chloride content(10). From a clinical viewpoint, the changes inbody composition during potassium restriction as-sume importance in the management of therapy.The present experiments were designed to ex-
amine the behavior of total electrolyte and serumelectrolyte concentrations when groups of ratswere subjected to sodium loading with and with-out potassium restriction, and in the presence orabsence of desoxycorticosterone acetate (DCA).
1This investigation was supported in part by a re-search grant (H-1638) from the National Heart In-stitute of the National Institutes of Health, United StatesPublic Health Service.
One group of animals was given sodium bicarbo-nate in the drinking water, two groups receivedsodium chloride for variable periods, and thefourth group received sodium chloride as wellas injections of desoxycorticosterone (DCA).For controls the carcasses of rats on a normal dietand on a normal diet with saline for drinking, withand without DCA, have been analyzed. Becauseof the possibility that some of the changes observedwere due to a diminished food intake, a study ofthe changes in carcass composition during starva-tion has also been included.The results indicate that the severity of potas-
sium deficiency, as measured by total carcass po-tassium content, cannot be accurately predicted byany specific change in body composition or by al-teration in acid base balance. Total body chlo-ride is usually decreased but, under certain con-ditions, total chloride may be increased. Thestatus of total body chloride does not correlatewith the serum chloride concentration. Whiletotal body sodium increased in all potassium de-ficient animals, the increment could not be corre-lated with the decrement in body potassium.
EXPERIMENTAL PROCEDURE AND METHODS
Male rats derived from the Wistar strain were used.Normal values for total body electrolyte, water and ni-trogen, furnishing standards for comparison of the re-sults on the experimental animals, were determined bycarcass analysis of animals of normal health and vigorof varying ages and weights. The larger and older ani-mals had been previously used for breeding purposes.All had been under observation for a period of at leasttwo weeks prior to sacrifice and for one week had beenmaintained on a synthetic diet of composition previouslydescribed (11).The 48 animals selected for the experimental groups
were in most cases of the median weight of the normalanimals, 210 to 250 grams. In some instances animals of
763

DONALD B. CHEEK AND CLARK D. WEST
greater weight were included. They were placed eitheron a normal or a potassium deficient diet. The normaldiet is that described previously (11). The potassiumdeficient diet was similar to the normal in compositionexcept that potassium was removed and a mixture ofsodium chloride and sodium bicarbonate added. A kilo-gram of potassium deficient diet contained 300 mEq. ofsodium, 150 mEq. each of chloride and bicarbonate and0.5 mEq. of potassium. The animals were divided into6 groups and subjected to the following conditions:Group 0. Ten rats received a normal diet and isotonicsodium chloride for drinking during a 10-day period.
Group 1. Thirteen rats received the low potassium dietfor three weeks and isotonic sodium bicarbonate fordrinking during the last four days prior to sacrifice.
Group 2. Five rats received the low potassium diet forthree weeks and isotonic sodium chloride for drink-ing during the last four days.
Group 3. Five rats received the same treatment asGroup 2 but in addition injections of desoxycorti-costerone acetate in oil, 2% mg. daily, were givenintramuscularly during the last four days.
Group 4. Four rats were subjected to the same treat-ment as those in Group 3 except that they were givena normal diet.
Group 5. Six rats received the low potassium diet foreight days and isotonic sodium chloride to drink foreight days prior to sacrifice.
Experiments were also done on a group of five ratsto determine the effect of starvation on body composition.These animals were placed in individual cages and given85 ml. of water daily in which were dissolved 1.7 mEq.of sodium chloride, 4.2 gm. of glucose and a mixture ofvitamins. The daily allowance of fluid was completelyconsumed each day. After eight days of starvation, theanimals were sacrificed.The technique for reducing the rat carcass to a fine,
homogeneous, fat free powder and the methods for esti-mation of carcass chloride, potassium and water and forserum chloride have been described previously (11).The serum CO2 content was determined by the methodof Van Slyke and Neill (12) on blood collected anaero-bically from the aorta. Serum sodium and potassiumlevels were determined by flame photometry.For total carcass sodium estimation the method of
Butler and Tuthill was used (13). One gram of fatfree dry carcass was weighed out in a platinum crucible,covered with a nickel lid, and placed in a muffle furnaceat 550°C for 20 hours. After cooling the ash was dis-solved in 1.5 ml. of 2 N HC. One drop of alcoholicphenophthalein solution was added and the mixture trans-ferred to a 5-ml. volumetric flask and made up to volume.The solution was then poured into a 10-ml. centrifugetube and 200 mgm. of Ca (OH)2 were added. The pro-cedure of Butler and Tuthill was then completed. Theestimation of total nitrogen was carried out by the methodof Conway (14) using 50 mgm. of fat free dry carcassfor digestion in a 50-ml. Kjeldahl flask. Each digestionwas done for at least eight hours in duplicate and mi-
crodiffusion technique was carried out in triplicate.Blanks and a standard solution were run simultaneously.For digestion 3.5 ml. of Conway's acid digestion mixturewere employed. For magnesium and calcium determina-tions 500 mgm. of carcass were ashed and the ash dis-solved in weak HCI. To a 2.0-ml. aliquot of the extractof the ash was added 2.0 ml. of saturated ammonium oxa-late and the calcium precipitated. To 2.0 ml. of the su-pernatant fluid were added 2 ml. of 2 per cent KH2PO4and 2 ml. of concentrated ammonia to precipitate mag-nesium as the triple salt-ammonium magnesium phos-phate. After repeated washing and centrifuging thetriple salt was dissolved in 0.2 N HCI and the method ofFiske and Subbarow (15) was then employed to deter-mine the amount of phosphate present. The content ofmagnesium was calculated from a standard curve forthe triple salt derived from estimations of standard mag-nesium solutions. Calcium was estimated by the per-manganate titration method, after the calcium oxalateprecipitate had been repeatedly washed and dissolved in2.5 ml. of 30 per cent sulphuric acid.
CALCULATIONS
The chloride space has been used for appraisal ofchange of extracellular volume and no attempt has beenmade in the calculation to correct for intracellular chlo-ride or for the slightly greater chloride concentration inconnective tissue water as compared with that of a serumultrafiltrate. It is assumed that neglect of these correc-tions will produce the same magnitude of error in theexperimental as in the normal rats so that the valuesobtained provide an index of change in extracellularvolume. A value of 0.95 is used as the Donnan factorand it is assumed that serum water represents 930 ml.per liter of serum.The total sodium of the carcass has been partitioned
into two fractions, that present in the chloride space andthat deposited in the bone and cells. The calculation isbased on the assumption that the concentration of sodiumthroughout the chloride space is the same as that in anultrafiltrate of serunm That which is not in the chloridespace serves as an index of the amount of intracellularand bone sodium. The actual amount in bone and cellsis probably greater than that calculated, because the chlo-ride space has not been corrected for factors mentionedabove, and is consequently larger than it should be.Hence, it should be emphasized that the calculated valuesfor sodium in the non-chloride space serve only as anindex of bone and cell sodium.
RESULTS
Body composition of normal rats
In normal rats total body electrolyte (sodium,potassium, chloride, calcium and magnesium),nitrogen and water were found to be linearly re-lated to the fat free dry solid content of the car-
764
BODY COMPOSITION OF POTASSIUM DEFICIENT RATS
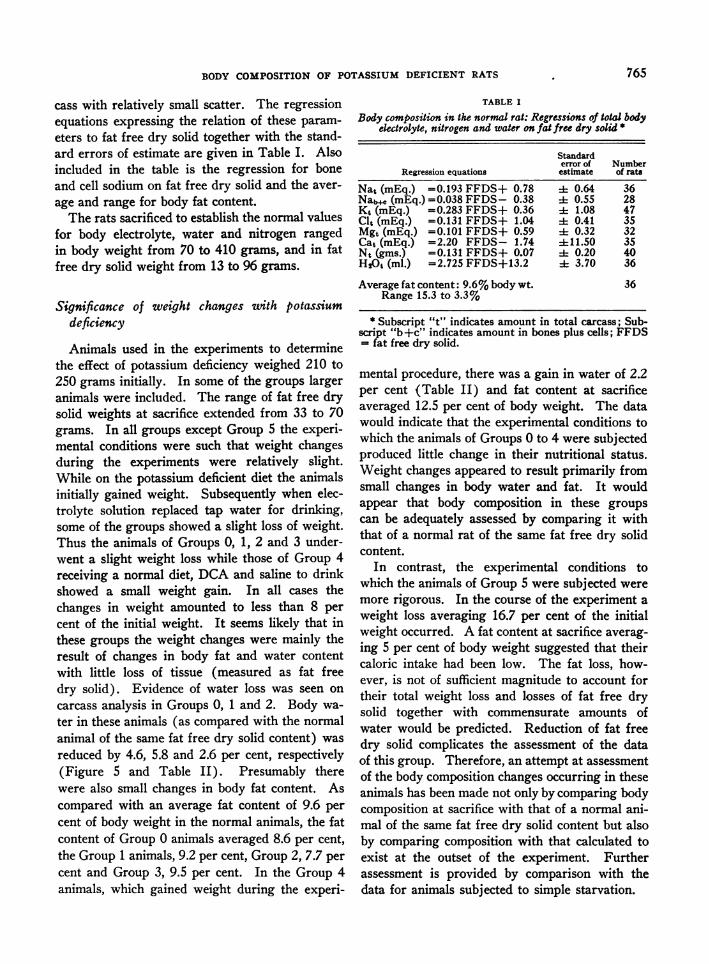
cass with relatively small scatter. The regressionequations expressing the relation of these param-eters to fat free dry solid together with the stand-ard errors of estimate are given in Table I. Alsoincluded in the table is the regression for boneand cell sodium on fat free dry solid and the aver-
age and range for body fat content.The rats sacrificed to establish the normal values
for body electrolyte, water and nitrogen rangedin body weight from 70 to 410 grams, and in fatfree dry solid weight from 13 to 96 grams.
Significance of weight changes with potassiumdeficiency
Animals used in the experiments to determinethe effect of potassium deficiency weighed 210 to250 grams initially. In some of the groups largeranimals were included. The range of fat free drysolid weights at sacrifice extended from 33 to 70grams. In all groups except Group 5 the experi-mental conditions were such that weight changesduring the experiments were relatively slight.While on the potassium deficient diet the animalsinitially gained weight. Subsequently when elec-trolyte solution replaced tap water for drinking,some of the groups showed a slight loss of weight.Thus the animals of Groups 0, 1, 2 and 3 under-went a slight weight loss while those of Group 4receiving a normal diet, DCA and saline to drinkshowed a small weight gain. In all cases thechanges in weight amounted to less than 8 percent of the initial weight. It seems likely that inthese groups the weight changes were mainly theresult of changes in body fat and water contentwith little loss of tissue (measured as fat freedry solid). Evidence of water loss was seen on
carcass analysis in Groups 0, 1 and 2. Body wa-
ter in these animals (as compared with the normalanimal of the same fat free dry solid content) was
reduced by 4.6, 5.8 and 2.6 per cent, respectively(Figure 5 and Table II). Presumably therewere also small changes in body fat content. Ascompared with an average fat content of 9.6 per
cent of body weight in the normal animals, the fatcontent of Group 0 animals averaged 8.6 per cent,the Group 1 animals, 9.2 per cent, Group 2, 7.7 per
cent and Group 3, 9.5 per cent. In the Group 4animals, which gained weight during the experi-
TABLE I
Body composition in the normal rat: Regressions of total bodyeletrolyte, nitrogen and water on fat free dry solid *
Standarderror of Number
Regression equations estimate of rats
Nat (mEq.) =0.193 FFDS+ 0.78 i 0.64 36Nab+. (mEq.) =0.038 FFDS- 0.38 ± 0.55 28Kt (mEq.) =0.283 FFDS+ 0.36 I 1.08 47Clt (mEq.) =0.131 FFDS+ 1.04 E 0.41 35Mgt (mEq.) =0.101 FFDS+ 0.59 4 0.32 32Cat (mEq.) =2.20 FFDS- 1.74 L11.50 35Nt (gms.) =0.131 FFDS+ 0.07 0.20 40H2Ot (ml.) =2.725 FFDS+13.2 :1: 3.70 36
Average fat content: 9.6% body wt. 36Range 15.3 to 3.3%
* Subscript "t" indicates amount in total carcass; Sub-script "b+c" indicates amount in bones plus cells; FFDS= fat free dry solid.
mental procedure, there was a gain in water of 2.2per cent (Table II) and fat content at sacrificeaveraged 12.5 per cent of body weight. The datawould indicate that the experimental conditions towhich the animals of Groups 0 to 4 were subjectedproduced little change in their nutritional status.Weight changes appeared to result primarily fromsmall changes in body water and fat. It wouldappear that body composition in these groupscan be adequately assessed by comparing it withthat of a normal rat of the same fat free dry solidcontent.
In contrast, the experimental conditions towhich the animals of Group 5 were subjected weremore rigorous. In the course of the experiment aweight loss averaging 16.7 per cent of the initialweight occurred. A fat content at sacrifice averag-ing 5 per cent of body weight suggested that theircaloric intake had been low. The fat loss, how-ever, is not of sufficient magnitude to account fortheir total weight loss and losses of fat free drysolid together with commensurate amounts ofwater would be predicted. Reduction of fat freedry solid complicates the assessment of the dataof this group. Therefore, an attempt at assessmentof the body composition changes occurring in theseanimals has been made not only by comparing bodycomposition at sacrifice with that of a normal ani-mal of the same fat free dry solid content but alsoby comparing composition with that calculated toexist at the outset of the experiment. Furtherassessment is provided by comparison with thedata for animals subjected to simple starvation.
765
DONALD B. CHEEK AND CLARK D. WEST
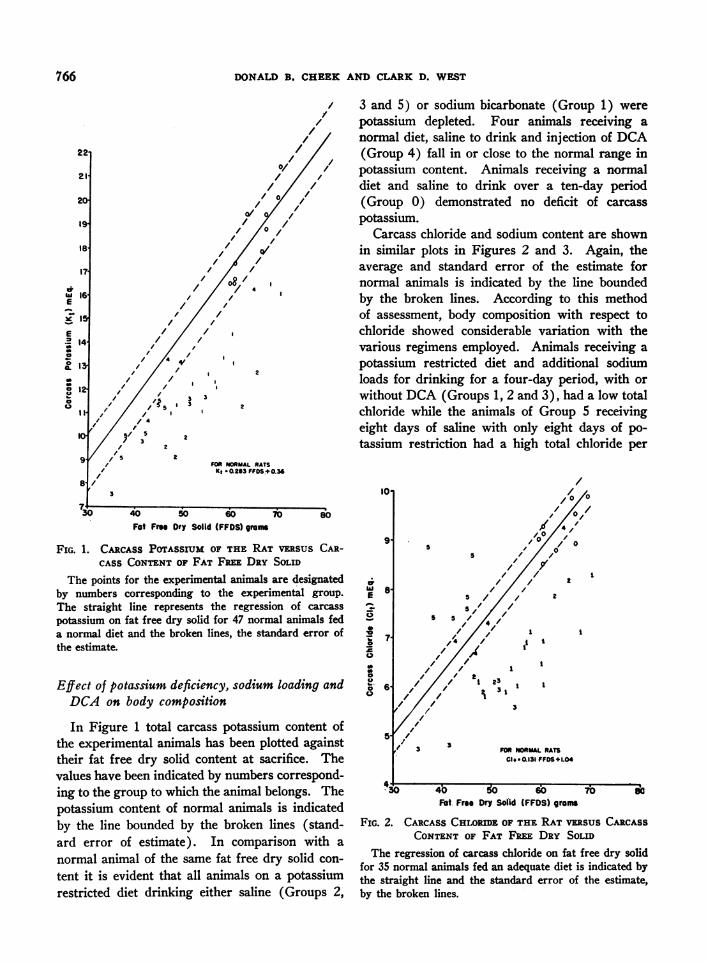
X 3 and 5) or sodium bicarbonate (Group 1) werepotassium depleted. Four animals receiving a
o/ / normal diet, saline to drink and injection of DCA/ /, (Group 4) fall in or close to the normal range in/ ,/ potassium content. Animals receiving a normal/// diet and saline to drink over a ten-day period
o /O o (Group 0) demonstrated no deficit of carcassXa/,/ potassium.
,'/°,/ Carcass chloride and sodium content are shownin similar plots in Figures 2 and 3. Again, theaverage and standard error of the estimate for
8' normal animals is indicated by the line boundedby the broken lines. According to this methodof assessment, body composition with respect tochloride showed considerable variation with thevarious regimens employed. Animals receiving apotassium restricted diet and additional sodiumloads for drinking for a four-day period, with orwithout DCA (Groups 1, 2 and 3), had a low total
2 chloride while the animals of Group 5 receivingeight days of saline with only eight days of po-tassium restriction had a high total chloride per
FOR NORMAL RATSK * 0.283 FFOS+ 0.3
Fat Free Dry Solid (FFDS) grOas
FIG. 1. CARCASS POTASSIUM OF THE RAT VBSUS CAR-CASS CONTENT OF FAT FREE DRY SOLID
The points for the experimental animals are designatedby numbers corresponding to the experimental group.The straight line represents the regression of carcass
potassium on fat free dry solid for 47 normal animals feda normal diet and the broken lines, the standard error ofthe estimate.
Effect of potassium deficiency, sodium loading andDCA on body composition
In Figure 1 total carcass potassium content ofthe experimental animals has been plotted againsttheir fat free dry solid content at sacrifice. Thevalues have been indicated by numbers correspond-ing to the group to which the animal belongs. Thepotassium content of normal animals is indicatedby the line bounded by the broken lines (stand-ard error of estimate). In comparison with a
normal animal of the same fat free dry solid con-
tent it is evident that all animals on a potassiumrestricted diet drinking either saline (Groups 2,
l0.
9
E
0-
2r0
.0
4,
.0
0
8
7
6
5,
,0/°
//I
'd/4//
/ /
5 / / / 25 /
S 5 /5/ /
/X// 1 1/,//,,, 23 1 t I
//// I I232
I 3
3 FOR W) L RATSClt-lD31 FFDS+1.0
40 60 60)Fat. Free Dry Soiid (FFDS) grams
FIG. 2. CARCASS CHLORDE OF THE RAT VERSUS CACASSCONTENT OF FAT FREE DRY SOLID
The regression of carcass chloride on fat free dry solidfor 35 normal animals fed an adequate diet is indicated bythe straight line and the standard error of the estimate,by the broken lines.
766
//
/
0'hIE1-
E.n I
0
0000
,/
3

BODY COMPOSITION OF POTASSIUM DEFICIENT RATS
19-IB.
I7-
16I
w
Ea
z
E0
0)
0n
0
10
14
13
12:
9
30
4
2~~~~~~ 4 ,~/R
5 5 o/XO o6
S 5 4 4 o3 //~~~~~ / /
fOR RMALRA2YS,NoO193FFDS+0.79
40 50 60Fat Free Dry Solid (FFDS) grams
70 80
FIG. 3. CARCASS SODIUM VERSUS CARCASS CONTENT OFFAT FR DRY SOLID
The straight line represents the regression of carcass
sodium on fat free dry solid for 36 normal animals on a
normal diet and the broken lines, the standard error ofthe estimate.
unit of fat free dry solid. As will be indicatedlater the high carcass chloride in this group isprobably secondary to the poor nutritional stateof the animals rather than the effect of potassiumdepletion. Both groups on a normal diet (GroupsO and 4) had a normal total chloride.The changes in body sodium content, as may be
seen in Figure 3, were, on the other hand, more
constant. An increased body sodium content was
present in all animals receiving a potassium re-
stricted diet (Groups 1, 2, 3, and 5), as well as inthose receiving a normal diet, saline and DCA(Group 4). A normal or slightly low body sodiumcontent was seen only in animals on a normal dietwith saline for drinking (Group 0).
Values serving as an index of sodium in boneand cells are shown in Figure 4. By the methodof calculation employed, the average bone andcell sodium for normal rats, indicated by the solidline, is about 12 per cent of the total in smalleranimals and about 17 per cent in larger animals.The rats of Groups 1 and 2 receiving a potassiumdeficient diet and sodium bicarbonate or salinefor drinking had a marked increase in the amount
w
E
a1
z
E2
0
In
0
0am
of sodium deposited outside of the chloride space.
In the remaining groups the amount of sodium incells and/or in bone was normal or only slightlyaltered.None of the experimental animals showed a
deviation from the normal in the relation of totalbody nitrogen, magnesium, or calcium to fat freedry solid. The graphs expressing these relation-ships are not shown.
Carcass water content is shown in Figure 5.Total water was definitely altered in the animalsreceiving a normal diet and saline to drink (Group0) and in those subjected to a potassium defi-cient diet and sodium bicarbonate for drinking(Group 1). In these groups body water tended
FOR NORMAL RATS(No),c 0-.O038 FFDS-0.3S
2
2
2
5 a
I5
3
3
2
.-
0
oO
0
4
30 40 50 60Fat Free Dry Solid (FFDS) grams
70 80
FIG. 4. THE BONE AND CELL SODIUM OF THE RAT(CALCULATED AS THE AMOUNT DEPOSiTED OUTSIDE THECHLORIDE SPACE) VERSUS THE CACASS CONTENT OF FATFRm DRY SoLIDThe straight line represents the regression of bone and
cell sodium on fat free dry solid for 28 normal rats on
a normal diet and the broken lines, the standard error ofthe estimate.
767

DONALD B. CHEEK AND CLARK D. WEST
TABLE II
Determined and derived values for body composition and serum electrolytes in potassium depilted and control rats *
Group 0 Group i Group 2 Group 3 Group 4 Group 5 Normal rats
Number of rats 10 13 - 5 5 4 6
Diet Normal K def. K def. K def. Normal K def.3 wks. 3 wks. 3 wks. 8 das.
Drinking fluid NaCl NaHCOs NaCl NaCI NaCl NaCl10 das. 4 das. 4 das. 4 das. 4 das. 8 das.
DCA 2.5 mg. 2.5 mg.4 das. 4 das.
FFDS, gms./rat 64.7 57.6 54.7 46.8 50.8 42.2 50
Serum Na, mEq./L. 145 153 151 172 165 143 145Serum Cl, mEq./L. 107 90 93 84 94 102 110
Serum K, mEq./L. 4.6 2.0 1.8 1.8 2.3 2.5 4.7Serum C02 content, mEq./L. 24.0 38.5 36.2 45.6 34.3 33.6 24.0
Nat, % change -3.8 +17.5 +40.7 +25.0 +23.4 +41.9 10.4 mEq.
Cit, % change -1.0 -23.1 -15.0 -24.0 -2.0 +20.0 6.7 mEq.Nat/Clt ratio 1.35 2.12 2.32 2.26 1.71 1.62 1.37Kt, % change +1.1 -27.5 -33.2 -23.1 -9.1 -14.0 14.5 mEq.
H2Ot, % change -4.6 -5.8 -2.6 +0.3 +2.2 +3.7 149.4 ml.Cl space, % change +1.8 -5.8 +0.3 +0.2 +15.0 +31.5 60.8 ml.Na in Cl space, mEq.
found 11.45 10.10 9.86 10.00 11.82 10.10expectedt 11.17 10.13 9.62 8.44 9.05 7.70 8.90
Bone Na + cell Na, mEq.found 1.31 3.90 6.08 2.30 1.10 2.54
expectedt 2.10 1.80 1.71 1.38 1.53 1.22 1.50
* FFDS = Fat free dry solid; Subscript t means "total"; DCA = Desoxycorticosterone acetate.t By expected sodium is meant the amount of sodium either inside or outside the chloride space that is presentin
the normal rat possessing the same fat free dry solid as that of the experimental group under consideration. Meanvalues for FFDS from the experimental groups are taken for comparison. The expected sodium is derived from theequations for total chloride and sodium for normal rats from 70 to 410 grams in weight.
to be low while in the others there was no sig-nificant alteration.A summary of the changes in body composition
in the experimental animals is given in tabularform in Table II. Values for electrolyte and watercomposition for each group are expressed as per-centage of the expected normal. The expectednormal is calculated from the regression equationsusing a fat free dry solid content equal to that ofthe mean for the group under consideration. Alsoshown in the table are the serum contents of so-dium, chloride, potassium and carbon dioxide aswell as derived values as to the amount of sodiumin the chloride space and in bone and cells.The rats receiving a normal diet and saline for
drinking over a ten-day period (Group 0) dem-onstrated no gross change in body composition
except for a slight reduction in total body water.total NaThere was no change in the total Cl ratio or in
the volume of the chloride space.In rats of Group 1 subjected to potassium re-
striction for three weeks with four days of sodiumbicarbonate for drinking, body potassium wasreduced by 27 per cent. Also there was a moder-ately severe hypochloremic alkalosis with a slightelevation of serum sodium concentration. Thetotal carcass sodium was elevated and total chlo-ride reduced, resulting in a ratio of total chlorideto total sodium of 2.12 as compared with a nor-mal value of 1.37. There was a significant reduc-tion of total water as well as in the volume of thechloride space; a small water loss from both extra-and intracellular compartments would be pre-
768

BODY COMPOSITION OF POTASSIUM DEFICIENT RATS
dicted. The sodium content of the chloride spacewas calculated as unchanged so that the incre-ment in total sodium apparently resided entirely incells and/or bone.The rats of Group 2 were subjected to a regi-
men similar to that of Group 1 except that sodiumchloride rather than sodium bicarbonate was givenfor drinking. Body composition resembled theGroup 1 animals with respect to the loss of potas-sium and chloride and the degree of alkalosis.The increment in total body sodium was,. on theother hand, much greater, and again, nearly allthe excess was located in cells and/or in bone.When DCA was added to the regimen of potas-
sium restriction and saline loading (Group 3) theseverity of the potassium depletion was not en-hanced. Indeed the potassium loss was less ap-preciable than that of animals receiving the sameregimen without DCA (Group 2). Alkalosis wasmarked with a very high serum sodium and alow serum chloride concentration. While the gainin body sodium and loss of body chloride was simi-lar to that of the previous groups (Groups 1 and2), the increment of sodium remained largely inthe chloride space with only a small gain in cellor bone sodium.Animals receiving a normal diet with saline and
DCA (Group 4) also showed considerable changein body composition. Carcass potassium contenttended to be low in two of the four animals, andalkalosis was present. The origin of the alkalosisappeared to differ from that of potassium restrictedanimals in that it was mainly the result of sodiumretention in the extracellular phase with littlechange in body chloride content. The averagevalue for bone and cell sodium was, if anything,somewhat reduced. The serum sodium concen-tration was elevated and serum chloride low; thelatter apparently resulted from the expansion ofthe chloride space in the face of a normal bodychloride content.
It is of interest to compare the changes in com-position of the rats in Group 3 receiving the com-bination of potassium restriction and DCA withthose in Group 2 receiving only potassium re-striction and those in Group 4 receiving onlyDCA (all 3 groups received saline for drinking).DCA alone (Group 4) appeared to cause a slightloss in body potassium but when given with po-
tassium restriction (Group 3) there was no aug-mentation of potassium loss. DCA alone causedaccumulation of sodium in the chloride spacewhile potassium deficiency resulted in a depositionof sodium outside the chloride space. When thetwo are given together as in the Group 3 rats,both extracellular and intracellular and/or bonesodium are increased. DCA alone produced nochange in body chloride content (Group 4), andpotassium deficiency alone caused a moderate re-duction. When the two were given together(Group 3), there was a marked reduction in body
200
190
180
170
160
I-:-150-0a
x
039 140,
0co-5
,I 130
20
1O1
I;
4 /
I'
//01///2 0
// /0
1,//5/1 II
5X13~~~1//l/~~~/1
5 7~ /
Sd ~ '
IiI
/FOR MAL RATS1 (Mt/ - 2 72 fFDS + 13/S
*30 40 50 60 70Fat Free Dry Solid (FFOS) groms
FIG. 5. ToTAL BODY WATER OF THE RAT PLorrEDAGAINST THE CARCASS CONTENT OF FAT FRU DRYSOLID
The straight line represents the regression of body wa-ter on fat free dry solid for 36 normal animals on anormal diet
i
769
DONALD B. CHEEK AND CLARK D. WEST
TABLE III
Calculated initial and final body composition of animals in Group 5 and of animalssubjected to starvation-average values *
Composition of normal animal withComposition at sacrifice FFDS content = Exper. group
Calculated Change from Deviation ofinitial initial exper. group
Body compositiont Found B -A X 100 Predicted B-Ccomponent A B AXOOC C XO
Group 5. Initial wt., 215 gms. Final wt., 179 gms. Wt. loss, 16.7%. N = 6
Clt (mEq.) 7.74 7.82 + 1.0% 6.58 +20.0%Nat (mEq.) 10.66 12.64 +18.6% 8.93 +41.9%Kt (mEq.) 14.86 10.58 -28.8% 12.31 -14.0%Nat/Clt 1.38 1.62 1.36H20t (ml.) 152.7 133.0 -12.9% 128.2 + 3.7%FFDS (gms.) 51.2 42.2 -17.67o 42.2Fat (% B.Wt.) 10.0 5.0
Starvation Group. Initial wt., 160 gms. Final wt., 121.5 gms. Wt. loss, 24%. N = 5
Clt (mEq.) 5.70 5.40 - 5.3% 4.77 +13.2%Nat (mEq.) 7.65 7.11 - 7.1% 6.27 +13.4%Kt (mEq.) 10.42 7.54 -27.7% 8.42 -10.5%Nat/Clt 1.34 1.32 1.31HAO (ml.) 110.2 90.5 -17.7% 90.8 - 0.3%FFDS (gms.) 35.6 28.5 -20.0% 28.5Fat (% B.Wt.) 10.0 2.1
* Subscript "t" = total electrolyte or water; FFDS = fat free dry solid; N = number of rats.t FFDS calculated from equation given previously (11),
LBM = 3.69 FFDS + 12.61assuming the lean body mass (LBM) to equal 90 per cent of body weight (body fat = 10 per cent of body weight)
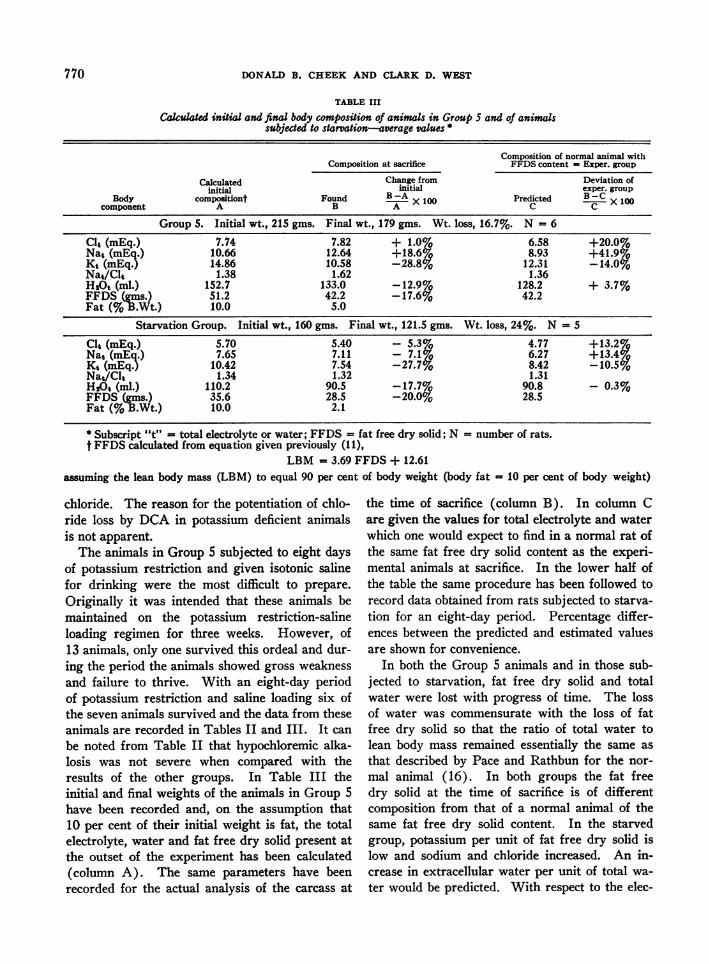
chloride. The reason for the potentiation of chlo-ride loss by DCA in potassium deficient animalsis not apparent.The animals in Group 5 subjected to eight days
of potassium restriction and given isotonic salinefor drinking were the most difficult to prepare.Originally it was intended that these animals bemaintained on the potassium restriction-salineloading regimen for three weeks. However, of13 animals, only one survived this ordeal and dur-ing the period the animals showed gross weaknessand failure to thrive. With an eight-day periodof potassium restriction and saline loading six ofthe seven animals survived and the data from theseanimals are recorded in Tables II and III. It canbe noted from Table II that hypochloremic alka-losis was not severe when compared with theresults of the other groups. In Table III theinitial and final weights of the animals in Group 5have been recorded and, on the assumption that10 per cent of their initial weight is fat, the totalelectrolyte, water and fat free dry solid present atthe outset of the experiment has been calculated(column A). The same parameters have beenrecorded for the actual analysis of the carcass at
the time of sacrifice (column B). In column Care given the values for total electrolyte and waterwhich one would expect to find in a normal rat ofthe same fat free dry solid content as the experi-mental animals at sacrifice. In the lower half ofthe table the same procedure has been followed torecord data obtained from rats subjected to starva-tion for an eight-day period. Percentage differ-ences between the predicted and estimated valuesare shown for convenience.
In both the Group 5 animals and in those sub-jected to starvation, fat free dry solid and totalwater were lost with progress of time. The lossof water was commensurate with the loss of fatfree dry solid so that the ratio of total water tolean body mass remained essentially the same asthat described by Pace and Rathbun for the nor-mal animal (16). In both groups the fat freedry solid at the time of sacrifice is of differentcomposition from that of a normal animal of thesame fat free dry solid content. In the starvedgroup, potassium per unit of fat free dry solid islow and sodium and chloride increased. An in-crease in extracellular water per unit of total wa-ter would be predicted. With respect to the elec-
770

BODY COMPOSITION OF POTASSIUM DEFICIENT RATS
trolyte content of the animals at the outset of theexperiment, starvation produced a loss of potas-sium and only a slight fall in sodium and chloride.The Nat/Clt ratio is maintained at the normallevel. In Group 5 the changes in carcass com-position resemble those produced by starvation,but the increase of carcass sodium is disproportion-ately greater than the increase of carcass chloride.Since the main difference between these twogroups is the difference in sodium intake, it wouldseem reasonable to ascribe the disproportionatelyhigh carcass sodium of Group 5 and the alkalosisto sodium loading with an inability to excretesodium effectively.
DISCUSSION
The imposition of various deleterious situationson the homeostatic mechanisms that regulate elec-trolyte balance appears to produce a wide spec-trum of complex changes in body composition thatcannot be fully explained. The present investiga-tions pertaining to sodium loading and potassiumdeficiency emphasize this complexity and revealthe variety of changes in body composition thatare possible with metabolic alkalosis. Determina-tion of the electrolyte content of individual tissuesmay not portray the alterations in total body elec-trolyte. Analyses of the muscle of potassium defi-cient animals have suggested that total body chlo-ride is commonly normal (7), whereas in thepresent study it was usually found to be dimin-ished. It would appear that carcass compositioncan be considerably influenced by the method usedto induce potassium deficiency. The administra-tion of DCA, inadequate caloric intake and thekind of sodium salt administered with the potas-sium restriction regimen all appear to superimposealterations in the basic changes in body composi-tion and acid base balance produced by potassiumdeficiency. It would appear that a consistentprogram must be followed if results are to becritically compared.The study would indicate that adequate potas-
sium intake is essential to the preservation ofhomeostasis. Administration of large loads ofsaline as drinking water to animals in which potas-sium intake was adequate (Group 0) caused nochange in body composition, while administrationof saline to potassium restricted animals produced
marked changes in body composition. While theexperiments represent extreme conditions, the re-sults offer a warning from a clinical standpointagainst the unrestricted use of saline during pe-riods of diminished potassium intake.The consistent changes in body composition
which occurred in all groups of potassium re-stricted, sodium loaded animals were a diminutionin carcass potassium and an increase in carcasssodium. The changes in carcass chloride were notso consistent. Chloride was diminished in allgroups in which body weight remained relativelyconstant during the experiments, while animalswhich showed a marked weight loss in the courseof the experiments (Group 5) had an increasein carcass chloride. The data suggest that starva-tion may significantly affect body composition andchanges in nutritional status of the animal mustalways be considered when interpreting the re-sults of carcass analysis. In the starved animalwith progress of time, there appears to be littlechange in the body content of sodium and chloridebut at sacrifice, per unit of fat free dry solid, so-dium and chloride are increased. The animals ofGroup 5 differed little in carcass chloride con-tent from those subjected to starvation withoutsodium loading. It seems logical to attribute thehigh chloride content per unit of fat free dry solidin the animals of Group 5 to their poor nutritionalstatus. With respect to carcass sodium, the Nat/Clt ratio and the status of acid base balance, theGroup 5 animals differed markedly from thestarvation group.The observations with respect to chloride in the
present study suggest that the correction of potas-sium deficits by the administration of potassiumalone without chloride, as described by Cooke,Segar, Reed, Etzwiler, Vita, Brusilow, and Dar-row (7) would not under all circumstances besuccessful. The frequent occurrence of a low totalbody chloride would indicate that for complete re-pair of body deficits, chloride must be given withpotassium.
Although the potassium restricted groups werecomparable in the direction of change in sodiumand, with the exception of Group 5, in chloride,they were not comparable in many other respects.There was no correlation, for example, betweenthe extent of potassium loss and of sodium gain in
771

DONALD B. CHEEK AND CLARK D. WEST
the various groups. It is now well recognized thatin the potassium deficient animal, part of the in-crement of the total body sodium is located inmuscle cells and the replacement of sodium for po-
tassium in these cells has been set at a ratio of ap-
proximately two sodium ions for three potassiumions (3, 17). It is apparent, however, from thepresent study that in the whole rat there is no
consistent correlation between potassium loss andsodium gain. In the rats of Group 1 potassiumloss averaged 4.58 mEq. and the sodium gainwas less than half this amount, 2.08 mEq. InGroup 2 the sodium gain (4.62 mEq.) was nearlyas great as the potassium loss (5.25 mEq.) and inGroup 5 the sodium increment of 4.75 mEq.greatly exceeded the potassium loss of 1.72 mEq.These discrepancies do not, of course, contradictthe observation that in the muscle cell, three po-
tassium ions are lost for every two sodium gained.Changes in extracellular volume, and perhapsdeposition of sodium in bone, appear to cause thevariations in this ratio in the whole animal.Use of the calculated values for sodium outsidethe chloride space (bone and cell sodium) to de-termine the cellular sodium: potassium ratio isdubious in view of the approximate nature of thecalculations and because of the fact that some ofthe increment in non-extracellular sodium may bein bone.The inconsistent changes in sodium and potas-
sium balance in the whole animal were paralleledby a similar lack of uniformity in total cation bal-ance. In agreement with earlier muscle analyses(18), the body content of magnesium and calciumwas unaltered in potassium deficiency so thatchanges in the fixed cation in the body were solelydependent on changes in sodium and potassium.In the various groups the fixed cation balancevaried from - 3.2 to + 2.3 mEq. per 50 gm. of fatfree dry solid.A lack of correlation is also apparent between
the changes in acid base balance and the severityof the potassium deficiency. The increment inserum bicarbonate concentration was approxi-mately the same in groups with potassium lossesvarying from 9 to 33 per cent. In potassium re-
stricted animals receiving DCA, potassium losswas not enhanced, yet there was a marked eleva-tion in serum bicarbonate. The serum level of
potassium was roughly correlated with the severityof the potassium deficit but the total range of vari-ation in the deficient groups was only 0.7 mEq. perL. The carcass content of sodium and chloridewas in no way reflected in the serum levels ofthese ions.A number of factors appears to influence the
pattern of body composition in potassium deficientanimals. As mentioned above, starvation seemsto be a factor of great importance. Likewise thekind of sodium salt administered appears to havesome effect on composition. Animals receivingsupplementary sodium bicarbonate for four dayswith potassium restriction (Group 1) had a muchsmaller gain in total body sodium than those onthe same regimen but receiving sodium chloride(Group 2) although the severity of potassium de-pletion in the two groups was approximately thesame. DCA could be considered a third factoraltering the results of carcass analysis. Animalsrestricted in potassium intake and receiving thissteroid had a marked increase in the sodium con-tent of the extracellular phase (Group 3) as com-pared with animals on a similar regimen but notreceiving DCA (Group 2). Because the extra-cellular volume of the animals receiving DCA wasnot expanded, a severe hypernatremia resultedwhich in turn potentiated the hypochloremic alka-losis of potassium deficiency. The results indicatethat this steroid not only superimposes furtheralterations in body composition but also is of littlevalue in facilitating the production of potassiumdeficiency in the experimental animal. In factanimals on a potassium deficient diet receivingDCA had a slightly less severe potassium deple-tion than the comparable group not receivingDCA.The effects of DCA in animals on a normal diet
(Group 4), as seen in the present study are incomplete agreement with the observations ofothers. Hypernatremia (19-21) with an increasein exchangeable sodium (21, 22) is also seen fol-lowing the administration of DCA to dogs. Ex-changeable chloride remains normal (21). Musclepotassium (20) as well as total body potassium(22) is decreased and serum potassium levels arelow. Similar to the present study, this steroidmay also produce an alkalosis in dogs which ap-pears to be independent of potassium loss.
772
BODY COMPOSITION OF POTASSIUM DEFICIENT RATS
Gamble (21) found that the alkalosis would dis-appear when DCA was withdrawn without potas-sium being present in the diet. The average po-tassium loss in the Group 4 animals in the presentstudy approximated the amount that has beentermed labile potassium-an amount that can belost without alteration in acid base balance.
tentiating the alkalosis, but does not enhance po-tassium loss.
6. The extent of the potassium depletion couldnot be correlated with the gain in body sodium,with the changes in acid base balance or with theserum levels of potassium.
REFERENCESSUMMARY
1. To ascertain the changes in body compositionproduced by potassium restriction, groups of nor-mal rats were given diets low in potassium andeither isotonic sodium chloride or sodium bi-carbonate for drinking for variable periods of time.DCA was administered to some of the groups.The control groups consisted of animals on a nor-mal diet with isotonic saline for drinking with andwithout DCA and of animals subjected to starva-tion. The results were assessed by comparingthe body composition of the experimental animalswith that of normal animals.
2. The basic change in the composition of thepotassium restricted-sodium loaded animals wasan increase in total body sodium, a reduction inpotassium, and, in those animals remaining in goodnutrition, a fall in body chloride. Animals losingweight in the course of the experiments, and con-trol animals subjected to starvation without so-dium loading, had a definite increase in chlorideper unit of fat free dry solid but little change inbody chloride content as compared with the con-tent prior to experimentation. Starvation ap-pears to alter markedly body composition withrespect to chloride, sodium and potassium.
3. Animals given saline to drink and a diet ade-quate in potassium had no changes in body com-position. With sodium loading, the administra-tion of potassium is necessary for preservation ofhomeostasis.
4. The potassium deficient animals showed nodeviation from the normal in their content of cal-cium, magnesium and nitrogen per unit of fatfree dry solid.
5. The pattern of change in body compositionproduced by potassium restriction is altered by ad-ministration of DCA. DCA causes a retention ofsodium in the chloride space, thus greatly po-
1. Darrow, D. C., Changes in muscle composition inalkalosis. J. Clin. Invest., 1946, 25, 324.
2. Darrow, D. C., Schwartz, R., Iannucci, J. F., and Co-ville, F., The relation of serum bicarbonate con-centration to muscle composition. J. Clin. Invest.,1948, 27, 198.
3. Cooke, R E., Segar, W. E., Cheek, D. B., Coville,F. E., and Darrow, D. C., The extrarenal correc-tion of alkalosis associated with potassium defi-ciency. J. Clin. Invest., 1952, 31, 798.
4. Muntwyler, E., and Griffin, G. E., Effect of potassiumon electrolytes of rat plasma and muscle. J. Biol.Chem., 1951, 193, 563.
S. Gardner, L. I., MacLachlan, E. A., and Berman, H.,Effect of potassium deficiency on carbon dioxide,cation, and phosphate content of muscle, with noteon the carbon dioxide content of human muscle.J. Gen. Physiol., 1952, 36, 153.
6. Black, D. A. K., and Milne, M. D., Experimentalpotassium depletion in man. Clin. Sc., 1952, 11,397.
7. Cooke, R. E., Segar, W. E., Reed, C., Etzwiler, D. D.,Vita, M., Brusilow, S., and Darrow, D. C., Therole of potassium in the prevention of alkalosis.Am. J. Med., 1954, 17, 180.
8. Cheek, D. B., Total body chloride of children inpotassium deficiency and under circumstances ofpoor nutrition. Pediatrics, 1954, 14, 193.
9. Schwartz, W. B., and Relman, A. S., Metabolic andrenal studies in chronic potassium depletion result-ing from overuse of laxatives. J. Clin. Invest.,1953, 32, 258.
10. Schwartz, R., Cohen, J., and Wallace, W. M., Tissueelectrolyte changes of the whole body, muscle,erythrocyte and plasma of rats on a potassium de-ficient diet. Am. J. Physiol., 1953, 172, 1.
11. Cheek, D. B., and West, C. D., An appraisal of meth-ods of tissue chloride analysis: The total carcasschloride, exchangeable chloride, potassium andwater of the rat. J. Clin. Invest., 1955, 34, 1744.
12. Van Slyke, D. D., and Neill, J. M., The determina-tion of gases in blood and other solutions by vac-uum extraction and manometric measurement. I.J. Biol. Chem., 1924, 61, 523.
13. Butler, A. M., and Tuthill, E., An application of theuranyl zinc acetate method for determination ofsodium in biological material. J. Biol. Chem.,1931, 93, 171.
773

DONALD B. CHEEK AND CLARK D. WEST
14. Conway, E. J., Microdiffusion Analysis and Volu-metric Error. 3rd rev. ed., London, C. Lockwood,1950, chap. 14.
15. Fiske, C. H., and Subbarow, Y., The colorimetricdetermination of phosphorus. J. Biol. Chem., 1925,66, 375.
16. Pace, N., and Rathbun, E. N., Studies on body com-
position. III. The body water and chemically com-
bined nitrogen content in relation to fat content.J. Biol. Chem., 1945, 158, 685.
17. Orloff, J., Kennedy, T. J., Jr., and Berliner, R. W.,The effect of potassium in nephrectomized ratswith hypokalemic alkalosis. J. Clin. Invest., 1953,32, 538.
18. Cotlove, E., Holliday, M. A., Schwartz, R., and Wal-lace, W. M., Effects of electrolyte depletion andacid-base disturbance on muscle cations. Am.J. Physiol., 1951, 167, 665.
19. Davis, A. K, Bass, A. C., and Overman, R. R.,Comparative effects of cortisone and DCA on ionicbalance and fluid volumes of normal and adrenal-ectomized dogs. Am. J. Physiol., 1951, 166, 493.
20. Ferrebee, J. W., Parker, D., Carnes, W. H., Gerity,M. K., Atchley, D. W., and Loeb, R. F., Certaineffects of desoxycorticosterone. The developmentof "diabetes insipidus" and the replacement ofmuscle potassium by sodium in normal dogs. Am.J. Physiol., 1941, 135, 230.
21. Gamble, J. L., Jr., Effect of variations of sodium in-take and of desoxycorticosterone on the relation-ship of sodium space to chloride space in dogs.Am. J. Physiol., 1953, 175, 276.
22. Gaudino, M., and Levitt, M. F., Influence of theadrenal cortex on body water distribution and re-
nal function. J. Clin. Invest., 1949, 28, 1487.
774


![LTE Handover Restriction List Configuration Mode Commands · LTE Handover Restriction List Configuration Mode Commands exit Syntax Description [no]forbidden {inter-rat all |cdma2000geranutran}location-ar](https://img.pdfslide.net/doc/110x75/60c8f7b2d52b387bd66a7deb/lte-handover-restriction-list-configuration-mode-commands-lte-handover-restriction.jpg)