Embed Size (px)
Citation preview
BULLETINof the
ILLINOIS NATURAL HISTORY SURV]HARLOW B. MILLS, Ckitf
Tularemia, Weather,
and Rabbit Populations
RALPH E. YEATTERDAVID H. THOMPSON
Print**! br Authority •{ the
STATE OF ILLINOISADLAI B. STEVENSON, Govtrmor
DEPARTMENT OF REGISTRATION AND EDUCATIONC HOBART ENGLE, Dlrtel^r


STATE OF ILLINOISAdi.ai E. Stevenson, Governor
DEPARTMENT OF REGISTRATION AND EDUCATIONC. HoBART Enci.e, Director
NATURAL HISTORY SURVEY D I \M S I O N
Harlow H. Mii.is, Chief
Volume 25 BULLETIN Article 6
Tularemia, Weather,
and Rabbit Populations
RALPH E. YEATTERDAVID H. THOMPSON
Pnntiii hy Autlinrity of tlic State 0/ Illinois
U R B A N A, ILLINOIS
J,n,f 1952

STATE OF ILLINOISAdlai E. Stevenson, Governor
DEPARTMENT OF REGISTRATION AND EDUCATIONC. HoBART Engle, Director
A. E. Emerson, Ph.D.L. H. TiFFAN-Y, Ph.DRoger Adams, Ph.D
BOARD OF NATURAL RESOURCES AND CONSERVATIONC. HoBART Engle, Chairman
Biology Walter H. Newhouse. Ph.D., GeologyForestry L. R. Howson, B.S.C.E., C.E.,D.Sc, Chemistry Engineering
George D. Stoddard. Ph.D., Litt.D., L.H.D., LL.D.. President of the University of IllinoisDelyte W. Morris, Ph.D., President of Southern Illinois University
NATURAL HISTORY SURVEY DIVISIONUrbana, Illinois
SCIENTIFIC AND TECHNICAL STAFFHARLOW B. MILLS, Ph.D., Chief
Bessie B. East, M.S., Assistant lo the Chief
Section of Economic Entomology
George C. Decker, Ph.D., Entomologist and HeadJ. H. Bigger, M.S., EntomologistL. L. English, Ph.D., EntomologistC. J. Weinman, Ph.D.. EntomologistS. C. Chandler, B.S., Associate EntomologistWillis N. Bruce. M.A., Associate EntomologistJohn M. Wright, M.A., Assistant EntomologistW. H. LuCKMANN, M.S., Assistant EntomologistH. B. Petty, M.A., Extension Specialist inEntomology
Paul Suranyi, Ph.D., Laboratory AssistantMassoud Varzandeh, M.S., Research AssistantNorman C. Gannon, M.S., Special Research
AssistantJeane Warner. Laboratory AssistantSue E. Watkins. Technical Assistant
Section of Faunistic Surveys and InsectIdentification
H. H. Ross, Ph.D.. Systematic Entomologist andHead
Milton W. Sanderson, Ph.D., Associate TaxonomistLewis J. Stannard, Jr., M.S.. Assistant TaxonomistLeonora K. Glo\T). M.S., Laboratory AssistantPhilip W. Smith, M.S., Laboratory AssistantWilliam R. Richards, B.S., Laboratory AssistantVera Twitty, B.S.. Technical Assistant
Section of Publications and Public Relations
James S. Avars. B.S., Technical Editor and HeadBlanche P. Young, B.A.. Assistant Technical EditorWilliam E. Clark. Assistant Technical PhotographerJames W. Curfman, B.S., Technical Assistant
Technical Library
Marguerite Simmons. M.A., M.S.. TechnicalLibrarian
Ruth Warrick, B.S., Assistant Technical Librarian
Section of Applied Botany and Plant Pathology
Leo R. Tehon, Ph.D.. Botanist and HeadJ. Cedric Carter, Ph.D.. Plant Pathologist
J. L. Forsberg, M.S., Associate Plant PathologistRalph W. Ames, Ph.D., Associate Plant PathologistPaul F. Hoffman. Jr., Ph.D., Associate Plant Pa-
thologist
G. H. Boewe, M.S., Assistant Plant PathologistG. J. Stessel. M.S., Assistant Plant PathologistB. M. Zuckerman, M.S., Assistant Plant PathologistRobert A. Evers, M.S., Assistant BotanistE. A. Curl, M.S., Special Research AssistantRovENiA F. Fitz-Gerald, B.A., Technical Assistant
Aquatic Biologist and
Associate Aquatic
Section of Aquatic Biology
George W. Bennett. Ph.D.,Head
William C. Starrett, Ph.D.,Biologist
Donald F. Hansen, Ph.D.. Assistant Aquatic BiologistR. W. Larimore, Ph.D.. Assistant Aquatic BiologistRobert D. Crompton. Field AssistantLeonard Durham. M.S., Technical Assistant*P. L. McNeil. B.S.. Technical Assistant*
Section of Game Research and Management
T. G. Scott. Ph.D.. Game Specialist and HeadRalph E. Yeatter. Ph.D., Game SpecialistF. C. Bellrose, B.S., Associate Game SpecialistH. C. Hanson, M.S., Assistant Game Specialist
J. S. Jordan. M.F., Assistant Game TechnicianWilliam Nuess, Field AssistantLysle R. Pietsch, M.F.. Project Leader^
Section of Forestry
Willet N. Wandell, M.F.. Forester and HeadLawson B. Culver, B.S., Associate in Forestry Ex-
tensionRoss J. Miller, M.S., Field Ecologist
Charlotte Aschbacher, B.A., Technical Assistant
Consultant in Herpetology: Hobart M. Smith. Ph.D., Associate Professor of Zoology. University of Illinois.Consultant in Parasitology: Norman D. Levine, Ph.D., Associate Professor of Veterinary Parasitology and
of Veterinary Medicine, University of Illinois.
*Employed by the Illinois Department of Conservation and assigned to the Natural History Survey for ad-ministrative and technical supervision.
tEmployed by the Illinois Department of Conservation under terms of the Federal Aid in Wildlife RestorationAct and assigned to the Natural History Survey for administrative and technical supervision.
This paper is a contribution from the Section of Game Research and Management.
(48291—4M—4-52)

PORE W O R
D
IT IS commonly assumed, by people whoare not immediately associated with re-
search, that endeavors in this field ot ac-
tivity can be completed in a short time and
that findings of value will always accrue.
This assumption is often, but not by any
means always, valid. Further, short-term re-
searches almost universally have their base
in painstaking studies which have progressed
over a long period, some time previous to the
initiation of the short-term observations.
Values which result from research studies
are often so closely intertwined with time
that these values do not become significant
until observations have been continued over a
long period. This is the case in the present
important contribution, a study correlating
game populations, weather, and humanhealth, and utilizing observations covering
about a quarter of a century.
Dr. Thompson was zoologist for the Illi-
nois Natural History Survey from 192.? to
1944 and, since that time, has been Senior
Naturalist for the Forest Preserve District
of Cook County, Illinois. Because of his
earlier training in animal pathology and
statistics, he became interested in tularemia
soon after the first cases were reported in
Illinois. In 19.54 Dr. Yeatter, a specialist
in research and management of upland
game in the Middle West, joined our staff
and teamed up with Dr. Thompson to workon the relation of human tularemia to
rabbit hunting in Illinois. Dr. Yeatter has
been principally responsible for completing
the project during the past 10 years and
for preparing this manuscript for publica-
tion. These men noticed the relationship
between mild autumn temperatures and the
severe outbreaks of human tularemia which
occurred in Illinois following the opening of
the rabbit-hunting seasons in 19.^8 and 1939.
Later they learned that Dr. Robert G. Greenof Minnesota had already foreseen this re-
lationship from a consideration of the life
history of the ticks which transmit the in-
fection from rabbit to rabbit and from a
study of the course of the disease in the
cottontail.
The following study sliould be of interest
to a great many people.
Harlow B. .Mills, dhirf
Illinois Natural History Survey

V
?i^
"/
/ /
. -v.**!^ *„--«-*^r <<? •
•-^-;'

C ON T E NTS
Acknowledgments .^52
History of Tularemia 352
Tularemia ix Wildlife 353
Tick and Insect Vectors 353
Tularemia in Man 356
Weather and Tularemia 366
Rabbit Populations and Tularemia 370
Tularemia and the Rabbit H unter 374
Recommendations 377
Summary 379
Literature Cited 380

Hunters in an uncultivated gray soil prairie area in southern Illinois. This part of the state,
which has a large cottontail population, has a relatively high human tularemia rate.

Tularemia, Weather,
and Rabbit Populations
RALPH E. Y E A T T E R *
DAVID H. THOMPSON*
TULAREAHA, a disease of rabbits
and hares (lagomorphs) , rodents,
and se\eral other animals, is
transmissible to man. In the period 1026-
1940. Illinois had more than 3,000 re-
ported cases of human tularemia, about
twice as many as any of the other states.
The great majority of these Illinois cases
were traceable to contact with cottontail
rabbits, fig. l.t Because these rabbits are
widely distributed on agricultural lands
throughout Illinois, and because they are
able to maintain themselves under heavy
hunting pressure, they rank among the
chief game animals of the state. At one
time, cottontail rabbits probably made up
about two-thirds of the total game bag
of llliniiis hunters, but, since the tularemia
hazard has become generally recognized,
rabbit hunting has lost some of its former
popularity. Thus, tularemia is of concern
to many thousands of people in Illinois not
only because of its relation to public health,
but also because of its adverse efifect on the
sport of hunting.
This paper deals with the relation of
human tularemia in different parts of the
state and in different \'ears to weather, to
the abundance of rabbits, and to some other
aspects of its epidemiology. In analyzing
the information on tularemia in Illinois,
•Dr. Yeatter holds the title of Game Specialist with
ifie Illinois Natural History Survey. Dr. Thompson.r several years with the Illinois Natural History Sijrvey,
now Senior Naturalist of the Forest Preserve District
if Cook County, with headquarters at River Forest, Illinois.
tThc Mearns c<itlontjiI rabbit. SylzilnRui floruianiis
r'irarnti (.Mien), is the common rabbit in Illinois. South1 the Ozarkian Uplift, in extreme southern Illinois, it-
: inge intergradcs with that of the Oklahoma cottonlall
r.ibbit. S. /. alacer (Bangs), according to HamiltonI 1943). Other Lagomorpha in Illinois are the swatnprabbit, SvIi'ilaEUS atquaticui acquaticui (Bachman), dis-
tributed in wooded bottt)mland6 of a few southern counties,
and the white-tailed jack rabbit. Lfpus townsfnd'n cam-puniui Hollister. which occurs in small numbers in the
northwestern part of the state.
the writers have made an effort to dctcr-
n)ine the methods of management whichwould permit Illinois hunters to enjoy the
sport of rabbit bunting without undue risk
of infection. In a report by the writers
(Thompson iSc Yeatter 1941) at the
Seventh Midwest Wildlife Conference,
Des Moines, Iowa, December, 1941, andin a Natural History Survey release
(.Anonymous 1941), the writers stated
that the human tularemia rate in Illinois
is related to weather at the time of the
opening of the hunting season. The\added that in years in which the mean date
of the first 10 freezing nights of autumnoccurs before the opening of the rabbit-
hunting season, the tularemia rate amonghumans in the state is much lower than in
other years. Green (1935, 1939) had
previously pointed out that in Minnesota
rabbits are free of tularemia during the
cold months of the year and had suggested
delaying the hunting of rabbits until
middle or late October as a way of reduc-
ing the hazard of tularemia in humanbeings.
The Illinois records on tularemia and
weather for the decade following the
publication of the writers' first reports
appear to support the conclusion that the
tularemia rate and weather are closely
related. Also, as was pre\iously indicatetl
(Thompson & Yeatter 1941 ), it is evident
that the tularemia rate in Illinois may be
influenced strongly at times by fluctuations
of rabbit populations. The principal con-
clusion resulting from the present study
is that, because of certain characteristics of
the life history of the principal arthropod
vector, the incidence of human tularemia
in Illinois can be lowered significantly by
dela\ ing the opening of the rabbit-hunting
[351]

352 Illinois Natural History Survey Bulletin Vol. 25, Art. 6
Fig. 1.—A Mearns cottontail rabbit. This rabbit is an important game animal throughout
its range from New York to Kansas. In Illinois, it is the reported source of more than 90
per cent of the human tularemia cases.
season until about December 1. Suchdelay is urgent, particularlj' in the central
and southern parts of the state.
Acknowledgments
The writers are greatly indebted to the
Illinois Department of Public Health for
detailed records since 1926 on the dis-
tribution of tularemia cases in Illinois
and to the United States Public HealthService for information on the prevalence
of tularemia in other parts of the country.
They are indebted also to the WisconsinConservation Department for permission
to use its records of the annual kill of
cottontail rabbits in Wisconsin, to the
United States Forest Service for census
data on a southern Illinois area, and to JoeL. Mote of Watseka, Illinois, for bagrecords and field notes.
History of Tularemia
Tularemia was discovered in 1910 by
Dr. George W. McCoy of the United
States Public Health Service in the ground
squirrels of Tulare County, California
(McCoy 1911; Francis 1937). Thedisease was named in 1920 by Dr. EdwardFrancis (1921, 1937), also of the United
States Public Health Service, after he hadestablished the identity of the groundsquirrel disease with an outbreak of
"Deerfly fever" in man in Utah. Theessential facts about tularemia have been
worked out entirely by American investi-
gators. The causative organism is a bac-
terium, Pasteurella tularensis (McCoy &Chapin) Bergey et al. (McCoy & Chapin1912; Breed, Murray, & Hitchens 1948).
In spite of the short history of tularemia, it
is believed that this disease is not new but

1952 Yeatter & Tho.mi-son ; Tularemia 353
is an old one which was not identified until
comparatively recent years. Since 1925
it has been reported from all states except
\'ermont, as well as from Canada. Alaska,
Mexico, and several countries in Europe,
Asia, and Africa.
Tularemia in Wildlife
Burroughs et al. (1945) have listed 47
kinds of mammals and birds, distributed
chieH\- in North America, Europe, and
.Asia, in whicli natural infection with
tularemia has been shown by laboratory
tests. \'arious groups of lagomorplis and
rodents make up more than three-fourths
of their list. Also included are certain
gallinaceous birds, raptorial birds, and
carnivores, as well as a few domestic
animals.
A few vears ago, wildlife pathologists
of the University of Minnesota and the
United States Bureau of Biological Survey
(now the Fish and AV'ildlife Ser\ice),
co-operating with the Minnesota Depart-
ment of Conservation, studied the relation
of tularemia to the welfare of several wild-
life species in Minnesota. As a result of
these studies. Green (1939) reported that
cottontail rabbits are highl\- susceptible to
tularemia, and that infected cottontails in-
variably die, usual!)' within a week after
the onset of the disease. He found that
snowshoe hares are resistant to the disease
and that they seldom die from it. Jack
rabbits prove rather susceptible when ex-
posed, but, among wild jack rabbits in
Minnesota, tularemia is apparently- rare.
Green iS: Wade (1929) reported a fatal
tularemia infection in the bob-white, Col-
iiiiis virg'uiianus Linnaeus ; Green & Shil-
linger (1932) found the disease in the
ruffed grouse, Boiiasa umbellus togata, and
the sharp-tailed grouse, Pediocetes phasia-
nellus. Green (1939) stated that the
ring-necked pheasant is highly resistant to
infection, but that muskrats "suffer from
a highh- fatal infection." He reported that
a'l kinds of mice, squirrels, and other
small rodents in Minnesota are susceptible,
and suggested that mice may be an im-
portant reservoir of the disease in the wild.
Green & Wade (1928) found that
domestic cats contracted tularemia whenfed the carcasses of infected guinea pigs.
Green (1942) stated that dogs appear to
be almost entirely immune. Waller(1940), however, reported agglutinationtests positive for tularemia in blood samplesof a dog whicli became sick after feeding
on a diseased rabbit. Downs et al. ( 1946)were successful in infecting a number of
laboratory dogs by injection of virulent
tularemia organisms, but reported that
dogs were less susceptible to the disease
than most laboratory animals and that they
were often able to localize the infection.
Lillie & Francis (1936) reported as
follows on attempted experimental inocula-
tion of red foxes: "In 1934 four red foxes
(Viilpes fitlva) were obtained. One(7484) was injected subcutaneously with
infected guinea pig spleen and culture
(Omo strain), and died 13 days later.
He refused to eat during the entire period.
There was a diarrhea during the last 2
days of life. Two other foxes died 2
months after the subcutaneous inoculation
of 7760 and after the first infectious feed-
ing of 7761. Both of these animals hadhad noisy labored respiration ; the first
for some 4 weeks, the second for 3 or 4days before death.
"B. tularense was recovered directly
from the blood of 7484, and inoculation of
various organs of all three reproduced
tularaemia in guinea pigs and cultures \\ere
recovered."
Human beings sometimes become in-
fected with tularemia through being bitten,
scratched, or clawed by dogs, cats, or other
flesh-eating animals that have become con-
taminated with the tissue or blood of in-
fected wildlife.
A considerable number of animal species
in which natural infection has not been
proved have been reported as probable
sources of human tularemia. Francis
(1937) mentioned as suspected carriers
the coyote, red fox, deer, ground hog,
tree squirrel, skunk, sage hen, bull snake,
and hog. Of domestic rabbits, Francis
stated, "Rabbits raised under domestic con-
ditions in rabbitries and hutches, although
highh' susceptible, have not been found
naturally infected, due probably to their
freedom from ticks.'
Tick and Insect \'ectors
Tularemia is spread among wild animals
largely by the bites of ticks and insects.

354 Illinois Natural History Survey Bulletin Vol. 25, Art. 6
Fig. 2.—Rabbit tick, Hacmaphysalis Icp-
oris-palustris (Packard). Top, male; center,
female; bottom, female, engorged. The rabbit
tick is the chief agent in the spread of tulare-
mia among rabbits and is an important carrierof the disease in other kinds of wildlife.
Infection in carnivorous mammals andbirds may, of course, come from eating
diseased prey. Also, it seems probable
that certain aquatic mammals, and possibly
other forms, sometimes contract the disease
from water that is contaminated withPasteurella tularensis. For example, the
findings of Jellison et al. (1942) suggest
that water-borne disease organisms werethe source of a tularemia outbreak amongbeavers in Montana in 1939 and 1940.
Studies by Parker et al. (1951) indicate
that contamination of streams and mudwith tularemia organisms is widespread in
the northwestern United States, and that
fatal infections of muskrats and beavers
with tularemia probably have occurred
there in recent years.
The rabbit tick, Haemaphysalis leporis-
palustris (Packard), fig. 2, is the chief
arthropod vector of tularemia in the wild.
Francis (1937) stated, "The disease ....is spread from rabbit to rabbit principally
by the rabbit tick, Haemaphysalis leporis-
palustris, but also by other blood-sucking
arthropods—ticks, lice, and fleas. Therabbit tick, the rabbit louse, and the rabbit
flea do not bite man, and therefore they
are not a source of human infection."
Green (1942) reported that the rabbit
tick was principally responsible for the
spread of tularemia among wild animals
and birds in Minnesota.
Two other ticks, the American dogtick, Dermacentor variabilis (Say), fig. 3,
and the Rocky Mountain wood tick, D.andersoni Stiles, fig. 4, are known vectors
of tularemia. Both are sources of the dis-
ease in man as well as in various species of
wildlife. The American dog tick, D.variabilis (also called wood tick), is dis-
tributed in the eastern United States, in the
Mississippi River valley, and in some of
the Plains states as well as in western
California, Canada, and Alaska (Coolev
1938). Green (1942) reported that the
most common mode of human tularemia in-
fection in Minnesota appeared, at the time
he wrote, to be the bite of a "wood tick"
(American dog tick) and the second mostcommon the cleaning of an infected rabbit.
He found that the adult dog ticks that
carry tularemia are those that have be-
come infected during immature stages
while feeding on diseased mice or other
small rodents.

June. 1952 Yeatter & Thompson- : Tularemia 355
^k
"»-*:fi».j(
Fi^. 3.—American liog tick, Dermacenlor'var'iahWis (Say). Top, male; center, female;
bottom, female, engorged. This tick is widely
distributed in North America; its principal
range is east of the Rocky Mountains. It is
a source of tularemia in humans and probably
in various wild and domestic animals.
Fig. 4.—Rocky Mountain wood tick,
Dermacentor andersoni Stiles. Top, male;
bottom, female. This tick is a source of tula-
remia in humans and probably in domestic
animals and wildlife. It is found in western
parts of the North American continent.
Bell (1945) reported that a natural
barrier, apparently a bactericidal action of
the ticks' guts, keeps infection among dog
ticks at a relatively low level. Green
(1*542) reported a maximum of only 1
infected to about 2,500 uninfected dog
ticks in numerous tick sainples collected
in Minnesota. He noted that dog ticks
in Minnesota go into a resting period in
July and remain dormant until the follow-
ing spring, and that they cause infection
principally in May and June, just previous
to becoming dormant.
The Rocky Mountain wood tick is dis-
tributed in southwestern Canada and in
the western United States from the arid
zone east of the Rocky Mountains \vcst-
ward to central Washington, central Ore-
gon, and eastern California. Both im-
mature and adult stages have been found

356 Illinois Natural History Survey Bulletin Vol. 25, Art. 6
on a wide variety of mammals and birds
(Cooley 1^38).' The adult stage has
been reported as a source of human tula-
remia in several western states. Woodticks are believed to have caused a tula-
remia outbreak among range sheep in Mon-tana (Philip, Jellison, & VVilkins 1935).
Several kinds of insects are known to
be carriers of tularemia. Prince &McMahon (1946) stated that the disease
has been transmitted under experimental
conditions by the bites of several insects,
including deer flies, Chrysops discalis
Williston, stable flies, Stoinoxys calcitrans
(Linnaeus), bed bugs, Cimex lectularis
Linnaeus, and mosquitoes, Aedes aegypti
(Linnaeus).
Lice and fleas, mentioned as vectors
by Francis (1937), appear to be poten-
tially important in the dissemination of
tularemia in the northern states because
they remain active in winter when most
arthropod vectors are dormant. Ecke
(1948) found that flea populations on
Illinois cottontails were higher in winter
than at other seasons. Evidence apparently
is lacking, however, that either fleas or lice
frequently transmit tularemia. Prince &McMahon (1946) reported that guinea
pigs used in their transmission experiments
remained negative for tularemia after
exposure during 32 days to infected rat
fleas, Xenopsylla cheopis (Rothschild),
and California ground squirrel fleas,
Diamanus montanus (Baker). They con-
cluded that the two species of fleas tested
do not play an important role in the spread
of the disease. Green (1942) stated,
'Tleas are found on rabbits in southern
Minnesota during the winter; but,
although these insects can transmit tula-
remia, they appear to do so rarely."
Hopla (1951) found that tropical rat
mites, Bdellonyssus bacoti (Hirst), re-
tained tularemia organisms for consider-
able periods after feeding on infected mice.
Normal mice became infected when theycrushed infected mites orally, but not whenthey were bitten by the mites.
Tularemia in Man
Francis (1937) stated that wild rabbits
and hares are the source of more than90 per cent of all human tularemia cases
in the United States. Humans generally
become infected from contact of the bare
hands with the flesh or blood of infected
rabbits or from eating infected rabbit flesh
that is insufiiciently cooked. Usually in-
fection from handling a diseased rabbit
develops at the site of a scratch or puncture
in the skin, but occasionally it develops
in the eye as a result of contact with hands
or of spattering of washings during clean-
ing. There is considerable evidence that
the disease organism also is able to pene-
trate the unbroken human skin.
Francis (1937) described a typical
tularemia case as follows: "About 3 days
after exposure to infection, illness begins
with headache, chilliness, vomiting, aching
pains all over the body, and fever. Thepatient thinks that he has the 'flu' andgoes to bed. The sore on the hand devel-
ops into an ulcer. The glands at the elbowor in the armpit become enlarged, tender,
and painful, and later may develop into
an abscess. There is sweating, loss of
weight, and debility. Illness lasts about
3 weeks and is followed by a slow con-
valescence covering a period of 2 or 3
months. Most patients recover withoutany bad after effects, but about 5 percent
die, especially if the case is complicated by
pneumonia." Although there is no evi-
dence of a natural immunity in man,persons who have recovered from the
disease are permanently immune.In regard to the diagnosis of the disease,
Francis (1937) wrote: "The history of
tick-bite, fly-bite, or wild rabbit contact
especially, or contact with other animals,
when coupled with fever, an ulcer on the
skin, and regional lymph-node enlarge-
ment, should call attention to tularaemia.
Diagnosis is made conclusive by obtaining
agglutination of Bacterium tularense
[Pasteurella iularensis] by the patient's
serum or by obtaining a culture of the
organism from the patient's ulcer or lymphnodes following guinea pig inoculation, or
by obtaining a positive skin reaction using
an antigen prepared by Foshay of Cincin-
nati for intradermal injection."
As will be discussed later, treatment of
tularemia in man has been facilitated in re-
cent years by the use of antibiotics.
Distribution in the United States.
—It will be evident from fig. 5, showing
the distribution of 23,921 cases of tulare-
mia reported in the United States during
<
June, 1952 Yeatter & Thompson : Tularemia 357
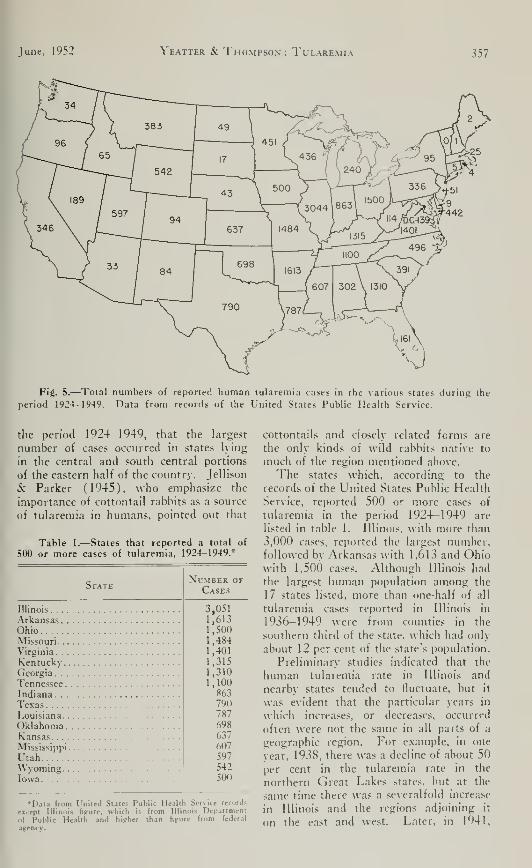
Fig. 5.—Total numbers of reported human tularemia cases in the various states during the
period 1924-1949. Data from records of the United States Public Health Service.
the period 1924-1949, that the largest
number of cases occurred in states lying
in the central and south central portions
of the eastern half of the country. Jellison
5c Parker (1945), who emphasize the
importance of cottontail rabbits as a source
nf tularemia in humans, pointed out that
Table 1.—States that reported a total of
500 or more cases of tularemia, 1924-1949.*
State

358 Illinois Natural History Survey Bulletin Vol. 25, Art. 6
Fig. 6.—Four general regions of the United States which exhibit distinctive trends and
seasonal distribution of human tularemia.
when tularemia declined in Illinois, Indi- States may be divided conveniently into
ana, and Iowa, there was a moderate in- four major regions, namely, Northern,
crease in the states to the north. Central, Southern, and Western, fig. 6.
With respect to human tularemia rates Trends in the annual tularemia rates dur-
and seasonal distribution, the United ing the period 1935-1949 in these four
28-
24
zo
20
12
U) 8
-CENTRAL
SOUTHERN-
— -J/*'
. ^NORTHERN
1936 1938 1940 1942 1944 1946 1948
F'fi- 7.—Trends in human tularemia rates during the period 1935-1949 in the four regionsof the United States shown in fig 6. Data on which this graph is based are from records of theUnited States Public Health Service.

June, 1952 Yeatter & Thompson : Tularemia 359
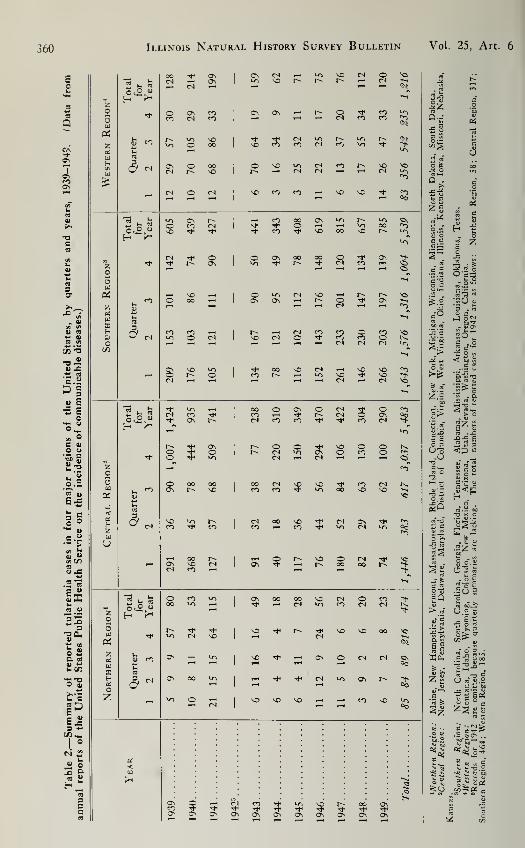
NORTHERN CENTRAL SOUTHERN WESTERN
Fig. 8.—Distribution of reported human tularemia cases by quarters of the year during
the period 1939-1949 in the four regions of the United States shown in fig. 6. Data on whichthis graph is based are from records of the United States Public Health Service.
regions are shown in fig. 7. The seasonal
tlistribution of tularemia in these regions
is shown in table 2 and hg. 8.
In the Northern and Central regions
the inajorit}' of cases occur during late
autumn and early winter. Rabbits, which
are hunted at that time, cause most of the
cases. As indicated by table 3, furbearers,
squirrels, and upland gaine birds contribute
a few cases. During other seasons, these
regions show moderate numbers of cases
that, presumably, result from bites of ticks
or insects, from chance infections by a
variety of mammals or birds, both wild
and domestic, or from a small amount of
\ear-round hunting.
In the Southern Region, the humantulareinia rate is fairly uniform through-
out the year, indicating several sources of
infection, the most important of which are
rabbits, ticks, and insect vectors. Francis
(1937) recorded 65 cases of tularemia in
the southern states, chiefly from Marchthrough July, due to contact with dog
ticks, Dermacentor variahilis. Pullen &Stuart (1945) reported that 176 (92.1
per cent) of 191 tularemia cases for which
tlie apparent source was recorded in Loui-
siana during a 16V-;-year period gave a
history of contact with rabbits. In this
region, year-round hunting probably playf
an important part in transmission of tula-
remia to luiman beings.
Tile human tularemia rate in the Wes;ern Region is highest in summer. Because
the principal insect and tick vectors in this
region are most active from late spring to
late suminer, it appears that arthropods
may play a relatively greater part in trans-
mitting tularemia to humans there than
in the Northern and Central regions.
Wood ticks, Dermacentor aridersunl, werereported by Francis (1937) to have caused
more than 50 cases in Montana and sur-
rounding states. According to the United
States Public Health Service (Anonymous1940), sheep handlers have occasionall\' be-
come infected from contact with woodticks or tick feces in the wool. Jellison
(1950) listed, for the western states, 158
cases of tularemia probably caused b\- deer
fly bites, and showed that the distriiiution
of these cases corresponded roughly with
the distribution of the deer fly species,
Chrysops discalis Williston. Jellison et til
(1950) reported contamination with Pax
teurella tularensis organisms of certain
natural waters in Montana and also a
few cases of human tularemia caused by a
contaminated domestic water supply.
360 Illinois Natural History Survey Bulletin Vol. 25, Art. 6
^o

June, 1952 Yeatter & Thompson : Tularemia 361
Jack rabbits, Lepus spp., are the reported
source of a number of cases in the \Vestern
Region. These rabbits also are important
hosts of ticks and probably of biting flies
that carry the disease ( Jellison & Parker
1945). jellison (letter of April 24, 1951,
from Hamilton, Montana) states, "Cot-
tontails ha\e not been as important in this
area as other sources of infection."
Distribution in Illinois.— Records of
the Illinois Department of Public Health
indicate that cottontail rabbits are re-
sponsible for the great bulk of humantularemia in Illinois. According to Sharp
( 1939) all but 2 of 459 reported cases in
the state in 1938, during a severe outbreak
of the disease, were traceable to contact
with cottontail rabbits. McDaniels (1943)
stated that cottontails cause more than
95 per cent of the human tularemia cases
in Illinois. Other mammals, birds, ticks,
and blood-sucking insects probably serve
as the source of infection for most of the
other cases, as numerous infections have
been traced to them elsewhere in the
United States.
Recent studies by Jackson (1946) in
Indiana and Morgan (1949) in AViscon-
sin, table 3, show somewhat higher per-
centages of cases caused by vectors other
than rabbits reported for these states than
for Illinois. As has already been shown,the proportion of tularemia cases caused
by the several kinds of known vectors
varies with different sections of the
country.
The mortality rates from human tula-
remia cases reported in Illinois during the
period 1926-1951 averaged 5.7 per cent,
table 4. Considerable variation in the
mortality rates was apparent from year to
year. It is of interest in this regard that
Philip & Davis (1935), Green (1943),
and others isolated several strains of tula-
remia from naturally infected animals.
These strains differed widely in virulence.
Green's work indicated that the virulence
of the disease depended largely on the kind
of animal from which it came. For
example, he found that the virulence of
tularemia from infected grouse was con-
siderably lower, when measured by the
Table 3.—Reported sources of human tularemia in Wisconsin (379 cases in which the
cause was reported) and Indiana (123 cases). Data from Morgan (1949) and Jackson (1946).

362 Illinois Natural History Survey Bulletin Vol. 25, Art. 6
Table 4.—Data on human tularemia re-
ported by the Illinois Department of Public
Health 1926-1951.

June, 1952 Yeatter & Thompson: Tularemia 363
CASES PER
100,000
rn 1.1 - 5.0
I I 5 1-20.0
I } 20.1 -40.0
Figs. 9-12.-Distribmion of human tularemia cases per lOO.nOO population in Illinois for
the years 1936-1939.

364 Illinois Natural History Survey Bulletin Vol. 25, Art. 6
Figs. 13-16.—Distribution of human tularemia cases per 100,000 population in Illinois forthe years 1940-1943.

June, 1952 Yeatter & Thompson : Tularemia 365
0.0- I
Q I.I - 5.0
5.1 -20.0
E23 20.1 -40.0
Fi^s. 17-20.— DislributitMl of human tularemia cases per 100,000 population in Uli:
the years 1944-1947.
for
366 Illinois Natural History Survey Bulletin Vol. 25, Art. 6
CASES PER
100,000
0.0- 10'
d] I.I- 50
^ 5.1 -20.0
E53 20.1 -40.0
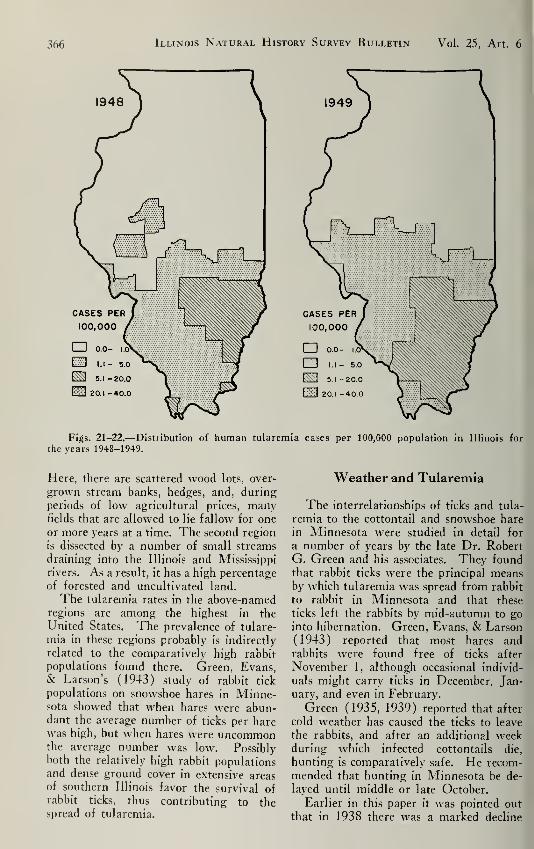
Figs. 21-22.—Distribution of human tularemia cases per 100,000 population in Illinois for
the years 1948-1949.
Here, there are scattered wood lots, over-
grown stream banks, hedges, and, duringperiods of low agricultural prices, manyfields that are allowed to lie fallow for one
or more years at a time. The second region
is dissected by a number of small streams
draining into the Illinois and Mississippi
rivers. As a result, it has a high percentage
of forested and uncultivated land.
The tularemia rates in the above-namedregions are among the highest in the
United States. The prevalence of tulare-
mia in these regions probably is indirectly
related to the comparatively high rabbit
populations found there. Green, Evans,& Larson's (1943) study of rabbit tick
populations on snowshoe hares in Minne-sota showed that when hares were abun-dant the average number of ticks per harewas high, but when hares were uncommonthe average number was low. Possiblyboth the relatively high rabbit populationsand dense ground cover in extensive areasof southern Illinois favor the survival ofrabbit ticks, thus contributing to thespread of tularemia.
Weather and Tularemia
The interrelationships of ticks and tula-
remia to the cottontail and snowshoe hare
in Minnesota were studied in detail for
a number of years by the late Dr. RobertG. Green and his associates. They foundthat rabbit ticks were the principal meansby which tularemia was spread from rabbit
to rabbit in Minnesota and that these
ticks left the rabbits by mid-autumn to gointo hibernation. Green, Evans, & Larson
(1943) reported that most hares andrabbits were found free of ticks after
November 1, although occasional individ-
uals might carry ticks in December, Jan-uary, and even in February.
Green (1935, 1939) reported that after
cold weather has caused the ticks to leave
the rabbits, and after an additional weekduring which infected cottontails die,
hunting is comparatively safe. He recom-
mended that hunting in Minnesota be de-
layed until middle or late October.
Earlier in this paper it was pointed out
that in 1938 there was a marked decline

rJ
I
1952 Yeatter & Thompson : Tularemia 367
in human tularemia in the northern GreatLakes states and a y;reat increase in Illinois
and states adjoining it on the east and west.
In Illinois there was a considerable increase
in the number of rabbits between the
autumn of 1937 and the autumn of 1938,
but it did not seem great enough to account
for the eightfold increase in the numberof tularemia cases reported in the 1938
hunting season. Inasmuch as there had
been no shifts in the date of opening of
the rabbit season in an\' of the NorthCentral states, it occurred to us that these
changes in tularemia rates might be due
to differences in temperatures about the
time of the opening of the season, as well
as to changes in rabbit abundance.
Although the percentage of infected rab-
bits apparently declines sharply throughout
the state soon after November 11 (the
opening date of the rabbit-hunting seasons
in recent years) the peak month for cases
reported to the Illinois Department of
Public Health is December, table 5. It
should be explained here that tularemia
cases are usually listed for the month in
which they are reported and not the monthof infection. Francis (1937) cites 45
Illinois tularemia cases for which the exact
month of onset is accurately recorded, as
follows : October, 1 case ; November, 23
cases; December, 18 cases; and January,
1 case. We suppose that the apparent dis-
crepancy arises from (a) delays between
killing and eating rabbits (cold storage or
freezing does not prevent infection), (b)
incubation period for the infection, (c)
Table 5.—Distribution of Illinois cases of
human tularemia, by months, 1926-1949.
Month
I
368 Illinois Natur.al History Survey Bulletin Vol. 25, Art. 6,,
correlation than any of several other
methods that were tried.
Illinois, with a north-south length of
almost 400 miles, has striking differences
in climate, and for that reason the game
and fish codes recognize three zones of
about equal area : Northern, Central, and
Southern. For making comparisons of the
mean dates of the first 10 freezing nights,
we chose a representative weather station
located near the center of each of these
zones. The Sycamore, Springfield, and
McLeansboro stations have records cover-
ing long periods of years and are not in
deep valleys or near large bodies of water.
The three zones and the locations of these
weather stations are shown in fig. 23.
When the numbers of days between the
mean or average dates of these first 10
freezing nights and the dates of the open-
ing of the rabbit-hunting seasons are com-
pared with the numbers of cases of human
tularemia for 24 successive years, 1926—
1949, it is evident that there is a general
correspondence in rises and falls between
the two sets of data.
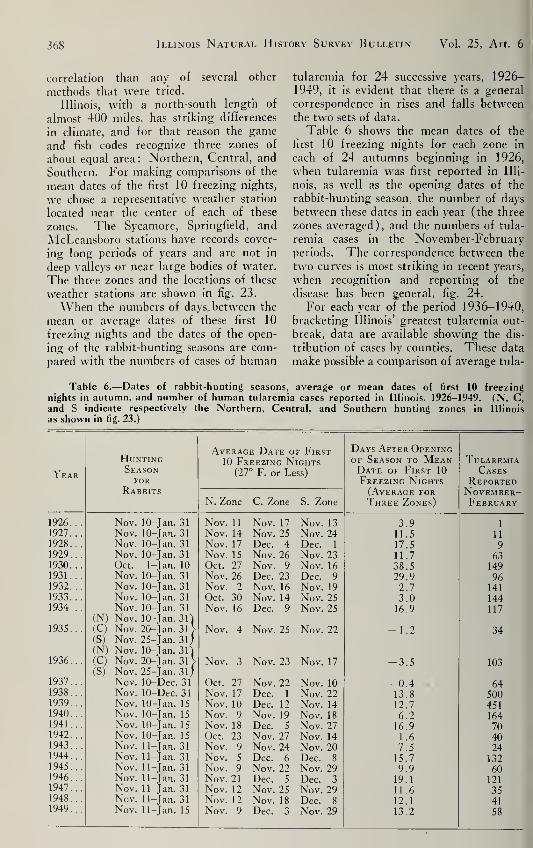
Table 6 shows the mean dates of the
first 10 freezing nights for each zone in
each of 24 autumns beginning in 1926,
when tularemia was first reported in Illi-
nois, as well as the opening dates of the
rabbit-hunting season, the number of days
between these dates in each year (the three
zones averaged), and the numbers of tula-
remia cases in the November-Februaryperiods. The correspondence between the
two curves is most striking in recent years,
when recognition and reporting of the
disease has been general, fig. 24.
For each year of the period 1936-1940,
bracketing Illinois' greatest tularemia out-
break, data are available showing the dis-
tribution of cases by counties. These data
make possible a comparison of average tula-
%
Table 6.—Dates of rabbit-hunting seasons, average or mean dates of first 10 freezingnights in autumn, and number of human tularemia cases reported in Illinois, 1926-1949. (N, C,and S indicate respectively the Northern, Central, and Southern hunting zones in Illinois
as shown in fig. 23.)

June, 1952 Yeatter & Thompson'; Tularemia 369
350
150
1944
Fis. 24.—The number of cases of human tularemia per year iii Illinois and the average elate
if the first 10 freezing nights in each autumn, 1929-1949.
remia rates in each of the three zones in
each of those 5 years as they are related to
the number of days between the openingdate of the rabbit-hunting season and the
mean date of the first 10 freezing nights.
This 5-year period includes 1*^38 and 1939,
when there was an epidemic of tularemia
in Illinois, and 1936, 1937, and 1940, whenthe tularemia rate was about average. Asummary is given in table 7.
Ecke's (1948) studies of ectoparasites
on cottontails collected in central Illinois in
the autumn of 1947 indicate that migration
of rabbit ticks to hibernating places was at
a peak in late October of that year and that
the great majority of these ticks had left
the rabbits to go into hibernation by the
time of opening of the hunting season in
early November. Temperatures wereslightly above average in October and
Table 7.—Days from opening of rabbit-huntini!, season to averajie or mean date of first 10
freezing nights in autumn, number of hunting-zone-years represented, and tularemia rate in
Illinois. 1936-1940. Figures on weather and human tularemia rate were obtained by averagingdata for each zone separately.
Days From Ope.sixg ofRabbit-Hinting Season to MeanDate of First 10 Freezing N'ights
• to 39 days beforeI to 29 days before
to 19 days beforeI to 9 days beforeI to 9 days after
I to 19 days after
N'lmber ofZone-VearsAveraged
Tllare.mia Rate,Cases per 100,000,
November- February
in
14 1

370 Illinois Natural History Survey Bulletin Vol. 25, Art. 6
November of that year. It seems probable
that even though tick hibernation in central
Illinois is usually well advanced by No-vember 11, the opening date of the rabbit-
hunting season in recent years, it is not
complete. It is apparent that this date is
too early to afford hunters the desired free-
dom from the danger of infection. Hiber-
nation of ticks may be delayed by recur-
rence or persistence of warm weather
;
presumably it occurs somewhat later in
southern Illinois, where the majority of
tularemia cases are found, than in the
central and northern parts of the state.
Portman (1944) reported finding rabbit
ticks feeding on cottontails in the southern
counties of Missouri during the winters of
1943 and 1944. He believed that southern
Missouri is the approximate northern limit
of the rabbit tick's year-round activity.
Since the extreme southern counties of
Illinois are close to and in approximately
the same latitude as the Missouri areas
where Portman did his collecting, it is
passible that a certain amount of year-
round activity of ticks occurs there also.
Although a fair number of Illinois
hunters now delay their rabbit hunting
until cold weather, apparently a great
many still begin to take rabbits as soon
as the season opens, believing that the
animals will soon be thinned out and madewary by other hunters. The initial rush
greatly emphasizes the importance of the
date of opening of the season because this
is the critical period for tularemia. Nostatistics are available in Illinois showinghow much hunting is concentrated in the
early days of the season, but we estimate
that between one-third and one-half of the
year's crop is taken in the first week.In Ohio, Benjamin (1940) reported the
daily kill of rabbits in the season of 1939on 180,000 acres of state-supervised hunt-ing areas scattered through 35 counties. Aquarter of the season's total was killed onthe opening day (November 8), and bythe end of the fourth day (November 11)more than half had been killed. Inciden-tally, he found that the average daily kill
per hunter was about twice as great on theopening day as it was 3 or 4 weeks later.
Burroughs & Dayton (1941) reportedthe daily kill of cottontails on 9,000 acresin Saginaw County, Michigan, in 1938and 1939. In both seasons combined,
more than a third of the annual kill wasmade on the opening day and more than a
half by the end of the first week.
All available evidence indicates that anearly rabbit-hunting season, such as is nowin effect in Illinois, results in the handlingby hunters of approximately half of the
rabbit kill at a time when the possibility
of contracting the disease is still com-paratively great.
Although it is apparent that temper-
atures just preceding the opening of the
rabbit-hunting season play an importantpart in determining the amount of humantularemia in Illinois, the influence of
weather, as has already been suggested,
is frequently modified by another factor,
the abundance of rabbits.
Rabbit Populations and Tularemia
The tularemia rate for the whole Cen-tral Region of the United States, fig. 6,
increased from 9.8 cases per million in-
habitants in 1937 to 27.3 cases per million
in 1938 and 28.1 cases per million in 1939.
The sharp rise in the tularemia rate duringthe period 1937-1939 occurred simulta-
neously with a marked increase in the num-bers of cottontail rabbits in the CentralRegion, especially in the middle Mississippi
and the lower Missouri river basins. Sub-sequently, following a general decrease of
rabbits, the tularemia rate declined, and,
by 1942, only 6.1 cases per million werereported in that region. This apparentrelationship between the prevalence of
tularemia and the high peak of rabbit
populations emphasized the need for
further information on the behavior of
game populations.
Studies of animal populations in recent
years have shown that many kinds of ani-
mals are subject to more or less regular
variations in numbers. The snowshoe or
varying hare, Lepus americanus Erxleben,
is often cited as a classic example of ananimal that undergoes cyclic fluctuations.
MacLulich (1937) concluded from ananalysis of population data, including
records of the Hudson's Bay Companycovering more than a century, that the
cycles of the snowshoe hare in Canadahave varied in length from 8 to 11 years
and have averaged 9.6 years.
Although long-time population records,

1952 Yeatter & Thompson : Tularemia 371
such as have been used in studies of the
snowshoe hare, are lackinjj for cottontail
rabbits, records obtained by workers in
several northern states indicate that cotton-
tail populations tend to fluctuate rather
widely. This paper does not attempt to
arrive at final conclusions as to whether
Illinois cottontail rabbits have cyclic, and
thus possibly predictable, fluctuations.
Nevertheless, it seems advisable to discuss
briefly the a\ailable records of cottontail
population trends in Illinois and nearby
regions in recent years, because of the
apparent relationship of the populations to
the incidence of human tularemia.
Fig. 25 shows the annual kill of cotton-
tails in Wisconsin during the period I'^^l-
1*^49 as computed from hunters' reports to
the Wisconsin Conservation Department
(Anon\mous 1949 and personal communi-cation from W. E. Scott). Cottontail
rabbits occur throughout W^isconsin except
possibly in a narrow zone along the north-
ern border, but they are generally most
common in the southeastern counties
(Morgan 1949). The cur\e in fig. 25
probably reflects the trend of the total
Wisconsin cottontail rabbit population
during the period l'^.? 1-1 949. The trend
of cottontail populations appears to have
followed rather closely the trends of snow-
shoe hare and grouse populations in Wis-consin during the same period, as shownby Grange (1948).
Although the Illinois cottontail rabbit
population data are not so nearly complete
as the data for Wisconsin, records from the
Natural History Survey and other sources
have made possible a partial reconstruction
of the fluctuations of cottontail rabbit pop-
ulations in the state during 25 recent years.
These data include, in addition to field
notes and published records, replies of
spcjrtsmen to questionnaires, estimates of
rabbit populations in southern Illinois by
the United States Forest Service, informa-
tion received annually by the Natural
History Survey on rabbit damage to crops
and orchards, and bag records and field
notes of qualified hunter-observers. Be-
cause these data refer to different regions,
they show something of the local aspects
of population fluctuations in Illinois. Asalready indicated, local fluctuations are im-
portant in considering the relation of rabbit
abundance to human tularemia rates.
The most noteworthy feature of the
behavior of Illinois cottontail rabbit popu-lations during the quarter century was the
sharp increase in numbers during the late
1930's, culminating in 1938 and 1939 in
the highest populations in many decades.
I he increase of rabbits in Illinois was mostevident in the southern half of the state,
where the main endemic centers of tula-
remia are found. As has been mentioned,
nearly 1,000 cases of human tularemia
were reported in Illinois during 1938 and1939. Unusually high rabbit populations
during these years were reported also in
Iowa, Missouri, Kansas, Arkansas, andsome other central states, where the tula-
remia rate also showed a sharp rise. Dur-
Table 8.—Number of rabbits flushed persquare mile during pre-hunting-season jjame-
bird censuses on the .lasper County, Illinois,
study area, 4 square miles, 1936-1941.
Vear Number of RabbitsPER Square Mile
1936 4.51937 3.8
1938 11 2
1939 14 2
1940 8 5
1941 3.3
Table 9.—Number of rabbits flushed per
square mile durinj^ pre-hunting-season censuses
made by the United States Forest Service onsample areas of the Shawnee National Forest,
in southern Illinois, 1935-1949.
Year
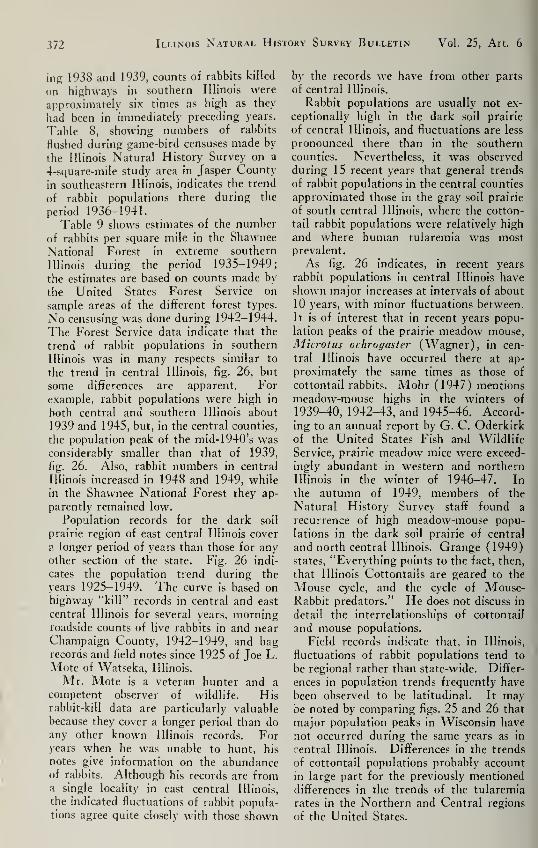
372 Illinois Natural History Survey Bulletin Vol. 25, Art. 6
ing 1938 and 1939, counts of rabbits killed
on highways in southern Illinois were
approximately six times as high as they
had been in immediately preceding years.
Table 8, showing numbers of rabbits
flushed during game-bird censuses made by
the Illinois Natural History Survey on a
4-square-mile study area in Jasper County
in southeastern Illinois, indicates the trend
of rabbit populations there during the
period 1936-1941.
Table 9 shows estimates of the number
of rabbits per square mile in the Shawnee
National Forest in extreme southern
Illinois during the period 1935-1949;
the estimates are based on counts made by
the United States Forest Service on
sample areas of the different forest types.
No censusing was done during 1942-1944.
The Forest Service data indicate that the
trend of rabbit populations in southern
Illinois was in many respects similar to
the trend in central Illinois, fig. 26, but
some differences are apparent. For
example, rabbit populations were high in
both central and southern Illinois about
1939 and 1945, but, in the central counties,
the population peak of the mid-1940's wasconsiderably smaller than that of 1939,
fig. 26. Also, rabbit numbers in central
Illinois increased in 1948 and 1949, while
in the Shawnee National Forest they ap-
parently remained low.
Population records for the dark soil
prairie region of east central Illinois cover
V. longer period of years than those for anyother section of the state. Fig. 26 indi-
cates the population trend during the
years 1925-1949. The curve is based onhighway "kill" records in central and east
central Illinois for several years, morningroadside counts of live rabbits in and nearChampaign County, 1942-1949, and bagrecords and field notes since 1925 of Joe L.
Mote of Watseka, Illinois.
Mr. Mote is a veteran hunter and a
competent observer of wildlife. Hisrabbit-kill data are particularly valuable
because they cover a longer period than doany other known Illinois records. Foryears when he was unable to hunt, his
notes give information on the abundanceof rabbits. Although his records are froma single locality in east central Illinois,
the indicated fluctuations of rabbit popula-
tions agree quite closely with those shown
by the records we have from other parts
of central Illinois.
Rabbit populations are usually not ex-
ceptionally high in the dark soil prairie
of central Illinois, and fluctuations are less
pronounced there than in the southern
counties. Nevertheless, it was observed
during 15 recent years that general trends
of rabbit populations in the central counties
approximated those in the gray soil prairie
of south central Illinois, where the cotton-
tail rabbit populations were relatively high
and where human tularemia was mostprevalent.
As fig. 26 indicates, in recent years
rabbit populations in central Illinois have
shown major increases at intervals of about
10 years, with minor fluctuations between.
It is of interest that in recent years popu-
lation peaks of the prairie meadow mouse,
Microtus ochrogaster (Wagner), in cen-
tral Illinois have occurred there at ap-
proximately the same times as those of
cottontail rabbits. Mohr (1947) mentions
meadow-mouse highs in the winters of
1939-40, 1942-43, and 1945-46. Accord-
ing to an annual report by G. C. Oderkirkof the United States Fish and Wildlife
Service, prairie meadow mice were exceed-
ingly abundant in western and northern
Illinois in the winter of 1946-47. In
the autumn of 1949, members of the
Natural History Survey staff found a
recurrence of high meadow-mouse popu-
lations in the dark soil prairie of central
and north central Illinois. Grange (1949)states, "Everything points to the fact, then,
that Illinois Cottontails are geared to the
Mouse cycle, and the cycle of Mouse-Rabbit predators." He does not discuss in
detail the interrelationships of cottontail
and mouse populations.
Field records indicate that, in Illinois,
fluctuations of rabbit populations tend to
be regional rather than state-wide. Differ-
ences in population trends frequently have
been observed to be latitudinal. It maybe noted by comparing figs. 25 and 26 that
major population peaks in Wisconsin have
not occurred during the same years as in
central Illinois. Differences in the trends
of cottontail populations probably account
in large part for the previously mentioned
differences in the trends of the tularemia
rates in the Northern and Central regions
of the United States.

1952 "Veattkr & Thompson; Tui.arkmia 373
2^00-
2,000
m 1,000
500
1932 1934 1938 1940 1942 1944 1946
Fig. 25.—The calculateii kill of cottontail rabbits per year in Wisconsin, 1931-1949.basic data for this graph are from the Wisconsin Conservation Department.
The
140
J I I I L _L J L J L
« HIGHWAY KILLS
PER 100 MILES
I I I I I L
ROADSIDE COUNTS,
, PER 1,000 MILESy
V\
A
J I L
30
25
20
1926 1928 1930 1932 1934 1936 1938 1940 1942 1944 1948
Fig. 26.—Cottontail rabbit population trends in central Illinois. 1925-1949, as indicated by
bag records, highway 'kill" counts, and roadside counts. Highway "kill" records for the
years 1930-1932 are from Flint (1934) and for 1937 from Starrett (1938). The high rabbit
populations of 1938 and 1939 were accompanied by a severe outbreak of human tularemia,
fig. 2!. Comparison of fig. 25 with tig. 26 indicates that major population peaks of rabbits did
not oixur in the same vears in Wisconsin and central Illinois.

,?74 Illinois Natural History Survey Bulletin Vol. 25, Art. 6
During periods of abnormally high
rabbit populations, warm weather pre-
ceding the opening of the hunting season
greatly increased the tularemia hazard in
Illinois. In years when rabbit populations
were unusually low, the tularemia rate
remained low even during warm autumns,
for example 1941, 1947, and 1948, fig. 24.
When rabbit populations were average,
the tularemia rate followed quite closely
the curve of the mean date of the first 10
freezing autumn nights. Moderately high
rabbit populations, such as occurred in
the middle and late 1940's and probably
in the early 1930's, brought increases in
the number of human tularemia cases, but
with these increases the disease did not
reach epidemic proportions even during
warm autumns.
Although there is evidence of more or
less regular fluctuations in numbers of
Illinois cottontails, our data do not indicate
that many of these fluctuations are violent.
The great population increase in 1938 and
1939 and the accompanying severe out-
break of human tularemia must be re-
garded as exceptional. Nevertheless,
hunters should bear in mind that a sus-
tained increase resulting in exceptionally
high rabbit populations in their hunting
areas may in turn favor a severe outbreak
of tularemia among the rabbits.
At times, tularemia may be a factor
that contributes to the decline of rabbit
numbers following population peaks.
Local tularemia outbreaks that were the
apparent cause of reduction of cottontail
populations from high to low levels have
been reported bv Waller (1940) and Hen-drickson (1943) in Iowa, Hicks (1942)in Ohio, and others. It seems safe to
assume, however, that tularemia is butone of numerous factors that contribute to
population control among cottontails.
Tularemia and the Rabbit Hunter
Green (1942) has pointed out that
tularemia is in large part a hunter's prob-lem. This observation seems applicable
to Illinois especiallv. At present, between400,000 and 500,000 licensed sportsmenhunt annually in Illinois. In addition,
many thousands of bo5's and men hunt ontheir home farms without being requiredto purchase hunting licenses. The great
majority of these people confine their
hunting entirely to upland game. Al-
though many of the Illinois hunters nowrefuse to bag cottontails for fear of con-
tracting tularemia, most of them dependlargely on rabbit hunting for their sport.
The importance of the cottontail rabbit
as a game species in Illinois will be evident
when it is considered that rabbits can be
found on virtually every square mile of
farm land in the state and in most cities
and towns, and that they are usually
present in huntable numbers through the
open season, even in intensively cultivated
districts. All other resident game species
tend to be local in distribution. Becausecottontails can be found close to home by
most Illinois hunters, which makes hunting
them a relatively inexpensive recreation,
and because they have desirable sporting
and table qualities, these rabbits in recent
years have averaged more than one-half
of the number of game animals taken an-
nually by the hunters of the state.
Cottontail rabbits have usually increased
in numbers readily under wildlife habitat
improvement programs that have been con-
ducted in Illinois. This tendency wasillustrated on the Urbana Township Wild-life Area by the marked rise of rabbit
populations, noted by the senior author,
that accompanied the growth of hedges
and blocks of shrubs and trees during the
years following planting on the area about
10 years ago. In favorable habitats, rab-
bits usually can be hunted heavily year
after year without permanent reduction of
their population levels (Pirnie 1949). In
fact, heavy hunting may be a desirable
game management measure to reduce
temporarily the population levels of rabbits
and thereby lessen the danger of epizootics.
It seems highly desirable for hunters
in Illinois and other states where rabbits
are important as game to have reliable in-
formation on how best to avoid contracting
tularemia while hunting. The medical
profession has recently made marked prog-
ress in successfully combating the disease
in man. Wildlife research workers andgame administrators in many states un-
doubtedly can contribute materially to the
solution of the tularemia problem by deter-
mining hunting practices and hunting
seasons likely to afford the greatest pro-
tection to hunters.

June, 1952 Yeatter & Thompson : Tularemia 375
Green (1942) observed that tularemia
in rabbits and hares in Minnesota wascliiefly a spring and fall disease. He foundinfection to be relatively uncommon in
tiiese animals during the summer monthsand veri, rare during the winter. On the
basis of the observed decline of tularemia
in winter, he had previously ( 1935, 1939)urged dela\" of rabbit liunting until after
the onset of cold weather.
In describing tularemia in rabbits, Green( 1942) stated, "Tularemia is a bacterial
disease ; that is, it is caused by a microbe
which can be seen under an ordinary micro-
scope. The germ can be grown in the
laborator)' and is easily recognizxd by a
trained bacteriologist. When this germinfects an animal, particularly a rabbit,
it grows in the blood stream and in all the
internal organs of the animal and produces
the disease which we call tularemia.
"\Vhen an infected rabbit is encountered
in the woods, its reactions are usually slow
and the animal appears somewhat tame.
Regardless of tularemia, it is alwa\s best
to take onlv rabbits or other wild animals
that show \igor and can be taken only withdifficulty.
"1 he typical infection as found in a
rabbit can be recognized b)' a pepperingof tiny white spots on the liver and spleen.
The white spots are abscesses caused bygrowth of the germ in those organs. Theinfection is of relati\ely short duration in
rabbits and hares, usually lasting about
seven days. Cottontail rabbits arc very
susceptible and always die; snowshoe hares
are comparatively resistant and usually
recover.
"On cleaning a rabbit, if the reddish-
brown liver or spleen is seen to be peppered
with fine white spots, the carcass should be
burned, one's hands should be repeatedly
washed with soap and water and finally,
if possible, with a disinfectant. Any cuts
on the hands should be treated with
iodine."
Inasmuch as other conditions than tula-
remia may cause spotting of the liver or
other internal organs, figs. 27 and 28, this
symptom is not conclusive e\idence of the
Fig. 27.—Lesions of tularemia on liver and spleen of a domestic raliliit, followiriK experi-
mental infection. The small white spots become visible on the liver and spleen about the third
day of illness. Photo by Nick Kramis, photographer, Rocky Mountain Laboratory, United States
Public Health Service.

376 Illinois Natural History Survey Bulletin Vol. 25, Art. 6
disease in rabbits. Fig. 27 illustrates the
characteristic appearance of the liver and
spleen of a rabbit infected with tularemia.
Tapeworm cysts are found rather fre-
quently in the muscles or attached to in-
ternal organs of Illinois cottontail rabbits.
These cysts are not related to tularemia
and are harmless unless eaten raw, but
it is better to discard an affected rabbit
rather than to try to cut out the cysts.
It should be borne in mind that rabbits
and other game may not exhibit visible
symptoms of tularemia in early stages of
the disease. Francis (1937) stated of
infected rabbits that "innumerable small
round spots [on the liver] become plainly
visible on the third or fourth day of illness,
but these spots are too small to be seen on
the first and second days of illness. There-
fore, if a rabbit is shot on the first or second
day of illness the liver, though diseased,
will appear healthy." Because it is possible
for infection to be present in apparently
healthy animals, thorough cooking of all
game is always a wise precaution. Tula-
remia contracted by humans as a result of
eating infected game that is insufficiently
cooked appears to be especially severe and
is associated with a high death rate. Cook-ing of rabbits and other game until the
bone marrow and the meat surrounding
the bones are well done eliminates any
danger of tularemia infection.
A number of organizations have advised
hunters to wear rubber gloves when han-
dling cottontails. Yeatter & Thompson(1943) have pointed out that this pre-
caution, although probably offering a de-
gree of protection, is not entirely practical
and may give a false sense of security to
hunters during tularemia epidemics. Thehunter usually is bare handed when han-
dling the gun, and during a day of hunting
receives scratches from briers or barbed
wire, or becomes chafed on the hands or
wrists. In addition, as has been mentioned,
considerable evidence indicates that in-
fection can take place through the un-
broken skin.
Although some hunters in recent years
have put on cotton or leather gloves before
picking up rabbits, they are probably in
the minority. Every shot rabbit is smeared
with blood, and, whether the animal is
Fig. 28.—Lesions of tularemia on lungs of a domestic rabbit, following experimental in-
fection. Photo by Nick Kramis, photographer, Rocky Mountain Laboratory, United States
Public Health Service.

June, 1952 Yeatter & Thompson: Tularemia .^77
carried in the hand or placed in a huntingcoat, it may come in contact with the skin.
Rubber gloves are not commonly used by
hunters in the field, and, e\en though an
attempt is made to use them while cleaning
rabbits, there are several points of danger.
The gloves may not be of sufficiently good
quality, but, more important, the average
hunter probably does not possess the train-
ing and skill required to use the gloves
without puncturing them or to remove andsterilize them without contaminating the
hands or face. Many laboratory techni-
cians and medical workers have contracted
tularemia even when all available facilities
and known protective measures have been
employed. Therefore, it is unlikely that
rubber gloves alone offer the untrained
la\man much protection.
Although it would obviously be unwise
to minimize tularemia as a hunting hazard,
it should be pointed out that publicity given
the disease by newspapers and radio has
tended to instill in the public an exag-
gerated fear of becoming infected by han-
dling wild rabbits during nonepidemic
years or during late fall or winter months.
The writers (Yeatter ik Thompson 1^43)
have stated in this regard, "Tularemia is
a serious disease and it is not our intention
to underrate it, but it has been mostly a
mental hazard since the peak years. Thedanger from car accidents and gun acci-
dents, which is considerably greater, does
not keep people from hunting. For ex-
ample, in 1942, Illinois had 67 cases and
one death from tularemia. In the same\ear Wisconsin, with almost the samenumber of licensed hunters had 109 gunaccidents and 36 deaths. Comparablefigures are not available for Illinois, but
they are probably about the same as those
for Wisconsin because 80 of the accidents
and 24 of the deaths came during the small
game season."
Hicks (1942), in recommending that
the rabbit-hunting season in Ohio be de-
la\ed until December, pointed out that
the delay in opening of the season wouldminimize the frequency of human tulare-
mia and eliminate much of the psychologi-
cal hazard which then detracted greatly
from the pleasures of hunting in Ohio.
Hunters are not likely to follow elab-
orate precautions for handling rabbits skill-
fulh enough to protect themselves from
infection with tularemia. The writers be-
lieve that Illinois hunters can most effec-
tively reduce the tularemia hazard to aminimum by delaying rabbit hunt.ng un.il
after the onset of siiarp, freezing weather.This delay is urged especially for huntersin the Central and Southern zones of the
state, where rabbit ticks presumably are
active later in the fall than in the NorthernZone. It should be remembered that
periods of exceptionalh' high rabbit popu-lations, such as occurred in Illinois in 1''38
and U'39, increase the danger of infection
and call for special measures on the part
of hunters.
Within the past decade, methods of
treating tularemia in humans have been
improved greatly, principally through the
use of antibiotics. The United States Fish
and Wildlife Service Wildlife LcaHet 271
(Anonymous 1948) stated in regard to
the use of streptom\cin in treating tulare-
mia, "Many remarkable recoveries with
few failures .... have been recorded
following the use of this agent." Recently
aureomycin and chloromycin ha\e largely
supplanted streptomycin in the treatment
of tularemia. Probably the 'ow death rate
in Illinois in recent years, table 4, reflects
the increasing use of antibiotics in treat-
.nent iif the disease.
Recommendations
Detailed analysis of weather and tula-
remia records indicates that delating tlie
opening of the rabbit season until Decem-ber is the most practical method for re-
ducing tularemia in Illinois. Recommen-dation is therefore made that the opening
date be changed to December 1 or, pref-
erably, December 8, at least in the Cen-
tral and Southern zones of the state. Theopening date in the Northern Zone might,
without serious hazard in most years, con-
tinue to be November 11. The fains to
be expected from standpoints of public
health and enjoyment of hunting seem to
far outweigh anv disadvantages that
might arise from this proposed change in
the game code. To compensate for the
dela\' of the opening date, the rabbit season
could be extended to Januarv 30.
Because of its adaptability to farm
habitats throughout Illinois, the cotton-
tail rabbit is undoubtedly our most impor-

378 Illinois Natural History Survey Bulletin Vol. 25, Art. 6
Fig. 29.
—
Illinois Natural History Survey entomologist examining wild cottontail rabbit
for external parasites.
tant game animal. There are, however,
a number of questions that need to be
answered before the best use of this gameanimal can be made. Studies of population
fluctuations should be continued, and rec-
ords of long-time censuses on areas that are
representative of the different sections of
the state should be analyzed to give better
methods for predicting population trends
and possible disease outbreaks.
Studies should be made to supplementthe investigations begun bj' Ecke (1948)for the Natural History Survey—studies
involving the degree of infestation of rab-
bits by ticks and other tularemia vectors,
fig. 29, the per cent of diseased animals,
numbers of embryos per female, numbersof broods of young per female, weights.
food, and other phases of the life cycle.
The relation of tularemia and its vectors
to rabbits, and to other wild and domestic
animals, should be further examined.
It seems evident from tularemia studies
already completed that much progress in
controlling the disease can be made byenacting legislation for confining the
hunting season to the colder months of
the year, by educating hunters to take
adequate safeguards, and by warning the
public of any significant increases in the
tularemia hazard. In event that exceptional
conditions arise, such as those in 1938 and1939, it is suggested that the Illinois De-partment of Public Health, the Illinois
Department of Conservation, and the Illi-
nois Natural History Survey, working
IJune. 1952 Yeatter & Thompson: Tularemia 379
jointly, bring such an emergency to tlie
attention of the go\ernor of the state so
that he may by proclamation defer the
opening of the rabbit-hunting season until
after the principal danger has passed.
Summary
1. An analysis of the human tularemia
records of the United States Departmentof Public Health indicates that, on the
basis of tularemia rates and seasonal in-
cidence of the disease, the United States
falls into four general regions, namely.
Northern, Central, Southern, and \\^est-
ern.
2. In a 24-year period beginning in
1926, Illinois had about twice as manyreported human tularemia cases as any
other state. The great majority of these
reported cases was among residents of the
southern half of the state.
3. The high incidence of tularemia
among hunters, their families, and others
in southern Illinois appears to be related
to the greater abundance of rabbits in that
region.
4. The human tularemia rate in anyyear in Illinois seems to he determined bothby temperatures about the time of the
opening of the rabbit season and by the
abundance of rabbits. Very high rabbit
populations increase the tularemia hazard.
5. When rabbit populations were aver-
age, the human tularemia rates followed
the curve of the mean or average date of
the first 10 freezing autumn nights. W'lien
rabbit populations were low, the tularemia
rates remained low, even during warmautumns. The most serious outbreak of
human tularemia known in the past half
century was in 1938 and 1939 when rabbit
populations were exceedingly high and the
autumns warm until well past the opening
date of the season.
6. Delay in the opening of the rabbit-
hunting season until December 1, partic-
ularly in the Central and Southern zones
of Illinois, is reconunended as the most
practical management method for reducing
the amount of human tularemia. TheNorthern Zone may, without serious haz-
ard in most years, continue to open on
November 1 1.

LITERATURE CITED
Anonymous1939. A statistical review of recent mortality and morbidity trends. 111. Dept. Pub. Health
Ed. Health Circ. 59. 31 pp.
1940. Tularaemia (rabbit fever). Reprint 2153 from U. S. Pub. Health Serv. Reps. 55
(16) : 667-70.
1941. Tularemia rate and weather. Wildlife Res. News, October, 1941:6-7. Mimeo-graphed. (Illinois Natural History Survey, Urbana.)
1948. Tularemia, an animal-borne disease. U. S. Fish and Wildlife Serv. Wildlife
Leaflet 271. 4 pp. Mimeographed.
1949. Wisconsin game kill charts 1948-1949. Wis. Cons. Dept. Mimeo. Pub. 19 pp.
Bell, J. Frederick
1945. The infection of ticks (Dermacentoy variahilis) with Pasicurelta tularensis. Jour.
Infect. Dis. 76(2) : 83-95.
Benjamin, J. R.
1940. State supervised hunting in Ohio in 1939. Ohio Wildlife Res. Sta. Release 136. 19 pp.
Mimeographed. (Ohio State University, Columbus.)
Breed, Robert S., E. G. D. Murray, and A. Parker Hitchens
1948. Bergey's manual of determinative bacteriology. (Sixth ed.) Williams and Wilkins
Company, Baltimore. 1529 pp.
Burroughs, A. L., R. Holdenried, D. S. Longanecker, and K. F. Meyer1945. A field study of latent tularemia in rodents with a list of all known naturally
infected vertebrates. Jour. Infect. Dis. 76: 115-9.
Burroughs, R. D., and Laurence Dayton
1941. Hunting records for the Prairie Farm, Saginaw County, Michigan, 1937-1939.
Jour, Wildlife Mgt. 5(2) : 159-67.
Case, H. C. M., and K. H. Myers1934. Types of farming in Illinois: an analysis of differences by areas. 111. Ag. Expt.
Sta. Bui. 403: 97-226.
Cooley, R. A.1938. The genera Dermacentor and Otocentor (Ixodidae) in the United States, with
studies in variation. U. S. Pub. Health Serv. Natl. Inst. Health Bui. 171. 89 pp.
Downs, Cora M., Lewis L. Coriell, Gifford B. Pinchot, Edward Maumenee, Alice Klauber,
S. S. Chapman, and Barbara Owen1946. The comparative susceptibility of various laboratory animals. (I in Studies on
tularemia.) Jour. Immunol. 56(3) :2I7-28.
Ecke, Dean Hobert1948. The cottontail rabbit in central Illinois. Unpublished master's thesis. University
of Illinois, Urbana.Flint, W. P.
1934. The automobile and prairie wild life. III. Nat. Hist. Surv. Biol. Notes 3. 7 pp.
Mimeographed.Francis, Edward
1921. The occurrence of tularaemia in nature as a disease of man. (I in TularaemiaFrancis 1921.) U. S. Pub. Health Serv. Reps. 36(30) : 1731-8.
1937. Sources of infection and seasonal incidence of tularaemia in man. Reprint 1799from U. S. Pub. Health Serv. Reps. 52(4) : 103-13.
Grange, Wallace Byron1948. Wisconsin grouse problems. Wisconsin Conservation Department, Madison. 318 pp.1949. The way to game abundance, with an explanation of game cycles. Charles Scribner's
Sons, New York. 365 pp.Green, Robert G.
1935. The periodic disappearance of game birds. Minn. Cons. no. 29:2-3, 19.
1939. Tularemia a common disease in wild animals. Minn. Cons. no. 67:14-6.1942. Tularemia as a hunter's problem. Cons. Volunteer 3(17):41-5. (Minnesota
Department of Conservation, St. Paul.)1943. Virulence of tularemia as related to animal and arthropod hosts. Am. Jour. Hyg.
38(3) : 282-92.
r iQ[\ 1

June, 1952 Yeatter & Thompson : Tui.ARKMiA 381
Green, R. G., C. A. Evans, and C. L. Larson
1943. A ten-year population study of the rabbit tick llarmaphysiilis leporis-palustris. Am.Jour. Hyg. 38(3) : 260-81.
Green, R. G., and J. E. Shillinger
1932. A natural infection of the sharp-tailed grouse and the rutfed grouse by Pasteuretta
tutarensis. Soc. Expt. Biol, and Med. Proc. 30:284-7.
Green, R. G., and E. M. Wade1928. Tularemia in the cat. Soc. Expt. Biol, and Med. Proc. 25:856-7.
1929. A natural infection of quail by B. tutarrnsr. Soc. Expt. Biol, and Med. Proc. 26: 626-7.
Hamilton, William J., Jr.
1943. The mammals of eastern Tnited States. Vol. 11. Comstork Publishing Company,Ithaca, New York. 432 pp.
Hendrlckson, George O.
1943. Mearns cottontail investigations in Iowa. .\mes Forester 21:59-73. (Iowa State
College, Ames.)
Hicks, Lawrence E.
1942. Rabbits ami the prevention of tularemia in Ohio. Ohio Wildlife Res. Sia. Release
176. 13 pp. Mimeographed. ( Ohio State Uni\'ersit\'. Columbus.
)
Hopla. Cluff E.
1951. Experimental transmission of tularemia by the tropical rat mite. .\m. Jour. Trop.
Med. 31(6) : 76:-83.
Jackson, James W.1946. Tularemia in Indiana including a reported industrial outbreak. Inrliana State
Board of He. 1th. (Presented at the seventy-fourth annual meeting of the .•\.P.H..'\.
11-14-46.) 19 pp. Mimeographed.
Jellison. William L.
1950. Tularemia. Geographical distribution of "deertly fever" and the biting fly, C/iiysops
Jisialii Williston. Reprint 3047 from V. S. Pub. Health Serv. Reps. 65 ( 41 ) : 1 321-9.
Jellison, W. L., Deane C. Epler, Edith Kuhns, and Glen M. Kohls
1950. Tularemia in man from a domestic rural water supply. Reprint 3045 from U. S.
Pub. Health Serv. Reps. 65(38): 1219-26.
Jellison, William L.. Glen M, Kohls. W. J. F.utler. and James A. Weaver
1942. Epizootic tularemia in the beaver, Castor lanadensis. anil the contamination of
stream water with Pusteuirlla tularensis. Am. Jour. Hyg. 36(2) : 168-82.
Jellison, W. L., and R. R. Parker
1945. Rodents, rabbits and tularemia in North America: some zoological and epiilemiological
considerations. Am. Jour. Trop. Med. 25(4 ): 349-62.
Lillie, R. D., and Edward Francis
1936. The pathology of tularaemia in other mammals. (XII in The pathology of tularae-
mia.) U. S. Pub. Health Serv. Natl. Inst. Health Bui. 167: U7-202.
MacLulich, D. A.
1937. Fluctuations in the numbers of the varying hare {l.epiis iimeriniiiiis). Toronto
Univ. Studies, Biol. Ser., 43. 136 pp.
McCoy, George W.1911. A plague-like disease of rodents. V. S. Pub. Health Serv. Bui. no. 43(2): 53-71.
McCoy, George W., and Charles W. Chapin
1912. Further observations on a plague-like disease of rodents with a preliminary note
on the causative agent Eaileiium tultirensr. Jour. Infect. Dis. 10(1) : 61-72.
McDaniels, Herbert E.
1943. Tularemia in Illinois. III. Oept. Pub. Health Eil. Health Circ. 44. 10 pP-
Mohr, Carl O.
1947. Major fluctuations of some Illinois mammal popul. tions. 111. State Acad. Sci.
Trans. 40:197-204.
Morgan, Banner Bill
1949. Tularemia in Wisconsin. Wis. /Xcad. Sci., Arts, Letters Trans. 39:1-19.
Parker, R. R., Edward A. Steinhaus, Glen M. Kohls, and William L. Jellison
1951. Contamination of natural waters and mud with I'tisteuretlii tiilarrnsis and tularemia
in beavers and muskrats in the northwestern United Stat-s. U. S. Pub. Health Serv.
Natl. Inst. Health Bui. 193. 61 pp.

382 Illinois Natural History Survey Bulletin Vol. 25, Art. 6
Philip, Cornelius B.. and Gordon E. Davis
1935. Tularemia. Observations on a strain of low initial virulence from rabbit ticks.
V. S. Pub. Health Serv. Reps. 50(28) : 909-11.
Philip, Cornelius B., Wm. L. Jellison, and H. F. Wilkins
1935. Epizootic tick-borne tularemia in sheep in Montana. Am. Vet. Med. Assn. Jour.
86, n.s. 39, (6) : 726-14.
Pirnie, M. D.
19+9. A test of hunting as cottontail control. Mich. Ag. Expt. Sta. Quart. Bui. 31(3): 304-8.
Portman, Ronald W.19+4. Winter distribution of two ectoparasites of the cottontail rabbit in Missouri. Jour.
Econ. Ent. 37(4): 5+1.
Prince, F. M., and M. C. McMahon19+6. Tularemia. Attempted transmission by each of two species of fleas: Xenopsylla
clieopis (Roths.) and Diamaniis montanus (Baker). Reprint 2689 from U. S. Pub.
Health Serv. Reps. 61(3) : 79-85.
PuUen, Roscoe L., and Byron M. Stuart
19+5. Tularemia: analysis of 225 cases. Am. Med. Assn. Jour. 129:+95-500.
Sharp, Cecil A. Z.
1939. Tularemia in Illinois. 111. State Acad. Sci. Trans. 32(2) :225-6.
Starrett, William Charles
1938. Highway casualties in central Illinois during 1937. Wilson Bui. 50(3): 193-6.
(Vol. 45, n.s., whole no. 185.)
Thompson, David H., and Ralph E. Yeatter
19+1. [Tularemia in Illinois.] Seventh Ann. Midwest Wildlife Conf. Proc. 1941:56-9.
Waller, E. F.
19+0. Tularemia in Iowa cottontail rabbits (Syl-vilagus florldanus mearnsi) and in a dog.
Vet. Student 2(2) : 54-5, 73. (Iowa State College, Ames.)Yeatter, Ralph E., and David H. Thompson
1943. Cottontails, tularemia and weather. 111. Cons. 8(4): 6-7, 36.


Recent Publications
A.—ILLINOIS NATURAL HISTORY SURVEY BULLETIN.Volume 23, Article 1.—The Caddis Flies, or Triohoptera, of Illinois. By Herbert H.
Ross. August, 1944. 326 pp., frontis. + 961 figs., bibliog., index. $1.50.
Volume 23, Article 3.—Overfishing in a Small Artificial Lake : Onized Lake near Alton,
Illinois. By George W. Bennett. May, 1945. 34 pp., frontis. + 15 figs., bibliog.
Volume 24, Article 1.—^The Mosquitoes of Illinois (Diptera, Culicidae). By HerbertH. Ross. August, 1947. 96 pp., frontis. + 184 figs., bibliog. 50 cents.
Volume 24, Article 2.—^The Leafhoppers, or Cicadellidae, of Illinois (Eurymelinae-Balcluthinae). By D. M. DeLong. June, 1948. 280 pp., frontis. + 514 figs., bibliog.,
index. $1.25.
Volume 24, Article 3.—^The Bass-Bluegill Combination in a Small Artificial Lake. ByGeorge W. Bennett. December, 1948. 36 pp., frontis. + 10 figs.
Volume 24, Article 4.—^The Pseudoscorpions of Illinois. By C. Clayton HoS. June,1949. 86 pp., frontis. + 51 figs., bibliog., index. 50 cents.
Volume 25, Article 1.—Characteristics of Residual Insecticides Toxic to the House Fly.
By Willis N. Bruce. July, 1949. 32 pp., frontis. + 14 figs., bibliog.
Volume 25, Article 2.—Effect of Permanent Flooding in a River-Bottom Timber Area.
By Lee E. Yeager. August, 1949. 32 pp., frontis. + 21 figs., bibliog.
Volume 25, Article 3.—Canada Geese of the Mississippi Flyway, with special reference
to an Illinois flock. By Harold C. Hanson and Robert H- Smith. March, 1950, 144 pp.,
frontis. + 82 figs., bibliog.
Volume 25, Article 4.—Biology of the White Crappie in Illinois. By Donald F. Hansen.August, 1951. 54 pp., frontis. + 13 figs., bibliog.
Volume 25, Article 5.—Commercial and Sport Fishes of the Mississippi River BetweenCaruthersville, Missouri, and Dubuque, Iowa. By Paul G. Barnickol and William C.
Starrett. September, 1951. 84 pp., frontis. + 15 figs., bibliog.
B.—ILLINOIS NATURAL HISTORY SURVEY CIRCULAR.32.—Pleasure With Plants. By L. R. Tehon. February, 1952. (Fourth printing, with
revisions.) 32 pp., frontis. + 9 figs.
36.—Planting and Care of Shade Trees. By J. E. Davis. September, 1947. (Thirdprinting, with additions.) 28 pp., frontis. + 20 figs.
38.—^Windbreaks for Illinois Farmsteads. By J. E. Davis. April, 1951. (Fourth print-
ing, with revisions by L. B. Culver.) 33 pp., frontis. 4- 27 figs.
39.—How to Collect and Preserve Insects. By H. H. Ross. July, 1949. 59 pp., frontis.,
+ 65 figs.
41.—How to Recognize and Control Termites in Illinois. By B. G. Berger. February,
1947. (Reprinted without text revision, April, 1950.) 44 pp., frontis. + 32 figs.
42.—Bird Dogs in Sport and Conservation. By Ralph E. Yeatter. December, 1948. 64
pp., frontis. -1- 40 figs.
43.—Peach Insects of Illinois and Their Control. By Stewart C. Chandler. December,1950. 63 pp., frontis. + 39 figs.
44.—The Drug Plants of Illinois. By Leo R. Tehon. July, 1951. 122 pp., frontis. + 262figs., index.
C—ILLINOIS NATURAL HISTORY SURVEY MANUAL.2.—Fieldbook of Illinois Land Snails. By Frank Collins Baker. August, 1939. 166 pp.,
color frontis. -1- 170 figs., 8 pis. $1.00.
3.—Fieldbook of Nativfe Illinois Shrubs. By Leo R. Tehon, December, 1942. 307 pp.,
4 color pis. + 72 figs., glossary, index. $1.25.
List of available publications mailed on request.
Single copies of Illinois Natural History Survey publications for which no price is listed
will be furnished free of charge \o individuals until the supply becomes low, after which a
nominal charge may be made. More than one copy of any free publication may be obtained
without cost by educational institutions and official organizations within the State of Illinois;
prices to others on quantity orders of these publications will be quoted upon request.
Address orders and correspondence to the ChiefIllinois Natural History Survey
Natural Resources Building, Urbana, Illinois
Payment preferably in the form of U.S. Post Office money order made out to State Treasurer of
Illinois, Springfield, Illinois, must accompany requests for publications on which a price is set.