Embed Size (px)
Citation preview

Andean Geology
ISSN: 0718-7092
Servicio Nacional de Geología y Minería
Chile
Osores, María Soledad; Folch, Arnau; Collini, Estela; Villarosa, Gustavo; Durant, Adam; Pujol, Gloria;
Viramonte, José G.
Validation of the FALL3D model for the 2008 Chaitén eruption using field and satellite data
Andean Geology, vol. 40, núm. 2, mayo, 2013, pp. 262-276
Servicio Nacional de Geología y Minería
Santiago, Chile
Available in: http://www.redalyc.org/articulo.oa?id=173927491005
How to cite
Complete issue
More information about this article
Journal's homepage in redalyc.org
Scientific Information System
Network of Scientific Journals from Latin America, the Caribbean, Spain and Portugal
Non-profit academic project, developed under the open access initiative

Andean Geology 40 (2): 262-276. May, 2013 Andean Geologyformerly Revista Geológica de Chile
www.andeangeology.cldoi: 10.5027/andgeoV40n2-a05
Validation of the FALL3D model for the 2008 Chaitén eruption using field and satellite data
*María Soledad Osores1, 2, 3, 4, Arnau Folch5, Estela Collini1, 2, Gustavo Villarosa3, 6, Adam Durant7, 8, 9, Gloria Pujol2, José G. Viramonte3, 10
1 Servicio de Hidrografía Naval, Av. Montes de Oca 2124 (1270), Ciudad Autónoma de Buenos Aires, Argentina. [email protected]; [email protected] 2 Servicio Meteorológico Nacional, 25 de Mayo 658 (1002), Ciudad Autónoma de Buenos Aires, Argentina. [email protected] Consejo Nacional de Investigaciones Cientificas y Técnicas, Av. Rivadavia 1917 (1033), Ciudad Autónoma de Buenos Aires, Argentina. [email protected]; [email protected] Comisión Nacional de Actividades Espaciales, Av. Paseo Colón 751, (1063) Ciudad Autónoma de Buenos Aires, Argentina.5 CASE Department, Edificio NEXUS I, 2a planta c/ Gran Capitán 2-4 (08034), Barcelona, Spain. [email protected] Instituto de Investigaciones en Biodiversidad y Medioambiente, Quintral 1250 (8400), Bariloche, Río Negro, Argentina.7 Department of Atmospheric and Climate Research, Norwegian Institute for Air Research, Instituttveien 18, P.O. Box 100, NO-2027
Kjeller, Norway. [email protected] Geological and Mining Engineering and Sciences, Michigan Technological University, 1400 Townsend Drive, Houghton, MI 49931, USA.9 Centre for Atmospheric Science, Cambridge University, Chemistry Department, Lensfield Road, Cambridge, CB2 1EW, UK.10 Universidad Nacional de Salta INENCO-GEONORTE, Av. Bolivia 5150 (4400) Salta, Argentina.
* Corresponding author: [email protected]
ABSTRACT. The 2008 Chaitén Volcano eruption began on 2 May 2008 with an explosive phase that injected large amounts of tephra into the atmosphere. During the first week of the eruption, volcanic ash clouds were transported for hundreds of kilometres over Argentina by the prevailing westerly winds. Tephra deposition extended to the Atlantic Ocean and severely affected the Argentinean Patagonia. Impacts included air and water quality degradation, disruption of ground transportation systems and cancellation of flights at airports more than 1,500 km apart. We use the FALL3D tephra transport model coupled with the Weather Research and Forecasting-Advanced Research Weather (WRF-ARW) meteorological model to simulate tephra fall from the 2-9 May 2008 eruptive period. Our hindcast results are in good agreement with satellite imagery and reproduce ground deposit observations. Key aspects of our analysis, not considered during syn-eruptive forecasts, are the re-initialization of each simulation with actualized meteorological forecast cycles and better constrained model inputs including column heights (inferred from reanalysis of GOES-10 imagery and nearby atmospheric soundings) and granulometric data obtained from field campaigns. This study shows the potential of coupling WRF/ARW and FALL3D models for short-term forecast of volcanic ash clouds. Our results highlight that, in order to improve forecasting of ash cloud dispersion and tephra deposition, it is essential to implement an operational observation system to measure temporal variations of column height and granulometric characteristics of tephra particles in nearly real-time, at proximal as well as distal locations.
Keywords: Chaitén eruption, FALL3D model, Ash dispersion, Ground deposition, Granulometry, Risk management.

263Osores et al. / Andean Geology 40 (2): 262-276, 2013
RESUMEN. Validación del modelo FALL3D para la erupción del Chaitén en 2008 usando datos satelitales y de campo. La erupción del volcán Chaitén se inició el 2 de Mayo de 2008 con una fase explosiva que inyectó grandes cantidades de tefra a la atmósfera. Durante la primera semana de erupción, se dispersaron nubes volcánicas por cientos de kilómetros sobre Argentina, siguiendo los vientos dominantes del oeste. El depósito de tefra se extendió hasta el océano Atlántico y afectó severamente a la Patagonia. Los impactos incluyen degradación de la calidad del aire y el agua, interrupción del sistema de transporte terrestre y la cancelación de vuelos incluso en aeropuertos a 1.500 km del volcán. Aquí se usó el modelo FALL3D de transporte y depósito de tefra con el modelo meteorológico Weather Research and Forecasting-Advanced Research Weather (WRF-ARW) para simular el período eruptivo del 2 al 9 de mayo de 2008. Los resultados obtenidos del pronóstico retrospectivo tienen una buena concordancia con las imágenes satelitales y reprodujeron las observaciones de depósito en superficie. Los aspectos claves de este análisis, no considerado durante los pronósticos contemporáneos, son la reinicialización de cada simulación con ciclos de pronósticos actualizados y condiciones iniciales del modelo más ajustadas, incluyendo alturas de columna eruptiva (inferidas a través del análisis de imágenes satelitales GOES-10 y radiosondeos cercanos) y datos granulométricos obtenidos a partir de campañas de campo. Este estudio muestra el gran potencial que tiene el acoplar el modelo WRF/ARW con el FALL3D para generar pronósticos a corto plazo de la nube volcánica. Los resultados presentados revelan que, para mejorar los pronósticos de dispersión y depósito de tefra, es esencial implementar un sistema de observación operativo con el fin de medir las variaciones temporales de la altura de columna y las características granulométricas de las partículas de tefra casi en tiempo real, tanto en lugares próximos como lejanos al volcán.
Palabras clave: Erupción del Chaitén, Modelo FALL3D, Dispersión de ceniza, Depósito en superficie, Granulometría, Manejo del riesgo.
1. Introduction
The May 2008 explosive eruption of Chaitén Volcano in southern Chile (42.83ºS, 72.65ºW, 1,122 m a.m.s.l.) was one of the most powerful eruptions in South America during the last century. The Chaitén Volcano, located ten kilometers north of Chaitén town, a small village on the Gulf of Corcovado, comprises a rhyolitic lava dome emplaced in a 2.5 km diameter caldera (Naranjo and Stern, 2004; Lara, 2009; Watt et al., 2009). Late on 1 May and early on 2 May 2008 around 04:00 local time (LT) the volcano reawak-ened after ~36 hours of increased seismic activity measured by the Chilean Southern Andean Volcano Observatory (OVDAS) of the Servicio Nacional de Geología y Minería (SERNAGEOMIN). The subsequent explosive stage of eruption comprised four main phases (Durant et al., 2012), categorized by eruption column altitude, persistence and mass discharge: 2 May (phase 1), 3-5 May (phase 2), 6 May (phase 3) and 8 May onwards (phase 4). Ash clouds from the eruption had serious impacts on aviation, agriculture and air quality in the region.
Folch et al. (2008) used the FALL3D dispersion and deposition model (Costa et al., 2006; Folch et al., 2009) to test the operational capacity to forecast ash cloud trajectories and tephra fallout during the first week of the Chaitén eruption. The model was driven by the Weather Research and Forecasting-Advanced Research Weather (WRF/ARW) mesoscale meteoro-
logical model and semi-quantitative observational inputs based on the first eruption reports. Although near real-time forecasts are extremely valuable, uncertainties in model outputs are typically large because key volcanological inputs are poorly cons-trained during an eruption. Data collected during an eruption provides an exceptional opportunity to test and validate volcanic ash transport and dispersion models (VATDM).
Here we perform a hindcast simulation for the period 2-9 May 2008 using WRF/ARW forecasts and a re-initialization of the FALL3D model every 48 hours. This strategy implies the initialization of a FALL3D run using the airborne ash concentration and deposit thickness from the previous run, and the updated WRF/ARW 72-hour forecasts. Furthermore, we use a Total Grain Size Distribution (TGSD) derived from Durant et al. (2012) and column heights that are a blend of those published in articles (Folch et al., 2008; Carn et al., 2009; Lara, 2009; Watt et al., 2009; Alfano et al., 2011a; Durant et al., 2012) and those obtained from estimations of cloud top tem-peratures derived from GOES-10 satellite imagery analysis and nearby atmospheric soundings. In this sense, this work can be viewed as an improvement of the results presented in Folch et al. (2008) which used limited observational constraints and did not re-initializate each partial hindcast run.
In this paper we briefly summarize the eruption chronology, review the configuration of the WRF-

264 Validation of the FALL3D model for the 2008 Chaitén eruption using field and satellite data.
ARW and FALL3D models, and compare new simulation results with satellite imagery, ground deposit measurements, and observations of visibility reduction by airborne ash reported at some ground-based meteorological stations.
2. Chronology of the May 2008 Chaitén Eruption
Pre-eruptive seismicity, as measured ~300 km from the volcano, started on 30 April 2008. From 1-2 May 2008 the OVDAS seismic network registered earthquakes ranging between Mw 3.2-5.2. However, the deployment of the OVDAS seismic stations far away from the source, and the fact that Chaitén had been dormant for a long period of time (the volcano was unmonitored), caused uncertainty with regard to the location of the seismic activity. A brief chronology of the eruption during the first week of activity is as follows (additional information is given in Table 1 and in Major and Lara, 2013, this volume):• Theeruptionbegan lateon1May23:38LT
with minor ash emissions and a violent explo-sion (phase 1) occurring at around 08:00 UTC (LT=UTC-4) on 2 May. The explosion lofted an eruption column approximately 20 km above mean sea level (a.m.s.l.) according to eyewitnesses (Lara, 2009). Although the eruption plume was detected from GOES-10 IR images, the ash-cloud top was estimated at only about 12 km a.m.s.l (Carn et al., 2009). During the day there were two distinct ash cloud trajectories: a low level cloud with a trajectory directed SSE; and a high altitude cloud deflected NNW in association with anticyclonic wind circulation (anticlockwise sense in the southern hemisphere). Volcanic ash fallout severely affected the cities of Futaleufú (Chile, 70 km from Chaitén) and Esquel (Argentina, 110 km from Chaitén) (Fig. 1); minor ash deposition also occurred across Argentinean Patagonia up to the Atlantic Ocean.
• On3Mayseismicitydeclinedabruptly(Lara,2009), the eruption column had an estimated height of 10 km or less (Watt et al., 2009; Carn et al., 2009; Alfano et al., 2011a) and the ash cloud was dispersed SE. During the afternoon of 4 and 5 May the volcanic cloud dispersed eastward. This period (3-5 May) comprises phase 2 of the eruption.
• Ataround12:00UTCon6Mayenergeticexplo-sive activity elevated the eruption column up to
30 km according to eyewitnesses (Folch et al., 2008; Watt et al., 2009; Carn et al., 2009), but only to 20 km according to satellite images (Carn et al., 2009; Alfano et al., 2011a). This reinvi-gorated activity marked the beginning of phase 3. A second burst with lower intensity occurred at around 19:00 UTC according to GOES-10 imagery. Both during and after these bursts in column height ash was dispersed NE.
• By8-9May,theeruptioncolumnhadaheightofabout 8 km a.m.s.l. (SERNAGEOMIN, 20081) except for a short-duration burst at 03:30 UTC on 8 May, which rose to 20-22 km (Carn et al., 2009). This waning explosive activity signaled the beginning of phase 4. During this period, ash was dispersed mainly NE, but shifted to a more ESE trajectory on 9 May. The Cloud-Aerosol Lidar with Orthogonal Polarization (CALIOP) instrument detected volcanic aerosols from a minor column burst to about 13 km (Carn et al., 2009). During 8 May the presence of ash between 3 and 10 km altitude was reported at Buenos Aires (Folch et al., 2008) (Fig. 1). After this last burst, explosive eruptive activity diminished significantly.
3. Modelling strategy
3.1. Meteorological modeling using WRF/ARW
Meteorological fields were derived using the numerical weather prediction model Weather Re-search and Forecasting-Advanced Research Weather (WRF/ARW) (Michalakes et al., 2005). We ran the WRF/ARW numerical model every 72 hours using 6-hour initial and boundary conditions from the 12:00 UTC forecast cycle of the 1 degree Global Forecast System (GFS) produced by the National Centers for Environmental Prediction (NCEP). The GFS is a global meteorological model that runs four times a day, which is initialized with an analysis updated by the assimilation of meteorological data from the Global Telecommunications System (GTS).
The WRF-ARW meteorological model domain spanned from 52ºS-32ºS and 77ºW-53ºW (Fig. 1), with horizontal resolution of 12 km (~0.11°) and 38 vertical pressure layers. Forecasts were generated out to 72 hours at 3-hour increments. The physical parameterizations used in the WRF-ARW model are similar to those employed by Folch et al. (2008). These include the single-moment 3-class microphysics
1 SERNAGEOMIN. 2008. Erupción del volcán Chaitén. Servicio Nacional de Geología y Minería (SERNAGEOMIN), Quinto Informe Técnico (Inédito), 09 de mayo de 2008: 2 p.

265Osores et al. / Andean Geology 40 (2): 262-276, 2013
Table 1. erupTion chronology for The May 2008 erupTion of chaiTén volcano, chile (reproduced froM duranT et al., 2012).
phase date Time (uTc) observation cloud height (location) Measurement source reference
1 2 May 08 08:00-14:00 Morning
Initial explosive ash columnEarly column activityStratospheric cloud height
>21 km (Chaitén Volcano) 10.7-16.8 km12 km
Visual observation (PIREP)Visual observation (SGVP)GOES imagery
(Carn et al., 2009; Folch et al., 2008)(Folch et al., 2008)(Carn et al., 2009)
2 3 May 20083-5 May 20083-4 May 2008
18:15--
Explosive ash columnSustained explosive ash emissionFine volcanic ash and/or ice crystals
17.4-19.6 km<10 km (Chaitén Volcano)~12 km (30ºS)
Visual observation (clinome-ter)CALIOP / OMI-
G. Villarosa(Watt et al., 2009)(Carn et al., 2009)
3 6 May 20086 May 20087 May 20087 May 20087 May 2010
12:00*13:30*20:00:00--
Initial explosive ash columnInitial explosive ash columnIncrease in eruption intensityEruption columnAsh / ice-coated ash cloud
30 km (Chaitén Volcano)30 km (Chaitén Volcano)-7-10 km~16 km (41º-42ºS)
-Visual observation (ONEMI)-CALIOP-
(Carn et al., 2009)(Folch et al., 2008)(Folch et al., 2008)(Folch et al., 2008)(Thomason and Pitts, 2008)
4 8 May 20088 May 20089 May 2008
03:30--
Initial explosive ash eruptionAirborne ashVolcanic aerosol
20-22 km (Chaitén)3-10 km (Buenos Aires)13 km
GOES imagery-CALIOP
(Carn et al., 2009)(Folch et al., 2008)(Carn et al., 2009)
CALIOP Cloud-Aerosol Lidar with Orthogonal Polarization (on Cloud-Aerosol Lidar and Infrared Pathfinder Satellite Observations platform).
GOES Geostationary Operational Environmental Satellite
OMI Ozone Monitoring Instrument
ONEMI Oficina Nacional de Emergencia del Ministerio del Interior (National Office of Emergency of the Interior Ministry, Chile)
PIREP Pilot report
SGVP Smithsonian Global Volcanism Program
* These reports conflict on the time of onset of the initial activity of Phase 3

266 Validation of the FALL3D model for the 2008 Chaitén eruption using field and satellite data.
scheme (Hong et al., 2004), the Kain-Fritsch cumulus scheme (Kain and Fritsch, 1990), the Noah Land-Surface model (Skamarock et al., 2008), the Yonsei University Planetary Boundary Layer (PBL) scheme (Hong et al., 2006), the Rapid Radiative Transfer Model (RRTM) long wave radiative model (Mlawer et al., 1997), and a short-wave radiative model by Dudhia (1989). These parameterizations are expressions of processes from scales that are not explicitly solved by the WRF-ARW model. They are included owing to their strong influences on the meteorological fields.
3.2. Volcanic Ash Transport and Deposition modelling
We used the FALL3D Eulerian model (Costa et al., 2006; Folch et al., 2009) to simulate tephra dispersion and deposition. This model uses 4D (time and space) meteorological fields and volcanological inputs to produce temporal predictions of airborne ash con-centration, ash cloud mass loading, and tephra fallout load. The FALL3D computational domain considered here(Fig.1)hasa0.06ºhorizontalresolution(≈6kmalong a meridian) and vertical resolutions of 0.5 km below and 1 km above the Planetary Boundary Layer (PBL). Volcanological inputs required by the model include column height, TGSD, Mass Eruption Rate
(MER), and vertical distribution of mass. Eruption column heights used in the simulation (Table 2) were obtained from Folch et al. (2008), Watt et al.
FIG. 1. Weather Research and Fore-casting-Advanced Research Weather (WRF-ARW) model domain, centred at 42.5ºS, 65ºW (large square) and FALL3D model domain (inner square). The black triangle indicates the location of the Chaitén Volcano. The cities of Esquel, Futaleufú, Chaitén and Buenos Aires are indicated (grey dots).
TABLE 2. COLUMN HEIGHTS (IN M ABOVE MEAN SEA LEVEL) USED DURING THE HINDCAST SIMULATIONS (FROM 2 MAY 08:00 UTC TO 9 MAY 00:00 UTC).
Date Hour (UTC) Height (m)
5/2/2008 8:00 13,000
5/2/2008 14:00 11,000
5/2/2008 16:00 10,000
5/2/2008 17:00 8,000
5/2/2008 19:00 10,000
5/2/2008 20:00 8,000
5/4/2008 12:00 14,000
5/5/2008 17:00 9,000
5/6/2008 13:00 22,000
5/6/2008 15:00 8,000
5/6/2008 19:00 10,000
5/7/2008 1:00 6,000
5/8/2008 5:00 12,000
5/8/2008 6:00 8,000

267Osores et al. / Andean Geology 40 (2): 262-276, 2013
(2009), Lara (2009), Carn et al. (2009) and Durant et al. (2012). They are based on eyewitnesses and satellite imagery and were refined during the major eruptive pulses using GOES-10 IR images available in ~15 minutes period.
TGSD was estimated from field data presented in Durant et al. (2012). We consider two different granulometries for the major eruptive phases, one during the 2-5 May period and the other during 6-9 May. The discretization of both TGSDs assumes 11 binsrangingfrom1Ф(0.5mm)to11Ф(0.5μm),and a linear dependency of particle density with diameter, with values of 970 and 1,226 kg/m³ for the two end-members (Watt et al., 2009). Particle sphericity, which is the ratio of the surface area of a sphere having a diameter equivalent to the particle diameter to the surface area of the particle, is assu-med constant and equal to a standard value of 0.9 (Alfano et al., 2011b). The resulting histograms of particle grain size distribution are shown in figure 2.
In order to quantify the mass eruption rate and mass distribution in the eruptive clouds we used the 1D radially averaged Buoyant Plume Theory (BPT) model (Bursik, 2001; Carazzo et al., 2008). This source term model solves for MER and vertical distribution of mass given the column height and plume mixture conditions at the vent. We assumed a mixture exit velocity of 200 m/s and a temperature of 850ºC.
The FALL3D model was configured with the Ganser (1993) terminal fall velocity model, and it
computed the horizontal diffusion as in the CMAQ model (Byun and Ching, 1999). For simplicity, ash aggregation effects were not considered. Numerical weather prediction error grows as lapse time increases. Therefore, the FALL3D model was restarted every 48 hours to include updated 72 hourly WRF/ARW forecasts so that the model maintained memory of the previous airborne ash concentration and deposit thickness. In each partial run, the meteorological driver is shifted by 12 hours to allow sufficient spin-up. The final simulations are obtained by concatenating 48 hours forecasts from 1 May at 12:00 UTC to 9 May at 00:00 UTC.
4. Results and Model Validation
4.1. Comparison with Satellite Retrievals
Passive remote sensing uses energy emitted by the sun or the surface of Earth to infer the presence of gases and particles in the atmosphere. Using a ra-diative transfer model and information on the spectral refractive indices of target gases or particles (e.g., water, ice, silicate ash, and SO2), retrieval schemes have been devised to determine the mass loading of gases and particles and a measure of their optical depth. Ash mass loadings and an estimate of the effective particle size are routinely retrieved through exploitation of ‘reverse absorption’ in the thermal in-frared (TIR) between wavelengths of 8-12 µm (Prata, 1989). When satellite radiance data are calibrated
FIG. 2. Total Grain Size Distributions (TGSDs) used in the simulations of ash dispersal during the 2-5 May 2008 (red) and 6-9 May 2008 (pink) explosive periods of the Chaitén eruption. Granulometries have been estimated after Durant et al. (2012) and are based on field measurements done at distances >80 km during the first week of the eruption.

268 Validation of the FALL3D model for the 2008 Chaitén eruption using field and satellite data.
and converted to temperature, a colder volcanic ash cloud over the warmer surface of the Earth satisfies the following condition:
BTD = T11-T12< 0 K,
where BTD is the brightness temperature difference, and T11 and T12 are brightness temperatures (Kelvin) at 11 and 12 µm, respectively. This algorithm is also known as the split window method, we used this technique with MODIS sensor images and selected a threshold value below -0.2 K, using a color en-hancement for the negative values, to indicate the presence of ash.
It is well known that this technique has limita-tions (Prata et al., 2001) related to uncertainty in the refractive index of the cloud particles, particle shape, and the presence of meteorological clouds. However, in most of instances this technique discriminates water clouds from ash clouds. Thus, this technique has been used to compare the observed location of the ash cloud with the simulated location.
In order to compare model results against BTD imagery we use the cloud column mass (vertical integration of tephra mass, in t/km2). According to the BTD image, on 2 May at 13:45 UTC the ash cloud was dispersed SE before it split in two branches, one continuing SE and the other NE. The model simulated this split trajectory reasonably well (Fig. 3a), but it predicted a smaller extension for the SE branch and a larger extension for the NE branch. In contrast, the more distal BTD signal (light blue contour in Fig. 3a) was not reproduced by the model. This could be explained by errors in the model source term (e.g., the occurrence of initial light eruption pulses not introduced in the model inputs).
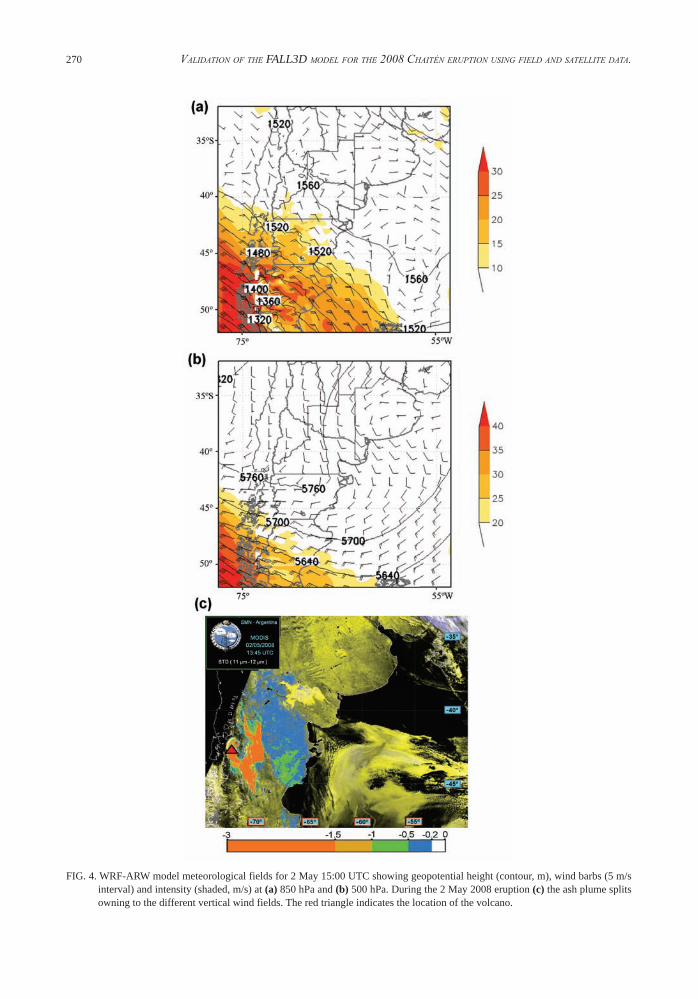
During 2 May the plume was mainly directed to NE. The WRF-ARW forecast shows that the 500 hPa (~5.5 km) wind field had an anticyclonic (counter clockwise) rotation around the source region consistent with the NE dispersal indicated by the BTD image. Simultaneously, the 850 hPa (~1.5 km) wind field over northern Patagonia blew at lower speed toward the SE in accordance with the SE branch of the ash cloud (Fig. 4). Late on 2 May the wind rotation over Patagonia produced a shift of the volcanic plume to the SE and that trajectory lasted until late on 4 May.
On 3 May the comparison between the modeled column mass and the BTD image at around 15:00
UTC shows a good agreement with cloud dispersion directed SE. The deflection of the plume to the NW at around 60ºW is related to the wind shift mentio-ned above. The presence of clouds on 4 May made it difficult to detect the ash plume using the BTD algorithm, but the FALL3D model results indicate a SE dispersion. On 5 May, the plume was dispersed mainly to the E over the continental area, and then to SE over the ocean (Fig. 3c). The values of the BTD image between -0.5 K and -0.2 K over northern Patagonia, however, are not captured by the model, which does not predict mass in this region. This difference may be explained by local remobilization of ash by wind, or inadequate model diffusion.
On 6 May the plume was initially dispersed to SE, but at around 06:00 UTC, it shifted to the NE and persisted on that trajectory until early on 8 May. The burst of eruption that occurred on 6 May at around 12:00 UTC, resulted in the maximum model column mass that moved during the following hours. The comparison of the BTD image at 19:15 UTC on 6 May with the model column mass shows a good correspondence (Fig. 3d) despite the fact that the location of the maximum mass in the simulations is shifted west with respect to the maximum BTD ash signal, which is located over the Valdes Peninsula of Argentina (Fig. 1, 3d). South of 43°S the ash cloud was not properly modeled.
On 7 May the plume detected over the northern part of Patagonia compares well with the modeled plume over that region. However, differences exist over Buenos Aires and La Pampa region (Fig. 1), with the BTD image showing a weak signal of ash E of Buenos Aires even though ash was visible in the MODIS true color image (not shown). In this case, the weakness of the BTD signal may be explained by the thinness of the plume and small size of the airborne particles.
4.2 Comparison with the Fallout Deposit
During the first week of the eruption (2-9 May) multiple lobes of fallout deposit were formed from differing plume trajectories. Figure 5 shows the daily depositional lobes predicted by the model. On 2 May the fallout deposit covered an area whose width encompassed an angle of approximately 45° but because wind intensity was low, the resulting lobe did not reach great distances. On 3 May, stronger winds produced a narrower and more elongated SE

269Osores et al. / Andean Geology 40 (2): 262-276, 2013
FIG. 3. Comparison between FALL3D column mass (in t/km2) (left) and Brightness Temperature Difference (BTD) (in K) (right). The red triangle indicates the location of the Chaitén Volcano. Results for a: 2 May, 14:00 UTC; b: 3 May, 15:00 UTC; c: 5 May, 14:00 UTC; and d: 6 May, 19:00 UTC.
270 Validation of the FALL3D model for the 2008 Chaitén eruption using field and satellite data.
FIG. 4. WRF-ARW model meteorological fields for 2 May 15:00 UTC showing geopotential height (contour, m), wind barbs (5 m/s interval) and intensity (shaded, m/s) at (a) 850 hPa and (b) 500 hPa. During the 2 May 2008 eruption (c) the ash plume splits owning to the different vertical wind fields. The red triangle indicates the location of the volcano.

271Osores et al. / Andean Geology 40 (2): 262-276, 2013
directed lobe that almost reached the Atlantic Coast. On 4 May, a similarly SE directed wind combined with an increase of the column height (Table 2) produced a larger lobe that reached the Gulf of San Jorge in the Atlantic Ocean (Fig. 1). From 5-8 May the anticyclonic wind rotation caused deposition of ash along two major lobes: one directed ESE and the other NE. As a result of the overlap of tephra fallout from different eruptive pulses and wind directions, we identified three main depositional axes directed NE, ESE, and SE respectively. Simulated deposit thicknesses for 2-9 May compare favorably with the isopach map of Watt et al. (2009) based on measure-ments of fall deposit taken approximately one month after the beginning of the eruption (Fig. 6).
The differences between simulated and actual deposition are particularly evident at the tip of the ESE deposit lobe. These differences can be explained by insufficient wind resolution in that particular location, the occurrence of local ash remobilization, and/or insufficient sampling. On the other hand, substantial differences occur also in the proximal-medial distances (less than about 100 km from the volcano), where the model largely underestimates deposit thickness with respect to observations. Model underestimation of thickness at distances closer to the volcano could be expected given the use of a fine-skewed TGSD (particles larger than 0.5 mm are not considered in our hindcast simulations). Also because the model does not include aggregation, the mass of fine ash deposited close to the volcano can be greatly underestimated. However,
as expected, the hindcast results present a much better fit to field data than those presented in Folch et al. (2008) (Fig. 6c). The better fit of our results owes to improved constraints on input parameters, namely the time-dependent eruption column height and MER, and two distinct field-based TGSDs. In addition, our hindcast simulation involved a re-initialization of the FALL3D model every 48 hours using actualized meteorological forecast cycles.
4.3 Comparison with Visibility Observations at Meteorological Stations
During the Chaitén eruption, some of the meteo-rological stations of the surface synoptic observation (SYNOP) network of the Argentinean National Meteorological Service (SMN) registered episodes of visibility reduction due to airborne ash. Visibility reduction is the result of the scattering and absorption of light by particles and gases in the atmosphere. The volcanic ash particles as well as sulfates, nitrates, organic carbon, and soil dust among others can significantly affect visibility.
Here we compare daily observations of visibility reduction at the surface with the ash concentration that is explicitly predicted by the model at the first vertical level (100 m above terrain). This compa-rison allows us to discern if visibility reduction by the presence of airborne ash correlates with the ash concentration thresholds for flight safety established in Europe during the 2010 Eyjafjallajökull eruption
FIG. 5. Modelled deposit thickness (0.1 cm contours) for different days of May 2008: 2 (red), 3 (light blue), 4 (orange), 5 (light magenta), 6 (green), 7 (light purple) and 8 (black).

272 Validation of the FALL3D model for the 2008 Chaitén eruption using field and satellite data.
FIG. 6. a: Isopachs (in cm) at the end of the hindcast simulation (9 May 2008); b: Isopach map after Watt et al. (2009) (adapted from Durant et al., 2012). Dots indicate sampling locations by Watt et al. (2009) (black) and Durant et al. (2012) (red). Dashed contours are contours inferred by Watt et al. (2009); c: Isopach at the end of the forecast simulation (9 May 2008) provided by Folch et al. (2008).

273Osores et al. / Andean Geology 40 (2): 262-276, 2013
in Iceland, i.e., more than 2 mg/m3 for the no-fly zone (IVATF/2-DP/02, 2011; SN-2011/004, 2011). Figure 7 shows modeled near-ground ash concen-trations overlapped with the meteorological stations that registered a reduction of visibility caused by the presence of ash at the same time.
On 5 May at 21:00 UTC the contour for near-surface ash concentration of 2 mg/m3 traverses the continental area in an easterly direction (Fig. 7a). At that time, only one of the four stations that registered
reduced visibility lay within the high concentration zone and two lie only slightly north of it (small errors in forecasted winds and model diffusion can explain the lack of overlap). The fourth station, located on the Gulf of San Jorge coast, probably registered residual ash from the passage of a plume hours before.
On 6 May at 18:00 UTC, following the eruptive pulse at 12:00 UTC, six surface stations registered reduced visibility (Fig. 7b). Four of these are within
FIG. 7. Comparison between simulated near-ground ash concentration (2 mg/m3 contour) and surface meteorological stations that registered (X) or did not register (O) reduced visibility by ash. Results for (a) 5 May at 21:00 UTC, (b) 6 May at 18:00 UTC, and (c) 8 May at 12:00 UTC.

274 Validation of the FALL3D model for the 2008 Chaitén eruption using field and satellite data.
the zone of predicted high concentration. At 12:00 UTC on 8 May (Fig. 7c), the plume was directed NE and many of the SYNOP network stations registered the presence of airborne ash, even as far away as in Buenos Aires (~1,500 km from the volcano).
In general, the modeled near-ground concentra-tion contour of 2 mg/m3 agrees with the records of reduced surface visibility, although some stations that registered the presence of ash lay out of the critical area. This comparison suggests that the visual detection of ash could be related to the critical concentration threshold of 2 mg/m3, but in some cases the source could be local resuspension of ash. Further research on this subject is necessary in order to determine whether visual observations can be used effectively for aviation safety purposes at airports.
5. Summary and Conclusions
We simulated dispersion and deposition of the Chaitén ash plume during 2-9 May 2008 explosive phase of eruption using the Weather Research and Forecasting-Advanced Research Weather (WRF/ARW) - FALL3D modeling system. The strategy adopted here considered the initialization of the FALL3D model every 48 hours using the previously predicted airborne ash concentration and deposit thickness, combined with updated WRF/ARW 72 hours forecasts as the meteorological driver.
Qualitative comparisons with MODIS imagery allowed us to assess the degree of concordance between the simulated plume locations and the MODIS images processed with the brightness tem-perature difference (BTD) algorithm. Differences between simulations and observations may result from inadequate treatment of diffusion, the coarse horizontal and vertical model resolution (from 0.5 to 1 km in the vertical), inaccurate Total Grain Size Distribution (TGSD) or the resuspension of fine ash.
Comparison of model deposit thicknesses with an isopach map extracted from Watt et al. (2009) shows a good general agreement. Some features of the fallout deposits were not reproduced by the simulations. For example the tips of the deposit lobes and the secondary deposit maxima attributed to aggregation processes were not reproduced. Nevertheless, results substantially improve upon the forecast of Folch et al. (2008), in which a syn-eruptive forecast was performed using a seven day
WRF-ARW forecast (the FALL3D model was not reinitialized with actualized meteorological fields) and large uncertainties arising from volcanological inputs produced larger errors. Improvements in the results arise from better constraints on eruption co-lumn heights determined from GOES-10 IR images (available every ~15 minutes for the period of study) and nearby atmospheric soundings. Field-based distal TGSDs obtained during the first days of the eruption by Durant et al. (2012) helped constrain patterns of the distal deposits. However proximal deposits were underestimated because of the fine skewed TGSDs used here.
Qualitative comparison of visibility reduction at ground stations with modeled near-ground ash concentration (using a concentration threshold equal to the 2 mg/m3 no-fly threshold defined in Europe in 2010) show that surface visibility reduction might be related to forecasted concentrations above 2 mg/m3. However it is necessary to discriminate the origin of the suspended near-ground volcanic ash and further studies are necessary to determine the utility of this approach for the prediction of visibility reduction.
This work shows the usefulness of the combined WRF/ARW-FALL3D modelling system for short-term forecasting and hindcasting of volcanic ash clouds. However, it also highlights the necessity of obtaining reliable quasi real-time measurements of column heights and accurate granulometries, which in South America at least can only be the result of enhanced transnational collaboration.
AcknowledgmentsThis work has been partially funded by Spanish Re-
search Project ATMOST (CGL2009-10244), the Programa Iberoamericano de Ciencia y Tecnología para el Desarrollo (CYTED) thematic network CENIZA (410RT0392), and the Consejo Nacional de Ciencia y Técnica (CONICET), Argentina. A. Folch is grateful to the Ramón y Cajal scientific program, Spain. Simulations have been done at the facilities of the Barcelona Supercomputing Center (BSC-CNS) using the MareNostrum supercomputer. The WRF/ARW-FALL3D modelling system was implemen-ted in a cluster installed at the Servicio Meteorológico Nacional (SMN) with funds from the Argentinean project Programa de Investigación y Desarrollo para la Defensa 41/10 (PIDDEF 41/10), which also support partly this research. J. Viramonte and G. Villarosa are grateful to CONICET for the Special Grant for the Chaitén Eruption
275Osores et al. / Andean Geology 40 (2): 262-276, 2013
study. The comments from two anonymous referees improved the early version of this manuscript.
References
Alfano, F.; Bonadonna, C.; Volentik, A.; Connor, C.; Watt, S.; Pyle, D.; Connor, L. 2011a. Tephra stratigraphy and eruptive volume of the May, 2008, Chaitén eruption, Chile. Bulletin of Volcanology 73 (5): 613-630.
Alfano, F.; Bonadonna, C.; Delmele, P.; Costantini, L. 2011b. Insights on tephra settling velocity from mor-phological observations. Journal of Volcanology and Geothermal Research 208 (3-4): 86-98.
Bursik, M. 2001. Effect of wind on the rise height of volcanic plumes Geophysical Research Letters 28 (18): 3621-3624.
Byun, D.; Ching, J. (editors). 1999. Science Algorithms of the EPA Model-3 Community Multiscale Air Quality (CMAQ) Modeling System EPA/600/R-99/030, Office of Research and Development. United States Environ-mental Protection Agency: 727 p. Washington D.C.
Carazzo, G.; Kaminski, E.; Tait, S. 2008. On the rise of turbulent plumes: Quantitative effects of variable entrainment for submarine hydrothermal vents, terrestrial and extra terrestrial explosive volcanism. Journal of Geophysical Research 113 (B09201). doi:10.1029/2007JB005458.
Carn, S.A.; Pallister, J.S.; Lara, L.; Ewert, J.W.; Watt, S.; Prata, A.J.; Thomas, R.J.; Villarosa, G. 2009. The Unexpected Awakening of Chaitén Volcano, Chile. Eos Transactions American Geophysical Union 90 (24): 205-206.
Costa, A.; Macedonio, G.; Folch, A. 2006. A three-dimen-sional Eulerian model for transport and deposition of volcanic ashes. Earth and Planetary Science Letters 241: 634-647.
Durant, A.; Villarosa, G.; Rose, W.I.; Delmelle, P.; Prata, A.J.; Viramonte, J.G. 2012. Long range volcanic ash transport and fallout during the 2008 eruption of Chaitén Volcano, Chile. Physics and Chemistry of the Earth 45-46: 50-64.
Dudhia, J. 1989. Numerical study of convection observed during the winter monsoon experiment using a mesoscale two-dimensional model. Journal of the Atmospheric Sciences 46: 3077-3107.
Folch, A.; Costa, A.; Macedonio, G. 2009. FALL3D: a computational model for volcanic ash transport and deposition. Computers and Geosciences 35 (6): 1334-1342.
Folch, A.; Jorba, O.; Viramonte, J. 2008. Volcanic ash forecast-application to the May 2008 Chaitén eruption. Natural Hazards and Earth System Sciences 8: 927-940.
Ganser, G. 1993. A rational approach to drag prediction spherical and non-spherical particles. Powder Tech-nology 77: 143-152.
Hong, S-Y; Noh, Y.; Dudhia, J. 2006. A New Vertical Diffusion Package with an Explicit Treatment of Entrainment Processes. Monthly Weather Review 134: 2318-2341.
Hong, S-Y.; Dudhia, J.; Chen, S-H. 2004. A revised ap-proach to ice-microphysical processes for the bulk parameterization of cloud and precipitation. Monthly Weather Review 132: 103-120.
Kain, J.; Fritsch, J. 1990. A one-dimensional entraining/ detraining plume model and its application in con-vective parameterization. Journal of the Atmospheric Sciences 47: 2784-2802.
Lara, L. 2009. The 2008 eruption of the Chaitén Volcano, Chile: a preliminary report. Andean Geology 36 (1): 125-129.
Major, J.J.; Lara, L.E. 2013. Overview of Chaitén Volcano, Chile, and its 2008-2009 eruption. Andean Geology 40 (2): 196-215.
Michalakes, J.; Dudhia, J.; Gill, D.; Henderson, T.; Klemp, J.; Skamarock, W.; Wang, W. 2005. The Weather Research and Forecasting Model: Software architecture and performance. In Proceedings of the 11th European Centre for Medium-Range Weather Forecasts (ECMWF)Workshop on the Use of High Performance Computing in Meteorology (Zwiefho-fer, W.; Mozdzynski, G.; editors). World Scientific: 156-168.
Mlawer, E.; Taubman, S.; Brown, P.; Iacono, M.; Clough, S. 1997. Radiative transfer for inhomogeneous at-mosphere: RRTM, a validated correlated-k model for the longwave. Journal of Geophysical Research 102: 16663-16682.
Naranjo, J.A.; Stern, C.H. 2004. Holocene tephrochro-nology of the southernmost part (42°30’-45°S) of the Andean Southern Volcanic Zone. Revista Geológica de Chile 31 (2): 225-240.
Prata, A.J. 1989. Observations of volcanic ash clouds in the10-12μmwindowusingAVHRR/2data.In Inter-national Journal of Remote Sensing 10 (4-5): 751-761.
Prata, F; Bluth, G.; Rose, B.; Schneider, D.; Tupper, A. 2001. Failures in detecting volcanic ash from a satellite-based technique-Comments. Remote Sensing of Environment 78 (3): 341-346.
Skamarock, W.C.; Klemp, J.B.; Dudhia, J.; Gill, D.O.; Barker, D.M.; Duda, M.G., Huang, X.; Wang, W.; Powers, J.G.A. 2008. A description of the Advan-ced Research WRF Version 3. National Center for

276 Validation of the FALL3D model for the 2008 Chaitén eruption using field and satellite data.
Atmospheric Researc Technical Note, NCAR/TN-475+STR: 113 p.
SN-2011/004, 2011. Guidance Regarding flight Opera-tions in the vecinity of Volcanic Ash. Civil Aviation Authority: 19 p.
Thomason, L.W.; Pitts, M.C. 2008. CALIPSO observa-tions of volcanic aerosol in the stratosphere. In Lidar Remote Sensing for Environmental Monitoring, No. 9
(Upendra, N.S.; Kazuhiro, A.; Achuthan, J.; editors). Proceedings of the SPIE 7153: 71530O-71530O-8. doi:10.1117/ 12.804090. New Caledonia.
Watt, S.F.L.; Pyle, D.M.; Mather, T.A.; Martin, R.S.; Matthews, N.E. 2009. Fallout and distribution of volcanic ash over Argentina following the May 2008 explosive eruption of Chaitén, Chile. Journal of Geophysical Research 114 (B04207). doi:10.1029/2008JB006219.
Manuscript received: November 01, 2011; revised/accepted: December 26, 2012; available online: February 01, 2013.