Embed Size (px)
Citation preview

AAAnnndddhhhrrraaa PPPrrraaadddeeessshhh PPPrrrooofff iii llleee
0
Andhra Pradesh
State Profile
2015-16
Compiled by
MSME-DI (Br) F-19 to 22, D Block
Autonagar, Visakhapatnam 530012
Ph: 0891-2517942, email: [email protected]
AAAnnndddhhhrrraaa PPPrrraaadddeeessshhh PPPrrrooofff iii llleee
1
Contents
S. No Topic Page No.
1 Andhra Pradesh at a glance 3-7
2 Physical features and Demographic particulars
8-10
3 Agriculture and Allied activities in the State
11-13
4 Mineral deposits and mining activity 14-16
5 Infrastructure 17-20
6 Industrial Infrastructure & Policy 21-23
7 Industrial scenario in AP 24-27
8 State Economy 28-30

AAAnnndddhhhrrraaa PPPrrraaadddeeessshhh PPPrrrooofff iii llleee
2
Map of AP
AAAnnndddhhhrrraaa PPPrrraaadddeeessshhh PPPrrrooofff iii llleee
3
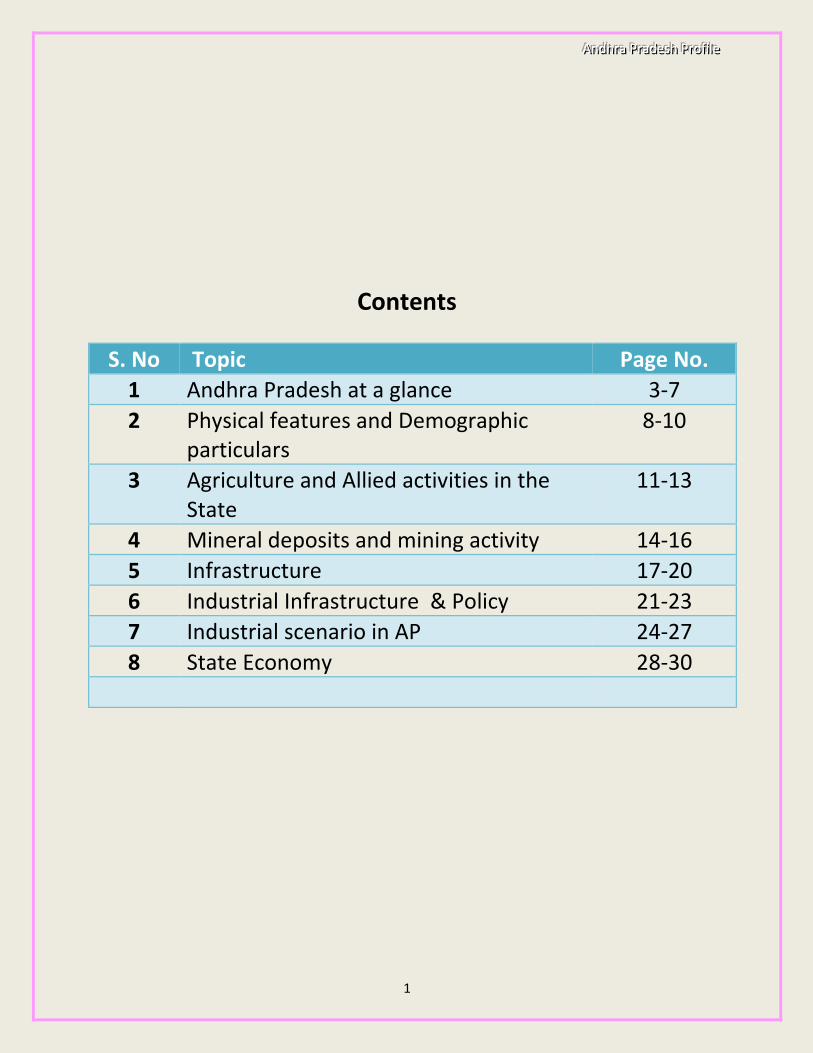
Andhra Pradesh at a glance
S. No Item A P All India % AP to All India
AP Location Longitude 76 47 to 84 50
Area ( in’ 000 kms) 162.97 3287 4.96% No. of districts 13 No. of Mandals 670 No. of Revenue Divisions 49 No. of Gram Panchayats 12918 No. of villages 17363 No. of towns 195 Members of Parliament
Lok Sabha Rajya Sabha
25 10
Members of Legislative Assembly Members of Legislative Council
175 50
Demographic particulars ( 2011 Census)
Total Population 4.96 crores 121.06 crores 4.097 Male population 2.483 crores 62.31 crores 3.98 Female population 2.474 crores 58.75 crores 4.21 Sex ratio (females per ‘000 males) 997 943 Urban population % 29.43 31.15 Rural population % 70.57 68.85 Density of population ( persons
per Sq. Km) 304 368
Literacy rate (Males) 74.77 80.89 Literacy rate ( Females) 59.96 64.64 Total literacy rate 67.41 72.99 SC Population as % of total
population 17.1 5.33
ST population as % of total population
16.63 8.61
% workers to total 46.51 39.79 Percentage of agricultural
workers to total workers 62.23 54.60
Work participation rate male % 58.41 53.26 Work participation rate female % 34.56 25.51 % Main workers to total workers 83.72 75.23 % Marginal workers to total
workers 16.82 24.77
Rainfall(2013-14) Normal ( in mm) Coastal Andhra 1078.1
AAAnnndddhhhrrraaa PPPrrraaadddeeessshhh PPPrrrooofff iii llleee
4
Rayalseema 714.1 Total AP 966.1 Actual ( in mm) Coastal Andhra 1126.7 Rayalseema 691.1 Total AP 962.5 Agriculture ( in March2014) Net area sown ( as % to total
geographical area) 41 43.06
( in 2010-11)
Gross cropped area ( as % to total geographical area)
50.74 60.5
Gross irrigated area to total geographical area
50.39
Percentage area under principal crops to total area sown ( 2014)
Paddy 31.79 Jowar 1.45 Bajra 0.61 Ragi 0.51 Total cereals & millets 39.03 Total pulses 13.64 Total food crops 67.57 Ground nut 14.47 Sesamum 0.75 Castor 0.60 Coconut 1.27 Cotton 8.32 Tobacco 1.76 Total non-food crops 32.43
Out-turn of crops ( in lakh tons) 2013 Rice 79.93 6.52 Jowar 2.65 7.69 Bajra 0.82 - Maize 22.13 8.58
Ragi 0.43 2.67 Pulses 10.79 6.17 Ground nut 8.81 Sunflower 0.68 Coconut ( in lakhs no’s) 16100 Chillies 6.02 Turmeric 1.52 Sugarcane ( in terms of Gur) 12.03 Mangoes 20.18 Banana 18.88 Cashew 0.37

AAAnnndddhhhrrraaa PPPrrraaadddeeessshhh PPPrrrooofff iii llleee
5
Onions 5.12 Cotton( bales of 170 kg) 21.87 Mesta 0.84 Tobacco 2.76 Rose 62.58 Jasmine 108.54 Marigold 110.20 Kanakambara 22.28 Livestock population (2012
census) in lakhs
Cattle 47.42 1909 2.48 Buffaloes 64.64 1087 5.94 Sheep, goats and pigs 294.5 2124.5 13.86 Poultry 817.84 7292 11.21 Milk production ( lakh Tonnes) 90.83 Chicken production ( ,, ) 2.97 Other meat production ( ,, ) 1.91 Production of eggs ( lakh nos) 127269 Fisheries production ( in lakh
Tonnes)
Inland fish 11.40 Marine fish 3.73 Marine shrimp 0.65 Brackish water shrimp 0.88 Fresh water prawns 1.03 Total forest produce ( Rs. in lakhs) 3898.37 Mineral production Petroleum Crude ( lakh tones) 2.74 Natural gas ( cu. Mm) 1143 Iron ore ( lakh tons) 9.4 Manganese ore ( ,, ) 3.66 Asbestos ( ,, ) 2.05 Barytes ( , ,) 17.25 Dolomite ( ,, ) 23.97 Limestone ( ,,) 351.93 Mica ( lakh tones) 0.51 Quartz ( ,, ) 7.73
Silica sand ( ,, ) 21.21 Electricity Installed capacity 16717 MW Electricity generated (united AP) 88191 MW Power consumed ( 2013-14)
L T
23167 MW
HT 13514 HT

AAAnnndddhhhrrraaa PPPrrraaadddeeessshhh PPPrrrooofff iii llleee
6
Village electrification 100%
Roads ( kms) National highways 4303 PWD Roads 41789 Panchayat Roads 82150 Commercial Banks Nationalized banks 3946 Regional Banks 904 Private sector/ foreign banks 628 Factories ( ASI 2011-12) Number of factories 11195 Employees & workers ( lakhs nos) 8.25 Total output ( Rs in crores) 167856 Gross Value Added ( ,,) 38263 No. of enterprises as per 6th
Economic Census ( 2013) 4237310 58470096 7.24%
% Contribution to GSDP/GDP
2014-15 , at current prices
Agriculture sector 27.59 18.20 Industrial Sector 20.62 24.77 Services sector 51.79 57.03
Source: Statistical Handbook, GoAP
AAAnnndddhhhrrraaa PPPrrraaadddeeessshhh PPPrrrooofff iii llleee
7
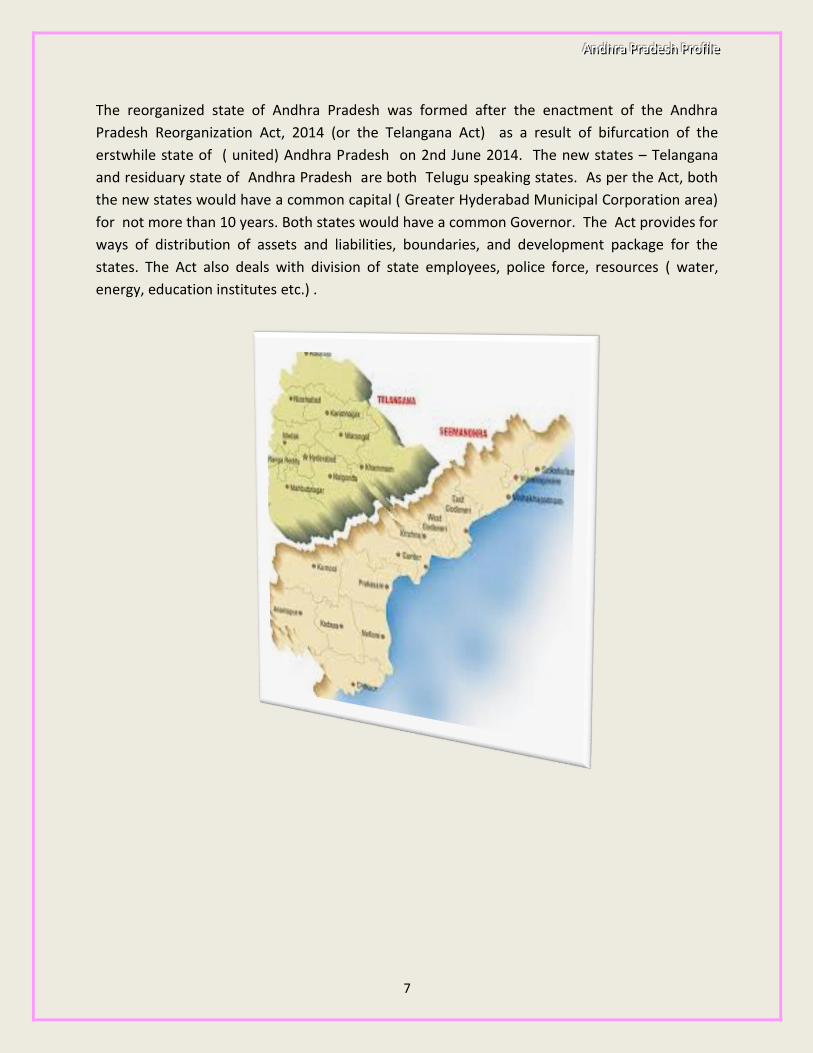
The reorganized state of Andhra Pradesh was formed after the enactment of the Andhra
Pradesh Reorganization Act, 2014 (or the Telangana Act) as a result of bifurcation of the
erstwhile state of ( united) Andhra Pradesh on 2nd June 2014. The new states – Telangana
and residuary state of Andhra Pradesh are both Telugu speaking states. As per the Act, both
the new states would have a common capital ( Greater Hyderabad Municipal Corporation area)
for not more than 10 years. Both states would have a common Governor. The Act provides for
ways of distribution of assets and liabilities, boundaries, and development package for the
states. The Act also deals with division of state employees, police force, resources ( water,
energy, education institutes etc.) .
AAAnnndddhhhrrraaa PPPrrraaadddeeessshhh PPPrrrooofff iii llleee
8
Boundaries
East Bay of Bengal
North –East Odisha state
North Chattisgarh State
West Telangana and Karnataka states
South Tamil Nadu State
Physical features
Coastal plains Coastal plains stretch from the foot of Eastern Ghats to the Bay of Bengal. Plains are narrow in the north, widest in the middle where Krishna and Godavari rivers form deltas. Coastal Plains are the most populous regions. Rivers deposit rich alluvium in the delta region.
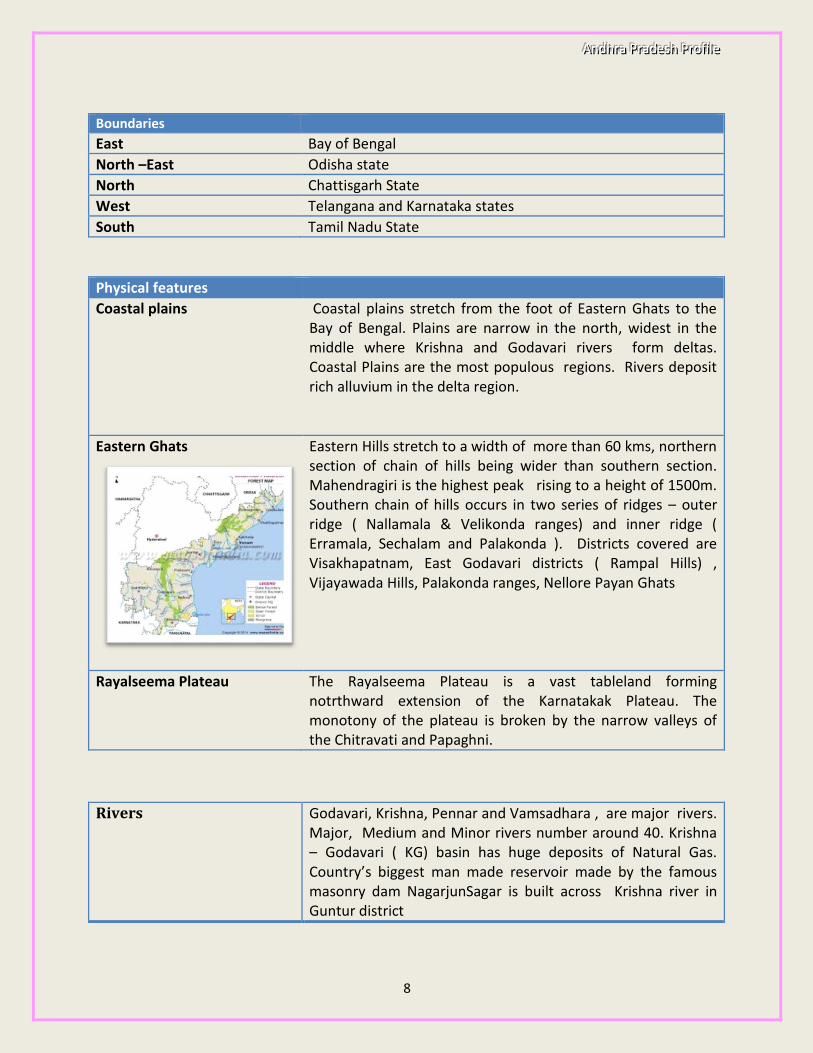
Eastern Ghats
Eastern Hills stretch to a width of more than 60 kms, northern section of chain of hills being wider than southern section. Mahendragiri is the highest peak rising to a height of 1500m. Southern chain of hills occurs in two series of ridges – outer ridge ( Nallamala & Velikonda ranges) and inner ridge ( Erramala, Sechalam and Palakonda ). Districts covered are Visakhapatnam, East Godavari districts ( Rampal Hills) , Vijayawada Hills, Palakonda ranges, Nellore Payan Ghats
Rayalseema Plateau The Rayalseema Plateau is a vast tableland forming notrthward extension of the Karnatakak Plateau. The monotony of the plateau is broken by the narrow valleys of the Chitravati and Papaghni.
Rivers Godavari, Krishna, Pennar and Vamsadhara , are major rivers. Major, Medium and Minor rivers number around 40. Krishna – Godavari ( KG) basin has huge deposits of Natural Gas. Country’s biggest man made reservoir made by the famous masonry dam NagarjunSagar is built across Krishna river in Guntur district
AAAnnndddhhhrrraaa PPPrrraaadddeeessshhh PPPrrrooofff iii llleee
9
Districts
Coastal districts - Nine ( Coastal region)
Srikakulam, Vizianagaram, Visakhapatnam, East Godavari, West Godavari, Krishna, Guntur, Prakasam and Nellore
Landlocked districts – Four ( Rayalseema region)
Chittoor, Kurnool, YSR Kadapa, Anantapuram
Demography
Area
162975 Sq. kms , 8th largest state in the country. 4.96% of country’s area .Anantapuram is the largest district with 19100 Sq. kms , followed by Kurnool and Prakasam districts ( 17.7 and 17.6 Thousand Sq. kms respectively. Srikakulam is the smallest district with just 5800 sq kms followed by Vizianagaram( 6500Sq Kms. )
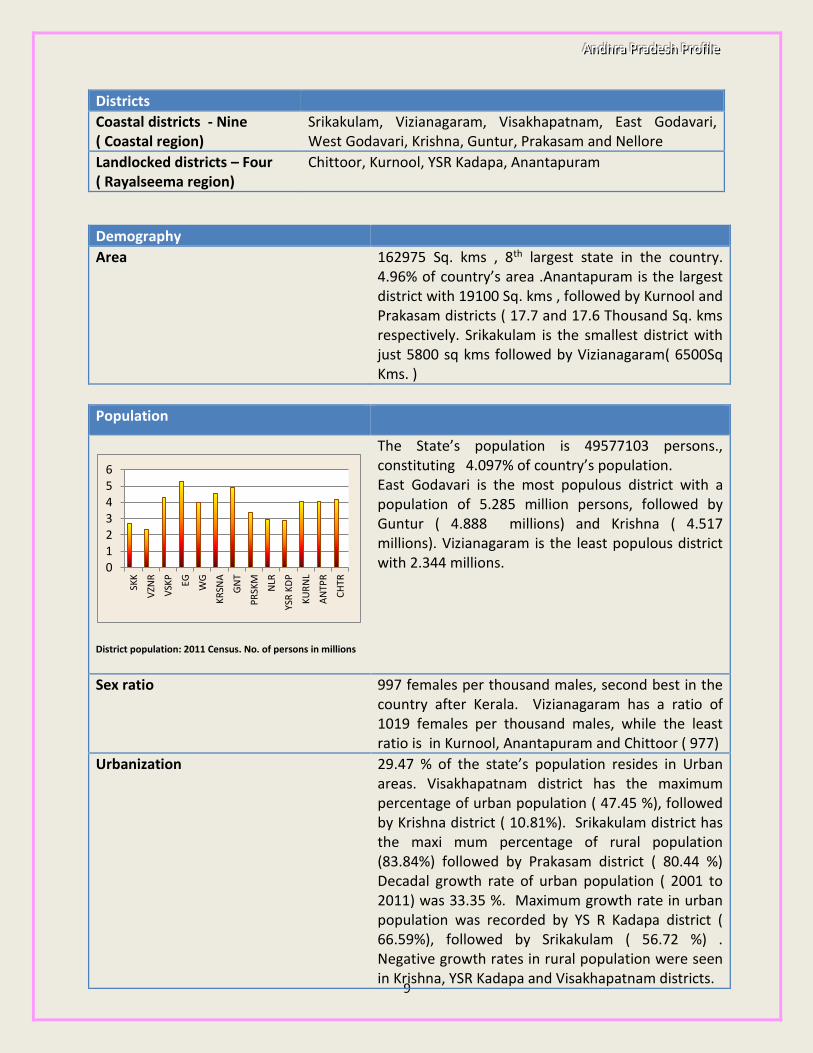
Population
District population: 2011 Census. No. of persons in millions
The State’s population is 49577103 persons., constituting 4.097% of country’s population. East Godavari is the most populous district with a population of 5.285 million persons, followed by Guntur ( 4.888 millions) and Krishna ( 4.517 millions). Vizianagaram is the least populous district with 2.344 millions.
Sex ratio 997 females per thousand males, second best in the country after Kerala. Vizianagaram has a ratio of 1019 females per thousand males, while the least ratio is in Kurnool, Anantapuram and Chittoor ( 977)
Urbanization 29.47 % of the state’s population resides in Urban areas. Visakhapatnam district has the maximum percentage of urban population ( 47.45 %), followed by Krishna district ( 10.81%). Srikakulam district has the maxi mum percentage of rural population (83.84%) followed by Prakasam district ( 80.44 %) Decadal growth rate of urban population ( 2001 to 2011) was 33.35 %. Maximum growth rate in urban population was recorded by YS R Kadapa district ( 66.59%), followed by Srikakulam ( 56.72 %) . Negative growth rates in rural population were seen in Krishna, YSR Kadapa and Visakhapatnam districts.
0123456
SKK
VZN
R
VSK
P
EG WG
KR
SNA
GN
T
PR
SKM
NLR
YSR
KD
P
KU
RN
L
AN
TPR
CH
TR

AAAnnndddhhhrrraaa PPPrrraaadddeeessshhh PPPrrrooofff iii llleee
10
Agriculture dependency 62.36% of the total working population in the district is dependent on agriculture. While only 14.47 % of total workers are cultivators, 47.89 % of total workers are agricultural labourers. West Godavari has the highest percentage of agricultural labourers( 60.22%) while Chittoor has the highest percentage of cultivators ( 22.48 %) . Only 2.87% of the total workers are in Household industry.
Major Cities and Towns
Visakhapatnam, Vijayawada, Rajahmundry, Guntur, Tirupathi, Kakinada, Ongole, Kurnool, Anantapuram, &Eluru
Literacy
literacy rate
West Godavari district is the most literate district in the state with a literacy rate of 74.32 (state average being 67.41 ). Vizianagaram is the least literate with a literacy rate of 58.89
0
10
20
30
40
50
60
70
80
SKK
VZN
R
VSK
P
EG WG
KR
SNA
GN
T
PR
KSM NLR
YSR
KR
NL
AN
TPR
CH
TR
AAAnnndddhhhrrraaa PPPrrraaadddeeessshhh PPPrrrooofff iii llleee
11
Agriculture : Land Utilization Pattern
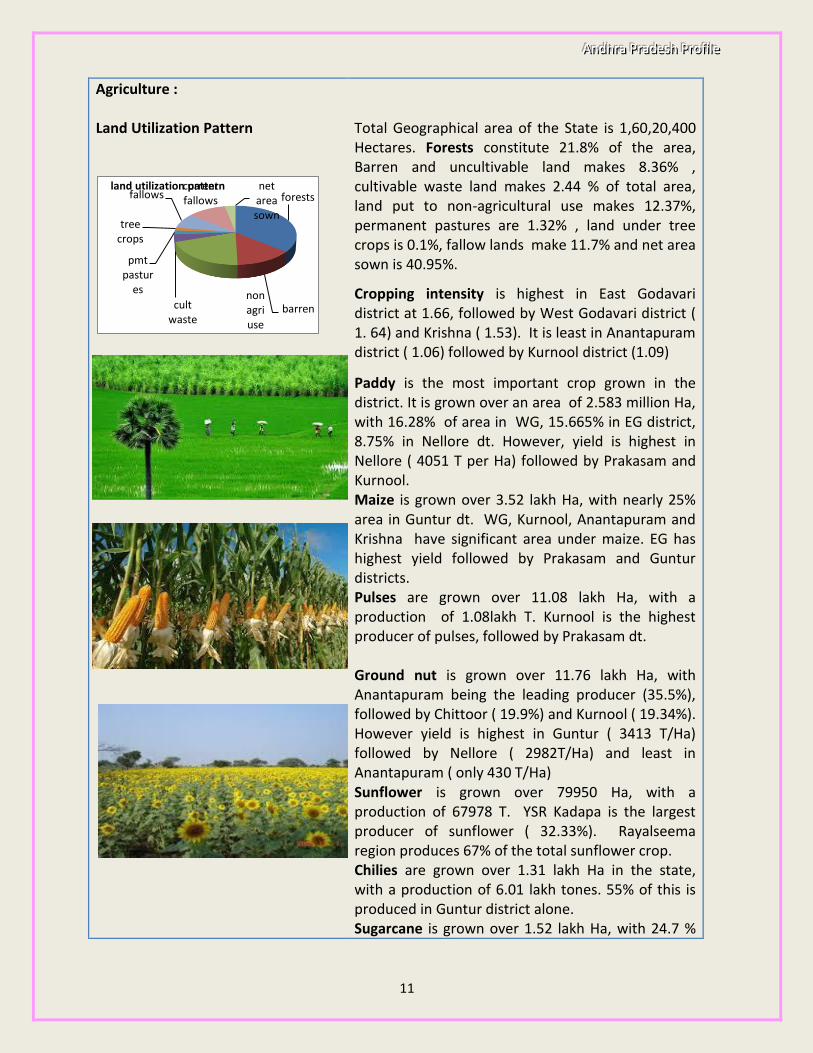
Total Geographical area of the State is 1,60,20,400 Hectares. Forests constitute 21.8% of the area, Barren and uncultivable land makes 8.36% , cultivable waste land makes 2.44 % of total area, land put to non-agricultural use makes 12.37%, permanent pastures are 1.32% , land under tree crops is 0.1%, fallow lands make 11.7% and net area sown is 40.95%.
Cropping intensity is highest in East Godavari district at 1.66, followed by West Godavari district ( 1. 64) and Krishna ( 1.53). It is least in Anantapuram district ( 1.06) followed by Kurnool district (1.09)
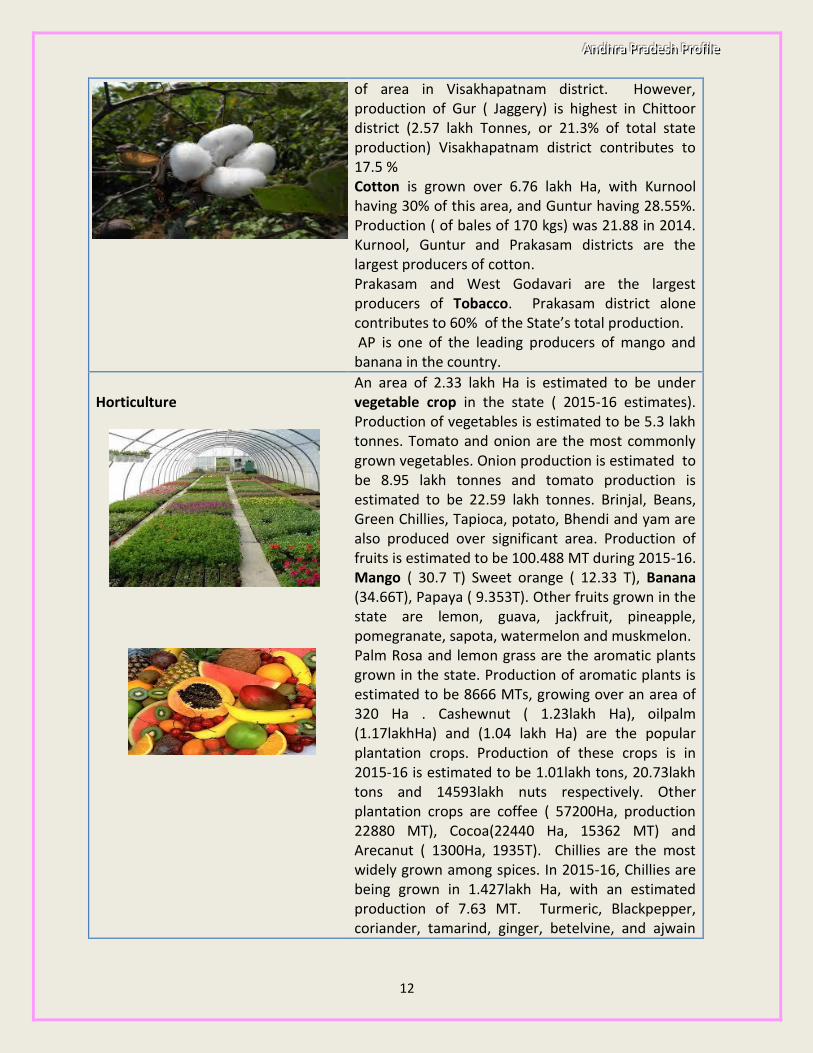
Paddy is the most important crop grown in the district. It is grown over an area of 2.583 million Ha, with 16.28% of area in WG, 15.665% in EG district, 8.75% in Nellore dt. However, yield is highest in Nellore ( 4051 T per Ha) followed by Prakasam and Kurnool. Maize is grown over 3.52 lakh Ha, with nearly 25% area in Guntur dt. WG, Kurnool, Anantapuram and Krishna have significant area under maize. EG has highest yield followed by Prakasam and Guntur districts. Pulses are grown over 11.08 lakh Ha, with a production of 1.08lakh T. Kurnool is the highest producer of pulses, followed by Prakasam dt. Ground nut is grown over 11.76 lakh Ha, with Anantapuram being the leading producer (35.5%), followed by Chittoor ( 19.9%) and Kurnool ( 19.34%). However yield is highest in Guntur ( 3413 T/Ha) followed by Nellore ( 2982T/Ha) and least in Anantapuram ( only 430 T/Ha) Sunflower is grown over 79950 Ha, with a production of 67978 T. YSR Kadapa is the largest producer of sunflower ( 32.33%). Rayalseema region produces 67% of the total sunflower crop. Chilies are grown over 1.31 lakh Ha in the state, with a production of 6.01 lakh tones. 55% of this is produced in Guntur district alone. Sugarcane is grown over 1.52 lakh Ha, with 24.7 %
forests
barrennon agri use
cult waste
pmt pastur
es
tree crops
fallowscurrent fallows
net area sown
land utilization pattern
AAAnnndddhhhrrraaa PPPrrraaadddeeessshhh PPPrrrooofff iii llleee
12
of area in Visakhapatnam district. However, production of Gur ( Jaggery) is highest in Chittoor district (2.57 lakh Tonnes, or 21.3% of total state production) Visakhapatnam district contributes to 17.5 % Cotton is grown over 6.76 lakh Ha, with Kurnool having 30% of this area, and Guntur having 28.55%. Production ( of bales of 170 kgs) was 21.88 in 2014. Kurnool, Guntur and Prakasam districts are the largest producers of cotton. Prakasam and West Godavari are the largest producers of Tobacco. Prakasam district alone contributes to 60% of the State’s total production. AP is one of the leading producers of mango and banana in the country.
Horticulture
An area of 2.33 lakh Ha is estimated to be under vegetable crop in the state ( 2015-16 estimates). Production of vegetables is estimated to be 5.3 lakh tonnes. Tomato and onion are the most commonly grown vegetables. Onion production is estimated to be 8.95 lakh tonnes and tomato production is estimated to be 22.59 lakh tonnes. Brinjal, Beans, Green Chillies, Tapioca, potato, Bhendi and yam are also produced over significant area. Production of fruits is estimated to be 100.488 MT during 2015-16. Mango ( 30.7 T) Sweet orange ( 12.33 T), Banana (34.66T), Papaya ( 9.353T). Other fruits grown in the state are lemon, guava, jackfruit, pineapple, pomegranate, sapota, watermelon and muskmelon. Palm Rosa and lemon grass are the aromatic plants grown in the state. Production of aromatic plants is estimated to be 8666 MTs, growing over an area of 320 Ha . Cashewnut ( 1.23lakh Ha), oilpalm (1.17lakhHa) and (1.04 lakh Ha) are the popular plantation crops. Production of these crops is in 2015-16 is estimated to be 1.01lakh tons, 20.73lakh tons and 14593lakh nuts respectively. Other plantation crops are coffee ( 57200Ha, production 22880 MT), Cocoa(22440 Ha, 15362 MT) and Arecanut ( 1300Ha, 1935T). Chillies are the most widely grown among spices. In 2015-16, Chillies are being grown in 1.427lakh Ha, with an estimated production of 7.63 MT. Turmeric, Blackpepper, coriander, tamarind, ginger, betelvine, and ajwain
AAAnnndddhhhrrraaa PPPrrraaadddeeessshhh PPPrrrooofff iii llleee
13
are the other spices grown. Total spices production is expected to be 1.089 lakh tonnes. Marigold, Chrysanthemum, Jasmine, Rose and Crossandra are the popular flower varieties grown. Total area under flower crop in the state is 16561 Ha, with expected production of 1.35 lakh MT.
Land holdings Total number of land holdings in the state are 76.21 lakhs , and average size of the holding is just 1.06 Ha. Average size of holding is highest in Anantapuram district ( 1.76 Ha). Size of holding is less than 1 Ha in most of the coastal districts.
Irrigation
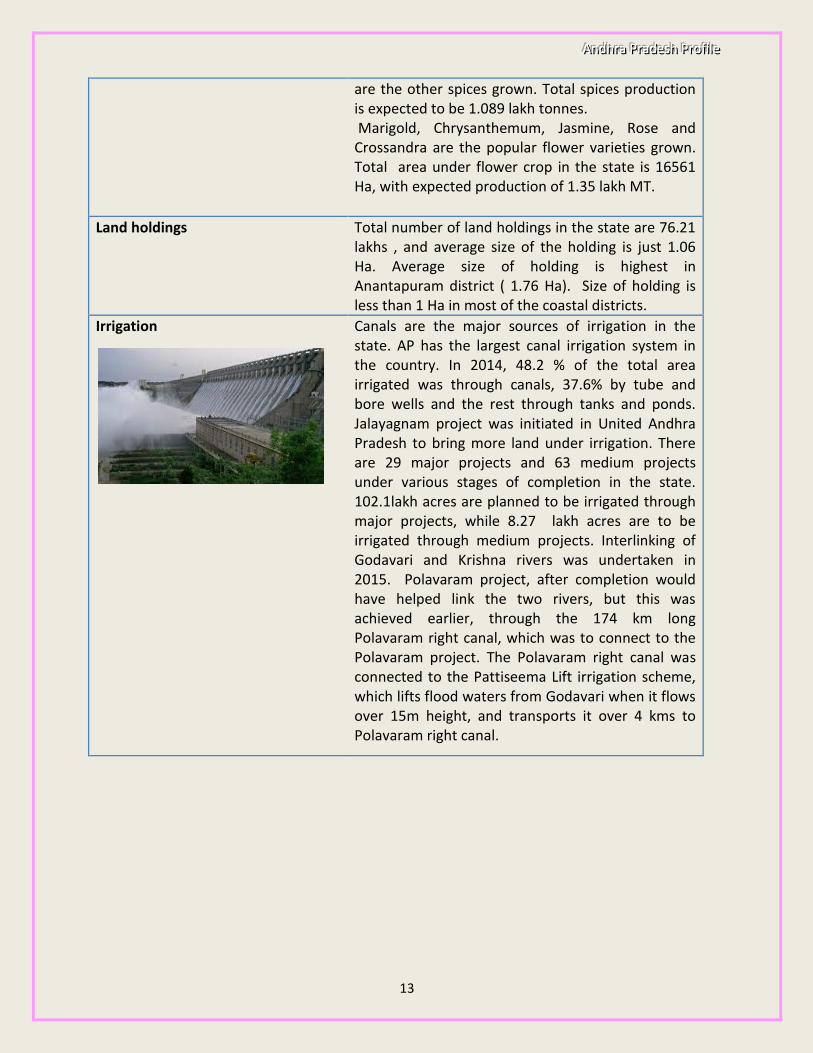
Canals are the major sources of irrigation in the state. AP has the largest canal irrigation system in the country. In 2014, 48.2 % of the total area irrigated was through canals, 37.6% by tube and bore wells and the rest through tanks and ponds. Jalayagnam project was initiated in United Andhra Pradesh to bring more land under irrigation. There are 29 major projects and 63 medium projects under various stages of completion in the state. 102.1lakh acres are planned to be irrigated through major projects, while 8.27 lakh acres are to be irrigated through medium projects. Interlinking of Godavari and Krishna rivers was undertaken in 2015. Polavaram project, after completion would have helped link the two rivers, but this was achieved earlier, through the 174 km long Polavaram right canal, which was to connect to the Polavaram project. The Polavaram right canal was connected to the Pattiseema Lift irrigation scheme, which lifts flood waters from Godavari when it flows over 15m height, and transports it over 4 kms to Polavaram right canal.

AAAnnndddhhhrrraaa PPPrrraaadddeeessshhh PPPrrrooofff iii llleee
14
Livestock and fisheries
Livestock
The 2012 Livestock Census reveals that the cattle population in the district is 47.42 lakh. Chittoor district has the largest cattle population ( 19.55%), followed by Srikakulam district (17.56%). Buffalo population stands at 64.64lakhs, with Guntur district having the largest buffalo population, followed by Prakasam district. Sheep population stands at 135.67 lakhs, with Anantapuram having 28.56% of the population. Goat population is 45.06 lakh with Anantapuram having the largest population. The estimated milk production in 2013-14 in the state was 90.83 lakh Metric Tonnes. Prakasam district was the largest producer of milk ( 1050 MT, or 11.56%) , followed by Krishna, Guntur and Chittoor districts. The estimated meat production in the state during the same period was 1.92Lakh Tonnes. Chittoor was the largest meat producer with 25,500 Tonnes, followed by Kurnool ( 24 000T) and Prakasam (21,370 T)
Poultry
A P has the second largest poultry population in the country (11.2% 0f total) . Poultry population in the state was 817.85 lakhs. Poultry activity is mainly concentrated in the districts of West Godavari (21.28%), East Godavari (17.1%) , Chittoor (15.4%) and Krishna districts. Egg production during the same period was 127269 lakh numbers. East Godavari is the largest producer of eggs (44537 lakh nos or 35%), followed by West Godavari (15.5%) , Krishna and Chittoor.
Fisheries Andhra Pradesh is endowed with a long coastline of 974kms , providing great scope for development of fisheries. The ocean backwaters and tanks and lakes also encourage inland fishing. Nine of the thirteen districts enjoy sea coast, and fishing is a

AAAnnndddhhhrrraaa PPPrrraaadddeeessshhh PPPrrrooofff iii llleee
15
major economic activity in these districts. Fishing community in the state consists of 4.28 lakh persons (including marine and inland fishing) Marine fishing is concentrated in East Godavari, Nellore, Srikakulam and Krishna districts. The state produces marine shrimp, marine fish and fresh water shrimp and fishes. Marine fish production was 3.73 lakh Tonnes, valued at Rs. 352291 Lakhs in 20114 ( 4.06 Lakh tones in 2014-15), while marine shrimp production was 64908Tonnes, valued at Rs. 198938 lakhs(69152 T in 2014-15). East Godavari (share of 21.55%), Visakhapatnam(20.5%) and Nellore(18.8%) are the major producers of marine fish and prawns (In 2014-15 production was 5.33 Lakh Tonnes and 5.48 lakh tonnes resp). Krishna district leads in inland fish and prawn production (5.12lakh T or 41.62%) of total inland fish and prawn production, followed by West Godavari district ( 39.3%). Brackish water prawn production is concentrated in West Godavari and Nellore districts. Visakhapatnam and its surrounding region is a hub of sea food exporters.

AAAnnndddhhhrrraaa PPPrrraaadddeeessshhh PPPrrrooofff iii llleee
16
Mineral wealth
Andhra Pradesh is a leading producer of many minerals. It has 94% of deposits of barytes, 70% of corundum, 78% of Kyanite, 61% of ball clay, 42% of calcite, 41% of mica, 20% of limestone, 15% of dolomite and 26% of garnet deposits in the country. Manganese ore is mainly found in Nellore, Prakasam, Vizianagaram and Srikakulam districts, while Graphite deposits are found in EG, WG, Visakhapatnam and Srikakulam districts. Mica deposits are in Rayalseema region, Krishna, Nellore, and Visakhapatnam. YSR Kadapa region (Tumulapalli) region has been found to have rich Uranium deposits. Andhra Pradesh is a leader exporter of granite slabs and stones. Chimakurthy of Prakasam district and Color granite of Srikakulam district are famed for their quality. The shore areas of the state are rich in mineral ores such as Illmenite, Rutile, Leucoxene, Zircon ,Silliminite and Monazite. Copper is found in YSR Kadapa, Guntur, Kurnool, Nellore and Prakasam districts.

AAAnnndddhhhrrraaa PPPrrraaadddeeessshhh PPPrrrooofff iii llleee
17
Infrastructure
Roadways
All parts of Andhra Pradesh are well connected by roads. The state has a total road length of 76896 kms, of which 4423kms are National Highways. 21 National Highways pass through the state. Among them are NH16(Calcutta, Vijayawada, Chennai Highway – 1024 kms), NH30 Jagdalpur Vijayawada road, NH 44, Nagpur, Hyderabad, Bangalore road, NH 65 Pune Hyderabad Machilipatnam road, NH 234 Mangalore VenkatgiriVIllipuram road etc Chittoor district has the maximum length of Highways ( 707kms), followed by Nellore ( 502 kms) and Anantapuram ( 486kms). The total road length in the state is 41788 kms(March 2014). Through JanmabhoomiMaaVooru scheme, the state is trying to create a grid of roads connecting all habitations to Mandal HQrs. All seaports would be connected to nearest Highways through 4 lane roads to facilitate cargo movement. The road grid is to be made ready by 2019.
Rail network
Andhra Pradesh is well connected by rail network to major cities in the country. Vijayawada is a very busy junction, connecting trains from the north to the south. Visakhapatnam is another major industrial city, with rail linkage to many major cities. The state is demanding for a separate railway zone with Visakhapatnam as its Head Quarters. The state is at present covered by three railway zones- The Southern Railway, the South Central Railway, and the East Coast Railway, with 121kms, 2660kms and 573km or railways respectively. There are a total of 444 railway stations. Metro Rail projects are being developed in the cities of Visakhapatnam, Vijayawada and Guntur.
Airways
Visakhapatnam, Tirupathi, Rajahmundry, Vijayawada, Bobbili, Nagarjunsagar, and Puttaparthi have airports. The Visakhapatnam airport is an international airport,
AAAnnndddhhhrrraaa PPPrrraaadddeeessshhh PPPrrrooofff iii llleee
18
and is to be expanded. Gannavaram( Vijayawada) is also to be soon developed into a world class airport. Vizag airport operates international flights to Dubai.
Sea Ports
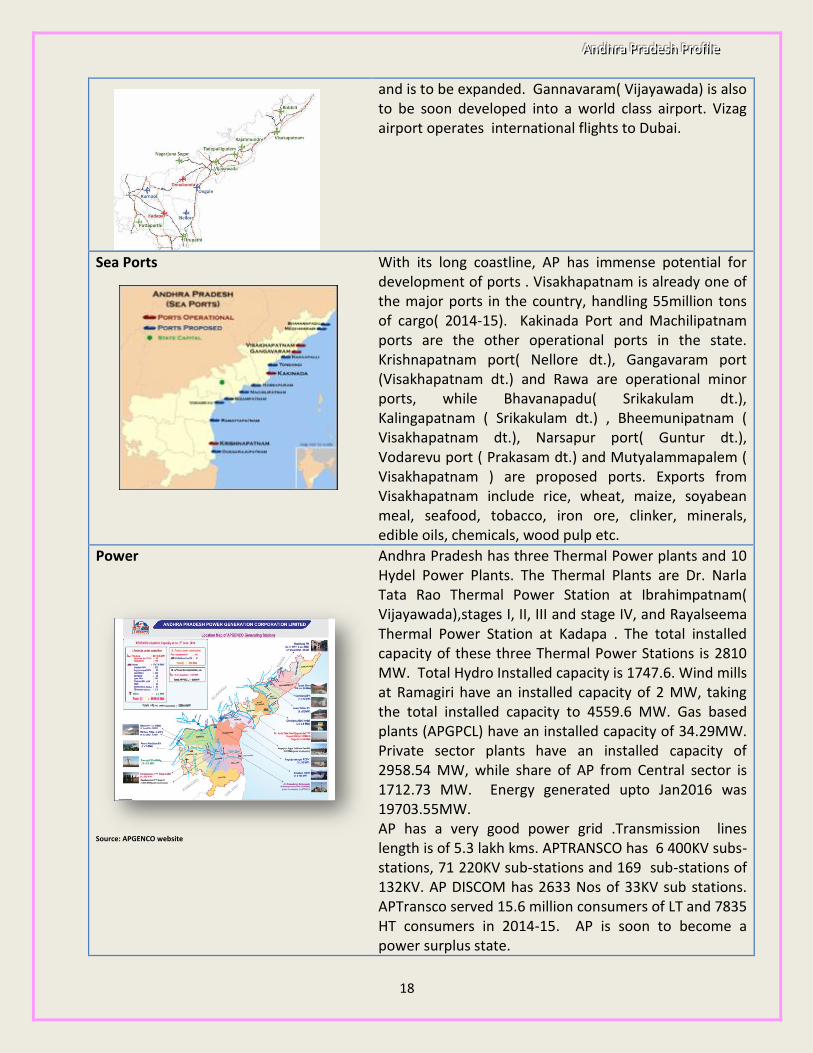
With its long coastline, AP has immense potential for development of ports . Visakhapatnam is already one of the major ports in the country, handling 55million tons of cargo( 2014-15). Kakinada Port and Machilipatnam ports are the other operational ports in the state. Krishnapatnam port( Nellore dt.), Gangavaram port (Visakhapatnam dt.) and Rawa are operational minor ports, while Bhavanapadu( Srikakulam dt.), Kalingapatnam ( Srikakulam dt.) , Bheemunipatnam ( Visakhapatnam dt.), Narsapur port( Guntur dt.), Vodarevu port ( Prakasam dt.) and Mutyalammapalem ( Visakhapatnam ) are proposed ports. Exports from Visakhapatnam include rice, wheat, maize, soyabean meal, seafood, tobacco, iron ore, clinker, minerals, edible oils, chemicals, wood pulp etc.
Power
Source: APGENCO website
Andhra Pradesh has three Thermal Power plants and 10 Hydel Power Plants. The Thermal Plants are Dr. Narla Tata Rao Thermal Power Station at Ibrahimpatnam( Vijayawada),stages I, II, III and stage IV, and Rayalseema Thermal Power Station at Kadapa . The total installed capacity of these three Thermal Power Stations is 2810 MW. Total Hydro Installed capacity is 1747.6. Wind mills at Ramagiri have an installed capacity of 2 MW, taking the total installed capacity to 4559.6 MW. Gas based plants (APGPCL) have an installed capacity of 34.29MW. Private sector plants have an installed capacity of 2958.54 MW, while share of AP from Central sector is 1712.73 MW. Energy generated upto Jan2016 was 19703.55MW. AP has a very good power grid .Transmission lines length is of 5.3 lakh kms. APTRANSCO has 6 400KV subs-stations, 71 220KV sub-stations and 169 sub-stations of 132KV. AP DISCOM has 2633 Nos of 33KV sub stations. APTransco served 15.6 million consumers of LT and 7835 HT consumers in 2014-15. AP is soon to become a power surplus state.

AAAnnndddhhhrrraaa PPPrrraaadddeeessshhh PPPrrrooofff iii llleee
19
Telecommunications
Tele-density in Andhra Pradesh (combined AP) was 86.53 ( Dec 2015), as compared to national average of 81.83. Wire line subscriber base was 1.64 lakhs while wireless subscribers were 74.5 million. Source ( TRAI bulletin). Pilot project of the National Optical Fibre Network ( NOFN) is operational in Parwada Mandal of Visakhapatnam of AP. The project aims at reaching all Gram Panchayats with Optical Fibre cable from Mandal HQrs. Power Grid Corporation Ltd is the executing agency. The state had 59 Head Post offices, and 10279 other post offices, as in March 2014. It had 2487 Telephone exchanges and more than 10 lakh telephone connections.
Education infrastructure College Number Students
enrolled
Junior 3315 4.53 lakhs
Degree 268 2.24 lakhs
Training 380 0.41 lakhs
Engineering 359 1.64 lakhs
Pharmacy 126 0.11 lakhs
MBA 314 0.31 lakhs
MCA 184 0.134 ;lakhs
Polytechnic 263 0.734 lakhs
ITI 500 0.39 lakhs
Nursing
Medical 23 0.325lakhs
Dental 14 1250
Alt medicine 8 340
AP has a good network of educational institutions. SarvaShikshaAbhiyaan – which provides free and compulsory education for all children upto the age of 14 – is implemented in the state. The drop-out rates in the state upto class V was 3.2, while that upto class VII was 19.16, and upto class X was 26.83. Highest dropout rates are witnessed in Prakasam and Vizianagaram districts. There are a total of 20 Universities in the state, including 2 Health sciences universities, a veterinary university, a horticulture university and two technological universities. There a total of 359 ( as in2014) engineering colleges in the state, with 1.64 lakh students. This means that more than 40000 engineers are being added to the job market every year. Apart from these, there are 314 MBA schools and 184 MCA colleges. Pharmacy colleges number 126 and Polytechnics number 263.The number of ITI colleges is 500. There are 23 medical colleges with 3250 students on roll. An IIM has started functioning temporarily at Andhra University in Visakhapatnam, and an IIT and IISER is being started in the state.

AAAnnndddhhhrrraaa PPPrrraaadddeeessshhh PPPrrrooofff iii llleee
20
Health Infrastructure Vital statistics ( 2013 – for united AP)
Crude birth rate 17.4 per 1000 population
Crude death rate 7.3 per 1000 population Infant mortality rate 39 per thousand live births Maternal mortality rate
Govt medical facilities ( 2014)
Dispensary/Hospital Nos.
Primary Health Centres 1155
dispensaries 79
General hospitals 245
Hospitals for special treatment
19
Medical facilities in the state of AP have been improving with many corporate hospitals setting up a chain of hospitals in many towns and cities in the district. Major names are Apollo Hospitals, Care Hospitals, KIMS, etc. The private hospitals are also expected to invest in the new capital region, once it is formed.
AAAnnndddhhhrrraaa PPPrrraaadddeeessshhh PPPrrrooofff iii llleee
21
Industrial Infrastructure & Policy
Industrial Estates
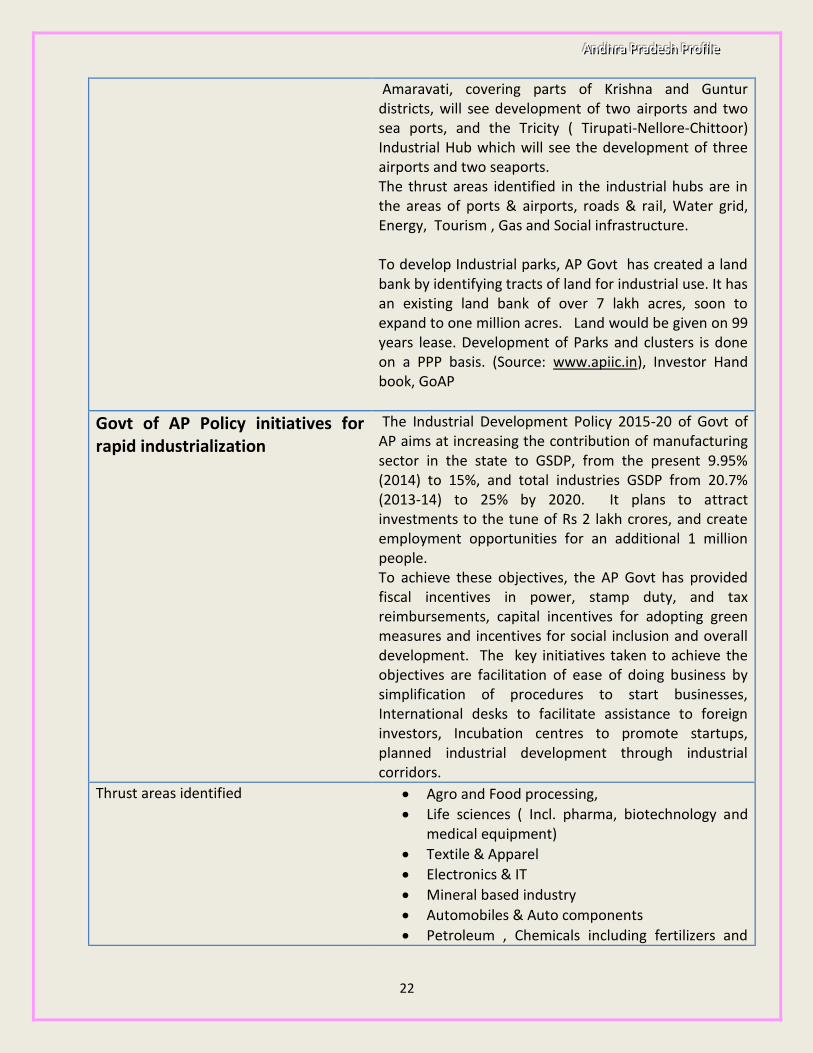
Andhra Pradesh has 236 Industrial Parks. The districts of Visakhapatnam, Krishna, East Godavari, West Godavari, Guntur, Nellore and Chittoor are industrially well developed. Visakhapatnam district has 38 parks, Srikakulam district under Visakhapatnam dist. has 8 parks, and Vizianagaram district has 4 parks. Vizag special Zone has 9 parks which include APSEZ, JN Pharma city, BARC Lands and Parwada Phase II. East Godavari district has 25 parks including Incubation centre at Kakinada. West Godavari district has 5 Parks. Krishna district has 14 parks , while Guntur has 24 parks . Nellore district has 21 parks, while Prakasam district has 20 parks. Chittoor district has 32 parks, and Kadapa district has 22 Industrial Parks. Anantapuram district has 18 parks. There are a total of 47 SEZs in the state, of which 32 are notified, 5 have got in-principle approval and 10 are formal. Of these, 10 SEZs are APIIC ventures, while 3 are assisted by APIIC. Of the 32 estates, 11 are being developed by private developers. . Notified SEZs are meant for IT & Enabled services, Biotech, Pharma, Leather, Building product, textiles & Apparels, s, etc. The area of the Parks range from 15 acres to 2500 acres. APIIC provides approved layouts, internal roads, water supply and power supply. Atotal of 1728 plots and 29 shed are vacant as in Feb 2016. The development of three Industrial Corridors – Visakhapatnam-Chennai Industrial Corridor ( VCIC), Chennai – Bengaluru Industrial Corridor ( CHIC) and Bengaluru-Hyderabad Industrial Corridor are bound to boost industrial and infrastructure development in the state, as all districts are covered by either one of the Industrial Corridors Govt of AP has planned three industrial hubs in the Industrial Corridors – Visakhapatnam industrial hub between Bhogapuram and Kakinada, which envisages development of three airports and three seaports. The Amaravati Industrial hub, around the new capital
AAAnnndddhhhrrraaa PPPrrraaadddeeessshhh PPPrrrooofff iii llleee
22
Amaravati, covering parts of Krishna and Guntur districts, will see development of two airports and two sea ports, and the Tricity ( Tirupati-Nellore-Chittoor) Industrial Hub which will see the development of three airports and two seaports. The thrust areas identified in the industrial hubs are in the areas of ports & airports, roads & rail, Water grid, Energy, Tourism , Gas and Social infrastructure. To develop Industrial parks, AP Govt has created a land bank by identifying tracts of land for industrial use. It has an existing land bank of over 7 lakh acres, soon to expand to one million acres. Land would be given on 99 years lease. Development of Parks and clusters is done on a PPP basis. (Source: www.apiic.in), Investor Hand book, GoAP
Govt of AP Policy initiatives for rapid industrialization
The Industrial Development Policy 2015-20 of Govt of AP aims at increasing the contribution of manufacturing sector in the state to GSDP, from the present 9.95% (2014) to 15%, and total industries GSDP from 20.7% (2013-14) to 25% by 2020. It plans to attract investments to the tune of Rs 2 lakh crores, and create employment opportunities for an additional 1 million people. To achieve these objectives, the AP Govt has provided fiscal incentives in power, stamp duty, and tax reimbursements, capital incentives for adopting green measures and incentives for social inclusion and overall development. The key initiatives taken to achieve the objectives are facilitation of ease of doing business by simplification of procedures to start businesses, International desks to facilitate assistance to foreign investors, Incubation centres to promote startups, planned industrial development through industrial corridors.
Thrust areas identified Agro and Food processing,
Life sciences ( Incl. pharma, biotechnology and medical equipment)
Textile & Apparel
Electronics & IT
Mineral based industry
Automobiles & Auto components
Petroleum , Chemicals including fertilizers and
AAAnnndddhhhrrraaa PPPrrraaadddeeessshhh PPPrrrooofff iii llleee
23
petrochemicals
Energy
Aerospace and Defence
Leather
Sector specific Policies of GoAP Source: Investor Handbook, GoAP
MSME Sector Single window for all registrations, clearances Land reserved or MSMEs in Industrial Parks Each district to have a dedicated MSME Park Reimbursement of stamp duty, power cost, VAT/CST/SCST Seed capital assistance for first generation entrepreneurs MSME revival fund for sick MSMEs
Food Processing Policy 2015-20 Food Park in every district, and incentives for establishment of Food Parks, Power and Capital subsidy for cold chain units Quality certification and marketing initiatives to be reimbursed Promoting innovation and R&D Commodity based cluster development Grant for establishing NABL accredited testing labs, Exemption from APMC cess/fee
Aerospace & Defence Manufacturing Policy 2015-20
Capital subsidy for basic infrastructure development, new units Patent registration, quality certification – reimbursement of cost Development of Aerospace & Defence Parks, air cargo complex Exemption from Entry tax on Plant and Machinery and capital goods Thrust on skill development
Electronics Policy 2014-20 Establishment of Center of Excellence for fables semiconductors, Electronics AP – to promote AP Electronics through Exhibitions, Road Shows, Web campaigns etc Exemption on electricity duty, reimbursement of stamp duty, transfer duty and registration fee. Capital investment subsidy Interest subsidy for 7 years

AAAnnndddhhhrrraaa PPPrrraaadddeeessshhh PPPrrrooofff iii llleee
24
Textile and Apparel Policy 2015-20 Establishment of Textile Parks encouraged Skill development Interest subsidy, power tariff, reimbursement of stamp duty, capital subsidy on fixed assets et
Thrust areas: Ginning & Pressing, Cotton spinning, Weaving, dyeing and processing, Knitting Garments/ made-ups, Machine carpeting Machine embroidery etc
Biotechnology Policy 2015-20 3 Mini Life science parks Life Sciences Knowledge centres on PPP model Power cost reimbursement, interest subsidy Technology Acquisition Fund for acquiring technology
Tourism Policy 2015-20 Focus on Theme based development of tourism projects And Destination based development through Hub and Spoke model Linkage infrastructure to be developed, waiver of land use conversion charges Reimbursement of registration /stamp duty for tourism infrastructure Investment subsidy for tourism related services
Automobile & Auto Components policy 2015-20
Provision of land to ancillary units at same rate as OEM(wherever Govt allocates land to IEM and upto a max of 50%ofland allocated to OEM) , reliable power supply Capital subsidy, reimbursement of patent & quality certification cost. Additional incentives for Mega Integrated Automobile projects.
AP Innovation and Startup Policy 2014-2020
GoAP aims to set up 100 Incubators to incubate 5000 companies, to develop 1 million sft of incubation space, to mobilize Rs.1000 Crores Venture Capital, to develop a Foster Innovation Centre and to create at least one billion dollar home-grown technology start up.

AAAnnndddhhhrrraaa PPPrrraaadddeeessshhh PPPrrrooofff iii llleee
25
Industrial Scenario in Andhra Pradesh
Large and Mega Industries in the state
Figure 1 Large and Mega industries in AP (as on Nov 2014)
As per the socio-economic survey of AP 2014, there were 1742 Large and Mega projects in the state, involving an investment of Rs 78,860 crores, and providing employment to 4,21,222 persons ( as in Nov 2014). Of these, 15 projects were established in 2014-15, with an investment of RS 1875 crores, and providing employment to 6814 persons East Godavari has the largest number of Large and Mega projects (216) followed by Guntur (202) and Visakhapatnam (194). Visakhapatnam tops in investment in Large and Mega projects (Rs.19811 crores) followed by East Godavari (Rs. 13836 crores). Employment wise, Visakhapatnam tops the chart with 67979 persons, followed by East Godavari Dt ( 49873 persons
Micro , Small and Medium Enterprises ( MSMEs) in Andhra Pradesh
( as in Nov 2014) Source: Socio-Economic Survey of AP
Figure 2 MSME sector in AP
There were a total of 1,08,494 registered MSMEs in the state of AP, as in Nov 2014. The total investment was 19176.13 crores, and these units provided employment to 11,90,277 persons. Prakasam district had the maximum number of MSMEs (23548), followed by Kadapa district (12806) and East Godavari (11188). Vizianagaram had the least number of MSMEs (3970) followed by Kurnool ( 4174). Investment wise, Visakhapatnam leads with Rs.4207.41 crores, followed by Prakasam with 4164.5 crores, and East Godavari with 2039.85 crores, implying that MSMEs in Visakhapatnam are much more capital intensive than other districts. Prakasam district is the largest employment provider in MSME sector with 2,62,081 persons followed by Visakhapatnam ( 1,47,622 persons) and EG (1,21,939).
0
500
1000
1500
2000
2500
Srik
aku
lam
Viz
ian
agar
m
Vis
akh
apat
nam EG W
G
Kri
shn
a
Gu
ntu
r
Pra
kasa
m
Nel
lore
YSR
Kad
apa
Ku
rno
ol
An
anta
pu
ram
Ch
itto
or
no of units invstmt( ( Rs. In '000 lakhs) Emplmt ( '00 persons)
0
5000
10000
15000
20000
25000
srik
aku
lam
vizi
anag
aram
visa
khap
atn
am E G
WG
Kri
shn
a
Gu
ntu
r
Pra
kasa
m
Nel
lore
YSR
Kad
apa
Ku
rno
ol
An
anth
apur
Ch
itto
or
No of units Invstmt ( Rs. In crores) Emplmt( '00 persons)
AAAnnndddhhhrrraaa PPPrrraaadddeeessshhh PPPrrrooofff iii llleee
26
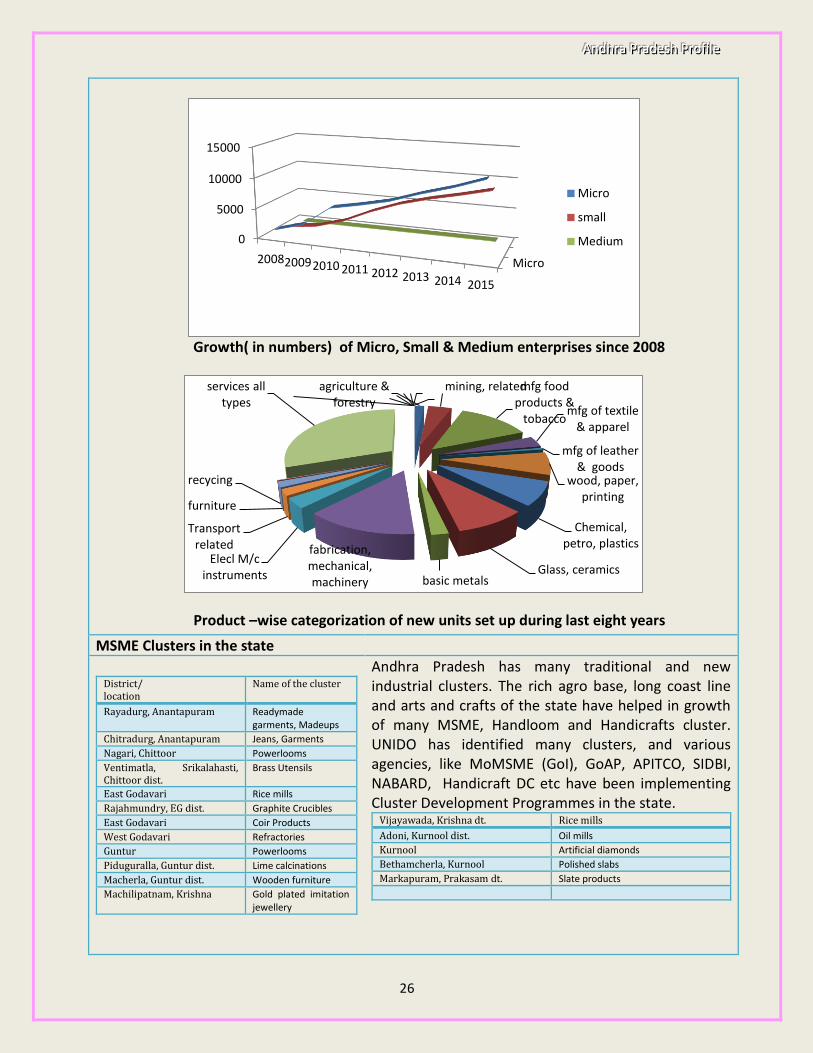
Growth( in numbers) of Micro, Small & Medium enterprises since 2008
Product –wise categorization of new units set up during last eight years
MSME Clusters in the state
District/ location
Name of the cluster
Rayadurg, Anantapuram Readymade garments, Madeups
Chitradurg, Anantapuram Jeans, Garments
Nagari, Chittoor Powerlooms
Ventimatla, Srikalahasti, Chittoor dist.
Brass Utensils
East Godavari Rice mills
Rajahmundry, EG dist. Graphite Crucibles
East Godavari Coir Products
West Godavari Refractories
Guntur Powerlooms
Piduguralla, Guntur dist. Lime calcinations
Macherla, Guntur dist. Wooden furniture
Machilipatnam, Krishna Gold plated imitation jewellery
Andhra Pradesh has many traditional and new industrial clusters. The rich agro base, long coast line and arts and crafts of the state have helped in growth of many MSME, Handloom and Handicrafts cluster. UNIDO has identified many clusters, and various agencies, like MoMSME (GoI), GoAP, APITCO, SIDBI, NABARD, Handicraft DC etc have been implementing Cluster Development Programmes in the state.
Vijayawada, Krishna dt. Rice mills
Adoni, Kurnool dist. Oil mills
Kurnool Artificial diamonds
Bethamcherla, Kurnool Polished slabs
Markapuram, Prakasam dt. Slate products
Micro
0
5000
10000
15000
200820092010 2011 2012 2013 2014 2015
Micro
small
Medium
agriculture & forestry
mining, relatedmfg food products &
tobaccomfg of textile
& apparel
mfg of leather & goods
wood, paper, printing
Chemical, petro, plastics
Glass, ceramicsbasic metals
fabrication, mechanical, machinery
Elecl M/c instruments
Transport related
furniture
recycing
services all types

AAAnnndddhhhrrraaa PPPrrraaadddeeessshhh PPPrrrooofff iii llleee
27
The following MSME clusters have been taken up for development under MSE-CDP of the Govt of India. GoI grants to clusters in AP
SL
.N
o
Location of
the
Industrial
Cluster
Type of cluster No.of
Acres
COST
(Rs. In
lakhs)
MSME
(GoI)
grant
(Rs. In
Lakhs)
1 Makavarip
alem-
Visakhapat
nam
Aluminum &
General
Engg.cluster
111.44 2771.70 800.00
2 Kopparthi
– Kadapa
Engineering
Cluster
87.48 2149.75 800.00
3 Gandrajua
plli –
Chittoor
Silk &
Garments
cluster
100.00 3985.31 800.00
4 Peddapura
m – E.G
Dist.
Traditional
Food cluster
20.60 1026.22 800.00
5 Mangalagi
ri – Guntur
Dist.
General Engg
Park
51.83 2537.52 800.00
6 Machilipat
nam –
Krishna
Dist
Upgradation
of existing
Imitation
Jewellary park
43.00 1529.03 743.54
7 Palakollu –
W.G.dist
Upgradation
of existing
Coir park
12.24 750.88 750.88
8 Palasa –
Srikakula
m Dist
Upgradation
of existing
Cashew park
31.61 656.58 656.58
TOTAL : 458.20 15406.99 6151.00
Clusters identified, land acquisition in progress
SL.
No Location of the
Industrial
Cluster
Type of cluster & Acres
1 Jangareddygude
m- West Godavari
DistBhimadolu-
West Godavari Dist
Tobbaco Fish processing
2 Agiripalli –
Krishna Dist
Food processing
3 Nellore Studded Jewellary
4 Piler – Chittoor
Dist
Silk & Garment cluster
5 Raidurg – Anantapuram
Dist
Garments cluster
6 Bethamcherla –
Kurnool Dist
Slab polishing cluster
Additional clusters identified
SL.
No
Location of the
Industrial Cluster
Type of cluster
& Acres
1 Bobbili – Vizianagaram
District
Mango Jelly cluster – 50
Ares
2 Achutapuram-
Visakhapatnam
Marine –
Min 100 acresFine &
Specialty chemicals cluster –
300 acres Petrochemicals –
Plastic – 300 acres
3 Guntur Spices –
Apache resumed land
4 Prakasam Dist Upgradation of existing
BPSEZ infrastructure
Facilities
5 Pulivendala – Cuddapah
Dist Yerra
guntla
Engineering cluster
Engineering cluster

AAAnnndddhhhrrraaa PPPrrraaadddeeessshhh PPPrrrooofff iii llleee
28
Handloom clusters in AP
As per the Handloom Census 2009-10, there were 3,55,838 handloom weavers in the state of Andhra Pradesh, with 1,24,714 handlooms. The share of AP to total number of weavers in the country is 8.21 %, while the share of handlooms in total country’s number of looms is 5.4%. DC(Handlooms) is implementing Integrated Handlooms Development Scheme in AP in one Mega cluster of Prakasam and Guntur districts which has a total of 25000 handlooms, and two big clusters at Madhavaram and Chirala which have 5000 looms Famous handloom clusters in the state include Venkatagiri, Mangalagiri, Puttapaka, Uppada, etc.
Handicrafts in AP
Kondapalli toys (Krishna district), Etikoppaka toys ( Visakhapatnam district) Bobbili Veena ( Vizianagaram dist), Budithi artware ( Srikakulam) Butta Bommalu of East & West Godavari districts are the famous handicrafts of AP
AAAnnndddhhhrrraaa PPPrrraaadddeeessshhh PPPrrrooofff iii llleee
29
State Economy
The GSDP of the state at constant (2004-05)prices for 2014-15 (Advance Estimates) was estimated at Rs.2,64,521 crores. The corresponding figure for 2013-14 was Rs.2,46,724, indicating a growth of 7.21%. The agricultural growth rate was 5.90%, Industrial growth rate was 5.25% and services growth rate was 8.48%
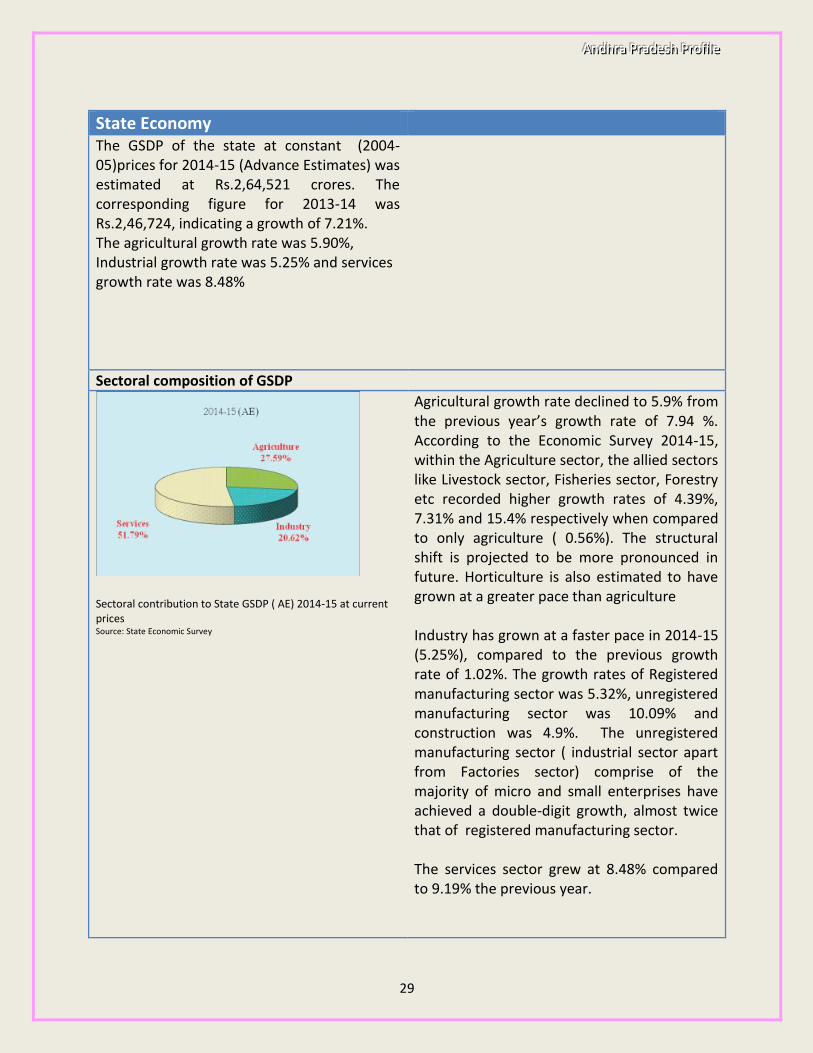
Sectoral composition of GSDP
Sectoral contribution to State GSDP ( AE) 2014-15 at current prices Source: State Economic Survey
Agricultural growth rate declined to 5.9% from the previous year’s growth rate of 7.94 %. According to the Economic Survey 2014-15, within the Agriculture sector, the allied sectors like Livestock sector, Fisheries sector, Forestry etc recorded higher growth rates of 4.39%, 7.31% and 15.4% respectively when compared to only agriculture ( 0.56%). The structural shift is projected to be more pronounced in future. Horticulture is also estimated to have grown at a greater pace than agriculture Industry has grown at a faster pace in 2014-15 (5.25%), compared to the previous growth rate of 1.02%. The growth rates of Registered manufacturing sector was 5.32%, unregistered manufacturing sector was 10.09% and construction was 4.9%. The unregistered manufacturing sector ( industrial sector apart from Factories sector) comprise of the majority of micro and small enterprises have achieved a double-digit growth, almost twice that of registered manufacturing sector. The services sector grew at 8.48% compared to 9.19% the previous year.
AAAnnndddhhhrrraaa PPPrrraaadddeeessshhh PPPrrrooofff iii llleee
30
***
Per capita income
The Per Capital Income ( PCI) of AP at current prices for 2014-15 increased to Rs. 90,517 from Rs. 81,397, recording a growth of 11.21 percent. PCI for the country ws Rs. 88,533 at current prices (2014-15) (AE)
Visakhapatnam had the highest PCI at current prices ( Rs1,24,162) followed by Krishna ( 1,04,897), and WG (Rs. 86,974). The lest PCI was recorded by Srikakulam ( Rs 7,174), followed by Vizianagaram ( Rs.61,157) and Chittoor district ( Rs. 64,671)
District wise Income levels
The District Domestic Product estimates the district income. The estimates for the year 2013-14 ( at current prices) revealed that Visakhapatnam has the maximum Gross District Domestic Product ( GDDP) at Rs 65458 Crores, followed by Krishna district ( Rs 55472 crores), and EG ( Rs. 46643 crores). The least GDDP was recorded by Vizianagaram ( Rs 16386 crores), Srikakulam ( Rs. 17846 crores) and YSR Kadapa district ( Rs. 23643 crores)
Poverty and Unemployment
Poverty figures available for united AP upto the year 2011-12 show that the percentage of people below Poverty line is constantly decreasing . From 29.9% in 2004-05 and 21.1% in 2009-10, it has decreased to 9.20% in 2011-12. Urban poverty percentage during 2011-12 ws 10.96% while rural poverty was 5.81%
The All India percentage of people below the poverty line during 2004-05 was higher than AP at 37.2%, and 29.8% in 2009-10. In 2011-12 it stood at 21.92%
The rate of unemployment in united AP during 2009-10 ( 66th Round NSSO survey) for rual was 12, and for Urban was 31. During 2011-12( 68th Round) the figures were 12 and 43 respectively, showing incrase in urban unemployment. (Unemployment rates are defined as number of persons
unemployed per 1000 persons in the labour force)
The corresponding figures at All India level for 2009-10 were 16 and 34 respectively. For 2011-12, unemployment rates in rural were 17 and Urban were 34.