Embed Size (px)
Citation preview
© Freytag 2008© Freytag 2008 11
AndreasAndreas FreytagFreytag BoP-Dynamics in South Africa: The Micro PerspectiveBoP-Dynamics in South Africa: The Micro Perspective
Presentation of Draft ReportPresentation of Draft Report
Balance of Payments Dynamics, Institutions and Balance of Payments Dynamics, Institutions and Economic Performance in South AfricaEconomic Performance in South Africa
Workshop organised byWorkshop organised bySAIIA/TIPS/FESSAIIA/TIPS/FES
August 13, 2008August 13, 2008PretoriaPretoria
Andreas FreytagAndreas Freytag FSU Jena and ECIPE, BrusselsFSU Jena and ECIPE, Brussels
© Freytag 2008© Freytag 2008 22
AndreasAndreas FreytagFreytag BoP-Dynamics in South Africa: The Micro PerspectiveBoP-Dynamics in South Africa: The Micro Perspective
Balance of Payments Dynamics, Institutions and Balance of Payments Dynamics, Institutions and Economic Performance in South AfricaEconomic Performance in South Africa
Outline of the PresentationOutline of the Presentation
1. Introduction1. Introduction
2. Balance of payment in South Africa: an overview2. Balance of payment in South Africa: an overview
3. Theoretical background 3. Theoretical background
4. The evidence4. The evidence
5. Policy conclusions: preliminary lessons for South Africa5. Policy conclusions: preliminary lessons for South Africa
© Freytag 2008© Freytag 2008 33
AndreasAndreas FreytagFreytag BoP-Dynamics in South Africa: The Micro PerspectiveBoP-Dynamics in South Africa: The Micro Perspective
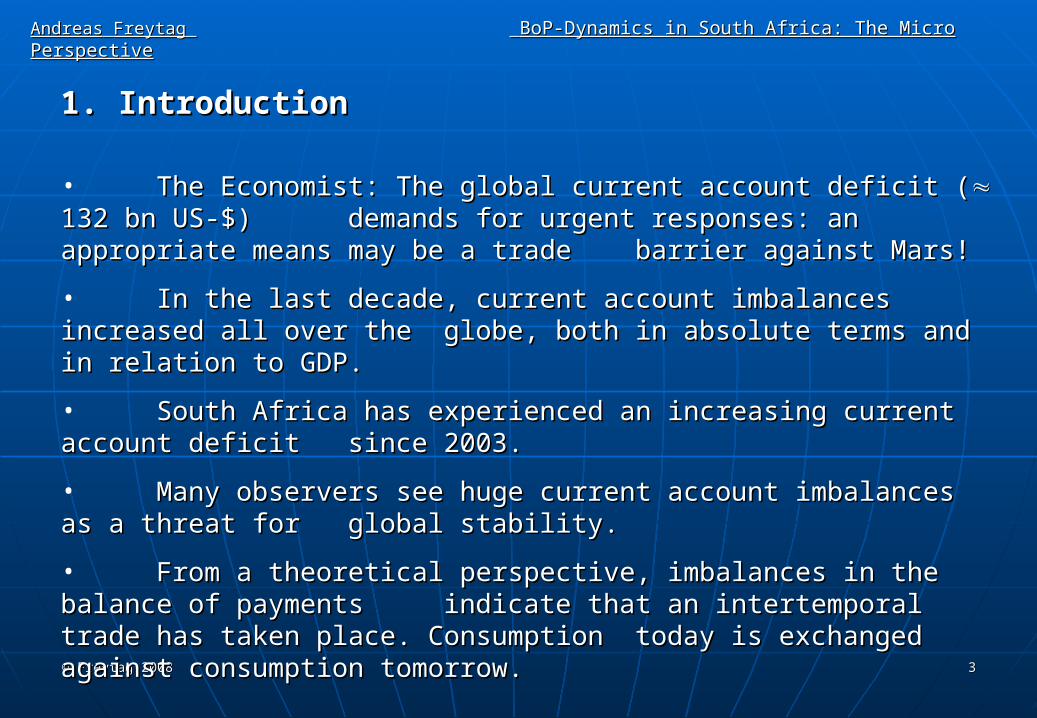
1. Introduction1. Introduction
• The Economist: The global current account deficit (The Economist: The global current account deficit ( 132 bn US-$) 132 bn US-$) demands for urgent responses: an appropriate means may be a trade demands for urgent responses: an appropriate means may be a trade barrier against Mars!barrier against Mars!
• In the last decade, current account imbalances increased all over the In the last decade, current account imbalances increased all over the globe, both in absolute terms and in relation to GDP.globe, both in absolute terms and in relation to GDP.
• South Africa has experienced an increasing current account deficit South Africa has experienced an increasing current account deficit since 2003.since 2003.
• Many observers see huge current account imbalances as a threat for Many observers see huge current account imbalances as a threat for global stability. global stability.
• From a theoretical perspective, imbalances in the balance of payments From a theoretical perspective, imbalances in the balance of payments indicate that an intertemporal trade has taken place. Consumption indicate that an intertemporal trade has taken place. Consumption today is exchanged against consumption tomorrow.today is exchanged against consumption tomorrow.
© Freytag 2008© Freytag 2008 44
AndreasAndreas FreytagFreytag BoP-Dynamics in South Africa: The Micro PerspectiveBoP-Dynamics in South Africa: The Micro Perspective
• Whether this trade is welfare enhancing, is depending on how capital Whether this trade is welfare enhancing, is depending on how capital imports are used (sustainability?)imports are used (sustainability?)
• in other words: is a bop-imbalance automatically a disequilibrium?in other words: is a bop-imbalance automatically a disequilibrium?
• What factors does the current account depend on?What factors does the current account depend on?
• We attempt to combine the dominant macroeconomic analysis with We attempt to combine the dominant macroeconomic analysis with institutional economics to sort out how to judge the South African institutional economics to sort out how to judge the South African current account development.current account development.
© Freytag 2008© Freytag 2008 55
AndreasAndreas FreytagFreytag BoP-Dynamics in South Africa: The Micro PerspectiveBoP-Dynamics in South Africa: The Micro Perspective
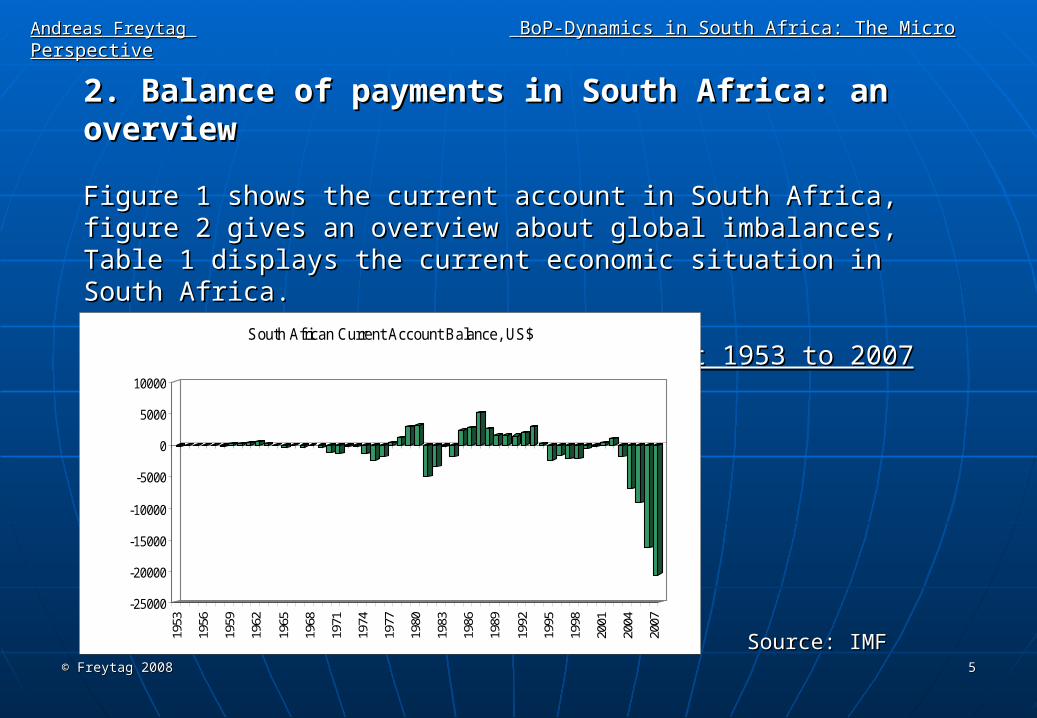
2. Balance of payments in South Africa: an overview2. Balance of payments in South Africa: an overview
Figure 1 shows the current account in South Africa, figure 2 gives an Figure 1 shows the current account in South Africa, figure 2 gives an overview about global imbalances, Table 1 displays the current economic overview about global imbalances, Table 1 displays the current economic situation in South Africa. situation in South Africa.
Figure 1: South African Current Account 1953 to 2007Figure 1: South African Current Account 1953 to 2007
-25000
-20000
-15000
-10000
-5000
0
5000
10000
1953
1956
1959
1962
1965
1968
1971
1974
1977
1980
1983
1986
1989
1992
1995
1998
2001
2004
2007
South African Current Account Balance, US$
Source: IMFSource: IMF
© Freytag 2008© Freytag 2008 66
AndreasAndreas FreytagFreytag BoP-Dynamics in South Africa: The Micro PerspectiveBoP-Dynamics in South Africa: The Micro Perspective
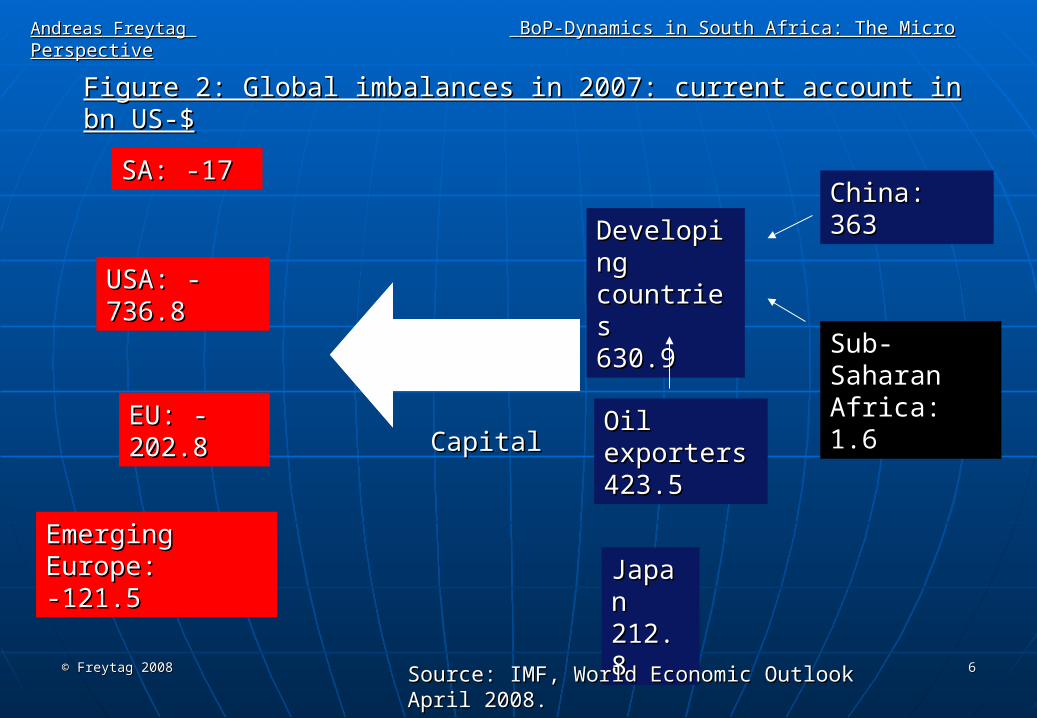
Figure 2: Global imbalances in 2007: current account in bn US-$Figure 2: Global imbalances in 2007: current account in bn US-$
USA: -736.8USA: -736.8
China: 363China: 363
Emerging Europe:Emerging Europe:-121.5-121.5
Oil exportersOil exporters423.5423.5
EU: -202.8EU: -202.8
Developing Developing countriescountries630.9630.9
Sub-Saharan Sub-Saharan Africa: 1.6Africa: 1.6
JapanJapan212.8212.8
CapitalCapital
SA: -17SA: -17
Source: IMF, World Economic Outlook April 2008.Source: IMF, World Economic Outlook April 2008.
© Freytag 2008© Freytag 2008 77
AndreasAndreas FreytagFreytag BoP-Dynamics in South Africa: The Micro PerspectiveBoP-Dynamics in South Africa: The Micro Perspective
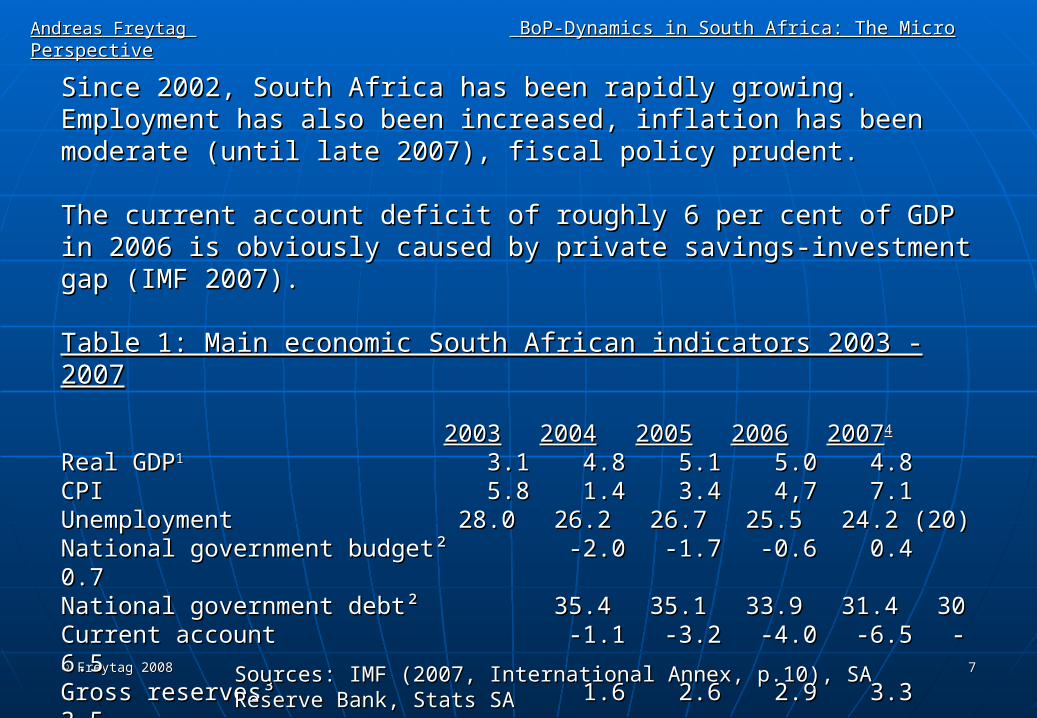
Since 2002, South Africa has been rapidly growing. Employment has also Since 2002, South Africa has been rapidly growing. Employment has also been increased, inflation has been moderate (until late 2007), fiscal policy been increased, inflation has been moderate (until late 2007), fiscal policy prudent. prudent.
The current account deficit of roughly 6 per cent of GDP in 2006 is obviously The current account deficit of roughly 6 per cent of GDP in 2006 is obviously caused by private savings-investment gap (IMF 2007).caused by private savings-investment gap (IMF 2007).
Table 1: Main economic South African indicators 2003 - 2007Table 1: Main economic South African indicators 2003 - 2007
20032003 20042004 20052005 20062006 2007200744
Real GDPReal GDP11 3.1 3.1 4.8 4.8 5.1 5.1 5.0 5.0 4.8 4.8CPICPI 5.8 5.8 1.4 1.4 3.4 3.4 4,7 4,7 7.1 7.1UnemploymentUnemployment 28.0 28.0 26.2 26.2 26.7 26.7 25.5 25.5 24.2 (20) 24.2 (20)National government budget²National government budget² -2.0 -2.0 -1.7 -1.7 -0.6 -0.6 0.4 0.4 0.7 0.7National government debt²National government debt² 35.4 35.4 35.1 35.1 33.9 33.9 31.4 31.4 30 30Current accountCurrent account -1.1 -1.1 -3.2 -3.2 -4.0 -4.0 -6.5 -6.5 -6.5 -6.5Gross reserves³Gross reserves³ 1.6 1.6 2.6 2.6 2.9 2.9 3.3 3.3 3.5 3.5
1: annual growth rate; ²: in per cent of GDP; ³: in months of next year’s im1: annual growth rate; ²: in per cent of GDP; ³: in months of next year’s imports; ports; 44: partly: partly projections.projections.
Sources: IMF (2007, International Annex, p.10), SA Reserve Bank, Stats SASources: IMF (2007, International Annex, p.10), SA Reserve Bank, Stats SA
© Freytag 2008© Freytag 2008 88
AndreasAndreas FreytagFreytag BoP-Dynamics in South Africa: The Micro PerspectiveBoP-Dynamics in South Africa: The Micro Perspective
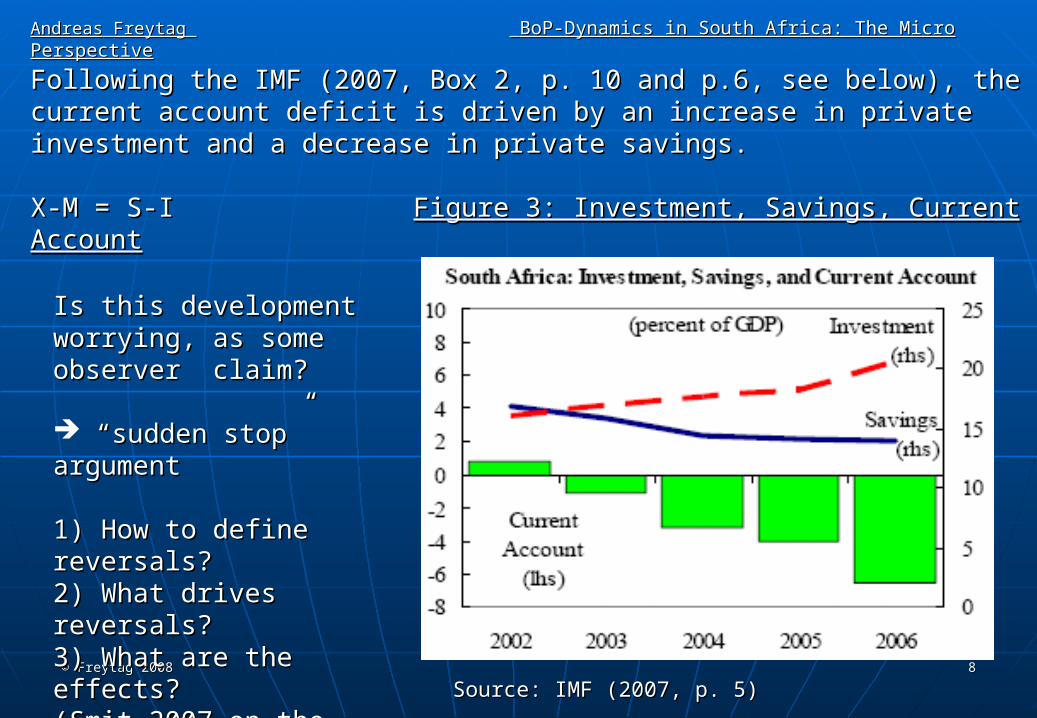
Following the IMF (2007, Box 2, p. 10 and p.6, see below), the current account Following the IMF (2007, Box 2, p. 10 and p.6, see below), the current account deficit is driven by an increase in private investment and a decrease in private deficit is driven by an increase in private investment and a decrease in private savings. savings.
X-M = S-IX-M = S-I Figure 3: Investment, Savings, Current AccountFigure 3: Investment, Savings, Current Account
Is this development Is this development worrying, as some observer worrying, as some observer claim? claim?
“ “sudden stop” argumentsudden stop” argument
1) How to define reversals?1) How to define reversals?2) What drives reversals?2) What drives reversals?3) What are the effects?3) What are the effects?(Smit 2007 on the macro (Smit 2007 on the macro perspective)perspective)
Source: IMF (2007, p. 5)Source: IMF (2007, p. 5)
© Freytag 2008© Freytag 2008 99
AndreasAndreas FreytagFreytag BoP-Dynamics in South Africa: The Micro PerspectiveBoP-Dynamics in South Africa: The Micro Perspective
3. Theoretical Background3. Theoretical Background
To explain and judge developments in the balance of payments (BoP), To explain and judge developments in the balance of payments (BoP), many approaches are available.many approaches are available.
Identity: Exports minus imports equals savings minus investments! Thus, it Identity: Exports minus imports equals savings minus investments! Thus, it is impossible to analyse the current account and/or trade balance without is impossible to analyse the current account and/or trade balance without looking at the capital account.looking at the capital account.
The most serious and widely accepted view is the intertemporal approach The most serious and widely accepted view is the intertemporal approach to the balance of payments (e.g. Böhm-Bawerk 1914; Obstfeld and Rogoff to the balance of payments (e.g. Böhm-Bawerk 1914; Obstfeld and Rogoff 1994; Dluhosch, Freytag and Krüger 1996; Corden 2007). 1994; Dluhosch, Freytag and Krüger 1996; Corden 2007).
According to this approach, the balance of payments is the result of According to this approach, the balance of payments is the result of disaggregated, i.e. individual decisions about consumption, sales, savings disaggregated, i.e. individual decisions about consumption, sales, savings and investments, i.e. intertemporal trade.and investments, i.e. intertemporal trade.
© Freytag 2008© Freytag 2008 1010
AndreasAndreas FreytagFreytag BoP-Dynamics in South Africa: The Micro PerspectiveBoP-Dynamics in South Africa: The Micro Perspective
Unless trade is forced or restricted, the balance of payments is based on Unless trade is forced or restricted, the balance of payments is based on optimal plans (which may turn out to be suboptimal in the future). optimal plans (which may turn out to be suboptimal in the future).
Instead of being a disequilibrium, current account imbalances can be Instead of being a disequilibrium, current account imbalances can be interpreted as sustainable equilibria (Dooley, Garber and Folkerts-Landau interpreted as sustainable equilibria (Dooley, Garber and Folkerts-Landau 2007).2007).
Thus, it seems inappropriate to talk of improvement or worsening with Thus, it seems inappropriate to talk of improvement or worsening with respect to the trade balance.respect to the trade balance.
The exchange rate is an adjustment parameter to bring about the transfer The exchange rate is an adjustment parameter to bring about the transfer from the capital account to the current account.from the capital account to the current account.
However: In politics, an alternative thinking, labelled the competitiveness However: In politics, an alternative thinking, labelled the competitiveness approach, is fashionable. The exchange rate is a policy instrument to approach, is fashionable. The exchange rate is a policy instrument to redirect trade flows redirect trade flows Marshall Lerner condition. Marshall Lerner condition.
© Freytag 2008© Freytag 2008 1111
AndreasAndreas FreytagFreytag BoP-Dynamics in South Africa: The Micro PerspectiveBoP-Dynamics in South Africa: The Micro Perspective
What drives (individual) decisionmaking with respect to savings and What drives (individual) decisionmaking with respect to savings and investment?investment?
ability to save (not really given for many in South Africa)ability to save (not really given for many in South Africa) Drivers of savings: age structure, income, educational level, Drivers of savings: age structure, income, educational level, institutions, inflationinstitutions, inflation
MECMEC MEC is driven by institutions, that is rules, habits, morale etc which MEC is driven by institutions, that is rules, habits, morale etc which are investment friendly;are investment friendly; besides, infrastructure, education and demographics matter;besides, infrastructure, education and demographics matter; natural resources may encourage fdinatural resources may encourage fdi fiscal and monetary stability are encouraging private investment.fiscal and monetary stability are encouraging private investment.
A national current account imbalance (deficit or surplus) tells us to what extent a A national current account imbalance (deficit or surplus) tells us to what extent a country is successfully competing on the world’s savings, I.e. mobile capital.country is successfully competing on the world’s savings, I.e. mobile capital.
Special role for fdi (vs. portfolio investment)Special role for fdi (vs. portfolio investment)
© Freytag 2008© Freytag 2008 1212
AndreasAndreas FreytagFreytag BoP-Dynamics in South Africa: The Micro PerspectiveBoP-Dynamics in South Africa: The Micro Perspective
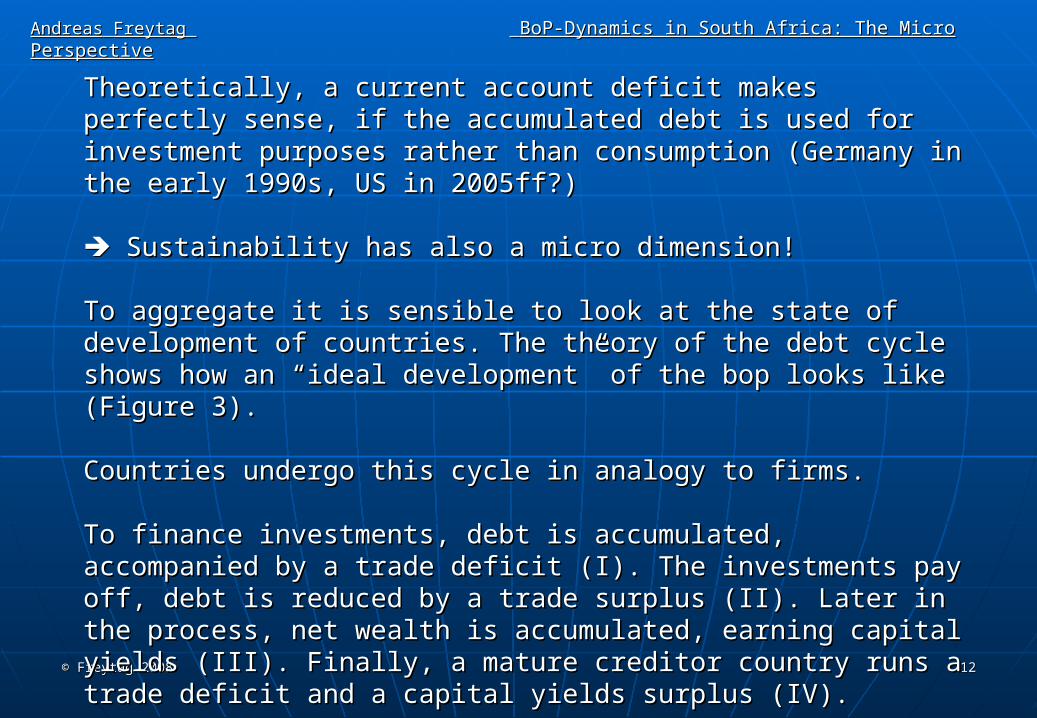
Theoretically, a current account deficit makes perfectly sense, if the Theoretically, a current account deficit makes perfectly sense, if the accumulated debt is used for investment purposes rather than accumulated debt is used for investment purposes rather than consumption (Germany in the early 1990s, US in 2005ff?)consumption (Germany in the early 1990s, US in 2005ff?)
Sustainability has also a micro dimension!Sustainability has also a micro dimension!
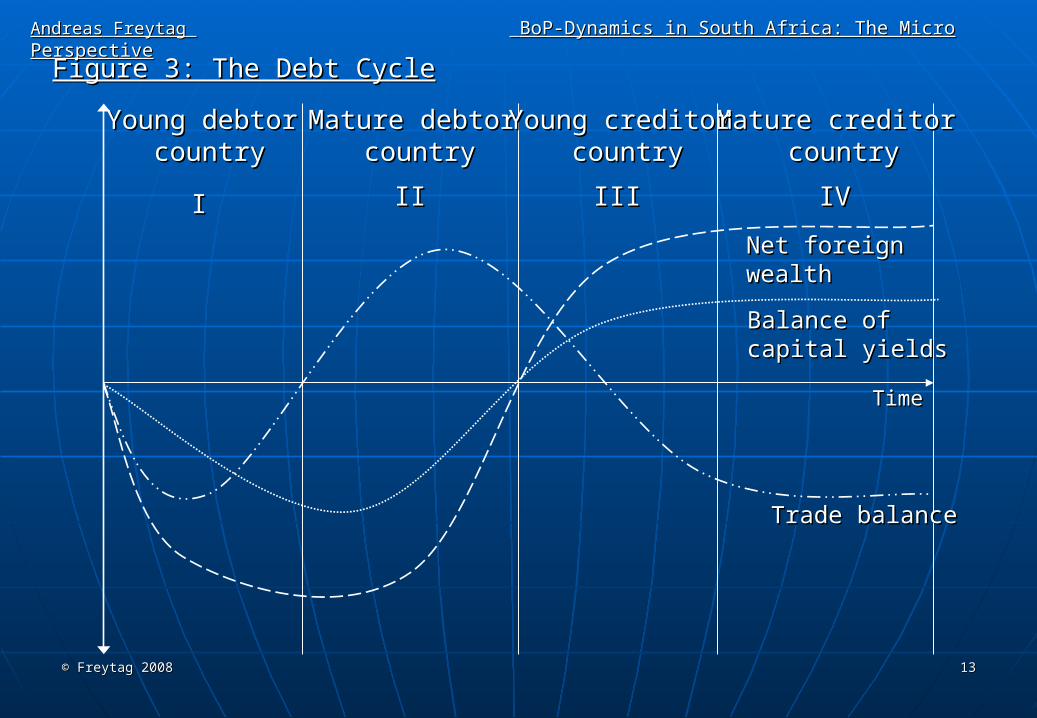
To aggregate it is sensible to look at the state of development of countries. To aggregate it is sensible to look at the state of development of countries. The theory of the debt cycle shows how an “ideal development” of the bop The theory of the debt cycle shows how an “ideal development” of the bop looks like (Figure 3). looks like (Figure 3).
Countries undergo this cycle in analogy to firms. Countries undergo this cycle in analogy to firms.
To finance investments, debt is accumulated, accompanied by a trade To finance investments, debt is accumulated, accompanied by a trade deficit (I). The investments pay off, debt is reduced by a trade surplus (II). deficit (I). The investments pay off, debt is reduced by a trade surplus (II). Later in the process, net wealth is accumulated, earning capital yields (III). Later in the process, net wealth is accumulated, earning capital yields (III). Finally, a mature creditor country runs a trade deficit and a capital yields Finally, a mature creditor country runs a trade deficit and a capital yields surplus (IV).surplus (IV).
© Freytag 2008© Freytag 2008 1313
AndreasAndreas FreytagFreytag BoP-Dynamics in South Africa: The Micro PerspectiveBoP-Dynamics in South Africa: The Micro Perspective
TimeTime
Trade balanceTrade balance
Balance of Balance of capital yieldscapital yields
Net foreign Net foreign wealthwealth
Young debtorYoung debtor countrycountry
Mature creditorMature creditor countrycountry
Mature debtorMature debtor countrycountry
Young creditorYoung creditor countrycountry
II IVIVIIIIIIIIII
Figure 3: The Debt CycleFigure 3: The Debt Cycle
© Freytag 2008© Freytag 2008 1414
AndreasAndreas FreytagFreytag BoP-Dynamics in South Africa: The Micro PerspectiveBoP-Dynamics in South Africa: The Micro Perspective
The role of the exchange rate The role of the exchange rate
Adjustment parameter?Adjustment parameter?
Real exchange rate defined as follows Real exchange rate defined as follows
eereal real = P= PTT/P/PNN
South Africa: Capital inflowsSouth Africa: Capital inflows⇧ ⇧ P PTT constant, P constant, PNN ⇧ ⇧, real exchange rate , real exchange rate ⇩ ⇩ X X ⇩ ⇩ , M , M ⇧⇧ current account deficit. current account deficit.
Once the supply side has adjusted so that the appreciation is no longer Once the supply side has adjusted so that the appreciation is no longer needed to allow the current account deficit, the currency may well needed to allow the current account deficit, the currency may well depreciate again depreciate again overshooting! overshooting!
Policy variable? Policy variable?
The latest depreciation did not reduce the current account deficit!The latest depreciation did not reduce the current account deficit!
© Freytag 2008© Freytag 2008 1515
AndreasAndreas FreytagFreytag BoP-Dynamics in South Africa: The Micro PerspectiveBoP-Dynamics in South Africa: The Micro Perspective
4. The evidence4. The evidence
What are the main drivers of the current account deficit? Does South Africa What are the main drivers of the current account deficit? Does South Africa match this ideal pattern? How sustainable is the development?match this ideal pattern? How sustainable is the development?
Macroeconomic conditionsMacroeconomic conditions Exchange rate developmentExchange rate development Structural changeStructural change Structure of imports and capital inflowsStructure of imports and capital inflows Debt cycleDebt cycle InstitutionsInstitutions South African policy framework (Asgisa, NIPF)South African policy framework (Asgisa, NIPF)
Relevant: OECD report on microeconomic shortcomings and planned remedies!Relevant: OECD report on microeconomic shortcomings and planned remedies!
The Harvard group has also discussed economic policy issues comprehensively.The Harvard group has also discussed economic policy issues comprehensively.
© Freytag 2008© Freytag 2008 1616
AndreasAndreas FreytagFreytag BoP-Dynamics in South Africa: The Micro PerspectiveBoP-Dynamics in South Africa: The Micro Perspective
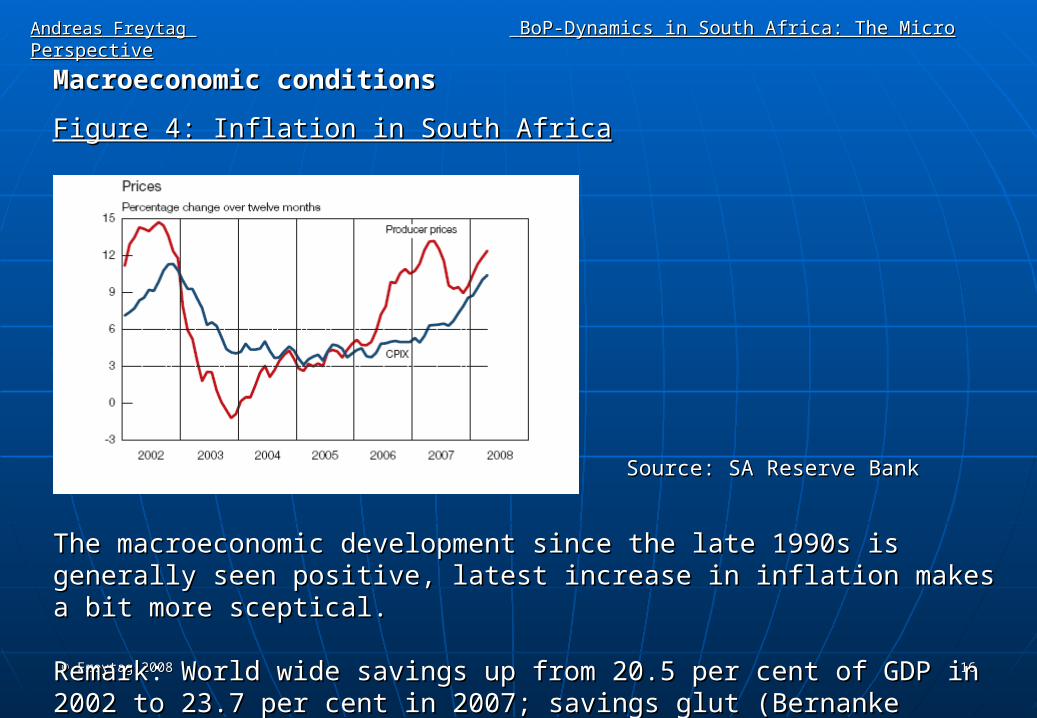
Macroeconomic conditionsMacroeconomic conditions
Figure 4: Inflation in South AfricaFigure 4: Inflation in South Africa
The macroeconomic development since the late 1990s is generally seen The macroeconomic development since the late 1990s is generally seen positive, latest increase in inflation makes a bit more sceptical.positive, latest increase in inflation makes a bit more sceptical.
RemarkRemark: World wide savings up from 20.5 per cent of GDP in 2002 to 23.7 per World wide savings up from 20.5 per cent of GDP in 2002 to 23.7 per cent in 2007; savings glut (Bernanke 2005).cent in 2007; savings glut (Bernanke 2005).
Source: SA Reserve BankSource: SA Reserve Bank
© Freytag 2008© Freytag 2008 1717
AndreasAndreas FreytagFreytag BoP-Dynamics in South Africa: The Micro PerspectiveBoP-Dynamics in South Africa: The Micro Perspective
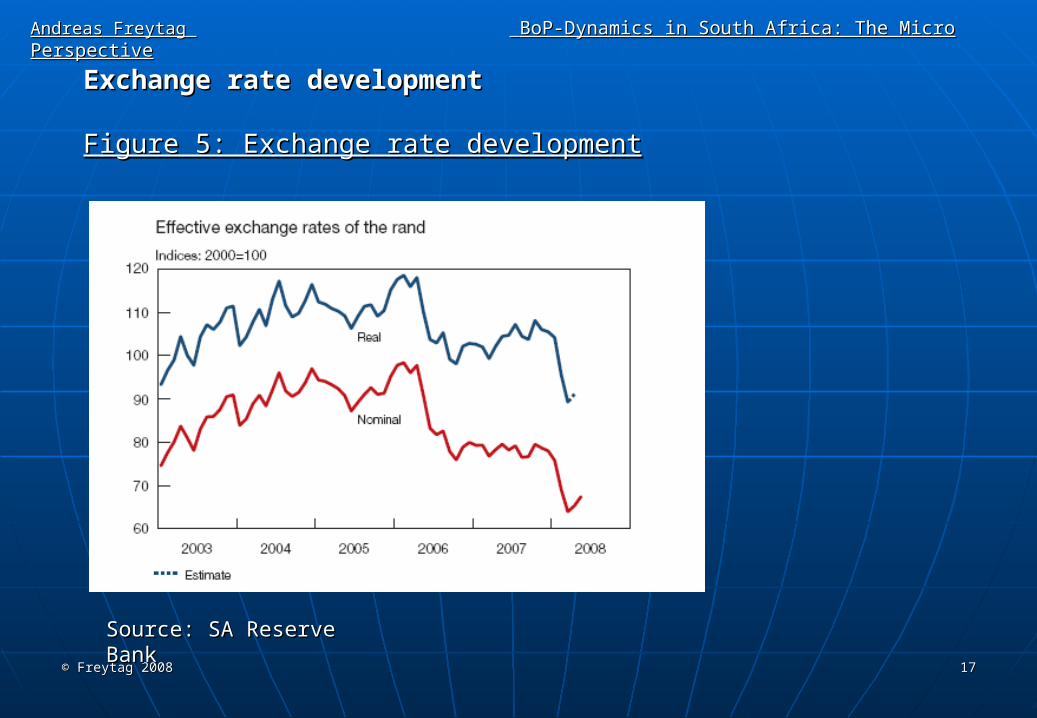
Exchange rate developmentExchange rate development
Figure 5: Exchange rate developmentFigure 5: Exchange rate development
Source: SA Reserve BankSource: SA Reserve Bank
© Freytag 2008© Freytag 2008 1818
AndreasAndreas FreytagFreytag BoP-Dynamics in South Africa: The Micro PerspectiveBoP-Dynamics in South Africa: The Micro Perspective
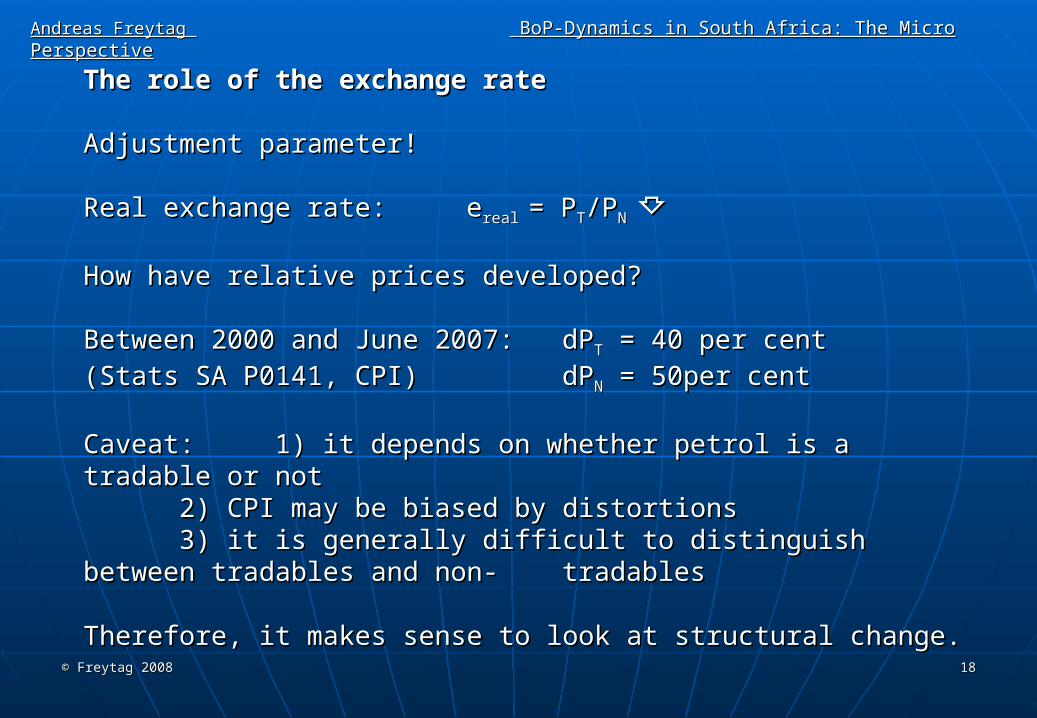
The role of the exchange rate The role of the exchange rate
Adjustment parameter!Adjustment parameter!
Real exchange rate:Real exchange rate: eereal real = P= PTT/P/PN N ⇩⇩
How have relative prices developed?How have relative prices developed?
Between 2000 and June 2007: Between 2000 and June 2007: dPdPTT = 40 per cent = 40 per cent
(Stats SA P0141, CPI)(Stats SA P0141, CPI) dPdPNN = 50per cent = 50per cent
Caveat:Caveat: 1) it depends on whether petrol is a tradable or not1) it depends on whether petrol is a tradable or not2) CPI may be biased by distortions2) CPI may be biased by distortions3) it is generally difficult to distinguish between tradables and non- 3) it is generally difficult to distinguish between tradables and non- tradablestradables
Therefore, it makes sense to look at structural change.Therefore, it makes sense to look at structural change.
© Freytag 2008© Freytag 2008 1919
AndreasAndreas FreytagFreytag BoP-Dynamics in South Africa: The Micro PerspectiveBoP-Dynamics in South Africa: The Micro Perspective
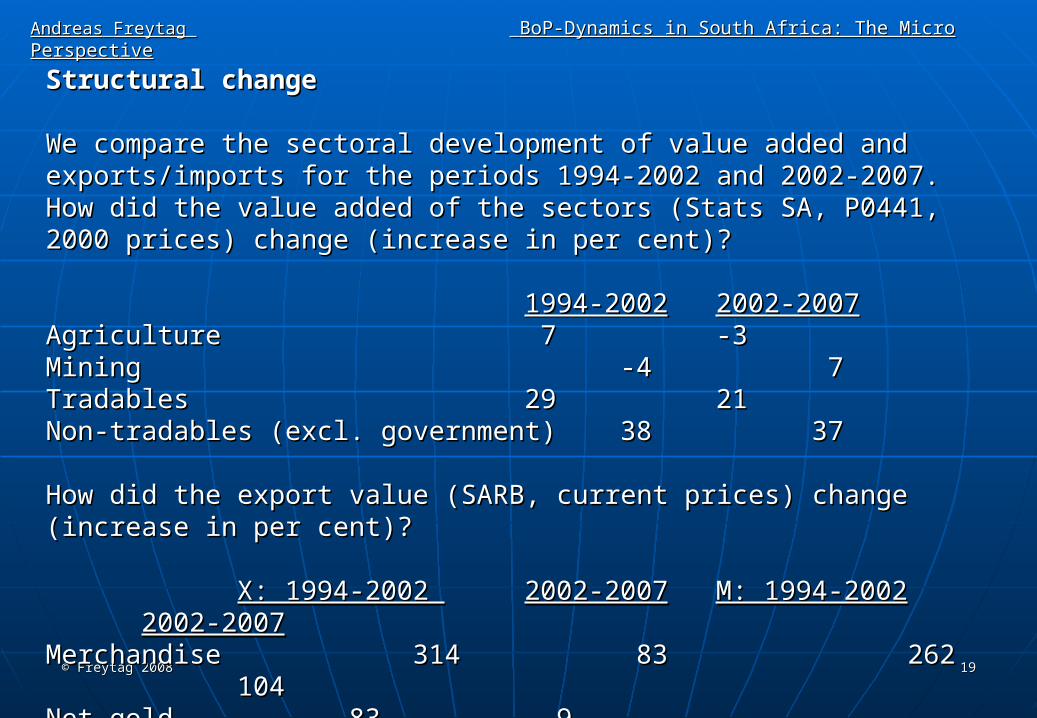
Structural changeStructural change
We compare the sectoral development of value added and exports/imports for We compare the sectoral development of value added and exports/imports for the periods 1994-2002 and 2002-2007. How did the value added of the sectors the periods 1994-2002 and 2002-2007. How did the value added of the sectors (Stats SA, P0441, 2000 prices) change (increase in per cent)? (Stats SA, P0441, 2000 prices) change (increase in per cent)?
1994-20021994-2002 2002-20072002-2007AgricultureAgriculture 7 7 -3-3MiningMining -4-4 7 7TradablesTradables 2929 2121Non-tradables (excl. government)Non-tradables (excl. government) 3838 3737
How did the export value (SARB, current prices) change (increase in per cent)?How did the export value (SARB, current prices) change (increase in per cent)?
X: 1994-2002 X: 1994-2002 2002-20072002-2007 M: 1994-2002M: 1994-2002 2002-20072002-2007Merchandise Merchandise 314 314 83 83 262 262 104104Net goldNet gold 83 83 -9 -9 - - - - - - - -ServicesServices 206 206 83 83 333 333 123123
© Freytag 2008© Freytag 2008 2020
AndreasAndreas FreytagFreytag BoP-Dynamics in South Africa: The Micro PerspectiveBoP-Dynamics in South Africa: The Micro Perspective
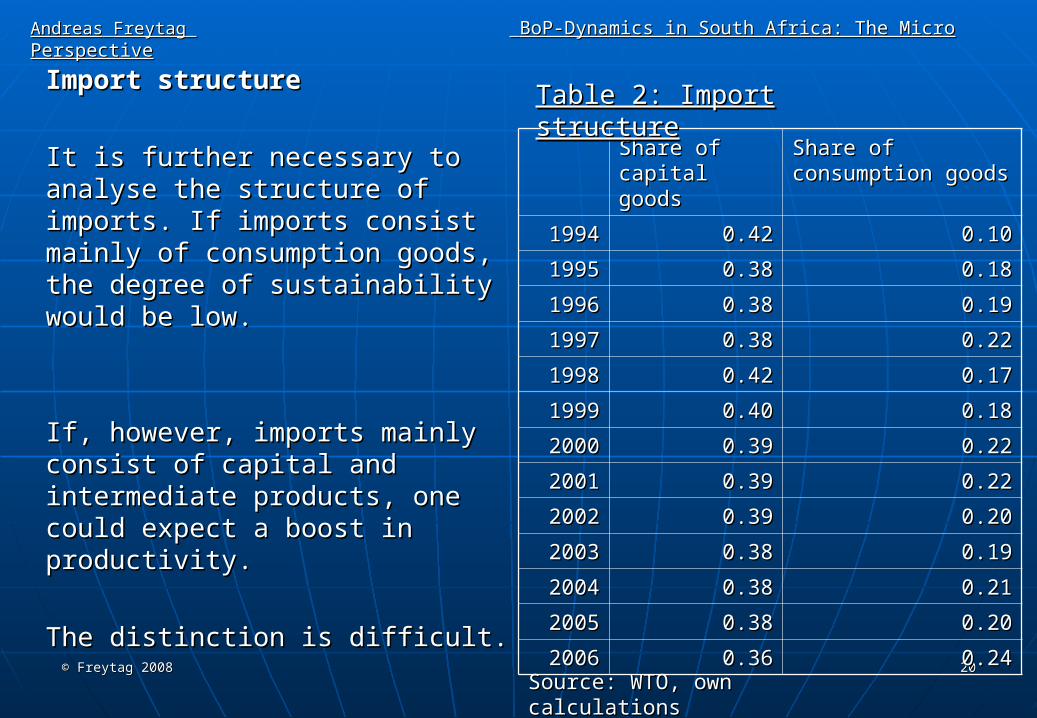
Import structureImport structure
It is further necessary to analyse the It is further necessary to analyse the structure of imports. If imports consist structure of imports. If imports consist mainly of consumption goods, the mainly of consumption goods, the degree of sustainability would be low. degree of sustainability would be low.
If, however, imports mainly consist of If, however, imports mainly consist of capital and intermediate products, one capital and intermediate products, one could expect a boost in productivity.could expect a boost in productivity.
The distinction is difficult.The distinction is difficult.
Share of capital Share of capital goodsgoods
Share of consumption Share of consumption goodsgoods
19941994 0.420.42 0.100.10
19951995 0.380.38 0.180.18
19961996 0.380.38 0.190.19
19971997 0.380.38 0.220.22
19981998 0.420.42 0.170.17
19991999 0.400.40 0.180.18
20002000 0.390.39 0.220.22
20012001 0.390.39 0.220.22
20022002 0.390.39 0.200.20
20032003 0.380.38 0.190.19
20042004 0.380.38 0.210.21
20052005 0.380.38 0.200.20
20062006 0.360.36 0.240.24
Source: WTO, own calculationsSource: WTO, own calculations
Table 2: Import structureTable 2: Import structure
© Freytag 2008© Freytag 2008 2121
AndreasAndreas FreytagFreytag BoP-Dynamics in South Africa: The Micro PerspectiveBoP-Dynamics in South Africa: The Micro Perspective
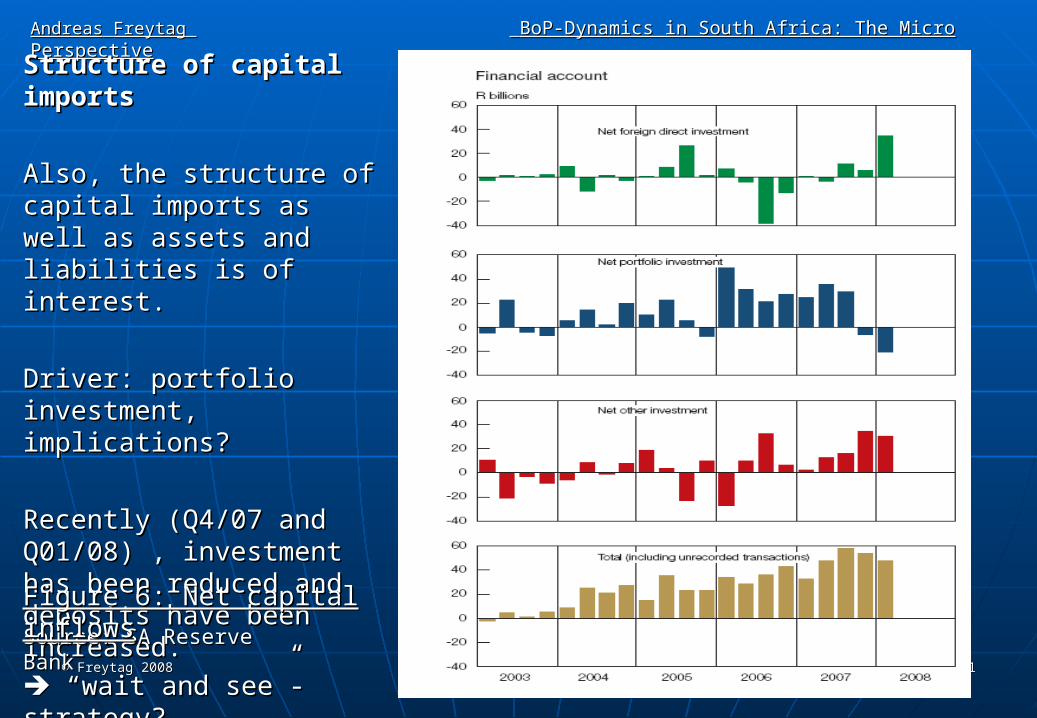
Structure of capital importsStructure of capital imports
Also, the structure of capital Also, the structure of capital imports as well as assets and imports as well as assets and liabilities is of interest. liabilities is of interest.
Driver: portfolio investment, Driver: portfolio investment, implications?implications?
Recently (Q4/07 and Q01/08) , Recently (Q4/07 and Q01/08) , investment has been reduced investment has been reduced and deposits have been and deposits have been increased. increased.
“ “wait and see”-strategy?wait and see”-strategy?
Source: SA Reserve BankSource: SA Reserve Bank
Figure 6: Net capital inflowsFigure 6: Net capital inflows
© Freytag 2008© Freytag 2008 2222
AndreasAndreas FreytagFreytag BoP-Dynamics in South Africa: The Micro PerspectiveBoP-Dynamics in South Africa: The Micro Perspective
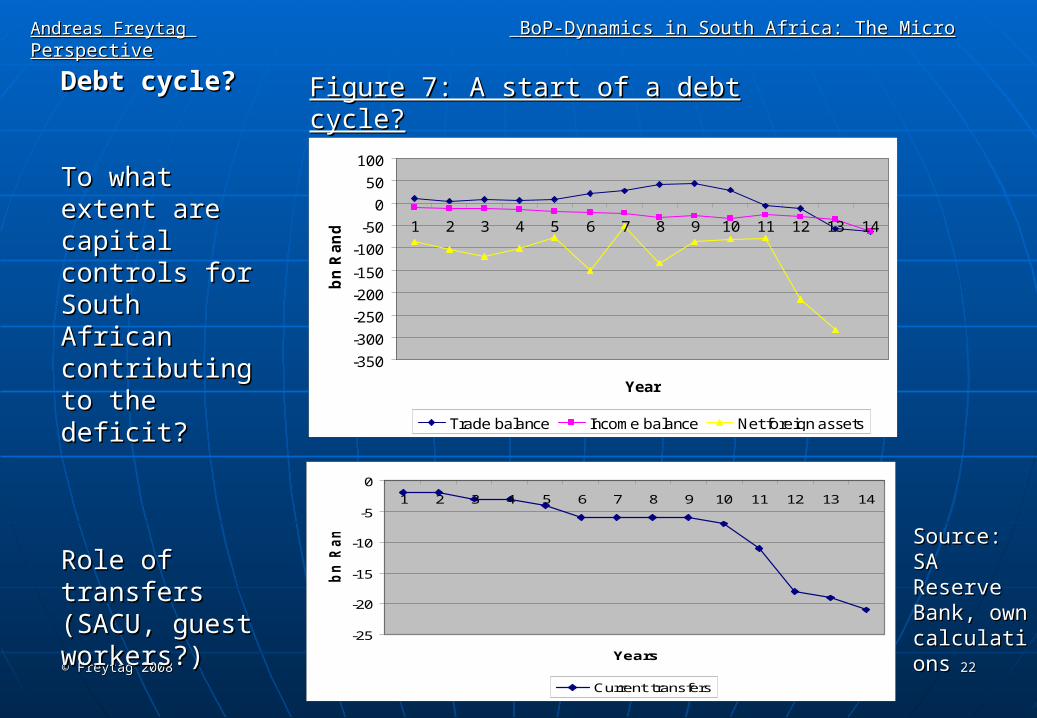
Debt cycle?Debt cycle?
To what extent To what extent are capital are capital controls for controls for South African South African contributing to contributing to the deficit?the deficit?
Role of transfers Role of transfers (SACU, guest (SACU, guest workers?)workers?)
-25
-20
-15
-10
-5
0
1 2 3 4 5 6 7 8 9 10 11 12 13 14
Years
bn
Ran
d
Current transfers
-350
-300
-250
-200
-150
-100
-50
0
50
100
1 2 3 4 5 6 7 8 9 10 11 12 13 14
Year
bn
Ra
nd
Trade balance Income balance Net foreign assets
Figure 7: A start of a debt cycle?Figure 7: A start of a debt cycle?
Source: SA Source: SA Reserve Reserve Bank, own Bank, own calculationscalculations
© Freytag 2008© Freytag 2008 2323
AndreasAndreas FreytagFreytag BoP-Dynamics in South Africa: The Micro PerspectiveBoP-Dynamics in South Africa: The Micro Perspective
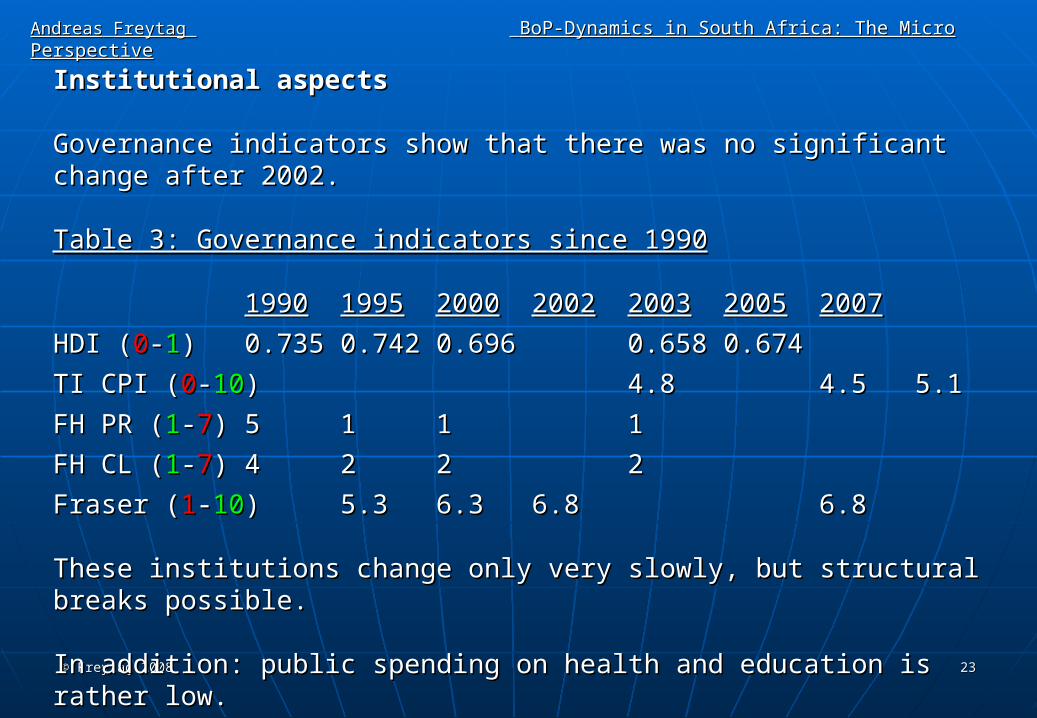
Institutional aspectsInstitutional aspects
Governance indicators show that there was no significant change after 2002.Governance indicators show that there was no significant change after 2002.
Table 3: Governance indicators since 1990Table 3: Governance indicators since 1990
19901990 19951995 20002000 20022002 20032003 20052005 20072007
HDI (HDI (00--11)) 0.7350.735 0.7420.742 0.6960.696 0.6580.658 0.6740.674
TI CPI (TI CPI (00--1010)) 4.84.8 4.54.5 5.15.1
FH PR (FH PR (11--77)) 55 11 11 11
FH CL (FH CL (11--77)) 44 22 22 22
Fraser (Fraser (11--1010)) 5.35.3 6.36.3 6.86.8 6.86.8
These institutions change only very slowly, but structural breaks possible.These institutions change only very slowly, but structural breaks possible. In addition: public spending on health and education is rather low.In addition: public spending on health and education is rather low.
© Freytag 2008© Freytag 2008 2424
AndreasAndreas FreytagFreytag BoP-Dynamics in South Africa: The Micro PerspectiveBoP-Dynamics in South Africa: The Micro Perspective
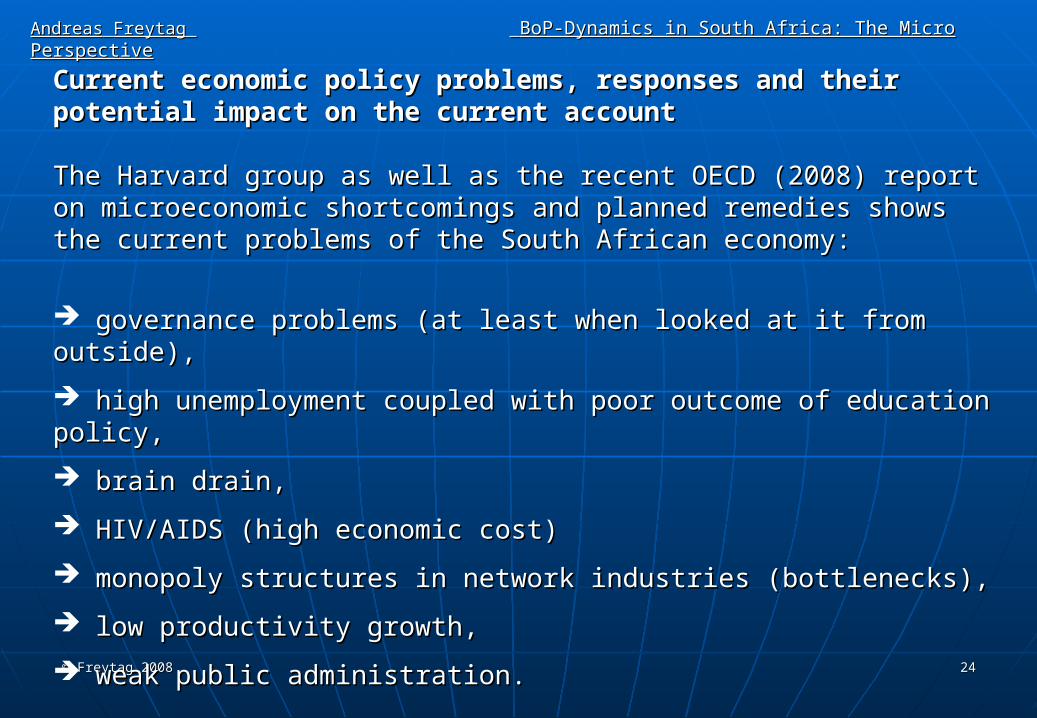
Current economic policy problems, responses and their potential impact Current economic policy problems, responses and their potential impact on the current accounton the current account
The Harvard group as well as the recent OECD (2008) report on microeconomic The Harvard group as well as the recent OECD (2008) report on microeconomic shortcomings and planned remedies shows the current problems of the South shortcomings and planned remedies shows the current problems of the South African economy:African economy:
governance problems (at least when looked at it from outside),governance problems (at least when looked at it from outside),
high unemployment coupled with poor outcome of education policy,high unemployment coupled with poor outcome of education policy,
brain drain, brain drain,
HIV/AIDS (high economic cost)HIV/AIDS (high economic cost)
monopoly structures in network industries (bottlenecks),monopoly structures in network industries (bottlenecks),
low productivity growth, low productivity growth,
weak public administration.weak public administration.
© Freytag 2008© Freytag 2008 2525
AndreasAndreas FreytagFreytag BoP-Dynamics in South Africa: The Micro PerspectiveBoP-Dynamics in South Africa: The Micro Perspective
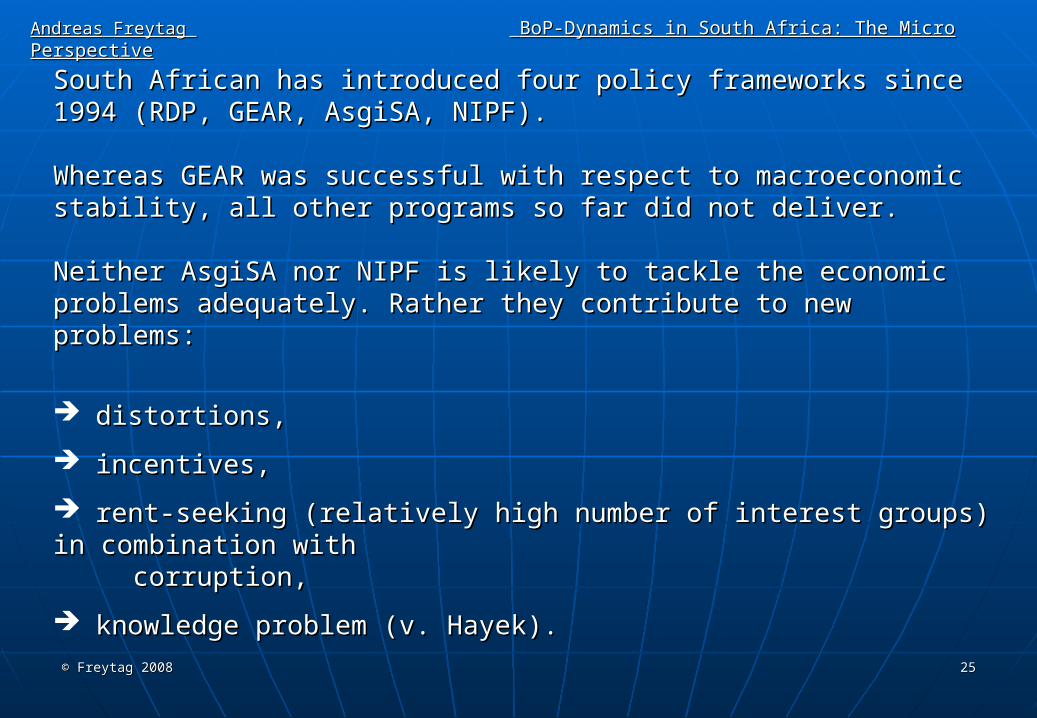
South African has introduced four policy frameworks since 1994 (RDP, GEAR, South African has introduced four policy frameworks since 1994 (RDP, GEAR, AsgiSA, NIPF).AsgiSA, NIPF).
Whereas GEAR was successful with respect to macroeconomic stability, all Whereas GEAR was successful with respect to macroeconomic stability, all other programs so far did not deliver.other programs so far did not deliver.
Neither AsgiSA nor NIPF is likely to tackle the economic problems adequately. Neither AsgiSA nor NIPF is likely to tackle the economic problems adequately. Rather they contribute to new problems:Rather they contribute to new problems:
distortions,distortions,
incentives,incentives,
rent-seeking (relatively high number of interest groups) in combination with rent-seeking (relatively high number of interest groups) in combination with corruption, corruption,
knowledge problem (v. Hayek).knowledge problem (v. Hayek).
© Freytag 2008© Freytag 2008 2626
AndreasAndreas FreytagFreytag BoP-Dynamics in South Africa: The Micro PerspectiveBoP-Dynamics in South Africa: The Micro Perspective
In addition: do the problems as well as inappropriate responses have any effect In addition: do the problems as well as inappropriate responses have any effect on the future development of the current account?on the future development of the current account?
Example: If South Africa allows competition in telecommunication, one can Example: If South Africa allows competition in telecommunication, one can expect a surge in fdi in this industry. This contributes further to the current expect a surge in fdi in this industry. This contributes further to the current account deficit (in line with the theory of the debt cycle), improving the price account deficit (in line with the theory of the debt cycle), improving the price competitiveness of many industries.competitiveness of many industries.
But if South Africa increases subsidies to domestic producers while at the same But if South Africa increases subsidies to domestic producers while at the same time restricting trade further, the reversal is more likely, if S-I is changing due to time restricting trade further, the reversal is more likely, if S-I is changing due to the policy.the policy.
If it does not change, then distortions reduce gross flows without changing the If it does not change, then distortions reduce gross flows without changing the balances.balances.
© Freytag 2008© Freytag 2008 2727
AndreasAndreas FreytagFreytag BoP-Dynamics in South Africa: The Micro PerspectiveBoP-Dynamics in South Africa: The Micro Perspective
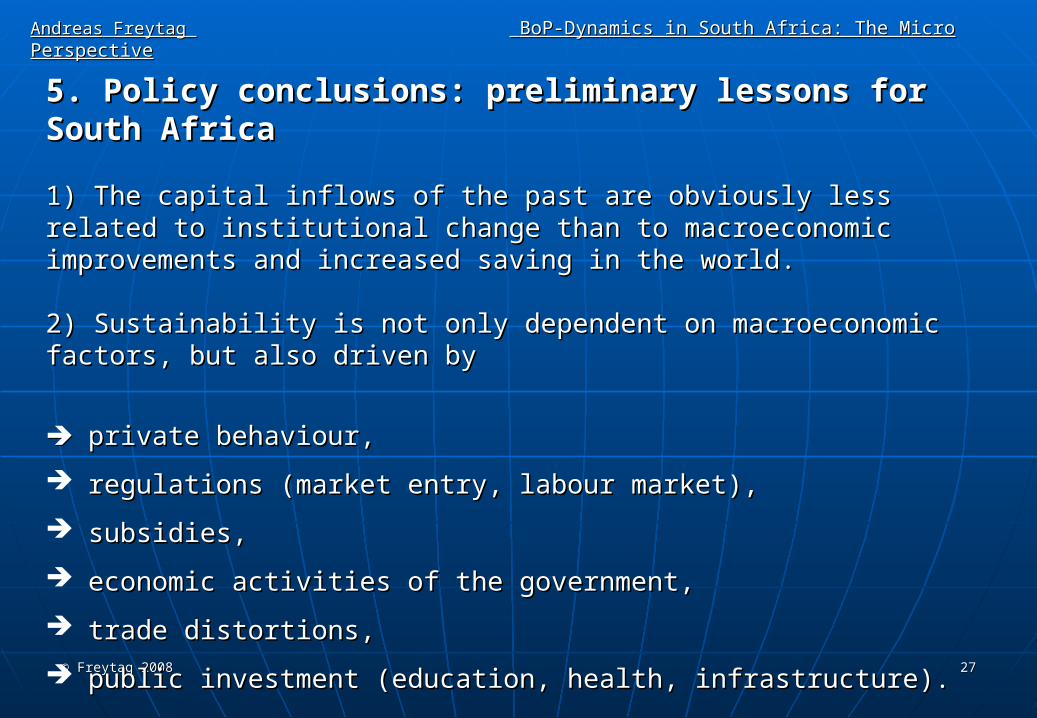
5. Policy conclusions: preliminary lessons for South Africa 5. Policy conclusions: preliminary lessons for South Africa
1) The capital inflows of the past are obviously less related to institutional 1) The capital inflows of the past are obviously less related to institutional change than to macroeconomic improvements and increased saving in the change than to macroeconomic improvements and increased saving in the world.world.
2) Sustainability is not only dependent on macroeconomic factors, but also 2) Sustainability is not only dependent on macroeconomic factors, but also driven by driven by
private behaviour,private behaviour,
regulations (market entry, labour market),regulations (market entry, labour market),
subsidies,subsidies,
economic activities of the government,economic activities of the government,
trade distortions,trade distortions,
public investment (education, health, infrastructure).public investment (education, health, infrastructure).
© Freytag 2008© Freytag 2008 2828
AndreasAndreas FreytagFreytag BoP-Dynamics in South Africa: The Micro PerspectiveBoP-Dynamics in South Africa: The Micro Perspective
3) It is, however, difficult to identify thresholds (e.g. investment structure, import 3) It is, however, difficult to identify thresholds (e.g. investment structure, import structure, institutions, net wealth position to GDP) to judge the sustainability.structure, institutions, net wealth position to GDP) to judge the sustainability.
4) Nevertheless: South Africa needs more capital to modernise the economy and 4) Nevertheless: South Africa needs more capital to modernise the economy and increase the potential productivity. This implies to import net capital and use is increase the potential productivity. This implies to import net capital and use is for investment.for investment.
5) In particular, bottlenecks such as telecommunication, transportation and 5) In particular, bottlenecks such as telecommunication, transportation and energy are to be widened.energy are to be widened.
6) In the longer run, savings have to increase: Education 6) In the longer run, savings have to increase: Education ⇧ ⇧ Employment ⇧ Employment ⇧ GDP ⇧ GDP ⇧ Savings ⇧. Savings ⇧.
7) It is too early to state whether or not South Africa is at the beginning of a 7) It is too early to state whether or not South Africa is at the beginning of a beneficial debt cycle. Signs are encouraging. beneficial debt cycle. Signs are encouraging.
© Freytag 2008© Freytag 2008 2929
AndreasAndreas FreytagFreytag BoP-Dynamics in South Africa: The Micro PerspectiveBoP-Dynamics in South Africa: The Micro Perspective
To summarise, today the threat to sustainability (or the danger of a reversal) To summarise, today the threat to sustainability (or the danger of a reversal) may be bigger on the microeconomic front than from the macroeconomic side.may be bigger on the microeconomic front than from the macroeconomic side.
Therefore, the South African government should seriously rethinking any Therefore, the South African government should seriously rethinking any interventionist strategies and consider some of the recommendations made by interventionist strategies and consider some of the recommendations made by the Harvard group and even more so the options shown by the OECD.the Harvard group and even more so the options shown by the OECD.
More attention should also be paid to crime and corruption (rule of law).More attention should also be paid to crime and corruption (rule of law).