Embed Size (px)
Citation preview

Andrew Briscoe, CAE President & CEO
The Sugar Association
National Confectioners Association State of the Industry Conference
February 20, 2010
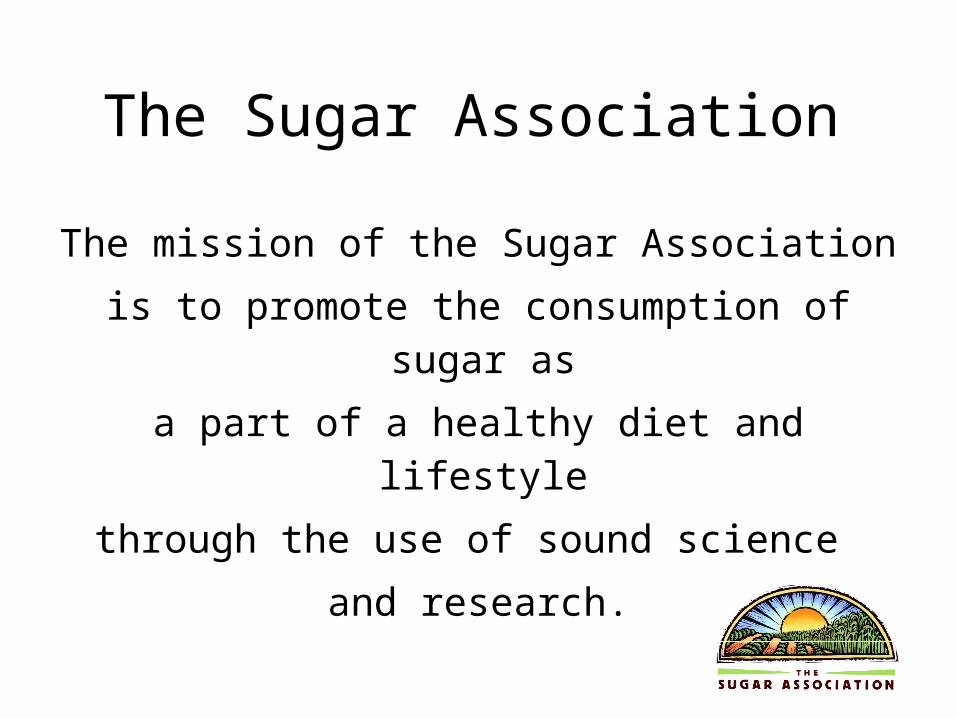
The Sugar Association
The mission of the Sugar Association
is to promote the consumption of sugar as
a part of a healthy diet and lifestyle
through the use of sound science
and research.

7.5
7.75
8
8.25
8.5
8.75
9
9.25
9.5
9.75
10
10.25
10.5
10.75
80 82 84 86 88 90 92 94 96 98 00 02 04 06 08
Source: USDA. ERS. World Agricultural Outlook Board. World Agricultural Supply and Demand Estimates, Table 16.
Total Domestic Sugar Deliveries, Fiscal Years 1980 – 2008
FY 2009 Deliveries Estimated at 10.638 Million Tons, Raw Value; December 2009
Mil
lion
Ton
s, R
aw V
alu
e
Fiscal Year
© The Sugar Association, Inc.December 11, 2009
Sugar’s portion of total sweetener consumption continues to trend up

Tho
usan
d Sh
ort T
ons,
Raw
Val
ueU.S. Sugar Fiscal Year Deliveries for Domestic Food Use
Total Deliveries
Change From Previous Fiscal Year
8,000
8,750
9,500
10,250
11,000
+ 750
750
0
© The Sugar Association, Inc.December 11, 2009
Source Report: USDA. ERS. World Agricultural Outlook Board. World Agricultural Supply and Demand Estimates, 477-16; Accessed December 11, 2009.
+ 123+ 202
+ 108+ 200
+ 121+ 7
1996 1997 1998 1999 2000 2001 2002 2003 2004 2005 2006 2007 2008 2009
+ 174
- 390
- 106
+ 341+ 165
- 271Estimate
- 27
9,91
3
10,5
06
10,4
79
9,99
3
9,67
2
9,50
4 9,67
8 10,0
19
10,1
84
9,89
4
10,0
00
9,87
2
9,56
4
9,44
1
+ 593

5
32.3%33.2% 33.7% 33.5% 33.4%
34.3% 34.7% 35.1% 35.0% 35.1% 35.1% 34.7%34.0% 33.5% 33.4%
32.7%
31.1%
14% 14% 14%16% 16% 15% 15% 15% 16% 16% 16% 17% 17% 17% 17% 18% 18%
10%
20%
30%
40%
1992 1993 1994 1995 1996 1997 1998 1999 2000 2001 2002 2003 2004 2005 2006 2007 2008
Artificial Sweeteners
HFCS
Sugar
Shares of U.S. Sweetener Consumption:Sugar, HFCS, and Artificials, 1992-2008
Data Source: USDA/ERS, June 2009. HFCS = High Fructose Corn Syrup. Other sweeteners -- glucose, dextrose, honey, syrups- - comprise 14-15% of the U.S. sweetener market. 62

Key Messages
• Sugar is all natural• Just 15 calories per teaspoon• Is an important ingredient that has
been used safely for over 2000 years

Pro-actively Defending
Sugar’s Rolein a
Balanced Diet and Healthy Lifestyle
Public Affairs
Public Policy
Research & Science

Programmatic Initiatives• Pro-active defense of sugar in the Media• Dispelling Sugar Myths• Sugar Promotion & Social Marketing• Monitoring all nutrition science related to
sugar – cornerstone of all SA messages• Defending sugar in all Federal Nutrition Policy
Initiatives & FDA Food Labeling• Consumer and Health Professional Education

SA Actively Works to Dispelling Sugar Myths – prompt response to media
misinformation, on our website and in our educational materials
• Sugar does not cause diabetes• Sugar does not cause hyperactivity• Sugar is not high on the glycemic index• Sugar intake is not the cause of obesity• Sugar is not addictive• Sugar does not cause a sugar high


Social MediaInitiative

Strategic Website Ad Placement
Targeted Websites Include:YahooFood NetworkiVillage

Culver’s Lemon Ice
Logo PartnershipUsing
“Sweetened with
SUGAR…Sweet by Nature”

FLOOR GRAPHICS


Exhibits Influence the Influencers

Delivering our key sugar messages
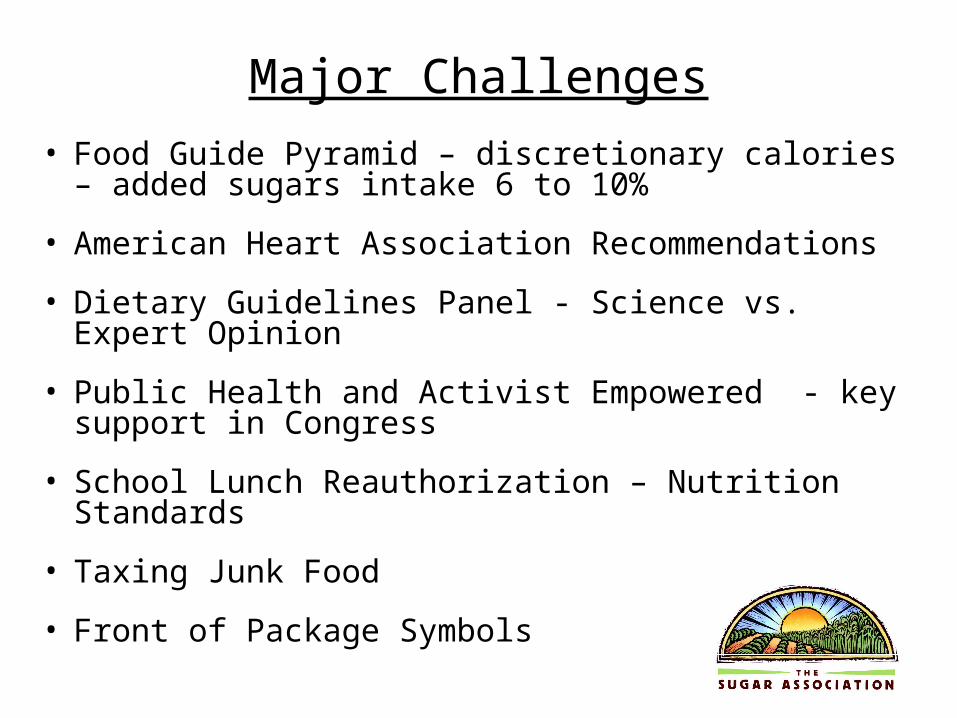
Major Challenges• Food Guide Pyramid – discretionary calories – added
sugars intake 6 to 10%
• American Heart Association Recommendations
• Dietary Guidelines Panel - Science vs. Expert Opinion
• Public Health and Activist Empowered - key support in Congress
• School Lunch Reauthorization – Nutrition Standards
• Taxing Junk Food
• Front of Package Symbols

Weapons or Tools to Confront Challenges and Threats
1. Submit science based comments2. Write letters to USDA and HHS Secretaries3. Meetings with agency officials 4. Congressional help / support5. PR – media exposure 6. Coalitions

Science is on our sideEvery major review of the scientific literature confirms sugars intake is not a causative factor in any lifestyle disease, including obesity.
• 1986 the FDA Sugars Task Force
• 1989 the National Academy of Sciences Report on Diet and Health
• 1997 the FAO/WHO joint expert consultation
• 2002 the NAS, Institute of Medicine “Dietary Reference Intakes for Energy, Carbohydrate, Fiber, Fat, Fatty Acids, Cholesterol, Protein and Amino Acids”

March 2009 expert report to the European Food Safety Authority
reaffirmed past conclusions:
“Available data do not allow the setting of an UL for total or added sugars, neither an accepted intake (AI) nor a recommended intake range.”
Scientific opinion of the panel on dietetic products, nutrition and allergies on a request from the EC on population reference intakes on carbohydrates and dietary fibre (March 2009)


US Per Capita Caloric Total Sweetener Deliveries1 for
Food and Beverage Use, Calendar Years 1999 – 2008
Poun
ds P
er Y
ear
(adj
uste
d fo
r lo
ss)
Source: USDA. Economic Research Service, Briefing Room. Sugar and Sweetener Yearbook Tables: Excel (.xls) Spreadsheets, Table 50. http://www.ers.usda.gov/briefing/sugar/Data/data.htm. Last ERS Update: December 10, 2009.
© The Sugar Association, Inc.February 12, 2010
Calendar Year
90
92
94
96
98
100
102
104
106
108
110
1999 2000 2001 2002 2003 2004 2005 2006 2007 2008
1Estimated loss = 29%
- 9.7 %
Per capita consumption of total sweetenershas declined by 9.7 % in the past 10 years