Embed Size (px)
Citation preview

Andrew Garcia & Bill Birkemeier
Coastal & Hydraulic LaboratoryUS Army Corps of Engineers
Monitor - to observe systematically;
… a planned series of observations
To establish baseline conditions...
To document episodic or unusual events and theireffects…
To acquire information for planning, design, or remedial efforts…
To access project performance or completionof study goals...

Information !!! - by way of…
Acquiring data…Processing and analyzing…Summarizing, categorizing…Correlating...
Waves, windsWater levels (astronomical tides)CurrentsNearshore bathymetryShoreline evolution
Capital costs… instruments, related hardware,software
Deployment… vessel, divers, expendable supplies
Maintenance… planned and unplanned
Data retrieval… electronic, physical
(continued)
Data processing… analysis, archiving
Data interpretation… plots, figure preparation
Project documentation… field notes, office records
Information, data dissemination… web site
(concluded)
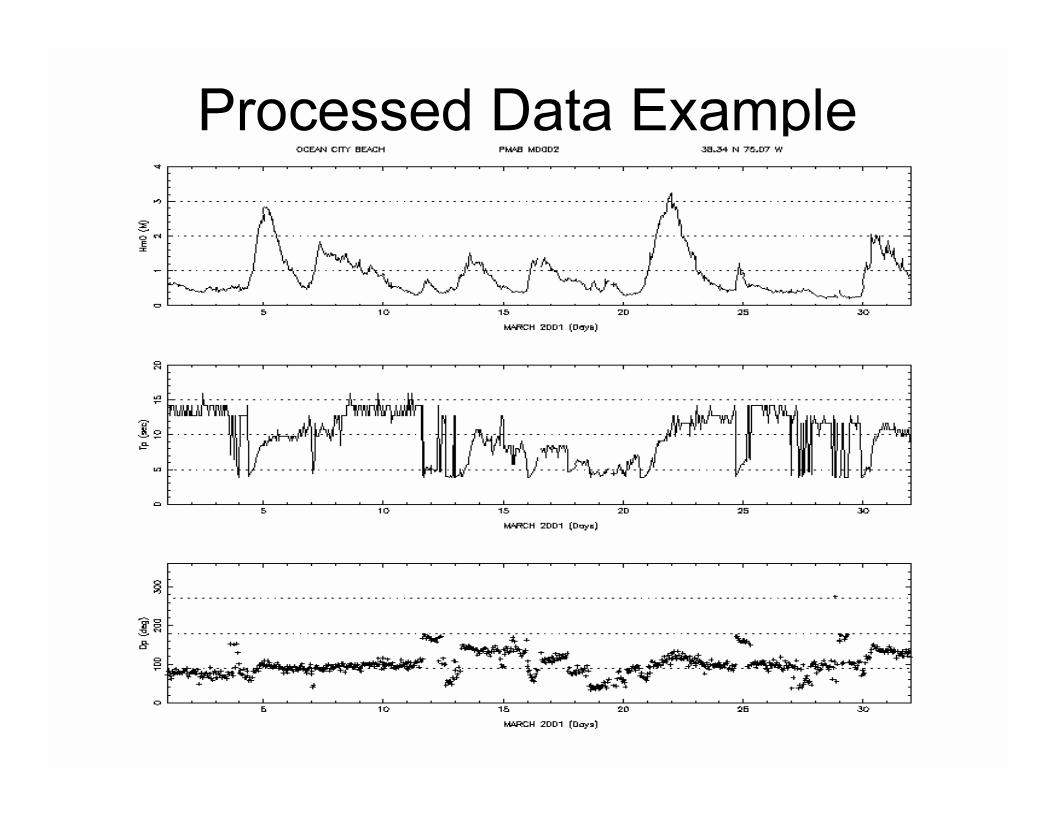
Wave Period
Wav
e H
eigh
t
Wave Dire
ction
The ideal wave:
One Height
One Period
One Direction
example: hurricane swell
Types of instruments...
Surface-piercing probes
Surface-following buoy
Sub-surface pressure sensor
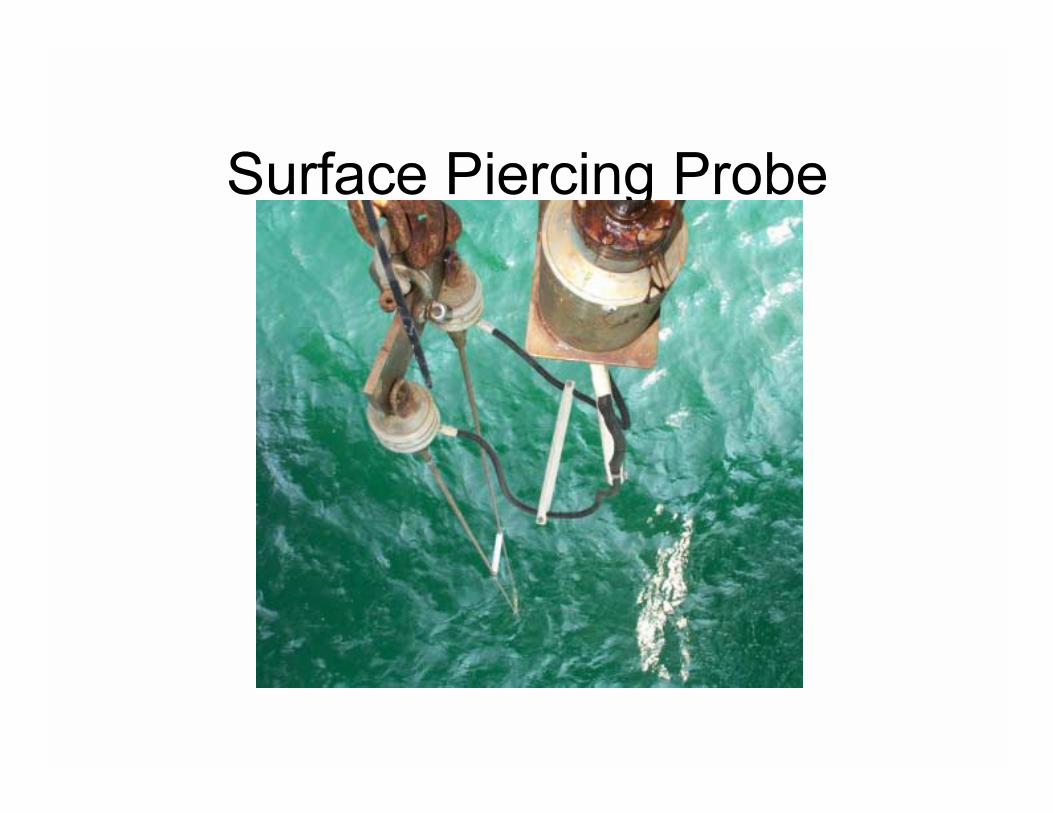

Advantages…Good linearity
Disadvantages…Requires a supporting structure ($$$)Vulnerable to floating debrisSusceptible to bio-foulingNon-directional
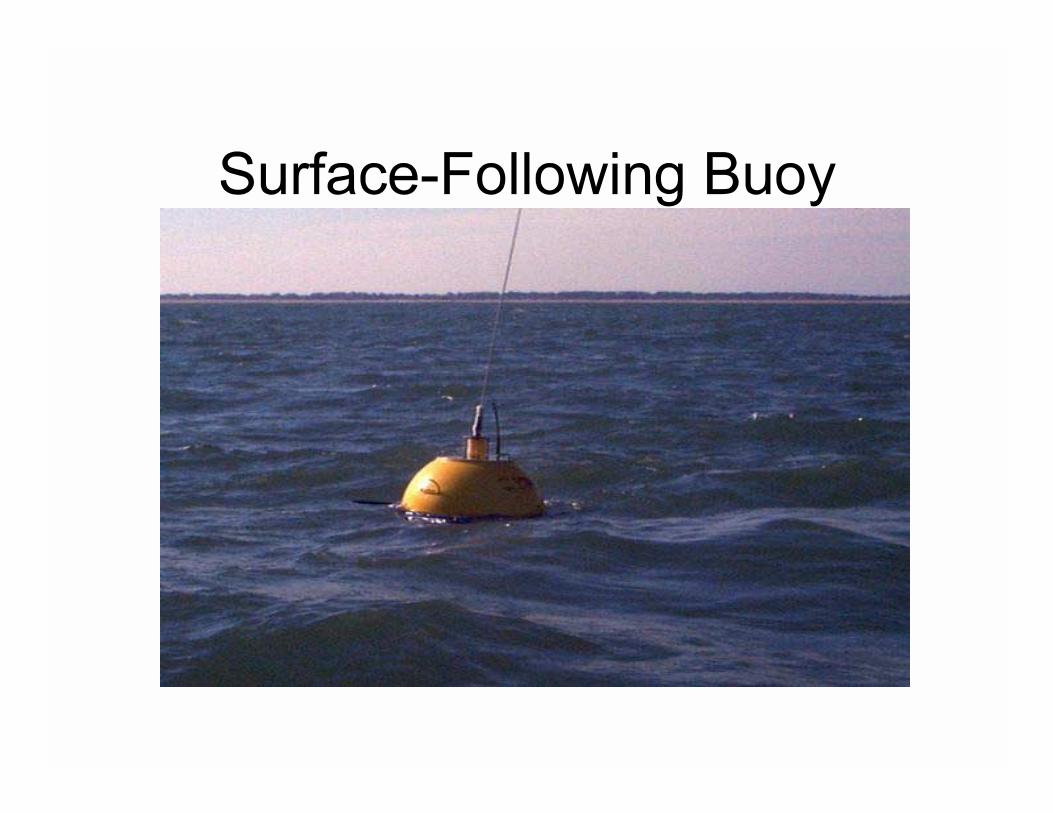
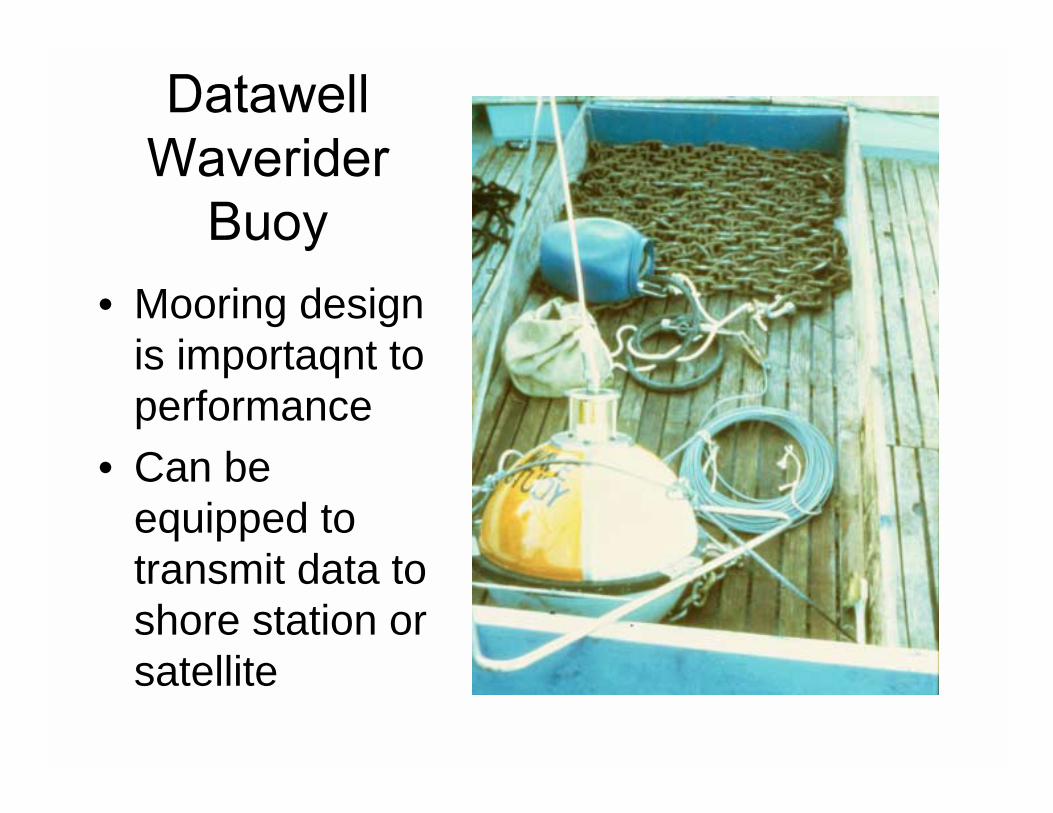
• Mooring design is importaqnt to performance
• Can be equipped to transmit data to shore station or satellite

Advantages…Wide range of acceptable sizes (1m-12m dia.)Suitable for very remote and/or deep water locationsResponse characteristics well documentedDirectional/Nondirectional Buoys available
Disadvantages…Not suitable for shallow water application (<15m)Does not track very steep waves wellCan be vulnerable to vandalism and marine mammalsMooring can be vulnerable to vessel traffic

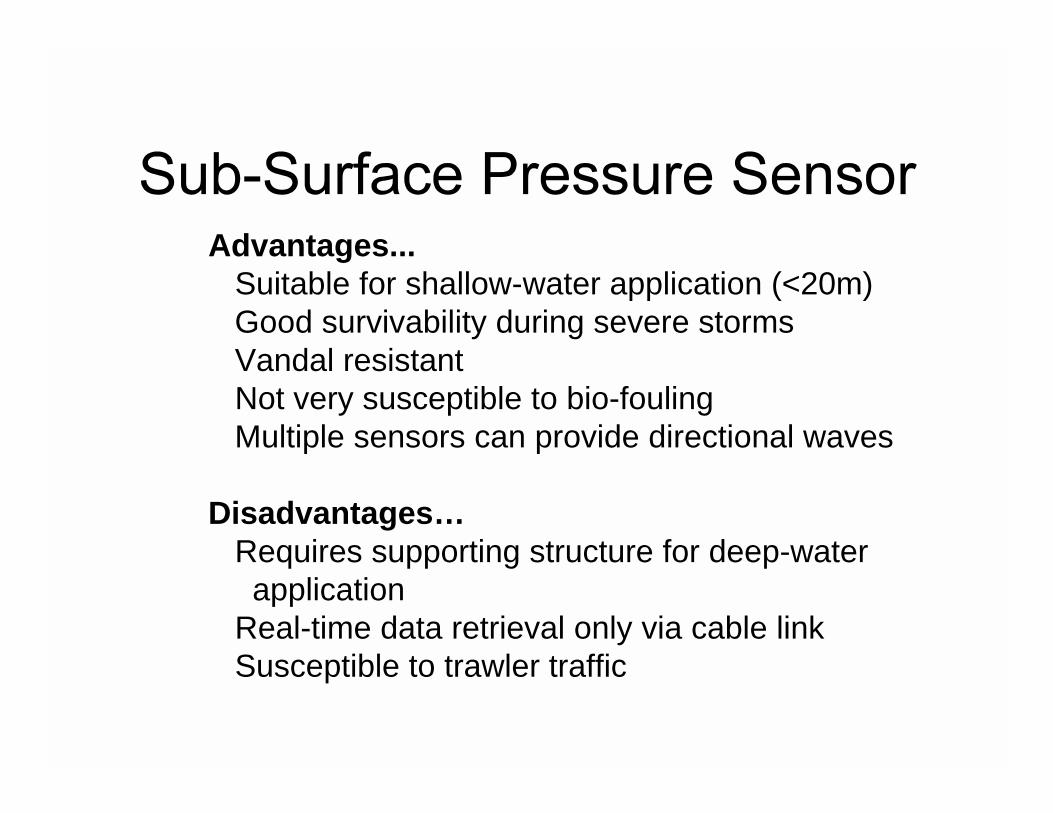
Advantages...Suitable for shallow-water application (<20m)Good survivability during severe stormsVandal resistantNot very susceptible to bio-foulingMultiple sensors can provide directional waves
Disadvantages…Requires supporting structure for deep-waterapplication
Real-time data retrieval only via cable linkSusceptible to trawler traffic
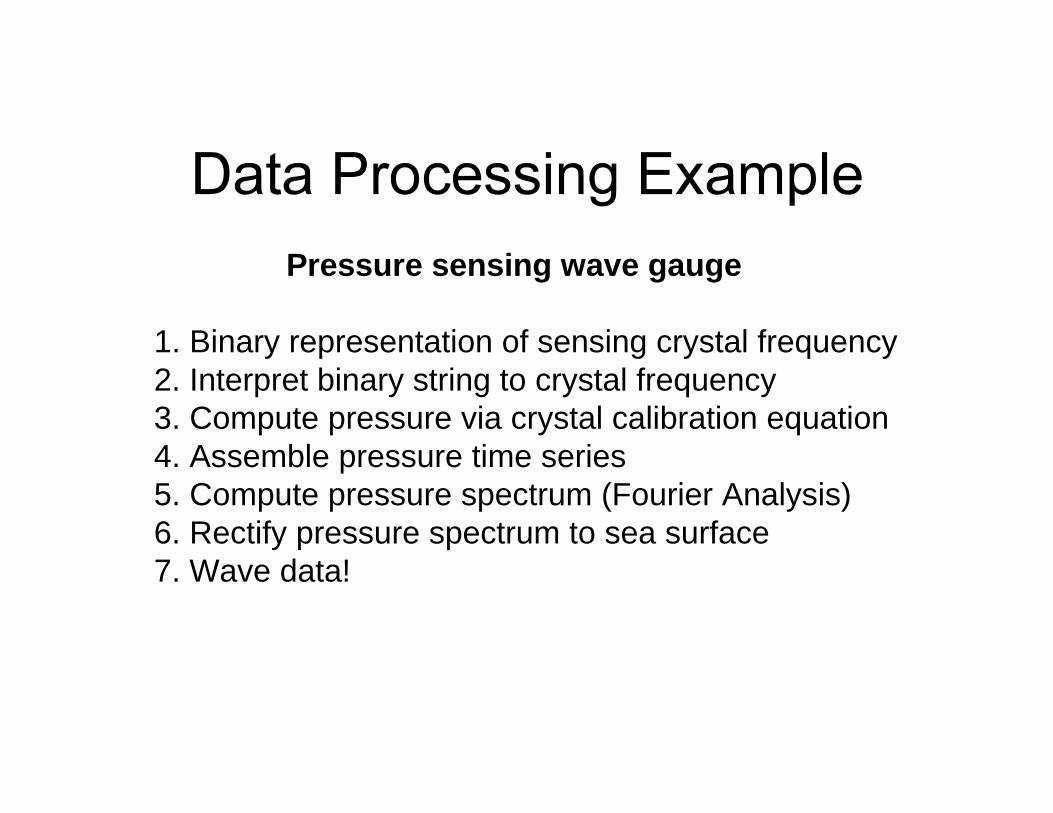
Pressure sensing wave gauge
1. Binary representation of sensing crystal frequency2. Interpret binary string to crystal frequency3. Compute pressure via crystal calibration equation4. Assemble pressure time series5. Compute pressure spectrum (Fourier Analysis)6. Rectify pressure spectrum to sea surface7. Wave data!
Types of instruments…
Rotor or propeller
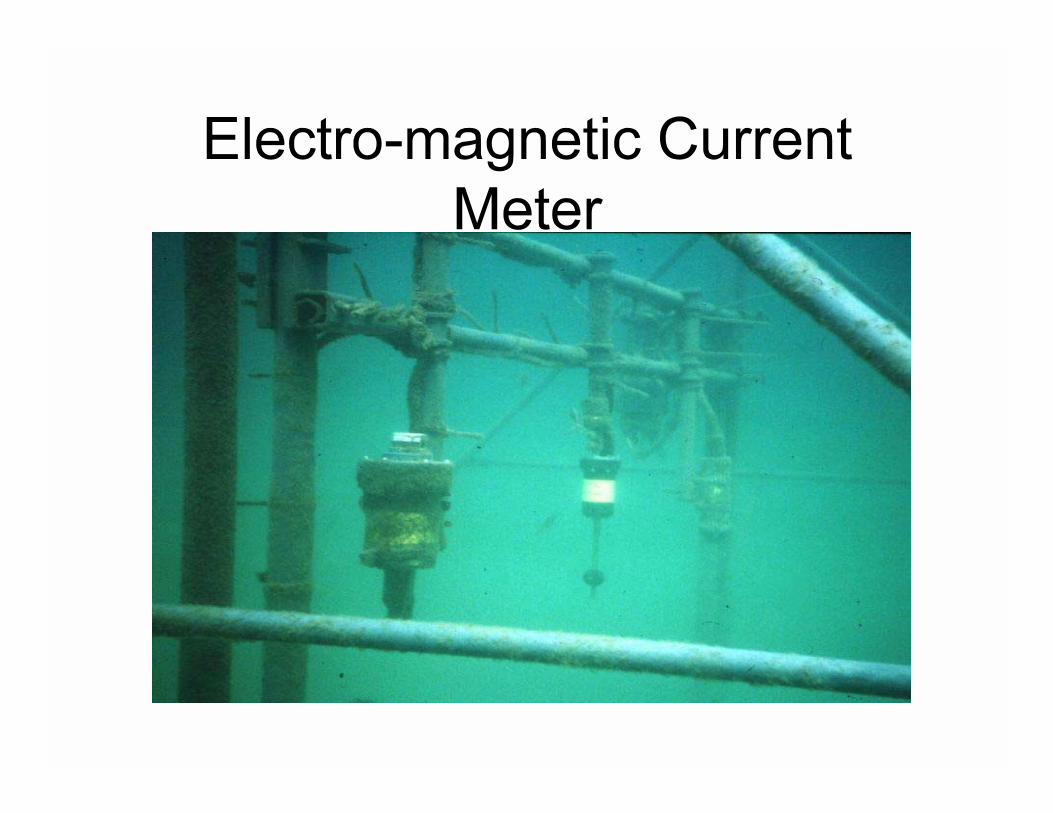
Electro-magnetic
Acoustic
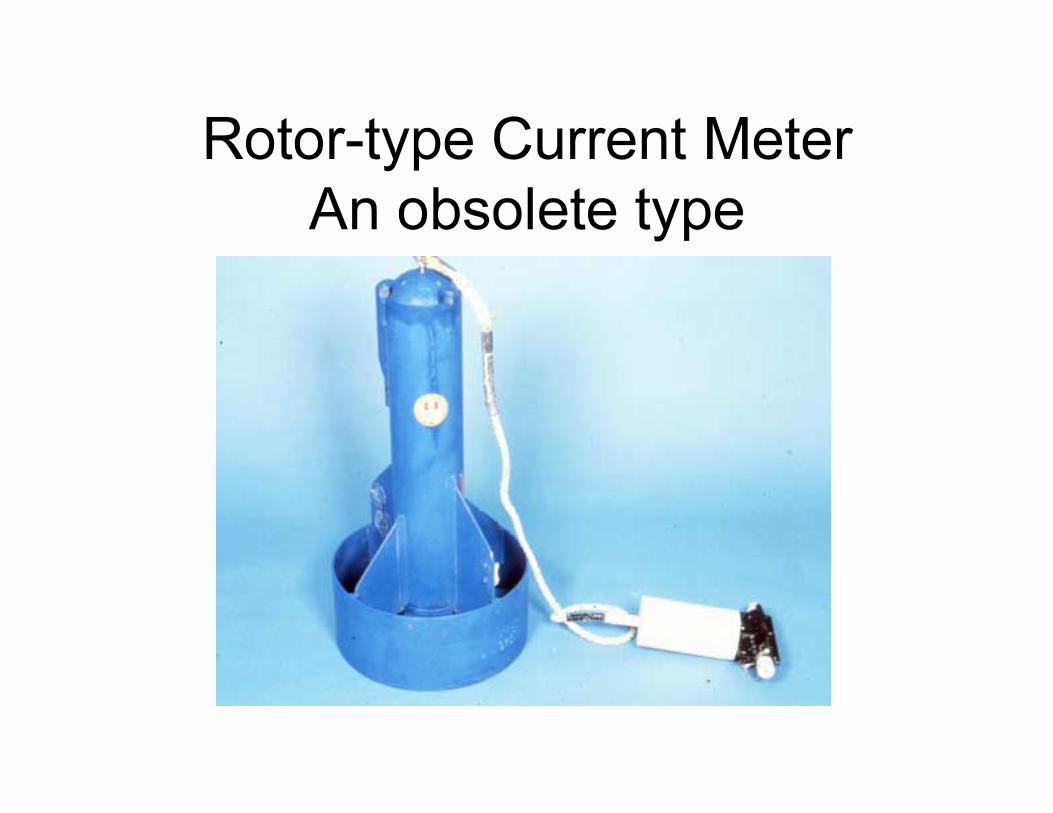
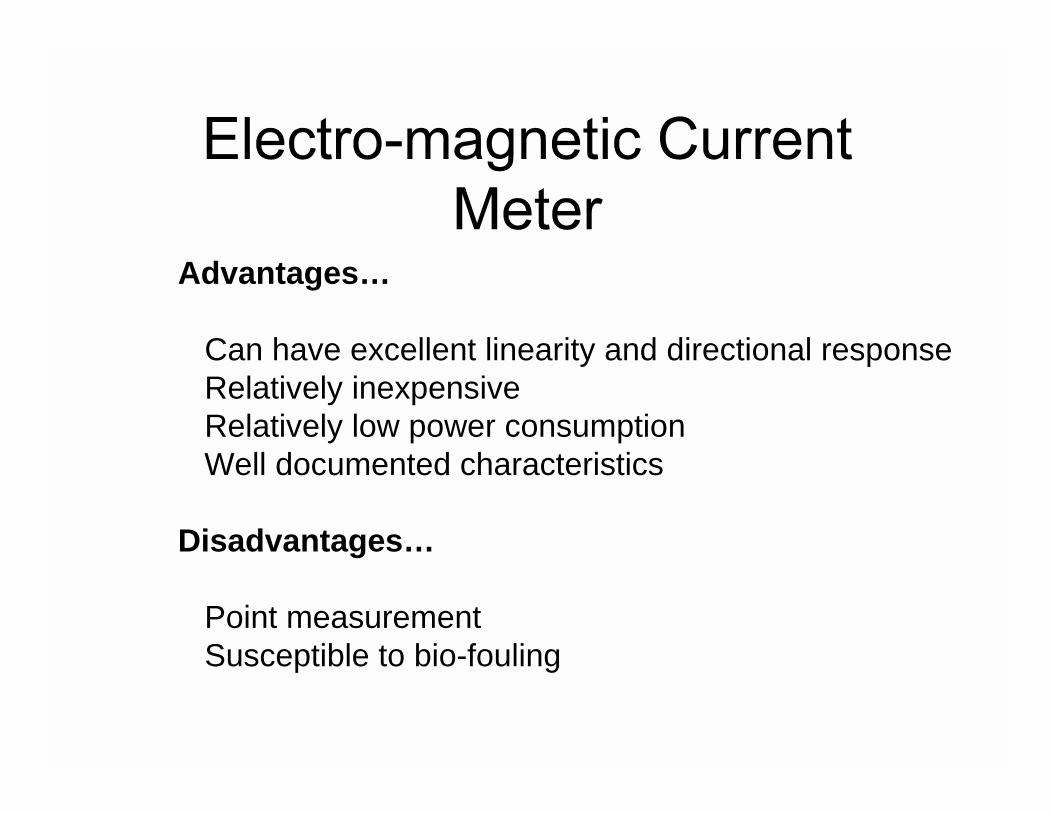
Advantages…
Can have excellent linearity and directional responseRelatively inexpensiveRelatively low power consumptionWell documented characteristics
Disadvantages…
Point measurementSusceptible to bio-fouling
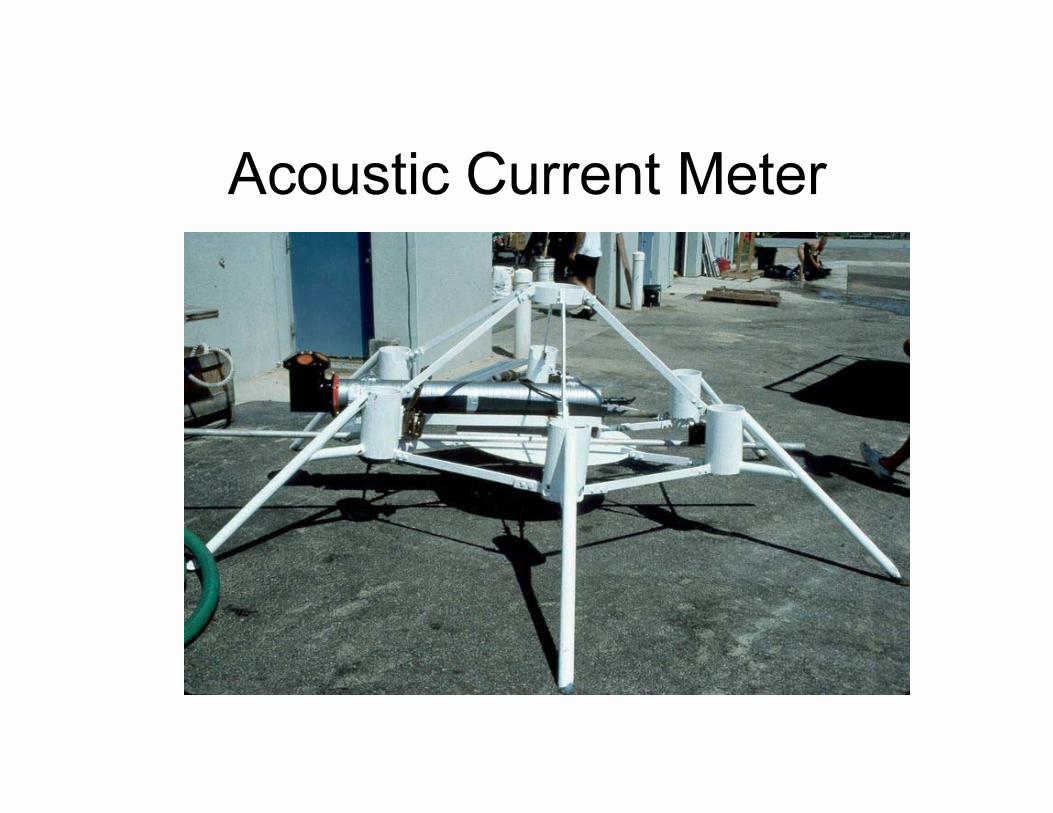
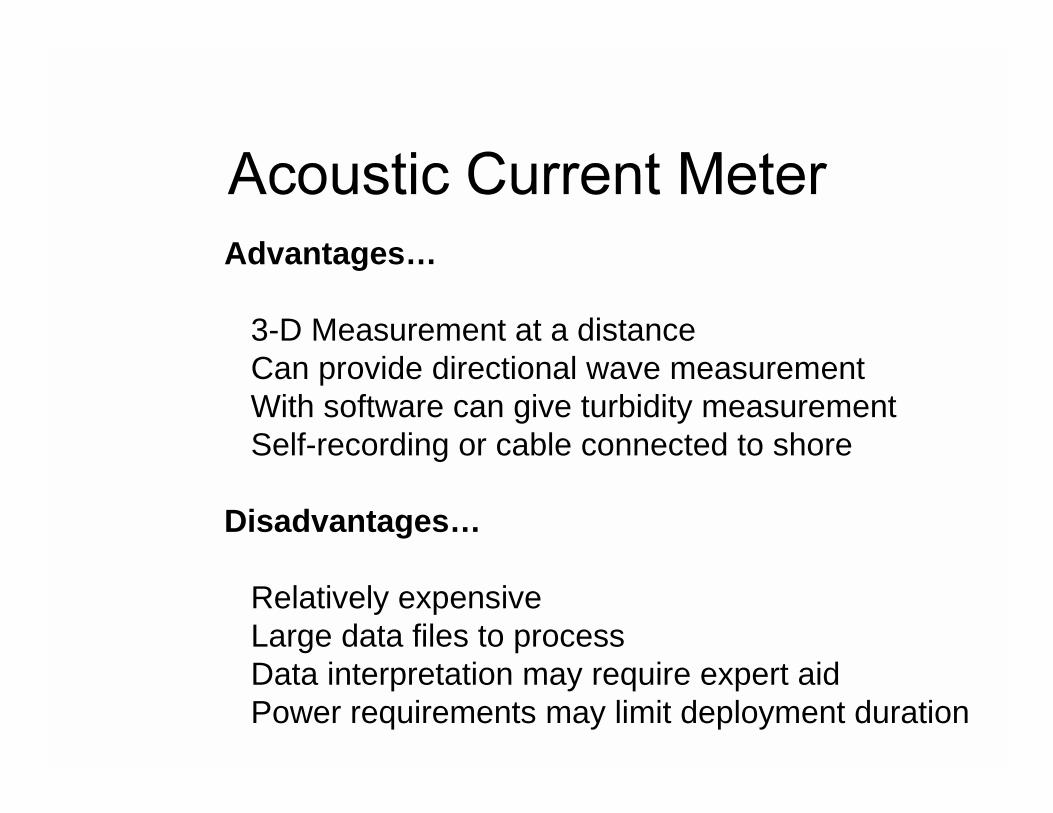
Advantages…
3-D Measurement at a distanceCan provide directional wave measurementWith software can give turbidity measurementSelf-recording or cable connected to shore
Disadvantages…
Relatively expensiveLarge data files to processData interpretation may require expert aidPower requirements may limit deployment duration
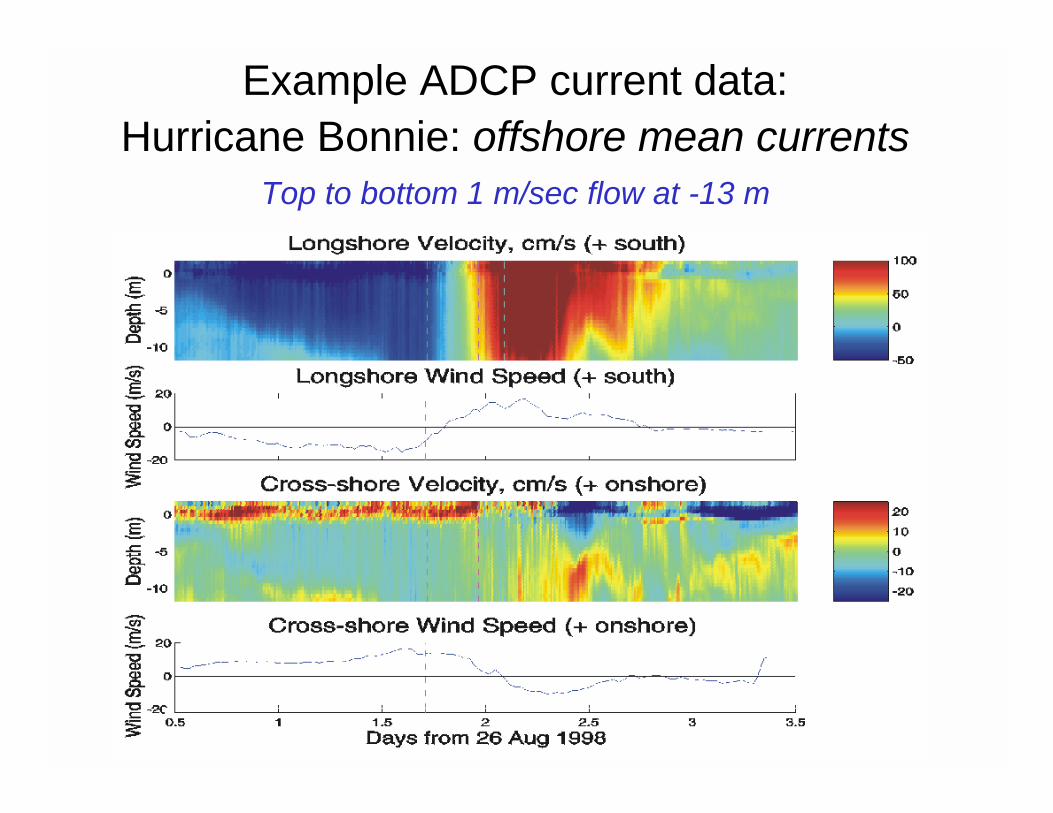
Example ADCP current data:Hurricane Bonnie: offshore mean currents
Top to bottom 1 m/sec flow at -13 m
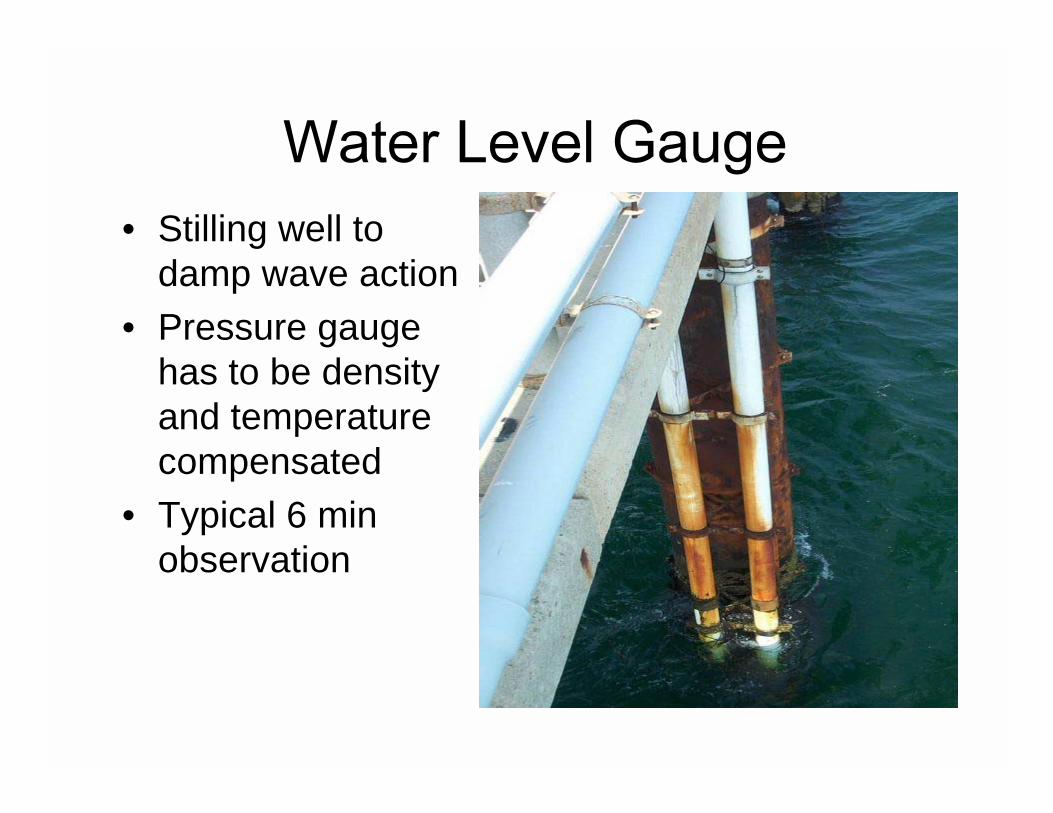
• Stilling well to damp wave action
• Pressure gauge has to be density and temperature compensated
• Typical 6 min observation

911008 911015 911022 911029 911105-1
0
1
2
Predicted Tide Water Level
0
1 Surge
0
2
4
6
Wave Height
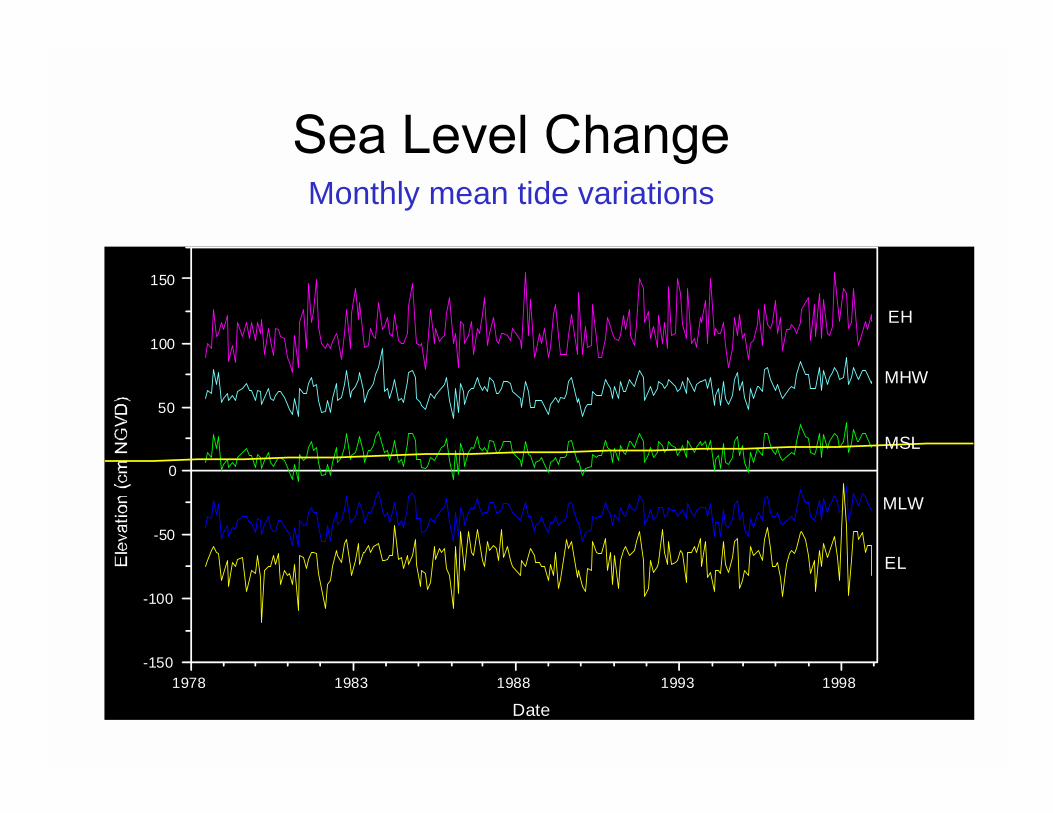
Monthly mean tide variations
1978 1983 1988 1993 1998-150
-100
-50
0
50
100
150
EL
MLW
MSL
MHW
EH
Date
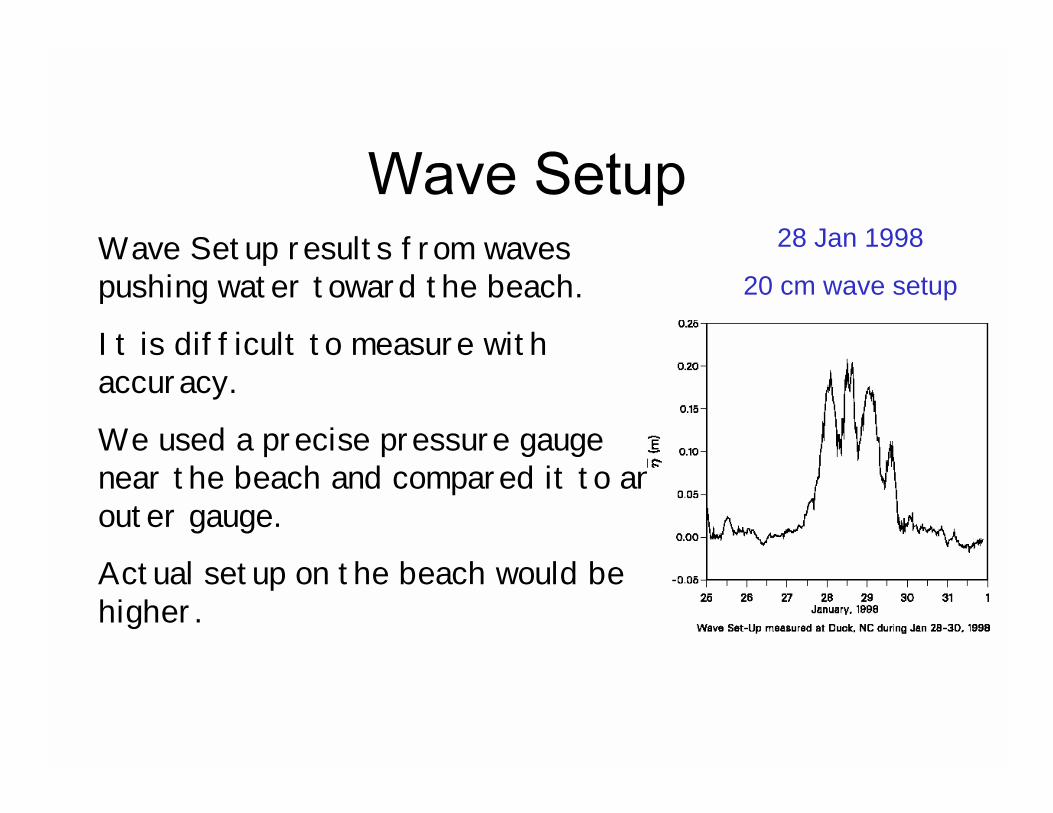
28 Jan 1998
20 cm wave setupWave Setup results from waves pushing water toward the beach.
It is difficult to measure with accuracy.
We used a precise pressure gauge near the beach and compared it to an outer gauge.
Actual setup on the beach would be higher.

• Local observers make daily visual observations
• Advantages:– Low cost, practical– Public involved
• Disadvantages– Subjective observations– Not continuous
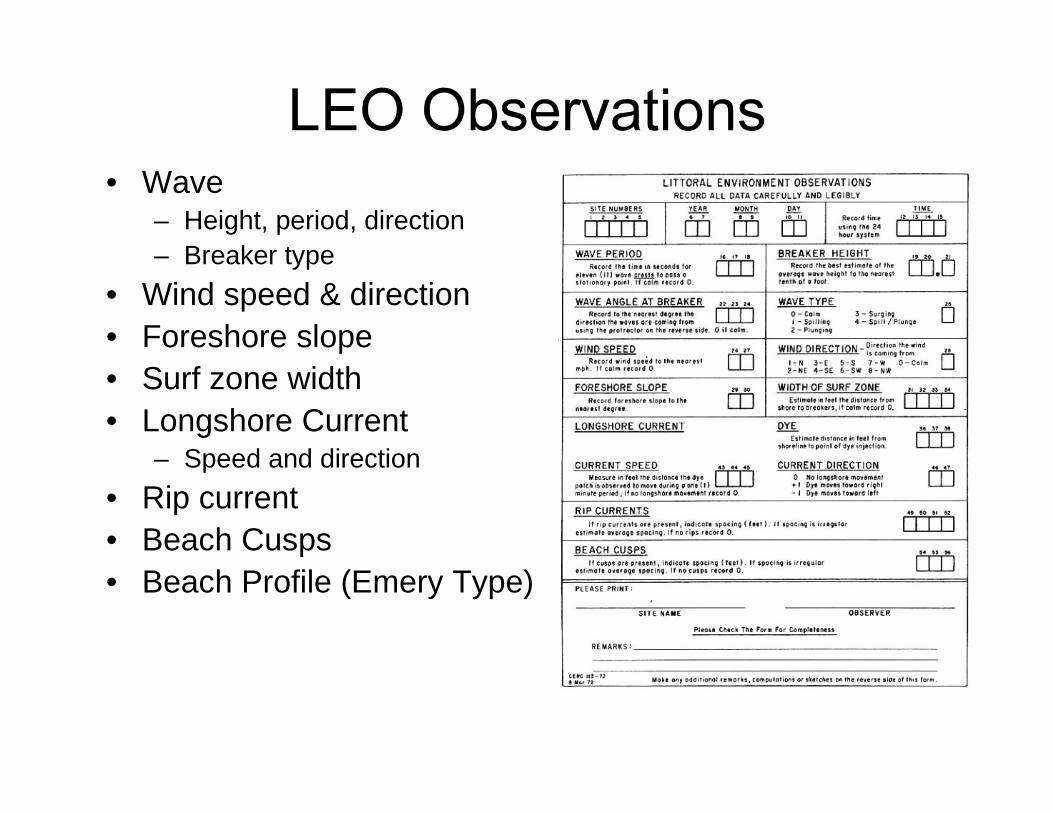
• Wave– Height, period, direction– Breaker type
• Wind speed & direction• Foreshore slope• Surf zone width• Longshore Current
– Speed and direction• Rip current• Beach Cusps• Beach Profile (Emery Type)
• Clip board• Hand level• Dye packet or float• Wind meter• LEO form• Optional
– Digital Camera– Survey gear