Embed Size (px)
Citation preview
Anemometer calibration at different
air temperatures and air pressures
Deutsche WindGuard Wind Tunnel Services GmbH
Oldenburger Str. 65
26316 Varel
Germany
Project No.: VT180259
Report No.: VT180259_01_Rev0
Report Date: 2018-03-02
VT180259_01_Rev0
Anemometer calibration at different air temperatures and air pressures Page 2 of 16
Anemometer calibration at different air temperatures and air pressures
Company: Deutsche WindGuard
Wind Tunnel Services GmbH
Oldenburger Straße 65
26316 Varel
Germany
Telephone: +49 4451 95 15 0
Fax: +49 4451 95 15 29
E-Mail: [email protected]
Project No.: VT180255
Report No.: VT180255_01_Rev0
Date of Report: 2018-03-02
Authors: Busche P., Dipl. Ing.
May C., B. Eng.
Roß A., M. Sc.
Suhr J., M. Sc.
Westermann H., B. Sc.
Approved by: Dipl.-Phy. D. Westermann
VT180259_01_Rev0
Anemometer calibration at different air temperatures and air pressures Page 3 of 16
Revision History
Revision No. Date Status Amendment
Rev0 02.03.2018 1st issue
Note: The last revision replaces all previous versions of the report.
VT180259_01_Rev0
Anemometer calibration at different air temperatures and air pressures Page 4 of 16
Contents
1 Introduction 5
2 Former investigations on temperature induced effects onto the
anemometer output 6
3 Technical description of the variable air density wind tunnel 8
3.1 Measuring system 10
4 Calibration procedure 10
4.1 Calibration procedure for varying air temperatures 11
4.2 Calibration procedure for varying air pressures 11
5 Measurement uncertainty 12
6 Sample results 12
6.1 Calibration results for varying air temperatures 13
6.2 Calibration results for varying air pressures/air densities 14
7 Conclusion 15
8 References 16
Disclaimer:
We hereby state, that the results in this report are based upon generally acknowledged and state-of-the-art methods and have been neutrally conducted to the best of our knowledge and belief. No guarantee, however, is given and no responsibility is accepted by Deutsche WindGuard Wind Tunnel Services GmbH for the correctness of the derived results. The work presented in this report complies with the present day valid standards and guidelines and the corresponding quality management system of Deutsche WindGuard. Any partial duplication of this report is allowed only with written permission of Deutsche WindGuard Wind Tunnel Services GmbH. The results of the following report refer to the investigated test objects only.
This report covers 16 pages.
VT180259_01_Rev0
Anemometer calibration at different air temperatures and air pressures Page 5 of 16
1 Introduction
An anemometer calibration is typically performed in a wind tunnel at a constant, pre-vailing air temperature and atmospheric pressure. This calibration is the basis for the wind speed measurements at meteorological met masts and therefore for the site as-sessment for potential wind farms. As the environmental parameters can influence the performance of the anemometer, an adequate anemometer for the specific site has to be chosen. Furthermore it is important to have a measure of the environmental influence on an accurate site assessment and wind turbine control.
Anemometers are assigned into different accuracy classes. In the latest IEC 61400-12-1 standard [1] there are different influence parameters which have to be investigated dur-ing the anemometer classification. The different classes cover different operational ranges of these influence parameters. Among these parameters are the air temperature and the air density.
In the IEC 61400-12-1 [1], it is assumed that a change in air temperature only influences the bearing friction. Higher air temperatures decrease the friction and therefore in-crease the rotational speed and vice versa.
In the IEC standard [1] are no further suggestions on how to evaluate a variation in air density. The air density is a function of air temperature and air pressure. To investigate the influence of a variation in air density, either the air temperature or the pressure can be altered. It is difficult to distinguish between the influence of changing air temperature and density if temperature variation is used to adjust the air density during the calibra-tion. If both parameters, air temperature and air pressure, can be altered independently the most precise results will be obtained.
In standard wind tunnels air temperature and pressure can usually not be set deliber-ately. Therefore the impact of these environmental conditions cannot be estimated reli-ably. A special research wind tunnel of “Göttinger” layout has been developed with the ability to vary the ambient tunnel pressure and temperature independently.
This document describes a measurement methodology for calibration of cup anemome-ters, propeller anemometers and sonic anemometers in the variable air density wind tunnel of WindGuard Wind Tunnel Services. The calibration result is the indicated wind speed of the anemometer at different temperatures and/or different air pressure. The calibration results can be used to estimate the uncertainty for wind sensors at very low or high temperatures and/or at high altitudes (lower temperatures in combination with lower density). The results are also essential for the classification of anemometers ac-cording to IEC [1].
In the second chapter, former investigations on the influence of changing air tempera-ture onto the bearing friction of cup anemometers are presented. In the third chapter, a technical description of the variable air density wind tunnel will be given, followed by the anemometer calibration procedure for varying air temperatures and air pressures. In the fourth chapter the uncertainty calculation is presented. In the end sample results for two different, commonly used and similar shaped cup anemometers with a frequen-cy output are presented with a final conclusion.
VT180259_01_Rev0
Anemometer calibration at different air temperatures and air pressures Page 6 of 16
2 Former investigations on temperature induced effects onto the an-emometer output
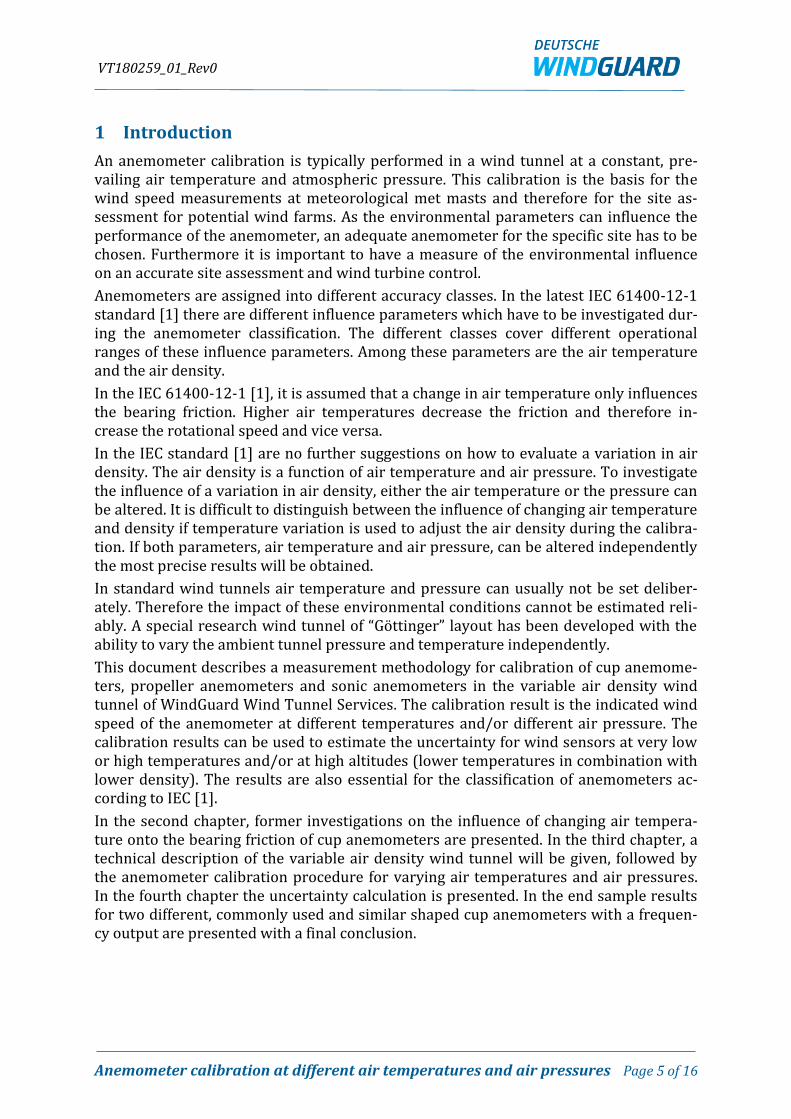
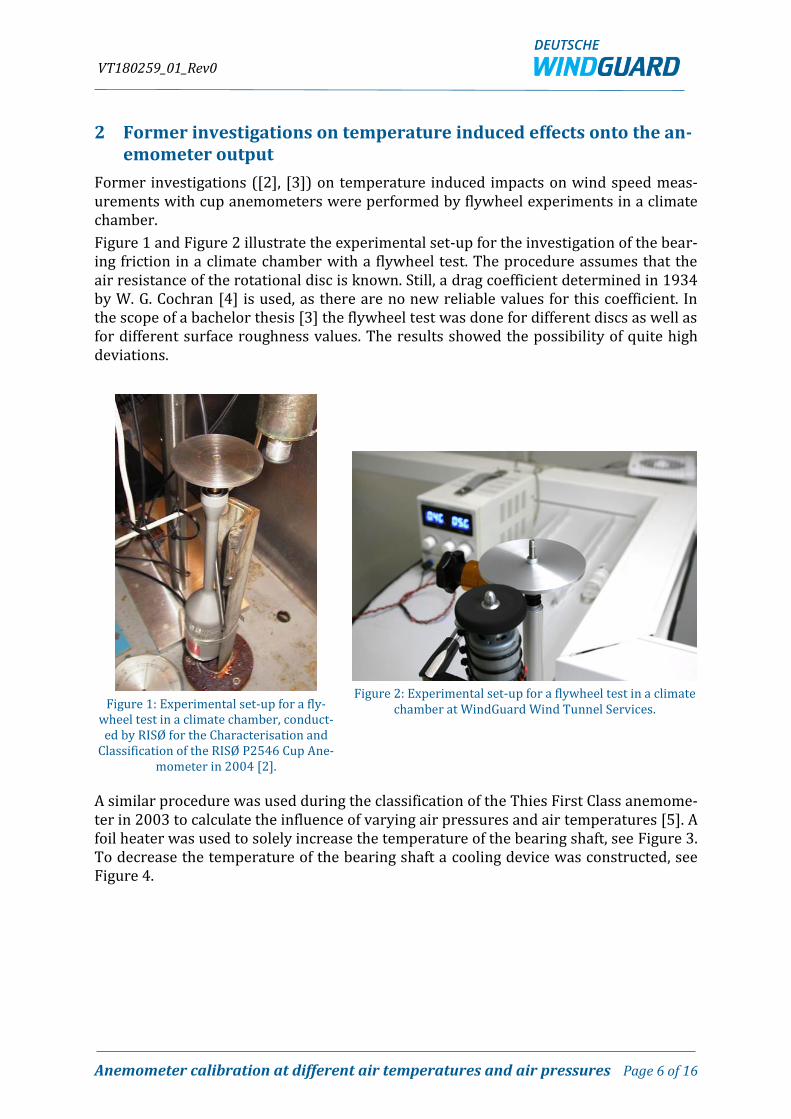
Former investigations ([2], [3]) on temperature induced impacts on wind speed meas-urements with cup anemometers were performed by flywheel experiments in a climate chamber.
Figure 1 and Figure 2 illustrate the experimental set-up for the investigation of the bear-ing friction in a climate chamber with a flywheel test. The procedure assumes that the air resistance of the rotational disc is known. Still, a drag coefficient determined in 1934 by W. G. Cochran [4] is used, as there are no new reliable values for this coefficient. In the scope of a bachelor thesis [3] the flywheel test was done for different discs as well as for different surface roughness values. The results showed the possibility of quite high deviations.
Figure 1: Experimental set-up for a fly-
wheel test in a climate chamber, conduct-ed by RISØ for the Characterisation and
Classification of the RISØ P2546 Cup Ane-mometer in 2004 [2].
Figure 2: Experimental set-up for a flywheel test in a climate
chamber at WindGuard Wind Tunnel Services.
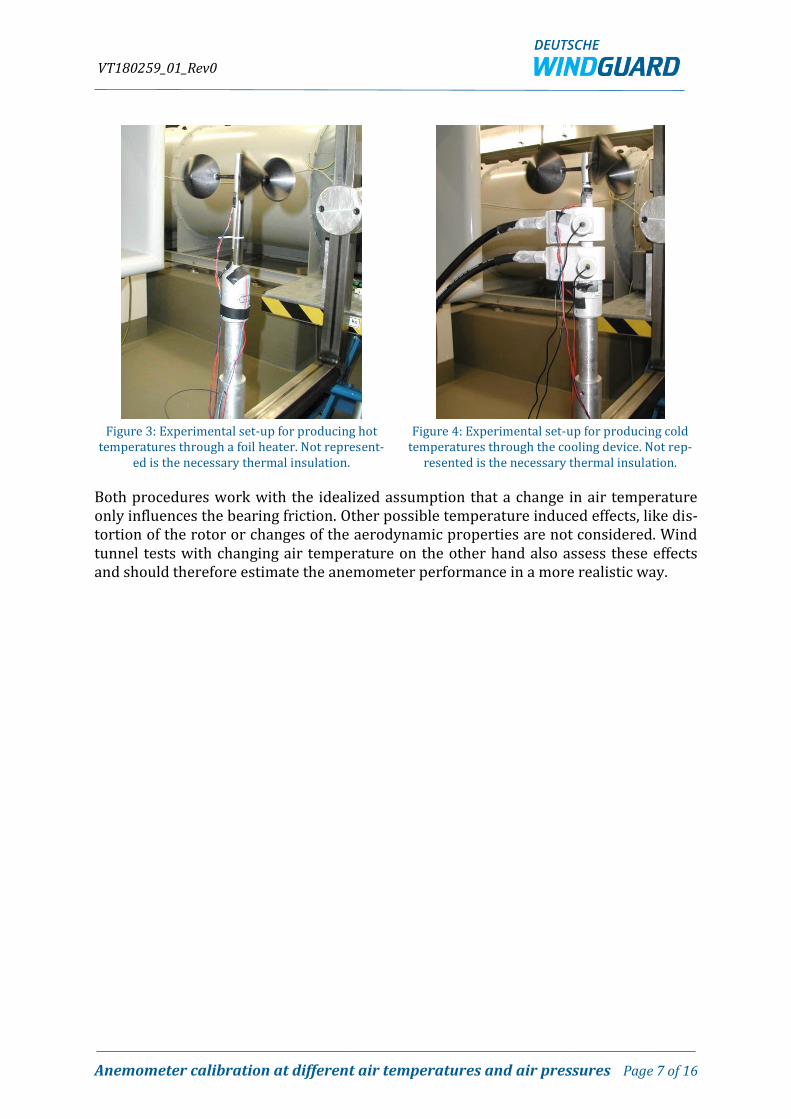
A similar procedure was used during the classification of the Thies First Class anemome-ter in 2003 to calculate the influence of varying air pressures and air temperatures [5]. A foil heater was used to solely increase the temperature of the bearing shaft, see Figure 3. To decrease the temperature of the bearing shaft a cooling device was constructed, see Figure 4.
VT180259_01_Rev0
Anemometer calibration at different air temperatures and air pressures Page 7 of 16
Figure 3: Experimental set-up for producing hot
temperatures through a foil heater. Not represent-ed is the necessary thermal insulation.
Figure 4: Experimental set-up for producing cold
temperatures through the cooling device. Not rep-resented is the necessary thermal insulation.
Both procedures work with the idealized assumption that a change in air temperature only influences the bearing friction. Other possible temperature induced effects, like dis-tortion of the rotor or changes of the aerodynamic properties are not considered. Wind tunnel tests with changing air temperature on the other hand also assess these effects and should therefore estimate the anemometer performance in a more realistic way.
VT180259_01_Rev0
Anemometer calibration at different air temperatures and air pressures Page 8 of 16
3 Technical description of the variable air density wind tunnel
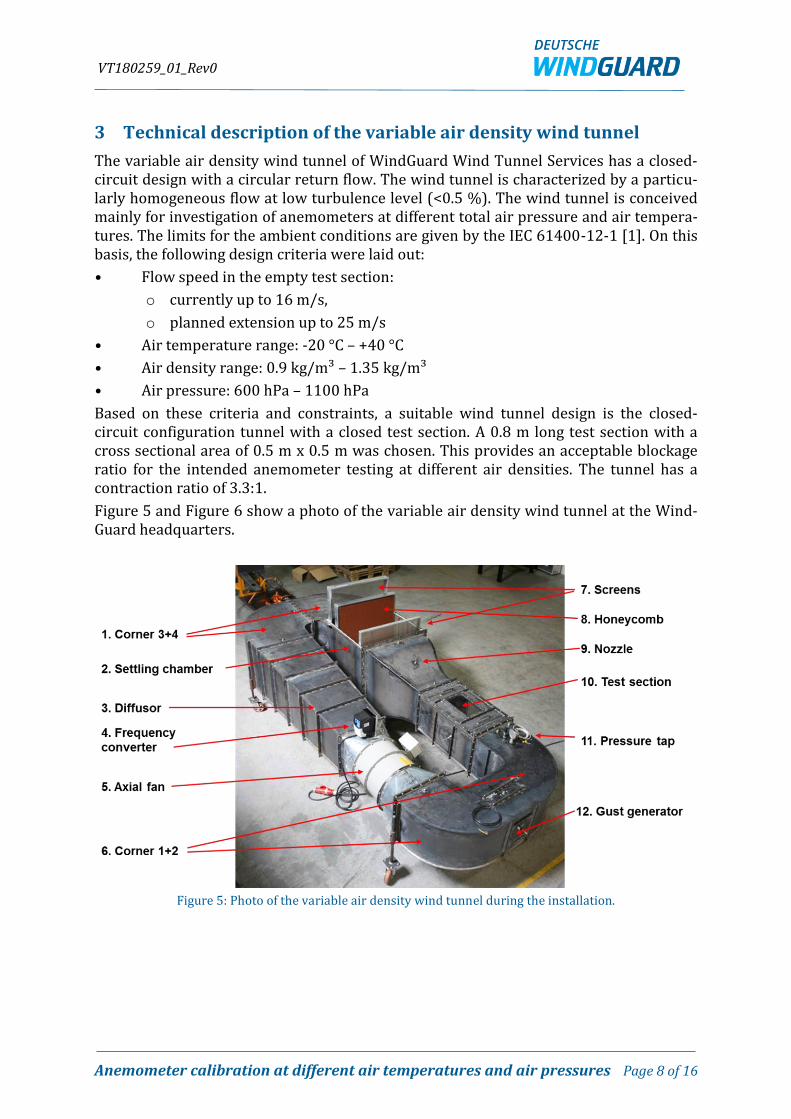
The variable air density wind tunnel of WindGuard Wind Tunnel Services has a closed-circuit design with a circular return flow. The wind tunnel is characterized by a particu-larly homogeneous flow at low turbulence level (<0.5 %). The wind tunnel is conceived mainly for investigation of anemometers at different total air pressure and air tempera-tures. The limits for the ambient conditions are given by the IEC 61400-12-1 [1]. On this basis, the following design criteria were laid out:
• Flow speed in the empty test section:
o currently up to 16 m/s,
o planned extension up to 25 m/s
• Air temperature range: -20 °C – +40 °C
• Air density range: 0.9 kg/m³ – 1.35 kg/m³
• Air pressure: 600 hPa – 1100 hPa
Based on these criteria and constraints, a suitable wind tunnel design is the closed-circuit configuration tunnel with a closed test section. A 0.8 m long test section with a cross sectional area of 0.5 m x 0.5 m was chosen. This provides an acceptable blockage ratio for the intended anemometer testing at different air densities. The tunnel has a contraction ratio of 3.3:1.
Figure 5 and Figure 6 show a photo of the variable air density wind tunnel at the Wind-Guard headquarters.
Figure 5: Photo of the variable air density wind tunnel during the installation.
VT180259_01_Rev0
Anemometer calibration at different air temperatures and air pressures Page 9 of 16
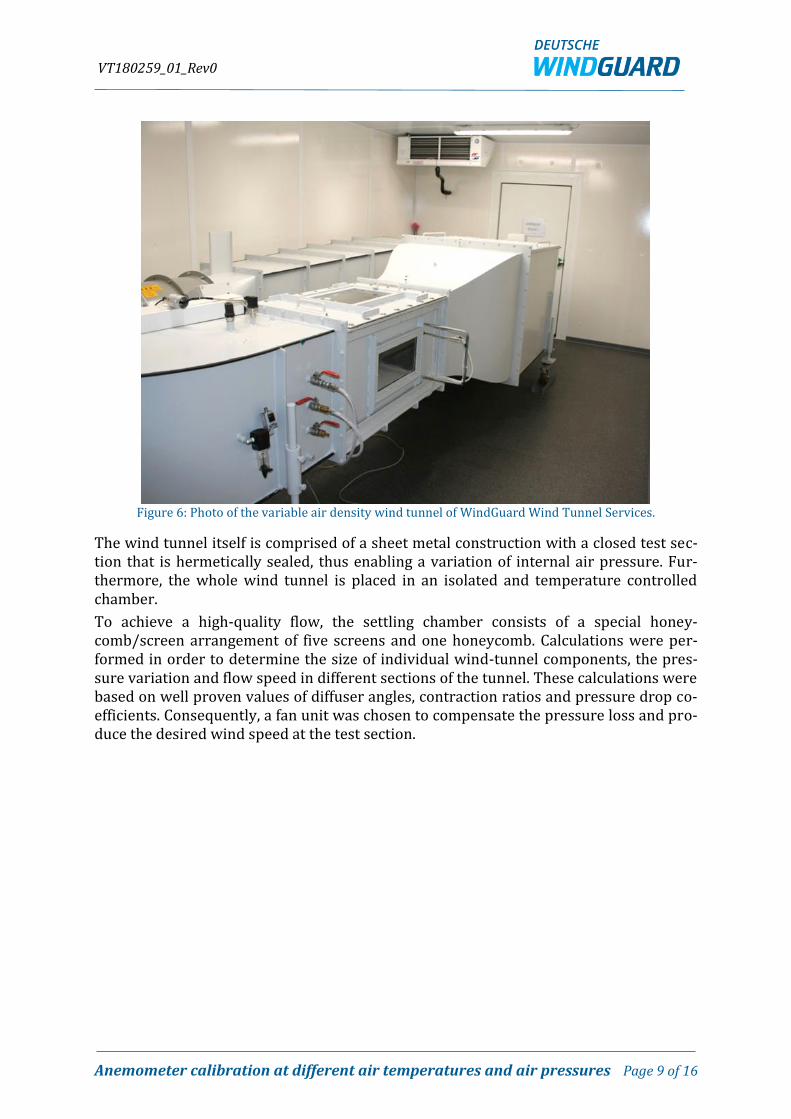
Figure 6: Photo of the variable air density wind tunnel of WindGuard Wind Tunnel Services.
The wind tunnel itself is comprised of a sheet metal construction with a closed test sec-tion that is hermetically sealed, thus enabling a variation of internal air pressure. Fur-thermore, the whole wind tunnel is placed in an isolated and temperature controlled chamber.
To achieve a high-quality flow, the settling chamber consists of a special honey-comb/screen arrangement of five screens and one honeycomb. Calculations were per-formed in order to determine the size of individual wind-tunnel components, the pres-sure variation and flow speed in different sections of the tunnel. These calculations were based on well proven values of diffuser angles, contraction ratios and pressure drop co-efficients. Consequently, a fan unit was chosen to compensate the pressure loss and pro-duce the desired wind speed at the test section.
VT180259_01_Rev0
Anemometer calibration at different air temperatures and air pressures Page 10 of 16
3.1 Measuring system
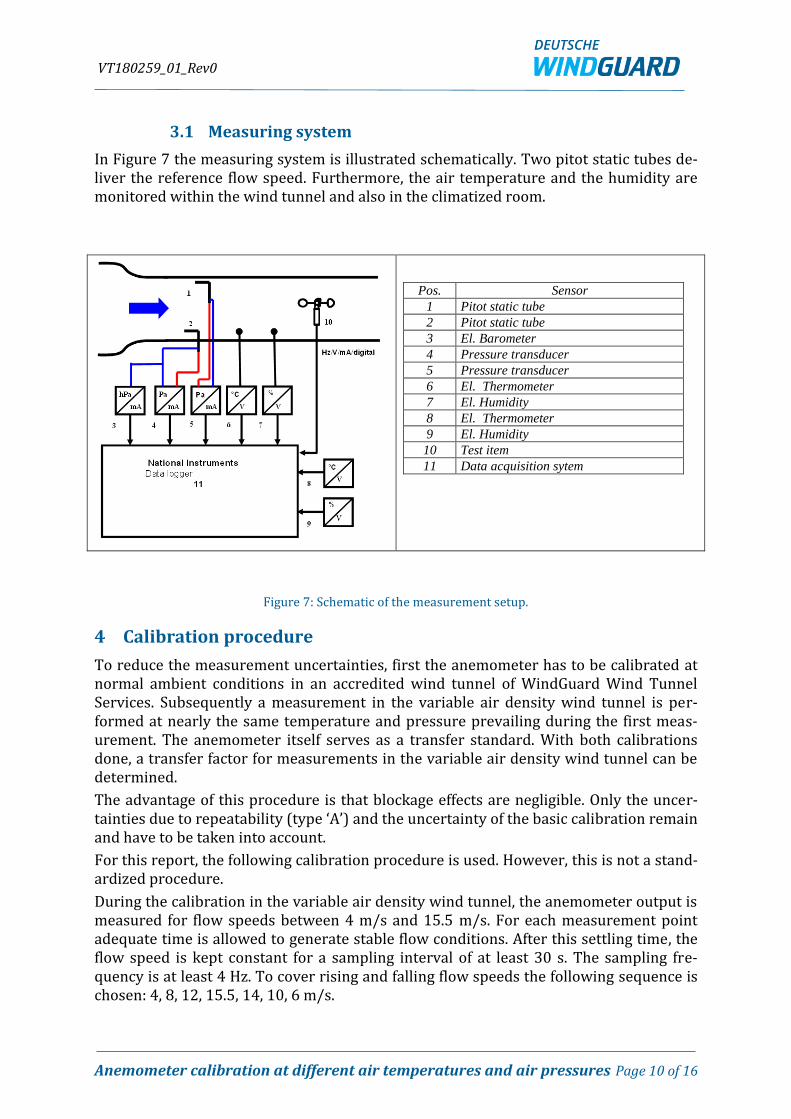
In Figure 7 the measuring system is illustrated schematically. Two pitot static tubes de-liver the reference flow speed. Furthermore, the air temperature and the humidity are monitored within the wind tunnel and also in the climatized room.
Pos. Sensor
1 Pitot static tube
2 Pitot static tube
3 El. Barometer
4 Pressure transducer
5 Pressure transducer
6 El. Thermometer
7 El. Humidity
8 El. Thermometer
9 El. Humidity
10 Test item
11 Data acquisition sytem
Figure 7: Schematic of the measurement setup.
4 Calibration procedure
To reduce the measurement uncertainties, first the anemometer has to be calibrated at normal ambient conditions in an accredited wind tunnel of WindGuard Wind Tunnel Services. Subsequently a measurement in the variable air density wind tunnel is per-formed at nearly the same temperature and pressure prevailing during the first meas-urement. The anemometer itself serves as a transfer standard. With both calibrations done, a transfer factor for measurements in the variable air density wind tunnel can be determined.
The advantage of this procedure is that blockage effects are negligible. Only the uncer-tainties due to repeatability (type ‘A’) and the uncertainty of the basic calibration remain and have to be taken into account.
For this report, the following calibration procedure is used. However, this is not a stand-ardized procedure.
During the calibration in the variable air density wind tunnel, the anemometer output is measured for flow speeds between 4 m/s and 15.5 m/s. For each measurement point adequate time is allowed to generate stable flow conditions. After this settling time, the flow speed is kept constant for a sampling interval of at least 30 s. The sampling fre-quency is at least 4 Hz. To cover rising and falling flow speeds the following sequence is chosen: 4, 8, 12, 15.5, 14, 10, 6 m/s.
VT180259_01_Rev0
Anemometer calibration at different air temperatures and air pressures Page 11 of 16
4.1 Calibration procedure for varying air temperatures
After determining the transfer factor for the anemometer under investigation, the air
temperature is decreased down to -20 °C and a calibration run is done. The air tempera-
ture is then increased in 5 °C steps up to the maximum air temperature of 40 °C, while
the air pressure is kept constant. At each temperature the calibration is done as de-
scribed above. To decrease the type ‘A’ uncertainty, the minimum duration of the sam-
pling interval is 30 s. For each calibration run a linear regression analysis is performed,
resulting in a calibration function with slope and offset for one particular air tempera-
ture.
4.2 Calibration procedure for varying air pressures
The calibration procedure for varying air pressures is done similar to varying tempera-
tures. After the measurement for the determination of the transfer factor, the air pres-
sure is increased in 50 hPa steps from 700 hPa up to 1100 hPa. To cover an air density of
about 0.8 kg/m³ to 1.4 kg/m³, the measurements for different air pressures is done at a
fixed air temperature of 10 °C. For each calibration run with variable ambient pressure a
linear regression analysis is performed, resulting in a calibration function with slope and
offset for each particular ambient air pressure.
It is possible to conduct surveys in any combination of pressure and temperature within
the parameter range as describes in Chapter 3.
VT180259_01_Rev0
Anemometer calibration at different air temperatures and air pressures Page 12 of 16
5 Measurement uncertainty
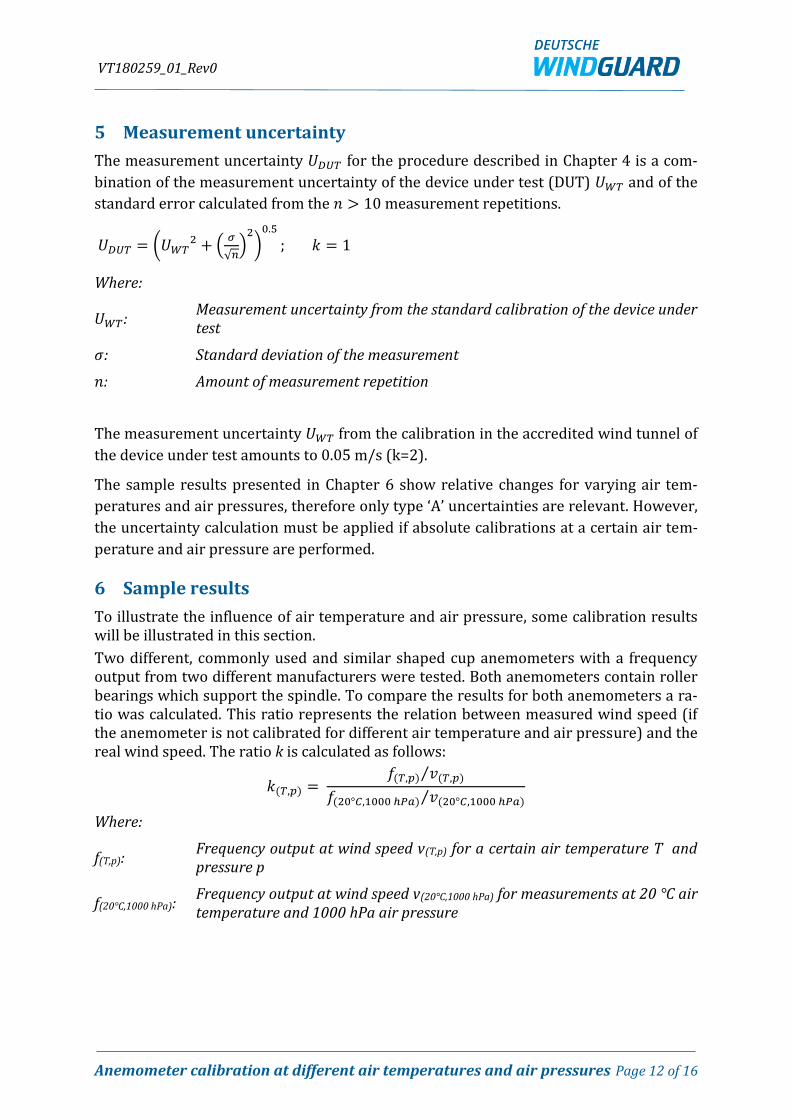
The measurement uncertainty 𝑈𝐷𝑈𝑇 for the procedure described in Chapter 4 is a com-
bination of the measurement uncertainty of the device under test (DUT) 𝑈𝑊𝑇 and of the
standard error calculated from the 𝑛 > 10 measurement repetitions.
𝑈𝐷𝑈𝑇 = (𝑈𝑊𝑇2 + (
𝜎
√𝑛)
2
)0.5
; 𝑘 = 1
Where:
𝑈𝑊𝑇: Measurement uncertainty from the standard calibration of the device under test
𝜎: Standard deviation of the measurement
𝑛: Amount of measurement repetition
The measurement uncertainty 𝑈𝑊𝑇 from the calibration in the accredited wind tunnel of
the device under test amounts to 0.05 m/s (k=2).
The sample results presented in Chapter 6 show relative changes for varying air tem-
peratures and air pressures, therefore only type ‘A’ uncertainties are relevant. However,
the uncertainty calculation must be applied if absolute calibrations at a certain air tem-
perature and air pressure are performed.
6 Sample results
To illustrate the influence of air temperature and air pressure, some calibration results will be illustrated in this section.
Two different, commonly used and similar shaped cup anemometers with a frequency output from two different manufacturers were tested. Both anemometers contain roller bearings which support the spindle. To compare the results for both anemometers a ra-tio was calculated. This ratio represents the relation between measured wind speed (if the anemometer is not calibrated for different air temperature and air pressure) and the real wind speed. The ratio k is calculated as follows:
𝑘(𝑇,𝑝) = 𝑓(𝑇,𝑝) 𝑣(𝑇,𝑝)⁄
𝑓(20°𝐶,1000 ℎ𝑃𝑎) 𝑣(20°𝐶,1000 ℎ𝑃𝑎)⁄
Where:
f(T,p): Frequency output at wind speed v(T,p) for a certain air temperature T and pressure p
f(20°C,1000 hPa): Frequency output at wind speed v(20°C,1000 hPa) for measurements at 20 °C air temperature and 1000 hPa air pressure
VT180259_01_Rev0
Anemometer calibration at different air temperatures and air pressures Page 13 of 16
6.1 Calibration results for varying air temperatures
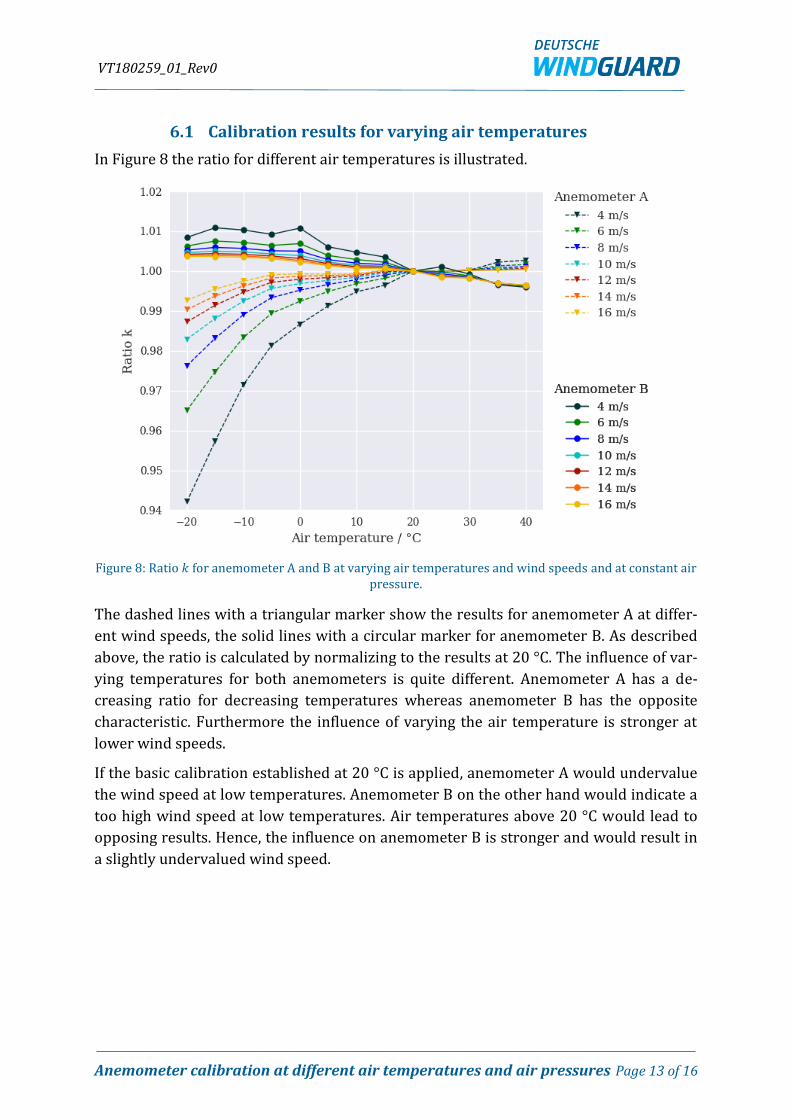
In Figure 8 the ratio for different air temperatures is illustrated.
Figure 8: Ratio 𝑘 for anemometer A and B at varying air temperatures and wind speeds and at constant air
pressure.
The dashed lines with a triangular marker show the results for anemometer A at differ-
ent wind speeds, the solid lines with a circular marker for anemometer B. As described
above, the ratio is calculated by normalizing to the results at 20 °C. The influence of var-
ying temperatures for both anemometers is quite different. Anemometer A has a de-
creasing ratio for decreasing temperatures whereas anemometer B has the opposite
characteristic. Furthermore the influence of varying the air temperature is stronger at
lower wind speeds.
If the basic calibration established at 20 °C is applied, anemometer A would undervalue
the wind speed at low temperatures. Anemometer B on the other hand would indicate a
too high wind speed at low temperatures. Air temperatures above 20 °C would lead to
opposing results. Hence, the influence on anemometer B is stronger and would result in
a slightly undervalued wind speed.
VT180259_01_Rev0
Anemometer calibration at different air temperatures and air pressures Page 14 of 16
6.2 Calibration results for varying air pressures/air densities
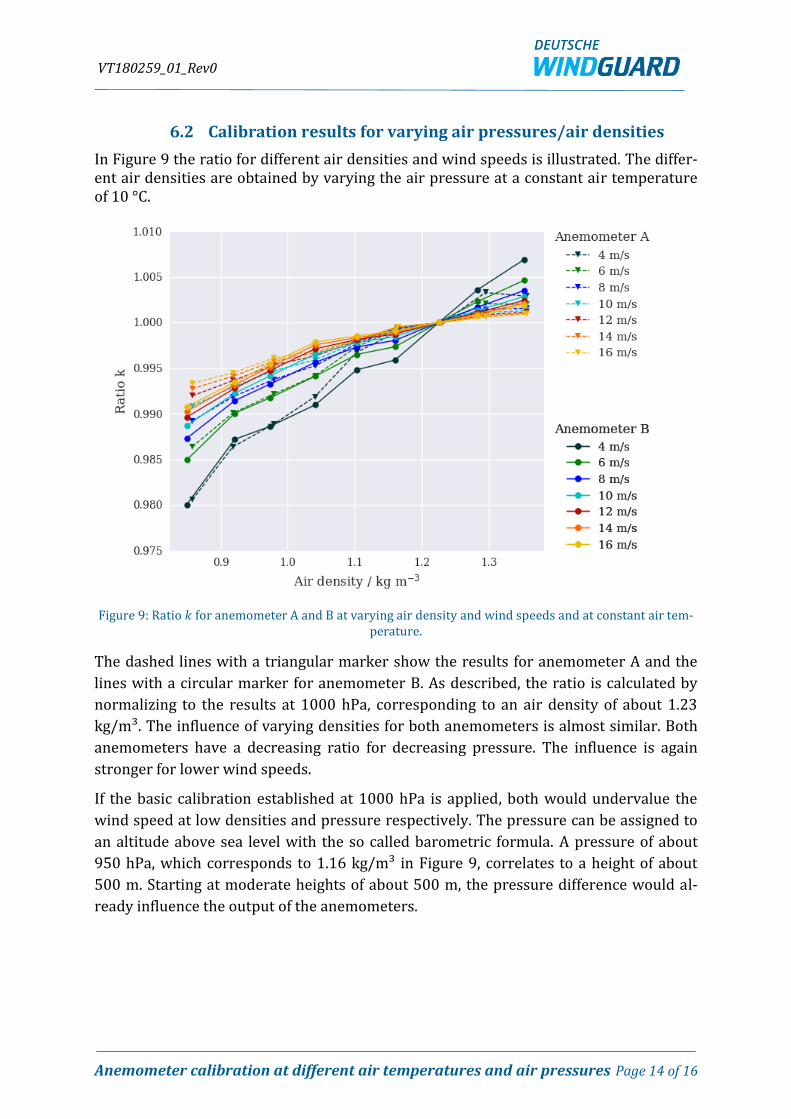
In Figure 9 the ratio for different air densities and wind speeds is illustrated. The differ-ent air densities are obtained by varying the air pressure at a constant air temperature of 10 °C.
Figure 9: Ratio 𝑘 for anemometer A and B at varying air density and wind speeds and at constant air tem-perature.
The dashed lines with a triangular marker show the results for anemometer A and the
lines with a circular marker for anemometer B. As described, the ratio is calculated by
normalizing to the results at 1000 hPa, corresponding to an air density of about 1.23
kg/m³. The influence of varying densities for both anemometers is almost similar. Both
anemometers have a decreasing ratio for decreasing pressure. The influence is again
stronger for lower wind speeds.
If the basic calibration established at 1000 hPa is applied, both would undervalue the
wind speed at low densities and pressure respectively. The pressure can be assigned to
an altitude above sea level with the so called barometric formula. A pressure of about
950 hPa, which corresponds to 1.16 kg/m³ in Figure 9, correlates to a height of about
500 m. Starting at moderate heights of about 500 m, the pressure difference would al-
ready influence the output of the anemometers.
VT180259_01_Rev0
Anemometer calibration at different air temperatures and air pressures Page 15 of 16
7 Conclusion
The results presented in Chapter 5 clearly verify the influence of varying air tempera-
ture and air pressure on the cup anemometer performance. For the two tested cup ane-
mometers, the influence is more pronounced at low wind speeds. While the results for
varying air pressures are similar between the tested anemometers, the results for vary-
ing air temperatures are opposing. This demonstrates that a change in air temperature
can have other effects than just an increase in bearing friction. Therefore it is not suffi-
cient to evaluate the influence of varying temperature with the flywheel method. It is
necessary to perform tests in which the whole anemometer is exposed to different tem-
peratures.
Additionally, the results demonstrate the importance to consider air pressure as a pri-
mary influencing variable on cup anemometer measurements, rather than air density.
Moreover, as the air density is dependent on air temperature and air pressure, the influ-
ence of the air density and air temperature on cup anemometer measurements can be
very different. None of these aspects are covered in IEC 61400-12-1 [1].
If cup anemometers are used in subarctic climate regions or in higher altitudes, a stand-
ard calibration can lead to an under or over estimation of the wind speed. The magni-
tude may be in the order of several percent in wind speed, which is an even greater de-
viation in wind power.
Also the use of anemometers for the wind turbine control in these regions may result in
a delayed start of power production, especially as the influence of air pressure and tem-
perature is the highest for low wind speeds.
A correction procedure to adjust the indicated wind speed seems feasible. The correc-
tion algorithm may be developed considering air pressure, air temperature and wind
speed. This correction function has to be individually developed for each anemometer
type. Further discussion is needed on how to assess the impact of the air pressure and
air temperature correction upon the associated uncertainty due to anemometer class
number according to [1].
VT180259_01_Rev0
Anemometer calibration at different air temperatures and air pressures Page 16 of 16
8 References
[1] IEC 61400-12-1, Edition 2.0, Wind energy generation systems – Part 12-1: Power
performance measurements of electricity producing wind turbines, IEC TC/SC 88,
2017
[2] T. Friis Pedersen, Characterisation and Classification of RISØ P2546 Cup Anemom-
eter, Risø-R-1364(ed. 2)(EN), March 2004
[3] P. Purucker, Untersuchung des thermischen Einflusses der Lagerreibung auf das
Kalibrierergebnis von Schalensternanemometern, Bachelorarbeit, WindGuard
Wind Tunnel Services GmbH, 2016
[4] W. G. Cochran, The flow due to a rotating disc, Mathematical Proceedings of the
Cambridge Philosophical Society, Vol. 30(3), pp. 365-375, 1934
[5] D. Westermann, Investigation and Classification of the Anemometer Thies First
Class, WindGuard AK03 002, April 2003
[6] J.-Å. Dahlberg, J. Gustavsson, G. Ronsten, T. F. Pedersen, U. Schmidt Paulsen D.
Westermann, CLASSCUP - Development of a standardised cup anemometer suited
to wind energy applications, June 2001
[7] C. May, Windkanaluntersuchungen zum Einfluss von Lufttemperatur und Luft-
druck auf das Kalibrierergebnis von Anemometern, Bachelorarbeit, WindGuard
Wind Tunnel Services GmbH, 2017