Embed Size (px)
DESCRIPTION
Utilizing the Health Belief Model to Assess Attitudes and Beliefs of Hemodialysis Patients Regarding the Seasonal Influenza, Pneumococcal and Hepatitis B Vaccines. Angela Adams, MSN,RN,CNN,DNP(c) Melissa Hall, DNP,RN,ANP-BC,FNP-BC,GNP-BC Janis Fulghum, BSN,RN,CNN. Objectives. - PowerPoint PPT Presentation
Citation preview

Utilizing the Health Belief Model to Assess Attitudes and Beliefs of Hemodialysis Patients Regarding the Seasonal Influenza, Pneumococcal and Hepatitis B
Vaccines
Angela Adams, MSN,RN,CNN,DNP(c)Melissa Hall, DNP,RN,ANP-BC,FNP-BC,GNP-BC
Janis Fulghum, BSN,RN,CNN

Objectives• Identify the overall impact of influenza, pneumonia, and the Hepatitis B Virus
(HBV)
• Recognize the importance of immunization as an effective strategy to prevent infectious disease related morbidity and mortality
• Identify special immunization considerations in the Chronic Kidney Disease Stage V (CKD Stage V) population
• Demonstrate the use of the Health Belief Model (HBM) to promote acceptance of immunization in the hemodialysis population
• Recognize individual practice applications for implementation
• Identify strategies for maintaining and sustaining change related to increasing immunization acceptance in the CKD Stage V population treated with hemodialysis
• Recognize future implications of utilizing the HBM to assess attitudes and beliefs of hemodialysis patients

Background and SignificanceOverall Impact of Influenza
• Average of >200,000 influenza-related hospitalizations annually
• 57% of hospitalizations and 90% death occur among persons < 65 years of age
• 0.5-1 deaths per 1,000 cases; > 23,000 deaths annually • Nursing homes rates ≥ 60%, with fatality rates ≥ 30%
• 2.7 times more deaths occurred during seasons when a(H3N2) viruses were prominent
• Cost of a severe epidemic $12 billion

Background and SignificanceOverall Impact of Pneumonia
• Estimated 175,000 hospitalizations annually
• Disease incidence rates: 36% of adult community-acquired pneumonia, 50% hospital-acquired pneumonia
• Common bacterial complication of influenza and measles
• Case-fatality rate 5%-7%, higher in elderly
• Chronic heart, pulmonary, liver or renal disease ↑ risk of invasive disease

Background and SignificanceOverall Impact of Hepatits B Virus (HBV)
• 38,000–73,000 new HBV infections annually in the U.S
• 600,000 HBV-related deaths annually worldwide
• 2 billion persons worldwide have been infected with HBV
• 350 million worldwide live with chronic infection
• Chronic HBV ↑ risk for chronic liver disease, cirrhosis, and liver cancer
• Cost $700 million annually for HBV related medical care and work loss

Special Considerations in the CKD Stage V Population
• Patients are “sicker”,1 often with dysfunctional immune systems2
– Greater disease burden – cardiovascular, infectious, inflammatory, uremic
– Increased susceptibility for infection
– Decreased response to vaccination
– Decreased maintenance of protective antibodies
• Implications:
– Results of studies in the general population do not always apply –try
geriatric studies
– Vaccines need to be evaluated individually
– Risks and benefits (and cost issues) need to be weighed
– There is a great need to prevent infections in ESRD1 USRDS ADR 2007
2 Pesanti EL. Infections in CRF. Infect Dis Clin North Am. 15: 1-15, 2001
Slide recreated with permission from Lascon, E. (2008). Vaccination in adult patients with ESRD
(PDF document). Retrieved from https://fmc4me.fmcna.com
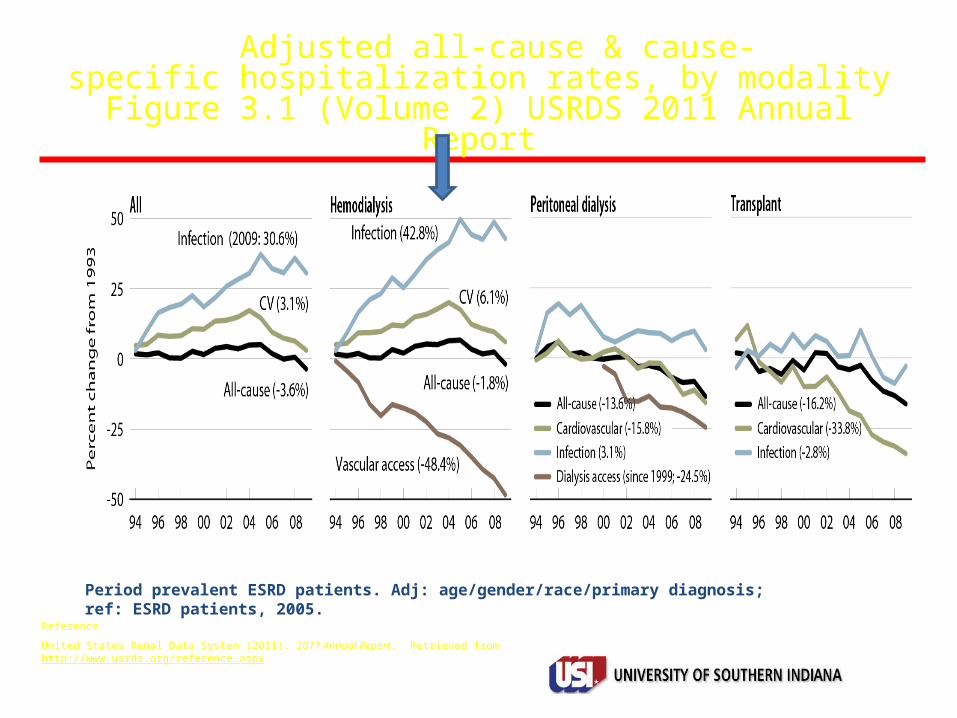
Adjusted all-cause & cause-specific hospitalization rates, by modality
Figure 3.1 (Volume 2) USRDS 2011 Annual Report
Period prevalent ESRD patients. Adj: age/gender/race/primary diagnosis; ref: ESRD patients, 2005.Reference
United States Renal Data System (2011). 2011 Annual Report. Retrieved from http://www.usrds.org/reference.aspx

Retrieved from http://www.cdc.gov/vaccines/recs/images/adult-schedule-chart-2.jpg
2012 Adult Immunization Schedule Based on Medical and Other Indications

USRDS 2011 Quality indicators: percentage of patients meeting clinical & preventive care guidelinesFigure 2.1 (Volume 2)
Reference
United States Renal Data System (2011). 2011 Annual Report. Retrieved from http://www.usrds.org/reference.aspx

Concept Map: Acceptance
Context: Acceptance of Influenza and Pneumococcal Vaccine in the Hemodialysis Population
Defining Attributes•Alignment of patient behavior and provider advice•Ability to met mutual goals and overcome perceived barriers
Theoretical Definition: Decision to act favorably toward disease preventive measures based on an individual’s perceived susceptibility, severity and threat of a disease process vs. the individual's perceived benefit minus the perceived barriers to the preventive health measure.
Acceptance
Related Terms•Compliance•Adherence•Concordance•Decision making
Operational DefinitionTool utilized to measure components of theoretical definition: Champion’s Health Belief Model Scale, vaccine consent forms, interview of clients to assess recommendation of vaccines to acquaintances and significant others
Patient Related•Immunization against disease processes•Decreased morbidity•Decreased mortality
Empirical Referents•Consent•Initial engagement in disease preventive measure•Repeat engagement in disease preventive measure•Recommendation of disease preventive measure to acquaintances and significant others
Antecedents•Prescribed disease preventive measure•Perceived disease susceptibility•Perceived disease severity•Perceived benefit of disease preventive measure•Lack of barriers•Access•Lack of contraindications•Creditable education•Healthcare provider advisement•Altruism•Self efficacy•Internal locus of control
Consequences
Health System Related•Decease healthcare cost•Decrease health system use
Modifying Variables•Age•Education level•Cultural beliefs•Religious beliefs•Socioeconomic status

Literature Review• Search engines reviewed
• Inclusion criteria
• Exclusion criteria
• Key terms - acceptance decision making adherence,
compliance, vaccine, immunization, influenza, pneumococcal, chronic kidney disease, chronic disease, disease , elderly

Perceived susceptibility to
influenza, pneumonia, and
hepatitis B
Perceivedseverity ofinfluenza
pneumonia, and Hepatitis B
Perceivedbenefits of influenza,
pneumococcal and hepatitis B
vaccines
Perceivedbarriers to receiving
influenza,pneumococcal and hepatitis B
vaccines
Personal VariablesAgeEducation levelCultural beliefsReligious beliefsSocioeconomic status
Cues to ActionHealthcare providerVaccine prescriptionHealthcare provideradvisementVaccine information SheetDiagnosis of family oracquaintance with influence or pneumoniaMedia campaigns
Theory: Health Belief Model Context: Acceptance of Influenza, Pneumococcal and Hepatitis B Vaccines in the Hemodialysis
Population
Individual perceptions regarding influenza, pneumococcal and hepatitis B vaccines
Modifying Variables Likelihood of Action
Perceived benefits of the influenza.
pneumococcal and hepatitis B vaccines
minusperceived barriers to receiving the vaccines
Self efficacyPerceived ability to
overcome the perceivedbarriers and receive
the influenza, pneumococcal,and hepatitis B
vaccines
Reference: Glanz, K., Rimer, B.K. & Lewis, F.M. (2002). Health Behavior and Health Education. Theory, Research and Practice. P. 52, San Francisco: Wiley &Sons.

Project Purpose• Determine if there is a significant difference between gender and beliefs
based on perceived susceptibility, benefits, barriers, and severity related to vaccine acceptance in the outpatient hemodialysis population
• Determine if there is a significant relationship between age and beliefs based on perceived susceptibility, benefits, barriers, and severity related to vaccine acceptance in the outpatient hemodialysis population
• Determine if perceived susceptibility , benefits, barriers, and cues to action will change the odds of receiving the influenza, pneumococcal, and hepatitis B vaccines related to vaccine acceptance in the outpatient hemodialysis population
• Utilize project findings to influence interdisciplinary assessment and plans of care related to vaccine acceptance in the outpatient hemodialysis population
• Utilize project findings to develop vaccine improvement strategies related to vaccine acceptance in the outpatient hemodialysis population

DNP ProjectDesign and Methodology
• Design: Qualitative, descriptive, comparative
• Setting: 10 outpatient hemodialysis facilities in metropolitan Atlanta, Georgia and Anderson, South Carolina affiliated with a large dialysis provider (LDP)
• Sample: - Influenza Survey: N= 215- Pneumonia Survey: N= 206- HBV Survey: N= 161
• Approach: informed consent, written survey

DNP ProjectDesign and Methodology
Instrument:• 22-item questionnaire adapted from Champion’s Health Belief
Model (HMB) Survey • Survey utilizes 5 point Likert scale scoring scale Perceived susceptibility towards vaccine Perceived severity towards vaccine Perceived benefits towards vaccine Perceived barriers towards vaccine Cues to Action• Demographic information: age, gender, dialysis vintage• Vaccination history: date of last vaccine

DNP Project Survey Tool Health Belief Model Influenza Vaccine Survey
Patient Age: Date of last influenza vaccine:
Patient Gender:
Dialysis Vintage:
Perceived Barriers Strongly Agree 5 4 3 2 1
Strongly Disagree
1 I do not want to get the flu shot 5 4 3 2 1
2 The flu shot will make me sick 5 4 3 2 1
3 Getting the flu shot takes too much time 5 4 3 2 1
4 Getting the flu shot takes too much effort 5 4 3 2 1
5 The flu shot is not available at a convenient time 5 4 3 2 1
6 The flu shot is not available at a convenient location 5 4 3 2 1
7 I need more information before I can make a decision about 5 4 3 2 1
taking the flu shot
8 Flu shots cost too much 5 4 3 2 1
Perceived Benefits Strongly Agree 5 4 3 2 1
Strongly Disagree
9 The flu shot is safe for me 5 4 3 2 1
10 Taking the flu shot will prevent the flu 5 4 3 2 1
11 Taking the flu shot may save my life. 5 4 3 2 1
12 I do not want to spread the flu to my family, 5 4 3 2 1
friends, patients and workers at the dialysis clinic
Perceived Susceptibility Strongly Agree 5 4 3 2 1
Strongly Disagree
13 I have an increased chance of getting the flu 5 4 3 2 1
14 I get sick more often than others my age 5 4 3 2 1
Perceived Severity Strongly Agree 5 4 3 2 1
Strongly Disagree
15 Complications from the flu could be serious 5 4 3 2 1
16 Getting the flu may lead to other serious health problems 5 4 3 2 1
Cues to Action Strongly Agree 5 4 3 2 1
Strongly Disagree
17 I will take the flu shot if my doctor said it is important 5 4 3 2 1
18 I will take the flu shot if my dialysis nurse said it is important 5 4 3 2 1
19 I will take the flu shot if my pharmacist said it is important 5 4 3 2 1
20 I will take the flu shot if a family member or significant other 5 4 3 2 1
said it is important
21 I will take the flu shot if I see a TV ad that said it is important 5 4 3 2 1
22 I will take the flu shot if the interdisciplinary team at the 5 4 3 2 1
dialysis clinic said it is important during my care plan meeting

Data Analysis and ResultsDescriptive Statistics for HBM Scores by Influenza Vaccine
Influenza Vaccine Mean Std. Deviation NPerceived Barriers Flu Shot No Flu Vaccine 1.8780 .96532 84
Received Flu Vaccine 1.6423 .75549 94
Total 1.7535 .86648 178Perceived Benefits Flu Shot No Flu Vaccine 3.7868 1.08543 95
Received Flu Vaccine 3.9867 .97275 113
Total 3.8954 1.02808 208Perceived Susceptibility Flu Shot No Flu Vaccine 2.7696 1.26583 102
Received Flu Vaccine 2.8451 1.18034 113
Total 2.8093 1.21936 215Perceived Severity Flu Shot No Flu Vaccine 3.9133 1.10534 98
Received Flu Vaccine 3.9911 1.02003 112
Total 3.9548 1.05884 210Cues To Action Flu Shot No Flu Vaccine 3.5686 1.16001 102
Received Flu Vaccine 3.7738 .98178 112
Total 3.6760 1.07281 214
•Individuals who received the flu vaccine had a lower average on Perceived Barriers, a higher average on Perceived Benefits, a higher average on Perceived Susceptibility, and a higher average on Cues to Action. There was almost no difference between groups on Perceived Severity.
•

Influenza Vaccine
0.00
0.50
1.00
1.50
2.00
2.50
3.00
3.50
4.00
4.50
No Vaccine 1.88 3.79 2.77 3.91 3.57
Received Vaccine 1.64 3.99 2.85 3.99 3.77
Perceived Barriers Flu
Shot
Perceived Benefits Flu
Shot
Perceived Susceptibility
Flu Shot
Perceived Severity Flu
Shot
Cues To Action Flu Shot
Data Analysis and Results
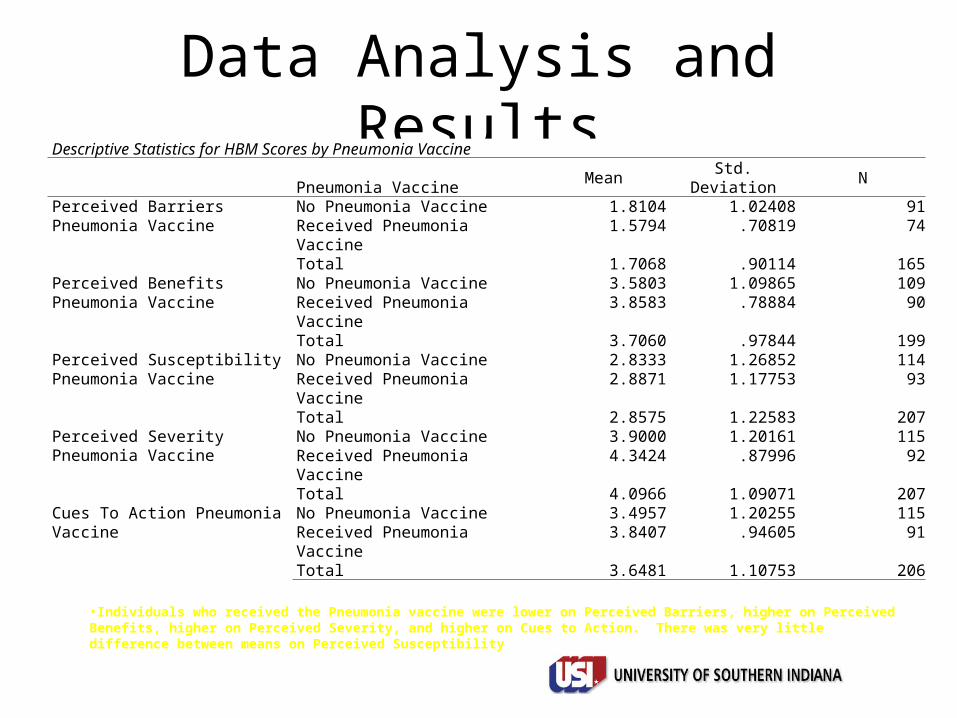
Data Analysis and ResultsDescriptive Statistics for HBM Scores by Pneumonia Vaccine
Pneumonia VaccineMean Std. Deviation N
Perceived Barriers Pneumonia Vaccine
No Pneumonia Vaccine 1.8104 1.02408 91Received Pneumonia Vaccine 1.5794 .70819 74
Total 1.7068 .90114 165Perceived Benefits Pneumonia Vaccine
No Pneumonia Vaccine 3.5803 1.09865 109Received Pneumonia Vaccine 3.8583 .78884 90
Total 3.7060 .97844 199Perceived Susceptibility Pneumonia Vaccine
No Pneumonia Vaccine 2.8333 1.26852 114Received Pneumonia Vaccine 2.8871 1.17753 93
Total 2.8575 1.22583 207Perceived Severity Pneumonia Vaccine
No Pneumonia Vaccine 3.9000 1.20161 115Received Pneumonia Vaccine 4.3424 .87996 92
Total 4.0966 1.09071 207Cues To Action Pneumonia Vaccine No Pneumonia Vaccine 3.4957 1.20255 115
Received Pneumonia Vaccine 3.8407 .94605 91
Total 3.6481 1.10753 206
•Individuals who received the Pneumonia vaccine were lower on Perceived Barriers, higher on Perceived Benefits, higher on Perceived Severity, and higher on Cues to Action. There was very little difference between means on Perceived Susceptibility

Pneumonia Vaccine
0.00
0.50
1.00
1.50
2.00
2.50
3.00
3.50
4.00
4.50
5.00
No Vaccine 1.81 3.58 2.83 3.90 3.50
Received Vaccine 1.58 3.86 2.89 4.34 3.84
Perceived Barriers Flu
Shot
Perceived Benefits Flu
Shot
Perceived Susceptibility
Flu Shot
Perceived Severity Flu
Shot
Cues To Action Flu Shot
Data Analysis and Results

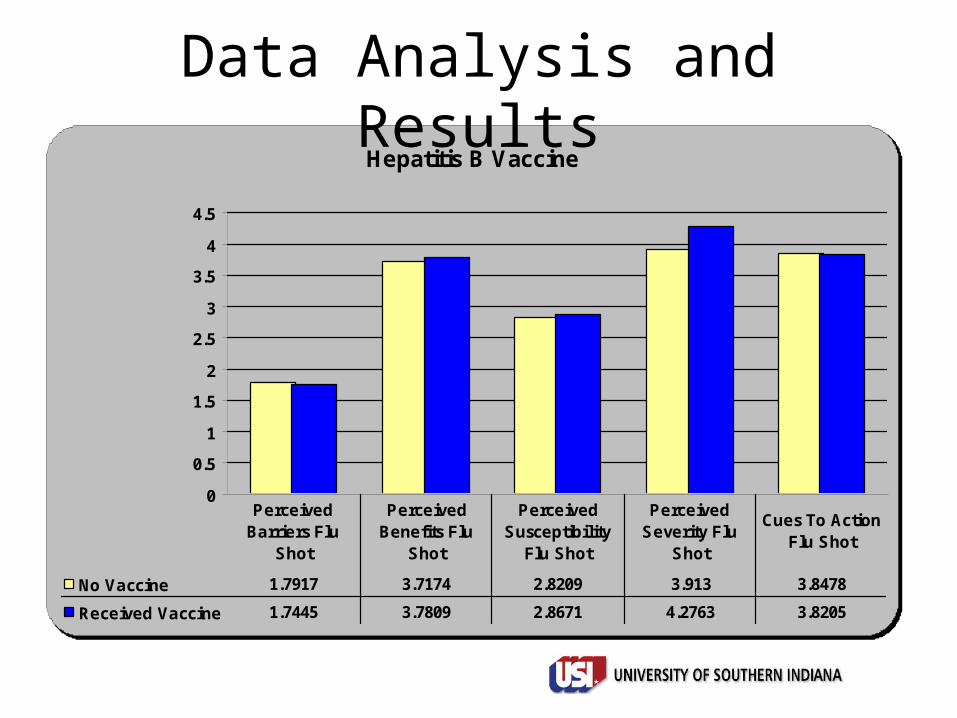
Data Analysis and Results
•For the Hepatitis B survey, there were very slight differences between group means on Perceived Barriers, Perceived Benefits, Perceived Susceptibility, and Cues to Action. Those who received the Hepatitis B vaccine were slightly higher on Perceived Severity
Descriptive Statistics for HBM Scores by Hepatitis B Vaccine
Hepatitis B Vaccine Mean Std. Deviation NPerceived Barriers Hepatitis B Vaccine
No Hepatitis B Vaccine 1.7917 .94648 93
Received Hepatitis B Vaccine 1.7445 .79920 68
Total 1.7717 .88494 161
Perceived Benefits Hepatitis B Vaccine
No Hepatitis B Vaccine 3.7174 .94802 69
Received Hepatitis B Vaccine 3.7809 .67706 81
Total 3.7517 .81074 150
Perceived Susceptibility Hepatitis B Vaccine
No Hepatitis B Vaccine 2.8209 1.24834 67
Received Hepatitis B Vaccine 2.8671 1.07926 79
Total 2.8459 1.15604 146
Perceived Severity Hepatitis B Vaccine
No Hepatitis B Vaccine 3.9130 1.08789 69
Received Hepatitis B Vaccine 4.2763 .84615 76
Total 4.1034 .98230 145
Cues To Action Hepatitis B Vaccine
No Hepatitis B Vaccine 3.8478 1.01127 69
Received Hepatitis B Vaccine 3.8205 .86655 78
Total 3.8333 .93409 147
Hepatitis B Vaccine
0
0.5
1
1.5
2
2.5
3
3.5
4
4.5
No Vaccine 1.7917 3.7174 2.8209 3.913 3.8478
Received Vaccine 1.7445 3.7809 2.8671 4.2763 3.8205
Perceived Barriers Flu
Shot
Perceived Benefits Flu
Shot
Perceived Susceptibility
Flu Shot
Perceived Severity Flu
Shot
Cues To Action Flu Shot
Data Analysis and Results

Data Analysis and Results
•All Levene’s tests were nonsignificant (sig. values were greater than .05 using that criterion). This suggests that the assumption of equal variances was not violated.
Levene's Tests for HBM Scores by GenderF df1 df2 Sig.
Perceived Barriers Flu Shot .754 1 75 .388Perceived Benefits Flu Shot .038 1 75 .846Perceived Susceptibility Flu Shot 1.791 1 75 .185Perceived Severity Flu Shot .008 1 75 .929Perceived Barriers Pneumonia Vaccine .042 1 75 .838Perceived Benefits Pneumonia Vaccine 1.157 1 75 .286Perceived Susceptibility Pneumonia Vaccine .286 1 75 .594Perceived Severity Pneumonia Vaccine .510 1 75 .477Perceived Barriers Hepatitis B Vaccine .068 1 75 .794Perceived Benefits Hepatitis B Vaccine .479 1 75 .491Perceived Susceptibility Hepatitis B Vaccine .290 1 75 .592Perceived Severity Hepatitis B Vaccine .034 1 75 .854

Data Analysis and Results
•The Wald statistic for Pneumonia Perceived Severity was significant. This test must be interpreted with extreme caution, because the overall chi-square value test was nonsignificant and there is evidence for weak model fit. This could be a type 1 (false positive) error. The Exp (B) value suggests that increases in Perceived Severity resulted in an increase in the odds of getting the Pneumonia Vaccine.
Regression Coefficients for Pneumonia Vaccine by HBM Scores
B S.E. Wald df Sig. Exp(B)
Pneumonia Perceived Barriers -.169 .217 .609 1 .435 .844
Pneumonia Perceived Benefits -.164 .249 .432 1 .511 .849
Pneumonia Perceived Susceptibility -.054 .152 .126 1 .722 .947
Pneumonia Perceived Severity .389 .192 4.094 1 .043 1.475
Pneumonia Cues to Action .212 .209 1.032 1 .310 1.237

Data Analysis and Results
•The Wald statistic for Hepatitis Perceived Severity was significant. Again, interpret this with caution since the overall chi-square value test was nonsignificant and there is evidence for weak model fit. This could be a type 1 (false positive) error. The Exp (B) value suggests that increases in Perceived Severity resulted in an increase in the odds of getting the Hepatitis B Vaccine
Regression Coefficients for Hepatitis B Vaccine by HBM Scores
B S.E. Wald df Sig. Exp(B)
Hepatitis B Perceived Barriers .166 .260 .410 1 .522 1.181
Hepatitis B Perceived Benefits -.127 .328 .149 1 .699 .881
Hepatitis B Perceived Susceptibility -.096 .193 .246 1 .620 .909
Hepatitis B Perceived Severity .627 .251 6.236 1 .013 1.873
Hepatitis B Cues To Action -.198 .290 .467 1 .494 .820

Data Analysis and Result Summary
• There was a weak negative correlation between Age and Perceived Susceptibility for the Influenza Vaccine. Older participants had a slight tendency to report lower susceptibility.
• There was a weak negative correlation between Age and Perceived Susceptibility for the Pneumonia Vaccine. Older participants had a slight tendency to report lower susceptibility.
• There were no significant correlations between perceived susceptibility, benefits, barriers, and dialysis vintage.
• Pneumonia Perceived Severity increased the odds of getting the Pneumonia Vaccine
• Hepatitis Perceived Severity increased the odds of getting the Hepatitis B Vaccine. The Wald statistic was significant.

DNP Study Limitations
• Survey instrument amended to fit purpose of study
• Study sites limited to southeastern, metropolitan locations part of one designated region affiliated with a single LDP
• Study participants limited to CKD Stage V patients treated with hemodialysis
• Facility staff bias could influence survey outcomes

Reference
United States Renal Data System (2011). 2011 Annual Report. Retrieved from http://www.usrds.org/reference.aspx
Implementing and Sustaining Change

Reference
United States Renal Data System (2011). 2011 Annual Report. Retrieved from http://www.usrds.org/reference.aspx
Implementing and Sustaining Change

Reference
United States Renal Data System (2011). 2011 Annual Report. Retrieved from http://www.usrds.org/reference.aspx
Implementing and Sustaining Change
Implementing and Sustaining Change
A Sense of Urgency
A Sense of Urgency
•Bringing the outside in
•Behaving with urgency every day
•Finding opportunity in crisis
•Dealing with “NoNos” or naysayers
Retrieved from http://www.amazon.com

Retrieved from http://www.bing.com/images
Implementing and Sustaining ChangeLewin’s Change Model

Driving Force Vaccine Rates < Healthy People 2010 and 2020 goals for hemodialysis patients
Restraining Forces
Increased morbidity and mortality related to infection
Lack of interdisciplinary team knowledge regarding vaccine rates and vaccine benefits
Lack of patient knowledge regarding disease severity and vaccine benefit
Patient and staff perceived barriers to vaccine acceptance
Missed treatments due to hospitalization
Nurses lack time to research vaccine history
CMS appoints ESRD networks oversight of dialysis facilities to increase vaccine rates
Patients are poor historians of vaccine history
CMS Quality Incentive Program proposed decrease in reimbursement if vaccine goals are not met
Lack of vaccine administration documentation in medical information system and vaccine data registries
Force Field Analysis

Summary• The overall impact of influenza, pneumonia, and the HBV is profound
• Immunization is an effective strategy to prevent infectious disease related morbidity and mortality
• It is imperative to recognize special immunization considerations in the CKD Stage V population
• The Health Belief Model (HBM) can be used to assess immunization acceptance and promote uptake of vaccines in the hemodialysis population
• Lewin’s Change Model and A Sense of Urgency tactics are effective strategies for maintaining and sustaining change related to immunization promotion.
• Clinicians must continuously evaluate evidence based practice findings, such as utilization of the HBM constructs, for incorporation into individual practice settings.
Conclusions and Recommendations
• The nephrology Interdisciplinary team ( IDT) must educate patients regarding disease severity and vaccine benefits
• The nephrology IDT must be educated regarding disease impact and special considerations in the CKD Stage V population
• The nephrology IDT must be educated regarding HBM constructs and applications to disease preventive initiatives
• The nephrology IDT must examine their own perceptions related to vaccines and the HBM
• The nephrology IDT must consider HBM constructs when a assessing vaccine acceptance in the CKD Stage V hemodialysis patient population
• Additional research is warranted regarding assessing acceptance of vaccines in CKD Stage V patients, and healthcare providers (HCP) in all treatment modality settings

Conclusions and Recommendations
• Facility QAPI Programs must develop processes for insuring proper obtaining vaccine history; tracking and trending vaccine administration; MIS documentation; participation in mandated vaccine registries; and development of facility specific action plans for increasing vaccinations
Retrieved from http://www.google.com

Conclusions and Recommendations
• Dialysis providers must implement vaccine improvement programs targeting patients and staff
-Vaccine Champion/Manager -Minimize barriers for patients and staff
-Promote ↑ peer and family influence-Incorporate vaccine reminders/alerts in MIS-Utilize postal and electronic patient reminders-Designate vaccine education/promotion days-Utilize available CDC, Network and related
resources

Implications for the Future
• Disease prevention and increasing vaccine uptake in the CKD Stage V patients and Healthcare Providers has a global impact
-↓ morbidity and mortality in CKD Stage V population
-↓ financial burden on ESRD Medicare and private payer programs
-↓ financial burden on outpatient dialysis facilities
-↓ patient acuity in outpatient hemodialysis setting
-↑ job satisfaction for nephrology IDT

Implications for the Future
• The nephrology IDT is a driving force to promote influenza, pneumococcal, and HBV immunizations into individual patient’s comprehensive assessment and plan of care
• Additional nephrology focused research regarding vaccine acceptance in the CKD Stage V patient and HCP in all treatment settings
• Collaborative efforts and spread of best practices are imperative in the nephrology community to increase patient and HCP acceptance of vaccines and prevent the spread of infectious diseases
ReferencesBerry, K. S., & Somerville, K. A. (2010). Linking change drivers and the organizational change process: A review and synthesis. Journal of Change Management, 10(2), 175-193. Retrieved from http://content.ebscohost.com.lib-proxy.usi.edu/pdf23_24/pdf/2010
Center for Disease Control and Prevention. (2009). Data and Statistics. Retrieved from http://www.cdc.gov/Features/dsChronicKidneyDisease
Centers for Disease Control and Prevention. Epidemiology and Prevention of Vaccine-Preventable Diseases. Atkinson W, Hamborsky J, Wolfe S, eds. 12th ed., second printing. Washington DC: Public Health Foundation, 2012.
Champion V.L. (1984). Instrument development for health belief model constructs. Advances in Nursing Science, 6(3), 73-85.
Cork, A. (2005). A model for successful change management. Nursing Standard, 19(25), 40-40-2. Retrieved from http://search.proquest.com/docview/219846459
Kausz, A., & Pahari, D. (2004). The value of vaccination in chronic kidney disease. Seminars in Dialysis, 17(1), 9-11. Kotter, J. P. (2008). A sense of urgency. Boston, MA: Harvard Business Press.
Lascon, E. (2008). Vaccination in adult patients with ESRD (PDF document). Retrieved from https://fmc4me.fmcna.com
Medina-Shepherd, R., & Kleier, J. (2010). Spanish translation and adaptation of victoria champion's health belief model scales for breast cancer screening-mammography. Cancer Nursing, 33(2), 93. Retrieved from http://search.proquest.com/docview/232000454?accountid=14752
Miller M, Boix-Mansilla V. Thinking across perspectives and disciplines. Harvard Graduate School of Education, Interdisciplinary Studies Project; Project Zero. Retrieved from http://www.pz.harvard.edu/eBookstore
Persanti, E.L. (2001). Immunological defects and vaccination in patient with chronic renal failure. Infections Disease Clinics of North America, 813-832. doi: 10.1016/S0891-5520(05)70174
U.S. Department of Health and Human Services. Office of Disease Prevention and Health Promotion. Healthy People 2020. Washington, DC. Retrieved from http://healthypeople.gov/2020
United States Renal Data System (2011). 2011 Annual Report. Retrieved from http://www.usrds.org