Embed Size (px)
Citation preview

22 July 2019
ANGLO AMERICAN PLATINUM 2019 INTERIM RESULTS PRESENTATION
Mogalakwena mine
2
CAUTIONARY STATEMENT
Front cover image: Mogalakwena Cut 9 Rope Shovel Loading Haul Trucks
Disclaimer: This presentation has been prepared by Anglo American Platinum Limited (“Anglo American Platinum”) and comprises the written materials/slides for a presentation concerning Anglo
American Platinum. By attending this presentation and/or reviewing the slides you agree to be bound by the following conditions.
This presentation is for information purposes only and does not constitute an offer to sell or the solicitation of an offer to buy shares in Anglo American Platinum. Further, it does not constitute a
recommendation by Anglo American Platinum or any other party to sell or buy shares in Anglo American Platinum or any other securities. All written or oral forward-looking statements attributable to
Anglo American Platinum or persons acting on their behalf are qualified in their entirety by these cautionary statements.
Forward-Looking Statements
This presentation includes forward-looking statements. All statements, other than statements of historical facts included in this presentation, including, without limitation, those regarding Anglo
American Platinum’s financial position, business, acquisition and divestment strategy, plans and objectives of management for future operations (including development plans and objectives relating
to Anglo American Platinum’s products, production forecasts and reserve and resource positions), are forward-looking statements. By their nature, such forward-looking statements involve known and
unknown risks, uncertainties and other factors which may cause the actual results, performance or achievements of Anglo American Platinum, or industry results, to be materially different from any
future results, performance or achievements expressed or implied by such forward-looking statements.
Such forward-looking statements are based on numerous assumptions regarding Anglo American Platinum’s present and future business strategies and the environment in which
Anglo American Platinum will operate in the future. Important factors that could cause Anglo American Platinum’s actual results, performance or achievements to differ materially from those in the
forward-looking statements include, among others, levels of actual production during any period, levels of global demand and commodity market prices, mineral resource exploration and development
capabilities, recovery rates and other operational capabilities, the availability of mining and processing equipment, the ability to produce and transport products profitably, the impact of foreign
currency exchange rates on market prices and operating costs, the availability of sufficient credit, the effects of inflation, political uncertainty and economic conditions in relevant areas of the world, the
actions of competitors, activities by governmental authorities such as changes in taxation or safety, health, environmental or other types of regulation in the countries where Anglo American Platinum
operates, conflicts over land and resource ownership rights and such other risk factors identified in Anglo American Platinum’s most recent Annual Report. Forward-looking statements should,
therefore, be construed in light of such risk factors and undue reliance should not be placed on forward-looking statements. These forward-looking statements speak only as of the date of this
presentation. Anglo American Platinum expressly disclaims any obligation or undertaking (except as required by applicable law, the Listings Requirements of the securities exchange of the JSE
Limited in South Africa and any other applicable regulations) to release publicly any updates or revisions to any forward-looking statement contained herein to reflect any change in Anglo American
Platinum’s expectations with regard thereto or any change in events, conditions or circumstances on which any such statement is based.
Nothing in this presentation should be interpreted to mean that future earnings per share of Anglo American Platinum will necessarily match or exceed its historical published earnings per share.
Certain statistical and other information about Anglo American Platinum included in this presentation is sourced from publicly available third party sources. As such it presents the views of those third
parties, but may not necessarily correspond to the views held by Anglo American Platinum.
No Investment Advice
This presentation has been prepared without reference to your particular investment objectives, financial situation, taxation position and particular needs. It is important that you view this presentation
in its entirety. If you are in any doubt in relation to these matters, you should consult your stockbroker, bank manager, solicitor, accountant, taxation adviser or other independent financial adviser
(where applicable, as authorised in South Africa, under the Financial Advisory and Intermediary Services Act 37 of 2002).
Alternative performance measures
Throughout this presentation a range of financial and non-financial measures are used to assess our performance, including a number of the financial measures that are not defined under IFRS,
which are termed ‘alternative performance measures’ (APMs). Management uses these measures to monitor Anglo American Platinum’s financial performance alongside IFRS measures because they
help illustrate the underlying financial performance and position of the Anglo American Platinum. These APMs should be considered in addition to, and not as a substitute for, or as superior to,
measures of financial performance, financial position or cash flows reported in accordance with IFRS. APMs are not uniformly defined by all companies, including those in Anglo American Platinum’s
industry. Accordingly, it may not be comparable with similarly titled measures and disclosures by other companies.

3
2. Financials Craig Miller
1. Safety and sustainability Chris Griffith
2. PGM market Chris Griffith
3. Next phase of value delivery Chris Griffith
1. Operations Chris Griffith
2019 INTERIM RESULTS AGENDA

4
DELIVERING VALUE…
R6.0bn
zero
Fatalities
R3.0bn
33%
Leading ESG(1) performance Safety performance Robust PGM fundamentals
45%
ROCE(3) increased
1st
Rank by Sustainalytics(2) ZAR basket price up
Net cash position H1 2019 cash dividend
Strong balance sheetIncreasing returns Industry leading returns
of 55 peers in precious metals sector
or R11.00 per share declared
at managed operations per platinum ounce sold

Chris Griffith
SAFETY & SUSTAINABILITY
Mototolo: Mareesburg tailings dam
6
6
2
0
2017 2018 H1 2019
4.52
3.002.83
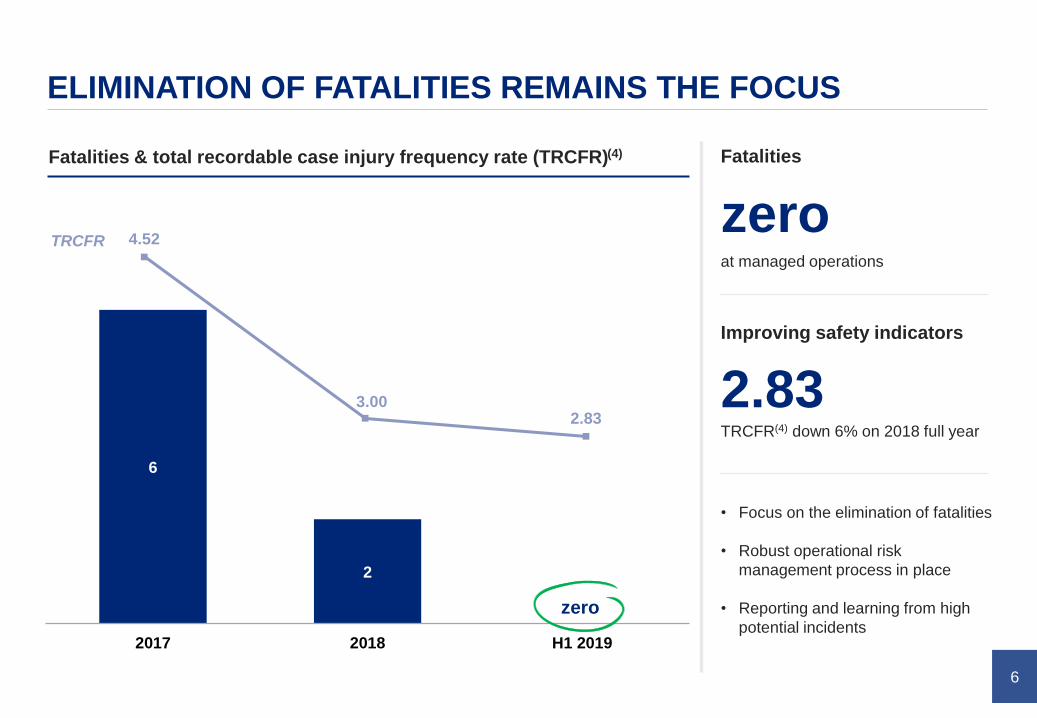
ELIMINATION OF FATALITIES REMAINS THE FOCUS
Fatalities & total recordable case injury frequency rate (TRCFR)(4) Fatalities
zero
• Focus on the elimination of fatalities
• Robust operational risk
management process in place
• Reporting and learning from high
potential incidents
TRCFR
Improving safety indicators
2.83
zero
TRCFR(4) down 6% on 2018 full year
at managed operations
7
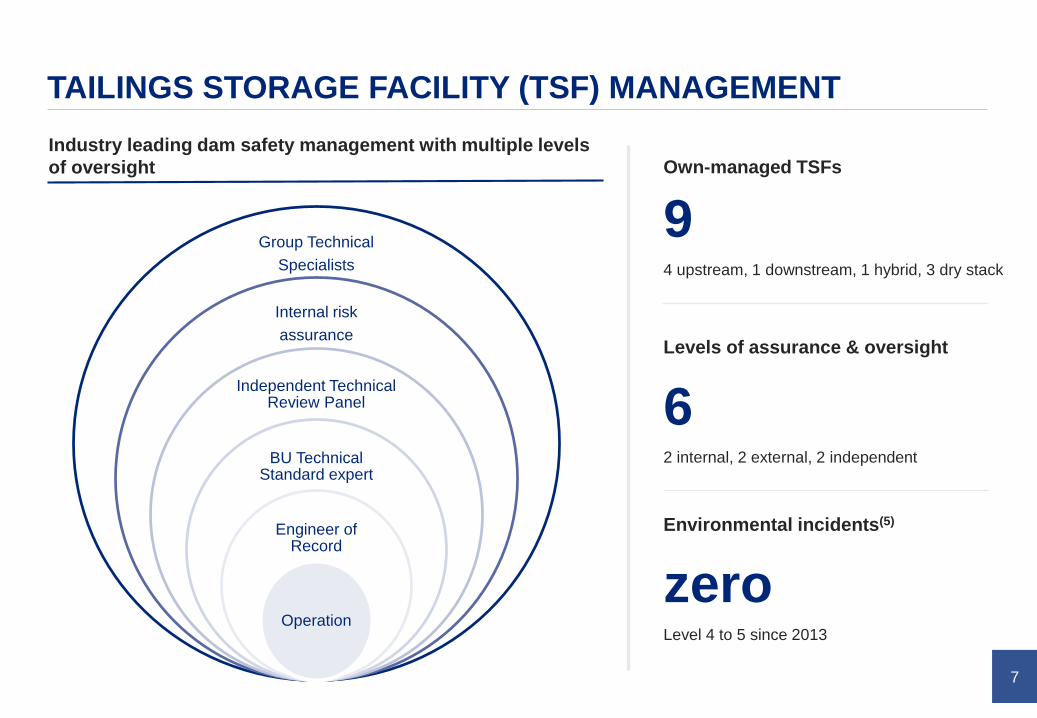
TAILINGS STORAGE FACILITY (TSF) MANAGEMENT
Industry leading dam safety management with multiple levels
of oversight
Group Technical
Specialists
Internal risk
assurance
Independent Technical Review Panel
BU Technical Standard expert
Engineer of Record
Operation
Own-managed TSFs
9
Levels of assurance & oversight
6
4 upstream, 1 downstream, 1 hybrid, 3 dry stack
2 internal, 2 external, 2 independent
Environmental incidents(5)
zeroLevel 4 to 5 since 2013

8
MINING RESPONSIBLY AND SUSTAINABLY
R2.5bn
Carbon & emission reduction pathway (2018 vs 2017) Global ESG recognition(1)(7)
270 hectares
Rustenburg communityTo global best practice
SO2 abatement investment Land transferred(8)
Fuel cell trucks75MW
Mogalakwena Solar PV plant Screening for opportunities
Renewable technology options
11%
GHG(6) emissions down
7%
Total energy down
6%
Energy intensity down
Chris Griffith
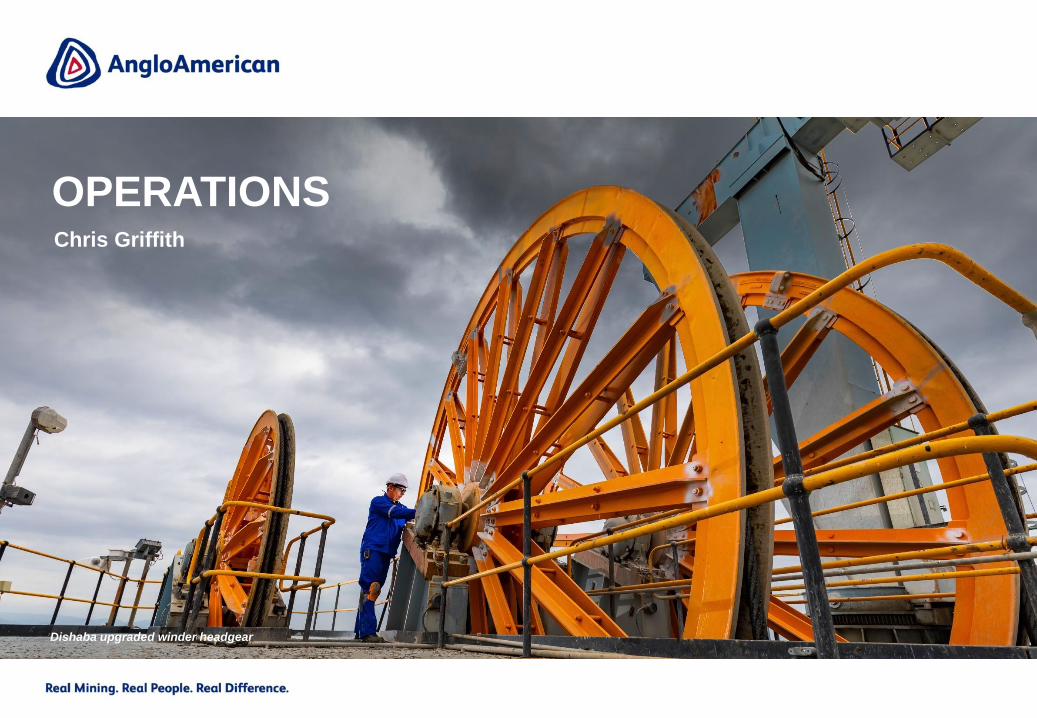
OPERATIONS
Dishaba upgraded winder headgear
10
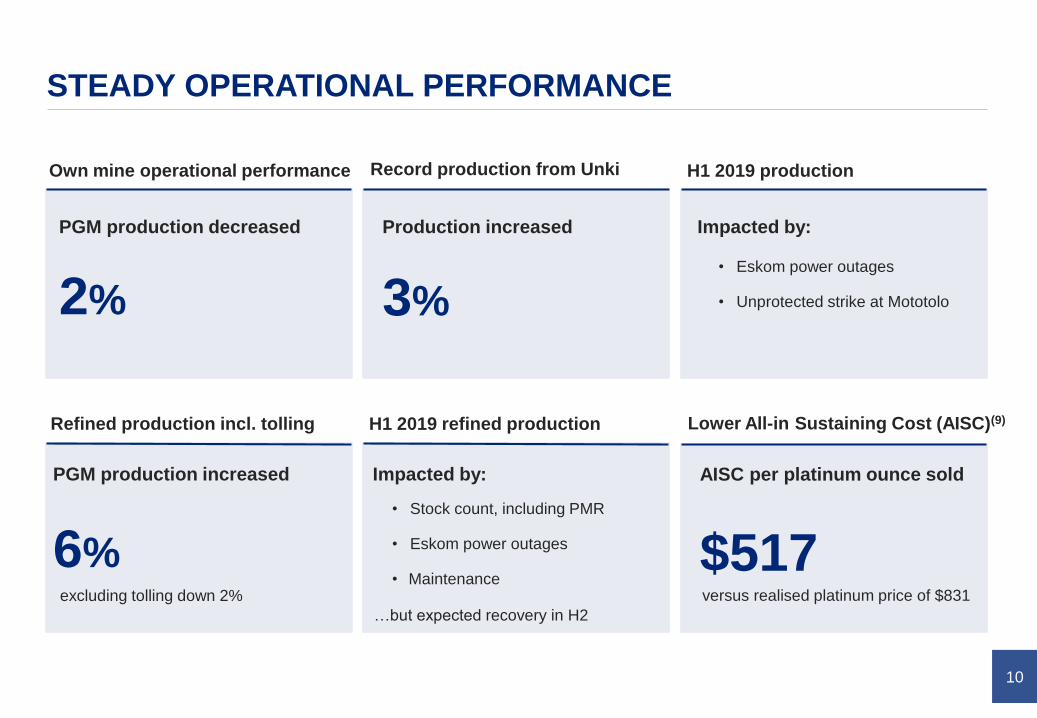
STEADY OPERATIONAL PERFORMANCE
$517
2%
PGM production decreased
Record production from UnkiOwn mine operational performance H1 2019 production
6%
PGM production increased
3%
versus realised platinum price of $831
Production increased Impacted by:
AISC per platinum ounce soldImpacted by:
Lower All-in Sustaining Cost (AISC)(9)Refined production incl. tolling H1 2019 refined production
• Eskom power outages
• Unprotected strike at Mototolo
• Stock count, including PMR
• Eskom power outages
• Maintenanceexcluding tolling down 2%
…but expected recovery in H2
11
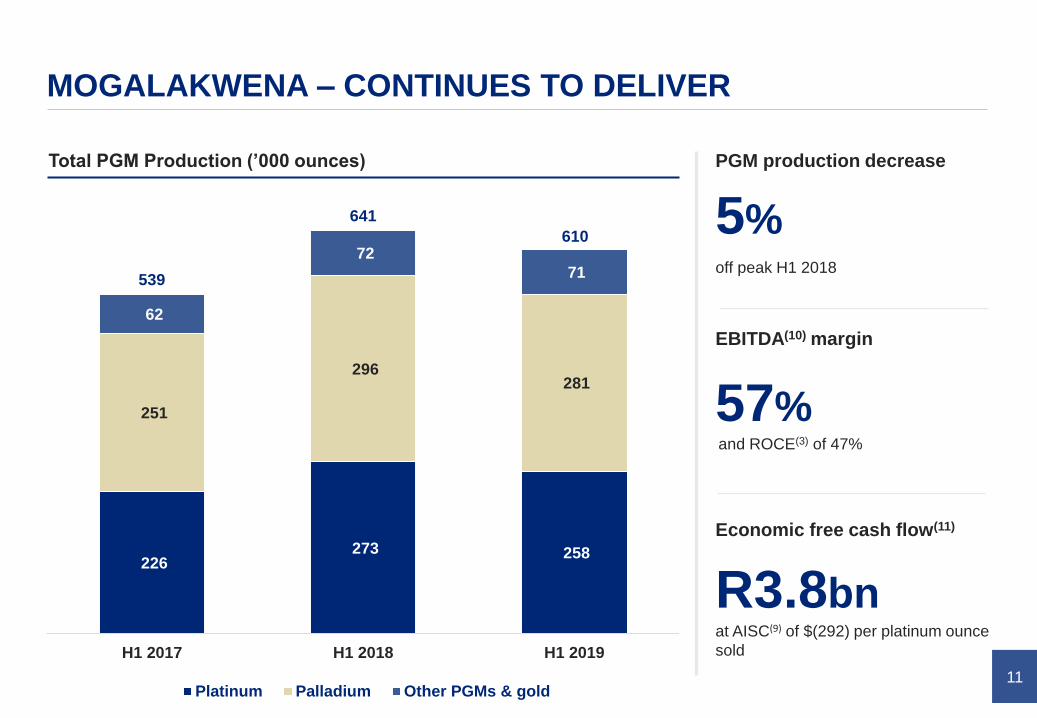
226 273 258
251
296 281
62
72
71
H1 2017 H1 2018 H1 2019
Platinum Palladium Other PGMs & gold
MOGALAKWENA – CONTINUES TO DELIVER
5%
PGM production decrease
57%
EBITDA(10) margin
R3.8bn
Economic free cash flow(11)
at AISC(9) of $(292) per platinum ounce
sold
Total PGM Production (’000 ounces)
539
641
610
off peak H1 2018
and ROCE(3) of 47%

12
AMANDELBULT – STRONGER Q2 PERFORMANCE
3%
PGM production decrease
26%
EBITDA(10) margin
R504m
Economic free cash flow(11)
Total PGM Production (’000 ounces)
204 220 215
94 103 99
100
110 108
H1 2017 H1 2018 H1 2019
Platinum Palladium Other PGMs & gold
398
433422
at AISC(9) of $672 per platinum
ounce sold
and ROCE(3) of 33%
but Q2 up 19% vs Q1

13
AMANDELBULT – TURNAROUND PROGRESSING
Immediately stopeable reserves (IMS)(13)Immediately available ore reserves (IMA)(12)
Chrome recovered from UG2 ore (’000 tonnes)Square metres – monthly average (’000)
ore months available
14.026.3 28.4
30.3
23.7 24.3
Q1 2017 Q1 2019 Q2 2019
ore months available
Dishaba
Tumela
2.7 3.9 5.0
10.46.3
8.7
Q1 2017 Q1 2019 Q2 2019
Dishaba
Tumela
22 20 24
4137
45
Q1 2017 Q1 2019 Q2 2019
126
174
229
Q1 2017 Q1 2019 Q2 2019
Dishaba
Tumela
+23%
23.824.8 26.2 7.3
5.2
6.9
6357
70
+32%
+6% +33%

14
UNKI – RECORD PRODUCTION FROM STRATEGIC ASSET
3%
Total PGM production increase
27%
EBITDA(10) margin
R229m
Economic free cash flow(11)
Total PGM Production (’000 ounces)
38 41 42
33 36
38
14
16 16
H1 2017 H1 2018 H1 2019
Platinum Palladium Other PGMs & gold
85
9396
at AISC(9) of $456 per platinum ounce
sold
+3%
and ROCE(3) of 12%

15
58 6350
3539
30
32
34
27
21
9
H1 2017 H1 2018 H1 2019
Platinum Palladium Other PGMs & gold
MOTOTOLO – PRODUCTION IMPACTED BY UNPROTECTED STRIKE
21%
Total PGM production decrease
40%
EBITDA(10) margin
R443m
Economic free cash flow(11)
Total PGM Production (’000 ounces)
157
at AISC(9) of $237 per platinum ounce sold
125
Bokoniexcluding Bokoni treated material
136
107
Strike
impact
and ROCE(3) of 40%

Universal love by Nicki Böttcher – Winner PlatAfrika 2018
Craig Miller
FINANCIALS

17
STRONG FINANCIALS
45%
Net cash
ROCE(3)
doubled
R12.4bnincrease of 82%
EBITDA(10)
R6.0bnfrom net cash of R2.9bn
Dividend declared
R11.00/share
40% of headline earnings (R3.0bn)
11.99
27.34
0.82
H1 2018
0.81
H1 2019
12.82
28.15
+120%
Headline earnings per share
(R per share)
Underlying
Once-off
accounting
entries

18
DIVERSIFIED PGM PRICES DRIVING EARNINGS
108
EBITDA(10) (R billion) H1 2019 vs. H1 2018
108
3.3
1.4
1.4
3.2
(0.2)
Royalties
(0.2)(0.2)
0.1
(1.5)
Volume
12.8
Ore
stockpile
Price Currency
(1.0)
H1 2018 H1 2019
6.8
3.6
(0.1)
12.4
(0.7)
CPI Costs
Rh
Pt
Pd
Minor PGMs
Stock count
gain
Sales volume

19
INCREASING EBITDA MARGINS
H1 2018 H1 2019
16%
38%
43%
POC/Toll JV mined share Own mines
11%
28%
33%
JV mined sharePOC Own mines
21% 32%
21%
32%
11%
28%
33%
16%
38%
43%
20
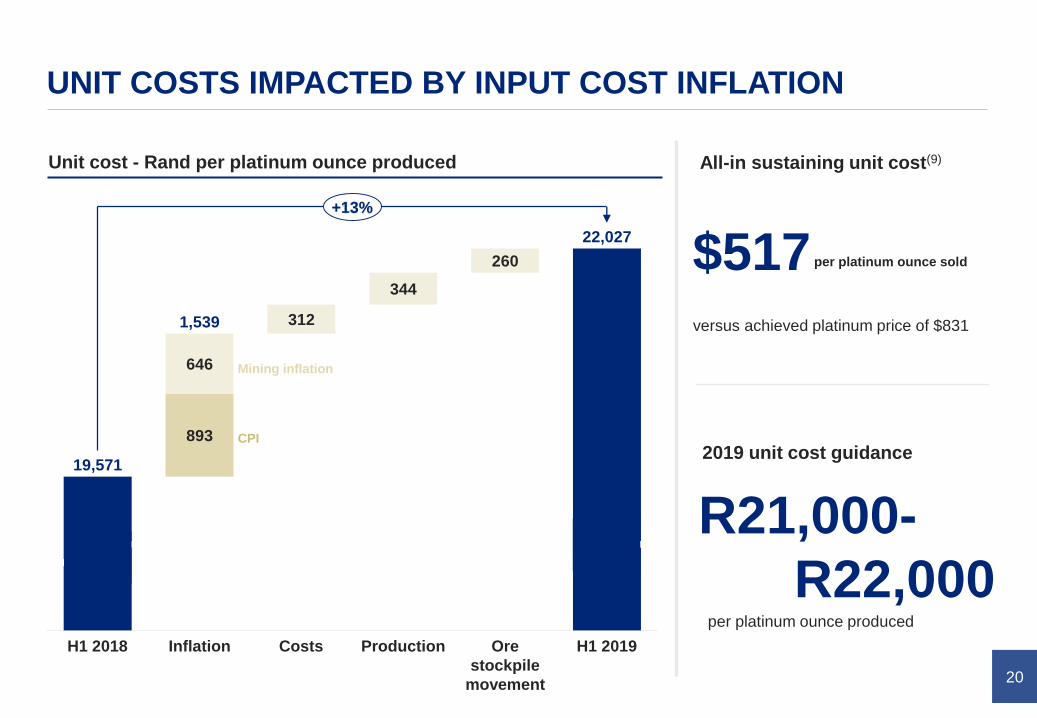
UNIT COSTS IMPACTED BY INPUT COST INFLATION
Unit cost - Rand per platinum ounce produced All-in sustaining unit cost(9)
$517versus achieved platinum price of $831
893
312
344
260
646
H1 2018 Ore
stockpile
movement
19,571
CostsInflation Production H1 2019
1,539
22,027
+13%
per platinum ounce sold
2019 unit cost guidance
R21,000-
R22,000per platinum ounce produced
CPI
Mining inflation
21
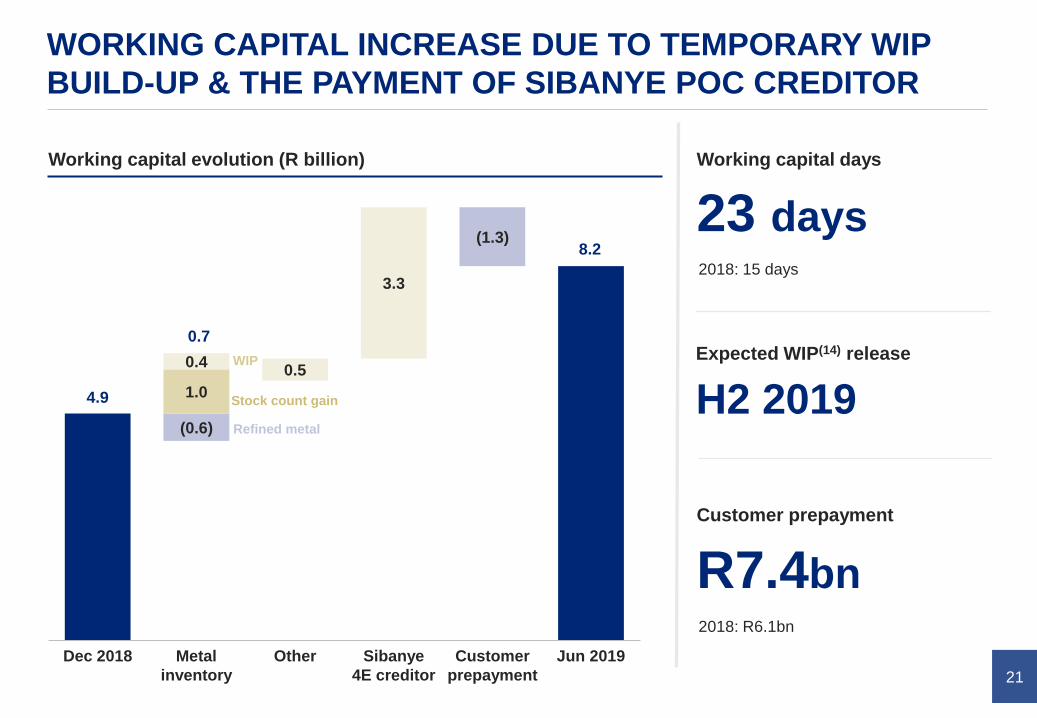
4.9
8.2
0.5
3.3
1.0
0.4
Sibanye
4E creditor
Dec 2018
(0.6)
OtherMetal
inventory
(1.3)
Jun 2019Customer
prepayment
0.7
R7.4bn
WORKING CAPITAL INCREASE DUE TO TEMPORARY WIP
BUILD-UP & THE PAYMENT OF SIBANYE POC CREDITOR
Working capital evolution (R billion) Working capital days
23 days2018: 15 days
Customer prepayment
2018: R6.1bn
Refined metal
WIP
Stock count gain H2 2019
Expected WIP(14) release
4.9
0.7
8.2

22
focused on SO2 abatement & Mogalakwena
Heavy Mining Equipment
Capital expenditure (R billion)
CONTINUED DISCIPLINED SPEND ON CAPEX
R1.7bn
R1.1bn1.3 1.3
0.4 0.3
0.4
0.8
5.7 – 6.3
0.1
H1 2018 2019 guidanceH1 2019
2.11.8
2019 guidance R2.0bn – R2.2bn
Sustaining capital expenditure (SIB)
Capitalised waste stripping
R0.3bnon low capex, fast payback projects
Project capital
ProjectsSIB SO₂ Abatement Project
SO₂Abatement
4.9 – 5.5

23
STRONG CASH FLOW LEADING TO STRONG BALANCE
SHEET
0.5
2.9
6.0
2018H1 2018 H1 2019
Net cash (R billion)
R3.1bn improvement
1.9
4.31.1
1.3
(0.9)
(2.0)
(0.6)
0.2
3.1
H1 2019H1 2018
0.1
2.3
R4.3bn
Stronger free cash flow(15) from operations (R billion)
Free cash flow IFRS16 Leases
Customer prepayment increase
Investments and proceeds
Dividend
126% up from H1 2018
0.5
2.9
6.0
24
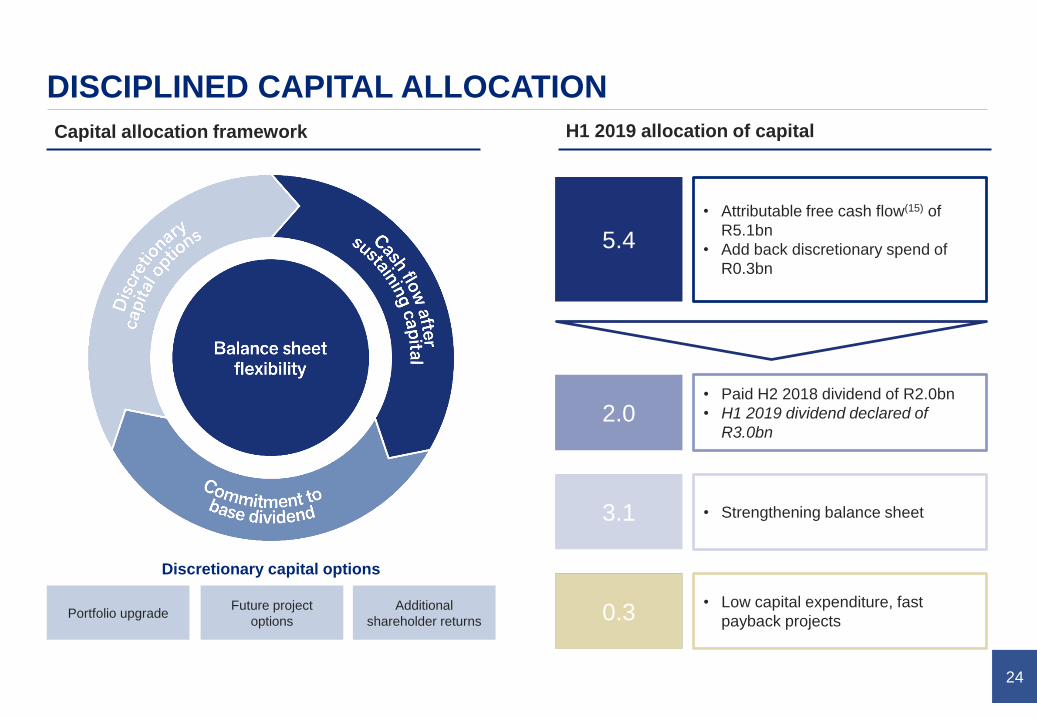
DISCIPLINED CAPITAL ALLOCATION
5.4
2.0
0.2
• Attributable free cash flow(15) of
R5.1bn
• Add back discretionary spend of
R0.3bn
• Paid H2 2018 dividend of R2.0bn
• H1 2019 dividend declared of
R3.0bn
• Low capital expenditure, fast
payback projects
• Strengthening balance sheet
0.3
3.1
Capital allocation framework H1 2019 allocation of capital
Discretionary capital options
Portfolio upgradeFuture project
options
Additional
shareholder returns

Chris Griffith
PGM MARKET
Fuel cell vehicle

26
STRONGER BASKET PRICE, SUPPORTED BY PALLADIUM
AND RHODIUM
Indexed achieved price (2 Jan 2018 = 100)
16%
USD basket price increase
33%
Rand basket price increase
15%
Rand/Dollar decrease
from 12.38 to 14.26 ZAR/USD
per platinum ounce sold, vs H1 2018
per platinum ounce sold, vs H1 2018
75
100
125
150
175
200
225
Jan 2018 Jul 2018 Jan 2019
Pt Pd Rh USD basket ZAR basket
Jun 2018 Jun 2019

27
OVERALL OUTLOOK FOR 3E DEMAND POSITIVE
Platinum (net demand)(16)
Medium-term demand outlook
improvingMedium-term demand outlook
positiveMedium-term demand outlook
positive
• Strong investment demand
• Industrial demand firm
• Automotive demand steady on
tightening emissions legislation
• Jewellery demand weaker
• Automotive consumption very strong
• Industrial demand softer as high
prices lead to thrifting
• Automotive purchasing growing
• Industrial demand strong
Palladium (net demand)(16) Rhodium (net demand)(16)
Autocat26%
Industrial 36%
Jewellery 24%
Investment 14%
Autocat79%
Industrial 21%
Autocat78%
Industrial 22%
Chris Griffith
Bulk ore sorter
NEXT PHASE OF VALUE DELIVERY

29
OUR DIFFERENTIATED VALUE PROPOSITION
Quality assets and
operational excellenceLong term sustainability
Capital discipline and
shareholder returns
Long-life mineral resource
~70% production in H1
of the cost curve
Only open-pit PGM mine
of scale in the world
Optimising assets and
extracting full value – P101
Strict cost control
Strong balance sheet
and cashflow
Disciplined capital allocation
Sustainable cash dividend
Invest in people and
communities
Project studies on value-add
growth optionality
Grow demand for PGMs
Modernising mining through
innovation and
FutureSmartTM technology

30
PROGRESSING STRATEGY TO UNLOCK FURTHER VALUE
P101 & FutureSmartTM
• Achieve and beat world best practice - P101
• FutureSmartTM technology and innovation
• Digitalisation and modernisation
Project studies underway
Fast Payback Projects
• Mogalakwena expansion options
• Mototolo / Der Brochen life extension or expansion
• Chrome expansions (Amandelbult & Modikwa)
• Modernisation (15E Amandelbult)
• Concentrator Debottlenecking (all operations)
• Copper Leach Circuit (Base Metals Refinery)
Market Development
• Investing in Green Economy
• Mirai Creation Fund II invests in AP Ventures
• Launch of Lion Battery Technologies Inc.
• Investing in new products
• PGI(17) launches into new target markets
• WPIC(18) – 3 new strategic partnerships

31
P101 & FUTURESMARTTM TECHNOLOGY ADVANCING
Mining
Bulk Sorting
Evaluation progressing at
Mogalakwena
Processing
Shock-break
Evaluation unit installed at
Baobab Concentrator
Shovel Performance
In progress at Mogalakwena Modernisation
Development of section
underway at Amandelbult
Coarse Particle Rejection
Trials planned for 2020
Fine Particle Recovery
Concept study in progressFine Chrome Recovery
Project in prefeasibility stage
Copper Circuit
Debottlenecking
Project in execution phase

32
CONTINUOUS FOCUS ON THE NEXT PHASE OF VALUE
5-8 percentage points
Margin uplift
3-5 years
Time to implement
Driven by
Driving an uplift in EBITDA(10) margin (excluding expansion projects)
• Fast payback, value enhancing
project delivery
• Operational efficiency to beat best in
class (P101)
• FutureSmart™ technology and
innovation 2012 2018 2023
11%
20%
+5-8pp
25%-28%

Amandelbult Chrome Plant
Chris Griffith
GUIDANCE & CONCLUSION

34
2019 GUIDANCE MAINTAINED – STRONGER H2 EXPECTED
Refined production (million ounces)Production M&C (million ounces) Sales volumes (million ounces)
Unit costCapital expenditure Potential headwinds
PGMs 4.2 – 4.5Pt: 2.0 – 2.1
Pd: 1.3 – 1.4
Other: 0.9 – 1.0
PGMs 4.6 – 4.9Pt: 2.2 – 2.3
Pd: 1.4 – 1.5
Other: 1.0 – 1.1
PGMs 4.6 – 4.9Pt: 2.2 – 2.3
Pd: 1.4 – 1.5
Other: 1.0 – 1.1
Excluding toll production
R5.7 - 6.3bn
Capitalised waste stripping: R2.0 -2.2 billion
R21,000 -
R22,000
Wage negotiations
& Eskom
Excluding toll productionExcluding toll production
per platinum ounce produced

35
TO CONCLUDE…
Zero fatalities and safe production
ESG performance improving and receiving global recognition
Steady production – higher H2 performance expected
Increased returns to shareholders
Continuous focus on the next phase of value delivery
✓
✓
✓
✓
✓
Strong financial position
✓
✓Robust fundamentals leading to strong PGM basket

Mogalakwena North Concentrator - Rougher cells section
Q&A

Mototolo mine
APPENDIX

38
Operation
Net Cash
December
2018
Cash from
operations
SIB and
waste capital
100%
Operating
free cashflow
Economic
interest
adjustment(17)
Economic
free
cashflow (11)
Project
capital
Cash tax and
net interest
paid
Free cash
flow
Investment
in
associates,
funding &
other(18)
Customer
prepayment
Net proceeds
on asset sales
IFRS 16
Lease/OtherDividend
Net cash Jun
2019
Mogalakwena 5,798 (1,991) 3,807 - 3,807 (19) 3,788
Amandelbult 841 (274) 567 (63) 504 (193) 374
Unki 332 (103) 229 - 229 (18) 210
Mototolo 598 (155) 443 - 443 - 443 (108)
Joint Ventures 1,486 (173) 1,312 - 1,312 (23) 1,289
3rd Parties (550) (189) (740) - (740) (231) (970)
Bokoni C&M - - - (34) (34) - - (77)
Twickenham C&M (61) - (61) - (61) - (61)
NMT & Infrastructure (138) (0) (138) - (138) - (138)
Other(19) 510 60 570 570 231 (1,428) (628) (47) 1,285 336 (604) (1,996)
2,890 8,816 (2,826) 5,990 (98) 5,892 (254) (1,428) 4,308 (124) 1,285 228 (604) (1,996) 5,986
NET CASH FLOW BY MINE
2.9
7.2
6.08.8 1.3
(0.1)
(2.8)
(0.3)(1.4)
0.2 (0.6)
(2.0)
R4.3bn

39
COST BREAKDOWN
Non ZAR – 10% of total costs
• 100% at Unki
• Circa 25% at Mogalakwena
Diesel - 3% of total costs
Costs reflective of Anglo American Platinum own mined and joint venture share of production and costs at operations. Excludes all purchase of concentrate
costs and volume, overhead and marketing expenses
H1 2019 Cost base (Rbn) Volume % PGM volume (koz) Labour Contractors Materials Utilities Sundries
Opencast Mining 2.6 43% 629 16% 11% 42% 2% 30%
Conventional Mining 4.4 31% 450 54% 4% 19% 7% 16%
Mechanised Mining 2.9 26% 375 42% 8% 33% 5% 12%
Concentrating 2.9 15% 0% 39% 19% 27%
Processing 3.7 25% 1% 24% 27% 22%
Total 16.7 100% 1,454 32% 4% 30% 12% 21%
H1 2018 Cost base (Rbn) Volume % PGM volume (koz) Labour Contractors Materials Utilities Sundries
Opencast Mining 2.3 43% 641 17% 6% 44% 2% 31%
Conventional Mining 4.4 34% 511 55% 7% 18% 7% 14%
Mechanised Mining 2.3 23% 341 41% 11% 29% 6% 13%
Concentrating 2.8 14% 0% 39% 20% 27%
Processing 3.3 24% 1% 27% 27% 21%
Total 15.0 100% 1,493 33% 5% 30% 12% 20%

40
PLATINUM DEMAND BALANCED ACROSS 3 KEY DEMAND
SEGMENTS
Pt
Forecast net demand 2019 (000 ounces)(16)
10%
Net platinum demand increase
10%
Net palladium demand increase
8.1%
Net rhodium demand increase
year-on-year
year-on-year
year-on-year
Pd
Autocat26%
Industrial 36%
Jewellery 24%
Investment 14%
Autocat79%
Industrial 21%

41
Chemical 35%
Dental25%
Electrical 25%
Other15%
INDUSTRIAL DEMAND REMAINS STRONG
Pt Pd
Forecast net demand 2019 (000 ounces)(19)
healthy
Platinum outlook
neutral
Palladium outlook
positive
Rhodium outlook
following 14% growth in 2018
Chemical25%
Glass15%
Electrical8%Petroleum &
gas-to-liquid10%
Fuel cells2%
Other40%

42
JEWELLERY: 2019 FORECAST MIXED
Forecast net demand 2019 (000 ounces)(20)
short term
negative
China still challenging
strong
positive
Strong growth from India
neutral
Europe, Japan, North America
China48%
North America15%
Europe12%
India12%
Japan8%
ROW5%

43
PLATINUM DEMAND FROM AUTOMOTIVE SECTOR RESILIENT
0.1%
Total platinum demand decrease
strong positive
substitution
Increase in palladium and
rhodium prices could lead to
of platinum into gasoline autocatalysts
Forecast platinum auto demand(22)
CAGR over 2019-2025, excluding
impact of substitution
due to tighter emissions regulation
and increased demand
Platinum auto demand split(21)
Heavy duty diesel outlook
Europe Light Duty Diesel
43%
RoW Light Duty Diesel30%
Global Light Duty Gasoline
8%
Global Heavy Duty Diesel
19%
2018 2025
Gasoline pt:pd Substitution at 10%
Global Light Duty Gasoline
Global Heavy Duty Diesel
RoW Light Duty Diesel
Europe Light Duty Diesel
c.3 Moz
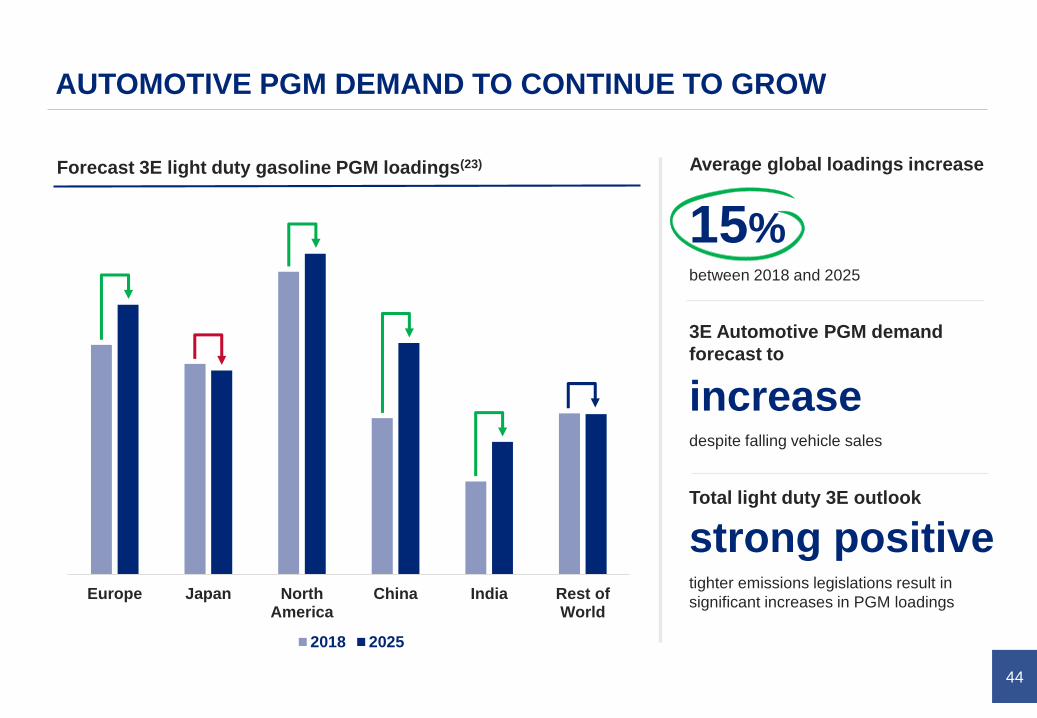
44
Europe Japan NorthAmerica
China India Rest ofWorld
2018 2025
AUTOMOTIVE PGM DEMAND TO CONTINUE TO GROW
Forecast 3E light duty gasoline PGM loadings(23)
15%
Average global loadings increase
3E Automotive PGM demand
forecast to
strong positive
between 2018 and 2025
despite falling vehicle sales
tighter emissions legislations result in
significant increases in PGM loadings
Total light duty 3E outlook
increase
45
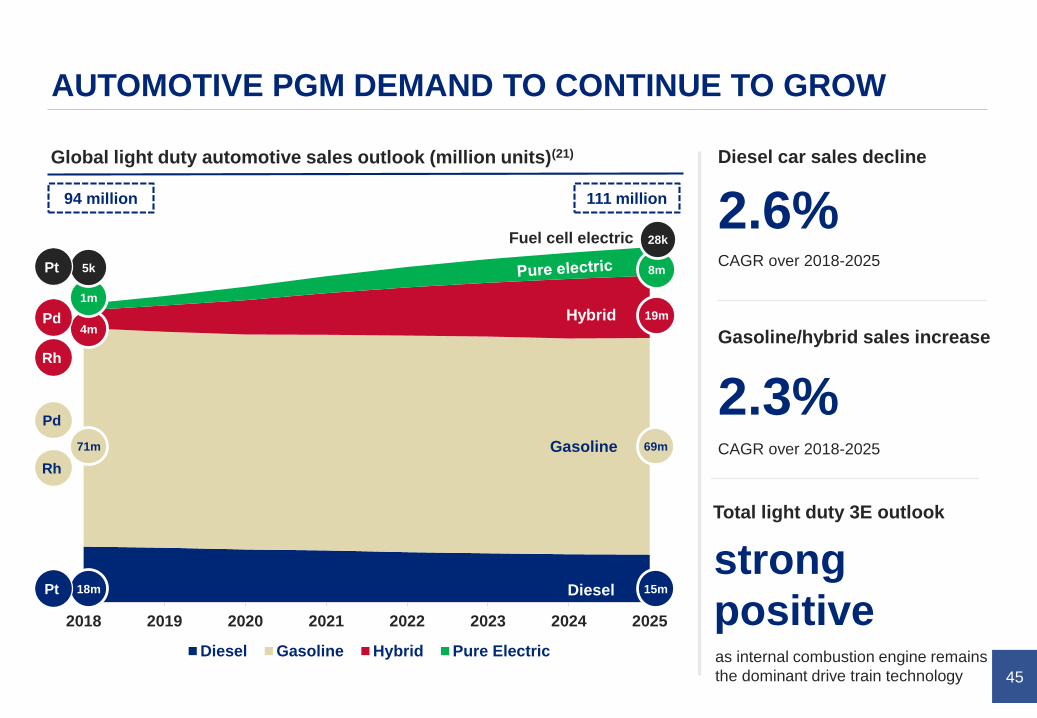
2018 2019 2020 2021 2022 2023 2024 2025
Diesel Gasoline Hybrid Pure Electric
AUTOMOTIVE PGM DEMAND TO CONTINUE TO GROW
18m DieselPt
Global light duty automotive sales outlook (million units)(21)
15m
Pd
Rh
71m 69m
4mPd
Rh
2.6%
Diesel car sales decline
2.3%
Gasoline/hybrid sales increase
strong
positive
94 million 111 million
CAGR over 2018-2025
CAGR over 2018-2025
as internal combustion engine remains
the dominant drive train technology
Hybrid
Total light duty 3E outlook
1m
5kPt
Fuel cell electric
Gasoline
19m
8m
28k

46
FUEL CELL DEVELOPMENT ACCELERATING
OEMs
continue
investing
• Hyundai Motor to invest €64m & Kia Motors to invest €16m in collaboration on high-
performance EV and FCEV prototypes by 2020
• Audi to invest additional resources in hydrogen fuel-cell development to meet future
zero-emission transportation needs, with a focus on the China
• Toyota to work with Chinese company Re-Fire Technology to deliver key fuel cell
technology to China’s FAW and Higer buses, as well as BAIC to provide fuel cell equipment
and hydrogen tanks for use in buses
Supply chain
scaling
• Engine manufacturer, Cummins purchases fuel cell manufacturer, Hydrogenics
Corporation for $290m
• Bosch to cooperate with stack manufacturer, Powercell, in large-scale production of fuel
cells for trucks and cars
• The Plastic Omnium Group opened two new hydrogen storage R&D centers to focus on
emissions control and fuel systems, including high-pressure hydrogen tanks and fuel cells
Governments
increasing
support
• During the G20 summit in Japan, representatives from Japan, Europe & US signed a joint
statement of future cooperation on hydrogen and fuel cell technologies
• UK commits to bring all greenhouse gas emissions to net zero by 2050, widening the
opportunity for adoption of fuel cells powered by clean hydrogen across a number of
applications
• Australian federal government promised A$1bn in funding for their Hydrogen Strategy to
fund research and commercial development in their hydrogen sector
• China to push ahead with the development of their hydrogen energy and fuel cell vehicle
industry, as part of wider efforts to promote green energy in the world’s largest auto market
Significant
orders placed &
opportunities
growing
• German Transport Authority, RMV, has ordered the world's largest fleet of passenger fuel
cell trains from Alstom, offering an new way to decarbonise their transport system
• UK commits to eliminate all diesel-only trains from the nation’s transport network by
2040 to reduce carbon emissions, creating a opportunity for the use of hydrogen passenger
trains

47
NET INVESTMENT CONTINUES
Net platinum investment demand(’000 ounces)(24)
~750koz
Total platinum investment
140koz
Total palladium disinvestment
positivePlatinum growth outlook
due to market development
in H1 2019
in H1 2019
198
5
198
7
198
9
199
1
199
3
199
5
199
7
199
9
200
1
200
3
200
5
200
7
200
9
201
1
201
3
201
5
201
7
201
9 (
f)2
01
9F

48
OVERALL OUTLOOK FOR 3E PGM DEMAND POSITIVE
Platinum
Palladium &
Rhodium
Other PGMs
Substitution
into gasoline
autocatalyst
Growth in
heavy duty &
stricter
emissions
Industrial
applications
growing
Jewellery
growth in India
Hydrogen
economy
Electrification
through fuel
cell vehicles
Jewellery
growth in
China
Global
economic
growth
Stricter
emissions
legislation
Light duty
vehicle growth
in gasoline &
hybrid
Expanding
demand for
transport
Decarbonisation
through hybrid
vehicles
Industrial
demand
growing
Clean
chemistry
New
applications
Global
economic
growth
Short to medium term… …longer term
49
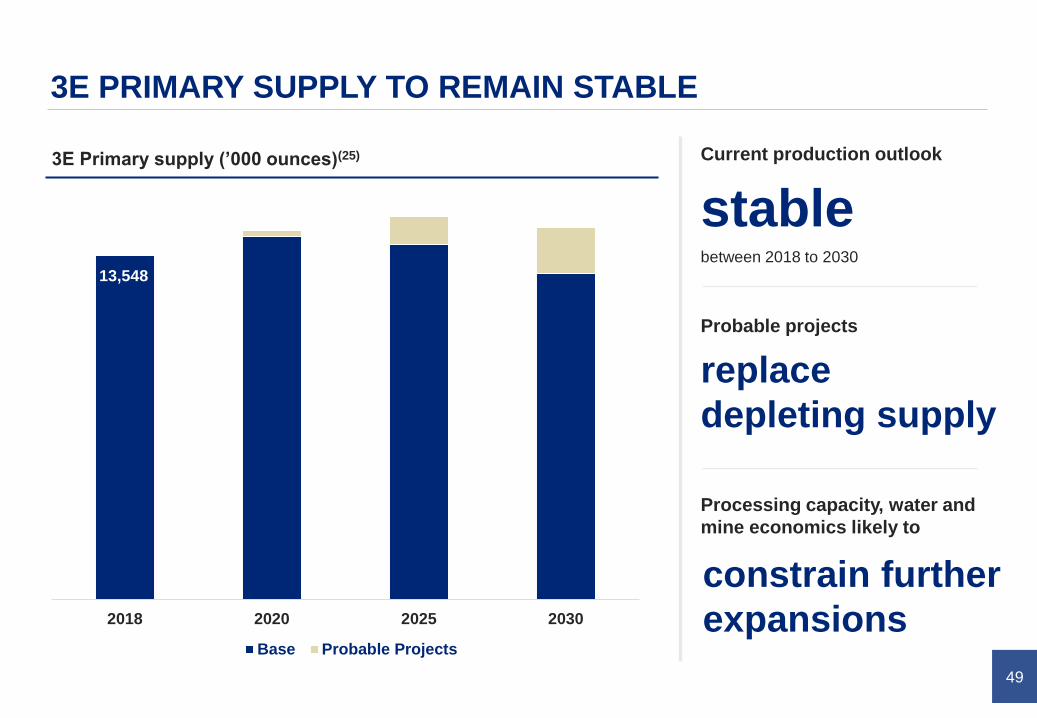
3E PRIMARY SUPPLY TO REMAIN STABLE
3E Primary supply (’000 ounces)(25)
stable
Current production outlook
replace
depleting supply
Probable projects
constrain further
expansions
Processing capacity, water and
mine economics likely to
between 2018 to 2030
1354814268 13978
12818
2018 2020 2025 2030
Base Probable Projects
13,548

50
ALL-IN SUSTAINING COST (AISC)
Mogalakwena Amandelbult Unki MototoloJoint ventures
(AAP share)
Company
(ex-trading)(26)
US$ Costs (million)
Cash operating costs 322 380 77 79 161 1,769
Other costs and marketing 54 49 28 9 14 176
Capitalised waste costs 80 - - - - 80
Sustaining capital 59 19 7 11 10 126
a Total Cost 516 448 112 98 185 2,152
Total revenue excluding platinum revenue
PGMs excluding platinum 488 271 76 83 170 1,463
Base metals , chrome and other 96 46 18 3 4 167
b Total revenue ex. platinum 584 317 94 87 174 1,630
c = a - b All-in sustaining costs (68) 131 18 12 11 522
d Platinum ounces sold (000) 231.3 194.4 39.7 50.3 95.9 1,009.4
e = c ÷ d * 1,000 AISC per platinum ounce sold (292) 672 456 237 116 517

51
RAND BASKET PRICE
Mogalakwena Amandelbult Unki Mototolo JVs (AAP share) Other(27) Company
(ex-trading)(28)
Net sales revenue ($ million)
from platinum 192.7 161.7 33.0 41.8 79.8 330.5 839.6
from palladium 400.5 142.4 55.8 49.5 100.1 324.7 1,073.0
from rhodium 48.5 102.2 11.9 26.2 55.2 179.4 423.3
base metals & other 134.2 76.7 26.3 10.7 18.9 108.0 374.7
a Total revenue 775.9 483.0 126.9 128.3 254.0 942.6 2,710.7
Sales volume (000 ounces)
b platinum ounces sold 231.3 194.4 39.7 50.3 95.9 397.9 1,009.4
other PGMs sold 339.8 182.1 52.5 58.0 116.1 402.1 1,150.6
c Total PGMs sold 571.1 376.4 92.1 108.2 212.0 800.0 2,160.0
d = a ÷ b * 1,000 US$ basket per platinum ounce 3,354 2,485 3,200 2,552 2,648 2,369 2,685
e = a ÷ c * 1,000 US$ basket per PGM ounce 1,358 1,283 1,377 1,185 1,198 1,178 1,255
f US Dollar / ZAR exchange rate 14.26 14.26 14.26 14.26 14.26 14.26 14.26
g = d x f Rand basket per platinum ounce 47,841 35,450 45,646 36,403 37,770 33,793 38,305
h = e x f Rand basket per PGM ounce 19,376 18,303 19,646 16,907 17,089 16,806 17,901

52
FOOT NOTES
(1) ESG stands for environmental, social and governance
(2) Sustainalytics is a global leader in ESG and Corporate Governance research and ratings. Over the last 25 years, they have brought together leading ESG research
and client servicing professionals. Today, Sustainalytics supports hundreds of the world’s foremost investors who incorporate ESG and corporate governance
insights into their investment processes.
(3) ROCE stands for return on capital employed
(4) Total recordable case injury frequency rate (TRCFR) is a measure of the rate of all injuries requiring treatment above first aid per 1,000,000 hours worked
(5) Level 4-5 environmental incidents are defined as high or major impact to the receiving environment, and have high or major sensitivity to the impact. Anglo American
has redefined its environmental incidents scale with levels 4 and 5 incidents now classified as high and major significant incidents (previously defined as level 3 to 5)
(6) GHG stands for Green House Gas
(7) Global recognition includes highest rating scores achieved on environmental and social aspects from ISS-Oekom, included in the FTSE4Good Index since June
2015; first place ranking by Sustainalytics on ESG in the precious metals sector globally; best Emerging Market performer as rated by Vigeo Eiris; and included in the
FTSE/JSE Responsible Investment Index
(8) Donated 270 hectares of land to the Rustenburg community in a land handover in March 2019, with the support of the Government of South Africa.
(9) AISC stands for all-in sustaining costs: defined as cash operating costs, overhead costs, other income and expenses, all sustaining capital expenditure, capitalised
waste stripping and allocated marketing and market development costs net of revenue from all metals other than platinum
(10) EBITDA stands for earnings before interest, tax, depreciation and amortisation
(11) Economic free cash flow represents AAPs economic share of operating free cash flow after adjusting for minority interests for subsidiaries/ joint ventures and
includes associate’s share of profit or loss
(12) Immediately available ore reserves (IMA) is ground available for mining without any further development.
(13) Immediately stopeable reserves (IMA) is fully equipped and spare mining faces that can be mined immediately.
(14) WIP stands for work-in-progress
(15) Free cash flow is defined as cash flow from operations, less capital, less project capital, less cash tax and net interest paid
(16) Source: Johnson Matthey
(17) Economic interest adjustment is an an adjustment to exclude minority share of operating free cash flow for subsidiaries/ joint ventures and include associate’s share
of profit or loss
(18) Funding from associates and other: BRPM funding will not be recurring from completion of sale of interest in BRPM.
(19) Other: includes market and market development costs, restructuring, working capital movements not allocated to each individual asset
(20) Source: Johnson Matthey, Platinum Guild International
(21) Source: LMC Automotive
(22) Source: Johnson Matthey, LMC Automotive, Company analysis
(23) Source: Johnson Matthey, Company analysis
(24) Source: Johnson Matthey, Bloomberg, Company analysis
(25) Source: Johnson Matthey, SNL, Company analysis
(26) Company includes other assets, i.e. purchase of concentrate and tolling
(27) Other includes purchase of concentrate but excludes tolling
(28) Company excludes tolling