Embed Size (px)
Citation preview

ANGULAR POSITION Sponsored by Disney
AMBER HALEY – ELECTRICAL ENGINEERING
JENNA SOTO – ELECTRICAL ENGINEERING
BENJAMIN WILLIAMSON – COMPUTER & ELECTRICAL ENGINEERING
SENIOR DESIGN 1
GROUP 14
SPRING 2018
4/23/2018
i
Table of Contents
1.0 Executive Summary __________________________________________________ 1
2.0 Project Background __________________________________________________ 1
2.1 Motivation ______________________________________________________________ 2
2.2 Objectives ______________________________________________________________ 2
2.3 Requirements Specifications _______________________________________________ 2
3.0 Research ___________________________________________________________ 2
3.1 Existing Similar Projects and Products ______________________________________ 3 3.1.1 Safety Monitoring Device and System _____________________________________________ 3 3.1.2 BreathaLock _________________________________________________________________ 3
3.2 Sensor Options __________________________________________________________ 3 3.2.1 Encoder _____________________________________________________________________ 4
3.2.1.1 Measurement Type _________________________________________________________ 4 3.2.1.2 Styles ___________________________________________________________________ 4 3.2.1.3 Technologies _____________________________________________________________ 4 3.2.1.4 Mounting Types ___________________________________________________________ 5 3.2.1.5 Turn Types _______________________________________________________________ 6 3.2.1.6 Additional Information ______________________________________________________ 6
3.2.2 Linear Variable Differential Transformer ___________________________________________ 6 3.2.3 Programmable Angle Sensor IC __________________________________________________ 7 3.2.3 Contactless Sensor _____________________________________________________________ 7 3.2.4 Sensor Conclusion _____________________________________________________________ 7
3.3 Wireless technology ______________________________________________________ 8 3.3.1 Wireless Options _____________________________________________________________ 10 3.3.2 Z-Wave Specifications ________________________________________________________ 12 3.3.3 Wireless Diagram ____________________________________________________________ 14
3.4 PLC Characteristics _____________________________________________________ 15 3.4.1 CPU _______________________________________________________________________ 15 3.4.2 Power Supply _______________________________________________________________ 15 3.4.3 I/O Modules _________________________________________________________________ 16
3.4.3.1 Sinking and Sourcing ______________________________________________________ 16 3.4.3.2 Types __________________________________________________________________ 16
3.4.4 PLC Types __________________________________________________________________ 17 3.4.4.1 Fixed PLC_______________________________________________________________ 17 3.4.4.2 Modular PLC ____________________________________________________________ 17
3.4.5 PLC Sizes __________________________________________________________________ 18 3.4.6 PLC Manufacturers ___________________________________________________________ 18 3.4.7 PLC Conclusion _____________________________________________________________ 18
3.5 Battery types ___________________________________________________________ 19 3.5.1 NiMH/ NiCd ________________________________________________________________ 19 3.5.2 Lead Acid __________________________________________________________________ 20 3.5.3 Li-Ion/ Polymer ______________________________________________________________ 21 3.5.4 Alkaline ____________________________________________________________________ 22 3.5.5 Battery Conclusion ___________________________________________________________ 23 3.5.6 Environmental Safety _________________________________________________________ 25
3.6 Battery Management System _____________________________________________ 26
3.7 Voltage Regulator _______________________________________________________ 26

ii
3.8 Microcontroller _________________________________________________________ 26 3.8.1 MSP430G2 _________________________________________________________________ 27 3.8.2 Arduino Mega _______________________________________________________________ 27 3.8.3 Arduino Uno ________________________________________________________________ 27 3.8.4 Raspberry Pi ________________________________________________________________ 28 3.8.5 Peripherals __________________________________________________________________ 28
3.9 IDE Comparison ________________________________________________________ 28 3.9.1 CodeBlocks _________________________________________________________________ 28 3.9.2 Eclipse _____________________________________________________________________ 29 3.9.3 Qt Creator IDE ______________________________________________________________ 29
3.10 Programming Language Comparison _____________________________________ 29 3.10.1 Java ______________________________________________________________________ 30 3.10.2 C/ C++ ____________________________________________________________________ 30 3.10.3 Python ____________________________________________________________________ 30
3.11 Zero Button ___________________________________________________________ 30
3.12 Robust Design _________________________________________________________ 30 3.12.1 Waterproof Enclosure ________________________________________________________ 31 3.12.2 Dehumidifier _______________________________________________________________ 33
3.12.2.1 Silica Packets ___________________________________________________________ 33 3.12.2.2 Filters _________________________________________________________________ 34
3.13 PCB Design ___________________________________________________________ 34 3.13.1 Programs __________________________________________________________________ 34 3.13.2 Board Manufacturers _________________________________________________________ 35
4.0 Related Standards __________________________________________________ 35
5.0 Project Hardware and Software Design Details ___________________________ 35
5.1 Concepts A and B Presented to Disney _____________________________________ 36 5.1.1 General Concept A ___________________________________________________________ 36 5.1.2 General Concept B ___________________________________________________________ 38 5.1.3 Concept Chosen Conclusion ____________________________________________________ 40
5.2 Component Selection ____________________________________________________ 41 5.2.1 Battery _____________________________________________________________________ 41 5.2.2 Voltage Regulator ____________________________________________________________ 43 5.2.3 Balance Charger _____________________________________________________________ 44 5.2.4 Battery Monitor ______________________________________________________________ 45 5.2.5 Encoder ____________________________________________________________________ 45 5.2.6 Encoder Coupling ____________________________________________________________ 46 5.2.7 Microcontroller ______________________________________________________________ 46 5.2.8 Z-Wave Module _____________________________________________________________ 47 5.2.9 Push Button _________________________________________________________________ 48 5.2.10 PLC ______________________________________________________________________ 48 5.2.11 Weatherproof Enclosure ______________________________________________________ 49 5.2.12 Silica Packets _______________________________________________________________ 49 5.2.13 Humidity Indicator __________________________________________________________ 50
5.3 Printed Circuit Board (PCB) ______________________________________________ 51 5.3.1 PCB Specifications ___________________________________________________________ 51 5.3.2 Soldering Components ________________________________________________________ 51
5.3.2.1 Soldering Paste ___________________________________________________________ 51 5.3.2.2 Soldering Wire ___________________________________________________________ 51
5.4 Software Development Process ____________________________________________ 52
iii
6.0 Project Prototype Construction and Coding ______________________________ 53
6.1 Hardware Fabrication ___________________________________________________ 53 6.1.1 Hardware Block Diagram ______________________________________________________ 54 6.1.2 Hardware Integrated Circuit Designs _____________________________________________ 54 6.1.3 Hardware Assembly Drawings __________________________________________________ 55 6.1.4 On-Board Housing Assembly Details _____________________________________________ 63 6.1.5 Way-Side Housing Assembly ___________________________________________________ 64
6.2 Software Fabrication ____________________________________________________ 67 6.2.1 On-Board Housing Assembly ___________________________________________________ 67 6.2.2 Way-Side Housing Assembly ___________________________________________________ 67
6.3 Coding ________________________________________________________________ 68 6.3.1 Microcontroller Coding ________________________________________________________ 68 6.3.2 PLC Coding _________________________________________________________________ 69 6.3.3 PCB Coding _________________________________________________________________ 70
6.4 Prototype Maintenance __________________________________________________ 70
7.0 Realistic Design Constraints __________________________________________ 70
7.1 Time and Economic Constraints ___________________________________________ 71
7.2 Manufacturability and Sustainability Constraints ____________________________ 71 7.2.1 Durability and Expected lifetime _________________________________________________ 71
7.2.1.1 Durability _______________________________________________________________ 72 7.2.2 Portability __________________________________________________________________ 72
7.2.2.1 Light Weight/ Relatively Small ______________________________________________ 72
7.3 Health, Safety, and Environmental Constraints ______________________________ 73 7.3.1 Hazardous Analysis ___________________________________________________________ 73
7.3.1.1 Likelihood ______________________________________________________________ 73 7.3.1.2 Fault Tree Analysis ________________________________________________________ 75 7.3.1.3 FMEA’s ________________________________________________________________ 76 7.3.1.4 Fail Safe ________________________________________________________________ 77
7.3.2 Environmental Constraints _____________________________________________________ 79 7.3.2.1 Temperature _____________________________________________________________ 79 7.3.2.2 Wind ___________________________________________________________________ 79 7.3.2.3 Light/ Dark ______________________________________________________________ 80
7.4 Ethical, Social, and Political ______________________________________________ 80
7.5 Disney Constraints ______________________________________________________ 80 7.5.1 Accurately Transmit and Receive data ____________________________________________ 83 7.5.2 Reliably Transmit and Receive Data ______________________________________________ 83 7.5.3 Angular Position Accuracy _____________________________________________________ 84 7.5.4 In Range Display _____________________________________________________________ 84 7.5.5 Out of Range Display _________________________________________________________ 84 7.5.6 Battery Level Display _________________________________________________________ 84 7.5.7 Signal Received Display _______________________________________________________ 85 7.5.8 Ride Stop Request Display _____________________________________________________ 85 7.5.9 Angular Position Display ______________________________________________________ 85 7.5.10 Standard Voltage for Battery ___________________________________________________ 85 7.5.11 Commercial Off the Shelf Parts _________________________________________________ 85 7.5.12 Supported for PLC I/O _______________________________________________________ 86 7.5.13 Potential Use in Dynamic Situations/ Environments _________________________________ 86 7.5.14 Vibration Tolerant ___________________________________________________________ 86
8.0 Project Assembly ___________________________________________________ 86

iv
9.0 Project Prototype Testing _____________________________________________ 87
9.1 Microcontroller Testing __________________________________________________ 88
9.2 Encoder Testing ________________________________________________________ 88
9.3 Test Environment _______________________________________________________ 88
9.4 Transmitter Test Procedures _____________________________________________ 88
9.5 Wireless Communication _________________________________________________ 88
9.6 PLC Test Procedures ____________________________________________________ 89
10.0 Administrative Content _____________________________________________ 89
10.1 Project Milestone ______________________________________________________ 89
10.2 Budget and Finance ____________________________________________________ 94
10.3 Team Organization ____________________________________________________ 94
10.4 House of Quality _______________________________________________________ 95
Appendences __________________________________________________________ 96
Appendix A – Copy Right Permission _________________________________________ 96 A.1 Powerwerx ___________________________________________________________________ 96 A.2 Battery – MaxAmps ___________________________________________________________ 96 A.3 Raspberry Pi _________________________________________________________________ 97 A.4 Angle Position Sensor IC _______________________________________________________ 97 A.5 Information Reference - Spend Edge ______________________________________________ 98 A.6 Encoder _____________________________________________________________________ 98 A.7 Encoder Coupling _____________________________________________________________ 99 A.8 Z-Wave.Me RaZberry Z-Wave plus GPIO card ______________________________________ 99 A.9 16 mm illuminated push button – blue momentary ___________________________________ 100 A.10 Dry & Dry silica packets and humidity indicator cards _______________________________ 100 A.11 12x10x5 Inch Weatherproof Windowed NEMA Enclosure ___________________________ 100
Appendix B Data Sheets ___________________________________________________ 101 B.1 Encoder ____________________________________________________________________ 101 B.2 Raspberry Pi 2Model B ________________________________________________________ 107 B.3 Micro USB Power Supply ______________________________________________________ 108 B.4 Z Wave Me RaZberry _________________________________________________________ 109 B.5 Powerwerx Watt Meter ________________________________________________________ 109 B.6 Battery Charger – SKYRC iMAX B6AC V2 _______________________________________ 110
________________________________________________________________________ 110 B.7 Voltage Regulator – DROK LM2596 _____________________________________________ 111 B.8 Circuit Breaker (fuse) – Digiten Auto Standard Blade Type ATV Fuse ___________________ 111 B.9 Weatherproof Enclosure – L-Com Weatherproof Windowed Enclosure __________________ 112 B.10 Silica Packets – Dry & Dry 5-gram Silica Packets __________________________________ 115
Appendix C Bibliography __________________________________________________ 115
Table of Figures Figure 1: Wi-Fi range comparison _______________________________________________________ 11 Figure 2: Representation of Z-Wave mesh network ___________________________________________ 14
v
Figure 3: Concept A Block Diagram ______________________________________________________ 37 Figure 4: Concept B Block Diagram ______________________________________________________ 39 Figure 5: MaxAmps 11.1V Battery (permission) _____________________________________________ 42 Figure 6: DROK LM2596 Voltage Regulator (pending approval) _______________________________ 43 Figure 7: iMAX B6AC v2 balance charger (pending approval) _________________________________ 44 Figure 8: Powerwerx Watt Meter_________________________________________________________ 45 Figure 9: US Digital Miniature Absolute Magnetic Shaft Encoder _______________________________ 45 Figure 10: Encoder Company Flexible Coupling ____________________________________________ 46 Figure 11: Raspberry Pi 2 Model B _______________________________________________________ 47 Figure 12: RaZberry Z-Wave Plus GPIO Card ______________________________________________ 47 Figure 13: Illuminated Pushbutton _______________________________________________________ 48 Figure 14: Weatherproof Windowed NEMA Enclosure ________________________________________ 49 Figure 15: 30 pack of 5-gram Silica Gel Packets ____________________________________________ 50 Figure 16: Dry & Dry Humidity Indicator card _____________________________________________ 50 Figure 17: Software Block Diagram ______________________________________________________ 52 Figure 18: Software Development Planning ________________________________________________ 53 Figure 19: System Block Diagram ________________________________________________________ 54 Figure 20: Integrated Circuit Design ______________________________________________________ 55 Figure 21: Encoder Assembly Drawing ____________________________________________________ 56 Figure 22: On-Board Control Box Assembly Drawing ________________________________________ 57 Figure 23: Track Side Box Assembly Drawing ______________________________________________ 58 Figure 24: Power Box Assembly Drawing __________________________________________________ 59 Figure 25: Way Side Ride Control Panel Assembly Drawing ___________________________________ 60 Figure 26: Way Side Ride Control Panel Detail “A” Assembly Drawing __________________________ 61 Figure 27: Way Side Console Assembly Drawing ____________________________________________ 62 Figure 28: Way Side Ride Control Panel Detail "B" Assembly Drawing __________________________ 63 Figure 29: On-Board Schematic _________________________________________________________ 64 Figure 30: Track Side Box Schematic _____________________________________________________ 65 Figure 31: Way Side I/O Schematic _______________________________________________________ 66 Figure 32: PLC Power Supply Schematic __________________________________________________ 67 Figure 33: Fault Tree Analysis of Problems ________________________________________________ 75 Figure 34: Failure Modes and Effects Analysis (FMEA) _______________________________________ 76 Figure 35:On-board failsafe code flow diagram _____________________________________________ 77 Figure 36: PLC Fail Safe Tree ___________________________________________________________ 78 Figure 37: In Range and Out of Range Angles ______________________________________________ 84 Figure 38: Microsoft Project Schedule pg. 1 ________________________________________________ 90 Figure 39: Microsoft Project Schedule pg. 2 ________________________________________________ 91 Figure 40: Microsoft Project Schedule pg. 3 ________________________________________________ 92 Figure 41: Microsoft Project Schedule pg. 4 ________________________________________________ 93
Table of Tables Table 1: Test frame and conditions to determine link quality ___________________________________ 13 Table 2: Nickel Cadmium Battery Advantages and Disadvantages _______________________________ 20 Table 3: Nickel Cadmium Battery Advantages and Disadvantages _______________________________ 20 Table 4: Lead Acid battery advantages and disadvantages _____________________________________ 21 Table 5: Lithium Ion Battery Advantages and Disadvantages ___________________________________ 22 Table 6: Lithium Polymer Battery Advantages and Disadvantages _______________________________ 22 Table 7: Nominal Voltage Cell Comparison. ________________________________________________ 23 Table 8: Life Span Cell Comparison ______________________________________________________ 24 Table 9: Charge Time Cell Comparison ___________________________________________________ 24 Table 10: Other Characteristics of Each Battery _____________________________________________ 25 Table 11: LiPo Battery Specification from Supplier __________________________________________ 42 Table 12: Voltage Regulator Specification from Supplier ______________________________________ 43
vi
Table 13: Battery Charger Specification from Supplier ________________________________________ 44 Table 14: Software Update Chart ________________________________________________________ 53 Table 15: Output Truth Table for way-side receiver __________________________________________ 65 Table 16: PLC Truth Table _____________________________________________________________ 69 Table 17: Maintenance Routine __________________________________________________________ 70 Table 18: Likelihood Table for mitigation __________________________________________________ 74 Table 19: Truth table for algorithm comparison output _______________________________________ 78 Table 20: Requirements / Specifications Fulfillment Table for On-Board __________________________ 81 Table 21: Requirements / Specifications Fulfillment Table for Way Side __________________________ 82 Table 22: Test frame and conditions to determine link quality __________________________________ 83 Table 23: Battery monitor value reference table _____________________________________________ 85 Table 24: The cost of the parts needed _____________________________________________________ 94 Table 25: House of Quality _____________________________________________________________ 95
Table of Acronyms
AES Advanced Encryption Standard AP Project Angular Position Project CB Circuit Breaker CDT C Development tools DLL Data Link Layer EEPROM Electrically Erasable Programmable Read-Only Memory FER Frame Error Rate FMEA Failure Mode and Effects Analysis FSO Free-Space Optical Communication FTA Fault Tree Analysis GPIO General Purpose Input / Output IEEE Institute of Electrical and Electronics Engineers I/O Input / Output IP International Protection Marking ISM Industrial, Scientific, and Medical ITU RR International Telecommunication Union Radio Regulations ITU-T International Telecommunication Union - Telecommunications ICD Integrated Circuit Design IDE Integrated development environment JDT Java Development Tools LCD Liquid Crystal Display LLC Logical Link Control LVDT Linear Variable Differential Transformer MAC Medium Access Control MCU Microcontroller Unit NEMA National Electrical Manufacturers Association NFC Near-Field Communication OSI Open Systems Interconnection PCB Printed Circuit Board PDT PHP Development Tools PIN Personal Identification Number PLC Programmable Logic Controller
vii
PHY Physical Layer QR Quick Response RAM Random-Access Memory ROM Read-Only Memory RF Radio Frequency RSR Stop Request S2 Security 2 Protocol SAR Segmentation and Reassembly SDP Software Design Plan STD Standard TB Terminal Block WORA Write once run anywhere WPA2 Wi-Fi Protected Access II MOSFET Metal-Oxide-Semiconductor Field-Effect-Transistor BJT Bipolar Junction Transistor
1
1.0 Executive Summary The Angular Position Project (AP Project) is a University of Central Florida senior design project being sponsored by Walt Disney World. The project is to capture angular position and use that information for future analysis. The Angular Position Project (AP Project) uses an on-board encoder attached to the shaft of the test object to read the test object’s linear angular position. Once the angular position is obtained, the encoder feeds that information to an on-board microcontroller for processing. The microcontroller will take in the analog data, run it through its algorithms to decide if the test object is operating in an “in range” mode or “out of range mode”. Then the microcontroller gives the data to an on-board transmitter. The transceiver packages the data then sends it wirelessly to a wayside transceiver. From the transceiver, the data is sent directly to the way-side PLC. In addition to the wireless signal, the PLC will have three other inputs. The stuck button will simulate if the test object is in a fixed position or stuck position. The polling button will simulate movement of the test object as if it was progressing around a ride track. The maintenance key button will simulate some maintenance personnel physically inserting a key into a turn lock to reset the ride stop request error. As each piece of data enters the PLC, the PLC program will decide if a wireless signal was received, if the test object is in or out of range, is stuck or not stuck and if a ride stop request should be issued. Once the PLC makes the decision, it will illuminate the appropriate light. There will be a light for signal received, in range, out of range, stuck, not stuck and ride stop request. Each polling point will reset the data in the PLC and therefore reset all the lights except for the ride stop request. The only way to reset the ride stop request light is if the abnormality has been fixed and the maintenance key button has been pressed; then the ride stop request light will reset. The on-board components are powered by a rechargeable battery. The battery sends the power through a voltage monitor then to a voltage regulator to step down the power for component protection. The power through a battery monitor, which will monitor the battery level at all times. The battery tester sends the power to the on-board microcontroller. The microcontroller then provides the power to the encoder and the transceiver. The way-side microcontroller will be powered from a power supply that is plugged directly into the wall. The PLC will be powered directly from the wall. The input stuck button, the input polling button and the input maintenance key button will be powered by a power supply. All output lights will be powered directly from the PLC output module.
2.0 Project Background
The next sections will introduce the angular position system by giving an overview of the motivation behind the project, objectives, and the requirement specifications. This will cover the background behind the project and what needs to be accomplished. It will go into a more technical description moving forward.
2
2.1 Motivation The angular position concept came about when wanting to get a Disney sponsored project for senior design. After further considering this concept, its reach can be introduced to much more diverse systems, from construction equipment to even airplane instruments. This will be an accurate and reliable system that will help other engineers, contractors, or manufactures. Adding a better way to measure angular position is a compelling way to help with expanding on how far mechanical systems can go.
2.2 Objectives
Transmission of angular position in all appropriate conditions. This includes indoor, outdoor, rain, temperature, day, night, etc. The goal is to produce a functioning prototype that proves the technology is not only possible, but that it can also meet the requirements specified. The desired result would be that the developed concept is capable of being incorporated into a ride control system.
2.3 Requirements Specifications The initial requirements of the sponsored project will be to: accurately transmit and receive data, reliably transmit and receive data, be supported for PLC I/O, standardized not customized, light weight, potential use in dynamic situations/environments, vibration tolerant, fail safe, relatively small, water resistant, and function in Florida weather (ride operational conditions) such as sunshine, water resistant, heat, fog, windy, light, dark, etc.
3.0 Research
In creating a project, researching the different components and other similar projects will help in choosing which components to use. Researching about the other similar projects that use components that we could use in our project will give the understanding of the different options that can be considered for this system. For each component it is good to know how much power consumption each will take. Using the data sheets for the components will help also understand how to help supply the voltage needed for all the components that will be used in this project. For this project, the research was done for the following components and topics: a senor for angular position, wireless technology, microcontroller, waterproof casing, battery types, PLC's, voltage regulator, and battery monitors. Each component and topic will be extensively researched until a decision is made on what component to use that would be the best option for this project. The decision will be based on examining the parameters of the components abilities and dimensions.
3
3.1 Existing Similar Projects and Products Through the developmental stage of the angular position accuracy, it was apparent that this project was unique. With this being said the components that are used for this project are not much different from previous projects. In researching the past projects, the primary aspect was use of wireless communication and angle sensors that would provide an accurate angle within +/- 1%.
3.1.1 Safety Monitoring Device and System
The Safety Monitoring Device and System project focused on creating and developing a device for monitoring safety. They incorporated a network that would link together each device that will provide the status of each device in the building that will relay a signal back on if a fire or explosion has happened. The system detects by using sensors and then will send the signals of each device to a centralized computer that will keep the logs of any triggers that happen from fire explosions. This is kind of relevant to this project in a couple of ways. One way is that we will also send back a signal from out encoder that would have to be interpreted to tell if the test object is in range or out of range. For the Safety Monitoring Device and System project they chose their data base structure to group all data into a text file. Each text file will split up into emergency and system logs. The text file storage as they said was not very secure since the files can be edited by anyone with access. This gave us the idea to keep a log system like this but instead of using a computer we decided to use the microcontrollers memory.
3.1.2 BreathaLock BreathaLock is a device that is to take in place of a key fob that would start the car to prevent drunk driving. The driver will take out the BreathaLock that will do a biometric fingerprint to make sure that it is the driver for the car. If the driver is sober it will unlock the vehicle remotely. If the user did not pass, then the BreathaLock will deny the driver. This helped us with installing a key switch needed to the PLC for safety concerns when checking the system. If the angle is out of range and stays out of range, stuck, or no signal, which will illuminate a light until fixed. Then a key switch is needed making sure the person officially came out and check on the system.
3.2 Sensor Options
There are several different types of sensors on the market that can read angular position. In our brainstorming sessions, we came up with several different ideas that could potentially work for this design project. One idea was to shoot a beam from a sensor at a mirror and when the beam reflects back, measure the angular position. The problem with this idea was that moisture on the sensor or the mirror
4
would cause false information. From these brainstorming sessions, we were able to produce several different sensors that would read angular position.
3.2.1 Encoder An encoder is a special sensor that captures position information, and sometimes speed as well as direction, then relays the data to other devices. When deciding what encoder to choose, there are several different areas to look at. There are so many different types of encoders on the market, we were only able to scratch the surface of the encoder world, therefore we are only listing the encoder types we researched for this design project.
3.2.1.1 Measurement Type
An encoder reads position. There are two different position types that lead to two different types of encoders. A linear encoder, as the name suggests, reads linear position. This type of encoder is used to determine position in a straight line and are normally used in application for things like a coordinate measuring machine. The other type of position is angular position. As an object turns in a circular motion, a rotary encoder reads the angle of the rotation. Rotary encoders are widely used in industry to track the position of a motor shaft.
3.2.1.2 Styles There are two major styles of encoders that treat position differently. An incremental encoder provides position relative to a “home” position. This detection of position is usually done with a pulse output. A single wave output will give indication of movement only meaning, it will signify when the shaft moved and how much it moved but not in which direction it moved. A two-channel quadrature output, meaning A+, A-, B+, B- will give how much the shaft moved and in which direction. The two channels are 90 degrees out of phase from each other and by taking the difference between the 4 outputted square waves, an angle of rotation can be obtained. This means that incremental encoders only deal with digital data. A drawback of incremental encoders is loss of position with loss of power. This is an issue if a power outage occurs, the encoder must be referenced back to the home position to reinitialize the counter. The other major style of encoder is an absolute encoder. The absolute encoder does not lose the position when a power outage occurs therefore the position is available immediately when the power returns to the encoder. The absolute encoder also assigns unique identifiers to each position, so it does not need to reference a “home” position to maintain position accuracy. Absolute encoders, unlike incremental encoders, come in both digital and analog versions.
3.2.1.3 Technologies
Encoders have several types of technologies available on the market. The two most dominate are the optical encoder and the magnetic encoder. The optical
5
encoder uses a glass or plastic disk with transparent or opaque sections. A light source shines through the disk and the photo detector reads the pattern projected through. Optical encoders have microprocessors built in to decipher the patterns being projected which equates to a position. For example, an optical incremental encoder, utilizes a disk which contains equally spaces sections to determine movement where as an optical absolute encoder utilizes a disk which contains concentric circle patterns and a masking disk. A light is passed through the mask then through the disk. The photo detector picks up the unique light pattern which produces a distinct output for each position. Optical encoders have the highest resolution, meaning they are the most accurate, on the market. The magnetic encoder has a series of magnetic poles inside the encoder. There are at least 2 poles, sometimes more. The position of the poles is read by a magnetic sensor. The pole positions are sent to a built-in microcontroller to decipher the pole position information. The microcontroller then produces an angular position much the same way an optical encoder does. Magnetic encoders are more rugged than optical encoders as they are manufactured for dirty, industrial environments. There is a new addition to the encoder market called a capacitive encoder. They offer comparable resolution to an optical encoder but are built to withstand rugged environments like a magnetic encoder. Since they are a relatively new introduction to the market, there are only a handful of vendors offering this encoder. Due to their limited availability, not further research was done on this encoder.
3.2.1.4 Mounting Types How the encoder mounts to the shaft of a motor or test object can vary so there are various mounting types to consider. The first type is a hub shaft encoder which fits the shaft of the motor inside the encoder bore. This means that the shaft length of the motor must be exact, within millimeters, for the encoder to function properly. This type of encoder is usually designed to fit certain types of motors so that the shaft length will match up correctly with the specified encoder. Then there is the thru-bore encoder. This encoder is circular in shape with a hollow hole in the middle just like a doughnut. The shaft of the motor or test object goes through the center hole. This allows for unlimited size in the shaft length. The center hole, also known as the bore hole, is usually lined with some type of rubber to prevent the encoder from moving rotationally on the shaft or linearly along the shaft. Next there is the regular shaft encoder which has a circular solid shaft that protrudes from the encoder. This shaft is to be inserted into a bore that accepts that shaft size. Therefore, instead of the motor or test object inserting a shaft inside the encoder like the previous two mounting types, this encoder inserts its shaft into the motor or test object. The last type is a flange shaft encoder which is the same as the regular shaft encoder with one slight difference. The encoder shaft is not completely round, it has a portion that is squared, creating a flange. The flange is to be inserted into a bore that accepts flange style shafts. This allows for proper lining up of the encoder to the motor or test object so if you were to use an
6
incremental encoder, the “home” position would be easier to locate because of the flange.
3.2.1.5 Turn Types There are additional layers of information that can be tracked by some encoders such as the number of turns or revolutions an encoder makes. In certain applications, the number of times an encoder turns are important therefore such applications would use a multiturn encoder. This encoder counts the number of turns as well as its position and its direction. Some even track speed, depending on the need for such information. If the number or revolutions are not important to the application, they offer single turn encoders which does not track revolutions only position and direction.
3.2.1.6 Additional Information
While researching encoders, there were a few additional points that were noticed along the way. There is a line driver encoder which provides error-free output pulses in electrically noisy environments or over long transmission lines. These types of encoders are used for cable lengths for up to 1,000 feet. A line driver is a sourcing output, sinking and sourcing is discussed under the PLC research, therefore it would need a sinking input to function properly. Another topic that was noticed while researching encoders is that one of the most prevalent kinds of outputs for incremental encoders is an open collector output. The open collector has a sinking output and would need a sourcing input to function. An open collector utilizes pull up resistors to pull in the signal to supply the voltage. In the same research on an open collector, we came across a push-pull output which is a combination of a line driver and an open collector. This design also utilizes pull up resistors. In the off state it will supply a path to ground and in the on state it will supply voltage.
3.2.2 Linear Variable Differential Transformer Another type of sensor we discussed was a linear variable differential transformer. This device measures linear displacement. The basic idea is there is a core inside of a hollow shaft. The hollow shaft is wrapped with wire, just like a transformer, on the north and south poles of the shaft to give the displacement. A third coil is wrapped over the middle part of the shaft, where the core sits inside, and a power source is fed through this third coil. The magnetic flux produced by the middle coil is coupled to the two pole coils inducing voltage in each coil. The core is attached to the object that is being measured and as the object moves, the core slides freely inside the hollow shaft between the two coiled poles. The displacement from the middle, which is the core’s “home” position, will determine the location of the object. There are great benefits in using LVDTs for displacement measurement because the LVDT is highly robust. There is no physical contact across the sensing element, so the element has no wear and tear. The device relies on magnetic flux, so it has infinite resolution. The slightest movement in the core will
7
result in a measurable displacement, so the only limit on the resolution is the data acquisition system interpreting the displacement. It should be noted that most LVDTs require an AC power source, though there are some on the market that do offer a DC power source option.
3.2.3 Programmable Angle Sensor IC This programmable angle sensor is a pinned component that uses the hall effect for angular position. This chip was an ideal part at first because it is a contactless sensor which would make being mobile a lot easier. These chips are used in industrial, automotive, and consumer markets. Some applications for this chip sensor is steering wheel angle, torque and rotational speed. The contactless angle sensor goes from 0 to 360. The designed is to use a magnet to a diameter of 15mm and a thickness of 4mm to be rotated. It is a non-volatile memory (EEPROM) with a single or dual die option that can support up to about 100 read/write cycles. This chip has 5 pins for VCC, VOUT, and the rest are NC which is connected to ground. The input voltage need for this chip is between 4.5V and 5.5V and a current draw of 12 mA to 15mA which would great with the low current draw to make portable. After researching, our sponsor did now want anything that had to be custom, so this idea had become scraped.
3.2.3 Contactless Sensor
The final sensor that was researched was a non-contact sensor. This sensor operates using the hall effect technology with generating a magnetic field by magnets. This sensor is a linear sensor. Some good advantages for this sensor is that it is non-contact so less wear and tear on the component, a full 360-degree rotation with a high tolerance for misalignment. Another advantage is that it only pulls 8mA which is one of the lowest out of all the sensors previously discussed. Usual applications for this sensor are for lifts, steering, and outboard trim sensing. One disadvantage for this sensor was the air gap. The air gap is the gap between the sensor and the magnet. The air gaps on most of the sensors similar to this was at most was 44mm which we need more room for more rotation on our test object.
3.2.4 Sensor Conclusion The LVDT was a viable choice until we were unable to find any DC options with a low power requirement. The lowest power option was a 12VDC which was too much power to be considered for this design. The programmable angle sensor IC was not considered because it did not meet the sponsor requirement of being a commercial off the shelf part. It was a chip that would have to be attached to something, not an actual component. The contactless sensor was another possible choice for the design project and was included in concept B (see section 5.1.2 for concept details) to be presented to our sponsor. The other feasible idea
8
was an encoder to read the angular position. This was included in concept A (see section 5.1.1 for concept details) to be presented to our sponsor. There are many different types of encoders on the market. There were several features that we were looking at to decide which encoder to choose. The encoder would be on exposed to the outside elements, so moisture and dirt would be a major concern. Optical encoders would not be the best choice because they are very sensitive to moisture and dirt, so we chose a magnetic encoder which is more rugged. The tradeoff is that a magnetic encoder cannot achieve the resolution or accuracy of an optical encoder, but for our application, the magnetic encoder will exceed the requirements set forth by the sponsor. The encoder needs to retain information if there is a power outage otherwise it could send incorrect data leading to a safety issue. This means the encoder must be an absolute which assigns a specific identity to each angle so if the encoder loses power, the angle will not reset back to zero like an incremental encoder would. There are several mounting types to choose from. Since the shaft length of the test object is not known, we wanted to use a design that could easily be adapted to any shaft length. This ruled out the hub shaft encoders. We didn’t want to limit the shaft to a flange style, so we ruled out the flange encoders. That left the hollow shaft and the regular shaft encoders to pick from. Either one would work for the design, so we looked at other factors to help make that choice. We wanted a small foot print, so the encoder needed to be light weight and relatively small in construction. Both hollow shaft and regular shaft encoders could meet that requirement. Ultimately, we did not know what size shaft could be used on a future design that would be able to meet the weight requirements for a swinging component so without knowing what diameter of shaft could be incorporated, we chose the regular shaft encoder to give more flexibility to the design.
3.3 Wireless technology Wireless communication was chosen as the preferred method of data communication for this project. The transmission of data can be generalized into two high-level categories which are wireless and wired communication. Wireless communication is the process of sending data between two or more points without the use of an electrical conductor. Wired communication is a data communication method that takes information directly from the source and transmits as a set of high and low voltage, or amperage, values through conductive material to the host device. The advantages and disadvantages of wired and wireless were used in the decision process of choosing wireless over wired for our project. The advantages of wireless communication are the number of devices that can easily be connected in a network, maneuverability of wireless devices indoors, and the large available bandwidth for communication over the network. One advantage of wired communication is that it’s a robust form of data communication since it’s normally sent through conductive material surrounded by a thick layer of insulating material
9
to help mitigate harmful electromagnetic waves. Another advantage to wired is the wide availability of different methods of wiring and standards that define how much data it can send and how the data is sent. The disadvantages of wireless communication are interference of signals using the same bandwidth to send data, operating range of higher frequencies, and the absorption of electromagnetic waves that travel through conductive materials. Wired disadvantages are clutter of wire, inability to move wired devices due to limited wire length, and if parallel communication is used with transmitting data through a wire the data has a high likelihood of colliding causing data loss. Wireless communication was overall preferred because it suited the needs of maneuverability of the project and it came with other advantages over wired communication. There were two possible wireless communication methods that were considered for use in the project. The two methods, or modes, were radio/microwave electromagnetic wave transmission and free-space optical communication. Free-space optical communication, or FSO, uses propagating light to transmit data from point to point in free space (air, outer space, vacuum, etc.) and is normally used in situations that physical connections are impractical. The radio wave mode of wireless communication uses the radio and microwave bandwidths on the electromagnetic spectrum to transmit data wirelessly from one device to another. Radio waves are able to do this by modulating the properties (amplitude, frequency, phase, pulse width, etc.) of the electromagnetic waves to represent the data being sent. The advantages and disadvantages of both modes were then weighed the same way wireless and wired communications were to decide which one our project would need. One advantage of FSO is license-free long-range operation which meant that acquiring a license to use a bandwidth would not be necessary. Other advantages are high bit rates and low bit error rates meaning reliability and accuracy in the sent data. The last notable advantage of FSO is the immunity to electromagnetic interference because the data is sent as propagated light which is not affected by electromagnetic waves. A disadvantage to this mode of wireless communication is that it is highly affected by any change in atmospheric condition (rain, fog, smog, snow, wind, etc.). This disadvantage alone is the only one that truly matters for our project because the environment that Florida has will cause transmission issues for free-space optical communication. The radio waves mode has multiple advantages including ease of application, satisfies communication range requirement for the project, and multiple frequencies to choose from to send data through. The ease of application comes from wireless radio communication being well established in most forms of wireless communication. These applications encompass long range satellite communication, which uses bandwidths in the microwave electromagnetic spectrum, to short range device to device communication such as Bluetooth. The next advantage of radio communication having a sufficient range for the project refers to having bandwidths that can transmit data to a distance of at least 50
10
meters away. The last advantage of multiple frequencies to choose from refers to the operating frequencies of 3 kHz to 300 GHz, but this brings in the first disadvantage of this system. Even with the large range of frequencies, only a limited set can be chosen because of regulations set by the National Telecommunications and Information Administration, which is run by the US Department of Commerce. The frequencies that can be chosen freely for the project are set by the Radio Regulations of the International Telecommunication Union, or ITU RR, and these frequencies are in what is known as the ISM bands. Another disadvantage is high propagation loss after a set distance, but the distance is different for each bandwidth that can be used. The last applicable disadvantage to the project for radio waves is interference of other devices that use the same bandwidth. Overall, the better choice between the two different wireless communication modes for our project was using the radio mode. Additional pertinent information on this mode comes from the ISM bands. The ISM (Industrial, Scientific, and Medical) bands are, as stated previously, set by the ITU RR for the purposes other than telecommunications. A majority of the frequency bandwidth allocations are for telecommunications, radio station broadcasting, or television broadcasting. The purpose of the ISM bands is to allow researches, enthusiasts, and students to use them to implement different applications to these frequencies. The ISM bands also provide options of different wireless radio communication to use which are Bluetooth, Wi-Fi, Z-Wave, and NFC (Near-Field Communication). These will be compared to determine which of these is best suited for the project.
3.3.1 Wireless Options There were five different options that were researched of the radio mode of wireless communication that the angular position project could use. These five were NFC (near-field communication), Bluetooth, Wi-Fi, Zigbee, and Z-Wave. Beginning with NFC as a method of communicating data it was immediately considered as non-viable option because it didn’t meet the range requirement due to its communication range being at most 20 cm. The next option considered was Bluetooth which provided a further operating range compared to NFC. NFC was at most 20 cm, where Bluetooth could be anywhere from 50 meters to 100 meters depending on if it is low energy or not. There were two issues with using Bluetooth: The standard they were designed from is no longer maintained and lack of proper signal security. The standard not being maintained means that if there are issues that pertain how the signal is packaged and sent, it is on the programmer to customize the networking code to properly send the signal. This conflicts with a parameter set by our sponsor of not having “customized” devices for their portion of the project and having to modify a standard fall under this set parameter. The disadvantage of the lack of security was a major issue as well because the data that is procured by the project is going to be treated as sensitive information that only designated users can access. Bluetooth devices that are in discoverable mode to pair with other devices share the device name, device class, list of
11
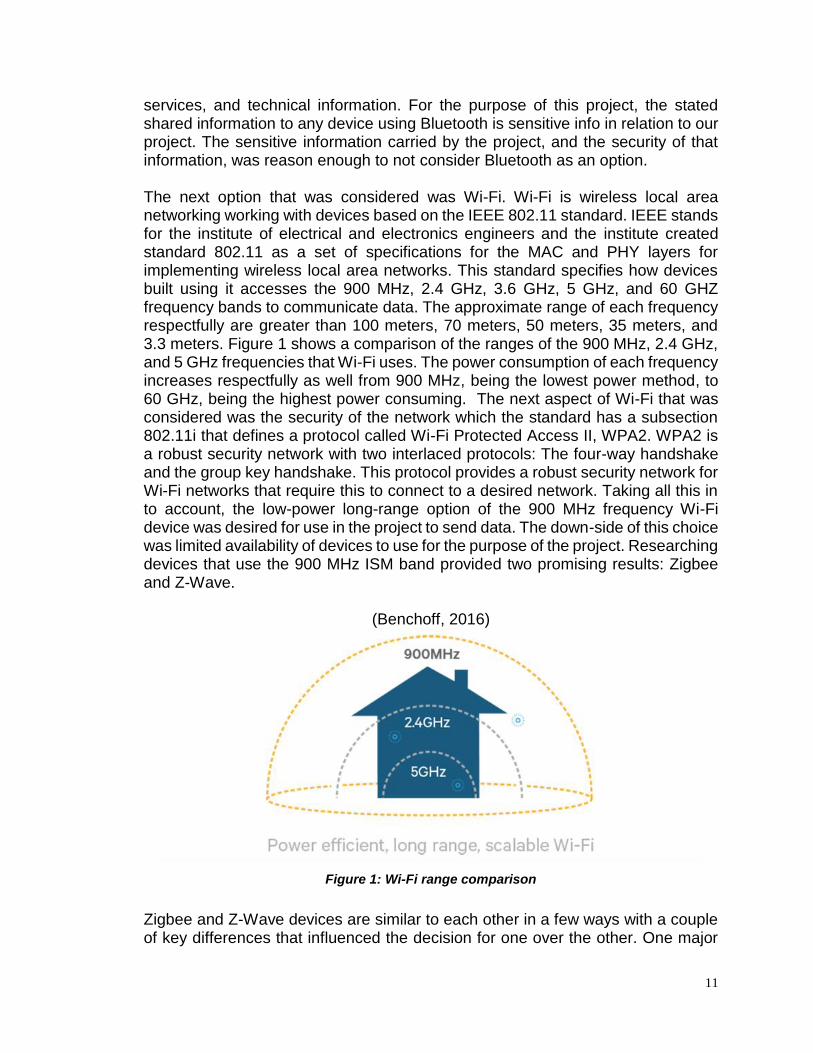
services, and technical information. For the purpose of this project, the stated shared information to any device using Bluetooth is sensitive info in relation to our project. The sensitive information carried by the project, and the security of that information, was reason enough to not consider Bluetooth as an option. The next option that was considered was Wi-Fi. Wi-Fi is wireless local area networking working with devices based on the IEEE 802.11 standard. IEEE stands for the institute of electrical and electronics engineers and the institute created standard 802.11 as a set of specifications for the MAC and PHY layers for implementing wireless local area networks. This standard specifies how devices built using it accesses the 900 MHz, 2.4 GHz, 3.6 GHz, 5 GHz, and 60 GHZ frequency bands to communicate data. The approximate range of each frequency respectfully are greater than 100 meters, 70 meters, 50 meters, 35 meters, and 3.3 meters. Figure 1 shows a comparison of the ranges of the 900 MHz, 2.4 GHz, and 5 GHz frequencies that Wi-Fi uses. The power consumption of each frequency increases respectfully as well from 900 MHz, being the lowest power method, to 60 GHz, being the highest power consuming. The next aspect of Wi-Fi that was considered was the security of the network which the standard has a subsection 802.11i that defines a protocol called Wi-Fi Protected Access II, WPA2. WPA2 is a robust security network with two interlaced protocols: The four-way handshake and the group key handshake. This protocol provides a robust security network for Wi-Fi networks that require this to connect to a desired network. Taking all this in to account, the low-power long-range option of the 900 MHz frequency Wi-Fi device was desired for use in the project to send data. The down-side of this choice was limited availability of devices to use for the purpose of the project. Researching devices that use the 900 MHz ISM band provided two promising results: Zigbee and Z-Wave.
(Benchoff, 2016)
Figure 1: Wi-Fi range comparison
Zigbee and Z-Wave devices are similar to each other in a few ways with a couple of key differences that influenced the decision for one over the other. One major
12
comparison between the two is that neither need access to the internet to operate and send data between devices. This is a significant advantage over Wi-Fi devices because it isolates the Zigbee and Z-Wave devices from security breaches from other devices over the internet. Another comparison between the both of them is that they have the operating frequency of 900 MHz and are low-power which is a factor in why they were chosen in the first place. They are both also easily implemented into systems and networks and widely available for purchase and installation. The first key difference is that Zigbee devices have an approximate transmitting range of 10-20 meters, whereas Z-Wave devices have an approximate range of 60 meters indoor and 100 meters outdoor. The second difference is that they both use separate standards that specify how the different network layers work in their networks. Zigbee uses IEEE 802.15.4 which is similar to IEEE 802.11 in the sense that it only defines how devices specify their PHY and MAC layers in networking with each other. Z-Wave uses recommendation ITU-T G.9959 which not only specifies how devices access the PHY and MAC layers, but also the SAR and LLC layers. In conclusion, a Z-Wave device was chosen as the preferred method to wirelessly communicate data for our transmission of angular position project.
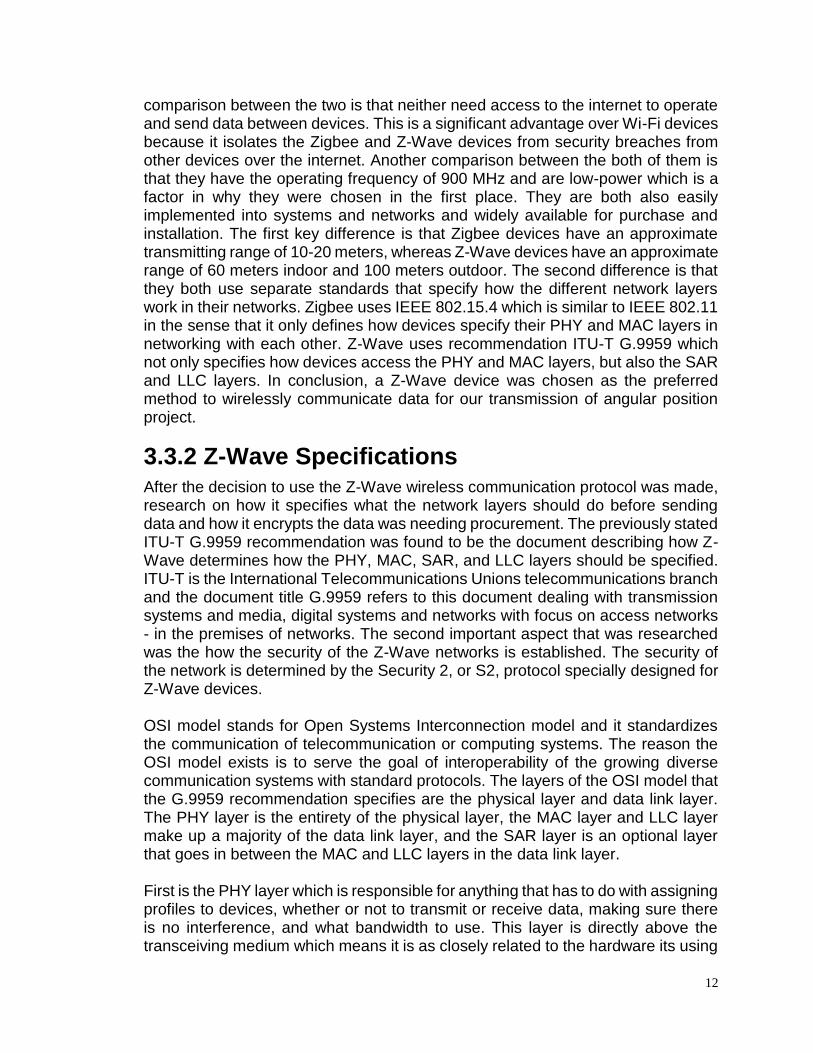
3.3.2 Z-Wave Specifications After the decision to use the Z-Wave wireless communication protocol was made, research on how it specifies what the network layers should do before sending data and how it encrypts the data was needing procurement. The previously stated ITU-T G.9959 recommendation was found to be the document describing how Z-Wave determines how the PHY, MAC, SAR, and LLC layers should be specified. ITU-T is the International Telecommunications Unions telecommunications branch and the document title G.9959 refers to this document dealing with transmission systems and media, digital systems and networks with focus on access networks - in the premises of networks. The second important aspect that was researched was the how the security of the Z-Wave networks is established. The security of the network is determined by the Security 2, or S2, protocol specially designed for Z-Wave devices. OSI model stands for Open Systems Interconnection model and it standardizes the communication of telecommunication or computing systems. The reason the OSI model exists is to serve the goal of interoperability of the growing diverse communication systems with standard protocols. The layers of the OSI model that the G.9959 recommendation specifies are the physical layer and data link layer. The PHY layer is the entirety of the physical layer, the MAC layer and LLC layer make up a majority of the data link layer, and the SAR layer is an optional layer that goes in between the MAC and LLC layers in the data link layer. First is the PHY layer which is responsible for anything that has to do with assigning profiles to devices, whether or not to transmit or receive data, making sure there is no interference, and what bandwidth to use. This layer is directly above the transceiving medium which means it is as closely related to the hardware its using
13
to wirelessly communicate data. This layer is also responsible for determining link quality in a signal by sending test frames that ascertain specific conditions as shown in . The other important function of this layer is setting the transceiving bit rate, modulating the signal, and determining the minimum receiver sensitivity before stopping a signal.
(International Telecommunications Union , 2015)
Table 1: Test frame and conditions to determine link quality
The MAC, Medium Access Control, layer controls access to the network and the layer also confirms the transceiving of frames from one device to another. The specifics it handles is assigning a HomeID for the domain, a NodeID to each device in the domain, and to assure that frames are transmitted without error or collision. This layer assigns a 32-bit HomeID for the domain and subsequent 8-bit NodeIDs for all the devices in the domain. The size of the NodeIDs allow for the possibility of 256 devices to be connected in a domain, but because of reserved NodeID values the maximum number of devices that can be in a single domain is reduced to 232. The LLC, logical link control, layer is directly above the MAC layer and the final part of the data link layer. The LLC layer handles only one thing: encryption/decryption of MAC protocol data units which tell the MAC layer what tasks it needs to perform. The SAR, segmentation and reassembly, layer will not be utilized for the project because the size of data the transceivers will be working with are no more than a couple of bytes. The SAR layer deals with breaking up large amounts of data in to multiple segments when transmitting and then reassembling said data when it received. The ITU-T G.9959 recommendation has an Annex A that deals with how this recommendation applies specifically to Z-Wave devices. The Z-Wave PHY and MAC layers are still responsible for all of the same things that are specified by the general G.9959 documentation.
The recommendation G.9959 deals with how the data is sent through the different layers and if the devices can connect under certain conditions. The data link layer is where security encryption is applied but it does not specify what encryption method it uses. The Security 2, or S2, protocol was created by the Z-Wave Alliance through reverse engineering successful hack attempts to their previous Security 0 protocol. A key feature of this protocol is the pairing procedure requires a unique PIN or QR code for a device to connect to the network. The only way to obtain these PINs or QRs is by physically requesting one for the network. This means that for someone to intrude in on to this network they have to physically interact
14
with the domain device to access the network. The type of encryption the transmitted data has in open-air is an AES-128 encryption which stands for Advanced Encryption Standard with a key size of 128 bits. Even though AES-128 has the smallest key size of 128-bits, it is still practically impossible to decipher. In summary, the Z-Wave specifications meets all the desired requirements by our transmission of angular position project. The approximate transmission range is 60 meters at minimum and 100 meters at maximum, it is low-power, available as off-the-shelf products, easily implementable, and secure.
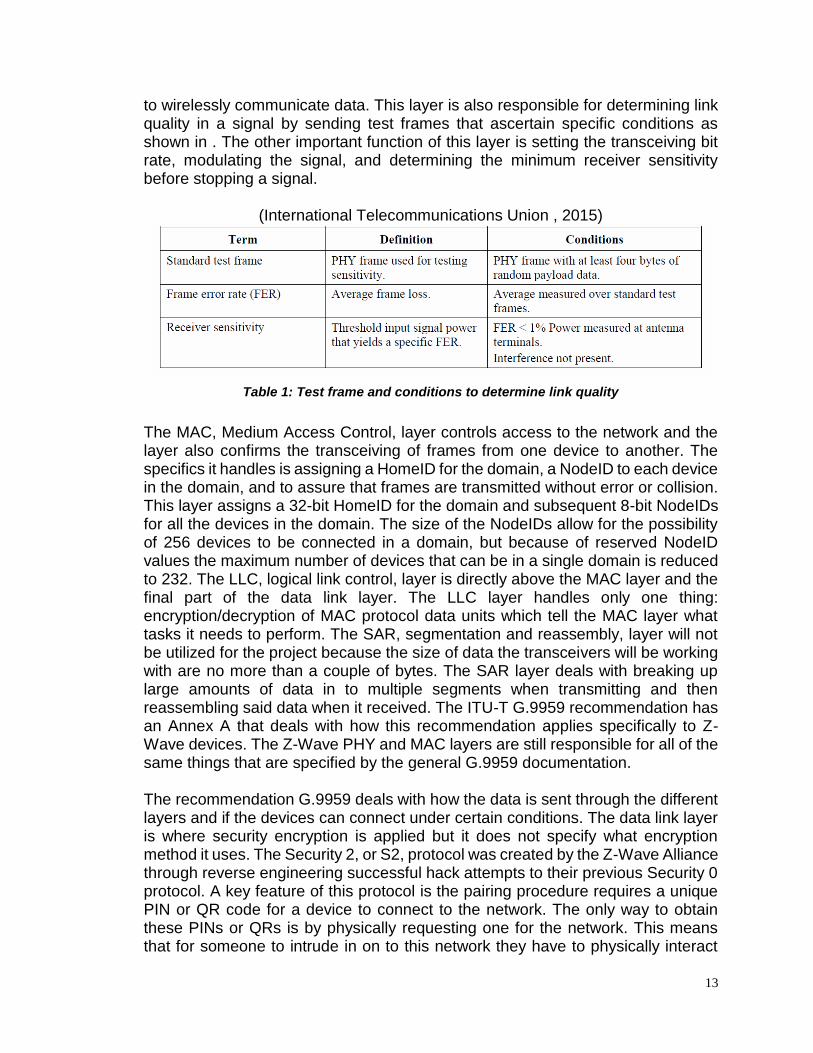
3.3.3 Wireless Diagram Figure 2 is a rough representation of how a Z-Wave mesh network looks on the level where you can only see the links and nodes of the network. Each of these nodes in the figure are assigned a different NodeID to differentiate themselves from each other. Since they are all interconnected, they are all part of the same unique domain defined by a HomeID which they all share. The two determining factors of how one node sends data from one of the other: number of hops to the destination node and latency between the nodes. The number of hops means how many nodes the data has to pass through before reaching its destination node. The latency between the nodes is the time it takes to send the data from node to node. Both of these factors are determined by how far away the source node is from the destination node. Normally, the algorithm that determines what path the data should take will take the path with the least latency. This algorithm is implemented on top of methods that help the data transmit with little to no errors, so the networking aspect it takes in to account on a high level is transporting the data from end to end as fast as possible.
(International Telecommunications Union , 2015)
Figure 2: Representation of Z-Wave mesh network
15
3.4 PLC Characteristics A programmable logic controller is an industrial computer that has a robust construction and reliable controlling capabilities that make it a major asset in control industries. There are many different types, models and styles of PLCs. Even with such a diverse selection on the market, there are some similarities. Every PLC has a minimum of three modules; a CPU module, a power supply module and at least one I/O module.
3.4.1 CPU
The CPU module is the brains of the entire system which consists of a central processor and its memory. The memory includes both ROM and RAM but are utilized a little differently in a PLC than in a personal computer. In a personal computer, ROM is used for storing data that does not get lost when the computer is turned off. This includes the operating system, drivers, programs and saved documents. RAM in a personal computer temporarily stores data that has not been saved to ROM such as a word document that you’ve started typing but have not saved it in your documents folder yet or when you add numbers on the calculator on the desktop. If you shut down your computer without saving the document, all your work will be lost. The calculator with the added numbers will not start up on your computer the next time you power it up. That is a generalized example of RAM and ROM work on a personal computer, but a PLC is different. In a PLC, ROM is also used for the operating system, drivers and application programs but does not store any user data such as documents. Any user data or external data is stored in RAM. This consists of user written programs and data being received from other inputs. In essence, the user does not have access to the ROM only the RAM. Just like the personal computer ROM, the PLC RAM is able to retain the information stored in it even when the power is turned off. This is called retentive memory. This means that when the PLC starts up again, the user programs loaded into the memory are still there. This alleviates the need for the PLC to be connected to a computer. Once the user program is downloaded into the PLC, no other interaction is needed unless the user wants to change the programming.
3.4.2 Power Supply The power supply module powers the CPU and the I/O modules. Many times, the power supply takes in AC power and converts it to DC power. Some power supply modules are manufactured to take in a DC power which allows for power flexibility depending on what is needed for your application. Some PLCs are able to use some of the power delivered from the power supply to drive a few sensors and/or actuators. That depends on the I/O cards, which will be discussed in the next section.
16
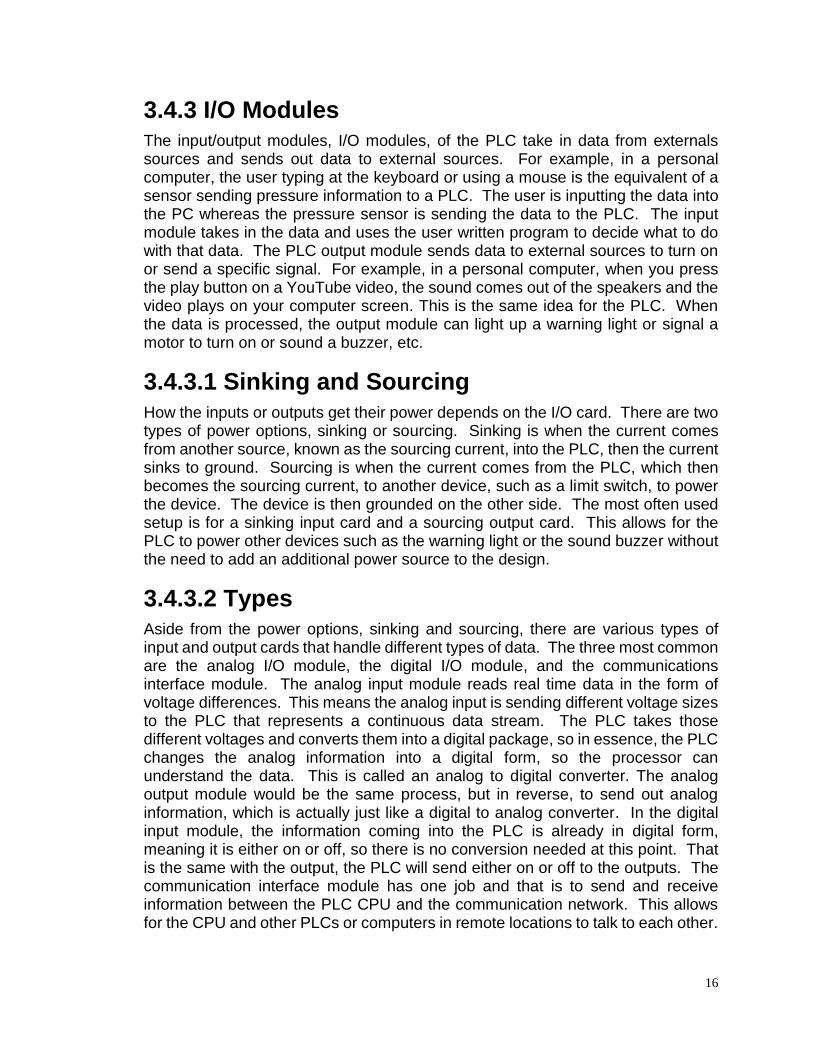
3.4.3 I/O Modules The input/output modules, I/O modules, of the PLC take in data from externals sources and sends out data to external sources. For example, in a personal computer, the user typing at the keyboard or using a mouse is the equivalent of a sensor sending pressure information to a PLC. The user is inputting the data into the PC whereas the pressure sensor is sending the data to the PLC. The input module takes in the data and uses the user written program to decide what to do with that data. The PLC output module sends data to external sources to turn on or send a specific signal. For example, in a personal computer, when you press the play button on a YouTube video, the sound comes out of the speakers and the video plays on your computer screen. This is the same idea for the PLC. When the data is processed, the output module can light up a warning light or signal a motor to turn on or sound a buzzer, etc.
3.4.3.1 Sinking and Sourcing
How the inputs or outputs get their power depends on the I/O card. There are two types of power options, sinking or sourcing. Sinking is when the current comes from another source, known as the sourcing current, into the PLC, then the current sinks to ground. Sourcing is when the current comes from the PLC, which then becomes the sourcing current, to another device, such as a limit switch, to power the device. The device is then grounded on the other side. The most often used setup is for a sinking input card and a sourcing output card. This allows for the PLC to power other devices such as the warning light or the sound buzzer without the need to add an additional power source to the design.
3.4.3.2 Types Aside from the power options, sinking and sourcing, there are various types of input and output cards that handle different types of data. The three most common are the analog I/O module, the digital I/O module, and the communications interface module. The analog input module reads real time data in the form of voltage differences. This means the analog input is sending different voltage sizes to the PLC that represents a continuous data stream. The PLC takes those different voltages and converts them into a digital package, so in essence, the PLC changes the analog information into a digital form, so the processor can understand the data. This is called an analog to digital converter. The analog output module would be the same process, but in reverse, to send out analog information, which is actually just like a digital to analog converter. In the digital input module, the information coming into the PLC is already in digital form, meaning it is either on or off, so there is no conversion needed at this point. That is the same with the output, the PLC will send either on or off to the outputs. The communication interface module has one job and that is to send and receive information between the PLC CPU and the communication network. This allows for the CPU and other PLCs or computers in remote locations to talk to each other.
17
3.4.4 PLC Types As noted above, there are three modules every PLC has, a CPU, a power supply and at least one I/O module. That is where the similarities end. There are different types of PLCs and numerous manufacturers of PLC. There are two types of PLCs, fixed and modular, and a few assorted sizes to choose from.
3.4.4.1 Fixed PLC
A fixed PLC, also referred to as an integrated or compact PLC, come as a packaged set. This means the manufacturer decides the CPU, the power supply and the I/O modules inside the PLC. All the components are wired together and contained inside a housing. This means that the user must choose from what the manufacturer provides and does not leave any room for flexibility. Some integrated PLCs can attach additional I/O’s together, so it does leave some room for expansion. One plus is that they are out of the package complete and there is no assembly required.
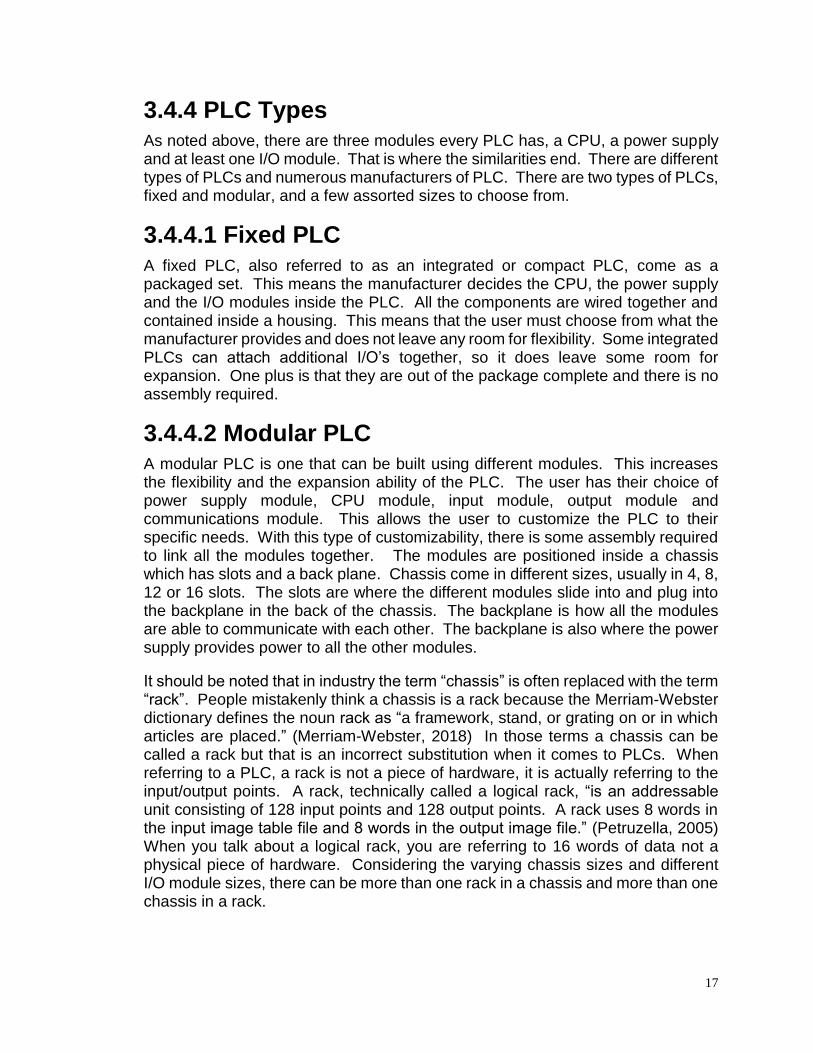
3.4.4.2 Modular PLC A modular PLC is one that can be built using different modules. This increases the flexibility and the expansion ability of the PLC. The user has their choice of power supply module, CPU module, input module, output module and communications module. This allows the user to customize the PLC to their specific needs. With this type of customizability, there is some assembly required to link all the modules together. The modules are positioned inside a chassis which has slots and a back plane. Chassis come in different sizes, usually in 4, 8, 12 or 16 slots. The slots are where the different modules slide into and plug into the backplane in the back of the chassis. The backplane is how all the modules are able to communicate with each other. The backplane is also where the power supply provides power to all the other modules.
It should be noted that in industry the term “chassis” is often replaced with the term “rack”. People mistakenly think a chassis is a rack because the Merriam-Webster dictionary defines the noun rack as “a framework, stand, or grating on or in which articles are placed.” (Merriam-Webster, 2018) In those terms a chassis can be called a rack but that is an incorrect substitution when it comes to PLCs. When referring to a PLC, a rack is not a piece of hardware, it is actually referring to the input/output points. A rack, technically called a logical rack, “is an addressable unit consisting of 128 input points and 128 output points. A rack uses 8 words in the input image table file and 8 words in the output image file.” (Petruzella, 2005) When you talk about a logical rack, you are referring to 16 words of data not a physical piece of hardware. Considering the varying chassis sizes and different I/O module sizes, there can be more than one rack in a chassis and more than one chassis in a rack.
18
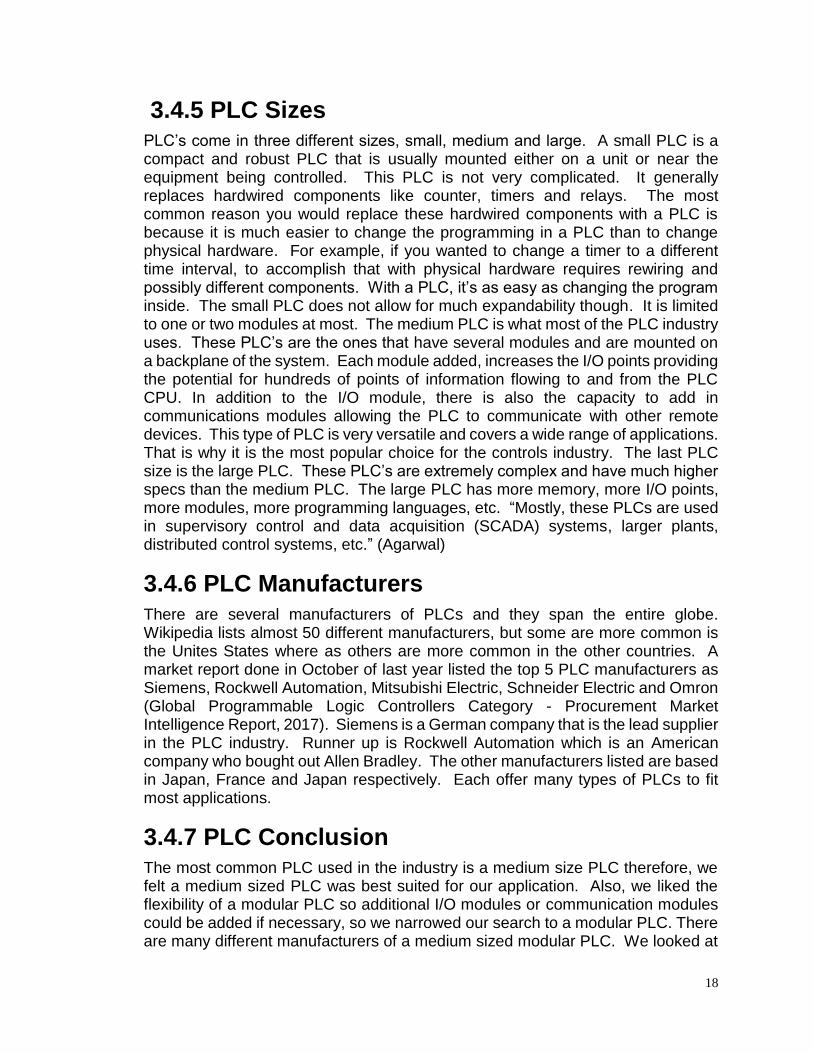
3.4.5 PLC Sizes PLC’s come in three different sizes, small, medium and large. A small PLC is a compact and robust PLC that is usually mounted either on a unit or near the equipment being controlled. This PLC is not very complicated. It generally replaces hardwired components like counter, timers and relays. The most common reason you would replace these hardwired components with a PLC is because it is much easier to change the programming in a PLC than to change physical hardware. For example, if you wanted to change a timer to a different time interval, to accomplish that with physical hardware requires rewiring and possibly different components. With a PLC, it’s as easy as changing the program inside. The small PLC does not allow for much expandability though. It is limited to one or two modules at most. The medium PLC is what most of the PLC industry uses. These PLC’s are the ones that have several modules and are mounted on a backplane of the system. Each module added, increases the I/O points providing the potential for hundreds of points of information flowing to and from the PLC CPU. In addition to the I/O module, there is also the capacity to add in communications modules allowing the PLC to communicate with other remote devices. This type of PLC is very versatile and covers a wide range of applications. That is why it is the most popular choice for the controls industry. The last PLC size is the large PLC. These PLC’s are extremely complex and have much higher specs than the medium PLC. The large PLC has more memory, more I/O points, more modules, more programming languages, etc. “Mostly, these PLCs are used in supervisory control and data acquisition (SCADA) systems, larger plants, distributed control systems, etc.” (Agarwal)
3.4.6 PLC Manufacturers
There are several manufacturers of PLCs and they span the entire globe. Wikipedia lists almost 50 different manufacturers, but some are more common is the Unites States where as others are more common in the other countries. A market report done in October of last year listed the top 5 PLC manufacturers as Siemens, Rockwell Automation, Mitsubishi Electric, Schneider Electric and Omron (Global Programmable Logic Controllers Category - Procurement Market Intelligence Report, 2017). Siemens is a German company that is the lead supplier in the PLC industry. Runner up is Rockwell Automation which is an American company who bought out Allen Bradley. The other manufacturers listed are based in Japan, France and Japan respectively. Each offer many types of PLCs to fit most applications.
3.4.7 PLC Conclusion The most common PLC used in the industry is a medium size PLC therefore, we felt a medium sized PLC was best suited for our application. Also, we liked the flexibility of a modular PLC so additional I/O modules or communication modules could be added if necessary, so we narrowed our search to a modular PLC. There are many different manufacturers of a medium sized modular PLC. We looked at
19
the top 5 PLC companies listed in our research section. We felt using an American based company would be best suited for our project for procurement of parts and the laws regulating the manufacturing of parts would be familiar to us, so we could better guarantee quality of parts. This led us to the only American option, Rockwell Automation (Allen Bradley) as our PLC manufacturer of choice. Rockwell offered many different types of CPU modules, power supply modules, I/O modules and communication modules.
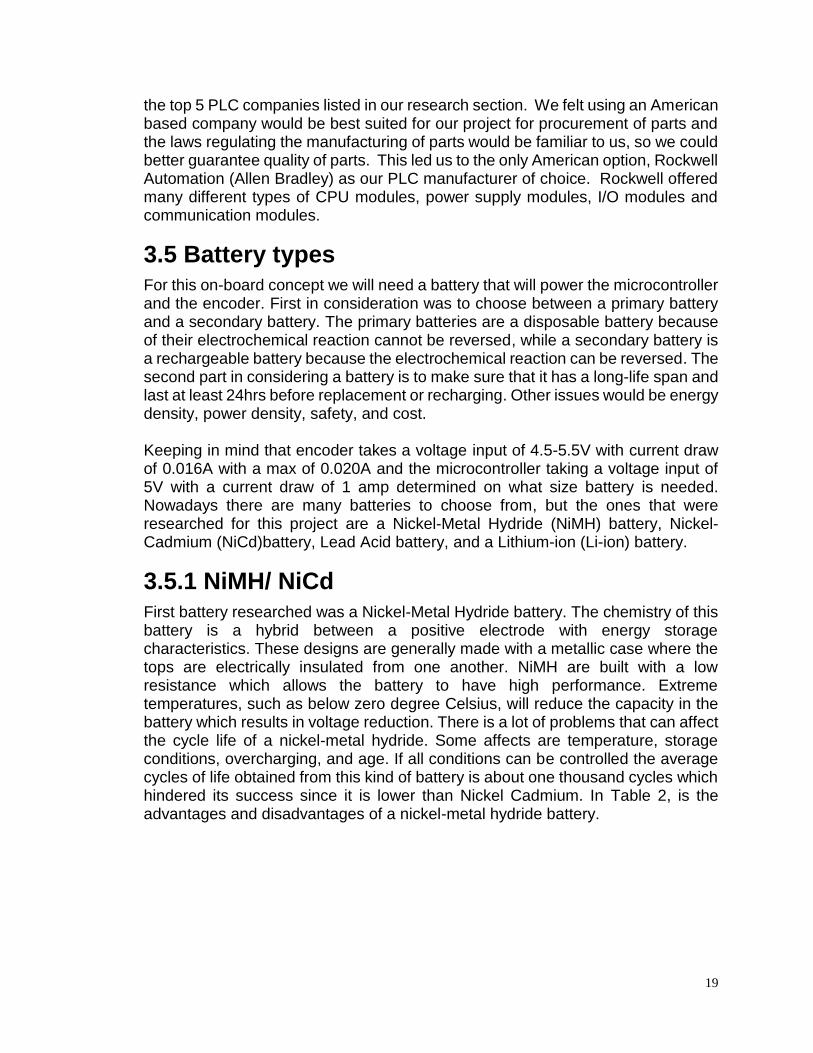
3.5 Battery types For this on-board concept we will need a battery that will power the microcontroller and the encoder. First in consideration was to choose between a primary battery and a secondary battery. The primary batteries are a disposable battery because of their electrochemical reaction cannot be reversed, while a secondary battery is a rechargeable battery because the electrochemical reaction can be reversed. The second part in considering a battery is to make sure that it has a long-life span and last at least 24hrs before replacement or recharging. Other issues would be energy density, power density, safety, and cost. Keeping in mind that encoder takes a voltage input of 4.5-5.5V with current draw of 0.016A with a max of 0.020A and the microcontroller taking a voltage input of 5V with a current draw of 1 amp determined on what size battery is needed. Nowadays there are many batteries to choose from, but the ones that were researched for this project are a Nickel-Metal Hydride (NiMH) battery, Nickel-Cadmium (NiCd)battery, Lead Acid battery, and a Lithium-ion (Li-ion) battery.
3.5.1 NiMH/ NiCd
First battery researched was a Nickel-Metal Hydride battery. The chemistry of this battery is a hybrid between a positive electrode with energy storage characteristics. These designs are generally made with a metallic case where the tops are electrically insulated from one another. NiMH are built with a low resistance which allows the battery to have high performance. Extreme temperatures, such as below zero degree Celsius, will reduce the capacity in the battery which results in voltage reduction. There is a lot of problems that can affect the cycle life of a nickel-metal hydride. Some affects are temperature, storage conditions, overcharging, and age. If all conditions can be controlled the average cycles of life obtained from this kind of battery is about one thousand cycles which hindered its success since it is lower than Nickel Cadmium. In Table 2, is the advantages and disadvantages of a nickel-metal hydride battery.
20
Advantages
Higher capacity than NiCd
Environmental friendly
Large temperature range
Less affected to memory than NiCd
Rejuvenated
Disadvantages
High discharge, lower service life
Does not take overcharge well
Heat produced when fast charging
Efficiency average of about 65%
Table 2: Nickel Cadmium Battery Advantages and Disadvantages
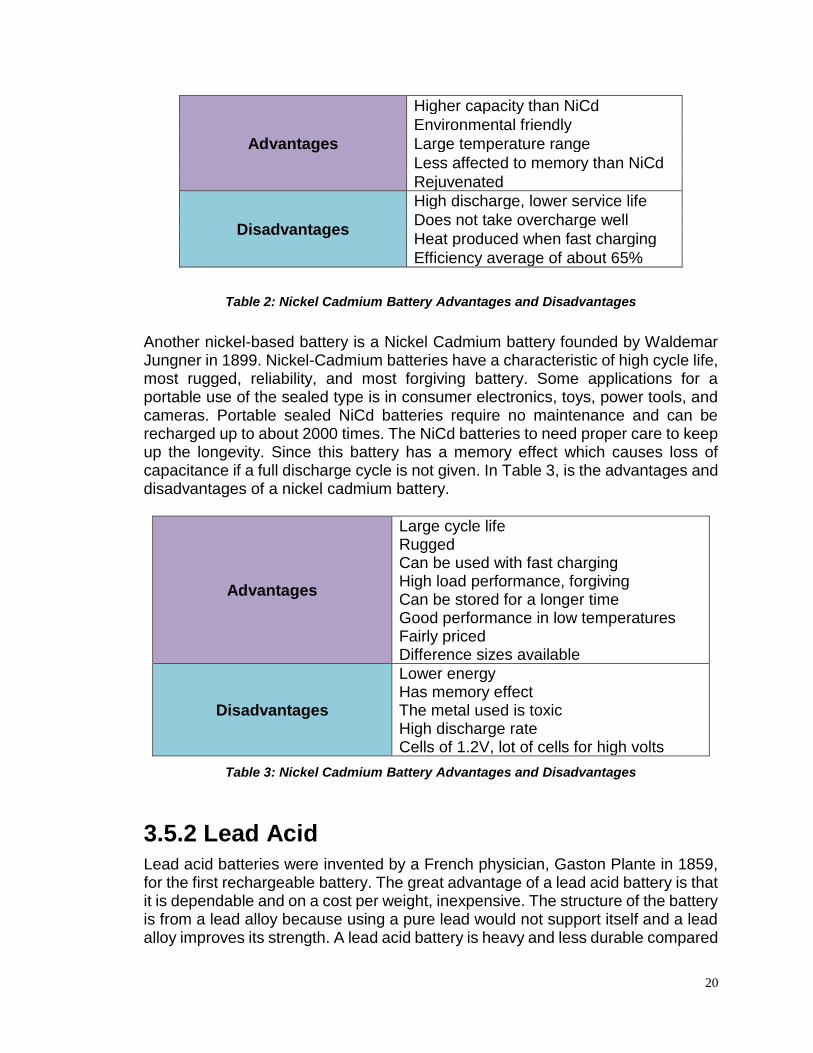
Another nickel-based battery is a Nickel Cadmium battery founded by Waldemar Jungner in 1899. Nickel-Cadmium batteries have a characteristic of high cycle life, most rugged, reliability, and most forgiving battery. Some applications for a portable use of the sealed type is in consumer electronics, toys, power tools, and cameras. Portable sealed NiCd batteries require no maintenance and can be recharged up to about 2000 times. The NiCd batteries to need proper care to keep up the longevity. Since this battery has a memory effect which causes loss of capacitance if a full discharge cycle is not given. In Table 3, is the advantages and disadvantages of a nickel cadmium battery.
Advantages
Large cycle life Rugged Can be used with fast charging High load performance, forgiving Can be stored for a longer time Good performance in low temperatures Fairly priced Difference sizes available
Disadvantages
Lower energy Has memory effect The metal used is toxic High discharge rate Cells of 1.2V, lot of cells for high volts
Table 3: Nickel Cadmium Battery Advantages and Disadvantages
3.5.2 Lead Acid
Lead acid batteries were invented by a French physician, Gaston Plante in 1859, for the first rechargeable battery. The great advantage of a lead acid battery is that it is dependable and on a cost per weight, inexpensive. The structure of the battery is from a lead alloy because using a pure lead would not support itself and a lead alloy improves its strength. A lead acid battery is heavy and less durable compared
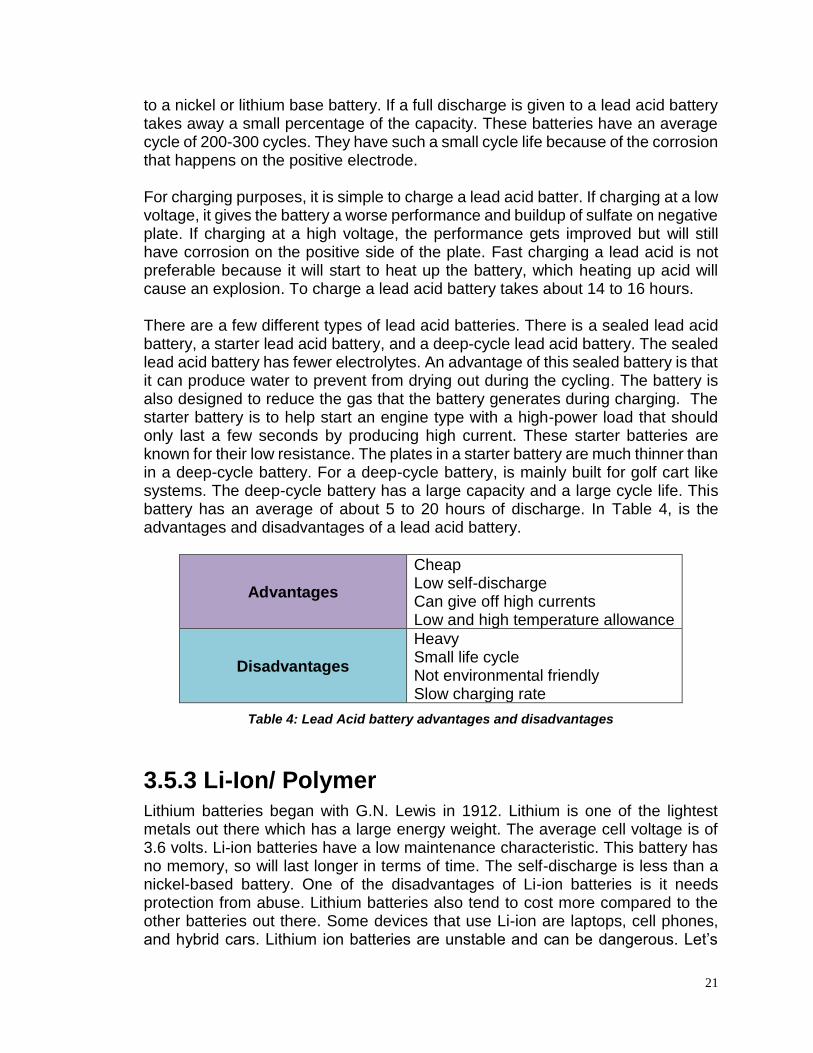
21
to a nickel or lithium base battery. If a full discharge is given to a lead acid battery takes away a small percentage of the capacity. These batteries have an average cycle of 200-300 cycles. They have such a small cycle life because of the corrosion that happens on the positive electrode. For charging purposes, it is simple to charge a lead acid batter. If charging at a low voltage, it gives the battery a worse performance and buildup of sulfate on negative plate. If charging at a high voltage, the performance gets improved but will still have corrosion on the positive side of the plate. Fast charging a lead acid is not preferable because it will start to heat up the battery, which heating up acid will cause an explosion. To charge a lead acid battery takes about 14 to 16 hours. There are a few different types of lead acid batteries. There is a sealed lead acid battery, a starter lead acid battery, and a deep-cycle lead acid battery. The sealed lead acid battery has fewer electrolytes. An advantage of this sealed battery is that it can produce water to prevent from drying out during the cycling. The battery is also designed to reduce the gas that the battery generates during charging. The starter battery is to help start an engine type with a high-power load that should only last a few seconds by producing high current. These starter batteries are known for their low resistance. The plates in a starter battery are much thinner than in a deep-cycle battery. For a deep-cycle battery, is mainly built for golf cart like systems. The deep-cycle battery has a large capacity and a large cycle life. This battery has an average of about 5 to 20 hours of discharge. In Table 4, is the advantages and disadvantages of a lead acid battery.
Advantages
Cheap Low self-discharge Can give off high currents Low and high temperature allowance
Disadvantages
Heavy Small life cycle Not environmental friendly Slow charging rate
Table 4: Lead Acid battery advantages and disadvantages
3.5.3 Li-Ion/ Polymer Lithium batteries began with G.N. Lewis in 1912. Lithium is one of the lightest metals out there which has a large energy weight. The average cell voltage is of 3.6 volts. Li-ion batteries have a low maintenance characteristic. This battery has no memory, so will last longer in terms of time. The self-discharge is less than a nickel-based battery. One of the disadvantages of Li-ion batteries is it needs protection from abuse. Lithium batteries also tend to cost more compared to the other batteries out there. Some devices that use Li-ion are laptops, cell phones, and hybrid cars. Lithium ion batteries are unstable and can be dangerous. Let’s
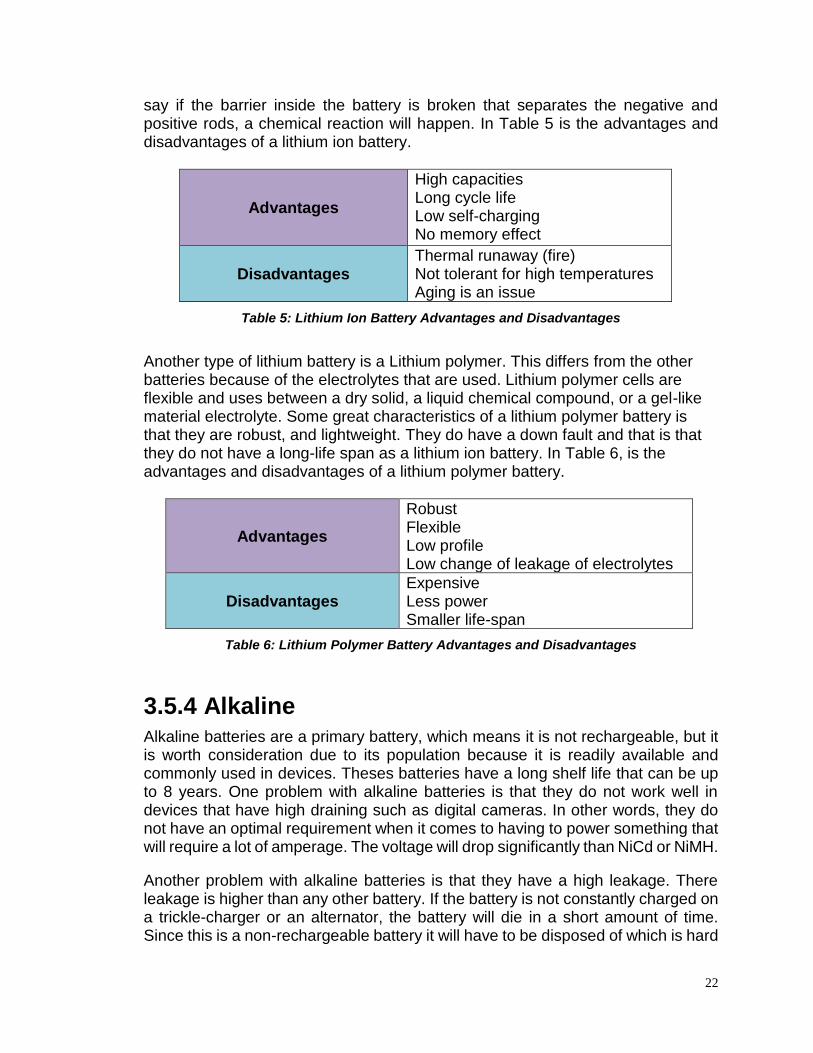
22
say if the barrier inside the battery is broken that separates the negative and positive rods, a chemical reaction will happen. In Table 5 is the advantages and disadvantages of a lithium ion battery.
Advantages
High capacities Long cycle life Low self-charging No memory effect
Disadvantages Thermal runaway (fire) Not tolerant for high temperatures Aging is an issue
Table 5: Lithium Ion Battery Advantages and Disadvantages
Another type of lithium battery is a Lithium polymer. This differs from the other batteries because of the electrolytes that are used. Lithium polymer cells are flexible and uses between a dry solid, a liquid chemical compound, or a gel-like material electrolyte. Some great characteristics of a lithium polymer battery is that they are robust, and lightweight. They do have a down fault and that is that they do not have a long-life span as a lithium ion battery. In Table 6, is the advantages and disadvantages of a lithium polymer battery.
Advantages
Robust Flexible Low profile Low change of leakage of electrolytes
Disadvantages Expensive Less power Smaller life-span
Table 6: Lithium Polymer Battery Advantages and Disadvantages
3.5.4 Alkaline Alkaline batteries are a primary battery, which means it is not rechargeable, but it is worth consideration due to its population because it is readily available and commonly used in devices. Theses batteries have a long shelf life that can be up to 8 years. One problem with alkaline batteries is that they do not work well in devices that have high draining such as digital cameras. In other words, they do not have an optimal requirement when it comes to having to power something that will require a lot of amperage. The voltage will drop significantly than NiCd or NiMH.
Another problem with alkaline batteries is that they have a high leakage. There leakage is higher than any other battery. If the battery is not constantly charged on a trickle-charger or an alternator, the battery will die in a short amount of time. Since this is a non-rechargeable battery it will have to be disposed of which is hard
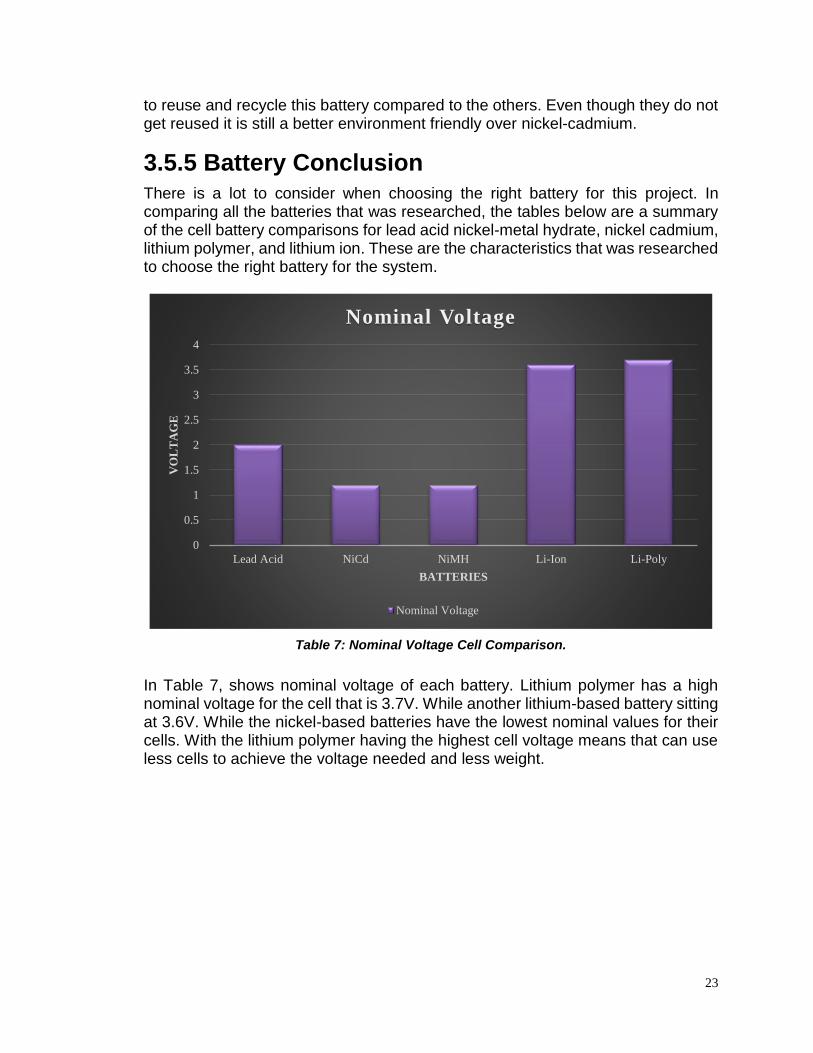
23
to reuse and recycle this battery compared to the others. Even though they do not get reused it is still a better environment friendly over nickel-cadmium.
3.5.5 Battery Conclusion There is a lot to consider when choosing the right battery for this project. In comparing all the batteries that was researched, the tables below are a summary of the cell battery comparisons for lead acid nickel-metal hydrate, nickel cadmium, lithium polymer, and lithium ion. These are the characteristics that was researched to choose the right battery for the system.
Table 7: Nominal Voltage Cell Comparison.
In Table 7, shows nominal voltage of each battery. Lithium polymer has a high nominal voltage for the cell that is 3.7V. While another lithium-based battery sitting at 3.6V. While the nickel-based batteries have the lowest nominal values for their cells. With the lithium polymer having the highest cell voltage means that can use less cells to achieve the voltage needed and less weight.
0
0.5
1
1.5
2
2.5
3
3.5
4
Lead Acid NiCd NiMH Li-Ion Li-Poly
VO
LT
AG
E
BATTERIES
Nominal Voltage
Nominal Voltage
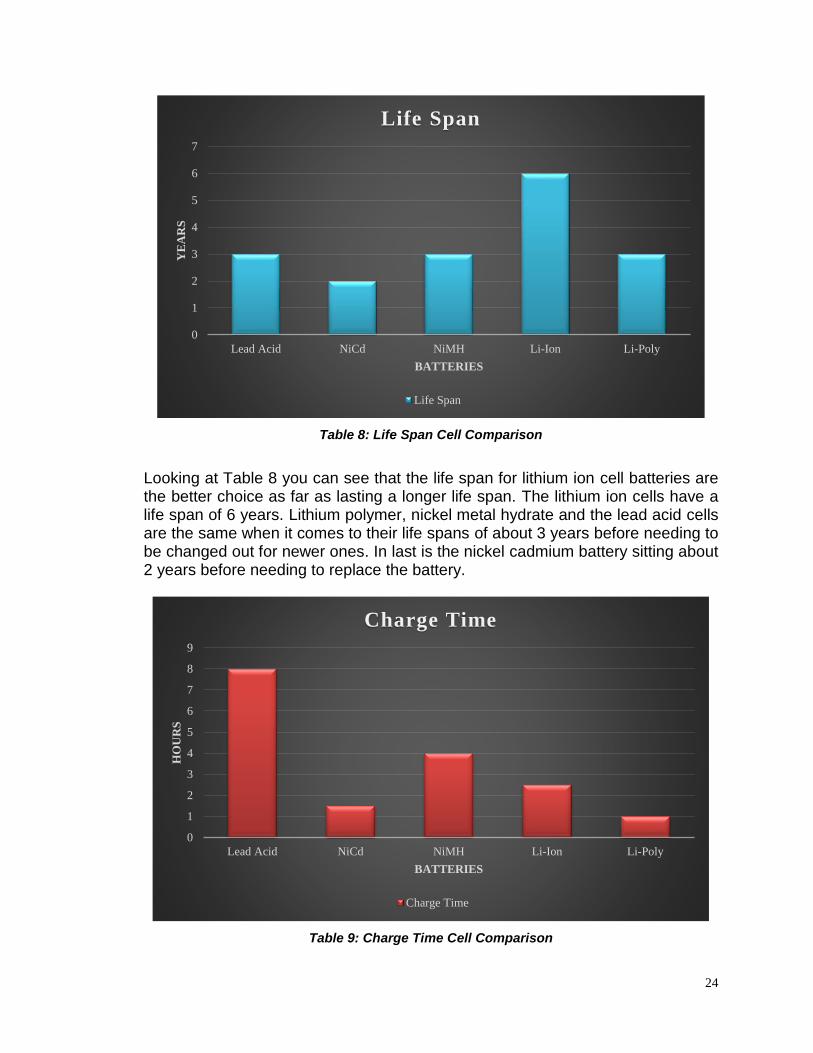
24
Table 8: Life Span Cell Comparison
Looking at Table 8 you can see that the life span for lithium ion cell batteries are the better choice as far as lasting a longer life span. The lithium ion cells have a life span of 6 years. Lithium polymer, nickel metal hydrate and the lead acid cells are the same when it comes to their life spans of about 3 years before needing to be changed out for newer ones. In last is the nickel cadmium battery sitting about 2 years before needing to replace the battery.
Table 9: Charge Time Cell Comparison
0
1
2
3
4
5
6
7
Lead Acid NiCd NiMH Li-Ion Li-Poly
YE
AR
S
BATTERIES
Life Span
Life Span
0
1
2
3
4
5
6
7
8
9
Lead Acid NiCd NiMH Li-Ion Li-Poly
HO
UR
S
BATTERIES
Charge Time
Charge Time
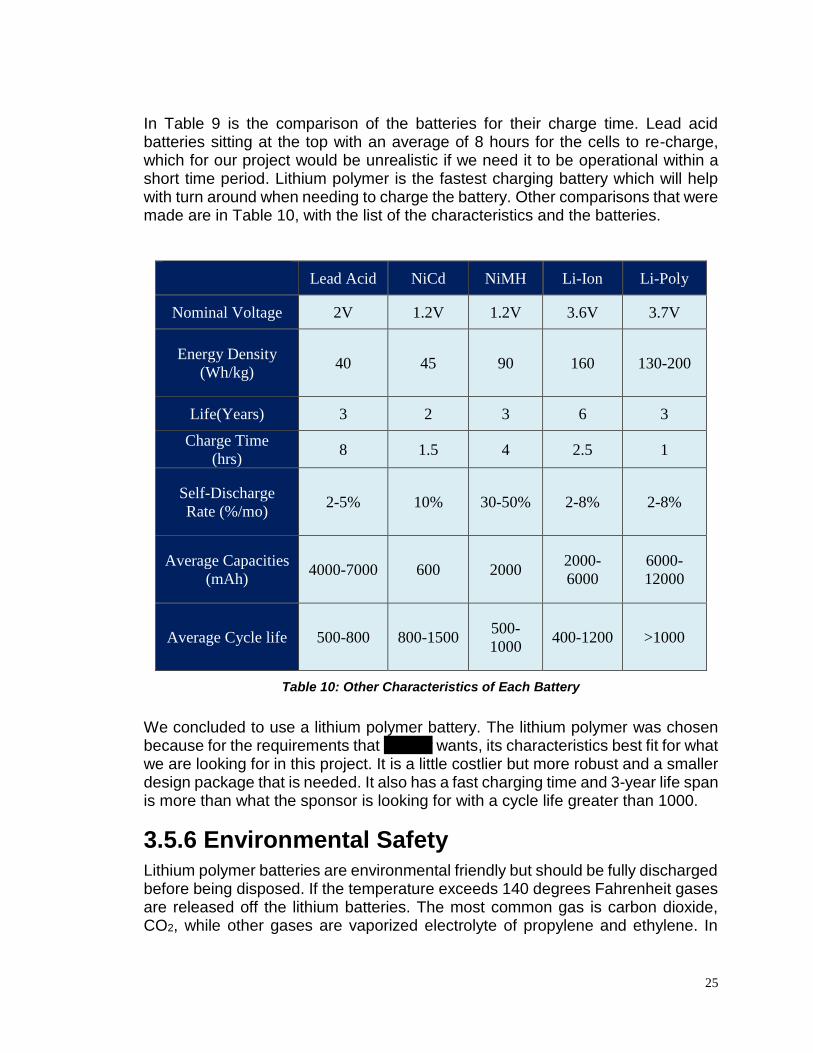
25
In Table 9 is the comparison of the batteries for their charge time. Lead acid batteries sitting at the top with an average of 8 hours for the cells to re-charge, which for our project would be unrealistic if we need it to be operational within a short time period. Lithium polymer is the fastest charging battery which will help with turn around when needing to charge the battery. Other comparisons that were made are in Table 10, with the list of the characteristics and the batteries.
Lead Acid NiCd NiMH Li-Ion Li-Poly
Nominal Voltage 2V 1.2V 1.2V 3.6V 3.7V
Energy Density
(Wh/kg) 40 45 90 160 130-200
Life(Years) 3 2 3 6 3
Charge Time
(hrs) 8 1.5 4 2.5 1
Self-Discharge
Rate (%/mo) 2-5% 10% 30-50% 2-8% 2-8%
Average Capacities
(mAh) 4000-7000 600 2000
2000-
6000
6000-
12000
Average Cycle life 500-800 800-1500 500-
1000 400-1200 >1000
Table 10: Other Characteristics of Each Battery
We concluded to use a lithium polymer battery. The lithium polymer was chosen because for the requirements that Disney wants, its characteristics best fit for what we are looking for in this project. It is a little costlier but more robust and a smaller design package that is needed. It also has a fast charging time and 3-year life span is more than what the sponsor is looking for with a cycle life greater than 1000.
3.5.6 Environmental Safety Lithium polymer batteries are environmental friendly but should be fully discharged before being disposed. If the temperature exceeds 140 degrees Fahrenheit gases are released off the lithium batteries. The most common gas is carbon dioxide, CO2, while other gases are vaporized electrolyte of propylene and ethylene. In
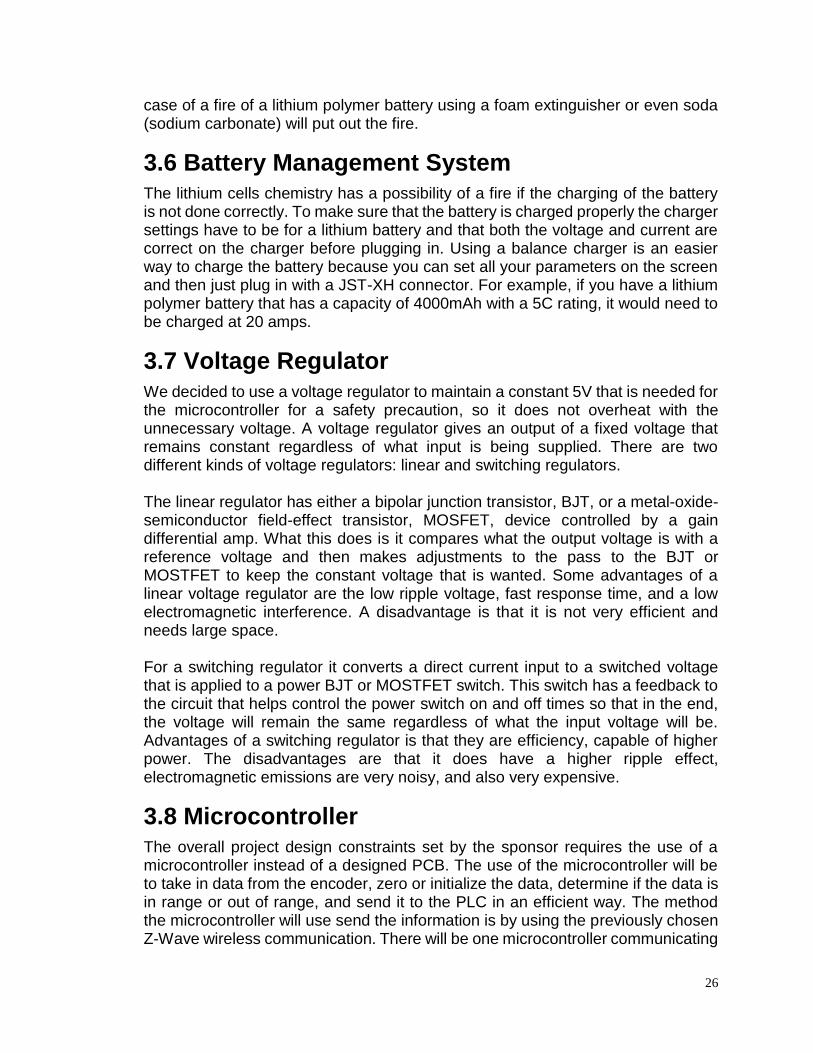
26
case of a fire of a lithium polymer battery using a foam extinguisher or even soda (sodium carbonate) will put out the fire.
3.6 Battery Management System The lithium cells chemistry has a possibility of a fire if the charging of the battery is not done correctly. To make sure that the battery is charged properly the charger settings have to be for a lithium battery and that both the voltage and current are correct on the charger before plugging in. Using a balance charger is an easier way to charge the battery because you can set all your parameters on the screen and then just plug in with a JST-XH connector. For example, if you have a lithium polymer battery that has a capacity of 4000mAh with a 5C rating, it would need to be charged at 20 amps.
3.7 Voltage Regulator
We decided to use a voltage regulator to maintain a constant 5V that is needed for the microcontroller for a safety precaution, so it does not overheat with the unnecessary voltage. A voltage regulator gives an output of a fixed voltage that remains constant regardless of what input is being supplied. There are two different kinds of voltage regulators: linear and switching regulators. The linear regulator has either a bipolar junction transistor, BJT, or a metal-oxide-semiconductor field-effect transistor, MOSFET, device controlled by a gain differential amp. What this does is it compares what the output voltage is with a reference voltage and then makes adjustments to the pass to the BJT or MOSTFET to keep the constant voltage that is wanted. Some advantages of a linear voltage regulator are the low ripple voltage, fast response time, and a low electromagnetic interference. A disadvantage is that it is not very efficient and needs large space. For a switching regulator it converts a direct current input to a switched voltage that is applied to a power BJT or MOSTFET switch. This switch has a feedback to the circuit that helps control the power switch on and off times so that in the end, the voltage will remain the same regardless of what the input voltage will be. Advantages of a switching regulator is that they are efficiency, capable of higher power. The disadvantages are that it does have a higher ripple effect, electromagnetic emissions are very noisy, and also very expensive.
3.8 Microcontroller The overall project design constraints set by the sponsor requires the use of a microcontroller instead of a designed PCB. The use of the microcontroller will be to take in data from the encoder, zero or initialize the data, determine if the data is in range or out of range, and send it to the PLC in an efficient way. The method the microcontroller will use send the information is by using the previously chosen Z-Wave wireless communication. There will be one microcontroller communicating
27
to a second microcontroller wirelessly to send the data to the PLC. The microcontrollers will need to be of the same make and model for parallelization purposes to make the communication and interoperability between the two efficient. The microcontrollers being considered are the MSP430G2, Arduino Uno, Arduino Mega, and Raspberry Pi. Another part of the design that is taken into consideration when deciding on the microcontroller to use is the peripherals that are to be attached to send the data.
3.8.1 MSP430G2 The Texas Instruments MSP430G2 series microcontroller is the simplest one on the list of considered microcontrollers. The simplicity of its design and any design using it is an advantage because it keeps power usage low, programs small in memory size, and has small dimensions to easily fit into smaller overall designs. The disadvantages are that the programs loaded to it cannot be too complex because of the limited flash memory and RAM and it does not have any available modules that are capable of using the Z-Wave method of wireless communication. Overall, the MSP430G2 did not meet the requirements of the project despite the familiarity of the device.
3.8.2 Arduino Mega
The next possible microcontroller that could be used by the project is an Arduino Mega 2560. The Mega is a relatively large microcontroller that has 54 digital input/output pins and 16 analog inputs totaling 70 input pins. The advantage to this is that if the microprocessor on the controller can handle that many inputs it can handle the processing required to wirelessly transmit data. Another advantage, due to the size of the board, is that there’s plenty of storage in the flash memory and RAM to implement the code that will be necessary to achieve the results needed by the microcontroller. The disadvantages of the Mega are that there will be multiple unused pins that are openings that could accumulate moisture, the power use of the Mega will be high relative to the other devices being considered, and the footprint of the device is much larger than the others being considered. In conclusion, the Arduino Mega can meet the requirements needed by the project but it will consume too much power to be considered as viable.
3.8.3 Arduino Uno The Arduino Uno is a smaller version of the aforementioned Arduino Mega 2560. Instead of 70 total input pins, there are instead 20 input pins on the Uno. The Uno having less input pins means there will be less unused pins to accumulate humidity and moisture from the air. Since the Uno is smaller than the Mega, it requires less power to operate which gives the Uno an advantage over the Mega. The downsides to the Uno is even though it has less pins that will be unused, the possibility of moisture accumulation still exists inside of the pinholes on the board. The advantages of the Uno come from it being a compact version of the Arduino

28
Mega. In summary, it’s better than the MSP430G2 and Mega but it still has a disadvantage that could cause premature failure in the device.
3.8.4 Raspberry Pi The final microcontroller that was compared to decide which one to use for the project was the Raspberry Pi 2 Model B. This microcontroller was chosen for comparison because it is Arduino’s strongest competitor in being a project microcontroller for hobbyists. Unlike Arduino boards, the pins on the Raspberry Pi 2 are all male instead of female. This provides an advantage to moisture accumulation because not only does it allow one to see if there is water building up on the pins, but it allows the pins to dry off on their own if sufficient airflow is provided. Another advantage to male pins is that they are easily covered with female pin protectors that can be added and removed as needed. The disadvantage of the Raspberry Pi 2 is that because of all of the different applications it can be used for it requires more power than the Arduino Uno to operate. The Raspberry Pi 2 Model B is the microcontroller that meets the most requirements provided by the project compared to the others listed above.
3.8.5 Peripherals
The peripherals that come with the microcontroller or can be attached must be able to wirelessly communicate data using the Z-Wave specification stated previously. This requirement for a peripheral is what will decide what microcontroller to use for the project. After research, the only peripheral that was found was a Z-Wave module that can attach to and operate only with the Raspberry Pi boards.
3.9 IDE Comparison An IDE, Integrated development environment, is essential to how a programming language gets developed in to useable software. An IDE should be chosen before choosing a specific language to code in because some IDE’s do not support all programming languages, or certain languages perform better in one IDE but not another. The IDE’s being compared for use in the project are CodeBlocks, Eclipse, and Qt Creator IDE. The advantages and disadvantages of each will be considered in the following sections to determine which one will be chosen for use in the project.
3.9.1 CodeBlocks
CodeBlocks was chosen as a possible IDE due to a majority of UCF faculty use it to teach programming and it also comes pre-installed on most of the computers on UCF campus. This immediate familiarity of the IDE provides the advantage of knowledge of how to use it and what it is capable of doing. Another set of advantages are that CodeBlocks is open-source, free, and cross-platform compatible which means using it can cut down on the cost of software needing to be bought for the project. The last advantage is because it is an open-source

29
program which means plugins can be installed for CodeBlocks to support other programming languages. This leads in to the disadvantage that without the plugins the IDE primarily deals with C++. Another disadvantage to using CodeBlocks is the non-interoperability of the software between the IDE and the microcontroller.
3.9.2 Eclipse The next IDE is called Eclipse and it is widely used as a Java IDE and is primarily used for developing Java applications. The other languages it can develop in are C, C++, C#, JavaScript, Perl, PHP, Python, and Ruby which are all well-known languages. Development environments that Eclipse comes with are JDT (Java Development Tools) for Java and Scala, CDT (C Development tools) for C/C++, and PDT (PHP Development tools) for PHP. The biggest advantage to Eclipse as an IDE is the ability to use most of the known high-level languages to code the software. Eclipse also has the advantage of being interoperable on multiple platforms including rich client platforms, server platforms, web tools platforms, and modeling platforms. A disadvantage of Eclipse is that it needs plugins to be able to support programming languages outside of Java and C. A slight disadvantage is that the latest version is a year old compared to CodeBlocks’ latest version which is only four months old.
3.9.3 Qt Creator IDE
The Qt Creator IDE was found through referencing the IDEs compatible with Raspberry Pi software development. Qt is a cross-platform IDE that primarily uses C++, JavaScript, and QML to program software. Qt includes a visual debugger, syntax highlighting, and auto completion and all of these are advantages to using this IDE over the other two being considered. Qt Creator also includes a project manager that can use a variety of project formats. This allows the programmer to separate functions of the project and integrate them later after their proved to work individually. Qt also released its newest stable released version in March 2018, so this is the most up-to-date IDE being considered. The disadvantage to Qt is that the only available languages to code in are C++, JavaScript, and QML. In conclusion after researching and comparing the three IDEs, the one being used for the project is the Qt Creator IDE.
3.10 Programming Language Comparison One thing that needs to be considered is the programming language that will be used to program the microcontroller. The usefulness of programming the microcontroller comes from being able to modify the incoming and outgoing data. The reason why the modification of data would happen is to make the PLC more efficient in determining the outputs of certain data ranges. The languages that will be considered based on knowledgeability are C/C++, python, and java. These languages were compared to determine the advantages and disadvantages of each. The following sections are the different languages that were compared to decide which one will be used for this project.

30
3.10.1 Java Java is a concurrent, class-based, and object-oriented programming language. The IDEs that use java as a main programming language tend to be too large to load on to the Raspberry Pi boards. The boards do have pre-loaded libraries or the ability to download the libraries in case that the board does not have them. The usefulness of using Java as a programming language for the project is that it is a WORA, Write once run anywhere, language. This means that as long as the code that is developed works on the platform that the Raspberry Pi boards provide, then the code can be ported over to a different platform. The downside of the language the size of the IDEs and libraries to make sure that it can be ported from system to system. Another advantage to Java is that it is a common programming language, so the available reference code packages are immeasurable.
3.10.2 C/ C++
C/C++ are the most established programming languages used in modern day software building. C is a general-purpose programming language and C++ is its object-oriented counterpart. C/C++ doesn’t come built-in for use on the Raspberry Pi boards but can easily be implemented by using the light-weight, in terms of memory size, Qt Creator IDE. These languages are preferred for use due to familiarity and the expansive set of function libraries to use for coding.
3.10.3 Python Python is an interpreted high-level programming language that is used mainly for general purpose programming. Python is also the standard programming language loaded to Raspberry Pi boards. The language was designed to emphasize code readability and have an extensive standard library. Python was designed with simplicity in mind and the only disadvantage to using this language is unfamiliarity with structure. Overall, python will be used to program the Raspberry Pi boards specified functions for the project.
3.11 Zero Button
A zeroing button was desired for our project as per sponsor recommendation. The button will provide the microcontroller the means to know when the encoder and test object are in their initial position. The button will feed a high value to an input pin on the microcontroller which will then initialize the data being fed to the microcontroller. A simple push-button switch was chosen for the project to meet the requirements specified by the sponsor.
3.12 Robust Design The need for robust design for our project is due to the certain weather conditions that our project will experience. The weather conditions that the projects design needs to mitigate are rain, humidity, and temperatures that can reach 100 degrees
31
Fahrenheit. Other weather conditions such as lightning, high wind gusts, and low temperatures are non-factors in the design of the project and should not be considered when creating mitigating factors for the robust design. Rain will be mitigated by finding an enclosure for the project that has a NEMA rating that meets requirements. The next factor is humidity and that will be handled by either silica packets that absorb moisture. Another method that will be considered for dealing with humidity and temperature inside of the enclosure is to determine if a particular enclosure with vents, that will have filters that absorb humidity and block dirt and dust, will meet the requirements of robustness of the project. The other consideration of temperature to the robustness of the project was to choose components that have a relatively high tolerance to temperature compared to Florida temperatures. Research in weatherproof enclosures and dehumidification processes was done in that respective order.
3.12.1 Waterproof Enclosure The process for finding a weatherproof enclosure started off by knowing what NEMA enclosure type and IP rating we would need for the project. NEMA, National Electrical Manufacturers Association, defines the standards used in North America for different grades of enclosures used in industrial applications. Any NEMA enclosure type protects against personal access to hazardous parts. Along with the protection from hazardous parts, each NEMA enclosure type is a different designated environmental condition. These conditions range from, but are not limited to, general-purpose, drip-tight, weather-resistant, watertight, dust-tight, and submersible. Out of these conditions the two that were the most suitable to the project was weather-resistant or watertight. The respective types for these are type 3 and type 4 NEMA enclosure types. Type 3 NEMA enclosures are weather-resistant that also protect against falling dirt and windblown dust. Type 3 also protects against rain, sleet, and snow and undamaged by ice formation. Type 4 means the enclosure is watertight and it has a sub-type of 4X which adds corrosion resistance to the enclosure. NEMA Type 4 was determined the rating that would be necessary for the enclosure for the project’s different components that need protection. The other type of rating to consider is the IP Code, or International Protection Marking, which classifies and rates the degree of protection provided against intrusion, dust, accidental contact, and water by mechanical casings and electrical enclosures. The reasons why the IP code of the casing was taken in to account when choosing a specific weatherproof enclosure is because it is a standard used on the international level and it provides additional information as to what the enclosure protects against. The standard that is used is the IEC, International Electrotechnical Commission, standard 60529 which makes manufacturers using it provide detailed information about the ratings, protections, and testing procedures used to determine what the enclosure protects against. The IP Code has a two-digit rating and the first digit determines the solid particle protection of the enclosure and the second digit determines the liquid protection of

32
the enclosure. The first digit of the IP Code rating goes from 0 to 6, but 5 and 6 are the only ratings that protect against dust entering the enclosure. First digit rating level 5 is considered to be dust protected which means that the enclosure will at let in a level of dust that won’t interfere with the operation of the equipment on the inside, but for the project this is a little less than satisfactory. The rating level 6 is considered to be dust tight based off of 8 hours of test time with air flow, so an IP code rating of at least IP 6x is what would be attained for the project. The second digit of the IP Code ranges of 0 to 9K. Rating 0 means there is no protection against liquid introduction in the enclosure and 9K is protection against powerful high temperature jets. Ratings 7 and 8 are for immersion which are unnecessary for the project, since the project will not be immersed in water for any of the testing procedures. Rating level 1 is protection against dripping water, 2 is protection from dripping water when the enclosure is tilted 15 degrees in four different directions, 3 is protection for spraying water, 4 is protection from splashing water, 5 is protection from water jets, and 6 is protection from powerful water jets. The ratings 1, 2, and 3 do not meet the requirements given to use for the project, so the ratings considered were 4, 5, and 6. IP Code 64 barely meets the minimum requirements for the project because even though it is dust tight, it only protects against splashing water which was only tested for 10 minutes based on the standard the IP Code uses. IP Code 65 meets the recommendations because it is dust tight and protects against water jets and tested for a long enough duration to simulate heavy rain for 15 minutes. Even though IP Code 65 meets the needs for the project, what was decided is to get equipment that exceeds what was required for the project to insure robustness of our design. IP Code 66 is the rating that was decided to be necessary for the project based on using a necessarily excessive robust weatherproof enclosure. The next step in procuring the necessary weatherproof enclosure is to decide between three types of weatherproof enclosures. The three types of enclosures are completely enclosed, vented, or windowed. These three provide the capability of having outlets on the inside of the enclosures in the case that power is provided to the enclosure. Due to the decision to provide power to our components using a battery the outlets in the enclosure would be redundant and unnecessary. A completely enclosed weatherproof enclosure provides the full protections that come from the NEMA rating and IP Code that were chosen to meet the needs of the project. The downside of a completely enclosed one is that there is no way to check on the equipment inside without opening the enclosure. This presents a safety issue with our project because if the components fail for any unknown reason there will be no way to check inside for harmful chemicals before exposing maintenance personnel to an unknown danger. This reason alone means a completely enclosed weatherproof enclosure is not going to be considered for the project design. The vented enclosure provides the same advantages and disadvantages as a completely enclosed one with the only difference of less protection against humidity and liquids due to the openings of the vents. The unknown hazard issue and humidity/liquid issue cause too many safety and
33
equipment issues that a vented enclosure was not considered for the project. Process of elimination brought the project to having a windowed weatherproof enclosure. The windowed enclosure mitigates the hazard issue of the completely enclosed enclosure of unknown hardware failure. The windowed enclosure provides a way for an individual fixing the project to physically see if the project failed in a way that is safe to attempt to repair. In summary, the chosen IP66 rated and NEMA type 4 weatherproof enclosure will be windowed.
3.12.2 Dehumidifier The robustness of the overall design of the project is not just determined by the general protection from the outside environment. The robustness is also highly dependent on the mitigation of the humidity our project will be subject to due to the setting of where the project will be tested. Florida is known to have high humidity levels throughout the year and the project design constraints set by our sponsors require it to operate in this particular set of humidity levels. The project has electrical hardware components that can have their lifespan shortened by the humidity. This section will focus on two ways to mitigate this humidity through dehumidifying through either silica packets or filters on, or in, the enclosure.
3.12.2.1 Silica Packets
One of the methods considered for handling the humidity inside the enclosure was putting silica packets inside of the enclosure to absorb moisture. Silica packets come in different sizes based on total silica gel mass. The masses range from 1 gram to 120 grams and the volumes that they can dehumidify range from 120 cubic inches to 8 cubic feet respectively. The design constraint the project has that was given was the components on-board should be able to fit in a 12-inch cube. The design constraint means the enclosure’s volume cannot exceed 1 cubic foot or 1728 cubic inches. Matching up the volume restriction to the silica packets’ dehumidifying volume restriction, the largest mass silica packet that would be needed for the project is 30-gram packets that are good for a 2 cubic feet volume. The next consideration with silica packets is to know when they are saturated and need to be changed. There are two possible methods to determine if the packets need to be changed. One method is finding a manufacturer that provides silica packets that change color as they saturate. The second method is using an indicator strip that changes colors as the humidity percentage rises inside of the enclosure. The first method has the advantage of being an all-in-one design packet that will change colors when it is saturated by the humidity. The disadvantages to this method is that they are costly and has questionable accuracy. The second method of using an indicator strip has the advantages of being cheap and accurate. The downside to the method is that it is one more piece to change out when switching out the silica packets. In the end, the humidity indicator strips were decided to be used for the project. The humidity indicator strips will detect humidity ranges from 10% to 60% with clear color changes in between. The project’s electrical components require the weatherproof enclosure to be in a humidity range
34
of 30% or below for nominal operation and to achieve an acceptable lifespan from the components.
3.12.2.2 Filters The other method considered to mitigate the issue of humidity inside of the weatherproof enclosure is by using filters that not only block dust but absorb moisture. The filters would use the natural airflow of the enclosure to block dust and absorb humidity to a certain point. The filters would need to be changed on a regular basis, much like air filters in most households. The advantages and disadvantages were not even considered with this method because it requires a vented weatherproof enclosure to be properly utilized. The weatherproof enclosure that was decided for use on the project was windowed and not vented.
3.13 PCB Design
ABET requirements for the project desired a PCB, Printed Circuit Board, design be created. The use of a PCB in the project will be to create a device that will be a control system for the test object and a display for the inputs and outputs of the system. for the large-scale project. The design needed a suitable program to create the circuit and a board manufacturer to build the required circuit board. These were chosen based on comparison on what they offered and familiarity. The programs are decided on first because the files that they correct will be sent to the manufacturers after the circuit design is created.
3.13.1 Programs The circuit design programs that were compared for use in the PCB design are MultiSim and Eagle CAD. The important factors from both of these programs is that they provide the ability to create a BOM, Bill of Materials, file and have the ability to create a file to send to a manufacturer. MultiSim is program used by a majority of UCF faculty to teach students circuit design in classes such as electronics 1 and electronics 2. This provides MultiSim with the advantages of it being a program that most electrical engineering students know how to use, but also being readily available for circuit design while using computers on the UCF campus. Another advantage to MultiSim is that the program has an expansive library on useable circuit components. The library includes not only virtual components with customizable values, but real components from multiple different manufacturers. A disadvantage of the program is that if there is a need to use it at home the program has to be purchased for use first. Another disadvantage is that when the circuit design needs to be sent to a manufacturer the file containing the design needs to be converted to a different format before it is sent. The previous disadvantage could possibly lead to the file or design being either corrupt or inaccurate compared to the original circuit design file. The other program, Eagle CAD, is a scriptable electronic design automation (EDA) application with schematic capture, PCB layout, auto-router, and
35
computer-aided manufacturing (CAM). Eagle has the same advantage as MultiSim with having a large library of components to create from a circuit. An advantage Eagle has over MultiSim is the ability to acquire the program for home use. The company that created Eagle allows students to use their software for free as long as a valid student email address is used. Another advantage is that Eagle can save a circuit design directly in to a file that can be sent to a manufacturer. One downside to Eagle is that it is an unfamiliar program, so there is a time constraint with having to learn how to use the program and make the files necessary for circuit design. In summary, after comparing Eagle CAD and MultiSim the desired PCB design software was decided to be Eagle CAD. This decision was made because it was an unknown program that could easily be learned, and the files created by it can be easily ported to a PCB manufacturer.
3.13.2 Board Manufacturers The next most important aspect of PCB design is choosing a manufacturer to print the circuit board to which the desired components will be mounted. There are three manufacturers that were taken in to consideration to make the PCB for the test object’s control system and display device. The manufacturers are PCBWay, JLC PCB, and OSH Park. These three were chosen for because of cost, availability, and shipping time. PCBWay and JLC PCB are Chinese PCB manufacturing companies which keeps costs low for customers but affects shipping time negatively. OSH Park was chosen as the PCB manufacturer for the test object’s control system and display device because it is based in the US, relatively low cost for 2 layer and 4 layer boards, and gives the choice of dropping in an Eagle CAD file to send to the manufacturer.
4.0 Related Standards
The general standards that may be used during this project are the National Electrical Code and the UL508C standard (standard for power conversion equipment). The sponsor standards that may be used during this project are the Design Review Standard, the Hazard Analysis Techniques Standard and the Software Engineering and Configuration. Other standards being used are ITU-T G.9959 recommendation for Z-Wave devices, NEMA enclosure rating standard for weatherproof enclosures, and IEC standard 60529 for the IP Code rating for the weatherproof enclosure.
5.0 Project Hardware and Software Design Details For the initial process of the design and implementation will be to design the physical aspect of this system. One of the goals of the AP Project is to present several concepts to our sponsor, Walt Disney World, for further discussions. These concepts had to be working concepts that would meet the initial requirements set forth by the sponsor. This includes, but not limited to, concepts on how to read the angular position and how to give the information to the PLC on the way-side.

36
5.1 Concepts A and B Presented to Disney The AP Project team delivered two working concepts to our sponsor on February 28, 2018. Each concept could be designed to meet all Disney requirements that were set stated in the initial meeting between the team lead, Amber Haley, and the Disney representatives. The two concepts were discussed in a design review meeting format between the AP Project team and the Disney representatives.
5.1.1 General Concept A
This concept uses an encoder attached to the shaft of the test object to read the test object’s linear angular position. Once the angular position is obtained, the encoder feeds that information to an analog to digital converter. Then the converter gives the data to an onboard transmitter. The transmitter sends the data wirelessly to an off-board receiver. Once the data is received, the data will bounce through routers until it reaches its final receiver near the PLC. The final receiver feeds the data into the PLC. In Figure 3 shows a block diagram of concept A’s set-up. Wireless Transmission of Data We are considering using Z-Wave technology that works similarly to IEEE 802.11 standardized routers, but instead use the less frequently used 902-928 MHz ISM bandwidth to transmit data. A reason for doing so is because it will have little to no interference coming from modern devices using the 2.4 Ghz - 5 Ghz ISM bandwidths most of the afore mentioned 802.11 routers use. Another reason to use Z-Wave and it's 900 MHz bandwidth is that because it's a longer wavelength than 2.4 GHz, let alone 5 GHz, it has an extended range of use compared to those two commonly used bandwidths. Power The off-board components are powered by a power supply with an in-line breaker and a voltage regulator. The on-board components are powered by a battery pack which will last about 30 hours before needing recharge. PLC Program The PLC program will take the information received and compare it to the following conditions: 1. Is the test object stuck 2. Is the test object unstuck 3. Is the test object in range 4. Is the test object out of range Once the parameters are set, the program will do one of the following: 1. Nothing 2. Issue a ride stop request 3. Retain the information to compare with the next packet of data received
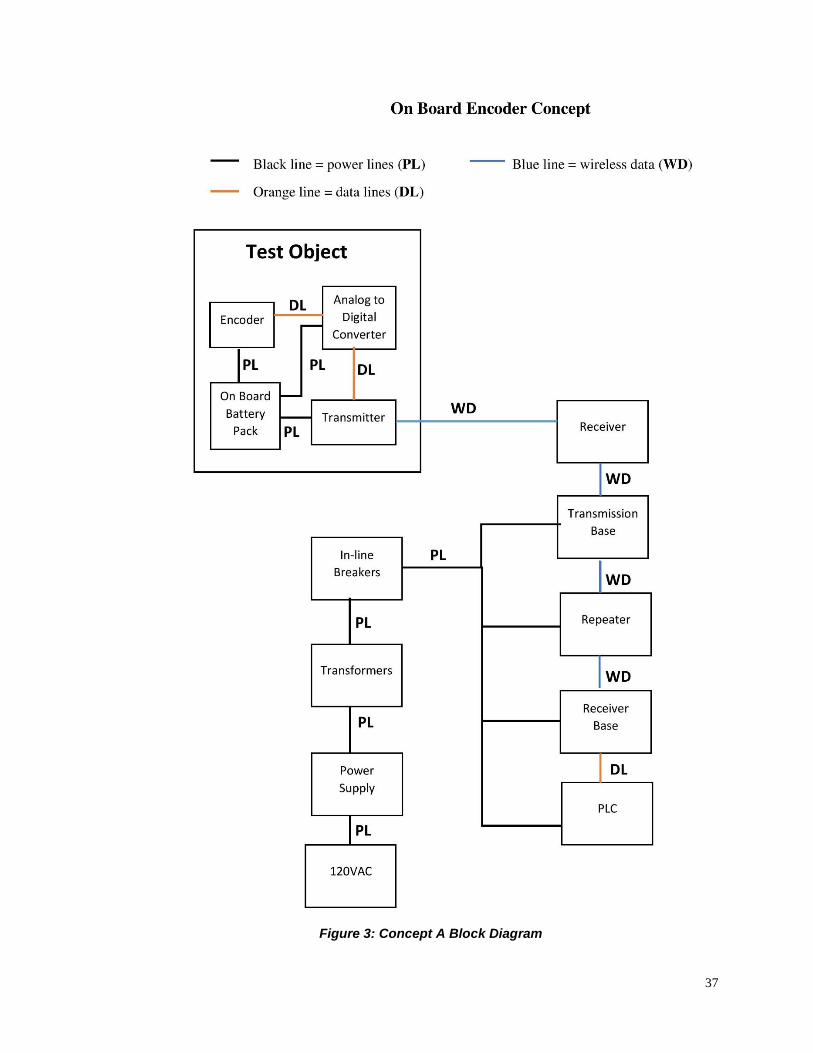
37
Figure 3: Concept A Block Diagram
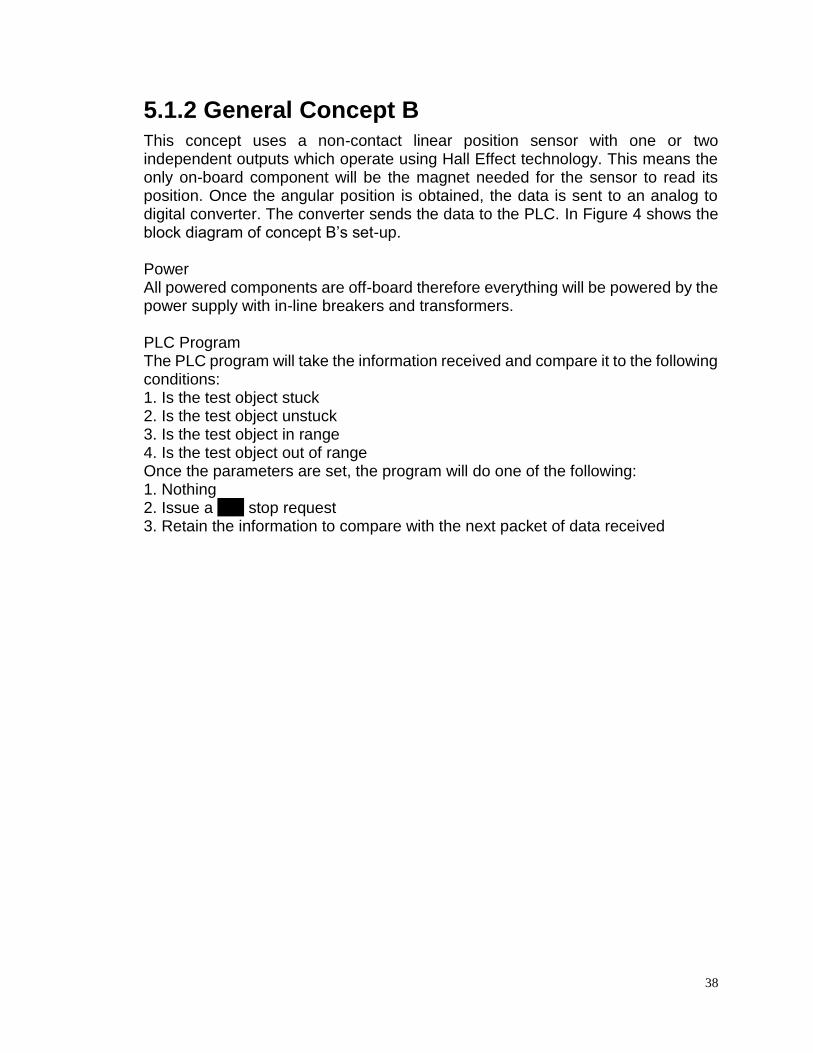
38
5.1.2 General Concept B This concept uses a non-contact linear position sensor with one or two independent outputs which operate using Hall Effect technology. This means the only on-board component will be the magnet needed for the sensor to read its position. Once the angular position is obtained, the data is sent to an analog to digital converter. The converter sends the data to the PLC. In Figure 4 shows the block diagram of concept B’s set-up. Power All powered components are off-board therefore everything will be powered by the power supply with in-line breakers and transformers. PLC Program The PLC program will take the information received and compare it to the following conditions: 1. Is the test object stuck 2. Is the test object unstuck 3. Is the test object in range 4. Is the test object out of range Once the parameters are set, the program will do one of the following: 1. Nothing 2. Issue a ride stop request 3. Retain the information to compare with the next packet of data received
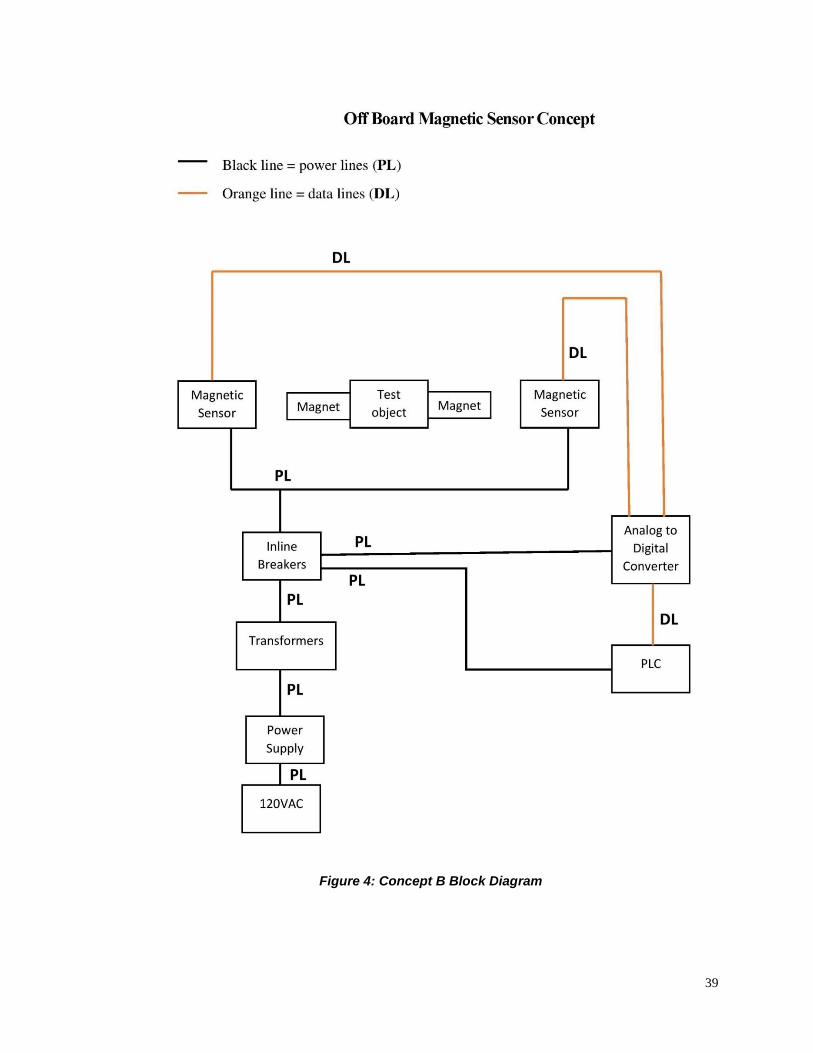
39
Figure 4: Concept B Block Diagram
40
5.1.3 Concept Chosen Conclusion On February 28, 2018, we presented two design concepts to Walt Disney Parks and Resorts Design and Engineering. We have included both design concepts (see concept A and concept B above). The conclusion of our concept design review with our sponsor was to modify the requires as follows. The software was originally going to determine if the test object was in a stuck potion or in a not stuck position. This is no longer a requirement. The sponsor is most interested in the angular position, so the stuck and not stuck information is what we call “a nice to have.” Originally the design team was going to put the test object in motion, possibly around a ride track, to ensure that the signal was being captured along the track side at different polling points. There was going to be 3-4 polling points that attained the angle along the track. Disney is more concerned with ensuring the concept works and therefore stipulated that the test object will be stationary for prototype testing and concept provability. When the original design was presented to the AP Project team, the sponsor asked for angular position of a rotating object but no information on along which axes the test object was rotating. The sponsor clarified that the angular position was to be a 180° linear direction along the x-axis. Originally the requirement was for the angular position to determine if the test object was in range or out of range. This requirement remains but better clarification was given on what is considered in range or out of range. The in-range angles are to be 0°- 60° in both directions and the out of range angles are to be 61° - 90° in both directions. When the concepts were presented, the question of how we can verify the signal with the angular data was sent was asked. Upon deliberation, the sponsor added a requirement of a signal received display. The sponsor also wanted to know how to verify that the angle going into the encoder was the angle coming out of the encoder, basically how to ensure the encoder is not giving false angles. They then added an angular position display as a requirement. The sponsor wanted to ensure that if the test object was in an abnormal operation that the ride stop request issued. This is a safety feature and therefore is extremely important. They added a ride stop request display as a requirement. After discussing both design concepts, the sponsor decided on Concept A, wireless transmission of angular position. They were most interested in transmitting wireless data from on-board a test object to a way-side receiver. Since the test object is to be in a stationary position for testing purposes, the sponsor requested that the extra equipment be removed from the design. Specifically, the transmission base, the repeater and the receiver base. They wanted the receiver to be hardwired directly to the PLC. This design has a battery pack in the on-board enclosure, so the sponsor made a few additional requirements in regard to the battery. A low battery display was added as a requirement. They want to make sure that there is some sort of indication the battery is low for two reasons. It allows them to spot if a battery is going bad and not holding a charge and it also helps with not adding additional work to the maintenance staff if the battery does not need charging yet. The sponsor added
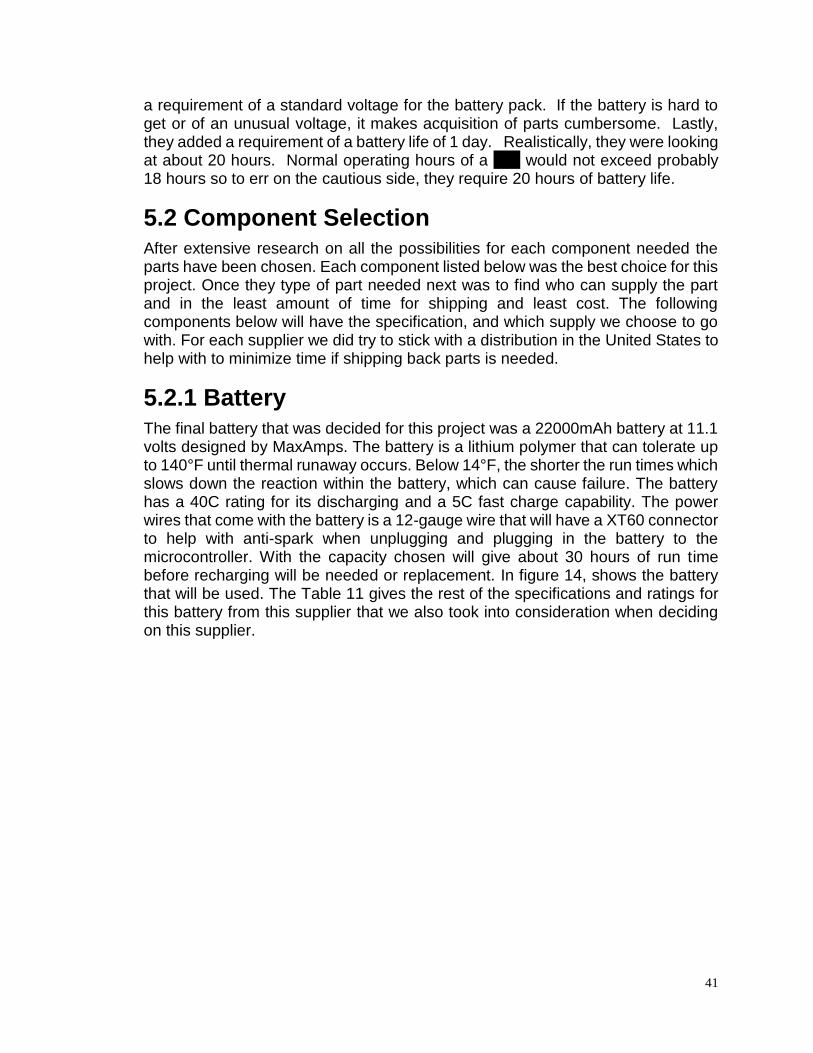
41
a requirement of a standard voltage for the battery pack. If the battery is hard to get or of an unusual voltage, it makes acquisition of parts cumbersome. Lastly, they added a requirement of a battery life of 1 day. Realistically, they were looking at about 20 hours. Normal operating hours of a ride would not exceed probably 18 hours so to err on the cautious side, they require 20 hours of battery life.
5.2 Component Selection After extensive research on all the possibilities for each component needed the parts have been chosen. Each component listed below was the best choice for this project. Once they type of part needed next was to find who can supply the part and in the least amount of time for shipping and least cost. The following components below will have the specification, and which supply we choose to go with. For each supplier we did try to stick with a distribution in the United States to help with to minimize time if shipping back parts is needed.
5.2.1 Battery
The final battery that was decided for this project was a 22000mAh battery at 11.1 volts designed by MaxAmps. The battery is a lithium polymer that can tolerate up to 140°F until thermal runaway occurs. Below 14°F, the shorter the run times which slows down the reaction within the battery, which can cause failure. The battery has a 40C rating for its discharging and a 5C fast charge capability. The power wires that come with the battery is a 12-gauge wire that will have a XT60 connector to help with anti-spark when unplugging and plugging in the battery to the microcontroller. With the capacity chosen will give about 30 hours of run time before recharging will be needed or replacement. In figure 14, shows the battery that will be used. The Table 11 gives the rest of the specifications and ratings for this battery from this supplier that we also took into consideration when deciding on this supplier.
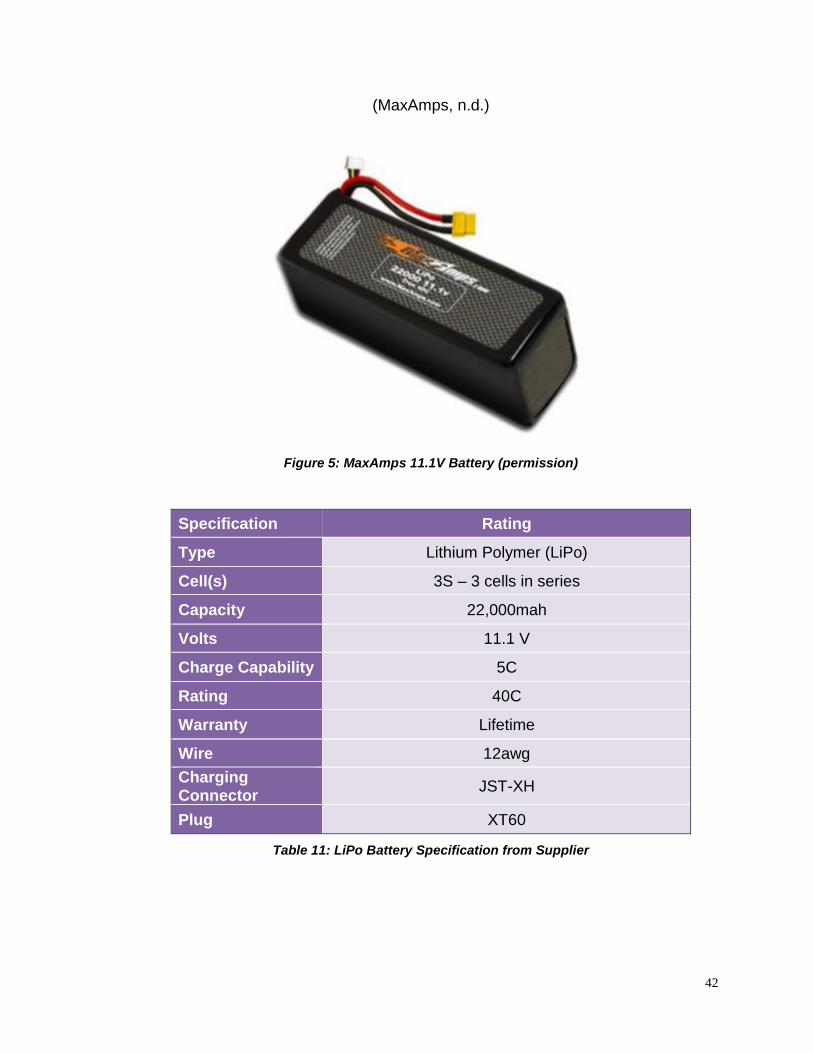
42
(MaxAmps, n.d.)
Figure 5: MaxAmps 11.1V Battery (permission)
Specification Rating
Type Lithium Polymer (LiPo)
Cell(s) 3S – 3 cells in series
Capacity 22,000mah
Volts 11.1 V
Charge Capability 5C
Rating 40C
Warranty Lifetime
Wire 12awg
Charging Connector
JST-XH
Plug XT60
Table 11: LiPo Battery Specification from Supplier
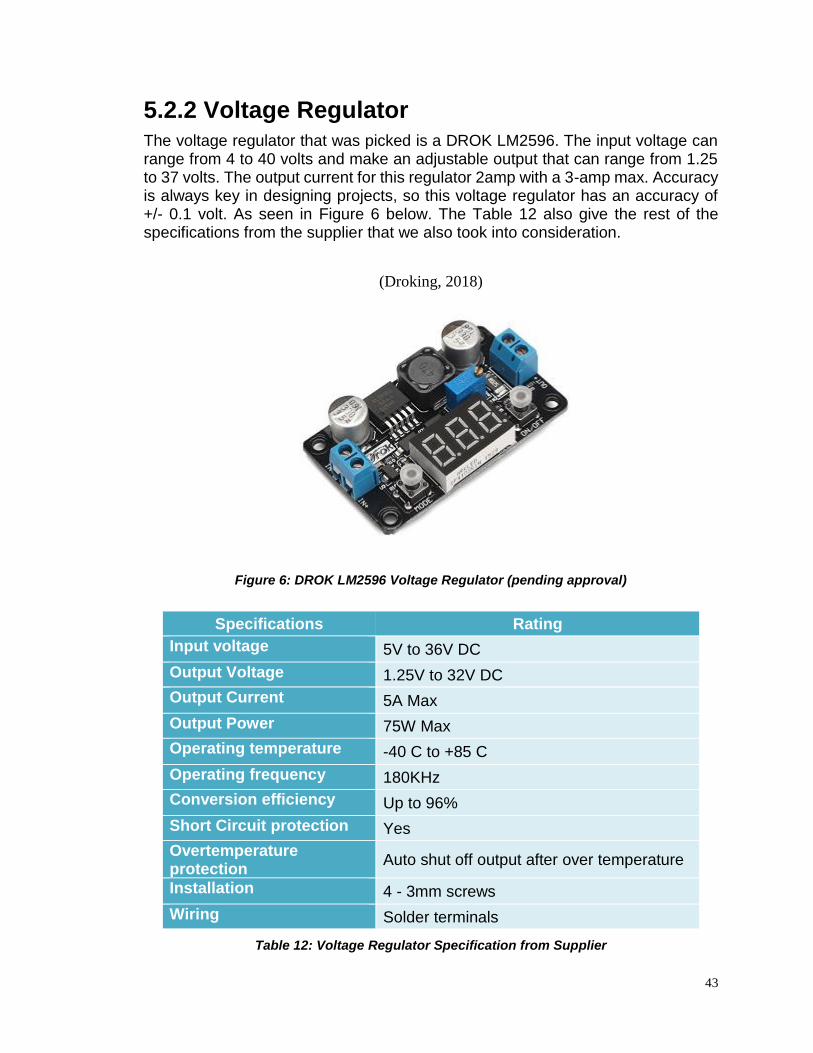
43
5.2.2 Voltage Regulator The voltage regulator that was picked is a DROK LM2596. The input voltage can range from 4 to 40 volts and make an adjustable output that can range from 1.25 to 37 volts. The output current for this regulator 2amp with a 3-amp max. Accuracy is always key in designing projects, so this voltage regulator has an accuracy of +/- 0.1 volt. As seen in Figure 6 below. The Table 12 also give the rest of the specifications from the supplier that we also took into consideration.
(Droking, 2018)
Figure 6: DROK LM2596 Voltage Regulator (pending approval)
Specifications Rating
Input voltage 5V to 36V DC
Output Voltage 1.25V to 32V DC
Output Current 5A Max
Output Power 75W Max
Operating temperature -40 C to +85 C
Operating frequency 180KHz
Conversion efficiency Up to 96%
Short Circuit protection Yes
Overtemperature protection
Auto shut off output after over temperature
Installation 4 - 3mm screws
Wiring Solder terminals
Table 12: Voltage Regulator Specification from Supplier
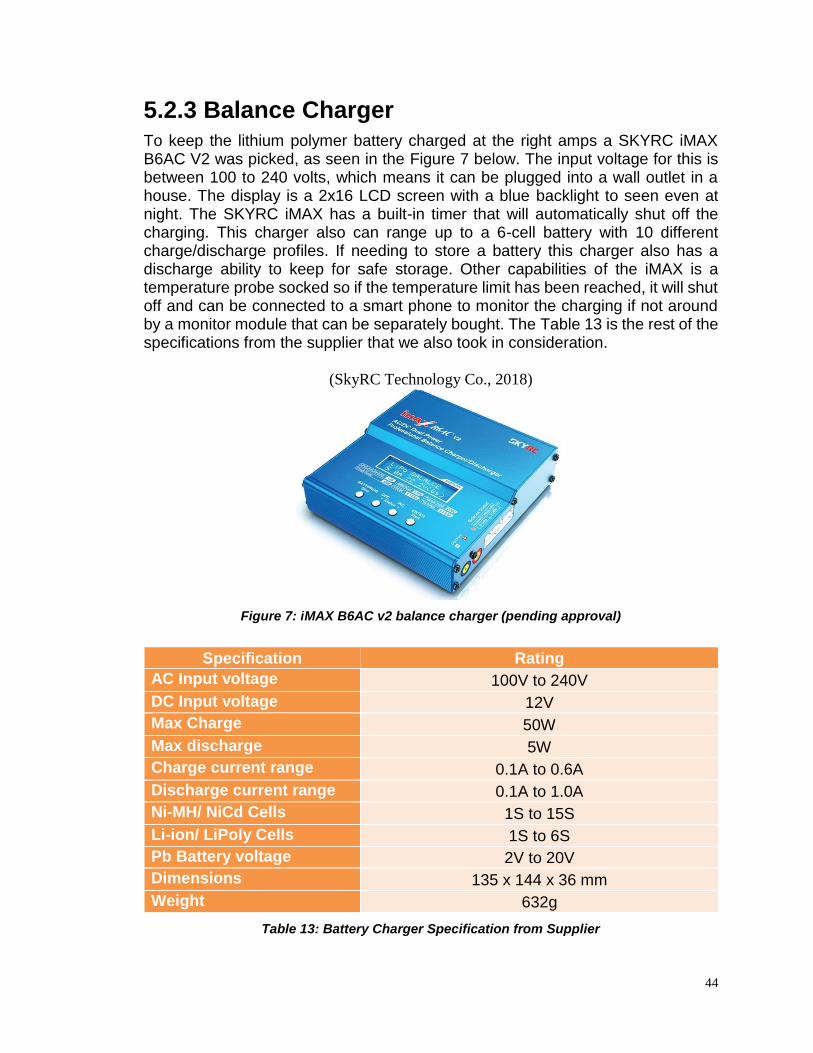
44
5.2.3 Balance Charger To keep the lithium polymer battery charged at the right amps a SKYRC iMAX B6AC V2 was picked, as seen in the Figure 7 below. The input voltage for this is between 100 to 240 volts, which means it can be plugged into a wall outlet in a house. The display is a 2x16 LCD screen with a blue backlight to seen even at night. The SKYRC iMAX has a built-in timer that will automatically shut off the charging. This charger also can range up to a 6-cell battery with 10 different charge/discharge profiles. If needing to store a battery this charger also has a discharge ability to keep for safe storage. Other capabilities of the iMAX is a temperature probe socked so if the temperature limit has been reached, it will shut off and can be connected to a smart phone to monitor the charging if not around by a monitor module that can be separately bought. The Table 13 is the rest of the specifications from the supplier that we also took in consideration.
(SkyRC Technology Co., 2018)
Figure 7: iMAX B6AC v2 balance charger (pending approval)
Specification Rating
AC Input voltage 100V to 240V
DC Input voltage 12V
Max Charge 50W
Max discharge 5W
Charge current range 0.1A to 0.6A
Discharge current range 0.1A to 1.0A
Ni-MH/ NiCd Cells 1S to 15S
Li-ion/ LiPoly Cells 1S to 6S
Pb Battery voltage 2V to 20V
Dimensions 135 x 144 x 36 mm
Weight 632g
Table 13: Battery Charger Specification from Supplier
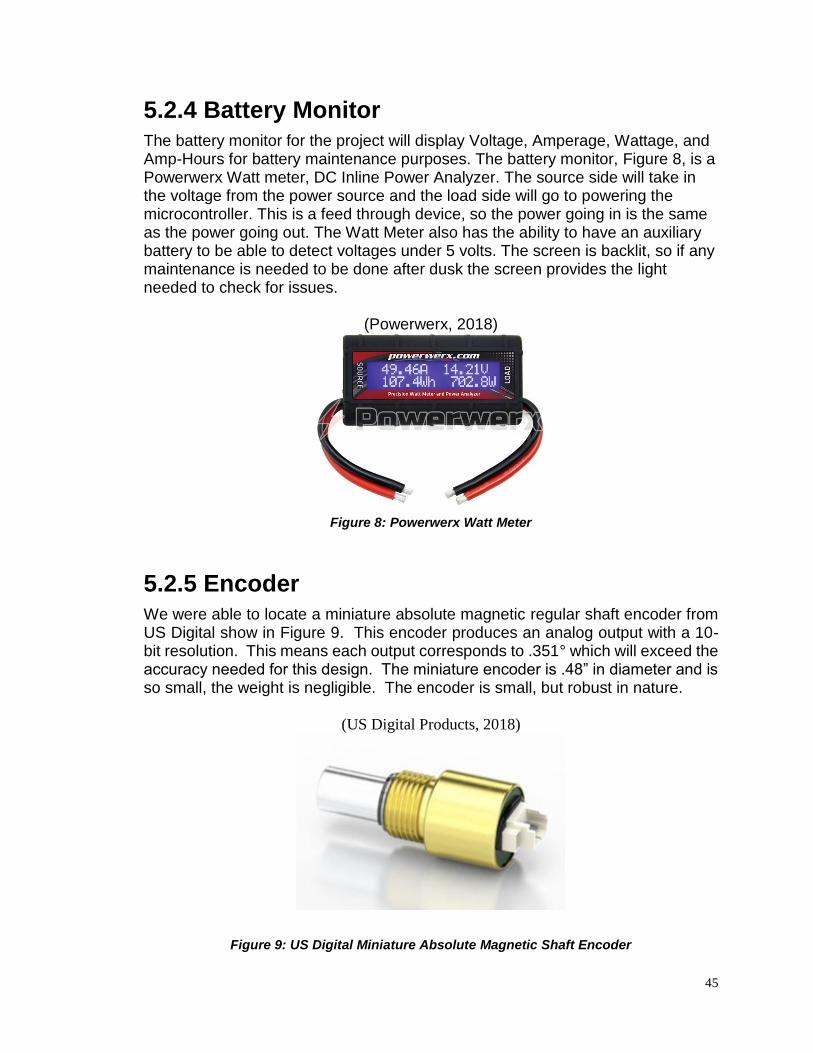
45
5.2.4 Battery Monitor The battery monitor for the project will display Voltage, Amperage, Wattage, and Amp-Hours for battery maintenance purposes. The battery monitor, Figure 8, is a Powerwerx Watt meter, DC Inline Power Analyzer. The source side will take in the voltage from the power source and the load side will go to powering the microcontroller. This is a feed through device, so the power going in is the same as the power going out. The Watt Meter also has the ability to have an auxiliary battery to be able to detect voltages under 5 volts. The screen is backlit, so if any maintenance is needed to be done after dusk the screen provides the light needed to check for issues.
(Powerwerx, 2018)
Figure 8: Powerwerx Watt Meter
5.2.5 Encoder We were able to locate a miniature absolute magnetic regular shaft encoder from US Digital show in Figure 9. This encoder produces an analog output with a 10-bit resolution. This means each output corresponds to .351° which will exceed the accuracy needed for this design. The miniature encoder is .48” in diameter and is so small, the weight is negligible. The encoder is small, but robust in nature.
(US Digital Products, 2018)
Figure 9: US Digital Miniature Absolute Magnetic Shaft Encoder
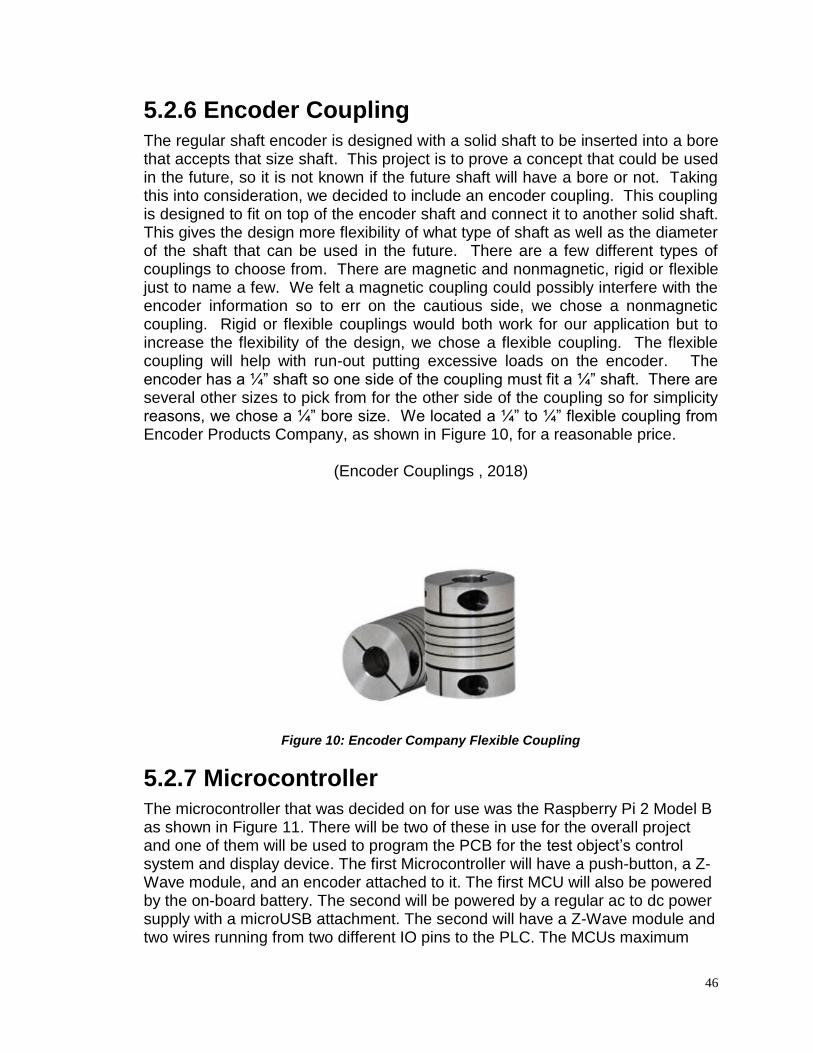
46
5.2.6 Encoder Coupling The regular shaft encoder is designed with a solid shaft to be inserted into a bore that accepts that size shaft. This project is to prove a concept that could be used in the future, so it is not known if the future shaft will have a bore or not. Taking this into consideration, we decided to include an encoder coupling. This coupling is designed to fit on top of the encoder shaft and connect it to another solid shaft. This gives the design more flexibility of what type of shaft as well as the diameter of the shaft that can be used in the future. There are a few different types of couplings to choose from. There are magnetic and nonmagnetic, rigid or flexible just to name a few. We felt a magnetic coupling could possibly interfere with the encoder information so to err on the cautious side, we chose a nonmagnetic coupling. Rigid or flexible couplings would both work for our application but to increase the flexibility of the design, we chose a flexible coupling. The flexible coupling will help with run-out putting excessive loads on the encoder. The encoder has a ¼” shaft so one side of the coupling must fit a ¼” shaft. There are several other sizes to pick from for the other side of the coupling so for simplicity reasons, we chose a ¼” bore size. We located a ¼” to ¼” flexible coupling from Encoder Products Company, as shown in Figure 10, for a reasonable price.
(Encoder Couplings , 2018)
Figure 10: Encoder Company Flexible Coupling
5.2.7 Microcontroller The microcontroller that was decided on for use was the Raspberry Pi 2 Model B as shown in Figure 11. There will be two of these in use for the overall project and one of them will be used to program the PCB for the test object’s control system and display device. The first Microcontroller will have a push-button, a Z-Wave module, and an encoder attached to it. The first MCU will also be powered by the on-board battery. The second will be powered by a regular ac to dc power supply with a microUSB attachment. The second will have a Z-Wave module and two wires running from two different IO pins to the PLC. The MCUs maximum
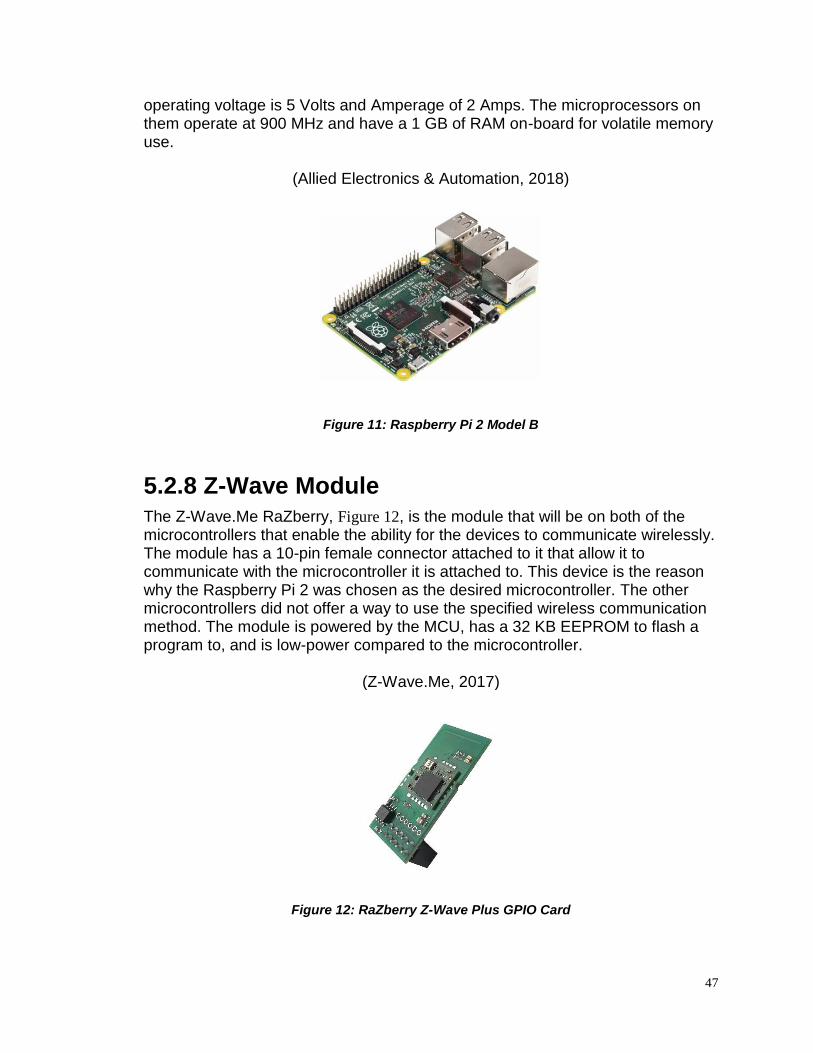
47
operating voltage is 5 Volts and Amperage of 2 Amps. The microprocessors on them operate at 900 MHz and have a 1 GB of RAM on-board for volatile memory use.
(Allied Electronics & Automation, 2018)
Figure 11: Raspberry Pi 2 Model B
5.2.8 Z-Wave Module
The Z-Wave.Me RaZberry, Figure 12, is the module that will be on both of the microcontrollers that enable the ability for the devices to communicate wirelessly. The module has a 10-pin female connector attached to it that allow it to communicate with the microcontroller it is attached to. This device is the reason why the Raspberry Pi 2 was chosen as the desired microcontroller. The other microcontrollers did not offer a way to use the specified wireless communication method. The module is powered by the MCU, has a 32 KB EEPROM to flash a program to, and is low-power compared to the microcontroller.
(Z-Wave.Me, 2017)
Figure 12: RaZberry Z-Wave Plus GPIO Card
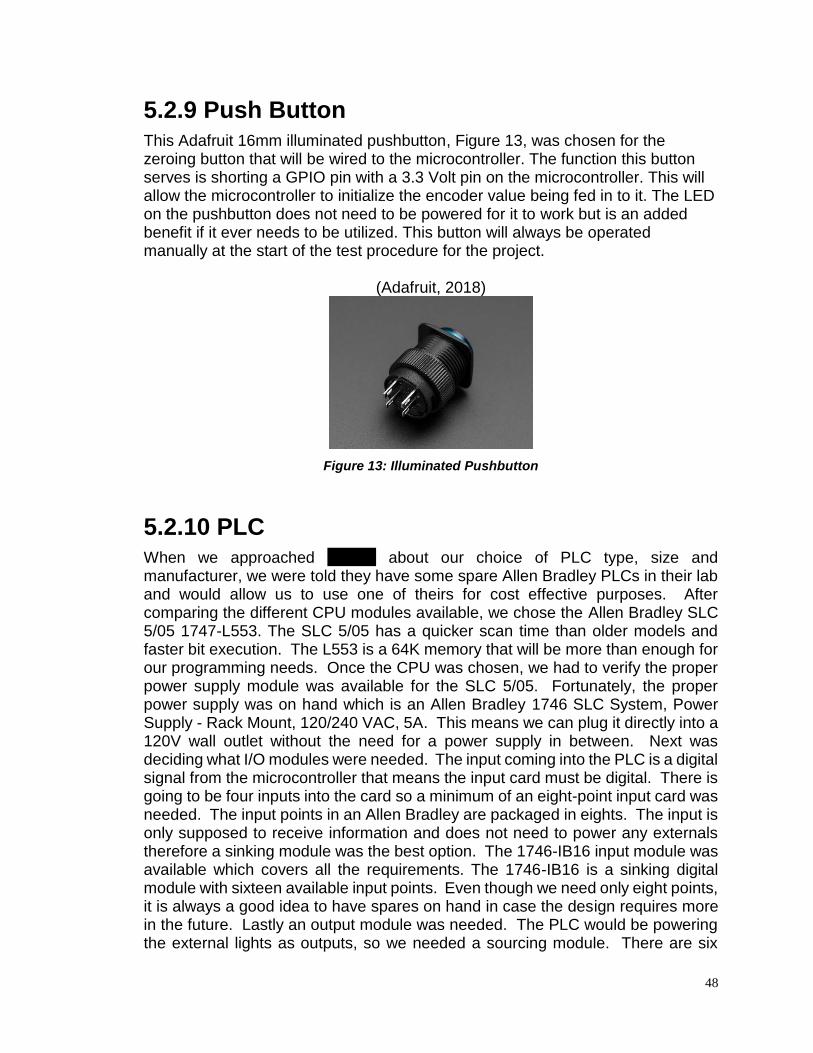
48
5.2.9 Push Button This Adafruit 16mm illuminated pushbutton, Figure 13, was chosen for the zeroing button that will be wired to the microcontroller. The function this button serves is shorting a GPIO pin with a 3.3 Volt pin on the microcontroller. This will allow the microcontroller to initialize the encoder value being fed in to it. The LED on the pushbutton does not need to be powered for it to work but is an added benefit if it ever needs to be utilized. This button will always be operated manually at the start of the test procedure for the project.
(Adafruit, 2018)
Figure 13: Illuminated Pushbutton
5.2.10 PLC When we approached Disney about our choice of PLC type, size and manufacturer, we were told they have some spare Allen Bradley PLCs in their lab and would allow us to use one of theirs for cost effective purposes. After comparing the different CPU modules available, we chose the Allen Bradley SLC 5/05 1747-L553. The SLC 5/05 has a quicker scan time than older models and faster bit execution. The L553 is a 64K memory that will be more than enough for our programming needs. Once the CPU was chosen, we had to verify the proper power supply module was available for the SLC 5/05. Fortunately, the proper power supply was on hand which is an Allen Bradley 1746 SLC System, Power Supply - Rack Mount, 120/240 VAC, 5A. This means we can plug it directly into a 120V wall outlet without the need for a power supply in between. Next was deciding what I/O modules were needed. The input coming into the PLC is a digital signal from the microcontroller that means the input card must be digital. There is going to be four inputs into the card so a minimum of an eight-point input card was needed. The input points in an Allen Bradley are packaged in eights. The input is only supposed to receive information and does not need to power any externals therefore a sinking module was the best option. The 1746-IB16 input module was available which covers all the requirements. The 1746-IB16 is a sinking digital module with sixteen available input points. Even though we need only eight points, it is always a good idea to have spares on hand in case the design requires more in the future. Lastly an output module was needed. The PLC would be powering the external lights as outputs, so we needed a sourcing module. There are six

49
different lights that need to illuminate therefore we needed at least an eight-point output module. The signal being sent to the light is to be either on or off, which is a digital signal, so we needed a digital module. We were able to locate a 1746-OB16 output module in the lab. The 1746-OB16 output module is a digital sourcing module with sixteen available output points. Once again, even though only eight points are needed, it is always good to have spares on hand. The chassis that was available in the lab has slots for the power supply, the CPU, the input module, the output module and one other module. Purely for aesthetic purposes and possible future use, we decided to add in a communications module to complete the chassis. The module available is a MVI46-MCM which we will not be using for this project.
5.2.11 Weatherproof Enclosure The L-Com 12x10x5 inch weatherproof windowed NEMA enclosure, Figure 14, was chosen as the desired enclosure for the project. The window on the front allows maintenance personnel to be able to monitor the battery without opening the case. The enclosure also allows personnel to notice any visible hazards within the case before opening it for maintenance. The window also provides less of an impact on wireless attenuation compared to the molded FRP, Fiberglass Reinforced Polyester. The total volume of the inside of the enclosure is 600 cubic inches. The components that will be going inside of this enclosure will suitably fit inside it without any space constraint issues.
(Infinite Electronics International, Inc., 2011)
Figure 14: Weatherproof Windowed NEMA Enclosure
5.2.12 Silica Packets The silica packets that were chosen to satisfy the projects needs for humidity control is the 5-gram silica gel desiccant package. A 30-pack of these packets is shown in Figure 15 and there will be two in the enclosure listed above at any time. Since the enclosure is 600 cubic inches and the 5-gram packets are rated for 600

50
cubic inches. Doubling on this recommendation was a decision made because of the intensity of Florida’s Humidity.
(Dry & Dry, 2015)
Figure 15: 30 pack of 5-gram Silica Gel Packets
5.2.13 Humidity Indicator The Dry & Dry Premium Cobalt Free Humidity Indicator cards, Figure 16, are the cards that will be inside of the enclosure alongside the silica gel packets. These cards will be able to be seen through the enclosure’s Lexan window, so that way the enclosure does not need to be opened to check these cards. This is beneficial because the silica packets work best in a sealed environment. These cards change from green to violet when the humidity reaches 30% or more inside of the enclosure. The card also has an arrow indication as to when the silica gel packets are needed to be changed. This is helpful for maintenance personnel because they will not need to remember a specific value to know when to change out the packets and indicator cards.
(Dry & Dry, 2015)
Figure 16: Dry & Dry Humidity Indicator card
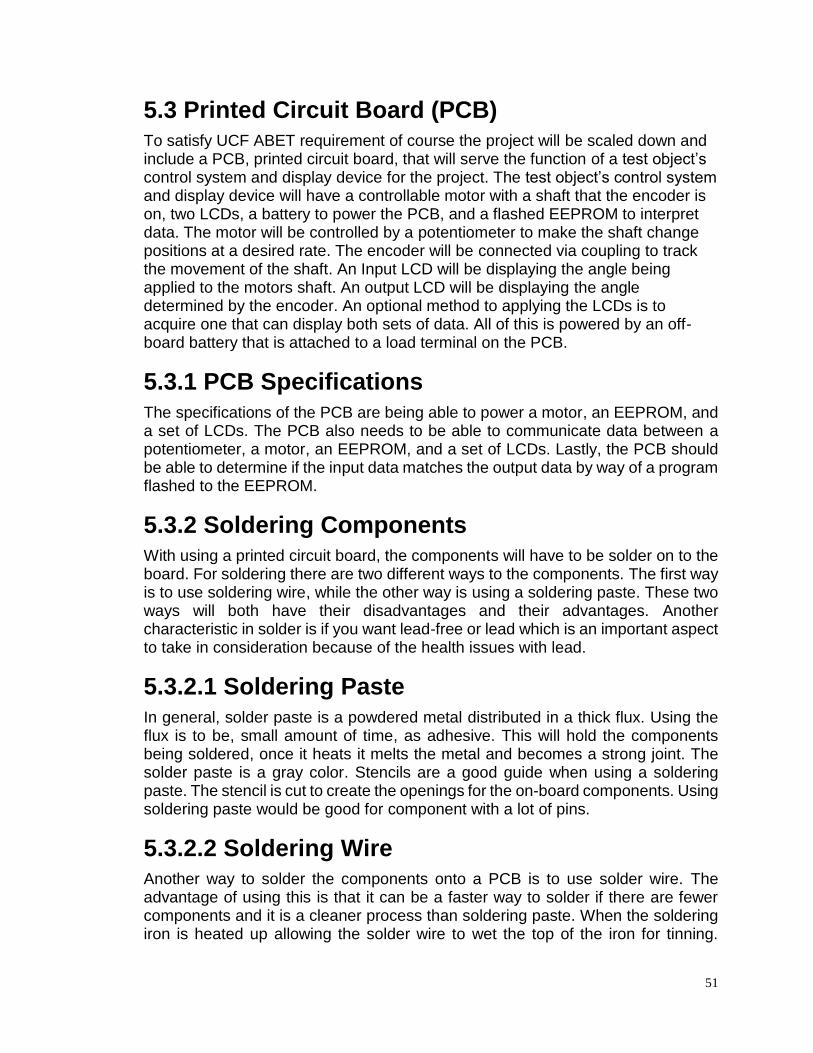
51
5.3 Printed Circuit Board (PCB) To satisfy UCF ABET requirement of course the project will be scaled down and include a PCB, printed circuit board, that will serve the function of a test object’s control system and display device for the project. The test object’s control system and display device will have a controllable motor with a shaft that the encoder is on, two LCDs, a battery to power the PCB, and a flashed EEPROM to interpret data. The motor will be controlled by a potentiometer to make the shaft change positions at a desired rate. The encoder will be connected via coupling to track the movement of the shaft. An Input LCD will be displaying the angle being applied to the motors shaft. An output LCD will be displaying the angle determined by the encoder. An optional method to applying the LCDs is to acquire one that can display both sets of data. All of this is powered by an off-board battery that is attached to a load terminal on the PCB.
5.3.1 PCB Specifications
The specifications of the PCB are being able to power a motor, an EEPROM, and a set of LCDs. The PCB also needs to be able to communicate data between a potentiometer, a motor, an EEPROM, and a set of LCDs. Lastly, the PCB should be able to determine if the input data matches the output data by way of a program flashed to the EEPROM.
5.3.2 Soldering Components With using a printed circuit board, the components will have to be solder on to the board. For soldering there are two different ways to the components. The first way is to use soldering wire, while the other way is using a soldering paste. These two ways will both have their disadvantages and their advantages. Another characteristic in solder is if you want lead-free or lead which is an important aspect to take in consideration because of the health issues with lead.
5.3.2.1 Soldering Paste
In general, solder paste is a powdered metal distributed in a thick flux. Using the flux is to be, small amount of time, as adhesive. This will hold the components being soldered, once it heats it melts the metal and becomes a strong joint. The solder paste is a gray color. Stencils are a good guide when using a soldering paste. The stencil is cut to create the openings for the on-board components. Using soldering paste would be good for component with a lot of pins.
5.3.2.2 Soldering Wire Another way to solder the components onto a PCB is to use solder wire. The advantage of using this is that it can be a faster way to solder if there are fewer components and it is a cleaner process than soldering paste. When the soldering iron is heated up allowing the solder wire to wet the top of the iron for tinning.
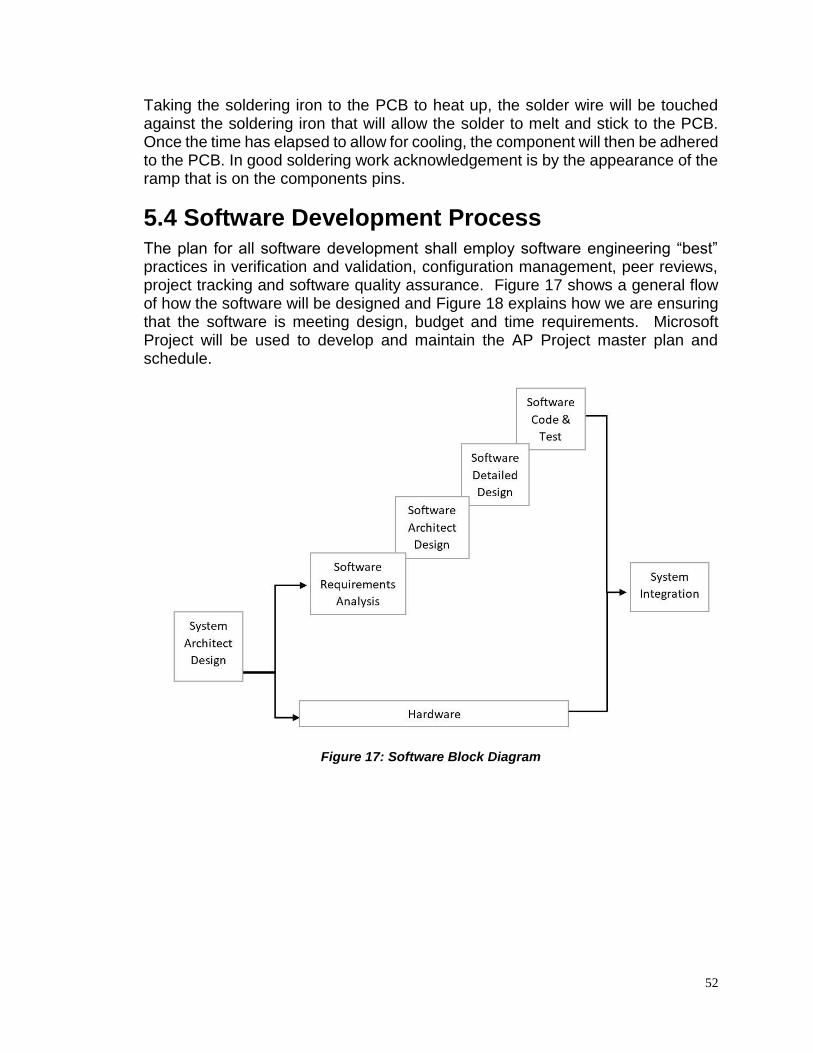
52
Taking the soldering iron to the PCB to heat up, the solder wire will be touched against the soldering iron that will allow the solder to melt and stick to the PCB. Once the time has elapsed to allow for cooling, the component will then be adhered to the PCB. In good soldering work acknowledgement is by the appearance of the ramp that is on the components pins.
5.4 Software Development Process The plan for all software development shall employ software engineering “best” practices in verification and validation, configuration management, peer reviews, project tracking and software quality assurance. Figure 17 shows a general flow of how the software will be designed and Figure 18 explains how we are ensuring that the software is meeting design, budget and time requirements. Microsoft Project will be used to develop and maintain the AP Project master plan and schedule.
Figure 17: Software Block Diagram
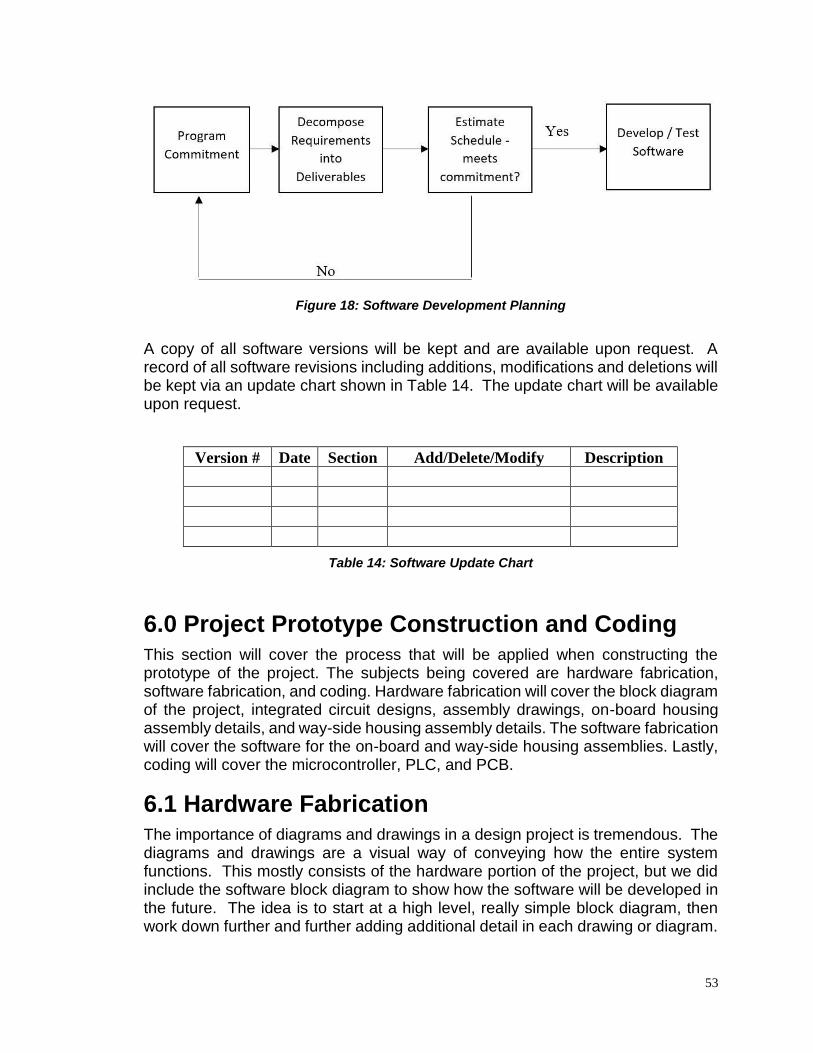
53
Figure 18: Software Development Planning
A copy of all software versions will be kept and are available upon request. A record of all software revisions including additions, modifications and deletions will be kept via an update chart shown in Table 14. The update chart will be available upon request.
Table 14: Software Update Chart
6.0 Project Prototype Construction and Coding This section will cover the process that will be applied when constructing the prototype of the project. The subjects being covered are hardware fabrication, software fabrication, and coding. Hardware fabrication will cover the block diagram of the project, integrated circuit designs, assembly drawings, on-board housing assembly details, and way-side housing assembly details. The software fabrication will cover the software for the on-board and way-side housing assemblies. Lastly, coding will cover the microcontroller, PLC, and PCB.
6.1 Hardware Fabrication The importance of diagrams and drawings in a design project is tremendous. The diagrams and drawings are a visual way of conveying how the entire system functions. This mostly consists of the hardware portion of the project, but we did include the software block diagram to show how the software will be developed in the future. The idea is to start at a high level, really simple block diagram, then work down further and further adding additional detail in each drawing or diagram.
Version # Date Section Add/Delete/Modify Description
54
The last drawing will be the schematic which shows the details of how each component wires to the other.
6.1.1 Hardware Block Diagram The general concept, as illustrated with Figure 19, is that there will be on-board components that send wireless data to way side components. The on-board components and way-side components will work together to create an entire system of checks and balances. The on-board box is physically on the test object and the way side box can be located anywhere not on the test object such as the side of a track or inside a ride control room, etc.
Figure 19: System Block Diagram
6.1.2 Hardware Integrated Circuit Designs
The ICD in Figure 20 begins to look inside the boxes listed in the block diagram in Figure 19. The ICD shows the different sections of the on-board configurations and the way side configurations. In visual terms, you easily see how many different sections are being encompassed in the overall design. The ICD also lists the wire sizes of the wires between the different sections and shows the flow of data and power.
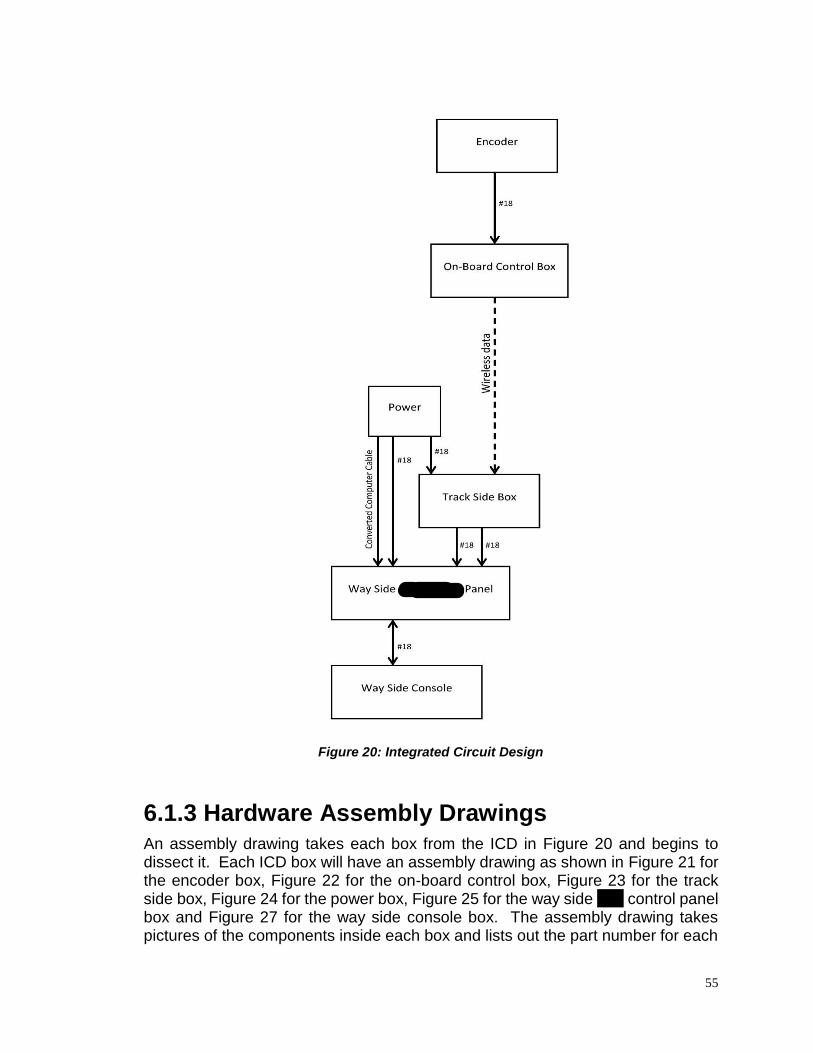
55
Figure 20: Integrated Circuit Design
6.1.3 Hardware Assembly Drawings
An assembly drawing takes each box from the ICD in Figure 20 and begins to dissect it. Each ICD box will have an assembly drawing as shown in Figure 21 for the encoder box, Figure 22 for the on-board control box, Figure 23 for the track side box, Figure 24 for the power box, Figure 25 for the way side ride control panel box and Figure 27 for the way side console box. The assembly drawing takes pictures of the components inside each box and lists out the part number for each
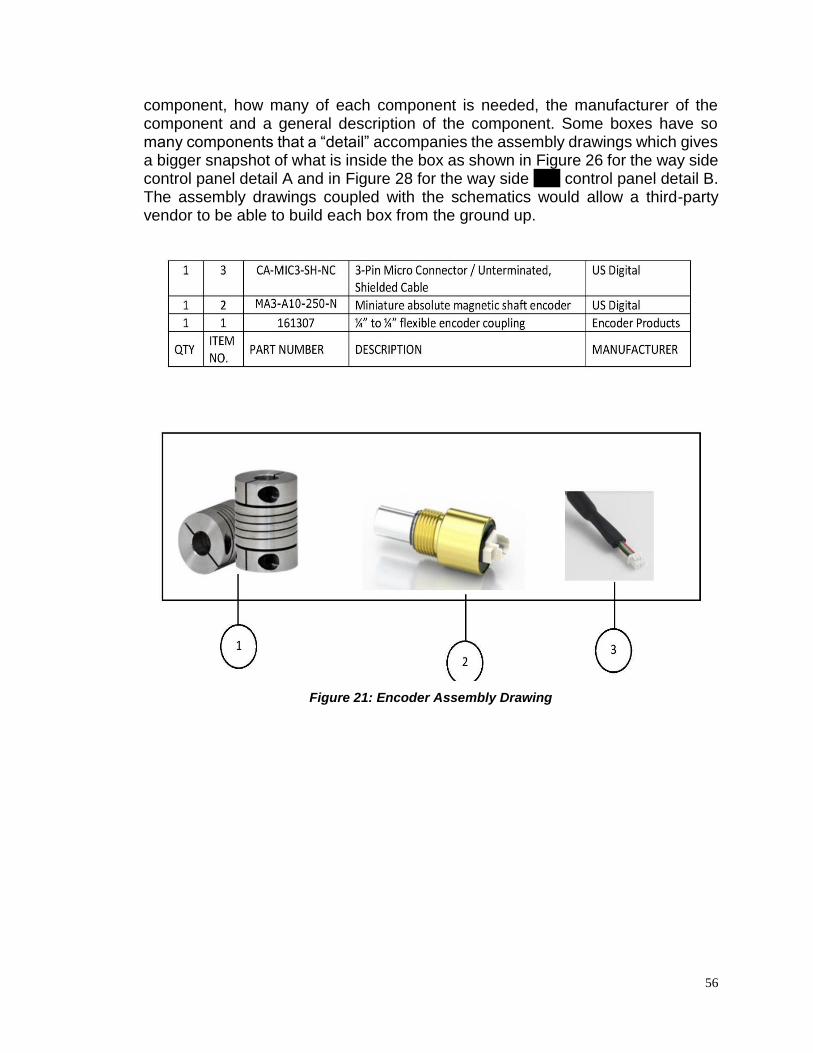
56
component, how many of each component is needed, the manufacturer of the component and a general description of the component. Some boxes have so many components that a “detail” accompanies the assembly drawings which gives a bigger snapshot of what is inside the box as shown in Figure 26 for the way side control panel detail A and in Figure 28 for the way side ride control panel detail B. The assembly drawings coupled with the schematics would allow a third-party vendor to be able to build each box from the ground up.
Figure 21: Encoder Assembly Drawing
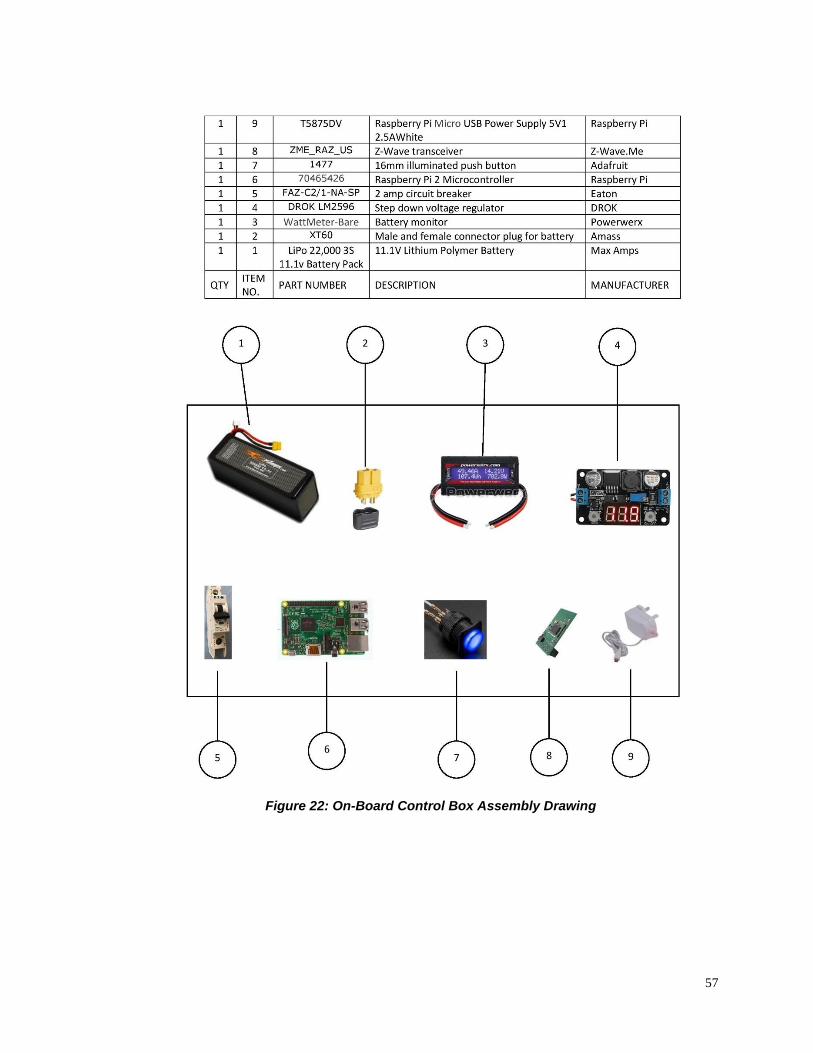
57
Figure 22: On-Board Control Box Assembly Drawing
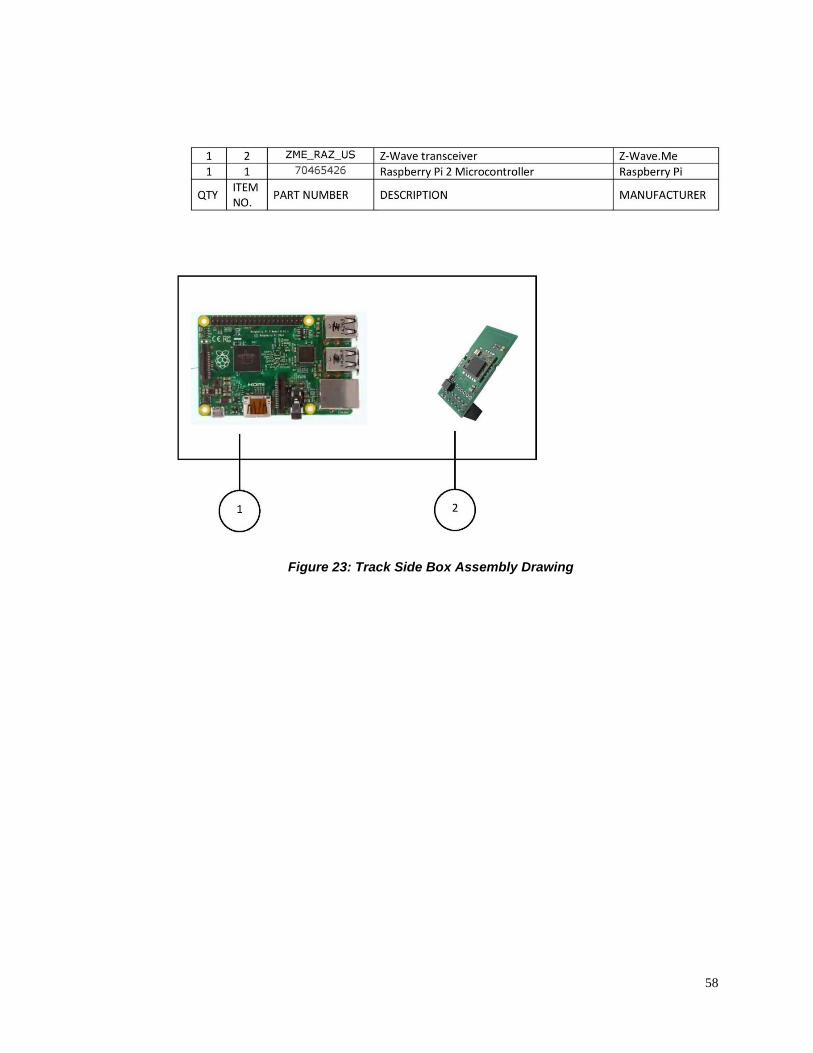
58
Figure 23: Track Side Box Assembly Drawing
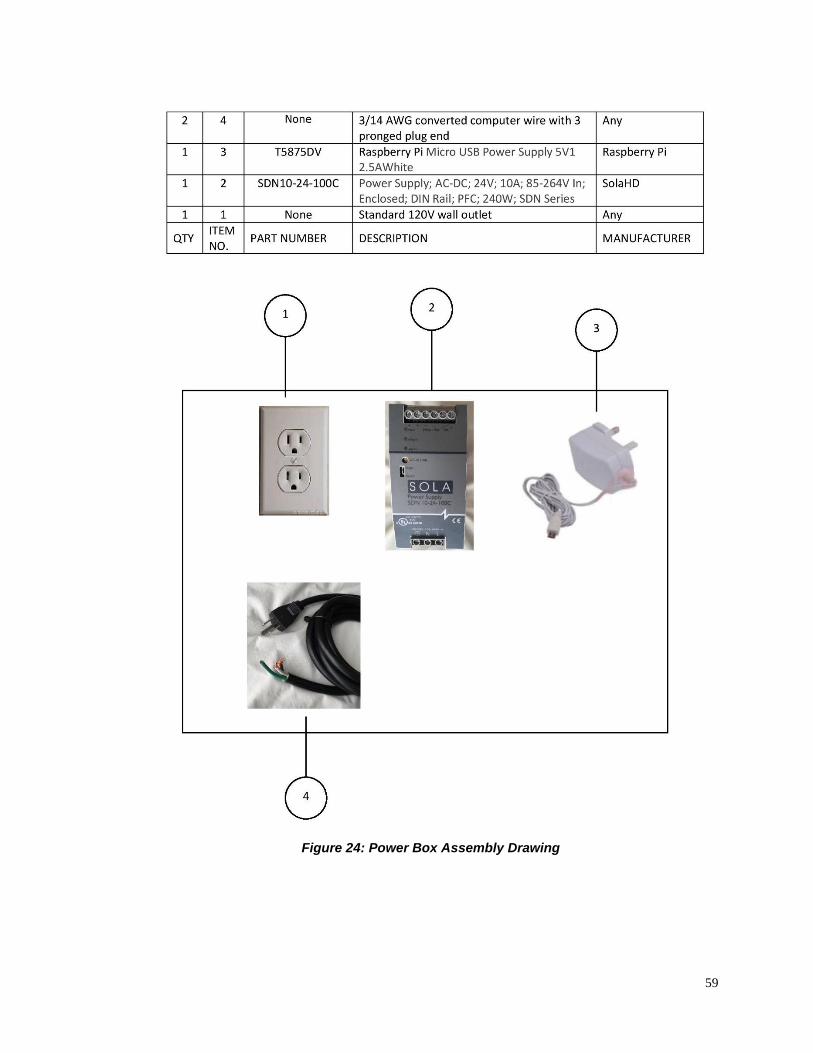
59
Figure 24: Power Box Assembly Drawing
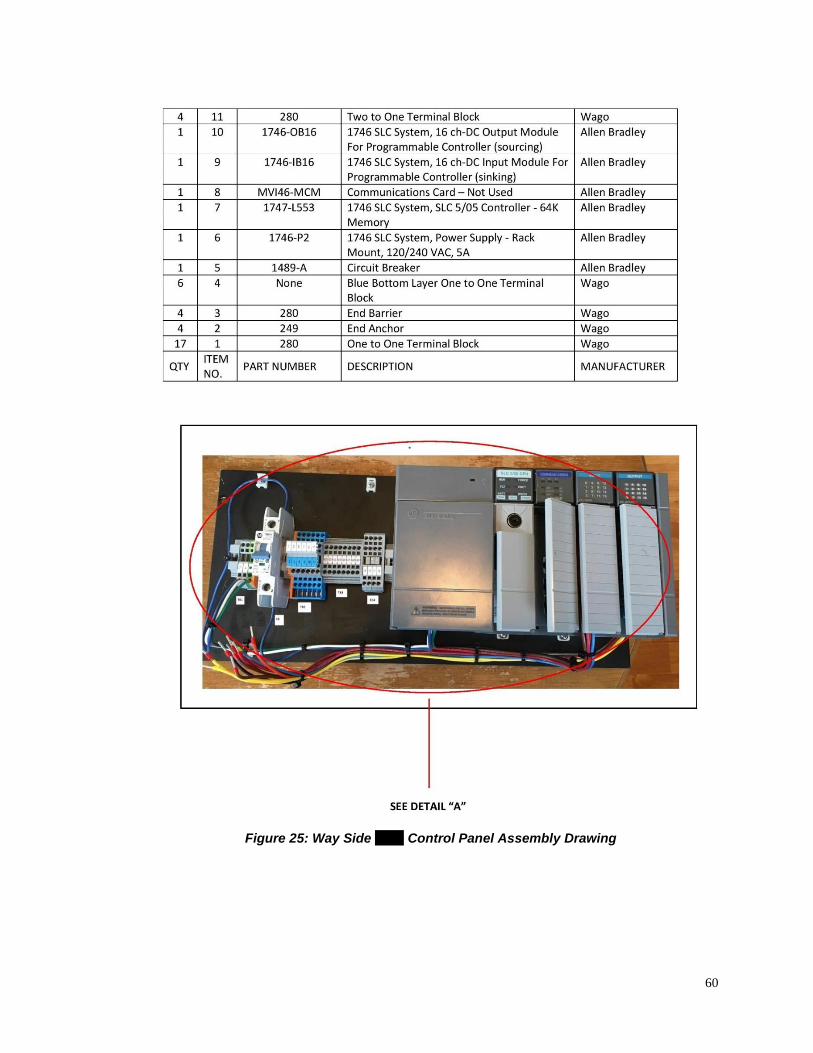
60
Figure 25: Way Side Ride Control Panel Assembly Drawing
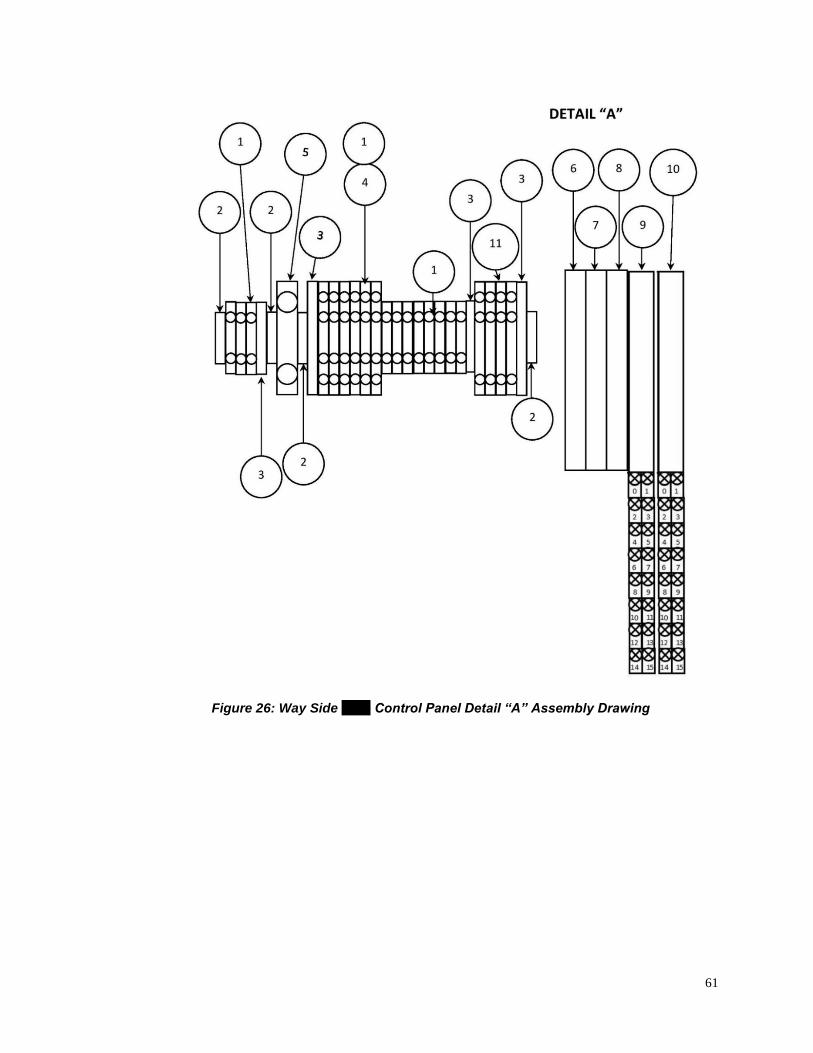
61
Figure 26: Way Side Ride Control Panel Detail “A” Assembly Drawing
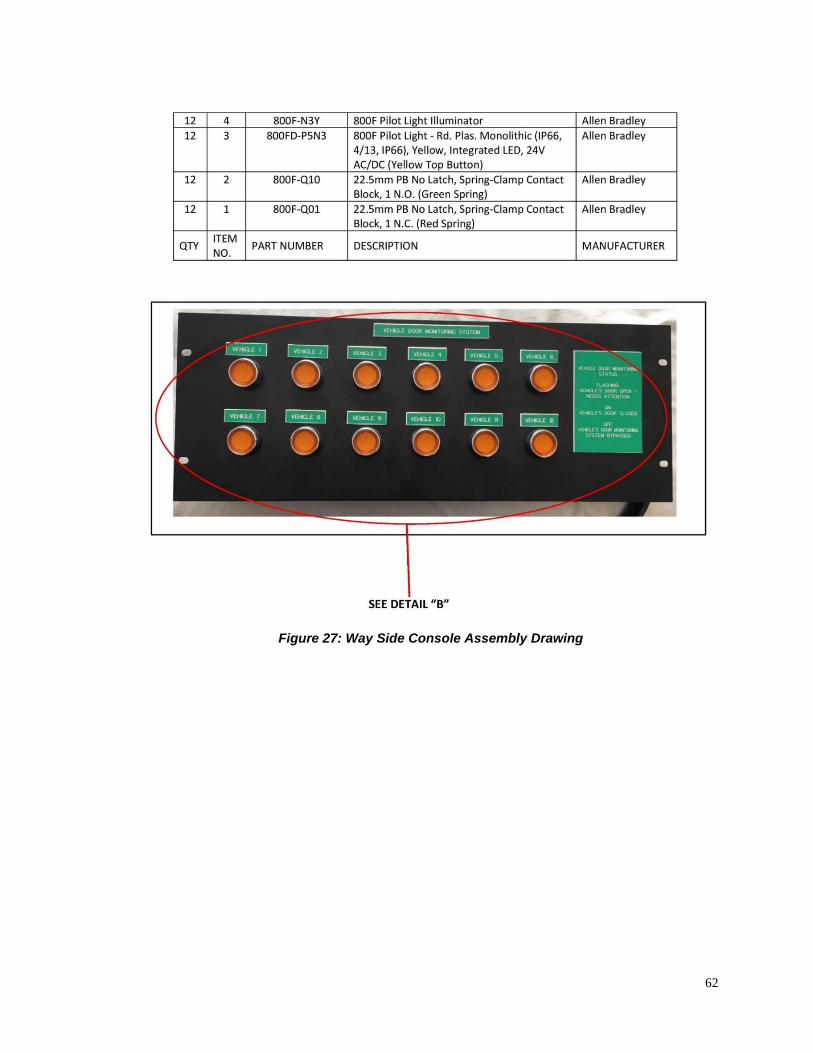
62
Figure 27: Way Side Console Assembly Drawing
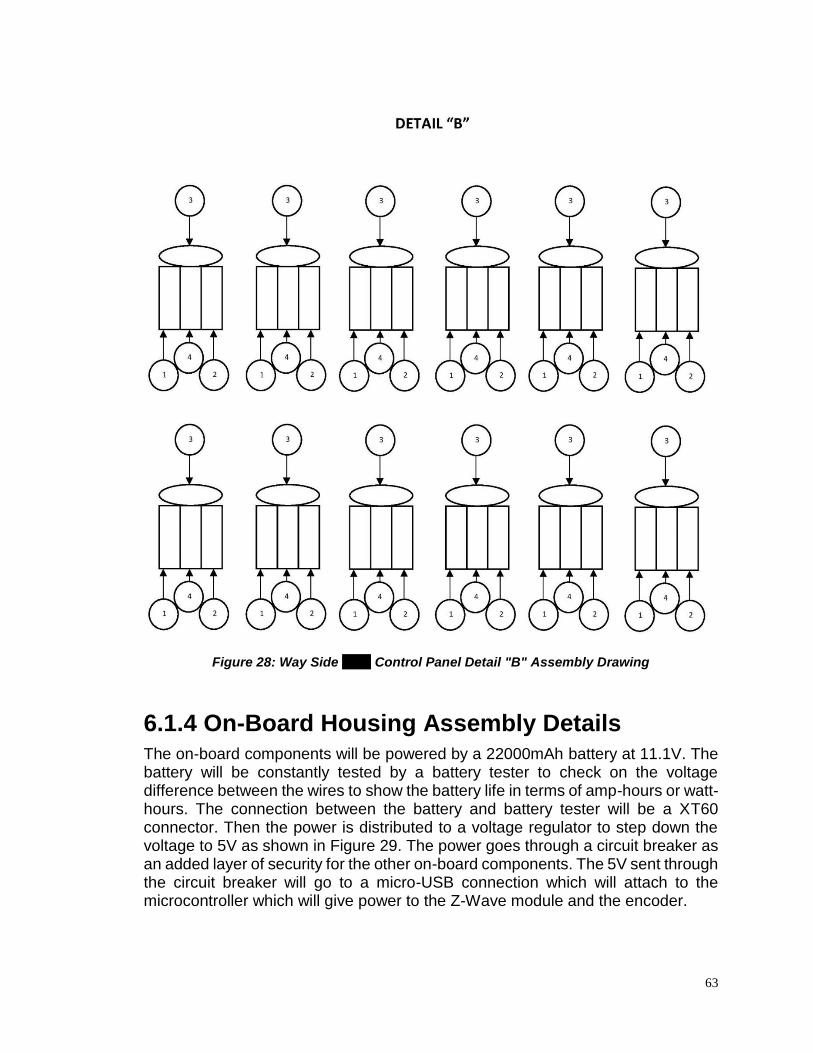
63
Figure 28: Way Side Ride Control Panel Detail "B" Assembly Drawing
6.1.4 On-Board Housing Assembly Details The on-board components will be powered by a 22000mAh battery at 11.1V. The battery will be constantly tested by a battery tester to check on the voltage difference between the wires to show the battery life in terms of amp-hours or watt-hours. The connection between the battery and battery tester will be a XT60 connector. Then the power is distributed to a voltage regulator to step down the voltage to 5V as shown in Figure 29. The power goes through a circuit breaker as an added layer of security for the other on-board components. The 5V sent through the circuit breaker will go to a micro-USB connection which will attach to the microcontroller which will give power to the Z-Wave module and the encoder.
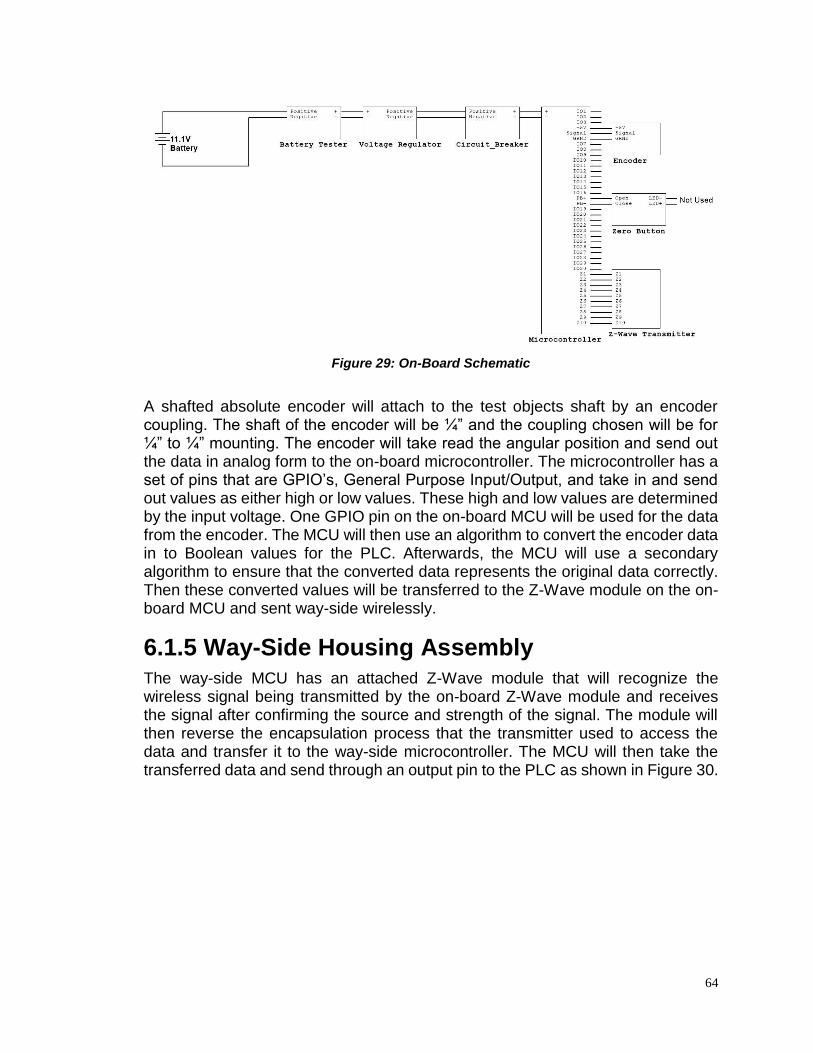
64
Figure 29: On-Board Schematic
A shafted absolute encoder will attach to the test objects shaft by an encoder coupling. The shaft of the encoder will be ¼” and the coupling chosen will be for ¼” to ¼” mounting. The encoder will take read the angular position and send out the data in analog form to the on-board microcontroller. The microcontroller has a set of pins that are GPIO’s, General Purpose Input/Output, and take in and send out values as either high or low values. These high and low values are determined by the input voltage. One GPIO pin on the on-board MCU will be used for the data from the encoder. The MCU will then use an algorithm to convert the encoder data in to Boolean values for the PLC. Afterwards, the MCU will use a secondary algorithm to ensure that the converted data represents the original data correctly. Then these converted values will be transferred to the Z-Wave module on the on-board MCU and sent way-side wirelessly.
6.1.5 Way-Side Housing Assembly
The way-side MCU has an attached Z-Wave module that will recognize the wireless signal being transmitted by the on-board Z-Wave module and receives the signal after confirming the source and strength of the signal. The module will then reverse the encapsulation process that the transmitter used to access the data and transfer it to the way-side microcontroller. The MCU will then take the transferred data and send through an output pin to the PLC as shown in Figure 30.
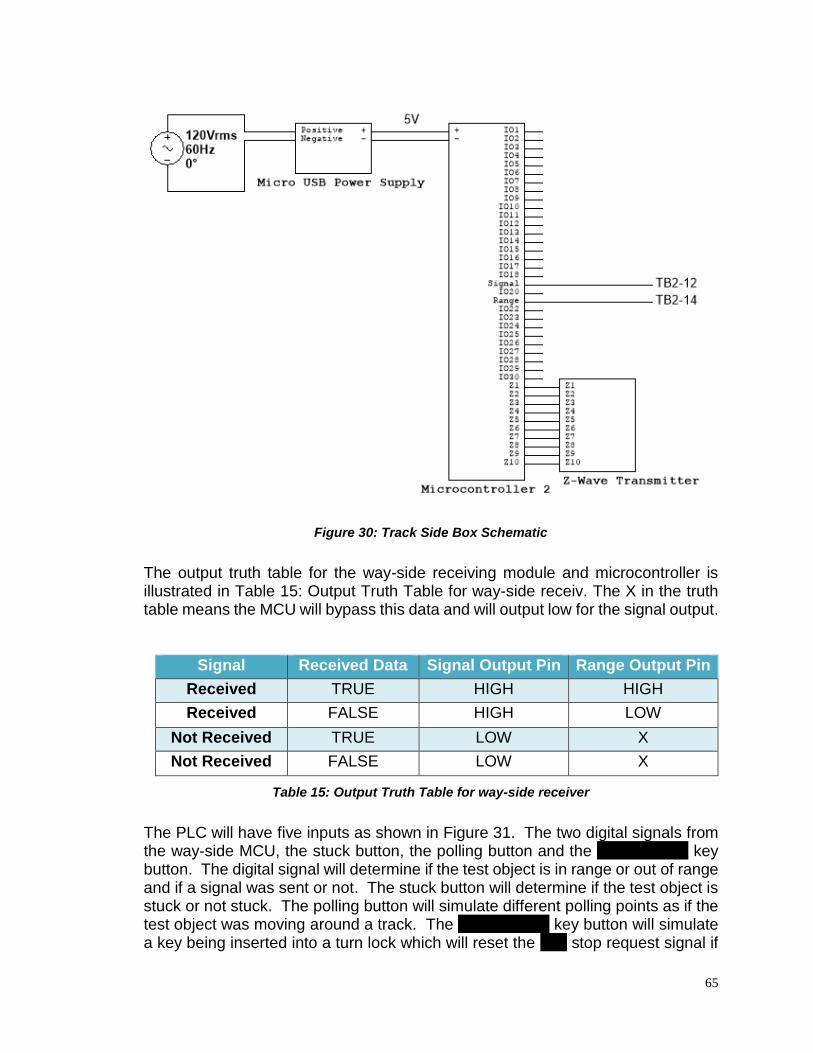
65
Figure 30: Track Side Box Schematic
The output truth table for the way-side receiving module and microcontroller is illustrated in Table 15: Output Truth Table for way-side receiv. The X in the truth table means the MCU will bypass this data and will output low for the signal output.
Signal Received Data Signal Output Pin Range Output Pin
Received TRUE HIGH HIGH
Received FALSE HIGH LOW
Not Received TRUE LOW X
Not Received FALSE LOW X
Table 15: Output Truth Table for way-side receiver
The PLC will have five inputs as shown in Figure 31. The two digital signals from the way-side MCU, the stuck button, the polling button and the maintenance key button. The digital signal will determine if the test object is in range or out of range and if a signal was sent or not. The stuck button will determine if the test object is stuck or not stuck. The polling button will simulate different polling points as if the test object was moving around a track. The maintenance key button will simulate a key being inserted into a turn lock which will reset the ride stop request signal if
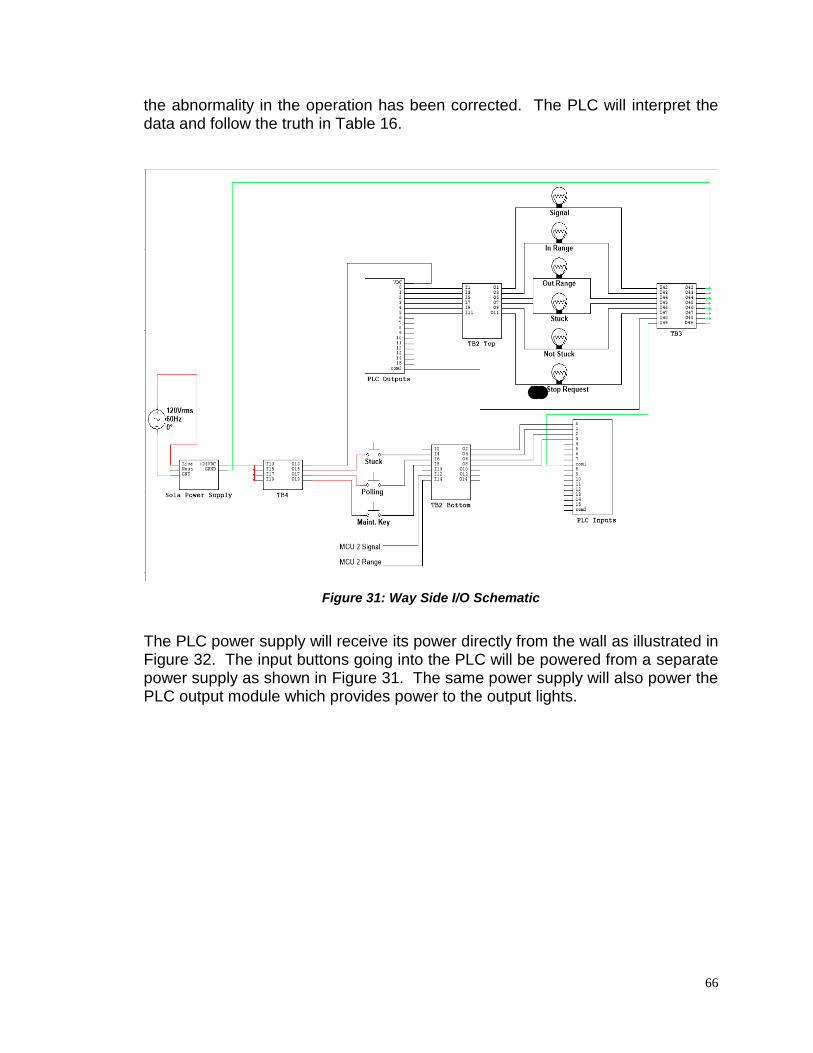
66
the abnormality in the operation has been corrected. The PLC will interpret the data and follow the truth in Table 16.
Figure 31: Way Side I/O Schematic
The PLC power supply will receive its power directly from the wall as illustrated in Figure 32. The input buttons going into the PLC will be powered from a separate power supply as shown in Figure 31. The same power supply will also power the PLC output module which provides power to the output lights.
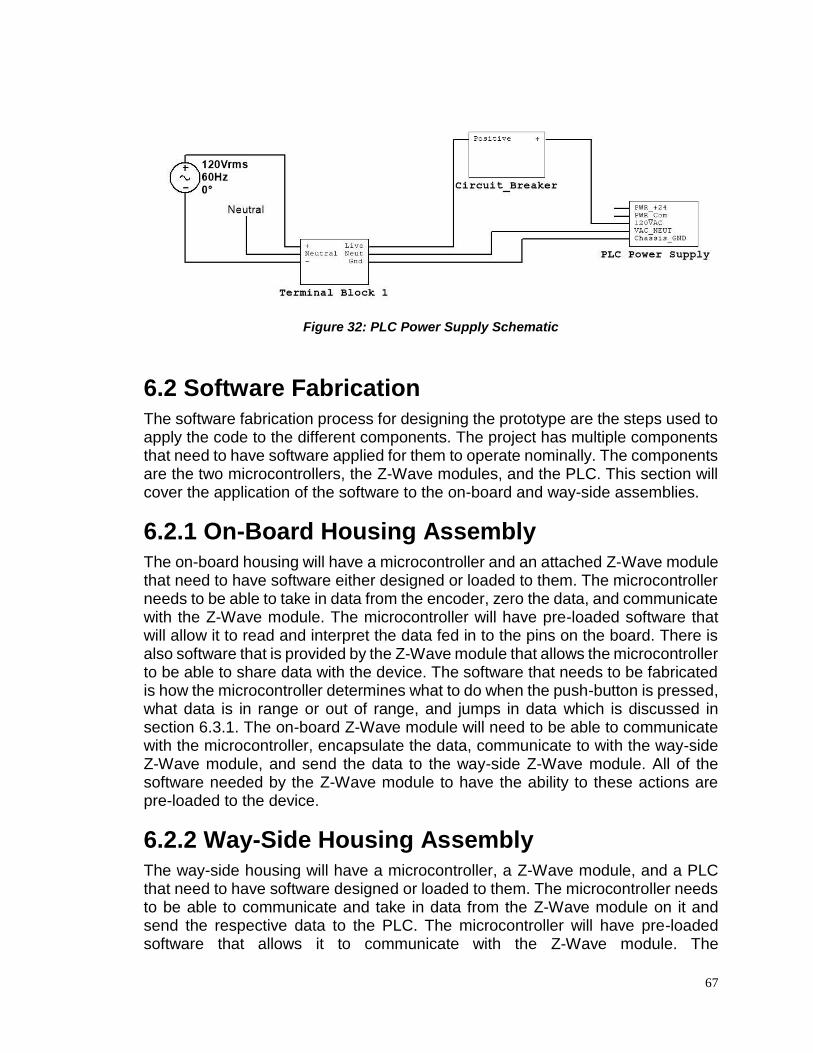
67
Figure 32: PLC Power Supply Schematic
6.2 Software Fabrication
The software fabrication process for designing the prototype are the steps used to apply the code to the different components. The project has multiple components that need to have software applied for them to operate nominally. The components are the two microcontrollers, the Z-Wave modules, and the PLC. This section will cover the application of the software to the on-board and way-side assemblies.
6.2.1 On-Board Housing Assembly The on-board housing will have a microcontroller and an attached Z-Wave module that need to have software either designed or loaded to them. The microcontroller needs to be able to take in data from the encoder, zero the data, and communicate with the Z-Wave module. The microcontroller will have pre-loaded software that will allow it to read and interpret the data fed in to the pins on the board. There is also software that is provided by the Z-Wave module that allows the microcontroller to be able to share data with the device. The software that needs to be fabricated is how the microcontroller determines what to do when the push-button is pressed, what data is in range or out of range, and jumps in data which is discussed in section 6.3.1. The on-board Z-Wave module will need to be able to communicate with the microcontroller, encapsulate the data, communicate to with the way-side Z-Wave module, and send the data to the way-side Z-Wave module. All of the software needed by the Z-Wave module to have the ability to these actions are pre-loaded to the device.
6.2.2 Way-Side Housing Assembly The way-side housing will have a microcontroller, a Z-Wave module, and a PLC that need to have software designed or loaded to them. The microcontroller needs to be able to communicate and take in data from the Z-Wave module on it and send the respective data to the PLC. The microcontroller will have pre-loaded software that allows it to communicate with the Z-Wave module. The
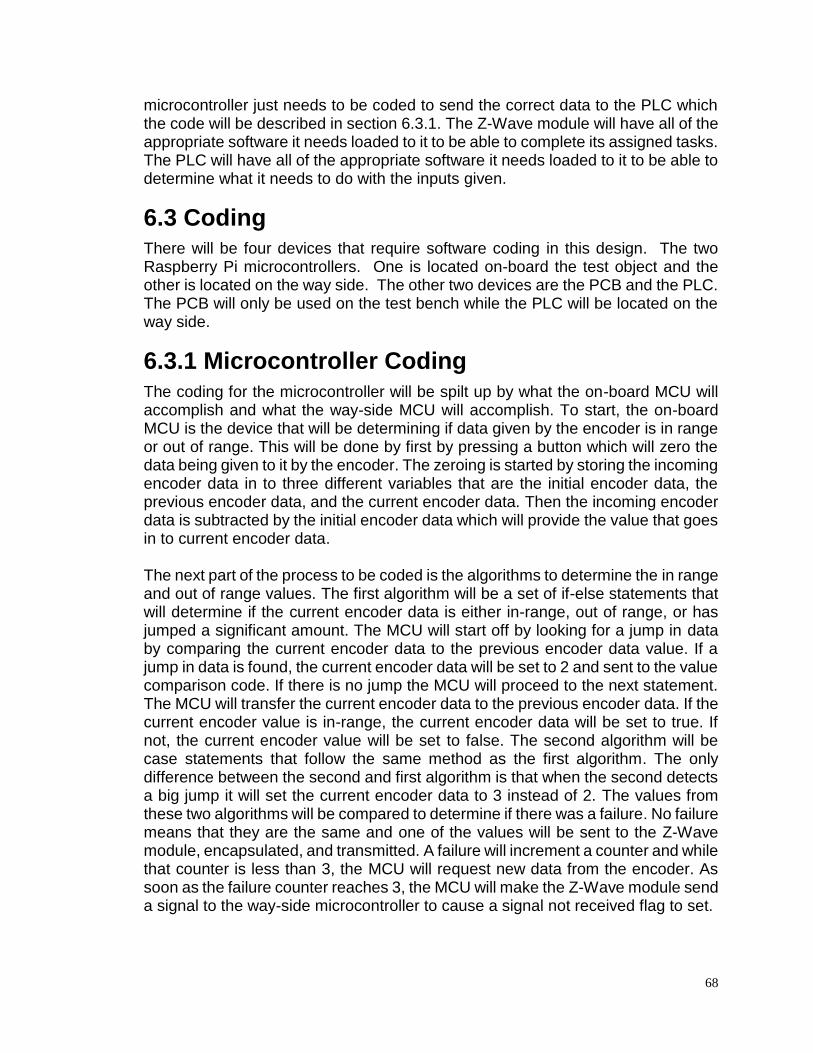
68
microcontroller just needs to be coded to send the correct data to the PLC which the code will be described in section 6.3.1. The Z-Wave module will have all of the appropriate software it needs loaded to it to be able to complete its assigned tasks. The PLC will have all of the appropriate software it needs loaded to it to be able to determine what it needs to do with the inputs given.
6.3 Coding There will be four devices that require software coding in this design. The two Raspberry Pi microcontrollers. One is located on-board the test object and the other is located on the way side. The other two devices are the PCB and the PLC. The PCB will only be used on the test bench while the PLC will be located on the way side.
6.3.1 Microcontroller Coding
The coding for the microcontroller will be spilt up by what the on-board MCU will accomplish and what the way-side MCU will accomplish. To start, the on-board MCU is the device that will be determining if data given by the encoder is in range or out of range. This will be done by first by pressing a button which will zero the data being given to it by the encoder. The zeroing is started by storing the incoming encoder data in to three different variables that are the initial encoder data, the previous encoder data, and the current encoder data. Then the incoming encoder data is subtracted by the initial encoder data which will provide the value that goes in to current encoder data. The next part of the process to be coded is the algorithms to determine the in range and out of range values. The first algorithm will be a set of if-else statements that will determine if the current encoder data is either in-range, out of range, or has jumped a significant amount. The MCU will start off by looking for a jump in data by comparing the current encoder data to the previous encoder data value. If a jump in data is found, the current encoder data will be set to 2 and sent to the value comparison code. If there is no jump the MCU will proceed to the next statement. The MCU will transfer the current encoder data to the previous encoder data. If the current encoder value is in-range, the current encoder data will be set to true. If not, the current encoder value will be set to false. The second algorithm will be case statements that follow the same method as the first algorithm. The only difference between the second and first algorithm is that when the second detects a big jump it will set the current encoder data to 3 instead of 2. The values from these two algorithms will be compared to determine if there was a failure. No failure means that they are the same and one of the values will be sent to the Z-Wave module, encapsulated, and transmitted. A failure will increment a counter and while that counter is less than 3, the MCU will request new data from the encoder. As soon as the failure counter reaches 3, the MCU will make the Z-Wave module send a signal to the way-side microcontroller to cause a signal not received flag to set.
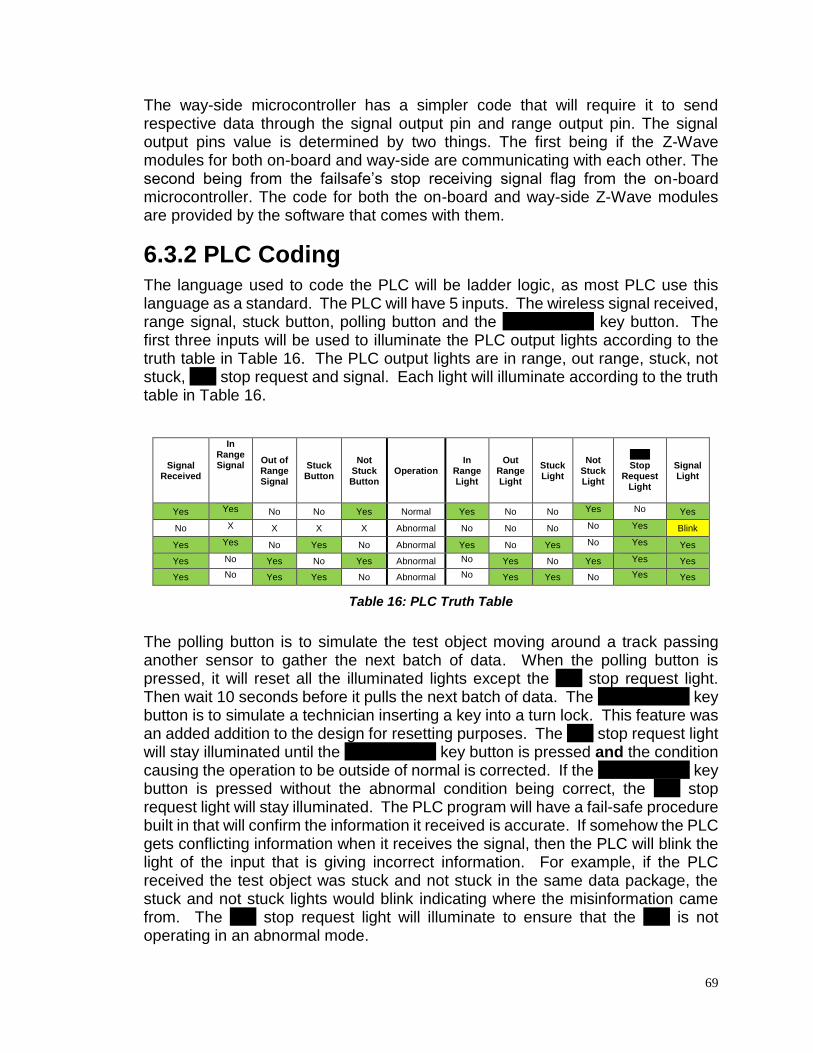
69
The way-side microcontroller has a simpler code that will require it to send respective data through the signal output pin and range output pin. The signal output pins value is determined by two things. The first being if the Z-Wave modules for both on-board and way-side are communicating with each other. The second being from the failsafe’s stop receiving signal flag from the on-board microcontroller. The code for both the on-board and way-side Z-Wave modules are provided by the software that comes with them.
6.3.2 PLC Coding The language used to code the PLC will be ladder logic, as most PLC use this language as a standard. The PLC will have 5 inputs. The wireless signal received, range signal, stuck button, polling button and the maintenance key button. The first three inputs will be used to illuminate the PLC output lights according to the truth table in Table 16. The PLC output lights are in range, out range, stuck, not stuck, ride stop request and signal. Each light will illuminate according to the truth table in Table 16.
Signal Received
In Range Signal
Out of Range Signal
Stuck Button
Not Stuck Button
Operation In
Range Light
Out Range Light
Stuck Light
Not Stuck Light
Ride Stop
Request Light
Signal Light
Yes Yes No No Yes Normal Yes No No Yes No Yes
No X X X X Abnormal No No No No Yes Blink
Yes Yes No Yes No Abnormal Yes No Yes No Yes Yes
Yes No Yes No Yes Abnormal No Yes No Yes Yes Yes
Yes No Yes Yes No Abnormal No Yes Yes No Yes Yes
Table 16: PLC Truth Table
The polling button is to simulate the test object moving around a track passing another sensor to gather the next batch of data. When the polling button is pressed, it will reset all the illuminated lights except the ride stop request light. Then wait 10 seconds before it pulls the next batch of data. The maintenance key button is to simulate a technician inserting a key into a turn lock. This feature was an added addition to the design for resetting purposes. The ride stop request light will stay illuminated until the maintenance key button is pressed and the condition causing the operation to be outside of normal is corrected. If the maintenance key button is pressed without the abnormal condition being correct, the ride stop request light will stay illuminated. The PLC program will have a fail-safe procedure built in that will confirm the information it received is accurate. If somehow the PLC gets conflicting information when it receives the signal, then the PLC will blink the light of the input that is giving incorrect information. For example, if the PLC received the test object was stuck and not stuck in the same data package, the stuck and not stuck lights would blink indicating where the misinformation came from. The ride stop request light will illuminate to ensure that the ride is not operating in an abnormal mode.
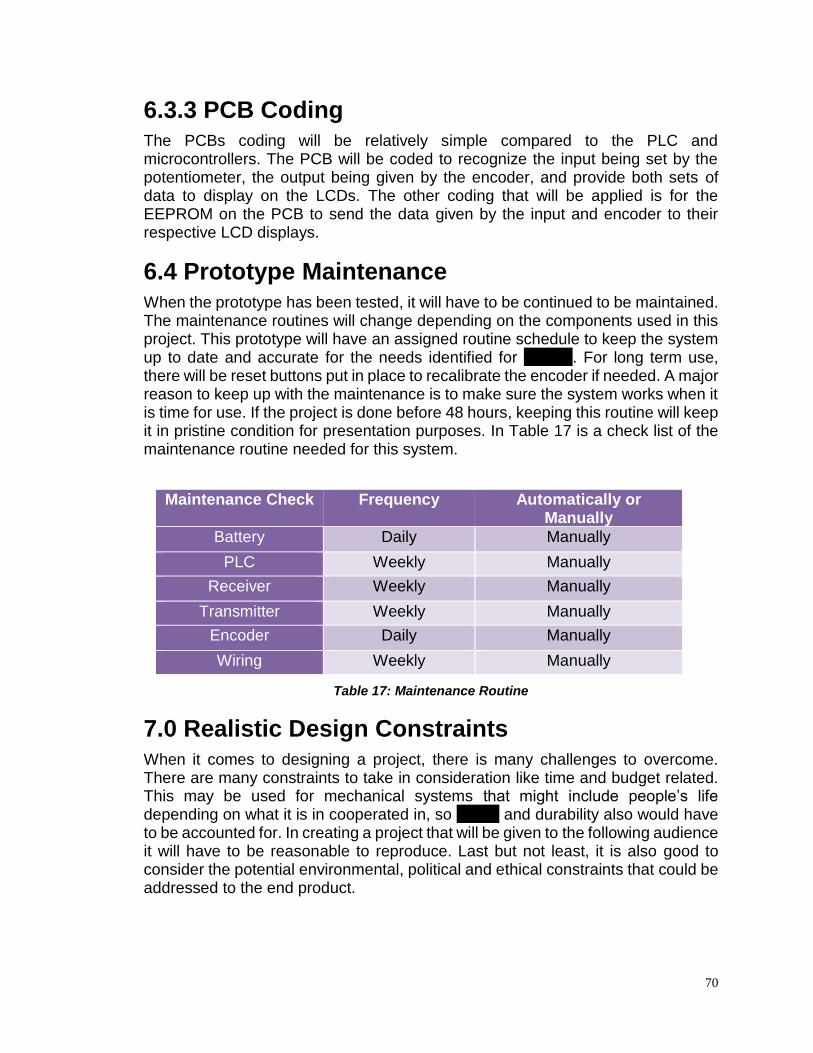
70
6.3.3 PCB Coding The PCBs coding will be relatively simple compared to the PLC and microcontrollers. The PCB will be coded to recognize the input being set by the potentiometer, the output being given by the encoder, and provide both sets of data to display on the LCDs. The other coding that will be applied is for the EEPROM on the PCB to send the data given by the input and encoder to their respective LCD displays.
6.4 Prototype Maintenance
When the prototype has been tested, it will have to be continued to be maintained. The maintenance routines will change depending on the components used in this project. This prototype will have an assigned routine schedule to keep the system up to date and accurate for the needs identified for Disney. For long term use, there will be reset buttons put in place to recalibrate the encoder if needed. A major reason to keep up with the maintenance is to make sure the system works when it is time for use. If the project is done before 48 hours, keeping this routine will keep it in pristine condition for presentation purposes. In Table 17 is a check list of the maintenance routine needed for this system.
Maintenance Check Frequency Automatically or Manually
Battery Daily Manually
PLC Weekly Manually
Receiver Weekly Manually
Transmitter Weekly Manually
Encoder Daily Manually
Wiring Weekly Manually
Table 17: Maintenance Routine
7.0 Realistic Design Constraints
When it comes to designing a project, there is many challenges to overcome. There are many constraints to take in consideration like time and budget related. This may be used for mechanical systems that might include people’s life depending on what it is in cooperated in, so safety and durability also would have to be accounted for. In creating a project that will be given to the following audience it will have to be reasonable to reproduce. Last but not least, it is also good to consider the potential environmental, political and ethical constraints that could be addressed to the end product.

71
7.1 Time and Economic Constraints Time is always against us, so using timely wisely is a goal for this. Construction is one of the most time-consuming aspects of this project. For instance, when ordering a part for the project, the shipping time plays in a great factor. If a broken or incorrect part is received, then that will cause more time to be used up waiting for the correct or fixed parts to come in. To help mitigate this problem, while some parts arrive is to start testing the components while the other parts are being waited on. Some parts of the project can’t be rushed, for examples, soldering on the components and putting on the electronics properly. The microcontroller and PLC will both have to be programmed which will also take a good amount of time. Using test benches and simulations can help get a running program, but like all things may not work correctly when it comes to programing the components. The programming of this project shouldn’t be too complicated, such as checking for an angle, then seeing if it is in range or out of range and displaying the correct output from the PLC. The aspect that might take a little more time is making sure that there is a good handshaking going on between the receiver and transmitter for the microcontrollers for fast and accurate reading. For this project the cost is not expected to be a lot. When choosing the parts, we chose to be a US company so shipping cost would not be extensive. We will be using a microcontroller that is used by Raspberry pi. In making things less stressful and time consuming we have chosen to do a Z-Wave module that will be compatible with the Raspberry Pi microcontroller so can just clip on the microcontroller versus applying extra wire not needed.
7.2 Manufacturability and Sustainability Constraints The manufacture and sustainability constraints are what would be found in any other project used for mechanical systems from construction to be integrating in robotics. We needed to take in consideration of how durable this product would be and how long would this project last. As well as taking in consideration of the portability of this project. This is considering the material the system is made from, the weight and size of it, and the power that will be used.
7.2.1 Durability and Expected lifetime
From the Disney aspect durability is a major concern for this project. The aspect lifetime of this project about 10 years or more with the proper maintenance based on educated estimates. The housing on this system goes in to contributing to this longevity of the system.

72
7.2.1.1 Durability The system must be water resistant. The relative humidity in Orlando, FL can range, on average, between 45% to 95% in the summer with an average dew point between 65-75 in the summer (Florida Climate Center, 2018). This type of weather pattern allows for increased condensation concerns, the likelihood of fog as well as higher potential for rain chances. The on-board encoder is an absolute magnetic shaft encoder. This means that all internal components of the encoder are sealed inside the casing, so moisture cannot access the internal parts. The only exposed portion of the encoder are the pins which will be connected to the microcontroller by clip connectors with heat shrink. All other on-board components will be inside a weatherproof case. The case is an L-Com Weatherproof Windowed Enclosure which is NEMA rated type 4 and IP66 rated. NEMA type 4 rated is a rating that signifies the enclosure is protected from windblown dust, falling dirt, water and the formation of ice. IP66 rated specifies that the enclosure is dust tight, protected against heavy seas, and powerful jets of water. Inside the case will be two Dry & Dry 5-gram Silica packets and a Dry & Dry Humidity Indicator. The 5-gram packets are each rated to absorb humidity in a 600-cubic inch container, so putting two in the case helps with Florida's humidity. The indicator card changes from green to violet when the humidity inside the enclosure reaches 30% and when this happens the card and packets need to be swapped. The only way-side components that could be exposed to extreme moisture conditions would be the receiving microcontroller. This component would also be encased in a weather proof case and its power supply operating humidity range is 20-85%. The PLC would be inside an enclosure somewhere on the way-side and the display lights would be on a panel located either at the load and unload area or in a control room.
7.2.2 Portability
Given that Disney did want this to be a concept to be mobile, it is essential that this system will be a reasonable size and weight. The aim is to have a system in a 12x 12 x 12-inch surface. The weight should be fair enough where it would not make a big difference in affecting the object movement.
7.2.2.1 Light Weight/ Relatively Small The encoder is a miniature encoder that has a diameter of .48 inches therefore the weight will be negligible. The encoder coupling will be about 1 inch in length with ¼” to ¼” bores making the weight negligible. The battery has dimensions of 6.22 x 2.33 x 2.40 inches weighing at 2.8lbs. Attached to the battery will be a voltage divider that is 2.4 x 1.3x 0.5 in. and weights 0.04 lbs. The Raspberry Pi microcontroller is 3.37" x 2.22" x 0.74" and weighs 0.1 lbs. The attached RaZberry

73
Z-Wave Module is 0.78" x 1.57" x 0.20" and weighs 0.035 lbs. The Powerwerx Watt Meter is 3.3" x 1.7" x 1.0" and weighs 0.18 lbs. The Raspberry Pi Power Supply is 2.88" x 1.78" x 1.38" and weighs 0.33 lbs. The L-Com Weatherproof Windowed Enclosure has outside dimensions of 13.3" x 11.3" x 5.5" and inside dimensions 12" x 10" x 4.8" and weighs 6.3 lbs. The Dry&Dry Silica packets are 2" x 2.75" and weigh 0.011 lbs. each. The Dry&Dry Humidity Indicators are 1.5" x 4.5" each and their weight is negligible.
7.3 Health, Safety, and Environmental Constraints For this system use of audience it should be safe for all use if properly constructed. There are a few components that could be dangerous or harmful. The factors that must be considered in the design is anything electrical that can cause an electrical shock or fire.
7.3.1 Hazardous Analysis
The hazardous analysis is a potential off all danger or warning applications that could happen in this project. The likelihood is an analysis of how often something can occur. The fault tree helps identify the cause and effect of components in the system. The FMEA will try to trouble shoot the situation by figure out the main cause of what could potentially happen. All three analyses are in the following sections below.
7.3.1.1 Likelihood The likelihood is the probability of a consequence occurring from a failure or mishap and considering the defined mitigations. Table 18 is a summary of the mishaps and the risk associated to it. Starting from the left of the high risk that is in red to be unacceptable to the right that is negligible risk that is in the green for acceptance.
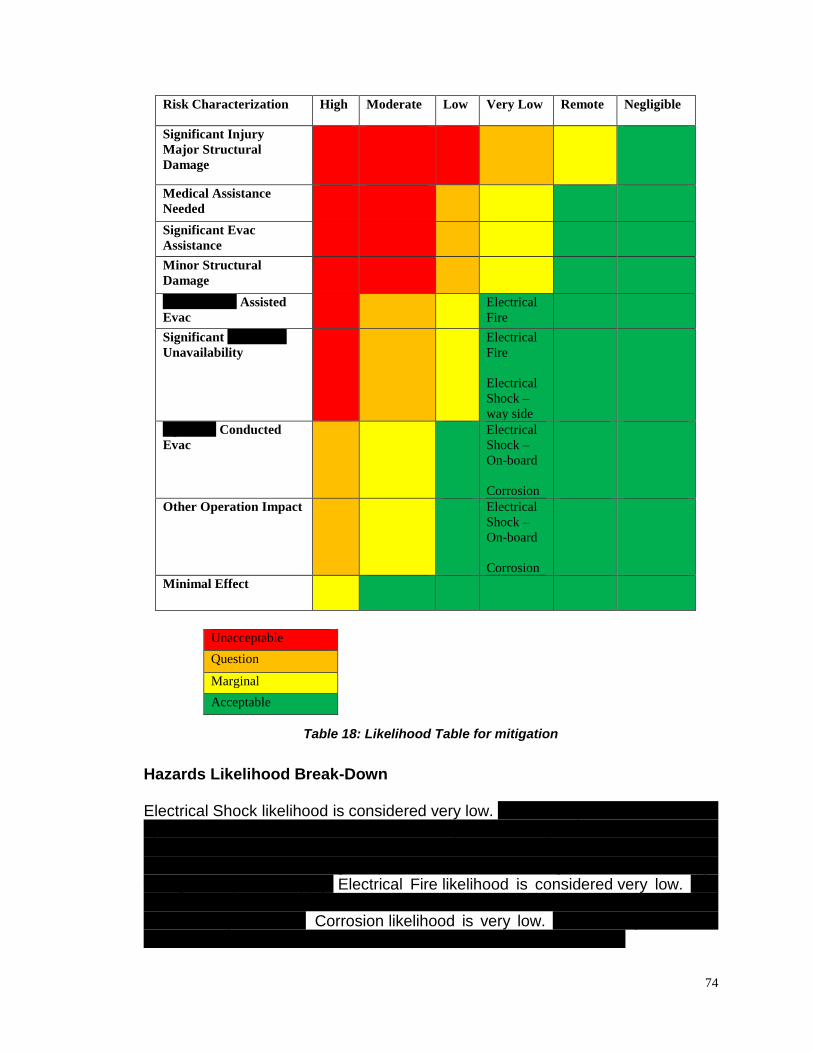
74
Risk Characterization High Moderate Low Very Low Remote Negligible
Significant Injury
Major Structural
Damage
Medical Assistance
Needed
Significant Evac
Assistance
Minor Structural
Damage
Maintenance Assisted
Evac
Electrical
Fire
Significant Attraction
Unavailability
Electrical
Fire
Electrical
Shock –
way side
Operator Conducted
Evac
Electrical
Shock –
On-board
Corrosion
Other Operation Impact Electrical
Shock –
On-board
Corrosion
Minimal Effect
Table 18: Likelihood Table for mitigation
Hazards Likelihood Break-Down Electrical Shock likelihood is considered very low. The severity for the on-board is operator conducted evacuation and other operational impact columns due to the low voltage DC power supply. The severity for the way-side is maintenance assisted evacuation and significant attraction unavailability columns due to high voltage AC power supply. Electrical Fire likelihood is considered very low. The severity for this is maintenance assisted evacuation and significant attraction unavailability columns. Corrosion likelihood is very low. The severity for this is operator conducted evacuation and other operation impact columns.
Unacceptable
Question
Marginal
Acceptable
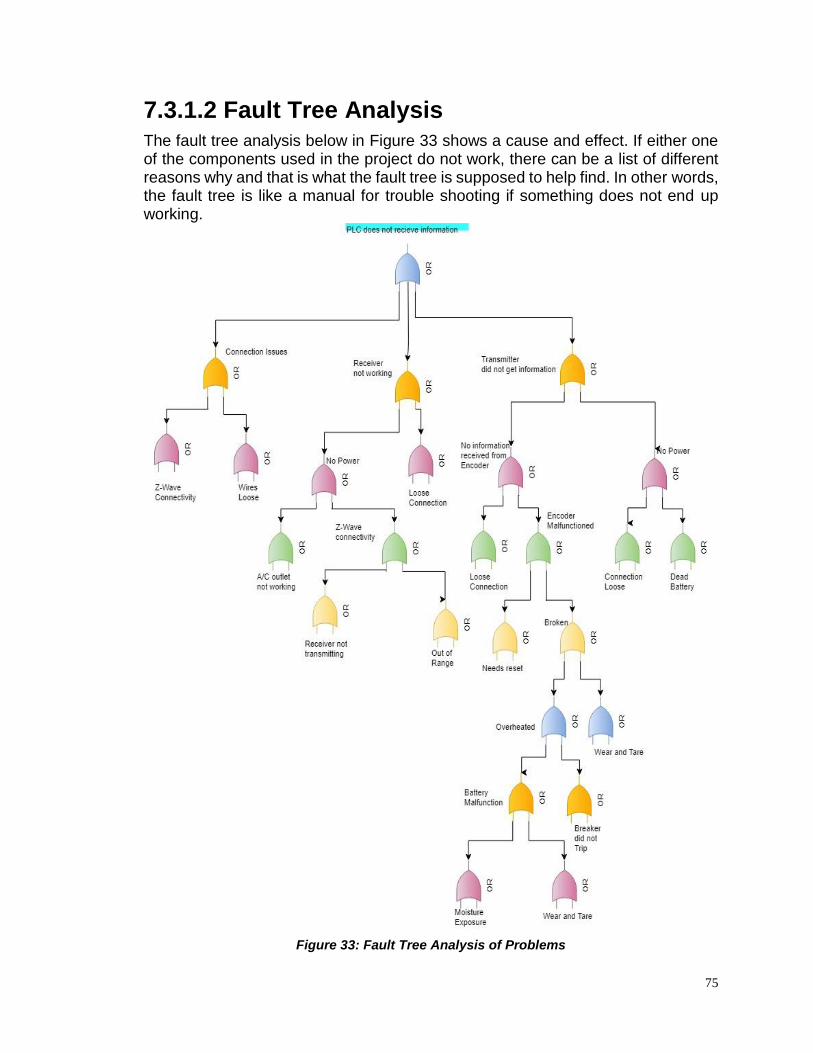
75
7.3.1.2 Fault Tree Analysis The fault tree analysis below in Figure 33 shows a cause and effect. If either one of the components used in the project do not work, there can be a list of different reasons why and that is what the fault tree is supposed to help find. In other words, the fault tree is like a manual for trouble shooting if something does not end up working.
Figure 33: Fault Tree Analysis of Problems

76
7.3.1.3 FMEA’s Components fail all the time but when it fails there could be a domino effect that can happen. In Figure 34 shows each failure, and what that failure would effect on each of the other components. Starting by identifying the parts that are in the system. Then identifying how the parts could fail. Finally, determining the resultant effects of the failures relative to the undesired outcomes. For the Failure Modes and Effects Analysis is effective at making sure that every part of the system is considered and knowing the common failures, where the original failure can lead to other failures.
Figure 34: Failure Modes and Effects Analysis (FMEA)
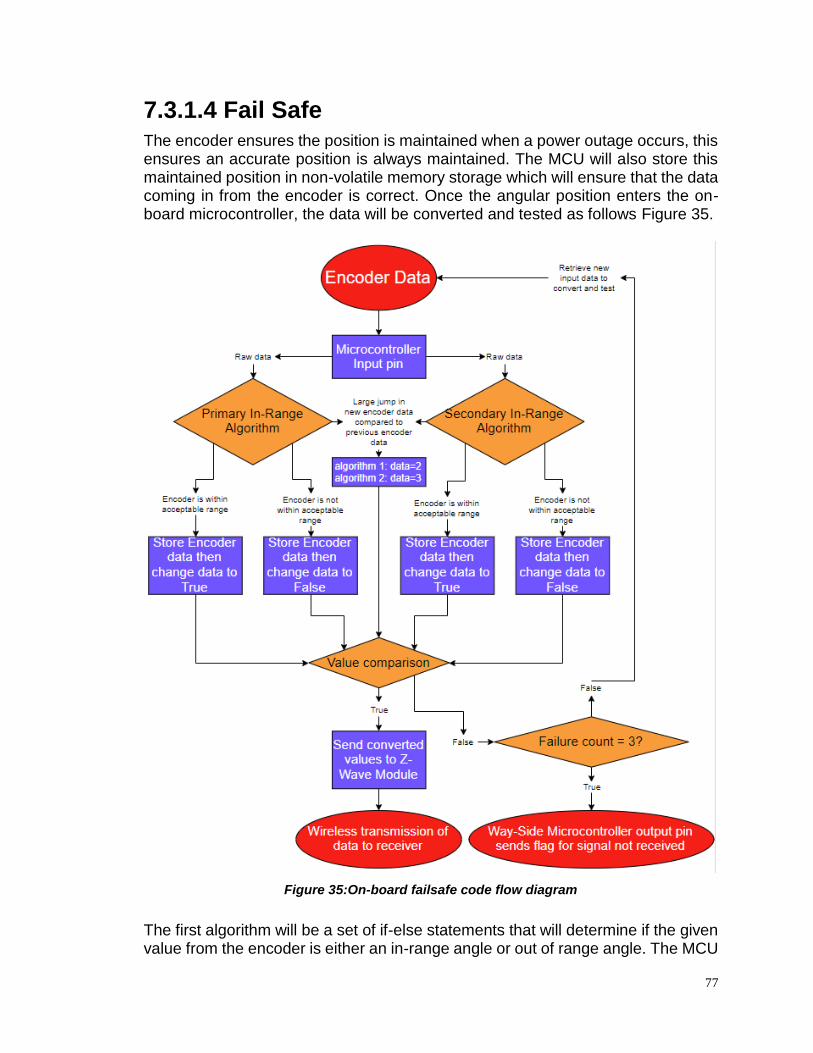
77
7.3.1.4 Fail Safe The encoder ensures the position is maintained when a power outage occurs, this ensures an accurate position is always maintained. The MCU will also store this maintained position in non-volatile memory storage which will ensure that the data coming in from the encoder is correct. Once the angular position enters the on-board microcontroller, the data will be converted and tested as follows Figure 35.
Figure 35:On-board failsafe code flow diagram
The first algorithm will be a set of if-else statements that will determine if the given value from the encoder is either an in-range angle or out of range angle. The MCU
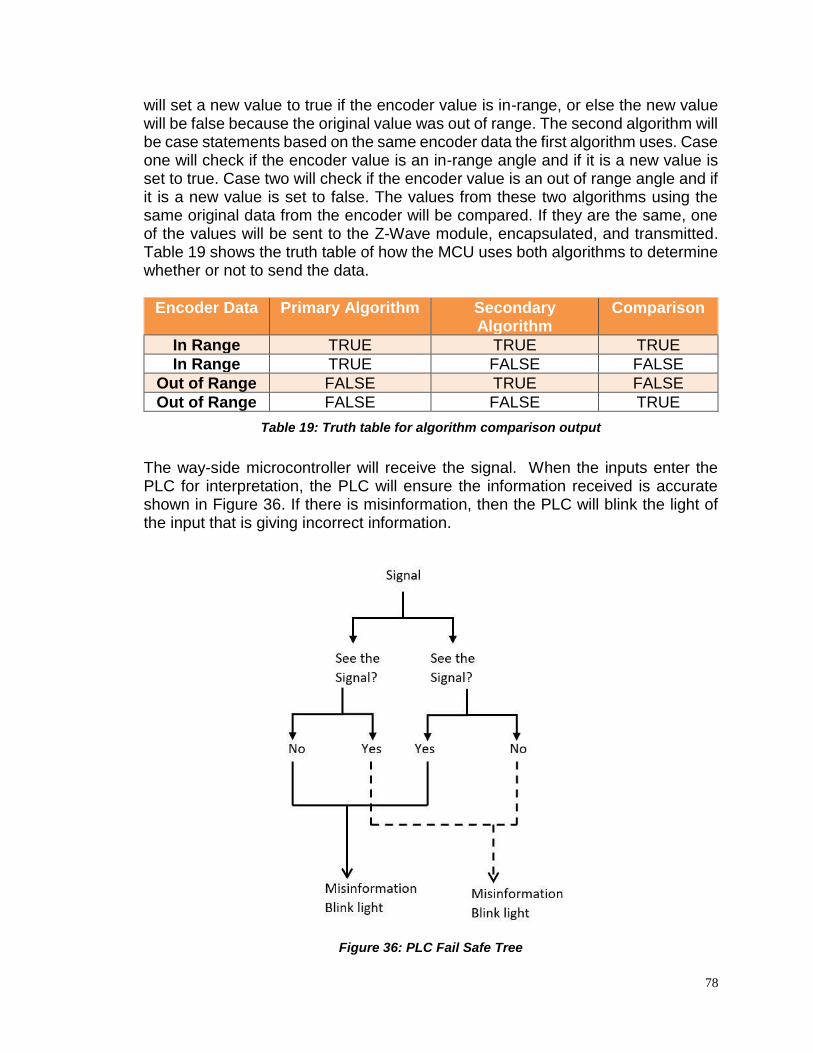
78
will set a new value to true if the encoder value is in-range, or else the new value will be false because the original value was out of range. The second algorithm will be case statements based on the same encoder data the first algorithm uses. Case one will check if the encoder value is an in-range angle and if it is a new value is set to true. Case two will check if the encoder value is an out of range angle and if it is a new value is set to false. The values from these two algorithms using the same original data from the encoder will be compared. If they are the same, one of the values will be sent to the Z-Wave module, encapsulated, and transmitted. Table 19 shows the truth table of how the MCU uses both algorithms to determine whether or not to send the data.
Encoder Data Primary Algorithm Secondary Algorithm
Comparison
In Range TRUE TRUE TRUE
In Range TRUE FALSE FALSE
Out of Range FALSE TRUE FALSE
Out of Range FALSE FALSE TRUE
Table 19: Truth table for algorithm comparison output
The way-side microcontroller will receive the signal. When the inputs enter the PLC for interpretation, the PLC will ensure the information received is accurate shown in Figure 36. If there is misinformation, then the PLC will blink the light of the input that is giving incorrect information.
Figure 36: PLC Fail Safe Tree
79
7.3.2 Environmental Constraints Our sponsor wanted this system to be robust. The robust aspects we considered was Florida weather conditions. In considering the weather changes the components chosen would be able to withstand these conditions. The other aspects that were takin into consideration was the temperature, wind, and light/dark environments.
7.3.2.1 Temperature
Florida has a record low of 19°F in 1985 and a record high of 101°F in 1998. On average, temperature range is between the low 50’s (Fahrenheit) and the mid 90’s (Fahrenheit) (Intellicast, 2018). The encoder has an operating temperature of -40°F to 257°F which well exceeds any temperature extreme encountered in Florida. The battery is a lithium polymer that can tolerate up to 140°F until thermal runaway occurs. Thermal runaway is when the battery heats up until the battery finally erupts in flame. Below 14°F, the shorter the run times which slows down the reaction within the battery, which could cause sudden failure. The voltage regulator operating temperature is -40°F up to 185°F. The PLC operating temperature is 32°F to 140°F which could cause a concern in low temperatures if stored outside, but the PLC will be located in an enclosure somewhere on way-side. This would eliminate any low temperature apprehensions. The Raspberry Pi 2 model B and RaZberry Z-Wave module have the same operating temperature of -40°F to 158°F. The Raspberry Pi Power Supply's operating temperatures are 32°F to 104°F. The L-Com Weatherproof Windowed Enclosure, Dry & Dry Silica packets and humidity indicators have negligible temperature tolerances.
7.3.2.2 Wind Florida is known for its hurricane potential, so wind gusts and sustained winds can be extremely high, but this is outside normal ride operating conditions. On average, the winds in Orlando, FL do not exceed 10 mph with gusts up to 30 mph (Florida Climate Center, 2018). Even with gusts up to 30 mph, none of the components are susceptible to wind. The encoder would be mounted to the test object and all other onboard components would be encased. The way-side microcontroller would be encased as well. The PLC will be in an enclosure and the display lights will be on a panel inside.

80
7.3.2.3 Light/ Dark Florida averages between 10 hours and 14 hours of daylight each day depending on the time of year (Time and Date, 2018). Normal park operating hours can easily extend from daylight hours into the night and a ride track can shift from inside zones to outside zones and vice versa. None of the components are light sensitive meaning each component can operate at high levels of light and complete absence of light.
7.4 Ethical, Social, and Political
In any project it is important to weigh in any social, ethical, or political constraints. The last thing anyone wants in building a project is any upset people towards the design. For this project, no ethical constraints are really needed. There is no certain ethnic part that of this project that would make anyone angry or not be able to consider. One social constraint is that this project was created with a team based in US and the primary language would be English. This is not of great concern because any manual created or etc. can be translated to many other languages. For the political aspect there is nothing the team is aware of that would be a contribute to a political constraint on this project.
7.5 Sponsor Constraints The system can meet all the requirements listed by our sponsor Disney. Table 20 and Table 21 list each requirement / specification and how each component meets those requirements / specifications. These tables are meant to be a quick reference guide and are not all inclusive. For further details, see each requirement details listed throughout section 7.0 Realistic Design Constraints.
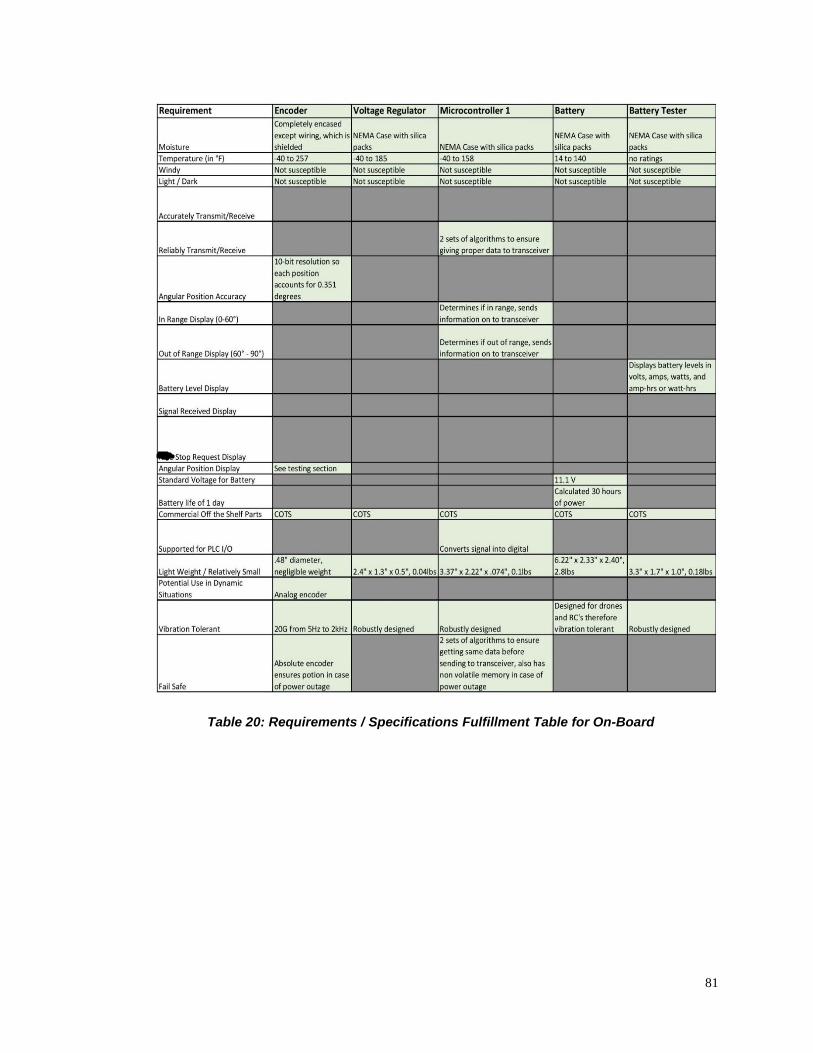
81
Table 20: Requirements / Specifications Fulfillment Table for On-Board
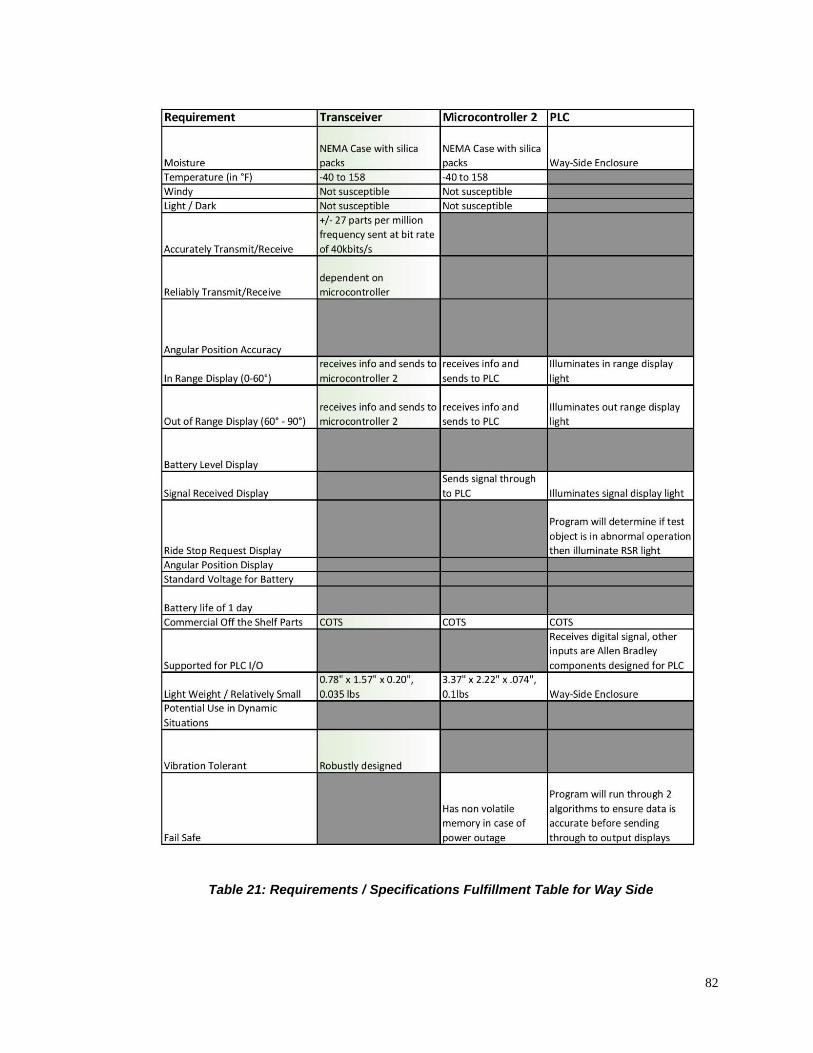
82
Table 21: Requirements / Specifications Fulfillment Table for Way Side
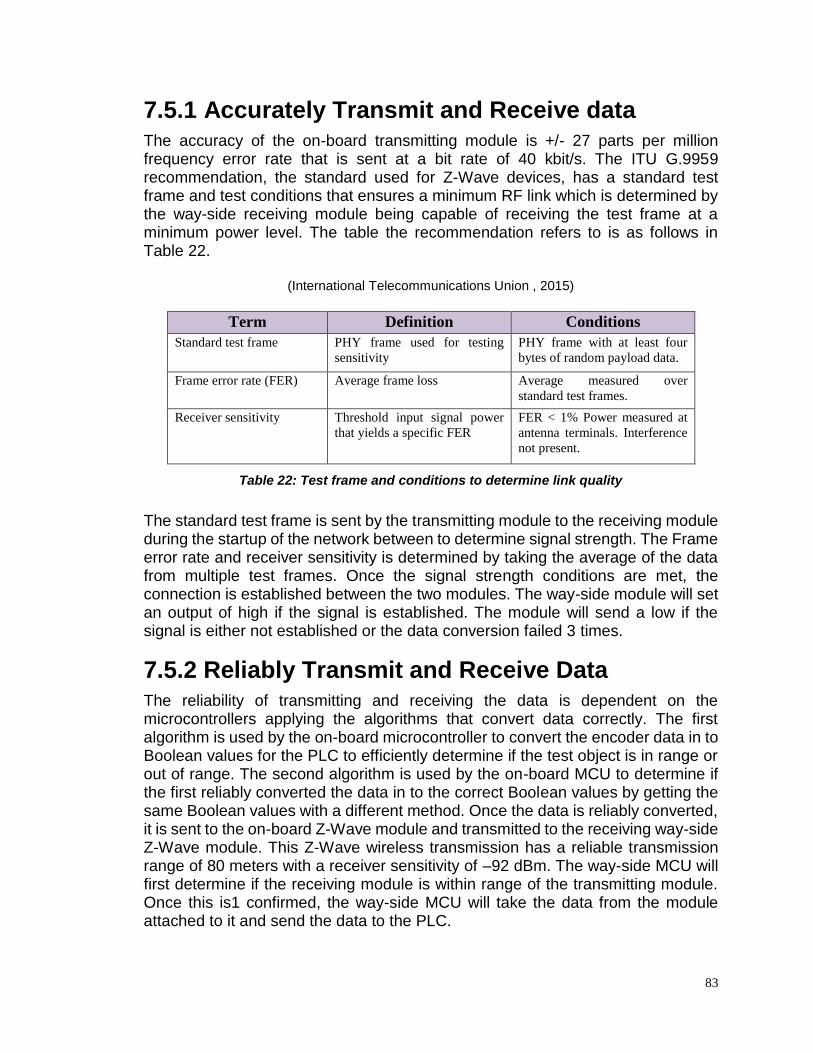
83
7.5.1 Accurately Transmit and Receive data The accuracy of the on-board transmitting module is +/- 27 parts per million frequency error rate that is sent at a bit rate of 40 kbit/s. The ITU G.9959 recommendation, the standard used for Z-Wave devices, has a standard test frame and test conditions that ensures a minimum RF link which is determined by the way-side receiving module being capable of receiving the test frame at a minimum power level. The table the recommendation refers to is as follows in Table 22.
(International Telecommunications Union , 2015)
Term Definition Conditions
Standard test frame PHY frame used for testing
sensitivity
PHY frame with at least four
bytes of random payload data.
Frame error rate (FER) Average frame loss Average measured over
standard test frames.
Receiver sensitivity Threshold input signal power
that yields a specific FER
FER < 1% Power measured at
antenna terminals. Interference
not present.
Table 22: Test frame and conditions to determine link quality
The standard test frame is sent by the transmitting module to the receiving module during the startup of the network between to determine signal strength. The Frame error rate and receiver sensitivity is determined by taking the average of the data from multiple test frames. Once the signal strength conditions are met, the connection is established between the two modules. The way-side module will set an output of high if the signal is established. The module will send a low if the signal is either not established or the data conversion failed 3 times.
7.5.2 Reliably Transmit and Receive Data The reliability of transmitting and receiving the data is dependent on the microcontrollers applying the algorithms that convert data correctly. The first algorithm is used by the on-board microcontroller to convert the encoder data in to Boolean values for the PLC to efficiently determine if the test object is in range or out of range. The second algorithm is used by the on-board MCU to determine if the first reliably converted the data in to the correct Boolean values by getting the same Boolean values with a different method. Once the data is reliably converted, it is sent to the on-board Z-Wave module and transmitted to the receiving way-side Z-Wave module. This Z-Wave wireless transmission has a reliable transmission range of 80 meters with a receiver sensitivity of –92 dBm. The way-side MCU will first determine if the receiving module is within range of the transmitting module. Once this is1 confirmed, the way-side MCU will take the data from the module attached to it and send the data to the PLC.
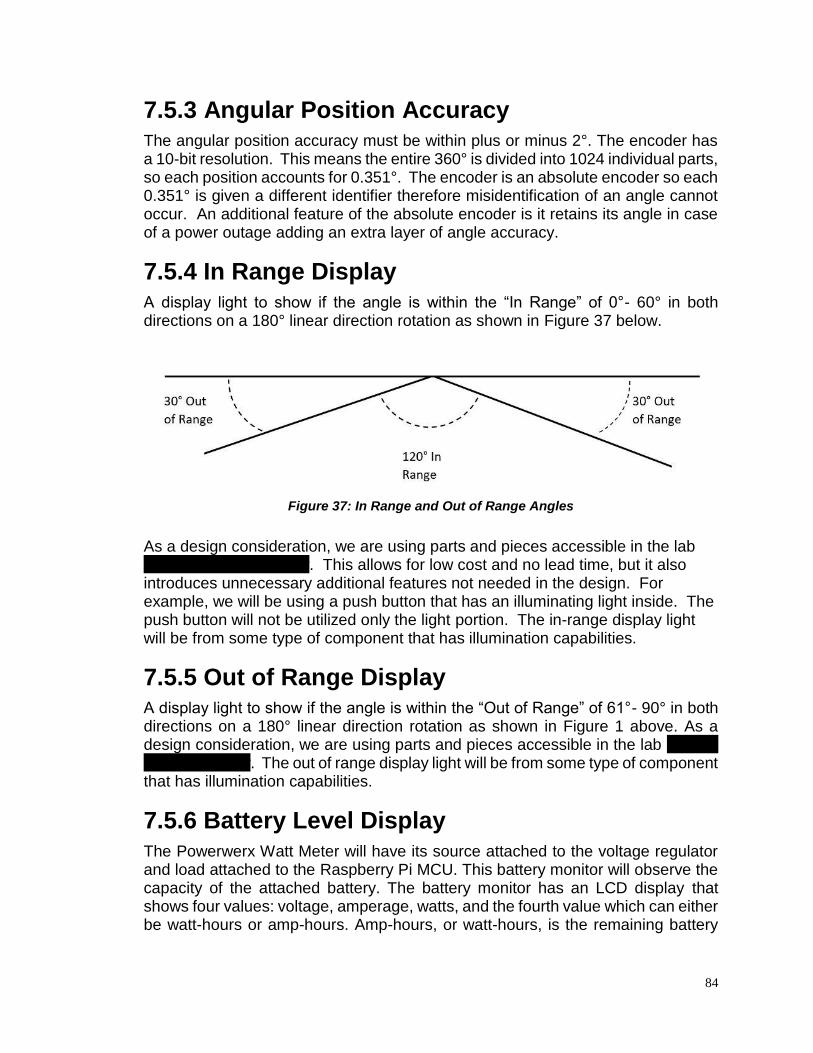
84
7.5.3 Angular Position Accuracy The angular position accuracy must be within plus or minus 2°. The encoder has a 10-bit resolution. This means the entire 360° is divided into 1024 individual parts, so each position accounts for 0.351°. The encoder is an absolute encoder so each 0.351° is given a different identifier therefore misidentification of an angle cannot occur. An additional feature of the absolute encoder is it retains its angle in case of a power outage adding an extra layer of angle accuracy.
7.5.4 In Range Display
A display light to show if the angle is within the “In Range” of 0°- 60° in both directions on a 180° linear direction rotation as shown in Figure 37 below.
Figure 37: In Range and Out of Range Angles
As a design consideration, we are using parts and pieces accessible in the lab located at Ride & Show. This allows for low cost and no lead time, but it also introduces unnecessary additional features not needed in the design. For example, we will be using a push button that has an illuminating light inside. The push button will not be utilized only the light portion. The in-range display light will be from some type of component that has illumination capabilities.
7.5.5 Out of Range Display A display light to show if the angle is within the “Out of Range” of 61°- 90° in both directions on a 180° linear direction rotation as shown in Figure 1 above. As a design consideration, we are using parts and pieces accessible in the lab located at Ride & Show. The out of range display light will be from some type of component that has illumination capabilities.
7.5.6 Battery Level Display
The Powerwerx Watt Meter will have its source attached to the voltage regulator and load attached to the Raspberry Pi MCU. This battery monitor will observe the capacity of the attached battery. The battery monitor has an LCD display that shows four values: voltage, amperage, watts, and the fourth value which can either be watt-hours or amp-hours. Amp-hours, or watt-hours, is the remaining battery
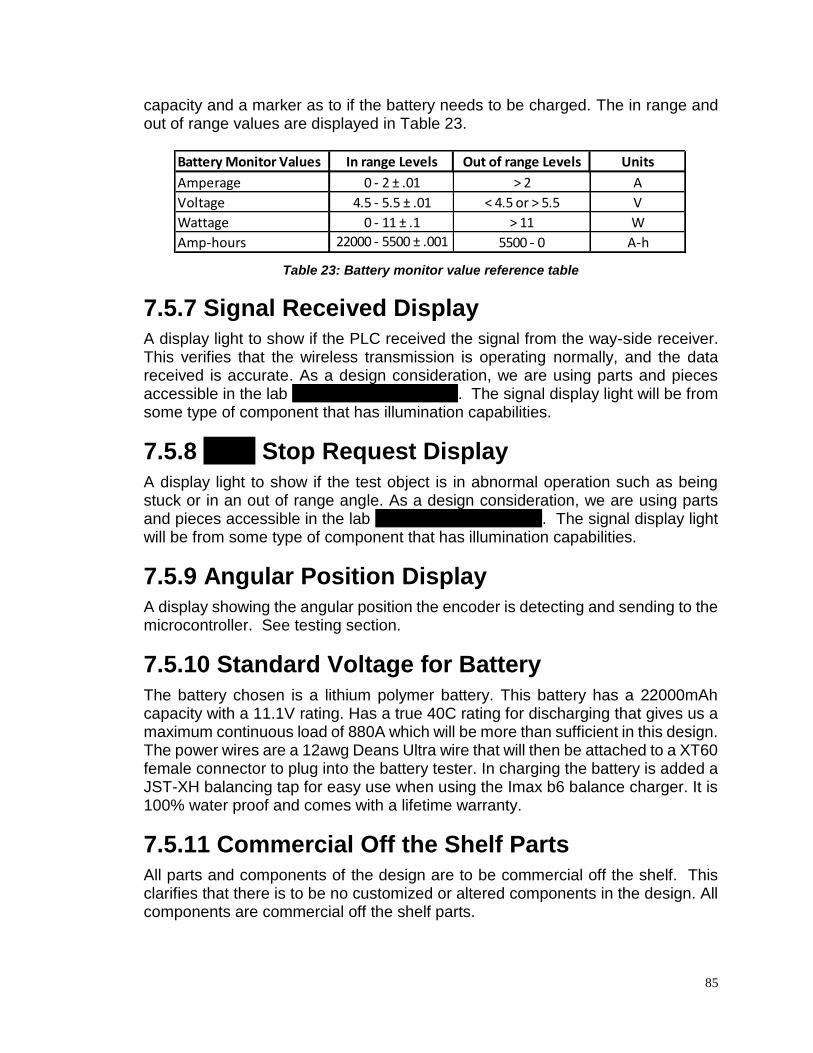
85
capacity and a marker as to if the battery needs to be charged. The in range and out of range values are displayed in Table 23.
Table 23: Battery monitor value reference table
7.5.7 Signal Received Display A display light to show if the PLC received the signal from the way-side receiver. This verifies that the wireless transmission is operating normally, and the data received is accurate. As a design consideration, we are using parts and pieces accessible in the lab located at Ride & Show. The signal display light will be from some type of component that has illumination capabilities.
7.5.8 Ride Stop Request Display
A display light to show if the test object is in abnormal operation such as being stuck or in an out of range angle. As a design consideration, we are using parts and pieces accessible in the lab located at Ride & Show. The signal display light will be from some type of component that has illumination capabilities.
7.5.9 Angular Position Display A display showing the angular position the encoder is detecting and sending to the microcontroller. See testing section.
7.5.10 Standard Voltage for Battery
The battery chosen is a lithium polymer battery. This battery has a 22000mAh capacity with a 11.1V rating. Has a true 40C rating for discharging that gives us a maximum continuous load of 880A which will be more than sufficient in this design. The power wires are a 12awg Deans Ultra wire that will then be attached to a XT60 female connector to plug into the battery tester. In charging the battery is added a JST-XH balancing tap for easy use when using the Imax b6 balance charger. It is 100% water proof and comes with a lifetime warranty.
7.5.11 Commercial Off the Shelf Parts All parts and components of the design are to be commercial off the shelf. This clarifies that there is to be no customized or altered components in the design. All components are commercial off the shelf parts.
Battery Monitor Values In range Levels Out of range Levels Units
Amperage 0 - 2 ± .01 > 2 A
Voltage 4.5 - 5.5 ± .01 < 4.5 or > 5.5 V
Wattage 0 - 11 ± .1 > 11 W
Amp-hours 22000 - 5500 ± .001 5500 - 0 A-h
86
7.5.12 Supported for PLC I/O The information sent wireless must be able to be interpreted by a PLC and the outputs are to be handled by the PLC. The inputs coming into the PLC input module are designed for proper handling by the PLC. All output display lights will be handled by the PLC output module.
7.5.13 Potential Use in Dynamic Situations/ Environments The design must be able to handle analog information allowing it to be placed in a real-world application. The encoder is designed to give an analog output angle. This information is sent to the microcontroller which translates the information into digital form. This allows for the encoder to read in real time with no down time for sampling.
7.5.14 Vibration Tolerant
The components on the test object must be vibration tolerant. They battery is designed for drone and RC’s, so the vibration tolerance will be well sufficient for this design. The voltage regulator, Raspberry Pi, RaZberry Z-Wave Module, Powerwerx Watt Meter, Raspberry Pi Power Supply, L-Com Weatherproof Windowed Enclosure, Dry&Dry Humidity Indicator, and Dry&Dry Silica packets are all robustly designed for vibration tolerance. The encoder is rated for 20G from 5Hz to 2kHz.
8.0 Project Assembly After the power supply for the On-board system was completely assembled and functioning properly, the next step was to get the Raspberry Pi with the ZWave.me RaZberry device functional and powered by the On-Board power supply. First, the MCU was installed with the necessary software to boot to its operating system that way the RaZberry could be properly activated. The RaZberry was initialized by downloading pre-built software from the manufacturer that set up a user interface to test the communication capabilities of the module. Once the On-board MCU was initially set up, the Way-Side MCU was initialized the same way. The next step was to confirm that the On-Board and Way-Side modules could communicate with each other before applying the customized software for our project. Following the communication confirmation, the Way-side was designated as the device to get values from the network of the Z-Wave modules and the On-Board was to set these values based on the input it received from the encoder. The next step in this process was to access the header files that controlled the command classes for the Z-Wave devices and create a program that could set and get values for the basic command class. The final steps in the process was to get the On-Board MCU to set the basic command class to True or False based on the conditions previously stated in this document and for the Way-Side to get those values from the basic command

87
class. Once these were both ready and the conditional programming was loaded to the On-Board MCU, the MCU was attached to the power supply using the microUSB connector it had attached. Lastly, the pin that was being utilized on the On-Board MCU was attached and ready to go to the test bench. The test bench was our PCB that we created to help visualize the angle being set as an input and what the encoder was sending as an angle to the On-Board MCU as a range. The encoder is powered by the 5 volt and ground pins on the MCU and the data is fed in through a pin to the PCB test bench. The PCB itself was assembled by first creating a schematic that had all of the proper components attached and pins for power and inputs. A board was created from this schematic and then sent to a PCB manufacturer. The parts were then ordered from mouser and then soldered on to the PCB and tested to make sure that it could power up and receive the proper inputs. The PCB has a pin out that holds the encoder range that the On-Board MCU receives. This range is what sets the conditional statements to either True or False and subsequently sets the basic command class of the Z-Wave network to either on or off respectively. The PCB is also connected to power using a microUSB connector to a wall outlet and the PCB also provides power to the servo motor that sets the input angle and rotates the coupler attached to the encoder. Finally, with the PCB wired up and powered, the encoder powered and wired, and the enclosed MCU wired and powered this completed our On-Board assembly process. The Way-Side assembly was done by first providing power to the MCU by attaching a microUSB power supply to the power strip powering the Way-Side components. Once the MCU had power, the pins that carried the signal and range outputs were wired up to an ATMega328 to step the 3.3 Volt outputs to the 5 Volt output minimum required by the step-up voltage regulators to get them to a proper 10-12 Volts to be recognized by the PLC. The step-up voltage regulators were receiving power on the input side from the ATMega328 outputs and respective grounds. The output side of the voltage regulator was grounded to the SOLA power supply and provided the necessary 10-12 Volt output for the PLC to recognize the inputs as off or on.
9.0 Project Prototype Testing In testing the components, a test plan will be developed. This will help ensure that the components and the devices will work in the intensions we are expecting from each datasheet. The testing will be extensive and will include each testing of the tasks. With these plans will help ensure the readings and the results are being accurate that is being outputted. First, the construction of the testing will start off with the characteristics that are going to be outlined in each data sheet to test the basics of each component. In knowing this will help secure the primary functions in the components.
88
9.1 Microcontroller Testing The microcontroller will start being tested by hooking up a keyboard, mouse, ethernet cable, USB to microUSB power cable, and HDMI cable. This will allow the ability to program the Raspberry Pi 2 with an easy to navigate graphical user interface. The ethernet cable being hooked up will allow the microcontroller to acquire its necessary software to code it. Having the interface will allow the ability to see in real-time what is going on in the microcontroller. The testing will be done by inputting different values in to the code stated above in 6.3.1.
9.2 Encoder Testing
The test bench will have a PCB that has either two LCDs or one LCD with the ability to display on two separate lines. The input LCD will display the angle that we are inputting into the encoder. The output LCD will display the angle coming out of the encoder. This will test the encoders ability to accurately read and transmit the correct angle.
9.3 Test Environment For testing purposes, the test object will be stationary. In actual application, the test object would be moving around a track or in some way have movement. This means we will be testing movement scenarios, such as polling points and the test object being stuck, in other ways. (see section 6.3.2 PLC coding for greater details).
9.4 Transmitter Test Procedures
The transmitter test procedures are set by the Z-Wave modules. The only thing that needs to be done manually is setting the NodeIDs of the modules and putting them on the same HomeID. Once this is done the modules will attempt to communicate with each other as long as they have power. This will be observed by having power provided to both microcontrollers while the Z-Wave module is attached and having one of the microcontrollers user interface open on a monitor.
9.5 Wireless Communication The wireless communication will be tested immediately after the transmitter test procedures are complete. This will be done by initially sending data from one microcontroller to the other to light up an LED on a bread board. This will determine if the microcontrollers can communicate with each other through the Z-Wave modules attached to them. Once this is confirmed, the in range and out of range code will be applied and tested. The microcontroller that has the on-board code on it will be given an arbitrary value to test and the value that is determined will be sent to the way-side microcontroller to light up an LED if the value is in range and a different LED if it is out of range.
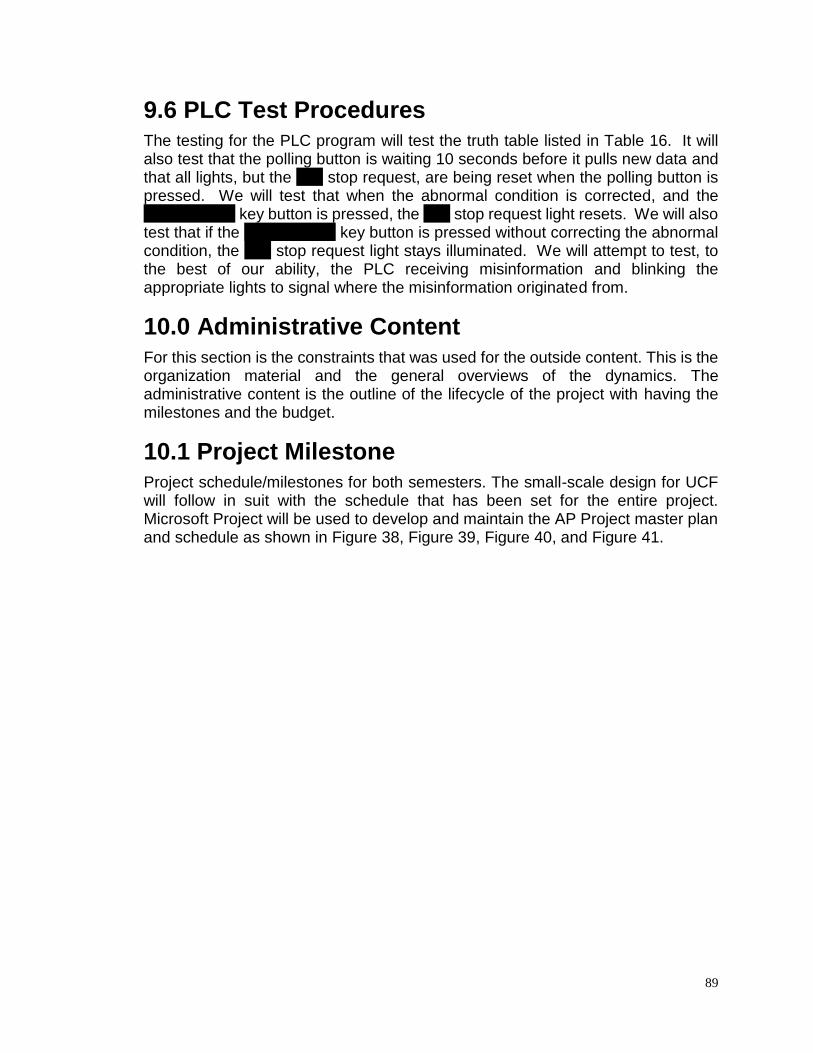
89
9.6 PLC Test Procedures The testing for the PLC program will test the truth table listed in Table 16. It will also test that the polling button is waiting 10 seconds before it pulls new data and that all lights, but the ride stop request, are being reset when the polling button is pressed. We will test that when the abnormal condition is corrected, and the maintenance key button is pressed, the ride stop request light resets. We will also test that if the maintenance key button is pressed without correcting the abnormal condition, the ride stop request light stays illuminated. We will attempt to test, to the best of our ability, the PLC receiving misinformation and blinking the appropriate lights to signal where the misinformation originated from.
10.0 Administrative Content
For this section is the constraints that was used for the outside content. This is the organization material and the general overviews of the dynamics. The administrative content is the outline of the lifecycle of the project with having the milestones and the budget.
10.1 Project Milestone Project schedule/milestones for both semesters. The small-scale design for UCF will follow in suit with the schedule that has been set for the entire project. Microsoft Project will be used to develop and maintain the AP Project master plan and schedule as shown in Figure 38, Figure 39, Figure 40, and Figure 41.
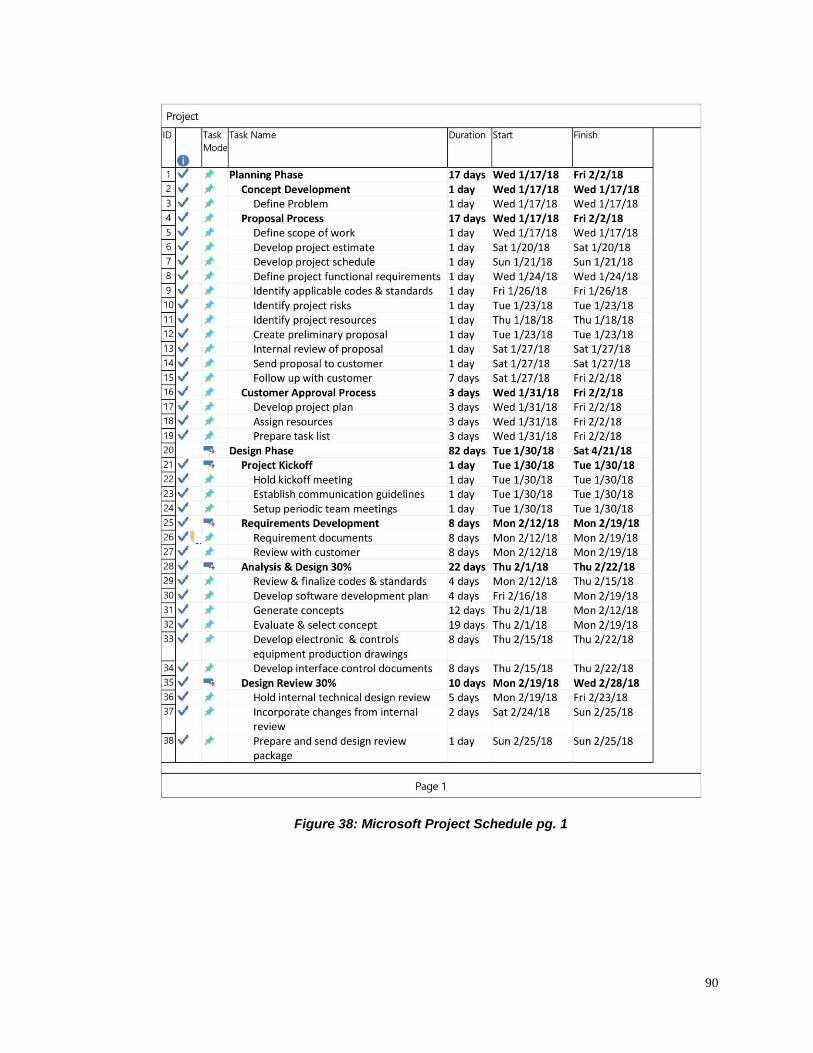
90
Figure 38: Microsoft Project Schedule pg. 1
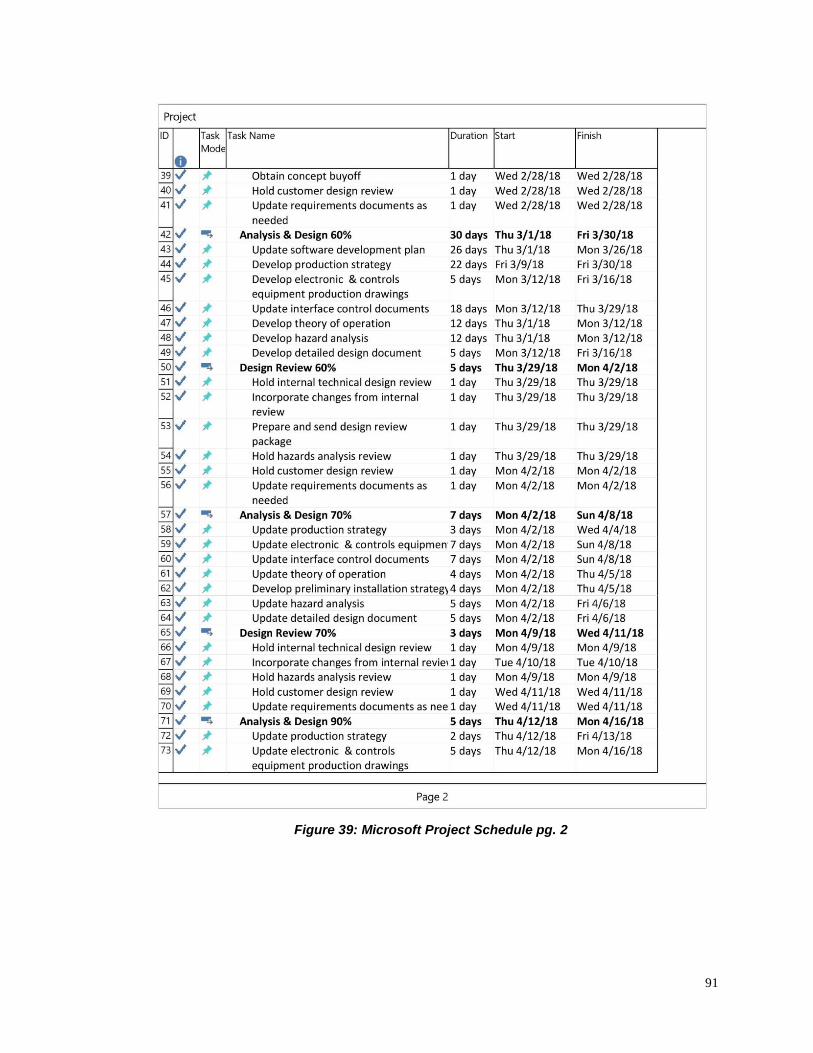
91
Figure 39: Microsoft Project Schedule pg. 2
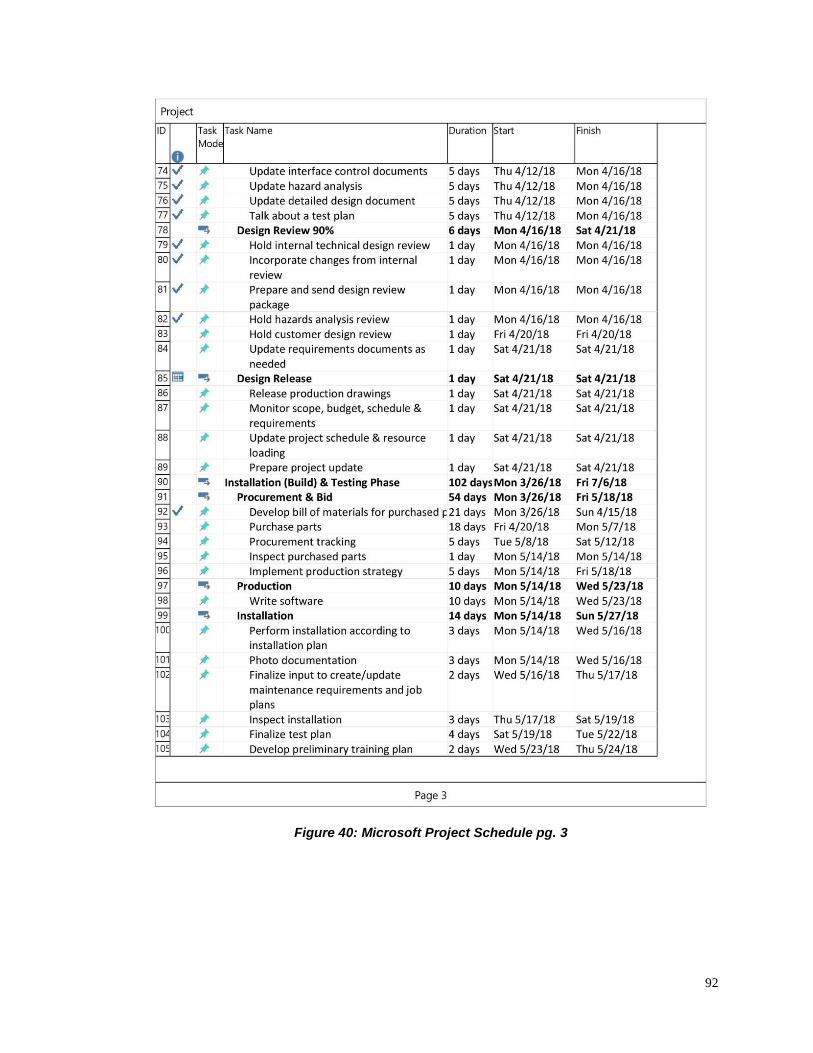
92
Figure 40: Microsoft Project Schedule pg. 3
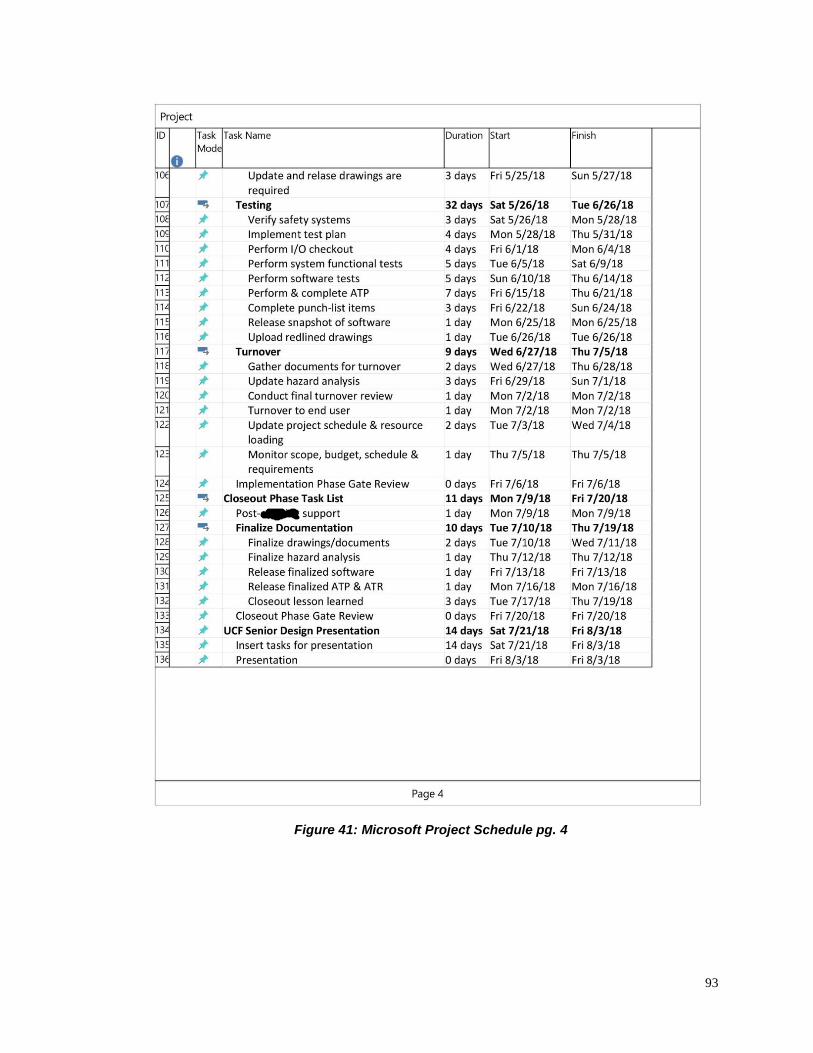
93
Figure 41: Microsoft Project Schedule pg. 4

94
10.2 Budget and Finance We anticipate the project budget rough order of magnitude to be $10,000. This project will be funded by Walt Disney Parks and Resorts Design and Engineering. The UCF part of the project’s budget will be roughly $250 and may or may not be funded by Walt Disney Parks and Resorts Design and Engineering. In Table 24 is the breakdown of the cost for each component that will need to be bought. There are other components that are needed for this project, but Disney already had in the lab to use.
Part Qty Cost
5V Voltage Regulator 1 $8.89
Battery 1 $399.99
SKYRC iMAX B6AC 1 $54.55
Connector – XT60 1 $9.56
WattMeter-Bare 1 $48.99
Encoder 1 $55.50
Encoder connector 1 $8.30
Encoder Coupling 1 $50.00
Micro USB Power 2 $9.00
Microcontroller 2 $34.99
Zeroing push button 1 $1.95
Z-Wave Module 2 $49.99
Total $725.71
Table 24: The cost of the parts needed
10.3 Team Organization
In working with Disney to complete their requirements as well as the PCB part for UCF being organized and staying to the timeline will be a huge factor for this project. In being organized helped the team move smoothly throughout the design process for both UCF and Disney. In making sure that Disney is understanding the design there were 3 major meetings with Disney. The first was a 30% review which we present to Disney two designs for consideration. Another review was the 60% review in where all the items and wiring will be explained as well as any hazards that come with the concept. Finally, was the 90% review which will be the final critics that was needed from the 60% and got the approval to start ordering the parts for senior design two. As far as the UCF side goes, the milestone helped keep all documentations due dates and make sure that they were completed. Continue using this process helped lead this group become successful at the end of Senior Design II.
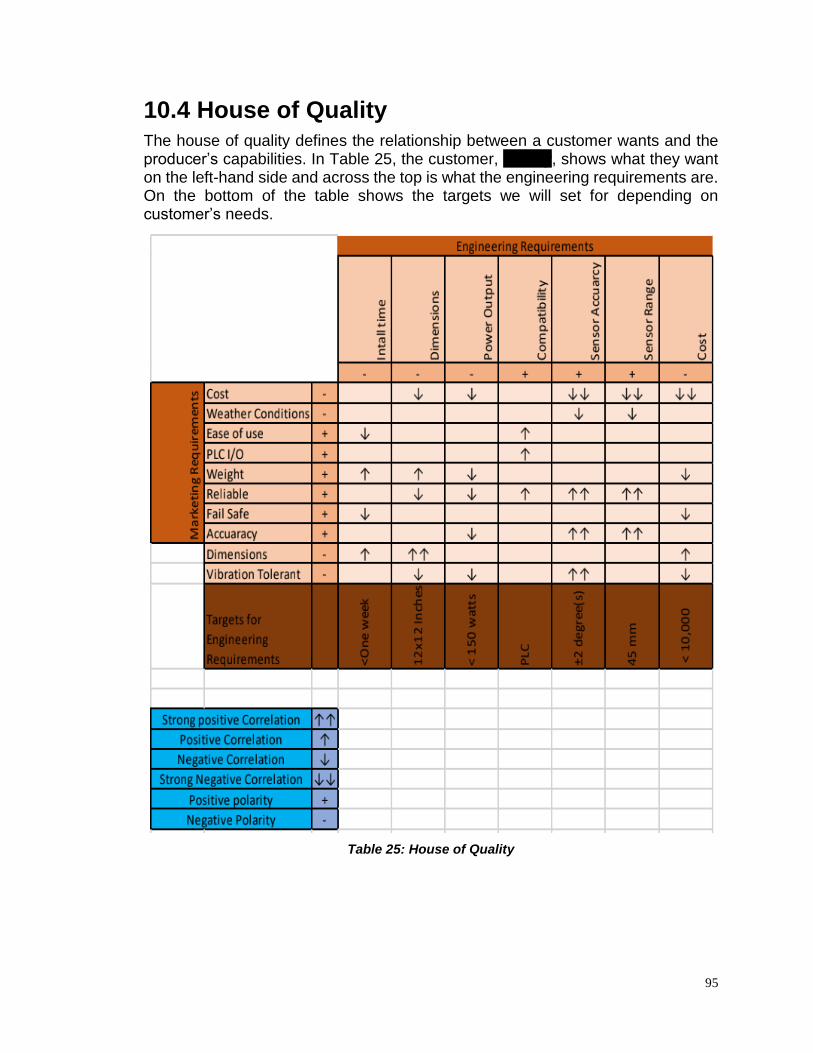
95
10.4 House of Quality The house of quality defines the relationship between a customer wants and the producer’s capabilities. In Table 25, the customer, Disney, shows what they want on the left-hand side and across the top is what the engineering requirements are. On the bottom of the table shows the targets we will set for depending on customer’s needs.
Table 25: House of Quality
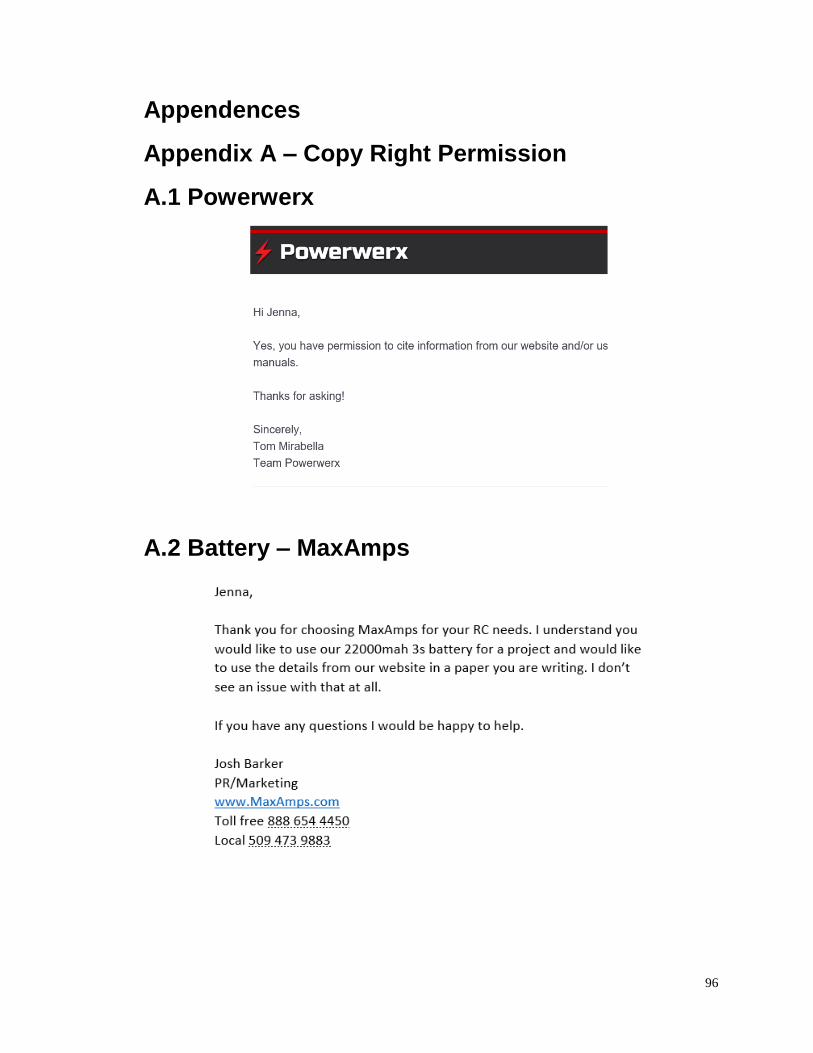
96
Appendences
Appendix A – Copy Right Permission
A.1 Powerwerx
A.2 Battery – MaxAmps

97
A.3 Raspberry Pi
A.4 Angle Position Sensor IC
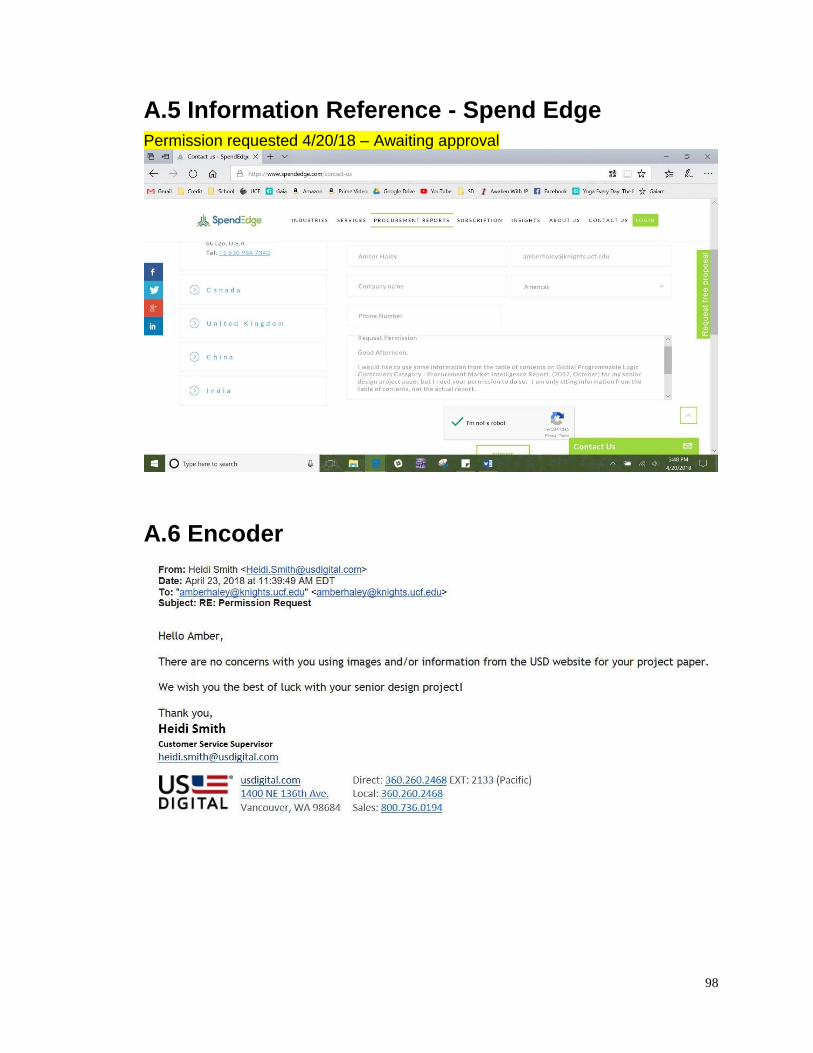
98
A.5 Information Reference - Spend Edge Permission requested 4/20/18 – Awaiting approval
A.6 Encoder
99
A.7 Encoder Coupling
A.8 Z-Wave.Me RaZberry Z-Wave plus GPIO card Permission requested 4/21/18 – Awaiting approval
100
A.9 16 mm illuminated push button – blue momentary
A.10 Dry & Dry silica packets and humidity indicator cards
Permission requested 4/21/18 – Awaiting approval
A.11 12x10x5 Inch Weatherproof Windowed NEMA Enclosure Permission requested 4/21/18 – Awaiting approval

101
Appendix B Data Sheets
B.1 Encoder
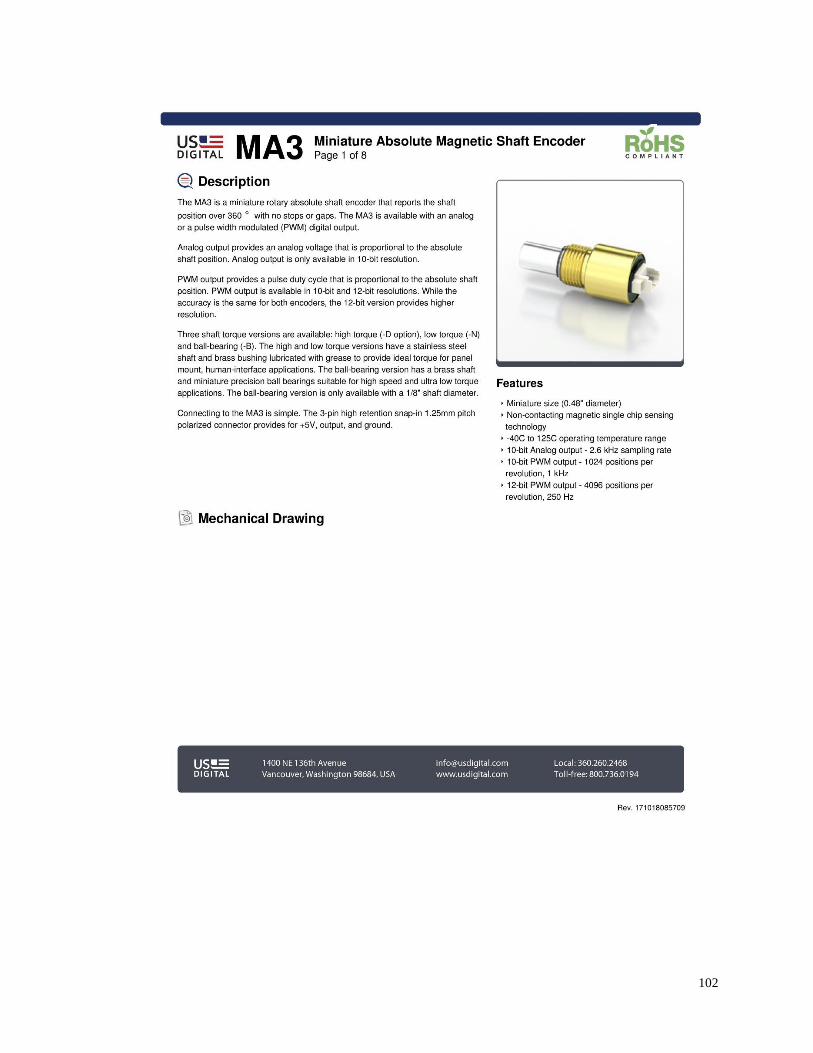
102
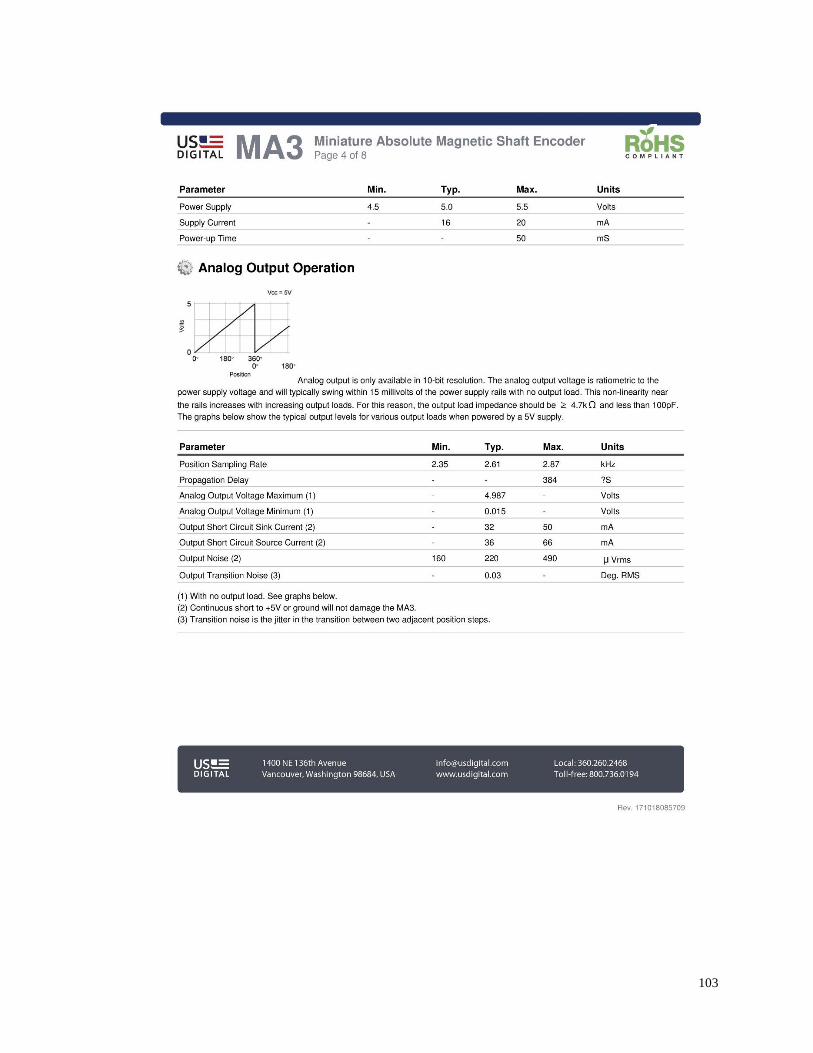
103
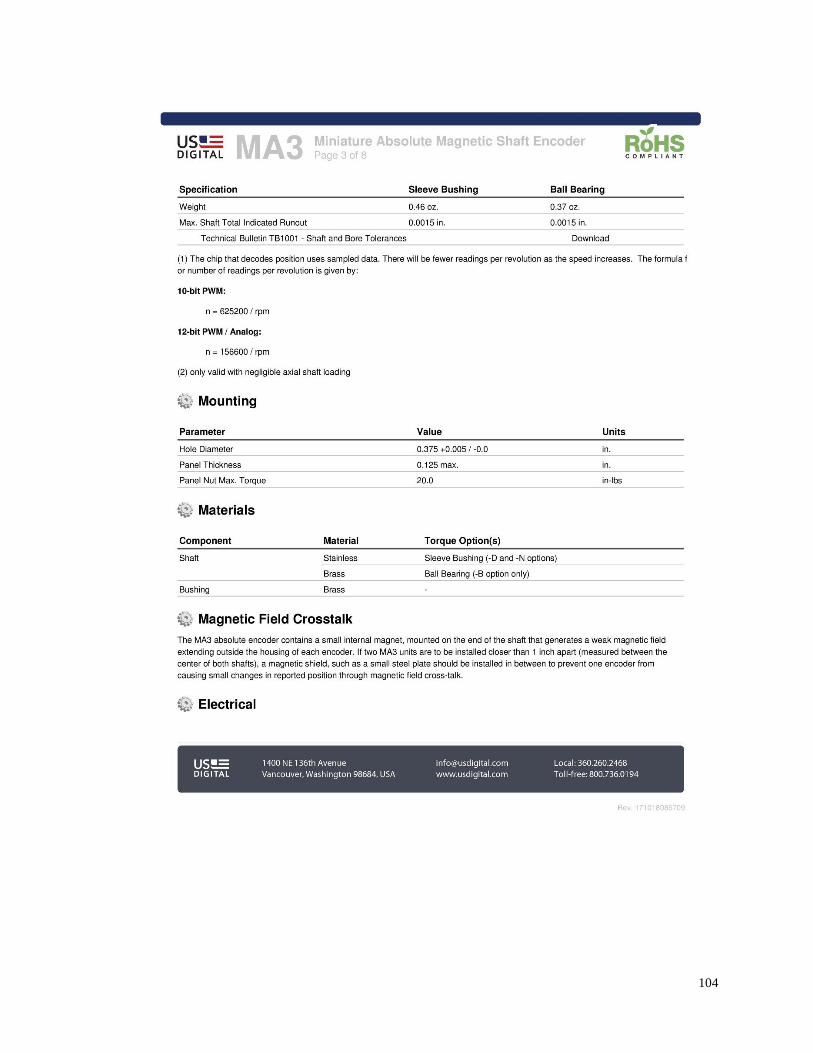
104
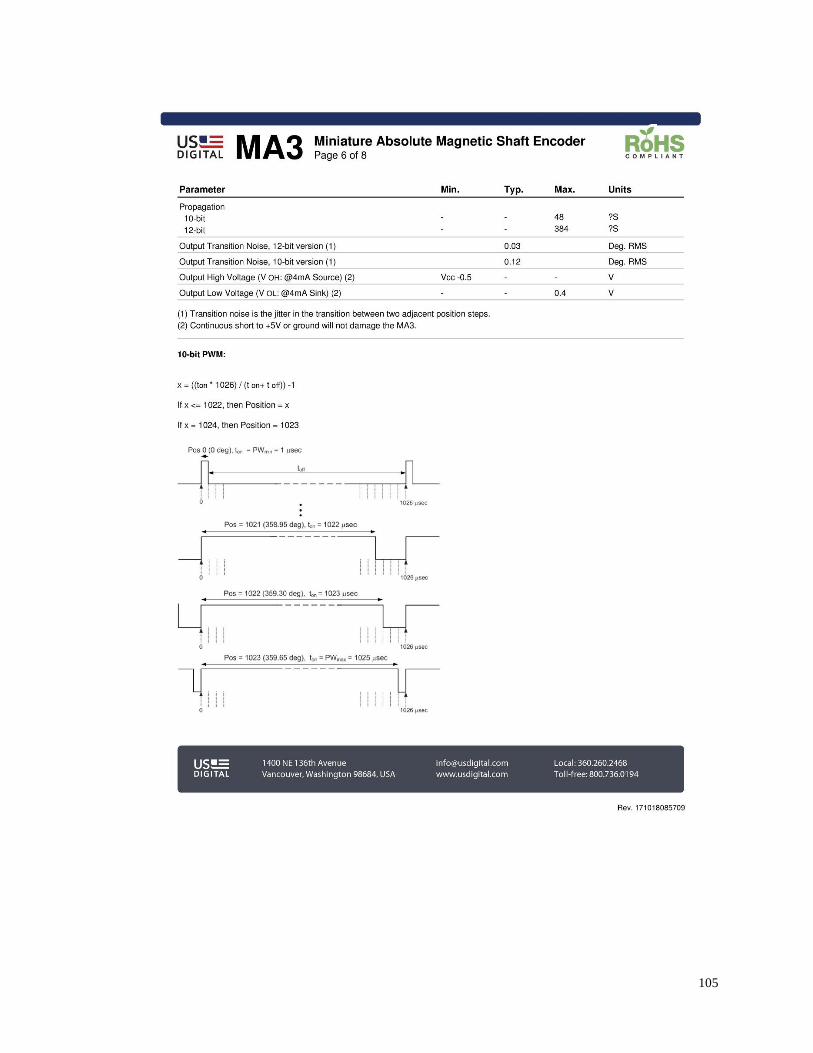
105
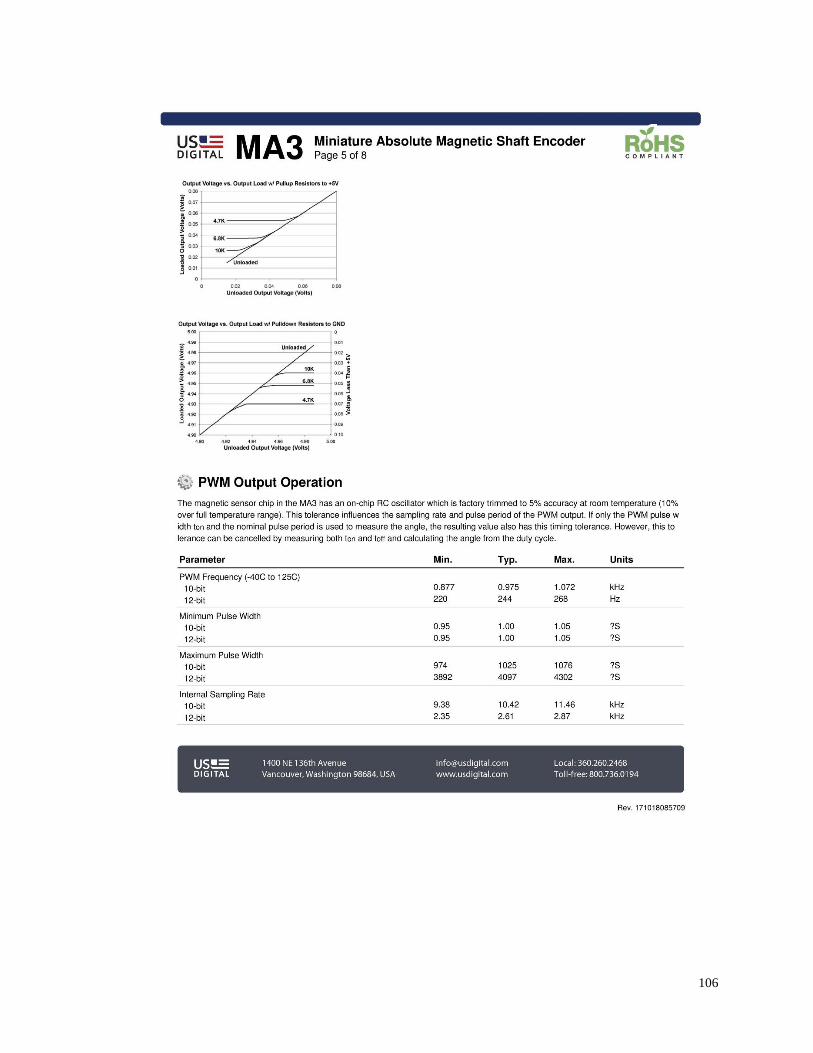
106

107
B.2 Raspberry Pi 2Model B
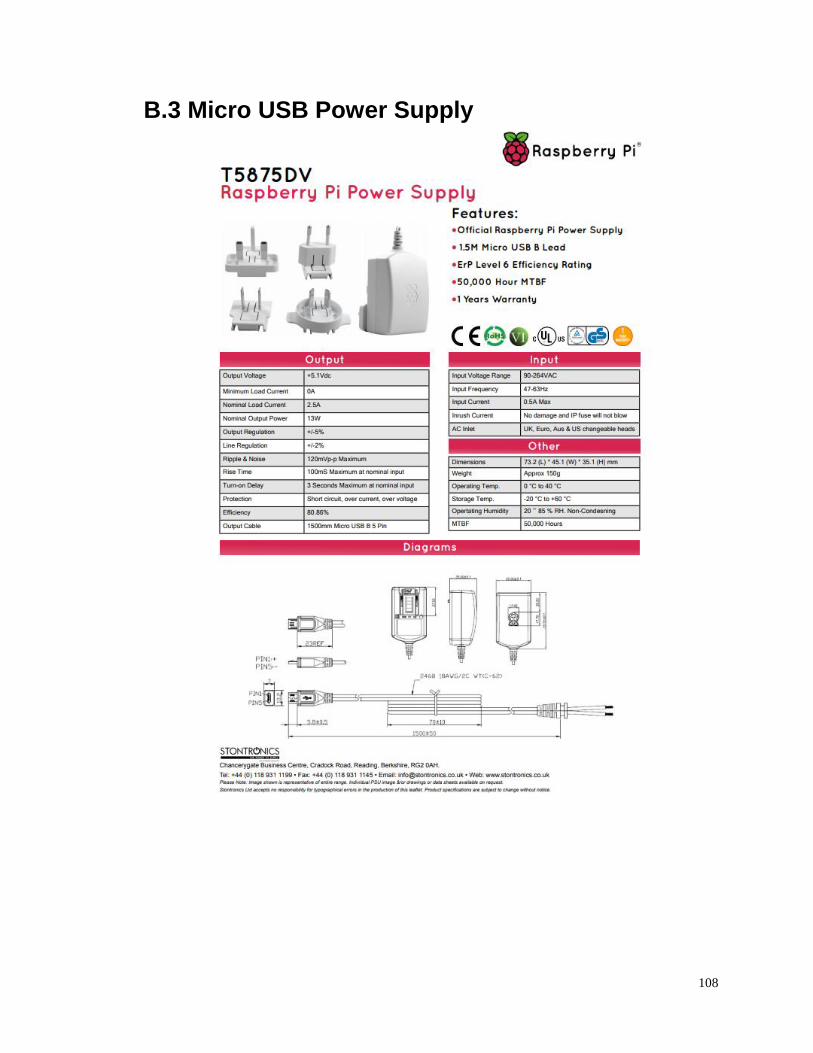
108
B.3 Micro USB Power Supply

109
B.4 Z Wave Me RaZberry
B.5 Powerwerx Watt Meter

110
B.6 Battery Charger – SKYRC iMAX B6AC V2
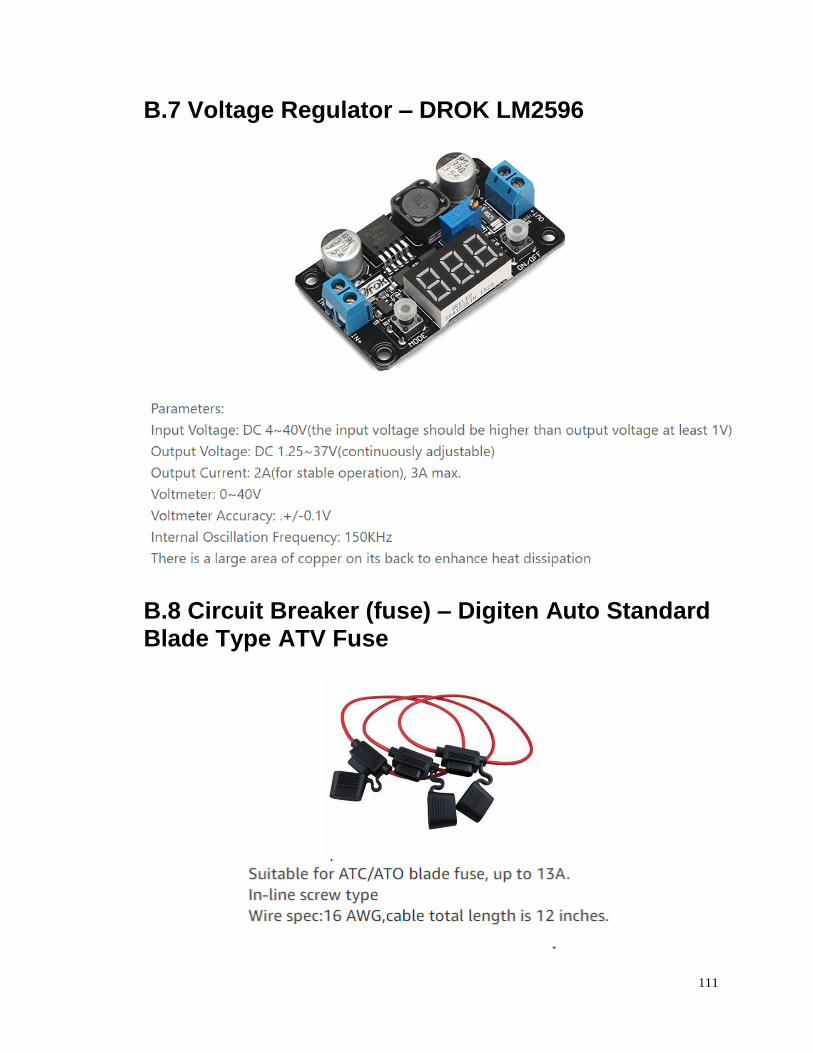
111
B.7 Voltage Regulator – DROK LM2596
B.8 Circuit Breaker (fuse) – Digiten Auto Standard Blade Type ATV Fuse
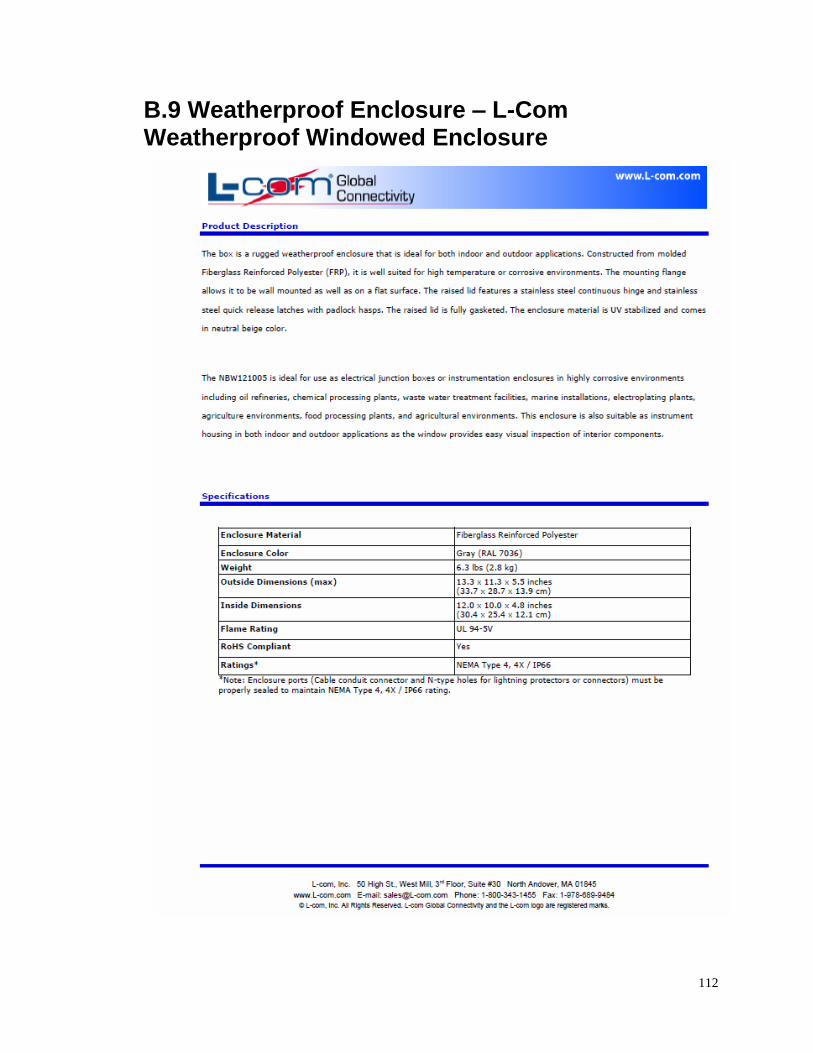
112
B.9 Weatherproof Enclosure – L-Com Weatherproof Windowed Enclosure
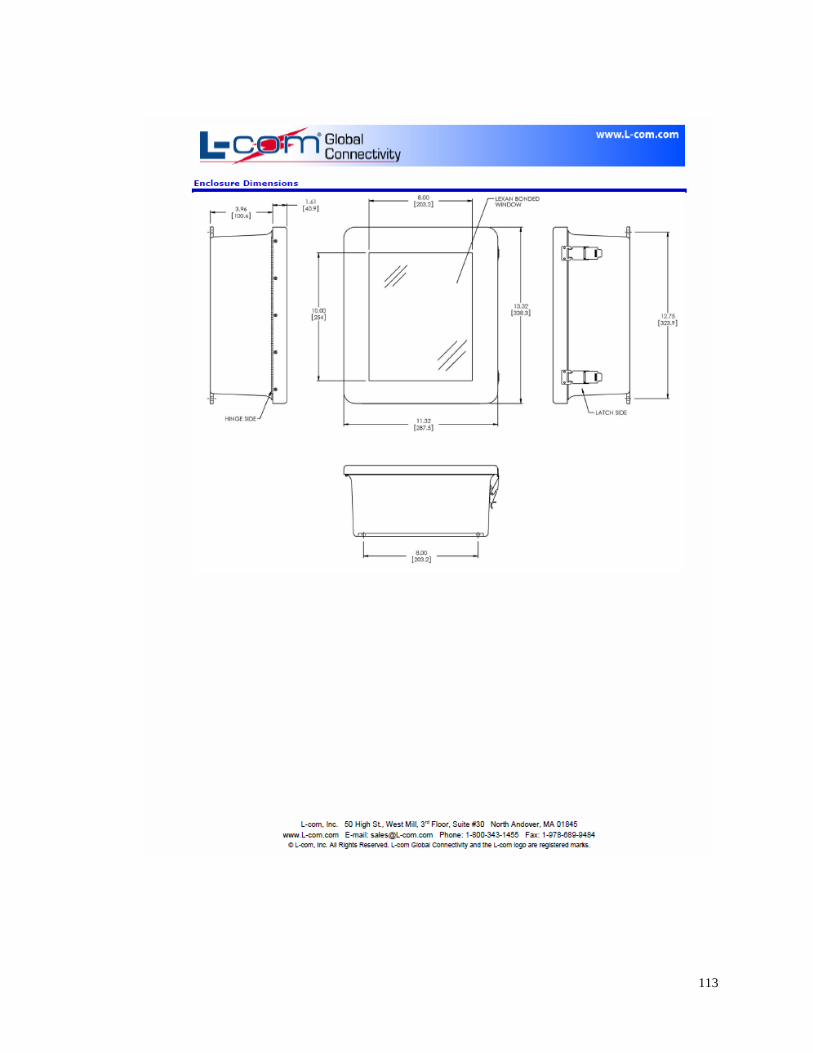
113
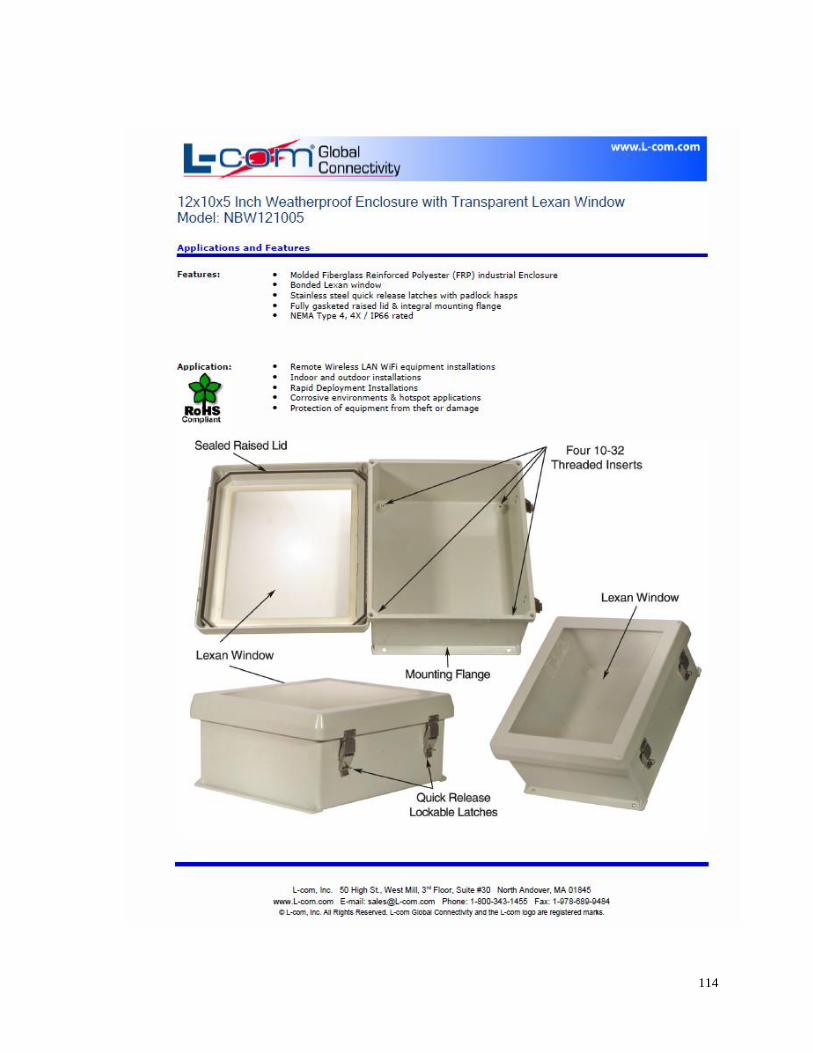
114

115
B.10 Silica Packets – Dry & Dry 5-gram Silica Packets
Appendix C Bibliography
Adafruit. (2018). 16mm Illuminated Pushbutton - Blue Momentary. New York City, New York, USA. Agarwal, T. (n.d.). ElProCus. Retrieved from Electronics Projects Focus:
https://www.elprocus.com/programmable-logic-controllers-and-types-of-plcs/
Allied Electronics & Automation. (2018). Raspberry Pi RASPBERRY PI 2, MODEL B. Fort Worth,
Texas, USA.
Benchoff, B. (2016, January 5). WIFI ALLIANCE INTRODUCES 802.11AH. Retrieved from Hackaday:
https://hackaday.com/2016/01/05/wifi-alliance-introduces-802-11ah/
Droking. (2018). Retrieved from DROK: LM2596 DC Volt Regulator:
http://www.droking.com/index.php?route=product/product&product_id=1863
Dry & Dry. (2015, December 8). 5 gram X 30 PK "Dry & Dry" Silica Gel Desiccant -FDA Compliant Food
Safe. California, Brea, USA.
Encoder Couplings . (2018). Retrieved from Encoder Products Company: http://encoder.com/couplings-
shaft-magnetic/
Florida Climate Center. (2018). Retrieved from The Florida State University:
https://climatecenter.fsu.edu/products-services/data/other-normals/relative-humidity
Global Programmable Logic Controllers Category - Procurement Market Intelligence Report. (2017,
October). Retrieved from Spend Edge: https://www.spendedge.com
Infinite Electronics International, Inc. (2011). 12x10x5 Inch Weatherproof Windowed NEMA Enclosure
Only. North Andover, Masachusetts, USA.
Intellicast. (2018). Retrieved from Intellicast:
http://www.intellicast.com/Local/History.aspx?location=USFL0372
International Telecommunications Union . (2015). ITU-T G.9959. Geneva: International
Telecommunications Union .

116
MaxAmps. (n.d.). Retrieved from maxamps.com
Merriam-Webster. (2018). Merriam-Webster Dictionary. Retrieved from Merriam-Webster Dictionary
Online: https://www.merriam-webster.com/dictionary/rack
Petruzella, F. D. (2005). Programmable Logic Controllers, 3rd Edition. New York: The McGraw-Hill
Companies, Inc.
Powerwerx. (2018). Powerwerx Watt Meter, DC Inline Power Analyzer, 45A Continuous, 12 Gauge, Bare
Wire Ends. Yorba Linda, California, USA.
SkyRC Technology Co., L. (2018, November). Retrieved from Skyrc:
https://www.skyrc.com/iMAX_B6AC_V2_Charger
Time and Date. (2018). Retrieved from Sunrise, Sunset, Day Length:
https://www.timeanddate.com/sun/usa/orlando?month=6
US Digital Products. (2018). Retrieved from US Digital:
https://www.usdigital.com/products/ma3#description
Z-Wave.Me. (2017). Z-Wave.Me RaZberry - Z-Wave Plus GPIO Card for the Raspberry Pi. Switzerland.