Embed Size (px)
Citation preview
Animating a historical ship race
www.learn.arcgis.com
380 New York Street
Redlands, California 92373 – 8100 USA Copyright © 2019 Esri
All rights reserved.
Printed in the United States of America.
The information contained in this document is the exclusive property of Esri. This work is protected under United States copyright law and other international copyright treaties and conventions. No part of this work may be reproduced or transmitted in any form or by any means, electronic or mechanical, including photocopying and recording, or by any information storage or retrieval system, except as expressly permitted in writing by Esri. All requests should be sent to Attention: Contracts and Legal Services Manager, Esri, 380 New York Street, Redlands, CA 92373-8100 USA.
The information contained in this document is subject to change without notice.
Time: 40 minutes
Using 3D thematic symbology to display features in a scene
Animating a historical ship race
Overview
Content is all about telling a story. Whether it’s a story about analysis results, a disaster, or maybe even land use changes, your main goal as a GIS analyst is to share a message that informs, compels, persuades, and convinces your audience to act. Sharing GIS knowledge does not always require an interactive online scene; it can also be done with an animated video, which is a rich, engaging medium that is cost-effective, easy to manage and create, and will help convey your message. With animated videos, you’re free to do whatever you want. Let your imagination run wild! The medium gives you the ability to bring any concept, no matter how complex or simple, to life with ease. In this lesson, you will create a video depicting a simulated virtual sailing ship race from 1770 by plotting the logged positions of the ships as they crossed the Atlantic from La Coruña, in Spain, to San Juan, in Puerto Rico. In this lesson, you will learn to do the following:
• Create a stop-motion style video to simulate feature movement
• Add on-screen text to provide additional information
• Use dynamic overlay text to embed the map’s date/time into the video
About
From the earliest days of deep-sea sailing, mariners have kept logbook accounts of their voyages. By 1750, the keeping of logbooks was almost universal among the officers of European ships. Although not prepared with this purpose in mind, the logbooks and the detailed observations that they contain are of great scientific value today. Thanks to the CLIWOC database built from official captains’ shipping logs, we know that in 1770 there were three sailing ship journeys made from La Coruña, in Spain, to San Juan, in Puerto Rico. The ship El Rey did it once, in August, and the ship El Colon made the trip twice, in April and October. Although these ships left port on different days, we can normalize the data in such a way that instead of using actual departure dates, we use “hours since they left port” to create an animation to compare their progress. In this way, we can simulate a virtual sailing ship race from 1770.
Getting started
The content for this lesson is contained in a map package. First, you need to create a project using the Blank project template, then import the map packages.
1. Download the ShipRace.zip compressed folder.
Animating a historical ship race
2. Locate the downloaded file on your computer and extract it to a location you can easily find, such as your Documents folder. 3. Start ArcGIS Pro and under New, click Start without a template.
Note: If you don't have ArcGIS Pro or an ArcGIS account, you can sign up for an ArcGIS free trial.
4. On the Quick Access toolbar, click Save or press Ctrl+S to save your project.
5. In the Save Project As window, accept the default storage location and save the project as "
ShipAnimation ".
6. On the Insert tab, in the Project group, click Import Map .
7. Browse to the location where you stored your download data or search for ShipRace.mpkx to
import this scene and click OK.
A scene named Race Across Atlantic opens to display a 2D layer representing ship paths and 3D layers representing logged and interpolated ship positions.

Animating a historical ship race
Reviewing the data
A quick review of the data, which has been pre-generated for you, will help you understand the animation settings required to create a video illustrating the virtual sailing ship race from 1770. You will create the video using the hours from port field to animate the positions of the ships across the Atlantic. This technique is stop-motion, which is what’s used in a flip-board animation, or a computer-generated movie (such as “Toy Story”), or claymation (such as “Wallace & Gromit”). This technique requires a single feature location and orientation for each output video frame, where the action of replaying them one after another gives the impression of movement.
1. In the Contents pane, click on Race Across Atlantic to activate the scene.
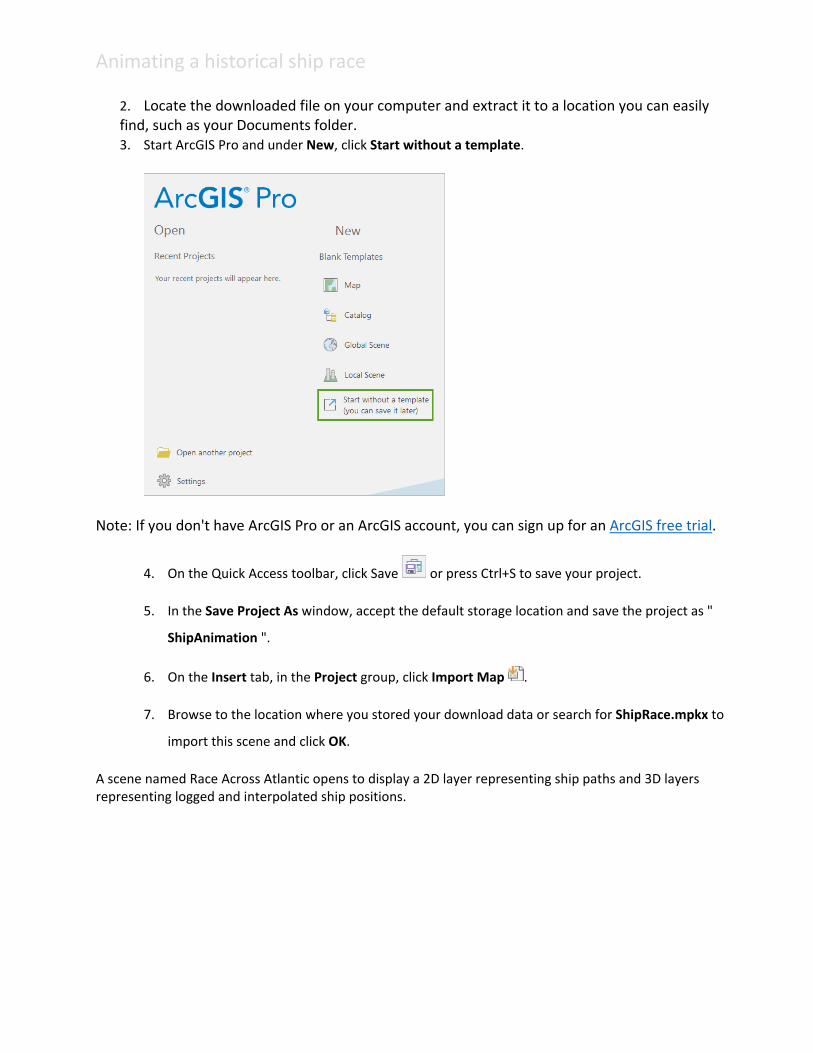
2. Right-click Logged Positions and select Attribute table.
Animating a historical ship race
Spend a few minutes reviewing the Logged Positions attributes. These are the officially recorded ship locations, per the transcribed historical logbooks for these ships.
3. Review the HOURS_TRAVELLED field and note how the values represent the number of hours travelled away from the port of origin and toward the destination.
4. When you are done, close the attribute table.
5. In the Contents pane, click Logged Positions to select the layer.
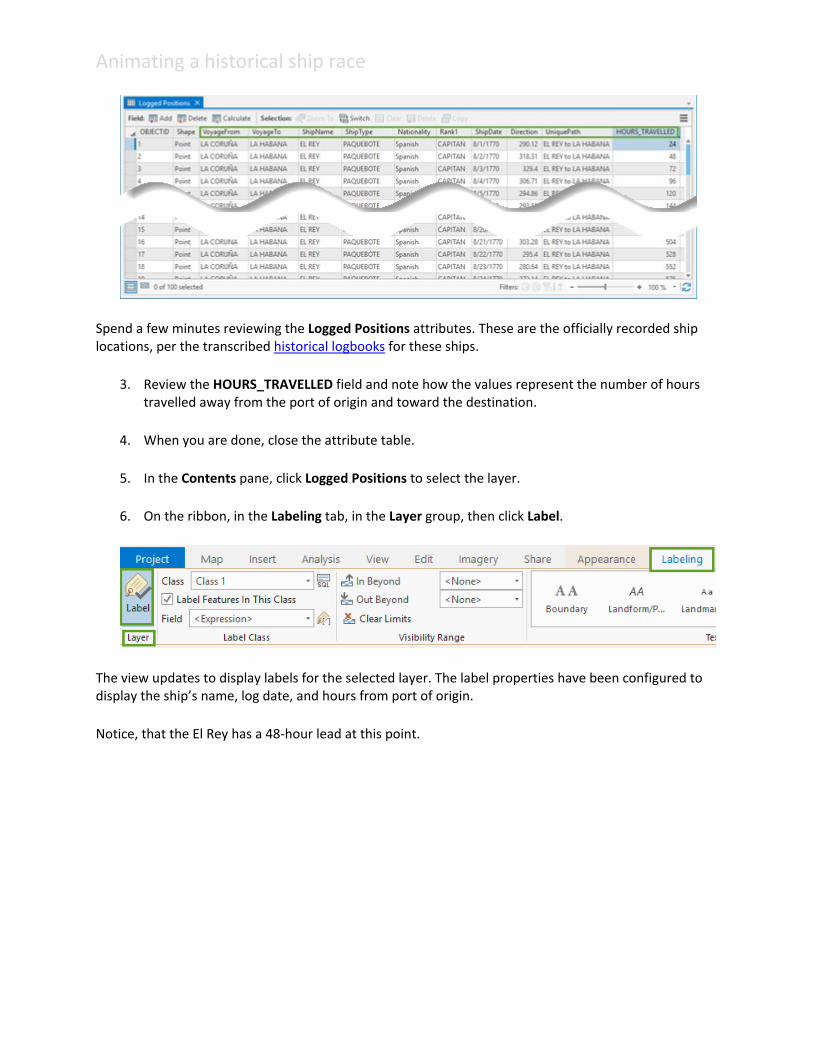
6. On the ribbon, in the Labeling tab, in the Layer group, then click Label.
The view updates to display labels for the selected layer. The label properties have been configured to display the ship’s name, log date, and hours from port of origin. Notice, that the El Rey has a 48-hour lead at this point.
Animating a historical ship race
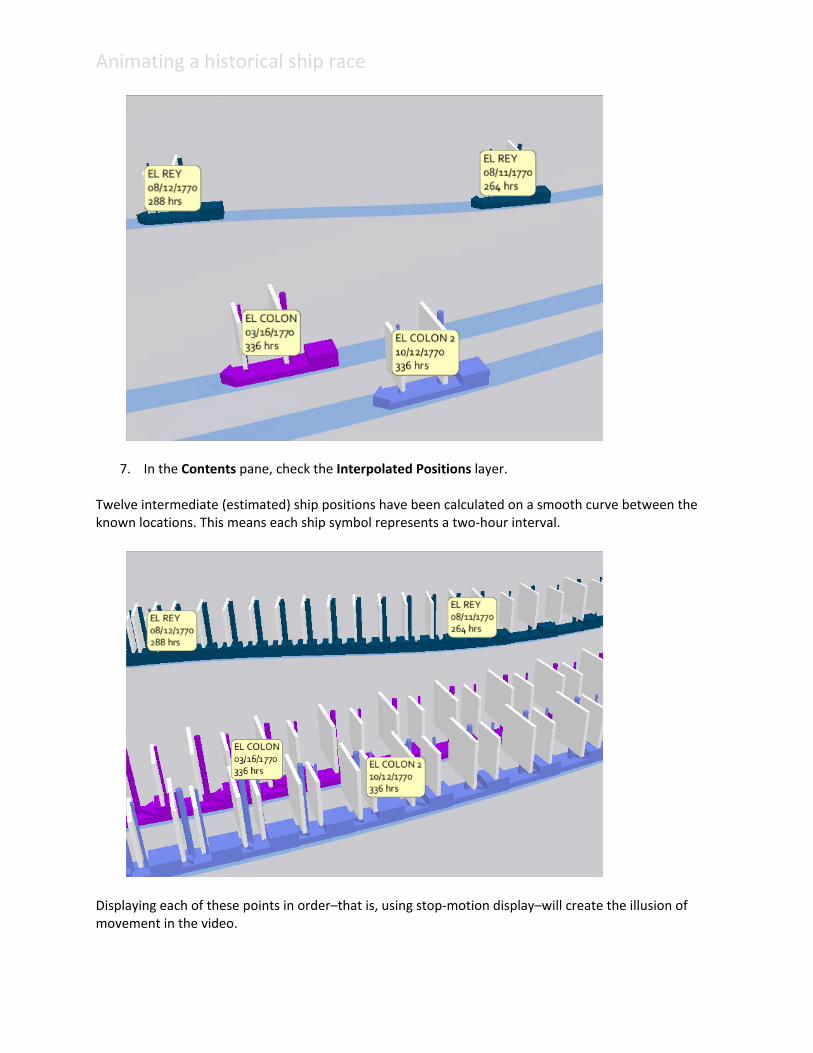
7. In the Contents pane, check the Interpolated Positions layer.
Twelve intermediate (estimated) ship positions have been calculated on a smooth curve between the known locations. This means each ship symbol represents a two-hour interval.
Displaying each of these points in order–that is, using stop-motion display–will create the illusion of movement in the video.
Animating a historical ship race
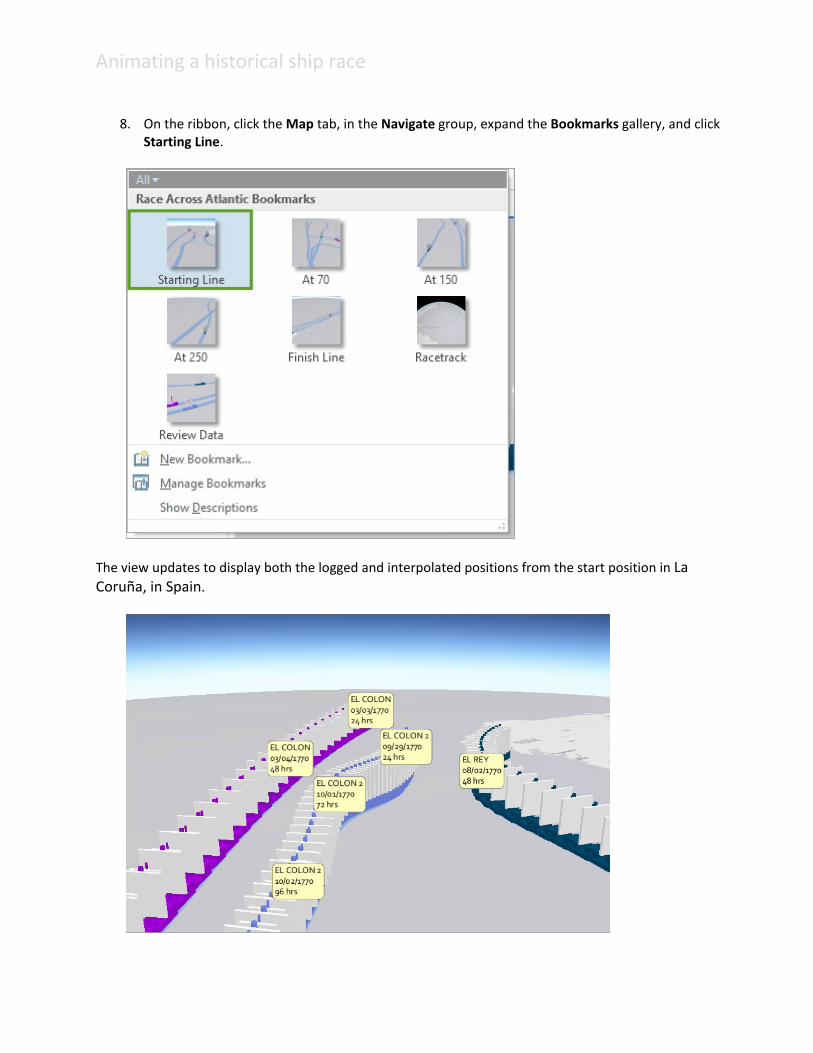
8. On the ribbon, click the Map tab, in the Navigate group, expand the Bookmarks gallery, and click
Starting Line.
The view updates to display both the logged and interpolated positions from the start position in La Coruña, in Spain.
Animating a historical ship race
9. On the Labeling ribbon, click Label to hide the labels for the Logged Positions layer.
On a general cartographic note–each ship is shown as 30 kilometers high, so the symbols can be seen over the large distances being travelled, and the Ship Paths line layer is 14 kilometers wide, which represents the approximate distance that can be seen across the ocean from a mast height of 15 meters/50 feet.
Filtering content by range
Range filtering can be applied to any numeric field in a layer and can be applied to multiple layers in the view. For our stop-motion video, we need to view features with specific hours travelled, at a specific rate and in a specific order, which is a good match for this tool.
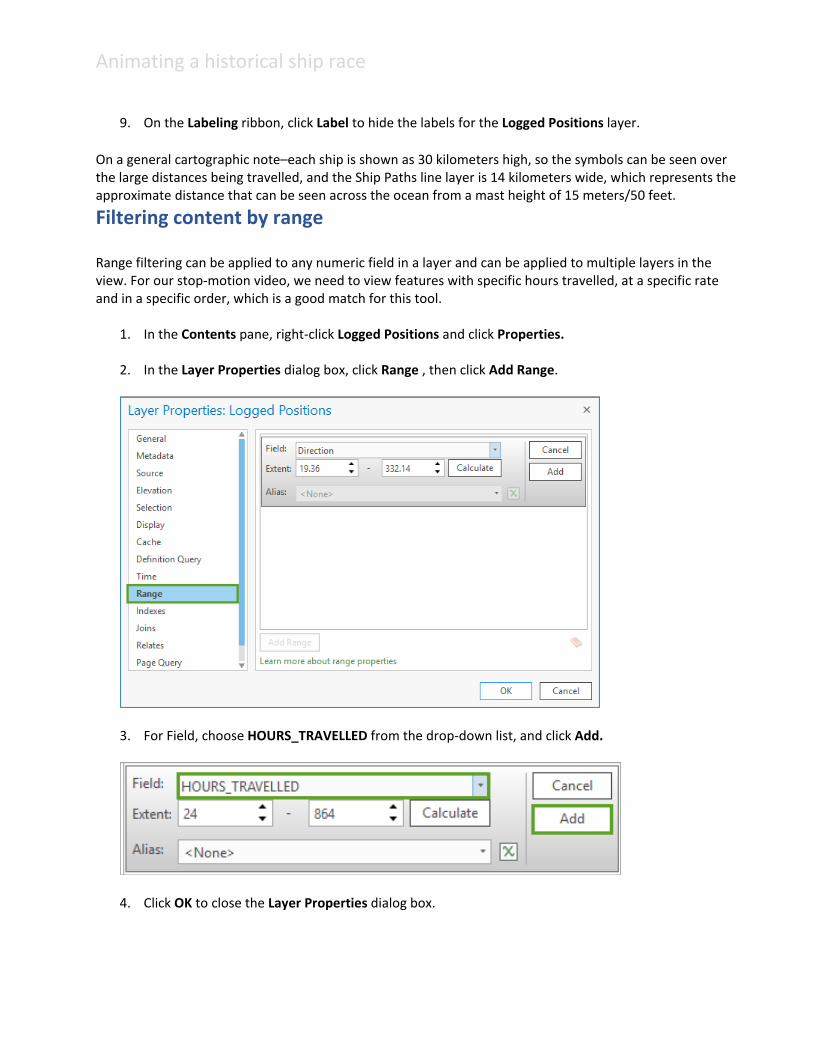
1. In the Contents pane, right-click Logged Positions and click Properties.
2. In the Layer Properties dialog box, click Range , then click Add Range.
3. For Field, choose HOURS_TRAVELLED from the drop-down list, and click Add.
4. Click OK to close the Layer Properties dialog box.
Animating a historical ship race
5. In the Contents pane, right-click Interpolated Positions and click Properties.
6. In the Layer Properties dialog box, click the Range tab, and click Add Range.
7. Choose the HOURS_TRAVELLED field from the drop-down list and click Add.
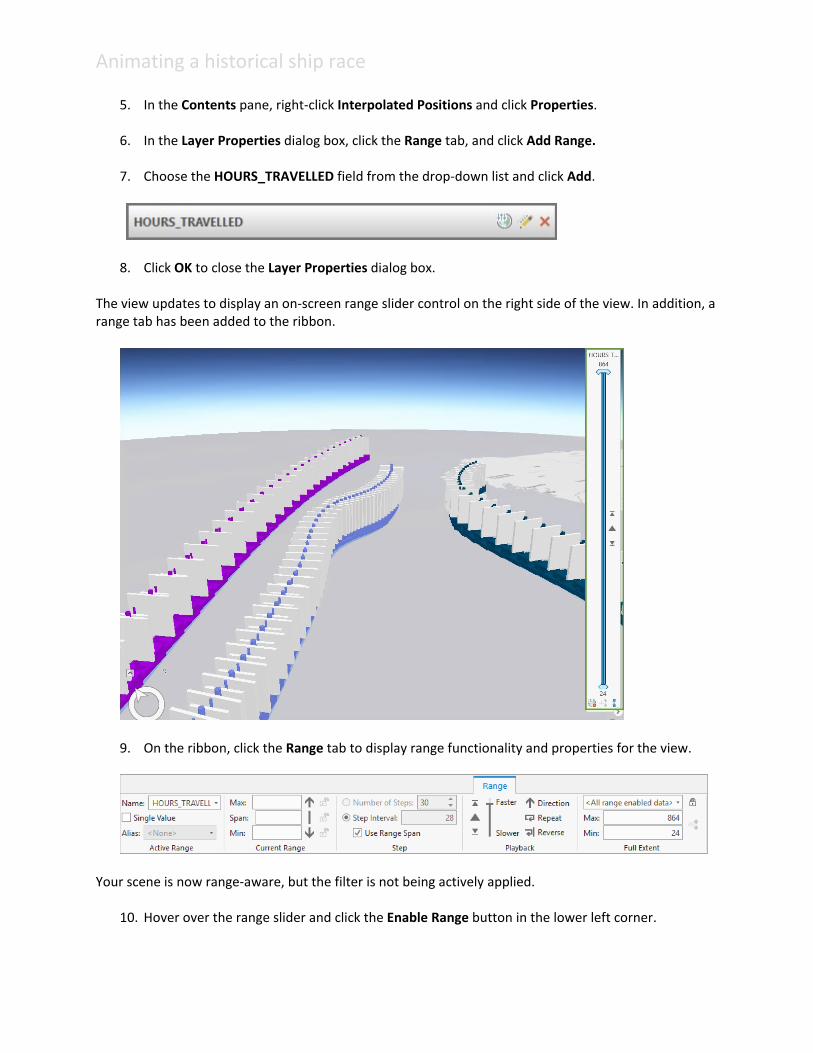
8. Click OK to close the Layer Properties dialog box. The view updates to display an on-screen range slider control on the right side of the view. In addition, a range tab has been added to the ribbon.
9. On the ribbon, click the Range tab to display range functionality and properties for the view.
Your scene is now range-aware, but the filter is not being actively applied.
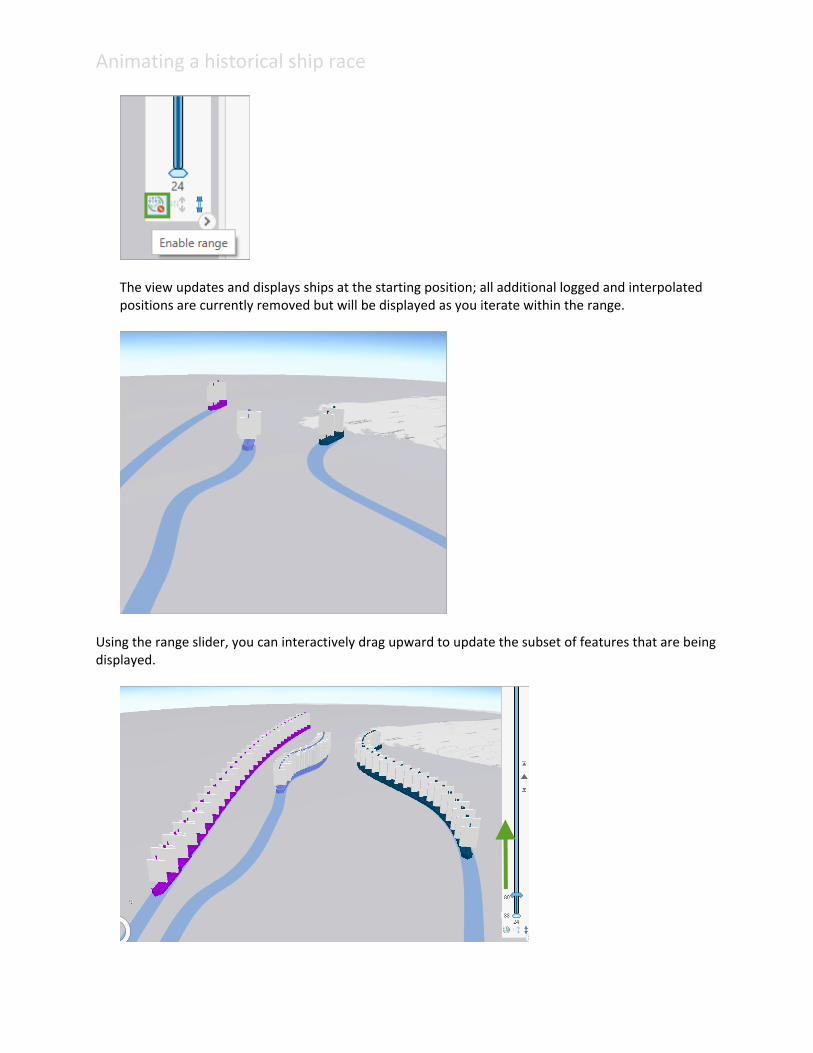
10. Hover over the range slider and click the Enable Range button in the lower left corner.
Animating a historical ship race
The view updates and displays ships at the starting position; all additional logged and interpolated positions are currently removed but will be displayed as you iterate within the range.
Using the range slider, you can interactively drag upward to update the subset of features that are being displayed.
Animating a historical ship race
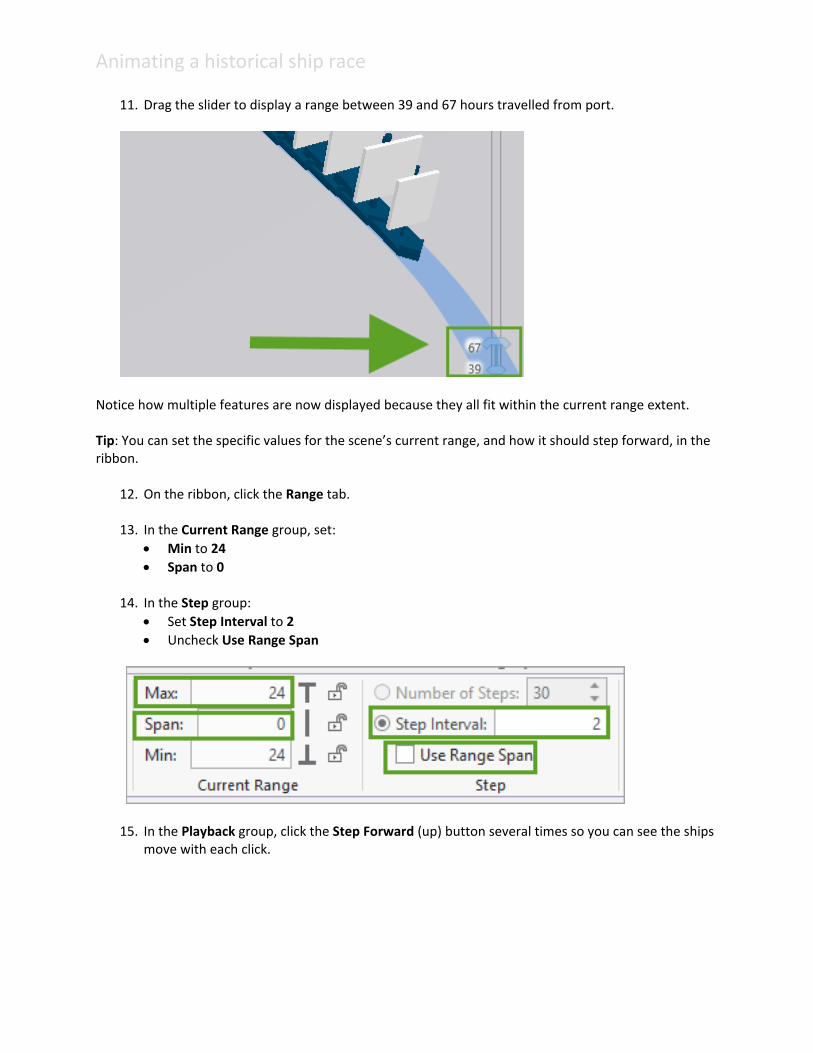
11. Drag the slider to display a range between 39 and 67 hours travelled from port.
Notice how multiple features are now displayed because they all fit within the current range extent. Tip: You can set the specific values for the scene’s current range, and how it should step forward, in the ribbon.
12. On the ribbon, click the Range tab.
13. In the Current Range group, set: • Min to 24 • Span to 0
14. In the Step group:
• Set Step Interval to 2 • Uncheck Use Range Span
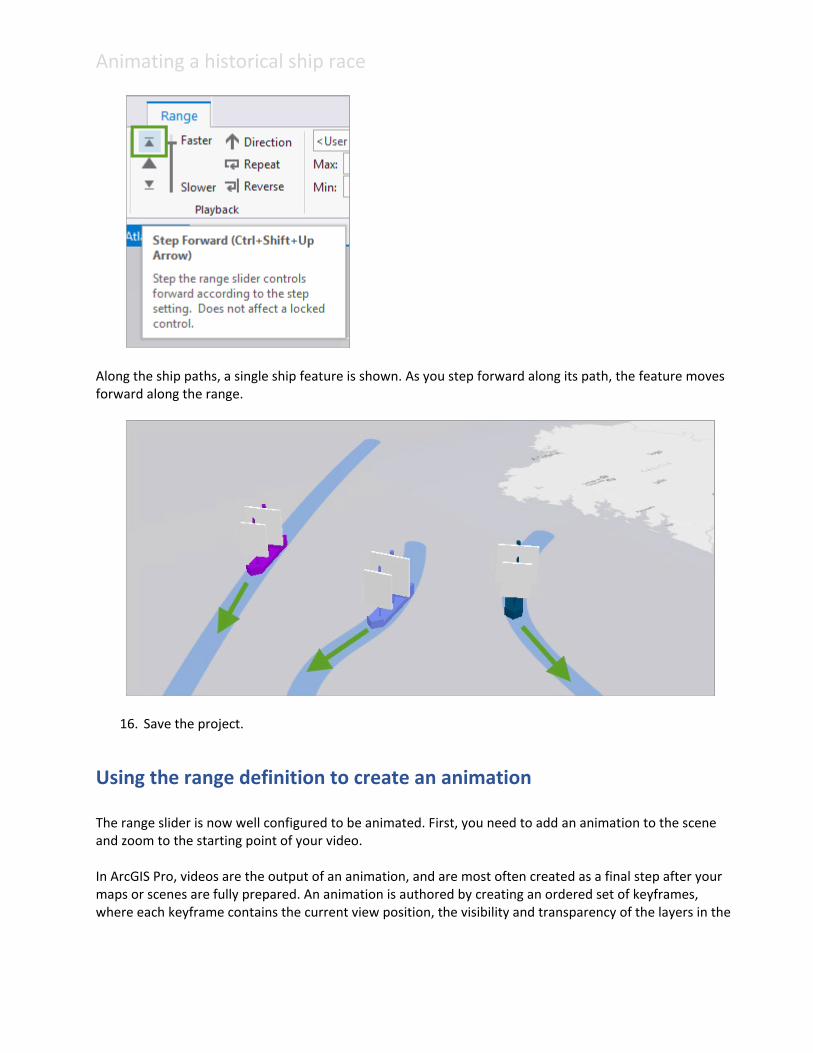
15. In the Playback group, click the Step Forward (up) button several times so you can see the ships move with each click.
Animating a historical ship race
Along the ship paths, a single ship feature is shown. As you step forward along its path, the feature moves forward along the range.
16. Save the project.
Using the range definition to create an animation
The range slider is now well configured to be animated. First, you need to add an animation to the scene and zoom to the starting point of your video. In ArcGIS Pro, videos are the output of an animation, and are most often created as a final step after your maps or scenes are fully prepared. An animation is authored by creating an ordered set of keyframes, where each keyframe contains the current view position, the visibility and transparency of the layers in the
Animating a historical ship race
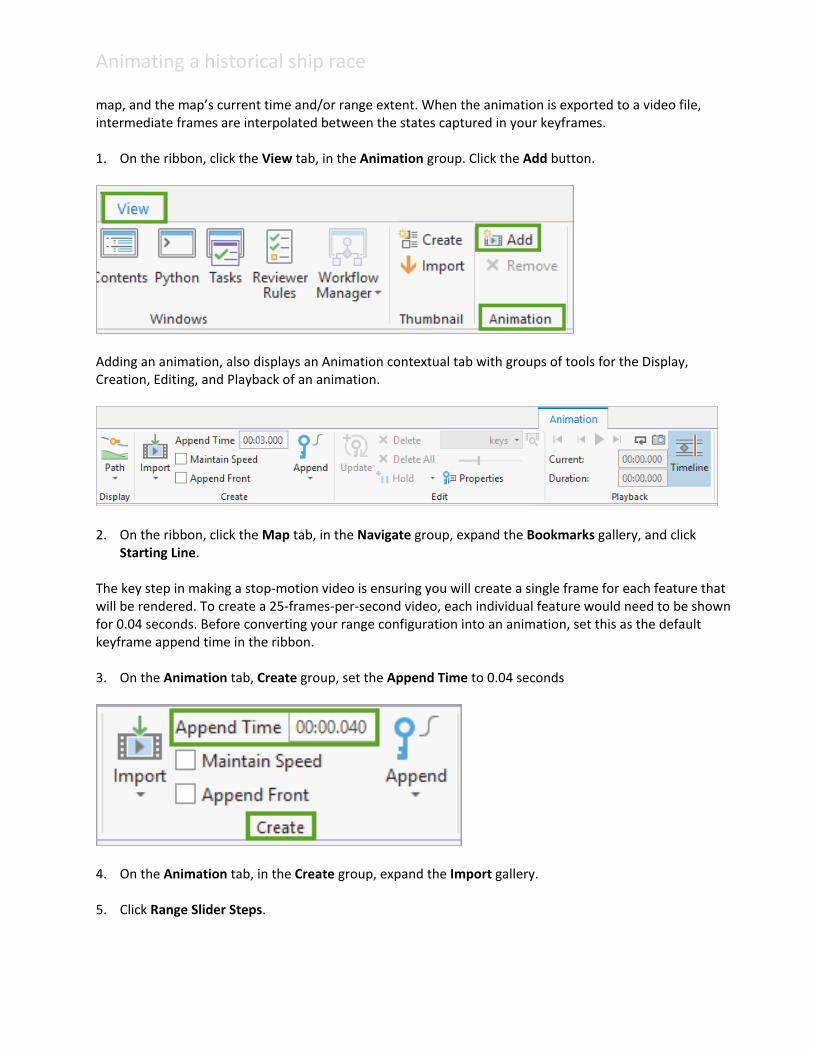
map, and the map’s current time and/or range extent. When the animation is exported to a video file, intermediate frames are interpolated between the states captured in your keyframes. 1. On the ribbon, click the View tab, in the Animation group. Click the Add button.
Adding an animation, also displays an Animation contextual tab with groups of tools for the Display, Creation, Editing, and Playback of an animation.
2. On the ribbon, click the Map tab, in the Navigate group, expand the Bookmarks gallery, and click
Starting Line. The key step in making a stop-motion video is ensuring you will create a single frame for each feature that will be rendered. To create a 25-frames-per-second video, each individual feature would need to be shown for 0.04 seconds. Before converting your range configuration into an animation, set this as the default keyframe append time in the ribbon. 3. On the Animation tab, Create group, set the Append Time to 0.04 seconds
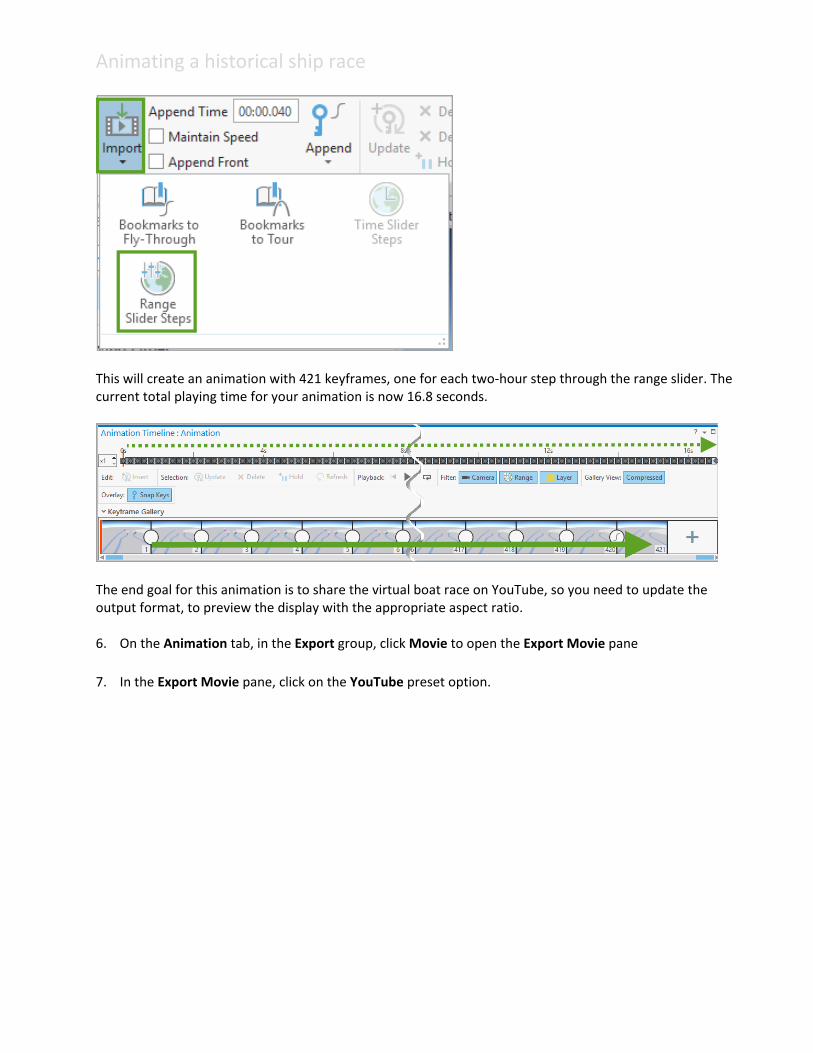
4. On the Animation tab, in the Create group, expand the Import gallery.
5. Click Range Slider Steps.
Animating a historical ship race
This will create an animation with 421 keyframes, one for each two-hour step through the range slider. The current total playing time for your animation is now 16.8 seconds.
The end goal for this animation is to share the virtual boat race on YouTube, so you need to update the output format, to preview the display with the appropriate aspect ratio. 6. On the Animation tab, in the Export group, click Movie to open the Export Movie pane
7. In the Export Movie pane, click on the YouTube preset option.

Animating a historical ship race
Since this is a different aspect ratio than before, you will notice that the framing of the view has been adjusted. 8. Close the Export Movie pane.
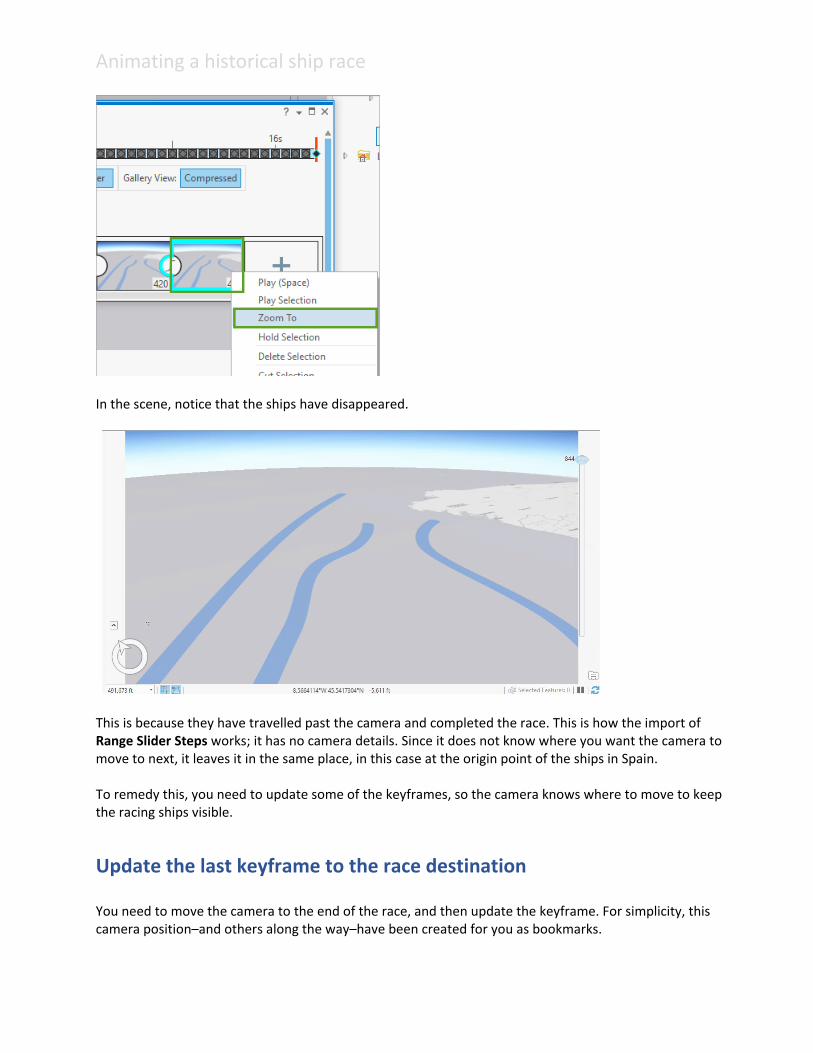
9. In the Animation Timeline, scroll to the last keyframe, 421. 10. Right-click keyframe 421 and choose Zoom To to move to that part of the animation in the scene.
Animating a historical ship race
In the scene, notice that the ships have disappeared.
This is because they have travelled past the camera and completed the race. This is how the import of Range Slider Steps works; it has no camera details. Since it does not know where you want the camera to move to next, it leaves it in the same place, in this case at the origin point of the ships in Spain. To remedy this, you need to update some of the keyframes, so the camera knows where to move to keep the racing ships visible.
Update the last keyframe to the race destination
You need to move the camera to the end of the race, and then update the keyframe. For simplicity, this camera position–and others along the way–have been created for you as bookmarks.
Animating a historical ship race
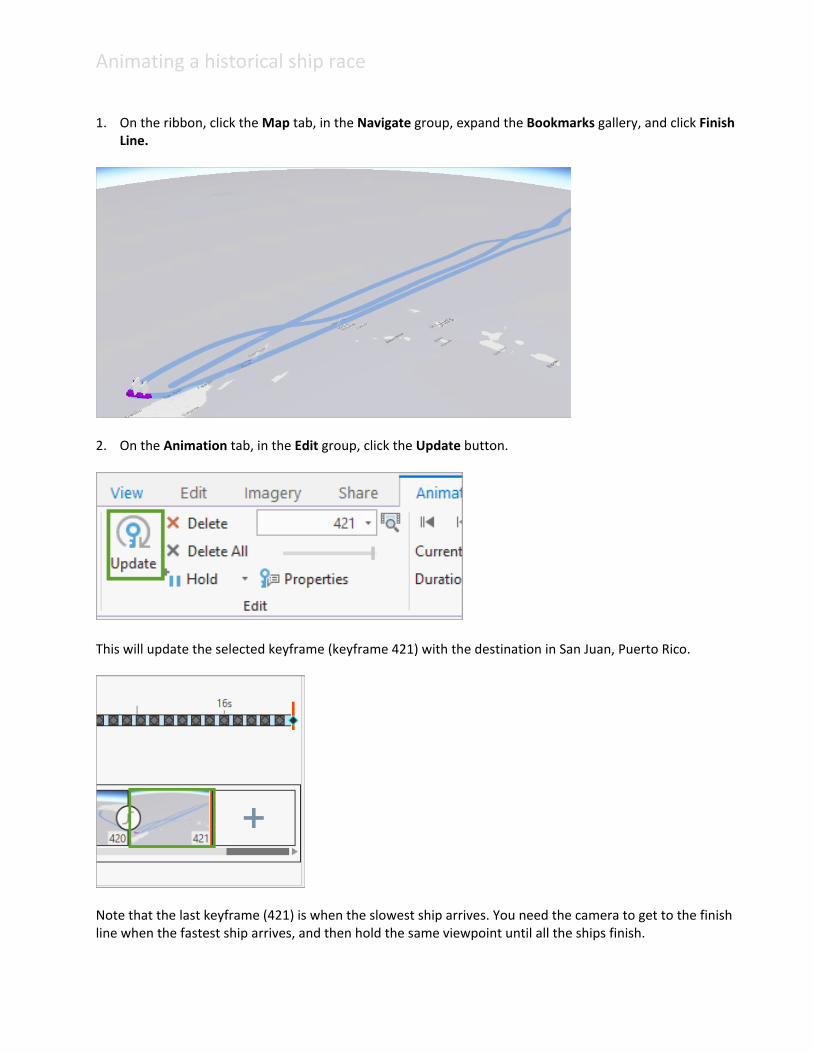
1. On the ribbon, click the Map tab, in the Navigate group, expand the Bookmarks gallery, and click Finish
Line.
2. On the Animation tab, in the Edit group, click the Update button.
This will update the selected keyframe (keyframe 421) with the destination in San Juan, Puerto Rico.
Note that the last keyframe (421) is when the slowest ship arrives. You need the camera to get to the finish line when the fastest ship arrives, and then hold the same viewpoint until all the ships finish.

Animating a historical ship race
The data tells us that the winner arrives after 29 days of travel, so the arrival keyframe for the fastest ship is #348 (29 days x 12 frames/day). 3. In the Animation Timeline, scroll to keyframe 348.
4. Right-click keyframe 348 and choose Zoom to to move to that part of the animation.
5. On the ribbon, click the Map tab, in the Navigate group, expand the Bookmarks gallery, and click Finish
Line.
6. On the Animation tab, in the Edit group, click the Update button. You can confirm the camera’s flight path by enabling a visual display of the line.
7. On the ribbon, click the Map tab, in the Navigate group, expand the Bookmarks gallery, and click
Racetrack.
Animating a historical ship race
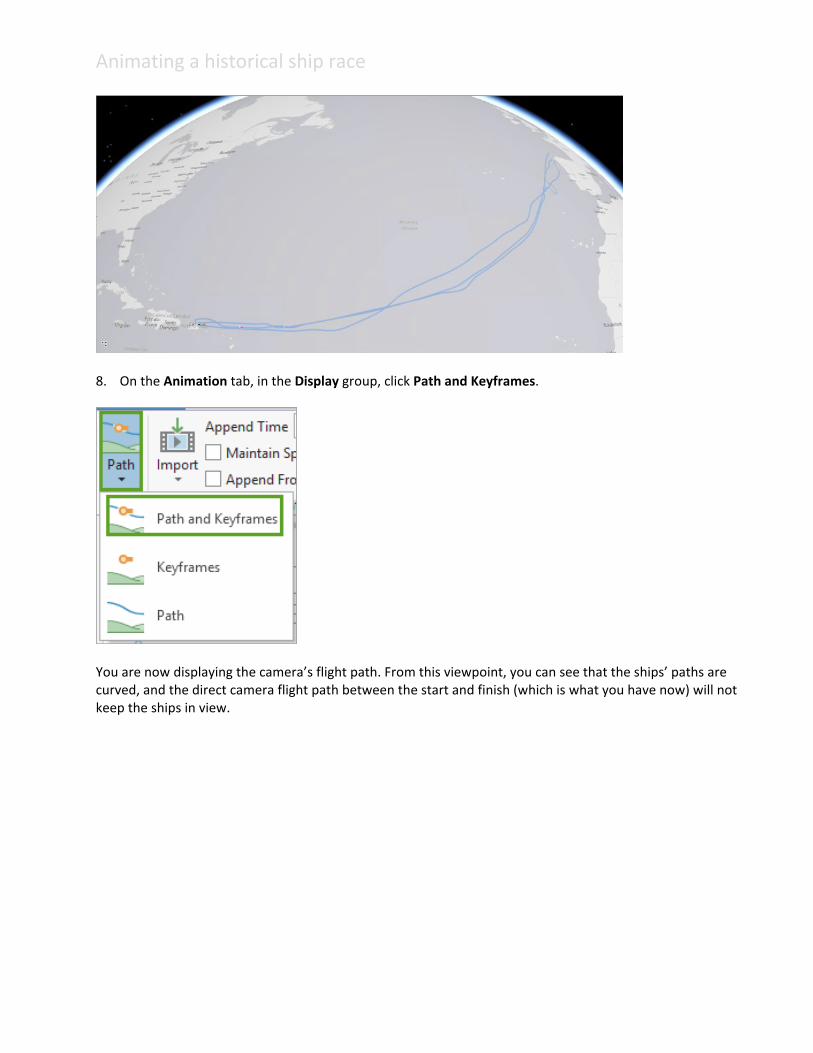
8. On the Animation tab, in the Display group, click Path and Keyframes.
You are now displaying the camera’s flight path. From this viewpoint, you can see that the ships’ paths are curved, and the direct camera flight path between the start and finish (which is what you have now) will not keep the ships in view.
Animating a historical ship race
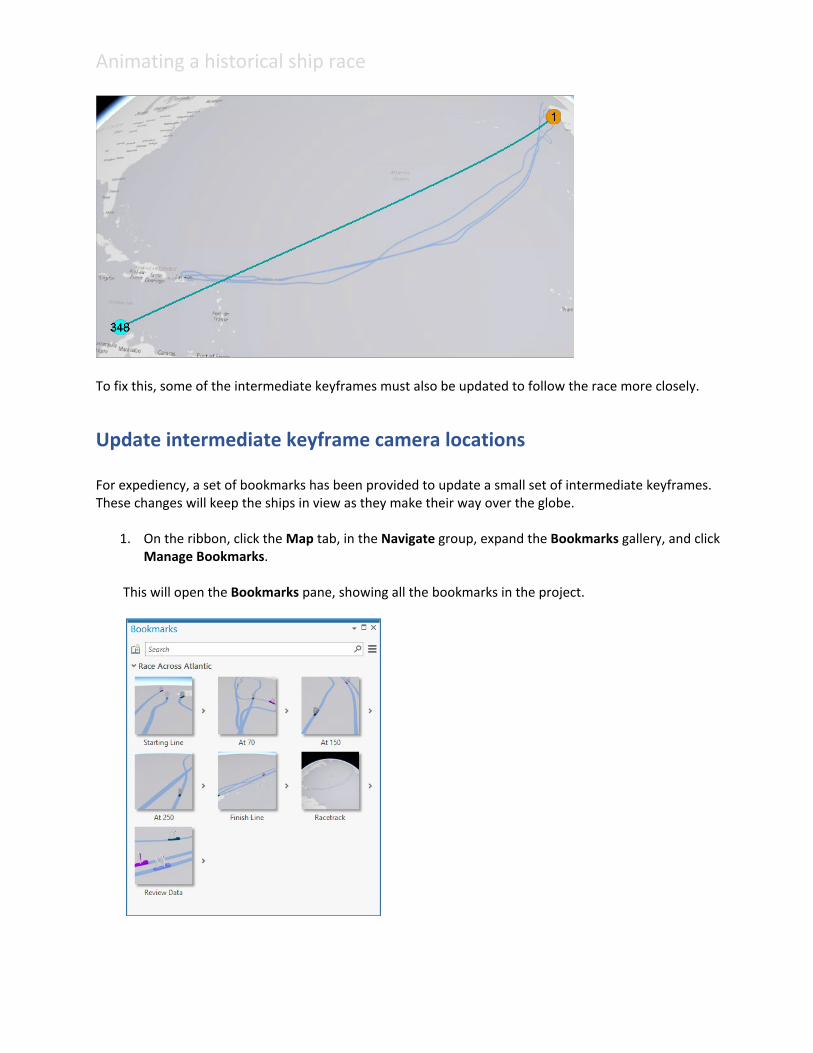
To fix this, some of the intermediate keyframes must also be updated to follow the race more closely.
Update intermediate keyframe camera locations
For expediency, a set of bookmarks has been provided to update a small set of intermediate keyframes. These changes will keep the ships in view as they make their way over the globe.
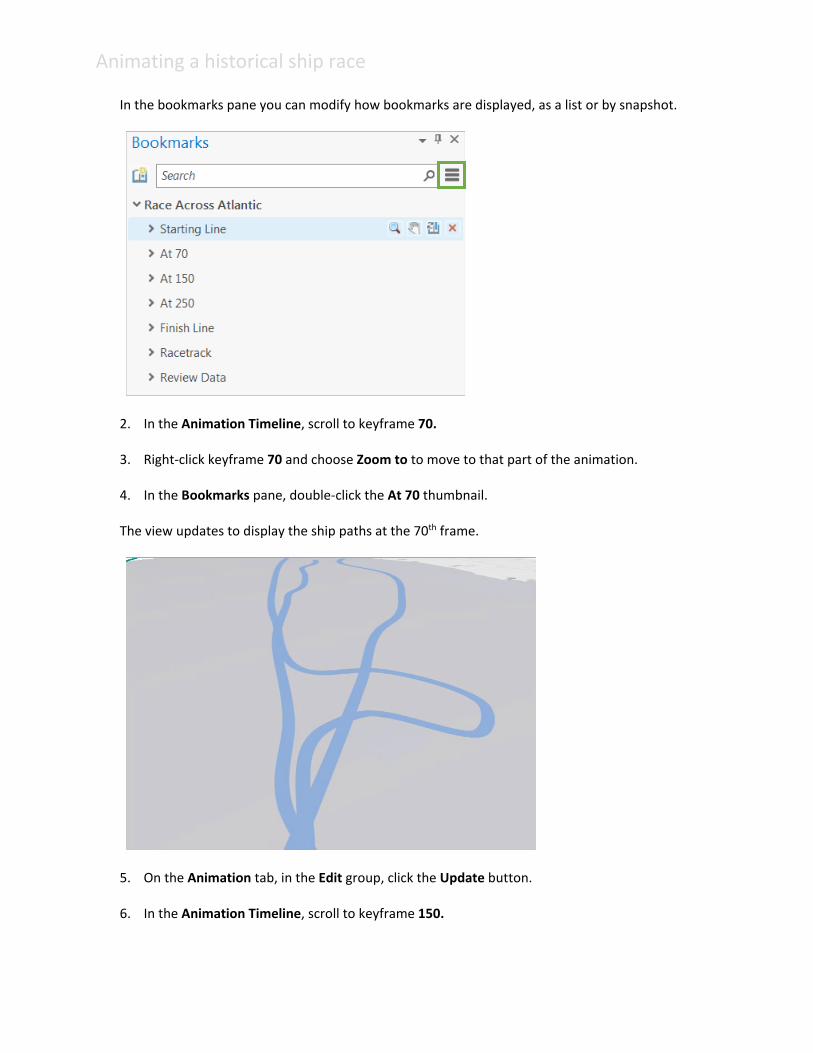
1. On the ribbon, click the Map tab, in the Navigate group, expand the Bookmarks gallery, and click Manage Bookmarks.
This will open the Bookmarks pane, showing all the bookmarks in the project.
Animating a historical ship race
In the bookmarks pane you can modify how bookmarks are displayed, as a list or by snapshot.
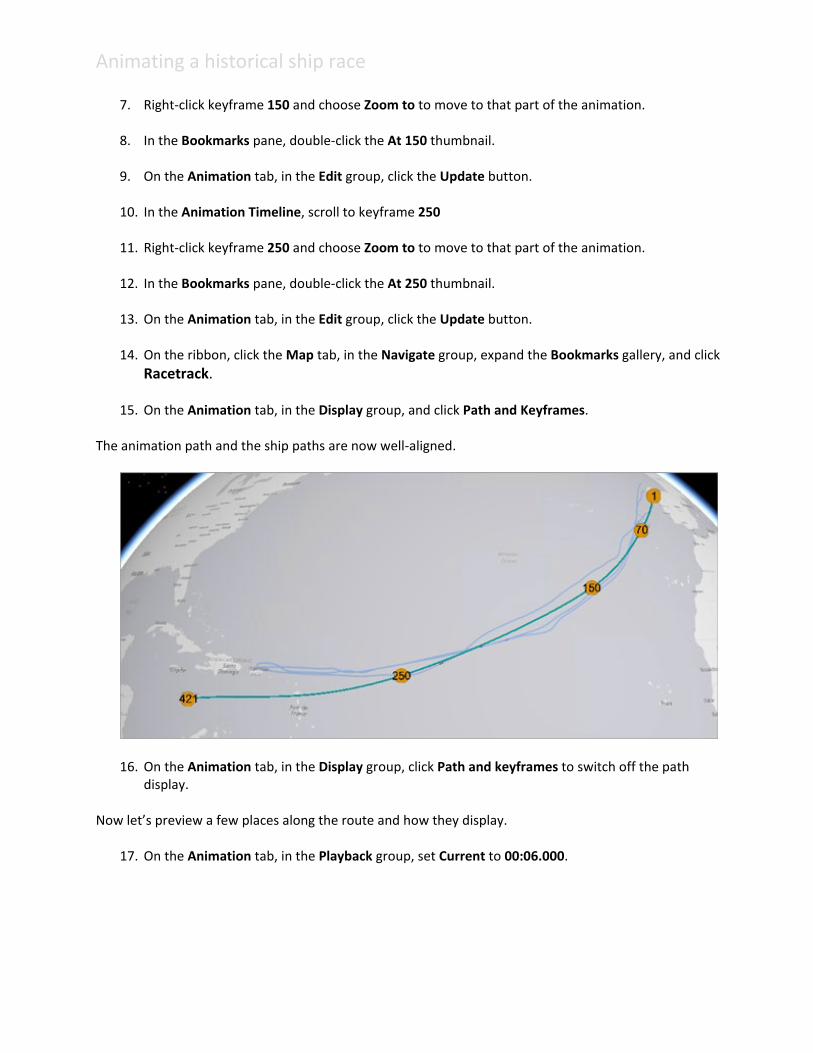
2. In the Animation Timeline, scroll to keyframe 70. 3. Right-click keyframe 70 and choose Zoom to to move to that part of the animation.
4. In the Bookmarks pane, double-click the At 70 thumbnail.
The view updates to display the ship paths at the 70th frame.
5. On the Animation tab, in the Edit group, click the Update button.
6. In the Animation Timeline, scroll to keyframe 150.
Animating a historical ship race
7. Right-click keyframe 150 and choose Zoom to to move to that part of the animation.
8. In the Bookmarks pane, double-click the At 150 thumbnail.
9. On the Animation tab, in the Edit group, click the Update button.
10. In the Animation Timeline, scroll to keyframe 250 11. Right-click keyframe 250 and choose Zoom to to move to that part of the animation.
12. In the Bookmarks pane, double-click the At 250 thumbnail.
13. On the Animation tab, in the Edit group, click the Update button.
14. On the ribbon, click the Map tab, in the Navigate group, expand the Bookmarks gallery, and click
Racetrack.
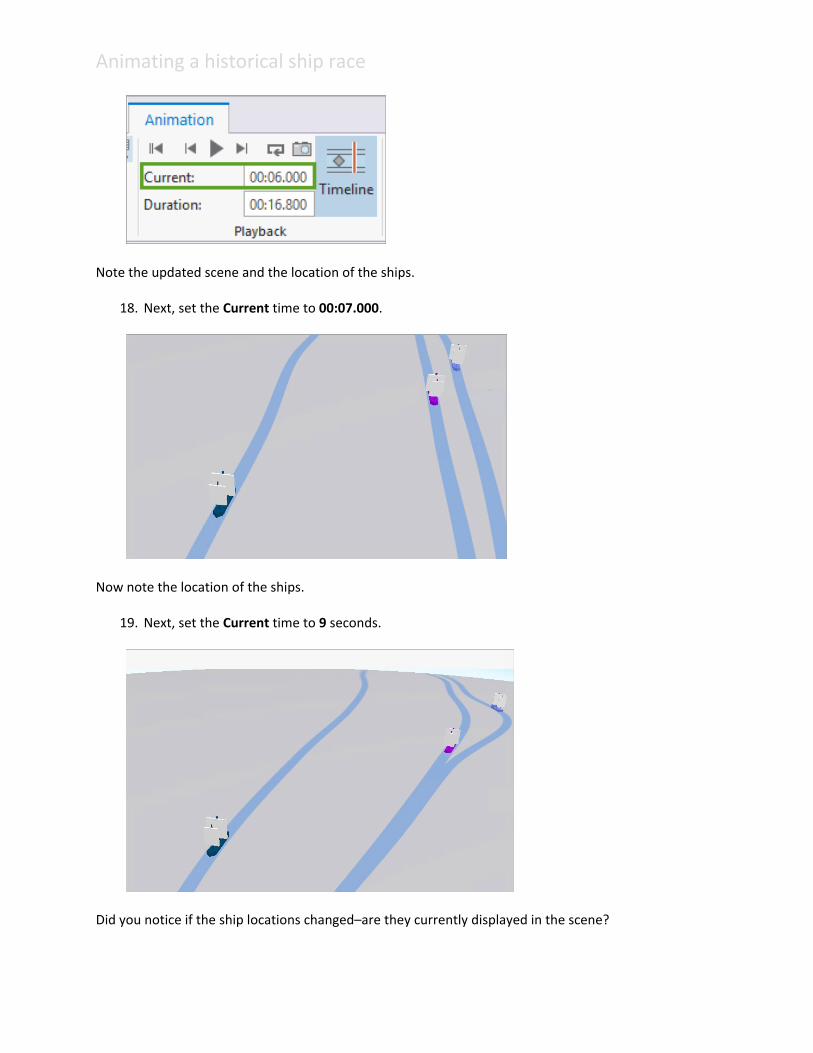
15. On the Animation tab, in the Display group, and click Path and Keyframes.
The animation path and the ship paths are now well-aligned.
16. On the Animation tab, in the Display group, click Path and keyframes to switch off the path
display. Now let’s preview a few places along the route and how they display.
17. On the Animation tab, in the Playback group, set Current to 00:06.000.
Animating a historical ship race
Note the updated scene and the location of the ships.
18. Next, set the Current time to 00:07.000.
Now note the location of the ships.
19. Next, set the Current time to 9 seconds.
Did you notice if the ship locations changed–are they currently displayed in the scene?

Animating a historical ship race
Adding contextual overlay elements
Your video also needs to show who was racing, and when. You can add overlays to do this. First, add a title.
1. In the Animation Timeline, click any keyframe to select.
2. Press Ctrl-A to select all keyframes in the animation.
3. In the Animation tab, in the Overlay group, expand the Overlay gallery, and click Paragraph.

Animating a historical ship race
4. Type “Spain to Puerto Rico, 1770”, then click the red X to exit edit mode.
5. In the Animation tab, in the Overlay group, update: • Font to Book Antiqua • Size to 48 point
6. On the Animation tab, in the Edit group, click the Properties button.
7. In the Animation Properties pane, click the Overlay tab.
8. In the Overlay tab, select Position, then Place overlay top- center.

Animating a historical ship race
Next, add a legend.
9. In the Animation tab, in the Overlay group, click Overlay gallery, and click Image.
Animating a historical ship race
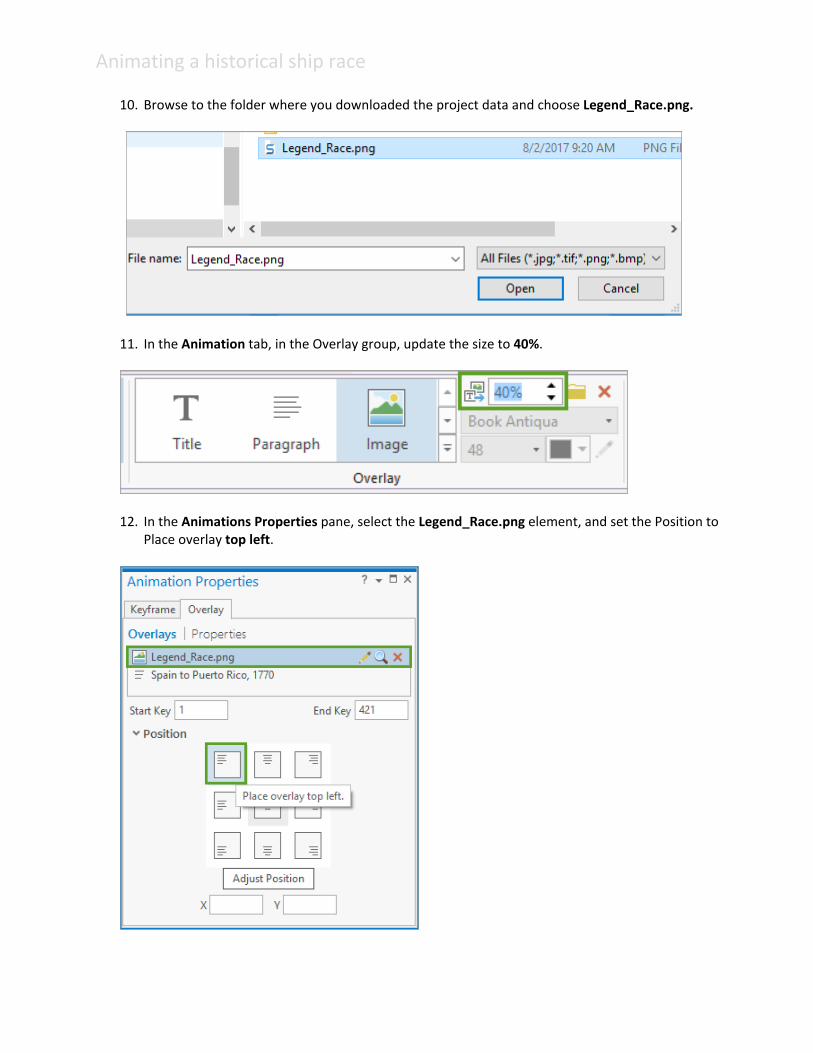
10. Browse to the folder where you downloaded the project data and choose Legend_Race.png.
11. In the Animation tab, in the Overlay group, update the size to 40%.
12. In the Animations Properties pane, select the Legend_Race.png element, and set the Position to Place overlay top left.
Animating a historical ship race
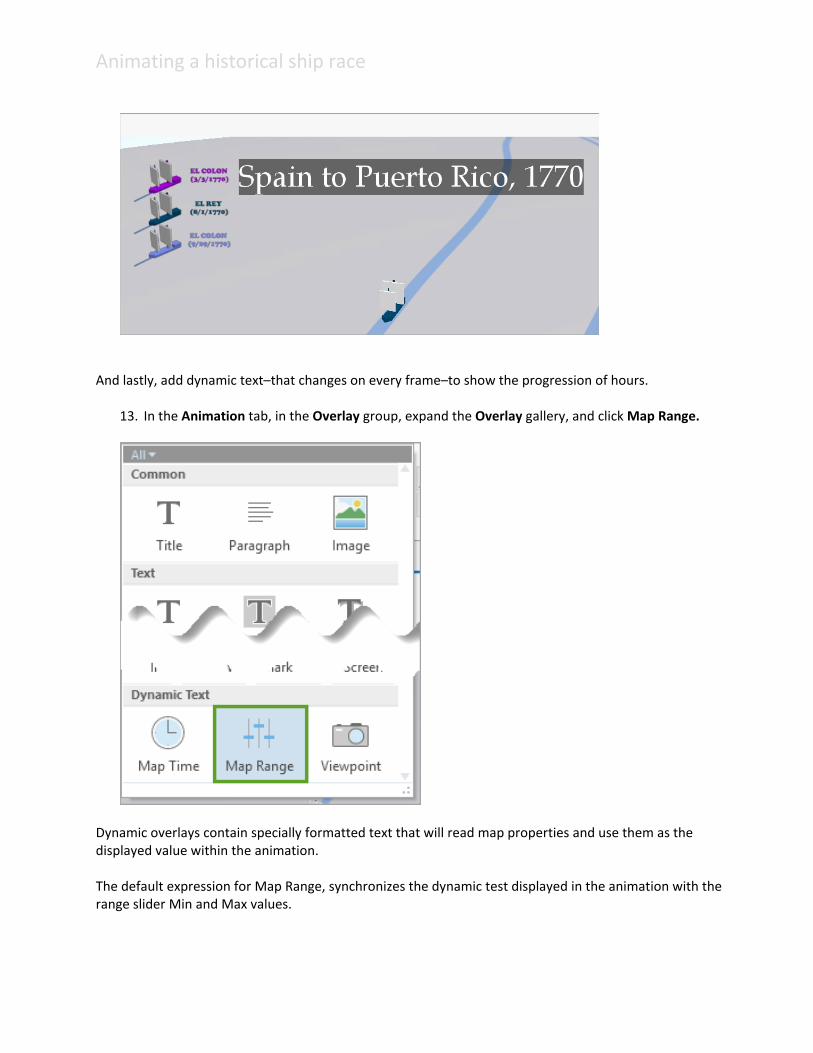
And lastly, add dynamic text–that changes on every frame–to show the progression of hours.
13. In the Animation tab, in the Overlay group, expand the Overlay gallery, and click Map Range.
Dynamic overlays contain specially formatted text that will read map properties and use them as the displayed value within the animation. The default expression for Map Range, synchronizes the dynamic test displayed in the animation with the range slider Min and Max values.
Animating a historical ship race
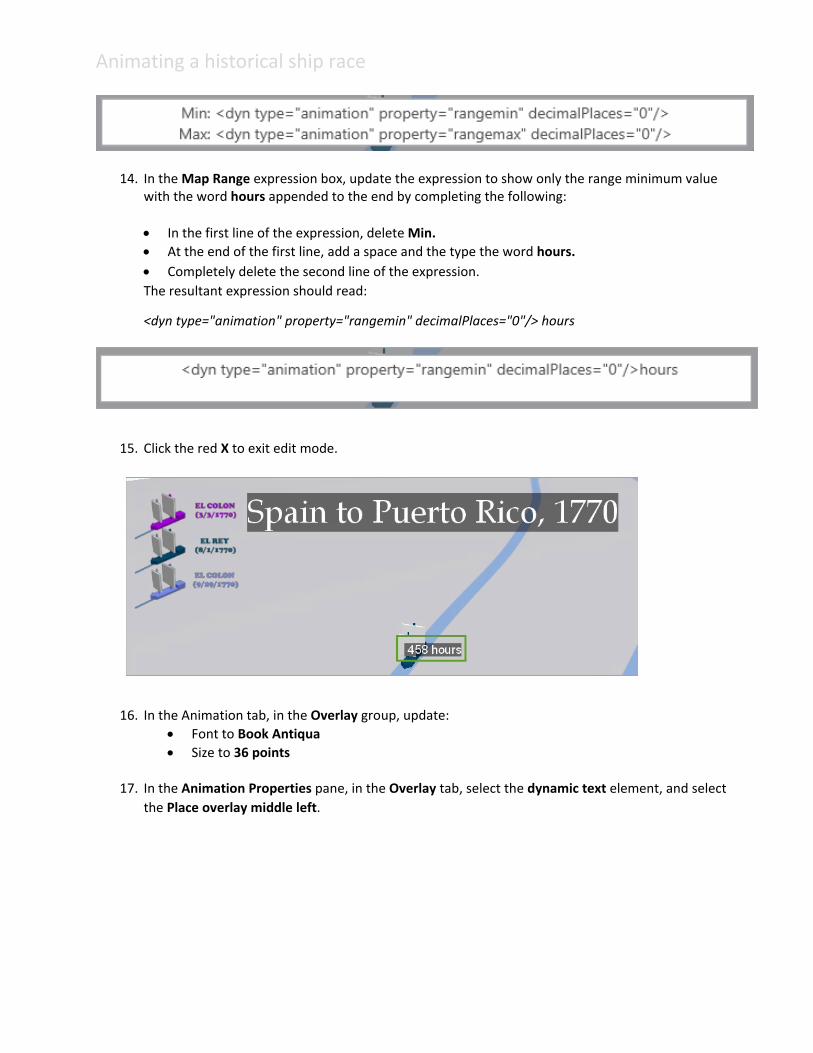
14. In the Map Range expression box, update the expression to show only the range minimum value with the word hours appended to the end by completing the following:
• In the first line of the expression, delete Min. • At the end of the first line, add a space and the type the word hours. • Completely delete the second line of the expression. The resultant expression should read:
<dyn type="animation" property="rangemin" decimalPlaces="0"/> hours
15. Click the red X to exit edit mode.
16. In the Animation tab, in the Overlay group, update:
• Font to Book Antiqua • Size to 36 points
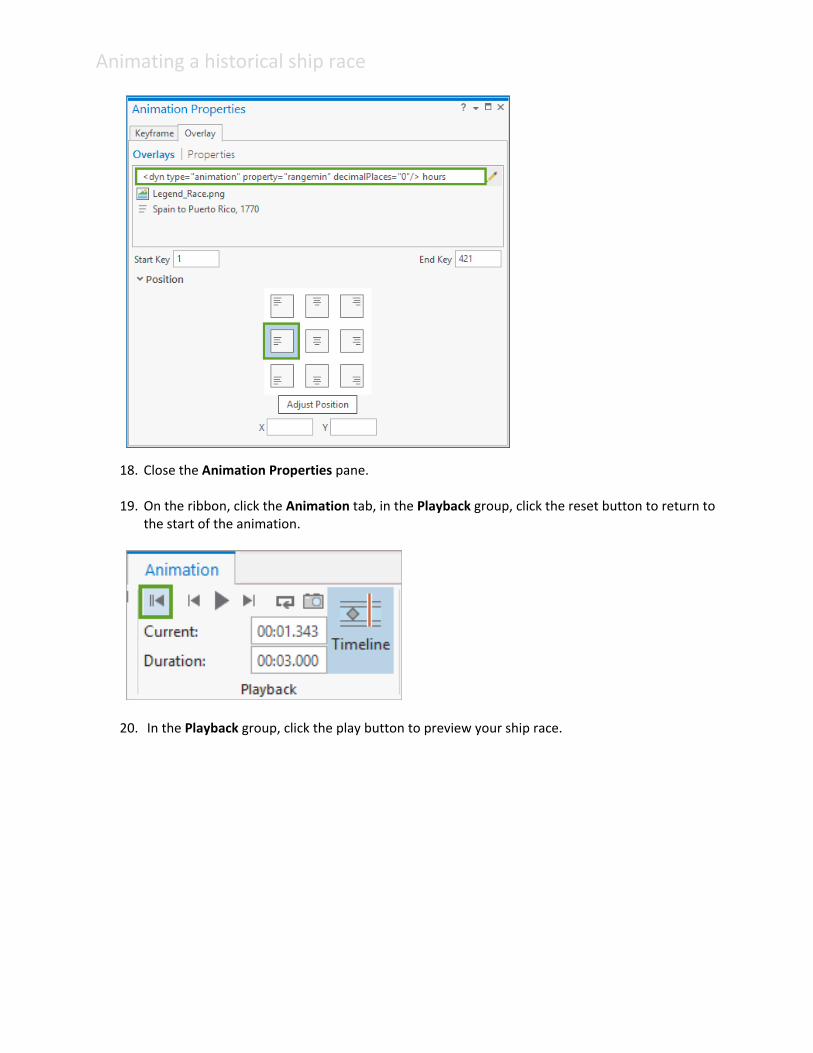
17. In the Animation Properties pane, in the Overlay tab, select the dynamic text element, and select
the Place overlay middle left.
Animating a historical ship race
18. Close the Animation Properties pane.
19. On the ribbon, click the Animation tab, in the Playback group, click the reset button to return to the start of the animation.
20. In the Playback group, click the play button to preview your ship race.
Animating a historical ship race
21. Save the project.
Creating the video
Your animation is now ready for export to video. Remember to set the export frame rate to match your stop-motion rate of 25 frames per second.
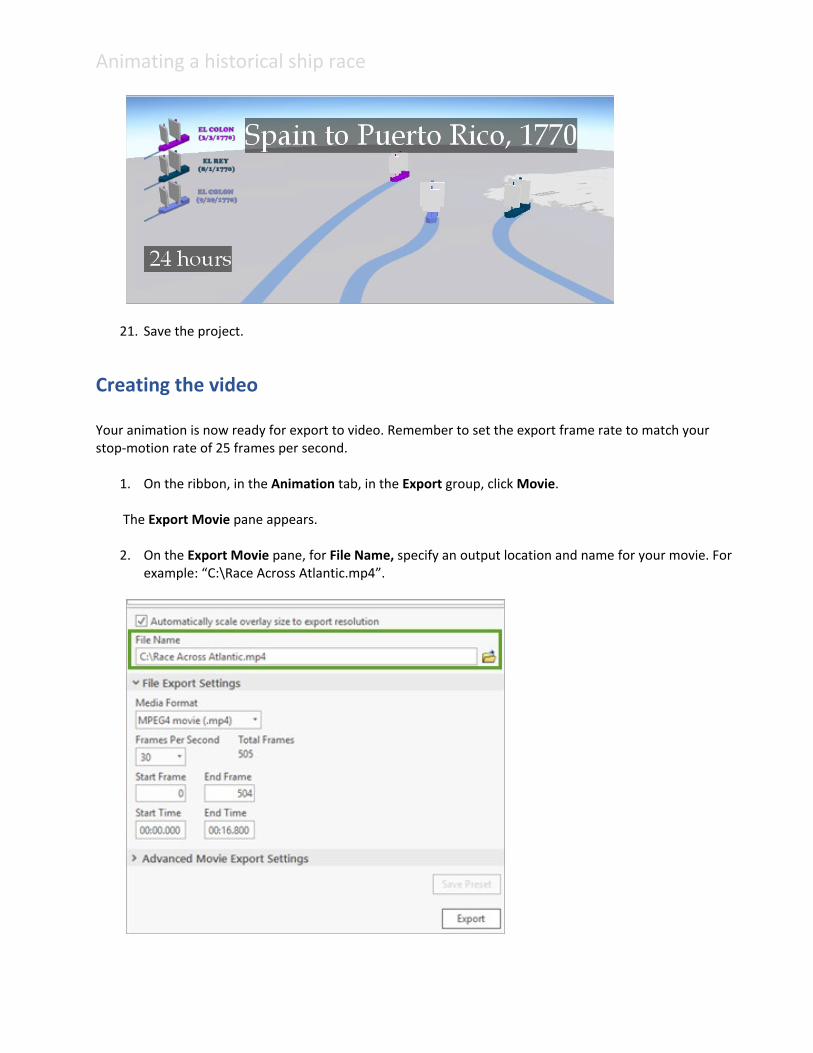
1. On the ribbon, in the Animation tab, in the Export group, click Movie.
The Export Movie pane appears. 2. On the Export Movie pane, for File Name, specify an output location and name for your movie. For
example: “C:\Race Across Atlantic.mp4”.
Animating a historical ship race
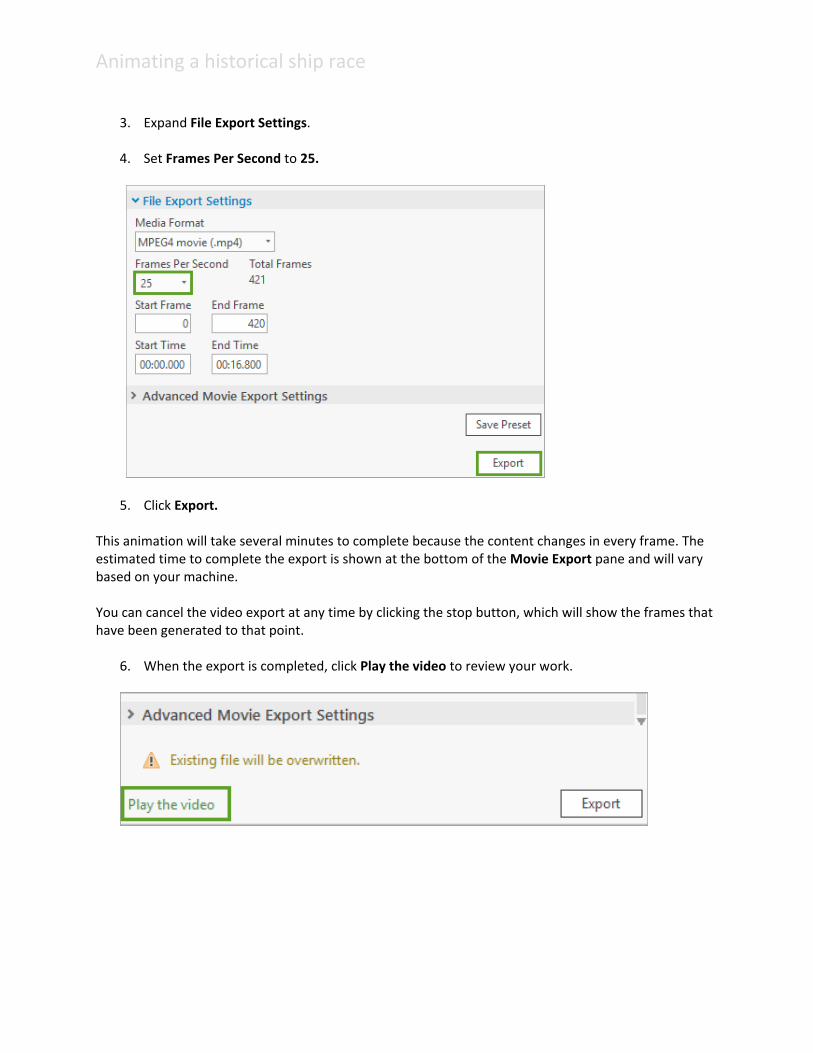
3. Expand File Export Settings.
4. Set Frames Per Second to 25.
5. Click Export.
This animation will take several minutes to complete because the content changes in every frame. The estimated time to complete the export is shown at the bottom of the Movie Export pane and will vary based on your machine. You can cancel the video export at any time by clicking the stop button, which will show the frames that have been generated to that point.
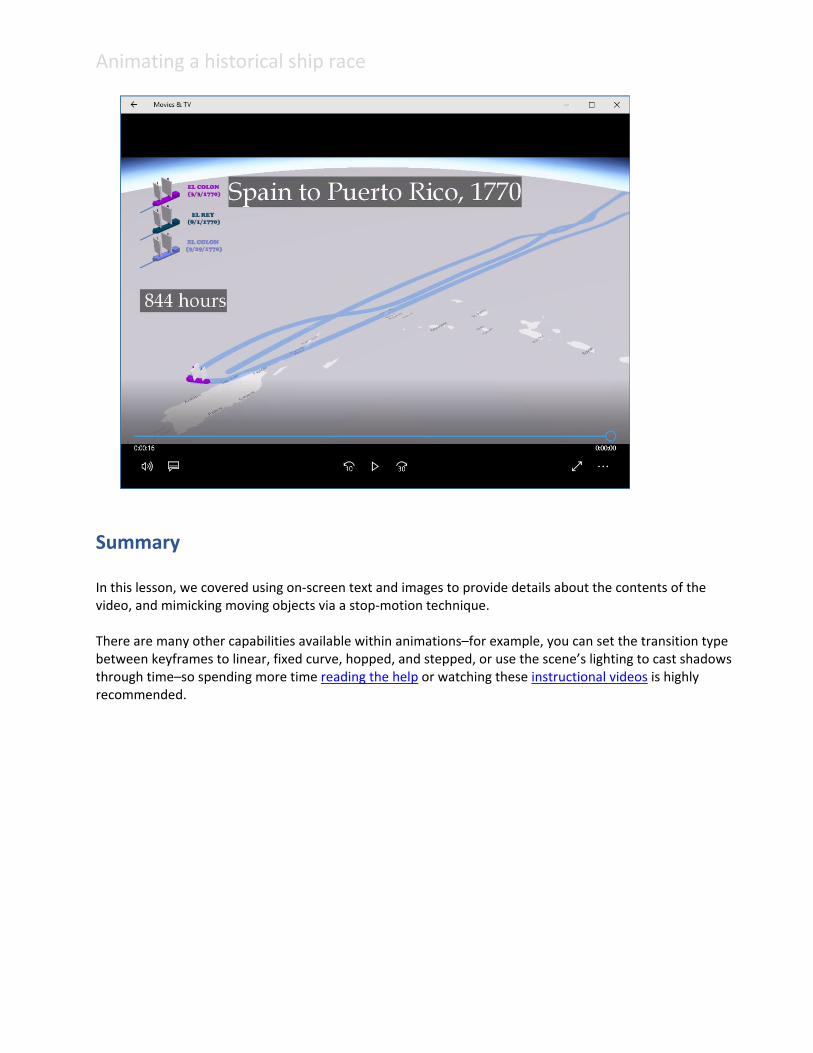
6. When the export is completed, click Play the video to review your work.
Animating a historical ship race
Summary
In this lesson, we covered using on-screen text and images to provide details about the contents of the video, and mimicking moving objects via a stop-motion technique. There are many other capabilities available within animations–for example, you can set the transition type between keyframes to linear, fixed curve, hopped, and stepped, or use the scene’s lighting to cast shadows through time–so spending more time reading the help or watching these instructional videos is highly recommended.