Embed Size (px)
Citation preview
Anion Receptors Containing -NH Binding Sites: Hydrogen-Bond Formationor Neat Proton Transfer?
Valeria Amendola,[a] Massimo Boiocchi,[b] Luigi Fabbrizzi,*[a] and Arianna Palchetti[a]
Introduction
Anions play an important role in medicine, biology, environ-mental and food sciences,[1] accounting for the increasing in-terest in the design of synthetic anion receptors. Methodolo-gies for the prompt detection and quantitative determina-tion of anions are being developed and, within the lastdecade, a variety of molecular sensors for anions have beensynthesised.[2] Most of these sensors contain chromogenic orfluorogenic groups that are covalently or non-covalentlylinked to the receptor moiety, thus enabling the colorimetricand fluorimetric sensing of anions with both temporal andspatial resolution.[3] The nature of the anion–receptor inter-action is a matter of choice for the designer; it can be elec-trostatic, in which case the receptor must be equipped withpositively charged groups (e.g., ammonium, alkylammoni-um, pyridinium, guanidinium),[4] or it can be based on hy-drogen bonding. In the latter case, the receptor must pro-vide hydrogen-bond-donor groups, in most cases the -NHfragment of carboxyamides, sulfonamides, ureas, thioureasand pyrroles.[5] Receptors based on hydrogen bonding areexpected to interact principally with anions containing the
most electronegative atoms, fluoride and oxygen (in theform of inorganic and organic oxo anions), while recognitionstudies are preferably carried out in aprotic media (e.g., di-methyl sulfoxide (DMSO), MeCN, CHCl3), to avoid compe-tition of the solvent (e.g., water or alcohols) as a hydrogen-bond donor.From this perspective, we considered the possibility of de-
signing anion receptors that contained both a positivelycharged group and a hydrogen-bond-donor group. The rea-sons for this approach were two-fold: firstly, the presence ofa proximate, positive charge should enhance the tendency ofthe -NH group to act as a hydrogen-bond donor, and sec-ondly, the positively charged group itself should provide ad-ditional electrostatic interaction with the negatively chargedanalyte. We prepared the molecular ions 1+ (1-benzyl-3-(tol-uene-4-sulfonylamino)pyridinium; -NH binding site fromthe p-toluenesulfonamide moiety, positive charge from thebenzylpyridinium fragment), and 2+ (2-benzyl-9H-b-carbo-lin-2-ium; -NH from the pyrrole subunit, positive chargeagain from a benzylpyridinium fragment).
The interaction of 1+ and 2+ with a variety of anions wasinvestigated by performing titration experiments in DMSO,and analysing the products by UV/Vis spectrophotometry
[a] Dr. V. Amendola, Prof. L. Fabbrizzi, A. PalchettiDipartimento di Chimica Generale, Universit= di Paviaviale Taramelli 12, 27100 Pavia (Italy)Fax: (+39)0382-528-544E-mail : [email protected]
[b] Dr. M. BoiocchiCentro Grandi Strumenti, Universit= di Paviavia Bassi 21, 27100 Pavia (Italy)
Abstract: When the amide-containingreceptor 1+ is in a solution of dimethylsulfoxide (DMSO) in the presence ofbasic anions (CH3COO� , F� , H2PO4
�),it undergoes deprotonation of the -NHfragment to give the correspondingzwitterion, which can be isolated as acrystalline solid. In the presence of less
basic anions (Cl� , Br� , NO3�), 1+ es-
tablishes true hydrogen-bond interac-tions of decreasing intensity. The less
acidic receptor 2+ undergoes neatproton transfer with only the morebasic anions CH3COO� and F� , and es-tablishes hydrogen-bond interactionswith H2PO4
� . An empirical criterionfor discerning neutralisation and hydro-gen bonding, based on UV/Vis and1H NMR spectra, is proposed.
Keywords: anions · hydrogenbonds · molecular recognition ·proton transfer · receptors
D 2005 Wiley-VCH Verlag GmbH&Co. KGaA, Weinheim DOI: 10.1002/chem.200400592 Chem. Eur. J. 2005, 11, 120 – 127120
and 1H NMR spectroscopy. We demonstrated that anion–re-ceptor interactions may involve either a neat proton transferor hydrogen-bond interactions, depending on the intrinsicacidity of the -NH group and the basic tendencies of theanion.
Results and Discussion
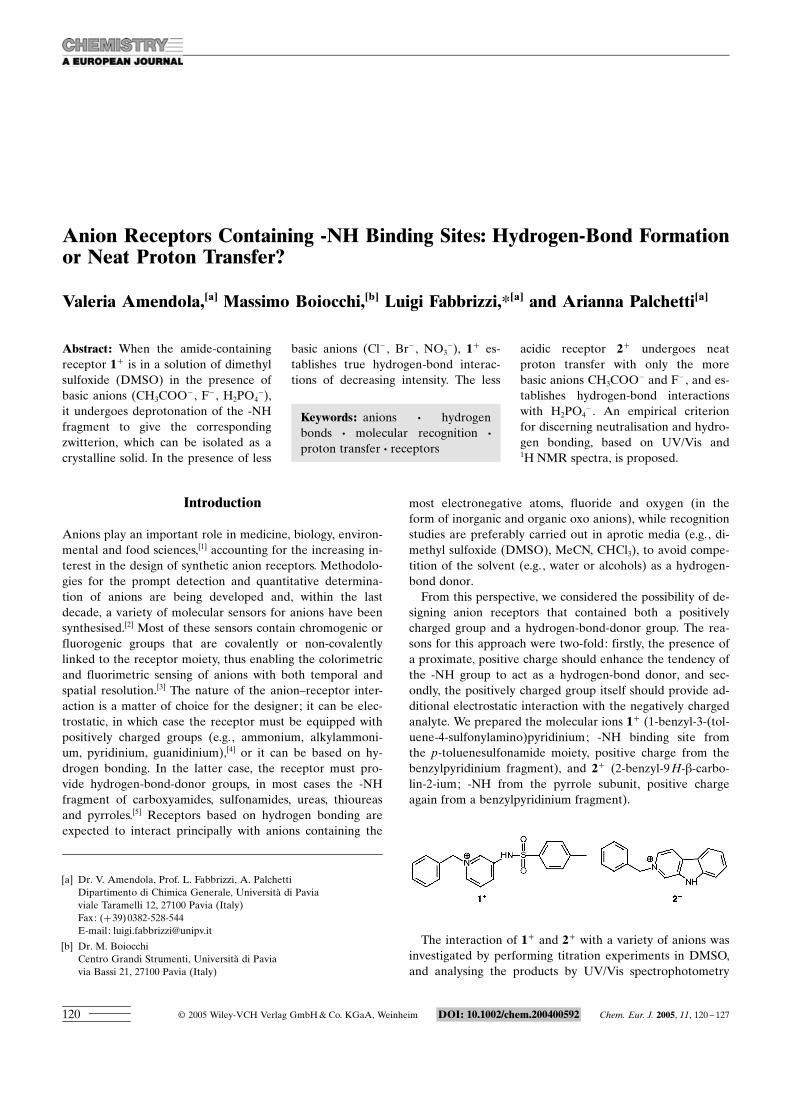
Both 1+ and 2+ were obtained as hexafluorophosphate salts,following reaction of the parent molecules with benzylbro-mide and subsequent recrystallisation in the presence of[NH4]PF6. The crystalline form of 1-PF6 was isolated and itsmolecular structure was determined by X-ray diffractionstudies (Figure 1). The structure reveals the reciprocal inter-
action of two 1+ ions, by means of hydrogen bonds involvingthe -NH group from one ion and a sulfonamide oxygenatom from the other. Each 1+ ion exhibits a conformationthat may minimise the intermolecular steric repulsionswithin the hydrogen-bonded dimer. In any case, interactionsdo not involve the PF6
� ion, which was deliberately chosento act as a very poor hydrogen-bond acceptor.Next, a solution of 1-PF6 in DMSO was titrated with a so-
lution of a [Bu4N]X salt in DMSO, in which X� representedthe F� , CH3COO� , H2PO4
� , NO3� , Cl� or Br� ion. In all
cases, the resulting solution had a yellow colour of greateror lesser intensity; however, the UV/Vis absorption spectradiffered significantly from salt to salt. Figure 2 shows, as an
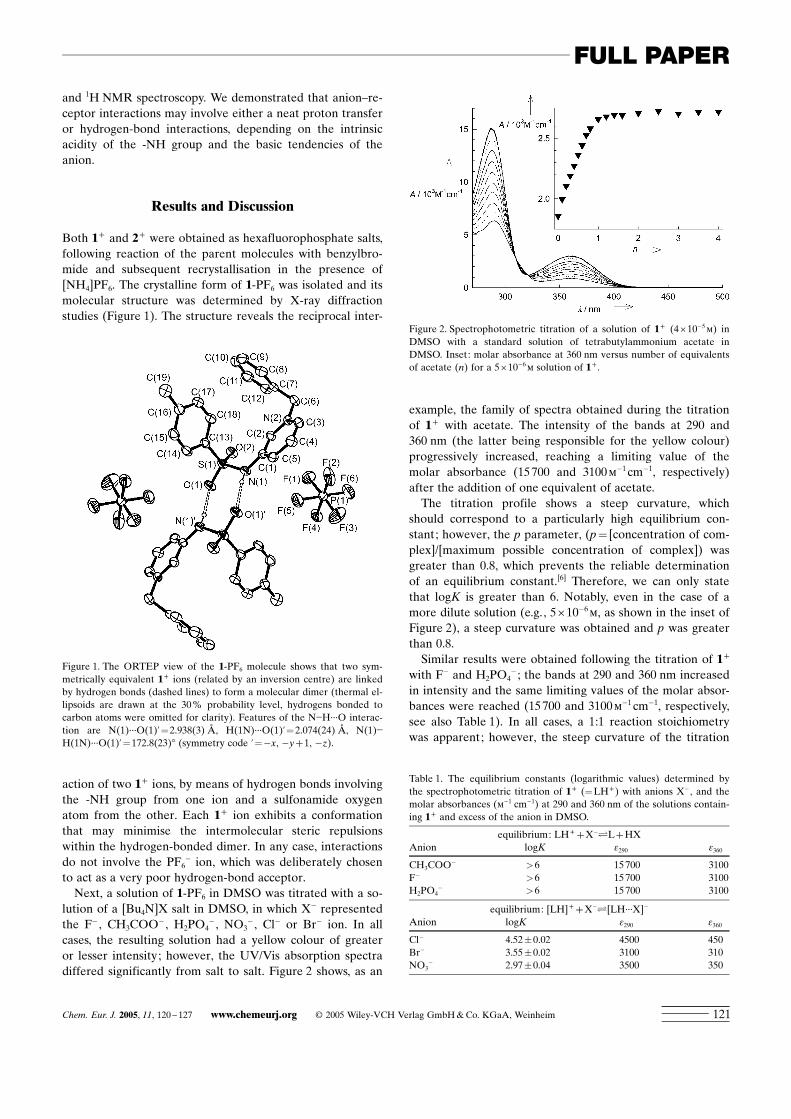
example, the family of spectra obtained during the titrationof 1+ with acetate. The intensity of the bands at 290 and360 nm (the latter being responsible for the yellow colour)progressively increased, reaching a limiting value of themolar absorbance (15700 and 3100m�1 cm�1, respectively)after the addition of one equivalent of acetate.The titration profile shows a steep curvature, which
should correspond to a particularly high equilibrium con-stant; however, the p parameter, (p= [concentration of com-plex]/[maximum possible concentration of complex]) wasgreater than 0.8, which prevents the reliable determinationof an equilibrium constant.[6] Therefore, we can only statethat logK is greater than 6. Notably, even in the case of amore dilute solution (e.g., 5I10�6m, as shown in the inset ofFigure 2), a steep curvature was obtained and p was greaterthan 0.8.Similar results were obtained following the titration of 1+
with F� and H2PO4� ; the bands at 290 and 360 nm increased
in intensity and the same limiting values of the molar absor-bances were reached (15700 and 3100m�1 cm�1, respectively,see also Table 1). In all cases, a 1:1 reaction stoichiometrywas apparent; however, the steep curvature of the titration
Figure 1. The ORTEP view of the 1-PF6 molecule shows that two sym-metrically equivalent 1+ ions (related by an inversion centre) are linkedby hydrogen bonds (dashed lines) to form a molecular dimer (thermal el-lipsoids are drawn at the 30% probability level, hydrogens bonded tocarbon atoms were omitted for clarity). Features of the N�H···O interac-tion are N(1)···O(1)’=2.938(3) L, H(1N)···O(1)’=2.074(24) L, N(1)�H(1N)···O(1)’=172.8(23)8 (symmetry code ’=�x, �y+1, �z).
Figure 2. Spectrophotometric titration of a solution of 1+ (4I10�5m) inDMSO with a standard solution of tetrabutylammonium acetate inDMSO. Inset: molar absorbance at 360 nm versus number of equivalentsof acetate (n) for a 5I10�6m solution of 1+ .
Table 1. The equilibrium constants (logarithmic values) determined bythe spectrophotometric titration of 1+ (=LH+) with anions X� , and themolar absorbances (m�1 cm�1) at 290 and 360 nm of the solutions contain-ing 1+ and excess of the anion in DMSO.
equilibrium: LH+ +X�ÐL+HXAnion logK e290 e360
CH3COO� >6 15700 3100F� >6 15700 3100H2PO4
� >6 15700 3100
equilibrium: [LH]+ +X�Ð[LH···X]�
Anion logK e290 e360
Cl� 4.52�0.02 4500 450Br� 3.55�0.02 3100 310NO3
� 2.97�0.04 3500 350
Chem. Eur. J. 2005, 11, 120 – 127 www.chemeurj.org D 2005 Wiley-VCH Verlag GmbH&Co. KGaA, Weinheim 121
FULL PAPER

profile prevented determination of the equilibrium constant(logK>6).Different results were obtained following titration of 1+
with NO3� , Cl� and Br� . Although the intensity of absorp-
tion at 290 and 360 nm increased, the limiting values ob-tained after addition of excess anion were distinctly lowerthan those in the above examples, and varied according tothe nature of the anion (see Table 1). As an example,Figure 3 displays the family of spectra obtained from the ti-
tration with Cl� . In all cases, nonlinear least-squares analysisof the titration data indicated a 1:1 stoichiometry. In addi-tion, the titration profiles displayed gentle curvature and thep parameter was less than 0.8.The equilibrium constants, calculated from the nonlinear
fitting of titration profiles, are reported in Table 1. The logKvalues for the 1+/X� interaction decrease along the series:CH3COO� , F� , H2PO4
� > Cl� > Br� > NO3� .
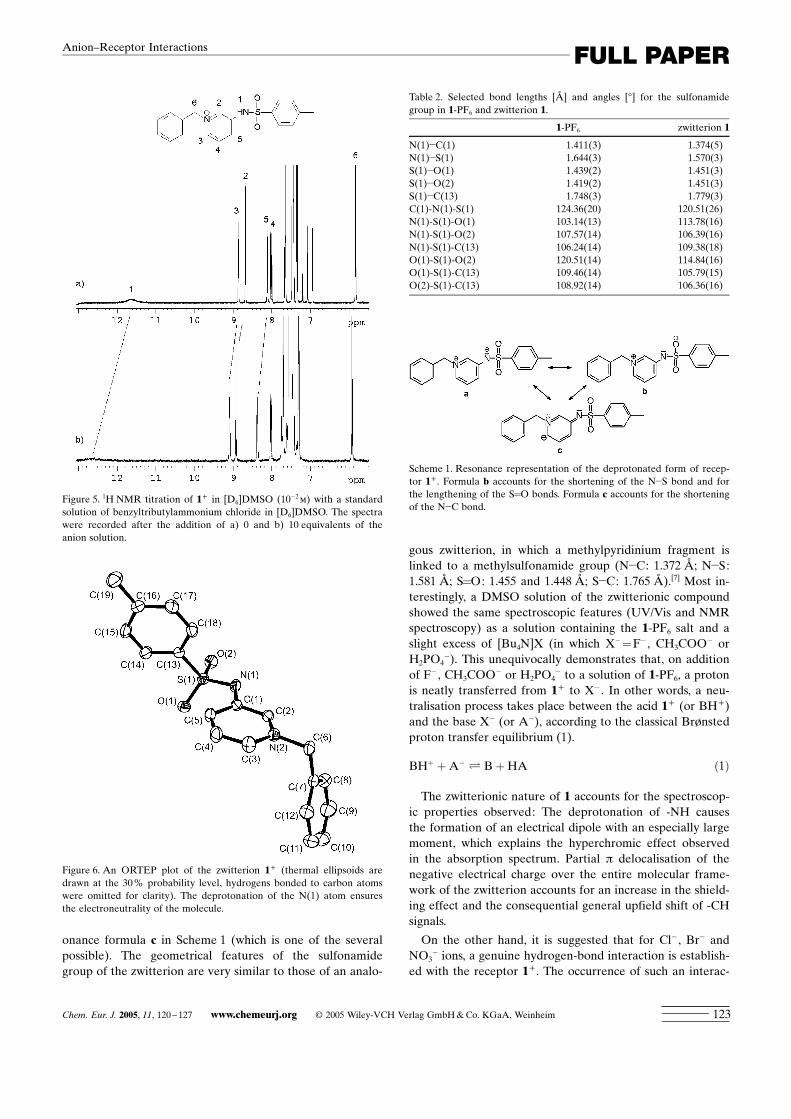
Further insights into the nature of receptor–anion interac-tions were provided by the analysis of 1H NMR spectra.Figure 4 displays the spectra for titration of a 10�2m[D6]DMSO solution of 1-PF6 with a [D6]DMSO solution of[Bu4N]CH3COO. Upon addition of acetate, the -NH signalat d=11.6 ppm disappears and the majority of signals perti-nent to the -CH hydrogens shift distinctly upfield, with thegreatest shift observed for -C(3)-H (Dppm=�0.64). Similarresults were obtained for F� and H2PO4
� , in particular, thesame limiting d values (obtained after the addition of one ormore equivalents of anion) were recorded.A different behaviour was observed with the remaining
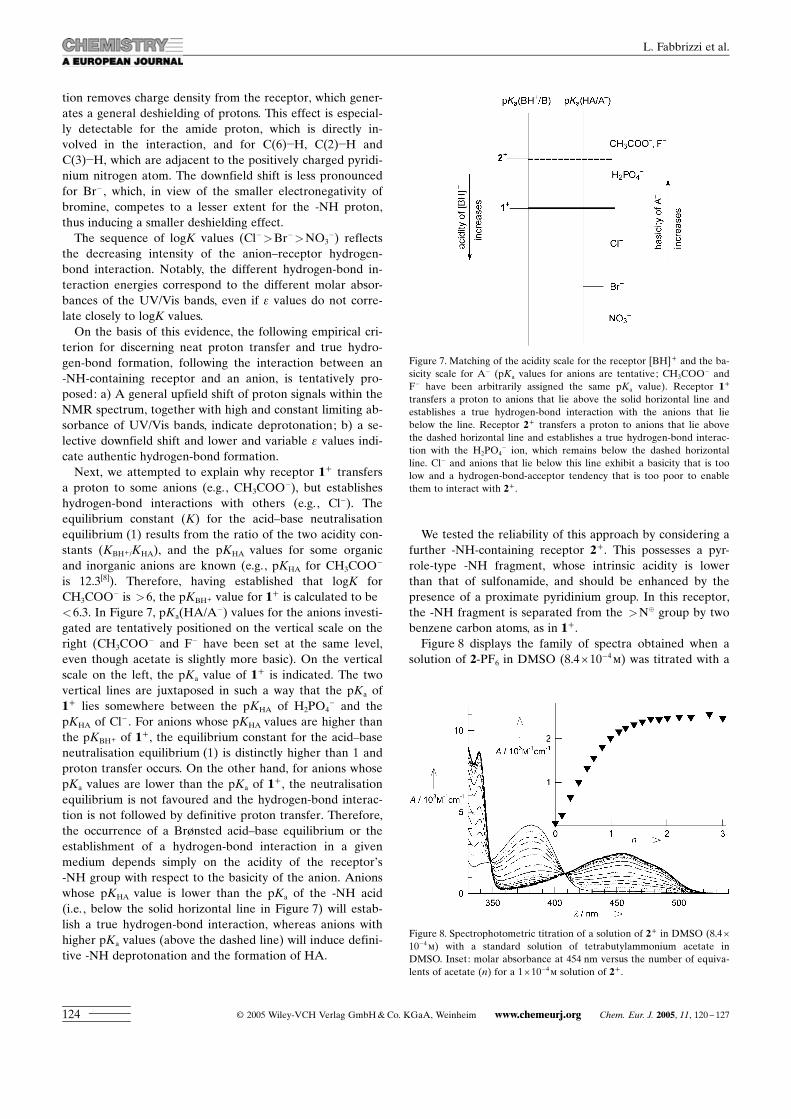
anions. Figure 5 shows the spectra obtained in the course oftitration of 1+ with benzyltributylammonium chloride in[D6]DMSO. In contrast to the results for CH3COO� , F� andH2PO4
� , the peak relative to the amide group (peak 1), didnot disappear, but instead was shifted significantly down-field. The protons in positions 2, 3 and 5 were shifted down-field, whereas those in positions 4 and 6 remained un-
changed. Similar results, although with less pronouncedshifts, were observed upon titration with bromide.The slow evaporation of a water/acetonitrile (2:1 v/v) so-
lution containing equimolar amounts of 1-PF6 and[Bu4N]CH3COO yielded pale yellow crystals. X-ray diffrac-tion revealed that these crystals contained no anions; rather,the positive charge of the benzyl pyridinium group was bal-anced by the negative charge resulting from deprotonationof the -NH fragment of the amide subunit. The zwitterion isshown in Figure 6. Comparison with 1+ revealed significantchanges in the geometry of the sulfonamide group (Table 2).Following deprotonation, the N(1)�S(1) bond length de-
creases, whereas the S=O distance increases. This suggeststhat the lone pair on the deprotonated nitrogen atom ispartly delocalised by a p mechanism over the >SO2 frag-ment. This is described in part by the resonance representa-tion in Scheme 1 (formula b). On the other hand, some elec-tronic charge must also delocalise through a p mechanismover the pyridinium ring, as suggested by the distinct reduc-tion of the N(1)�C(1) distance and accounted for by the res-
Figure 3. Spectrophotometric titration of a solution of 1+ (9I10�4m) inDMSO with a standard solution of benzyltributylammonium chloride inDMSO. Inset: molar absorbance at 360 nm versus number of equivalentsof chloride (n).
Figure 4. 1H NMR titration of 1+ in [D6]DMSO (10�2m) with a standardsolution of tetrabutylammonium acetate in [D6]DMSO. The spectra wererecorded after the addition of a) 0, b) 0.25, c) 0.5 and d) 1.0 equivalentsof acetate.
D 2005 Wiley-VCH Verlag GmbH&Co. KGaA, Weinheim www.chemeurj.org Chem. Eur. J. 2005, 11, 120 – 127122
L. Fabbrizzi et al.
onance formula c in Scheme 1 (which is one of the severalpossible). The geometrical features of the sulfonamidegroup of the zwitterion are very similar to those of an analo-
gous zwitterion, in which a methylpyridinium fragment islinked to a methylsulfonamide group (N�C: 1.372 L; N�S:1.581 L; S=O: 1.455 and 1.448 L; S�C: 1.765 L).[7] Most in-terestingly, a DMSO solution of the zwitterionic compoundshowed the same spectroscopic features (UV/Vis and NMRspectroscopy) as a solution containing the 1-PF6 salt and aslight excess of [Bu4N]X (in which X�=F� , CH3COO� orH2PO4
�). This unequivocally demonstrates that, on additionof F� , CH3COO� or H2PO4
� to a solution of 1-PF6, a protonis neatly transferred from 1+ to X� . In other words, a neu-tralisation process takes place between the acid 1+ (or BH+)and the base X� (or A�), according to the classical Brønstedproton transfer equilibrium (1).
BHþ þA� Ð BþHA ð1Þ
The zwitterionic nature of 1 accounts for the spectroscop-ic properties observed: The deprotonation of -NH causesthe formation of an electrical dipole with an especially largemoment, which explains the hyperchromic effect observedin the absorption spectrum. Partial p delocalisation of thenegative electrical charge over the entire molecular frame-work of the zwitterion accounts for an increase in the shield-ing effect and the consequential general upfield shift of -CHsignals.
On the other hand, it is suggested that for Cl� , Br� andNO3
� ions, a genuine hydrogen-bond interaction is establish-ed with the receptor 1+ . The occurrence of such an interac-
Figure 5. 1H NMR titration of 1+ in [D6]DMSO (10�2m) with a standardsolution of benzyltributylammonium chloride in [D6]DMSO. The spectrawere recorded after the addition of a) 0 and b) 10 equivalents of theanion solution.
Figure 6. An ORTEP plot of the zwitterion 1+ (thermal ellipsoids aredrawn at the 30% probability level, hydrogens bonded to carbon atomswere omitted for clarity). The deprotonation of the N(1) atom ensuresthe electroneutrality of the molecule.
Table 2. Selected bond lengths [L] and angles [8] for the sulfonamidegroup in 1-PF6 and zwitterion 1.
1-PF6 zwitterion 1
N(1)�C(1) 1.411(3) 1.374(5)N(1)�S(1) 1.644(3) 1.570(3)S(1)�O(1) 1.439(2) 1.451(3)S(1)�O(2) 1.419(2) 1.451(3)S(1)�C(13) 1.748(3) 1.779(3)C(1)-N(1)-S(1) 124.36(20) 120.51(26)N(1)-S(1)-O(1) 103.14(13) 113.78(16)N(1)-S(1)-O(2) 107.57(14) 106.39(16)N(1)-S(1)-C(13) 106.24(14) 109.38(18)O(1)-S(1)-O(2) 120.51(14) 114.84(16)O(1)-S(1)-C(13) 109.46(14) 105.79(15)O(2)-S(1)-C(13) 108.92(14) 106.36(16)
Scheme 1. Resonance representation of the deprotonated form of recep-tor 1+ . Formula b accounts for the shortening of the N�S bond and forthe lengthening of the S=O bonds. Formula c accounts for the shorteningof the N�C bond.
Chem. Eur. J. 2005, 11, 120 – 127 www.chemeurj.org D 2005 Wiley-VCH Verlag GmbH&Co. KGaA, Weinheim 123
FULL PAPERAnion–Receptor Interactions
tion removes charge density from the receptor, which gener-ates a general deshielding of protons. This effect is especial-ly detectable for the amide proton, which is directly in-volved in the interaction, and for C(6)�H, C(2)�H andC(3)�H, which are adjacent to the positively charged pyridi-nium nitrogen atom. The downfield shift is less pronouncedfor Br� , which, in view of the smaller electronegativity ofbromine, competes to a lesser extent for the -NH proton,thus inducing a smaller deshielding effect.The sequence of logK values (Cl�>Br�>NO3
�) reflectsthe decreasing intensity of the anion–receptor hydrogen-bond interaction. Notably, the different hydrogen-bond in-teraction energies correspond to the different molar absor-bances of the UV/Vis bands, even if e values do not corre-late closely to logK values.On the basis of this evidence, the following empirical cri-
terion for discerning neat proton transfer and true hydro-gen-bond formation, following the interaction between an-NH-containing receptor and an anion, is tentatively pro-posed: a) A general upfield shift of proton signals within theNMR spectrum, together with high and constant limiting ab-sorbance of UV/Vis bands, indicate deprotonation; b) a se-lective downfield shift and lower and variable e values indi-cate authentic hydrogen-bond formation.Next, we attempted to explain why receptor 1+ transfers
a proton to some anions (e.g., CH3COO�), but establisheshydrogen-bond interactions with others (e.g., Cl�). Theequilibrium constant (K) for the acid–base neutralisationequilibrium (1) results from the ratio of the two acidity con-stants (KBH+ /KHA), and the pKHA values for some organicand inorganic anions are known (e.g., pKHA for CH3COO�
is 12.3[8]). Therefore, having established that logK forCH3COO� is >6, the pKBH+ value for 1+ is calculated to be<6.3. In Figure 7, pKa(HA/A�) values for the anions investi-gated are tentatively positioned on the vertical scale on theright (CH3COO� and F� have been set at the same level,even though acetate is slightly more basic). On the verticalscale on the left, the pKa value of 1+ is indicated. The twovertical lines are juxtaposed in such a way that the pKa of1+ lies somewhere between the pKHA of H2PO4
� and thepKHA of Cl� . For anions whose pKHA values are higher thanthe pKBH+ of 1+ , the equilibrium constant for the acid–baseneutralisation equilibrium (1) is distinctly higher than 1 andproton transfer occurs. On the other hand, for anions whosepKa values are lower than the pKa of 1+ , the neutralisationequilibrium is not favoured and the hydrogen-bond interac-tion is not followed by definitive proton transfer. Therefore,the occurrence of a Brønsted acid–base equilibrium or theestablishment of a hydrogen-bond interaction in a givenmedium depends simply on the acidity of the receptorOs-NH group with respect to the basicity of the anion. Anionswhose pKHA value is lower than the pKa of the -NH acid(i.e., below the solid horizontal line in Figure 7) will estab-lish a true hydrogen-bond interaction, whereas anions withhigher pKa values (above the dashed line) will induce defini-tive -NH deprotonation and the formation of HA.
We tested the reliability of this approach by considering afurther -NH-containing receptor 2+ . This possesses a pyr-role-type -NH fragment, whose intrinsic acidity is lowerthan that of sulfonamide, and should be enhanced by thepresence of a proximate pyridinium group. In this receptor,the -NH fragment is separated from the >N� group by twobenzene carbon atoms, as in 1+ .Figure 8 displays the family of spectra obtained when a
solution of 2-PF6 in DMSO (8.4I10�4m) was titrated with a
Figure 7. Matching of the acidity scale for the receptor [BH]+ and the ba-sicity scale for A� (pKa values for anions are tentative; CH3COO� andF� have been arbitrarily assigned the same pKa value). Receptor 1+
transfers a proton to anions that lie above the solid horizontal line andestablishes a true hydrogen-bond interaction with the anions that liebelow the line. Receptor 2+ transfers a proton to anions that lie abovethe dashed horizontal line and establishes a true hydrogen-bond interac-tion with the H2PO4
� ion, which remains below the dashed horizontalline. Cl� and anions that lie below this line exhibit a basicity that is toolow and a hydrogen-bond-acceptor tendency that is too poor to enablethem to interact with 2+ .
Figure 8. Spectrophotometric titration of a solution of 2+ in DMSO (8.4I10�4m) with a standard solution of tetrabutylammonium acetate inDMSO. Inset: molar absorbance at 454 nm versus the number of equiva-lents of acetate (n) for a 1I10�4m solution of 2+ .
D 2005 Wiley-VCH Verlag GmbH&Co. KGaA, Weinheim www.chemeurj.org Chem. Eur. J. 2005, 11, 120 – 127124
L. Fabbrizzi et al.
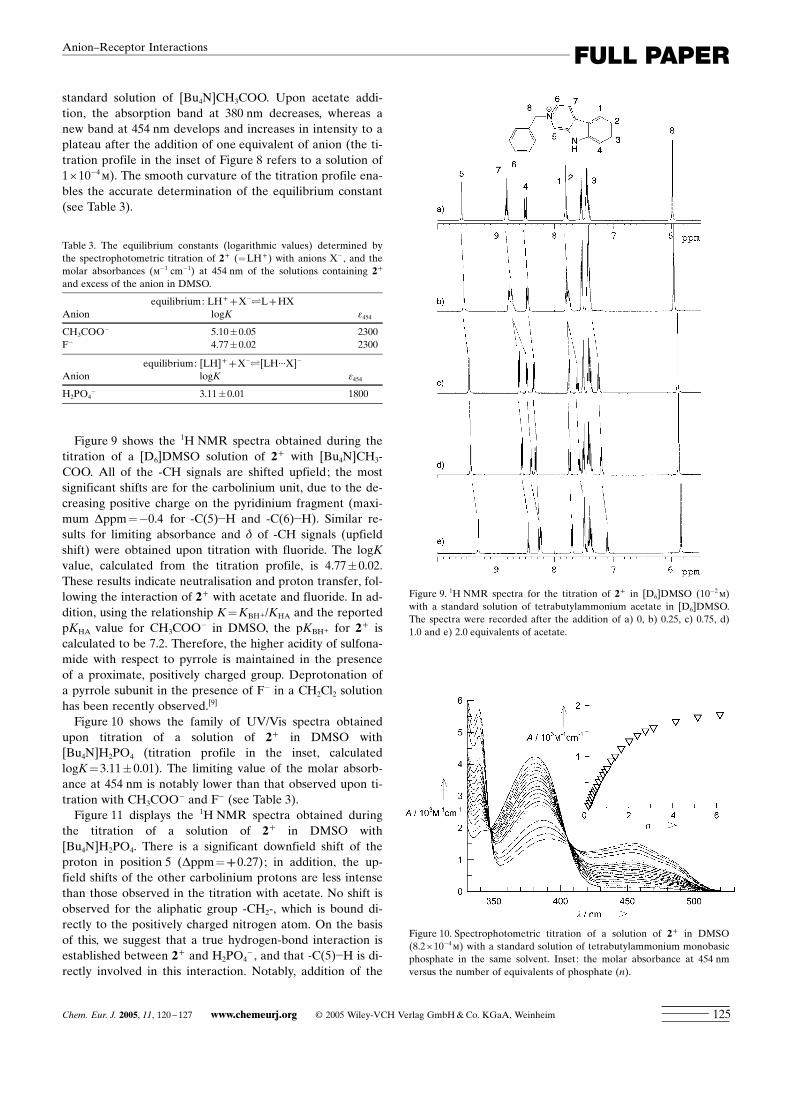
standard solution of [Bu4N]CH3COO. Upon acetate addi-tion, the absorption band at 380 nm decreases, whereas anew band at 454 nm develops and increases in intensity to aplateau after the addition of one equivalent of anion (the ti-tration profile in the inset of Figure 8 refers to a solution of1I10�4m). The smooth curvature of the titration profile ena-bles the accurate determination of the equilibrium constant(see Table 3).
Figure 9 shows the 1H NMR spectra obtained during thetitration of a [D6]DMSO solution of 2+ with [Bu4N]CH3-COO. All of the -CH signals are shifted upfield; the mostsignificant shifts are for the carbolinium unit, due to the de-creasing positive charge on the pyridinium fragment (maxi-mum Dppm=�0.4 for -C(5)�H and -C(6)�H). Similar re-sults for limiting absorbance and d of -CH signals (upfieldshift) were obtained upon titration with fluoride. The logKvalue, calculated from the titration profile, is 4.77�0.02.These results indicate neutralisation and proton transfer, fol-lowing the interaction of 2+ with acetate and fluoride. In ad-dition, using the relationship K=KBH+/KHA and the reportedpKHA value for CH3COO� in DMSO, the pKBH+ for 2+ iscalculated to be 7.2. Therefore, the higher acidity of sulfona-mide with respect to pyrrole is maintained in the presenceof a proximate, positively charged group. Deprotonation ofa pyrrole subunit in the presence of F� in a CH2Cl2 solutionhas been recently observed.[9]
Figure 10 shows the family of UV/Vis spectra obtainedupon titration of a solution of 2+ in DMSO with[Bu4N]H2PO4 (titration profile in the inset, calculatedlogK=3.11�0.01). The limiting value of the molar absorb-ance at 454 nm is notably lower than that observed upon ti-tration with CH3COO� and F� (see Table 3).Figure 11 displays the 1H NMR spectra obtained during
the titration of a solution of 2+ in DMSO with[Bu4N]H2PO4. There is a significant downfield shift of theproton in position 5 (Dppm=++0.27); in addition, the up-field shifts of the other carbolinium protons are less intensethan those observed in the titration with acetate. No shift isobserved for the aliphatic group -CH2-, which is bound di-rectly to the positively charged nitrogen atom. On the basisof this, we suggest that a true hydrogen-bond interaction isestablished between 2+ and H2PO4
� , and that -C(5)�H is di-rectly involved in this interaction. Notably, addition of the
Table 3. The equilibrium constants (logarithmic values) determined bythe spectrophotometric titration of 2+ (=LH+) with anions X� , and themolar absorbances (m�1 cm�1) at 454 nm of the solutions containing 2+
and excess of the anion in DMSO.
equilibrium: LH+ +X�ÐL+HXAnion logK e454
CH3COO� 5.10�0.05 2300F� 4.77�0.02 2300
equilibrium: [LH]+ +X�Ð[LH···X]�
Anion logK e454
H2PO4� 3.11�0.01 1800
Figure 9. 1H NMR spectra for the titration of 2+ in [D6]DMSO (10�2m)with a standard solution of tetrabutylammonium acetate in [D6]DMSO.The spectra were recorded after the addition of a) 0, b) 0.25, c) 0.75, d)1.0 and e) 2.0 equivalents of acetate.
Figure 10. Spectrophotometric titration of a solution of 2+ in DMSO(8.2I10�4m) with a standard solution of tetrabutylammonium monobasicphosphate in the same solvent. Inset: the molar absorbance at 454 nmversus the number of equivalents of phosphate (n).
Chem. Eur. J. 2005, 11, 120 – 127 www.chemeurj.org D 2005 Wiley-VCH Verlag GmbH&Co. KGaA, Weinheim 125
FULL PAPERAnion–Receptor Interactions

butylammonium salts of other anions (NO3� and halides)
caused no significant modification of the UV/Vis and1H NMR spectra, indicating a lack of interaction. Therefore,the less acidic receptor 2+ can still transfer a proton to themoderately strong bases CH3COO� and F� , establish hydro-gen-bond interactions with H2PO4
� , and does not interact atall with the weakly basic anions Cl� , Br� and NO3
� . Thisscenario is represented in Figure 7. The pKBH+ of 2+ mustnow be positioned between the pKHA values of CH3COO� ,F� and H2PO4
� , thus distinguishing between acid–base neu-tralisation (above the dashed horizontal line) and hydrogen-bond formation (below). Cl� and other anions exhibit a ba-sicity that is too low and a hydrogen-bond-acceptor tenden-cy that is too poor to enable them to interact with 2+ .
Conclusion
Figure 7 is generally applicable for the solvent used in thisstudy (DMSO); however, a qualitatively similar diagram
would be expected for an analogous solvent, for example,MeCN. Although most of the significant anions are repre-sented on the right-hand vertical line, a number of -NH re-ceptors of varying acidity have yet to be placed and correct-ly juxtaposed on the left-hand vertical line. This diagramshould be helpful in the design of anion receptors. For ex-ample, to increase the hydrogen-bond-donor tendency ofthe receptor, particularly acidic -NH groups could bechosen, or acidity could be enhanced by using electron-with-drawing substituents (e.g., -NO2, -CF3, -CN). However, highreceptor acidity may induce neat proton transfer, which isbeyond the realm of supramolecular chemistry and withinthe domain of classical Brønsted acid–base reactions. Ideal-ly, the pKa of the -NH-containing receptor should be coinci-dent with (or slightly more positive than) the pKHA of theA� anion, corresponding to the premise that the strongesthydrogen-bond interactions are established between ananion A� and its conjugate acid HA (which indeed refer tothe same pKa value).
[10]
Experimental Section
4-Methyl-N-pyridin-3-yl-benzensulfonamide : A solution containing 3-aminopyridine (1.5 g, 15.9 mmol) in pyridine (70 mL) and 4-methylben-zenesulfonyl chloride (3.8 g, 19.9 mmol) was refluxed for 2 h, then the re-action mixture was poured onto iced water (150 mL). The white precipi-tate was collected by filtration under vacuum and washed with purewater (yield 3.35 g; 85%). The product purity was controlled by perform-ing TLC (SiO2, 100% AcOEt: Rf=0.5). C12H12N2SO2 (248 gmol�1).1H NMR (400 MHz, [D6]DMSO): d=10.50 (s, 1H; NH), 8.28 (d, 1H;CH py), 8.25 (d, 1H; CH py), 7.63 (d, 2H; CH bz), 7.50 (dd, 1H; CHpy), 7.36 (d, 2H; CH bz), 7.28 (dd, 1H; CH py), 2.4 ppm (s, 3H; CH3).
1-Benzyl-3-(toluene-4-sulfonylamino)pyridinium hexafluorophosphate (1-PF6): An amount of 4-methyl-N-pyridin-3-yl-benzensulfonamide (0.4 g,1.6 mmol) was dissolved in CHCl3 (70 mL). An excess of benzyl bromide(0.41 g, 2.4 mmol) was added and the resulting solution was refluxed for24 h. The solvent was then removed by using a rotary evaporator to givean oily residue, which was dissolved in hot water and treated with a satu-rated aqueous solution of NH4PF6. The white precipitate of 1-PF6 was re-covered by filtration under vacuum (yield 0.45 g; 83%). C19H17N2SO2PF6
(484 gmol�1). 1H NMR (400 MHz, [D6]DMSO): d=11.65 (s, 1H; NH),8.86 (d, 1H; CH(7)), 8.68 (s, 1H; CH(4)), 8.11 (d, 1H; CH(5)), 8.01 (dd,1H; CH(6)), 7.65 (d, 2H; CH(2)), 7.46 (m, 5H; bz), 7.34 (d, 2H; CH(1)),(d, 2H; CH(2)), 5.84 (s, 2H; CH2(8)), 2.4 ppm (s, 3H; CH3).
2-Benzyl-9H-b-carbolin-2-ium (2-PF6): An amount of b-carboline (0.11 g,0.65 mmol) was dissolved in CHCl3 (70 mL). An excess of benzyl bro-mide (0.16 g, 0.98 mmol) was added and the resulting solution was re-fluxed for 24 h. The solvent was then removed by using a rotary evapora-tor to give a yellow solid residue, which was dissolved in hot water andtreated with a saturated, aqueous solution of NH4PF6. The white precipi-tate of 1-PF6 was recovered by filtration under vacuum (yield 0.21 g;80%). C18H15N2PF6 (404 gmol�1). 1H NMR (400 MHz, CD3CN): d=9.1(s, 1H; CH(5)), 8.55 (d, 1H; CH(7)), 8.45 (s, 1H; CH(6)), 8.40 (d, 1H;CH(4)), 7.80 (dd, 2H; CH(1)-CH(2)), 7.50 (m, 6H; CH(3), bz), 5.85 ppm(s, 2H; CH2(8)).
General procedures and materials : All reagents for syntheses were pur-chased from Aldrich/Fluka and used without further purification. UV/Visspectra were recorded on a Varian CARY 100 spectrophotometer with aquartz cuvette (path length: 1 cm). NMR spectra were recorded on aBruker Avance 400 spectrometer, operating at 9.37 T. Spectrophotomet-ric titrations were performed at 25 8C on 10�4 and 10�5m solutions of 1-PF6 and 2-PF6 in DMSO (polarographic grade). Aliquots of a fresh
Figure 11. 1H NMR spectra for the titration of 2+ in [D6]DMSO (10�2m)with a standard solution of tetrabutylammonium monobasic phosphate in[D6]DMSO. The spectra were recorded after the addition of a) 0, b) 0.25,c) 0.75, d) 1.0 and e) 2.0 equivalents of phosphate.
D 2005 Wiley-VCH Verlag GmbH&Co. KGaA, Weinheim www.chemeurj.org Chem. Eur. J. 2005, 11, 120 – 127126
L. Fabbrizzi et al.
Bu4NX standard solution were added and the UV/Vis spectra of the sam-ples were recorded. Spectrophotometric titration curves were fitted byusing the HYPERQUAD program.[11] 1H NMR titrations were carriedout in [D6]DMSO at moderately high concentrations of 1-PF6 and 2-PF6
(10�2m).
X-ray crystallographic studies : Diffraction data were collected at ambienttemperature by using an Enraf–Nonius CAD4 four-circle diffractometer,working with graphite-monochromatised MoKa radiation (l=0.71073 L).Crystal data for the 1-PF6 complex and for the 1+ zwitterion are reportedin Table 4. Data reductions (including intensity integration, background,
Lorentz and polarisation corrections) were performed with the WinGXpackage.[12] Absorption effects were evaluated with the psi-scanmethod,[13] and absorption correction was applied to the data (min./max.transmission factors were 0.865/0.938 for 1-PF6 and 0.931/0.970 for 1).
Crystal structures were solved by direct methods (SIR 97),[14] and refinedby full-matrix least-square procedures on F2 using all reflections
(SHELXL 97).[15] Anisotropic displacement parameters were refined forall non-hydrogen atoms. Hydrogens bonded to carbon atoms were placedat calculated positions with the appropriate AFIX instructions and re-fined by using a riding model; hydrogens bonded to the N(1) atom of 1-PF6 were located in the DF map and refined, constraining the N�H dis-tance to be 0.89�0.02 L.
CCDC-237092 and CCDC-237093 contain the supplementary crystallo-graphic data for this paper. These data can be obtained free of charge viawww.ccdc.cam.ac.uk/conts/retrieving.html (or from the Cambridge Crys-tallographic Data Centre, 12 Union Road, Cambridge CB21EZ, UK; fax:(+44)1223-336-033; or [email protected]).
Acknowledgement
We thank Dr. Laura Linati (Centro Grandi Strumenti, Universit= diPavia) for the NMR characterisation of the samples and Dr. Enrico Mon-zani (Dipartimento di Chimica Generale, Universit= di Pavia) for assis-tance with the NMR titrations and helpful discussions. The financial sup-port of the European Union (RTN Contract HPRN-CT-2000–00029) andof the Italian Ministry of University and Research (PRIN, Dispositivi Su-pramolecolari; FIRB, Project RBNE019H9K) is gratefully acknowl-edged.
[1] P. A. Gale, Coord. Chem. Rev. 2003, 240, 1.[2] C. Suksai, T. Tuntulani, Chem. Soc. Rev. 2003, 32, 192.[3] R. Martinez-MaÇez, F. SancenTn, Chem. Rev. 2003, 103, 4419.[4] R. J. Fitzmaurice, G. M. Kyne, D. Douheret, J. D. Kilburn, J. Chem.
Soc. Perkin Trans. 1 2002, 841.[5] K. Choi and A. D. Hamilton, Coord. Chem. Rev. 2003, 240, 101.[6] C. S. Wilcox in Frontiers in Supramolecular Chemistry and Photo-
chemistry, Wiley-VCH, Weinheim, 1991, pp. 123–143.[7] N. Dennis, A. R. Katritzky, H. Wilde, E. Gavuzzo, A. Vaciago, J.
Chem. Soc. Perkin Trans. 2 1977, 1304.[8] F. Bordwell, Acc. Chem. Res. 1988, 21, 456.[9] S. Camiolo, P. A. Gale, M. B. Hursthouse, M. E. Light, A. I. Shi,
Chem. Commun. 2002, 758.[10] T. Steiner, Angew. Chem. 2002, 114, 50; Angew. Chem. Int. Ed. 2002,
41, 48.[11] P. Gans, A. Sabatini, A. Vacca, Talanta 1996, 43, 1739.[12] L. J. Farrugia, J. Appl. Crystallogr. 1999, 32, 837.[13] A. C. T. North, D. C. Phillips, F. S. Mathews, Acta. Crystallogr. Sect.
A 1968, 24, 351.[14] A. Altomare, M. C. Burla, M. Camalli, G. L. Cascarano, C. Giaco-
vazzo, A. Guagliardi, A. G. G. Moliterni, G. Polidori, R. Spagna, J.Appl. Crystallogr. 1999, 32, 115.
[15] G. M. Sheldrick, SHELX97 Programs for Crystal Structure Analysis,University of Gçttingen, Germany, 1997.
Received: June 10, 2004Published online: November 10, 2004
Table 4. Crystallographic data for 1-PF6 and zwitterion 1.
1-PF6 zwitterion 1
formula C19H19F6N2O2PS C19H18N2O2SM 484.40 338.42colour colourless pale yellowdimension [mm] 0.80I0.43I0.21 0.80I0.28I0.11crystal system triclinic orthorhombicspace group P1̄ (no. 2) P21 (no. 4)a [L] 6.1779 (8) 10.3645(16)b [L] 12.8573(17) 8.5655(12)c [L] 13.3607(18) 10.7356(14)a [8] 83.866(12) –b [8] 87.840(16) 115.083(12)g [8] 82.756(22) –V [L3] 1046.5(2) 863.2(2)Z 2 21calcd [gcm
�3] 1.537 1.302mMoKa [mm�1] 0.303 0.201scan type w-2q scans w-2q scansq range [8] 2–26 2–26measured reflections 5213 2181unique reflections 4104 2084Rint
[a] 0.0116 0.0213strong data [Io>2s(Io)] 2673 1685R1, wR2 (strong data)[b] 0.0492, 0.1136 0.0393, 0.0849R1, wR2 (all data)[b] 0.0879, 0.1323 0.0594, 0.0941GoF[c] 1.040 1.029refined parameters 320 217max./min. residuals [eL�3] 0.22/�0.17 0.22/�0.17
[a] Rint=S jF2o�F2
o(mean) j /SF2o. [b] R1=S j jFo j� jFc j j /S jFo j , wR2=
{S[w(F2o�F2
c)2]/S[w(F2
o)2]}1/2, in which w=1/[s2F2
o+ (aP)2+bP] and P=[max(F2
o,0)+2F2c]/3. [c] GoF= {S[w(F2
o�F2c)
2]/(n�p)}1/2, in which n is thenumber of reflections and p is the total number of refined parameters.
Chem. Eur. J. 2005, 11, 120 – 127 www.chemeurj.org D 2005 Wiley-VCH Verlag GmbH&Co. KGaA, Weinheim 127
FULL PAPERAnion–Receptor Interactions