Embed Size (px)
Citation preview

1
Anisotropic Near Zero Thermal Expansion in REAgxGa4-x
(RE = La-Nd, Sm, Eu & Yb) Induced by Structural
Reorganization
Vidyanshu Mishra, Udumula Subbarao, Soumyabrata Roy, Saurav Ch. Sarma,
Dundappa Mumbaraddi, Shreya Sarkar, Sebastian C. Peter*
New Chemistry Unit, Jawaharlal Nehru Centre for Advanced Scientific Research, Bengaluru,
India, 560064.
Abstract
In this work, we have discovered the anisotropic near Zero Thermal Expansion (NZTE)_
behavior in a family of compounds REAgxGa4-x (RE = La-Nd, Sm, Eu and Yb). The compouds
adopts CeAl2Ga2 structure type. were obtained as single crystals in high yield by metal flux
growth technique using gallium as active flux. Synthesized compounds with space group
I4/mmm. Temperature dependent single crystal X-ray diffraction suggests that all the compounds
exhibit zero thermal expansion along c direction in the temperature range of 100-450 K.
Temperature dependent X-Ray absorption near edge spectroscopic study confirmed ZTE
behavior is due to the geometrical features associated within the crystal structure. The
anisotropic NZTE behavior was further established by anisotropic magnetic measurements on
selected single crystals. The atomic displacement parameters, apparent bond lengths, bond
angles, and structural distortion with respect to the temperature reveal that geometric features
associated with the structural distortion cause the anisotropic NZTE along c-direction. The
preliminary magnetic studies suggest all the compounds are paramagnetic at room temperature
except LaAgGa3. Electrical resistivity study reveals that compounds from this series are metallic
in nature.
Keywords: Anisotropic Thermal Expansion; Intermetallics; Crystal growth; Crystal Structure;
XANES, Magnetism; Resistivity.
*Corresponding author. Phone: 080-22082998, Fax: 080-22082627
Email - [email protected] (S. C. Peter)

2
1 Introduction
Thermal expansion (TE) property and differences in thermal expansion coefficients of
materials are important in many technological applications ranging from electronic devices to
space research. It is a common observation that most of the materials expand upon an increase in
temperature, which is known as positive thermal expansion (PTE). The materials with
temperature dependent zero thermal expansion (ZTE) or negative thermal expansion (NTE) are
scarce and mostly occurs over a relatively narrow temperature window. PTE can be explained
well on the basis of population of the higher energy vibrational levels which causes the bond
expansion due to asymmetric nature of a typical interatomic potential.as are populated.1
However, many devices that are expected to operate under extreme conditions, for example, low
or very high temperature, need to be engineered without any volume expansion and degradation.
The materials with NTE or ZTE are highly desirable for both exactitude engineering of various
components for nanodevices and of complex bulk systems. The materials demonstrating regular
PTE can be tuned with NTE materials to fabricate composites in order to attain an overall ZTE.
The ZTE feature hinders materials undergoing thermal shock on hasty cooling or heating.
Usually, the NTE feature in materials is crystallographic direction specific. Most of these
materials contain elemental silicon and germanium,2 Titania–silica glasses,3 carbon fibers,
Kevlar and Invar alloys,4 ZrW2O8 oxides,5 certain molecular networks.6 The materials
Ag3[Co(CN)6]7, Sm3C60,
8 BiNiO3,9 MnF2,
10 CuO,10 Mn3Cu1-xGexN11 are also well-known
compounds exhibiting NTE.
The materials with anisotropic mechanical, magnetic, optical and elastic properties are
well exploited, but the materials with intrinsic anisotropic thermal properties are very rare. Rare

3
earth based intermetallics are noteworthy in this direction- YbGaGe,2 Yb4TGe8 (T = Cr, Ni, and
Ag),12 Yb8Ge3Sb513 are a few examples reported with anisotropic TE and non-cubic systems with
intrinsic anisotropic thermal properties (PTE, ZTE or NTE) need to be discovered. The measure
of expansion in a material is given by its coefficient of thermal expansion (CTE). Generally, the
compounds having volume CTE in the range of αv ≈ 10-5 K-1 and linear CTE αl < |2| × 10-6 K-1
are considered to show very low thermal expansion.14,15 There are several aspects which give rise
zero and or negative thermal expansion such as structural flexibility in the compounds like
LiAlSiO4,16,17 α and β-ZrW2O8,
5 magnetovolume effect in the compounds like Fe-Ni and Ni-Cu
alloys,18 Tm2Fe16Cr,19 Dy2Fe17-xMnx20 and phase transition in compounds like ZrV2O7.
21 Herein,
we report the αv ≈ 4.6 – 6.7×10⁻⁵ K-1 and αl ≈ -1.3 to 6.6 × 10⁻⁶ K-1 for REAgxGa4-x (RE = Ce,
Nd, Yb, and Eu) systems in the range of 100 to 500 K which originates due to structural
flexibility.
We have chosen the compounds with general formula RETX3 (RE = Rare earth and T=
transition metals and X = Al, Si, Ga, Ge, Sb) to study TE behavior. These compounds show
interesting physical phenomena due to their adaptation associated with different structure
types.22-34 These structural variations in these types are due to the various parameters including
valence fluctuations or other electronic transition and or unique geometrical features associated
with the structure. These observations motivated us to investigate the temperature dependent
thermal properties of these compounds, especially on REAgxGa4-x compounds. The crystal
structure of these compounds was proposed as tetragonal (SG: I4/mmm) earlier by Grin et al35
using powder XRD data. However, our single crystal XRD data suggest that they showed
unusual thermal parameters in different crystallographic directions. The temperature dependent
single crystal XRD on these compounds showed ZTE along c direction and PTE along ab plane

4
due to the unique geometrical arrangement of atoms in crystal structure in the certain
temperature range. A detailed temperature dependent single crystal XRD, anisotropic magnetic
studies on single crystals and XANES studies confirm that the geometrical adjustments in the
crystal structure along ab plane and c-direction cause the ZTE.
2 Experimental Section
2.1 Reagents
The RE metals (La-Nd, Sm, Eu, Yb, pieces, 99.99%, Alfa Aesar), Ag (shots, 99.99%,
Sigma Aldrich) and Ga (pieces, 99.99%, Alfa Aesar) were used as purchased without any further
purification. The metals were stored and cut in small pieces inside the glove box.
2.2 Synthesis
2.2.1 Single Crystal Growth
Single Crystals were grown (Figure S1) through the metal flux growth technique using
gallium as active flux. Plate-shaped single crystals of REAgxGa4-x were obtained by combining
RE metal (0.3 g), Ga pieces (2 g), and Ag shots (0.4 g) in a niobium ampoule. The ampoule was
inserted in a 13-mm fused silica tube and was flame-sealed under a vacuum of 10−5 Torr to avoid
any oxidation during heating. The reactants were heated to 1273 K over 10 h to the form melt
and then soaked for 2 hrs. Next, the melt was cooled down to 1073 K in 2 h. To get the desired
phase formed, the reaction was maintained at this temperature for 48 h. Finally, to grow the
crystals, the reaction was allowed to cool gradually to 300 K over 48 h. Since Ga was used as a
flux, the product was heated at 673 K and subsequently centrifuged at this temperature through a
coarse frit to isolate excess Ga from the product. No reactions between the niobium ampoule and
starting materials or product were detected. Residual gallium was removed by immersing the
5
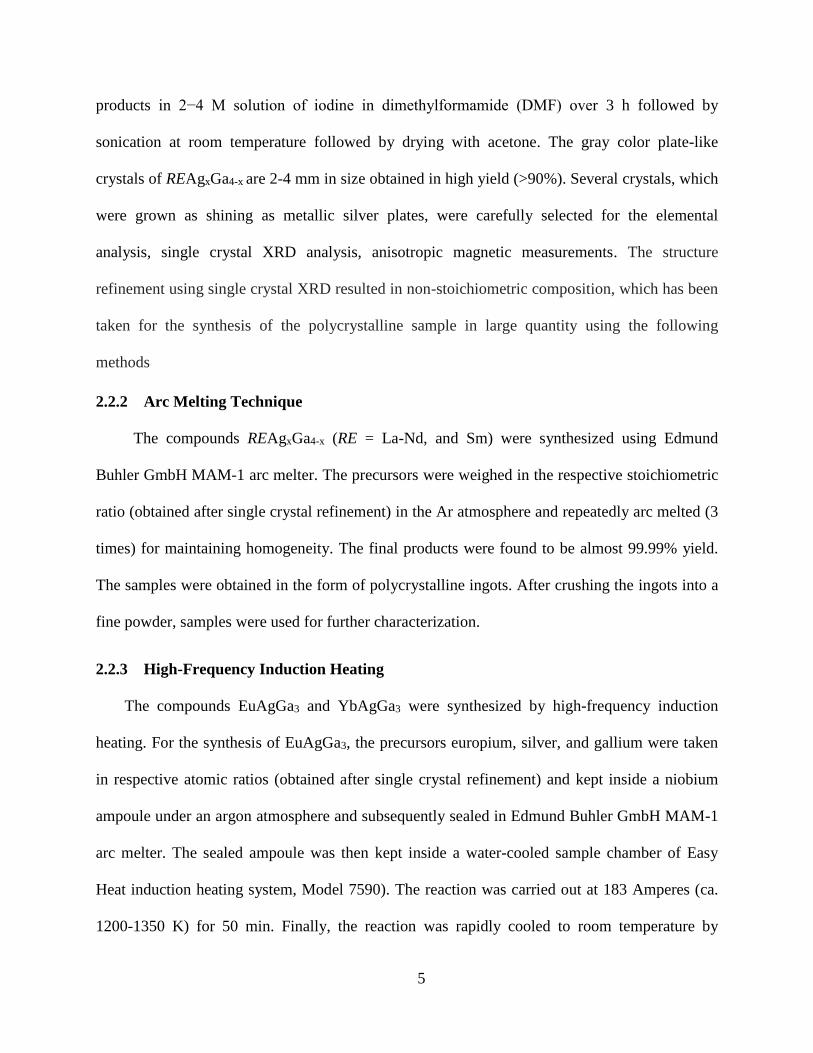
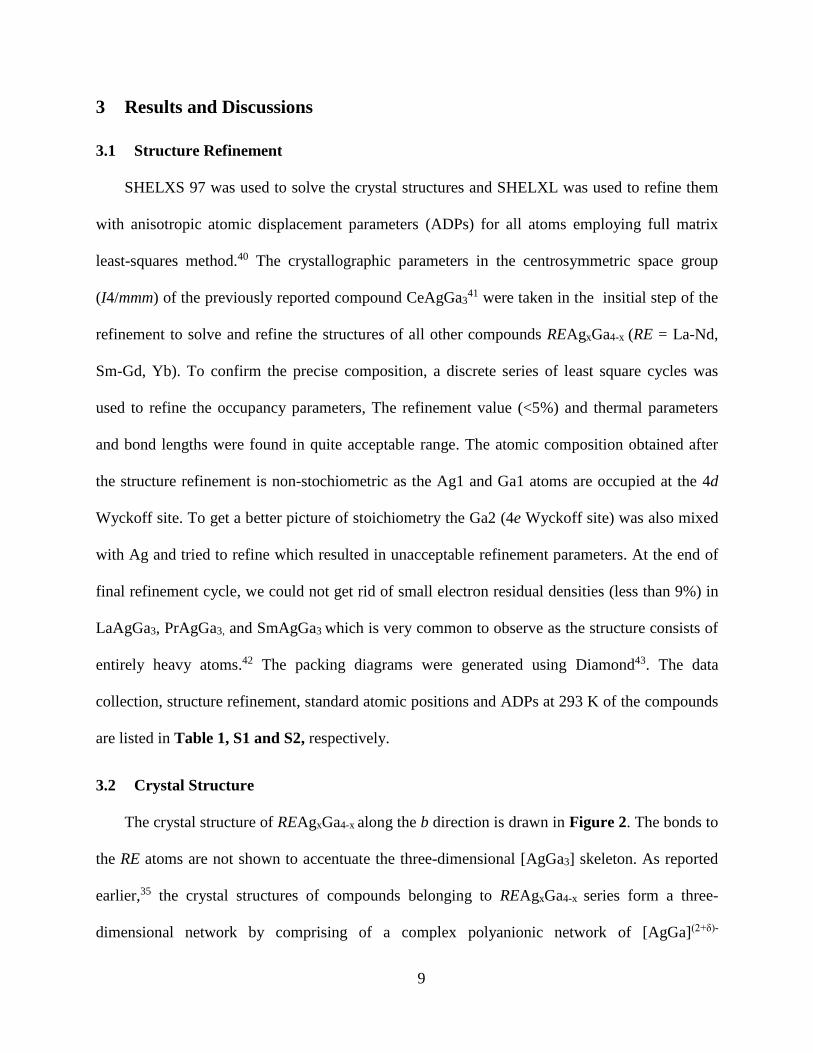
products in 2−4 M solution of iodine in dimethylformamide (DMF) over 3 h followed by
sonication at room temperature followed by drying with acetone. The gray color plate-like
crystals of REAgxGa4-x are 2-4 mm in size obtained in high yield (>90%). Several crystals, which
were grown as shining as metallic silver plates, were carefully selected for the elemental
analysis, single crystal XRD analysis, anisotropic magnetic measurements. The structure
refinement using single crystal XRD resulted in non-stoichiometric composition, which has been
taken for the synthesis of the polycrystalline sample in large quantity using the following
methods
2.2.2 Arc Melting Technique
The compounds REAgxGa4-x (RE = La-Nd, and Sm) were synthesized using Edmund
Buhler GmbH MAM-1 arc melter. The precursors were weighed in the respective stoichiometric
ratio (obtained after single crystal refinement) in the Ar atmosphere and repeatedly arc melted (3
times) for maintaining homogeneity. The final products were found to be almost 99.99% yield.
The samples were obtained in the form of polycrystalline ingots. After crushing the ingots into a
fine powder, samples were used for further characterization.
2.2.3 High-Frequency Induction Heating
The compounds EuAgGa3 and YbAgGa3 were synthesized by high-frequency induction
heating. For the synthesis of EuAgGa3, the precursors europium, silver, and gallium were taken
in respective atomic ratios (obtained after single crystal refinement) and kept inside a niobium
ampoule under an argon atmosphere and subsequently sealed in Edmund Buhler GmbH MAM-1
arc melter. The sealed ampoule was then kept inside a water-cooled sample chamber of Easy
Heat induction heating system, Model 7590). The reaction was carried out at 183 Amperes (ca.
1200-1350 K) for 50 min. Finally, the reaction was rapidly cooled to room temperature by

6
reducing the current to zero Ampere. The light gray colored polycrystalline product EuAgGa3
was obtained by cutting the niobium tube. No side products and reactions with the ampoule
could be detected. Several tests were run for confirming the stability of EuAgGa3 at two weeks
interval for three months and was found to be stable at standard conditions. No more than 1%
weight loss was observed in the product. For the synthesis of the YbAgGa3 compound, the metals
ytterbium, silver, and gallium were mixed in tantalum ampoule. The reaction was carried out
with the similar procedure for EuAgGa3, but applying 170 Ampere current. No side products
were detected. The compound YbAgGa3 was found to be stable for several months. The obtained
samples were used for crystal structure determination and physical property studies.
2.2.4 Elemental Analysis
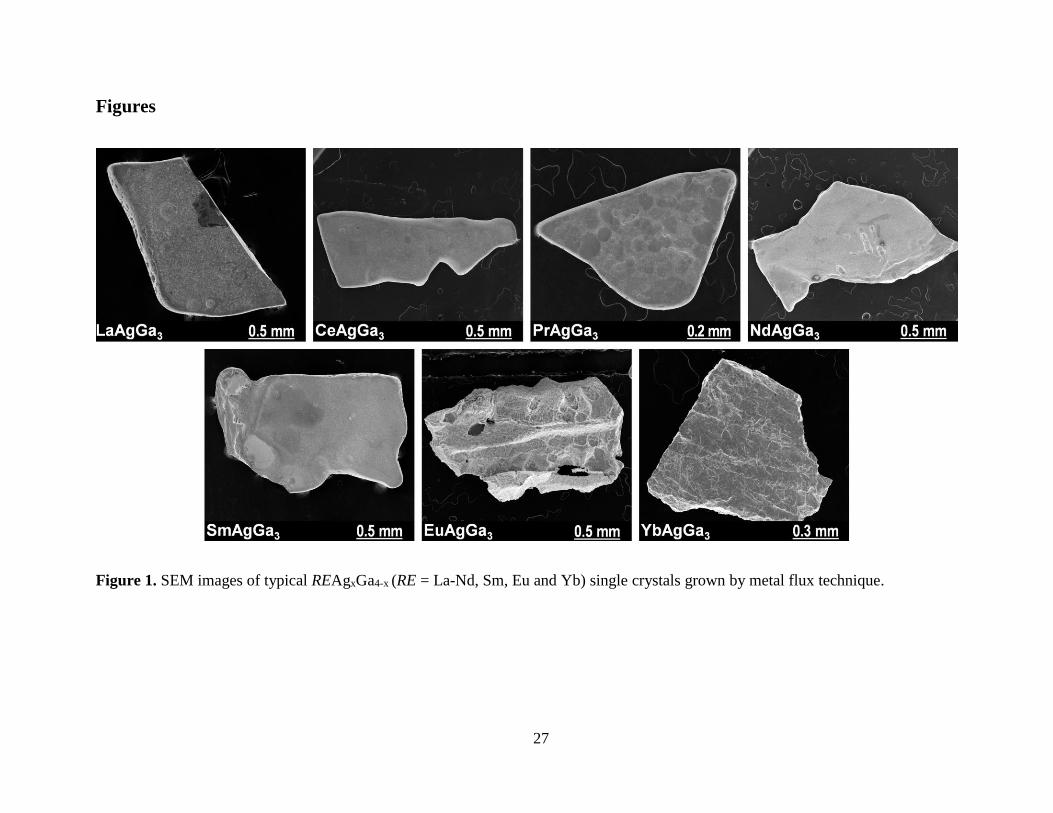
The visibly clean surfaces of single crystals obtained from the flux techniques were analyzed
by semi-quantitative microprobe analyses SEM equipped with Bruker 129 eV EDAX instrument
with an accelerating voltage of 20 kV in 90 sec accumulation time. The typical image of a plate-
like crystal of REAgxGa4-x (RE = La-Nd, Sm-Gd, and Yb) grown from the flux synthesis is
shown in Figure 1. The atomic composition of each crystal was found to be close to 1:1:3 by the
analysis, which is in good agreement with the single crystal XRD data (Figure S2).
2.2.5 Powder XRD
The phase identity and purity of the REAgxGa4-x (RE = La-Nd, Sm-Gd, and Yb) powder
samples were determined using the Bruker D8 Discover diffractometer, set at Cu-Kα radiation (λ
= 1.5406 Å) over the angular range of 20o ≤ 2θ ≤80o, with a step size of 0.02o at room
temperature (297 K) calibrated against corundum standard. The comparison between the
experimentally observed and the simulated pattern generated from the single crystal XRD
refinement (Figure S3.1) confirmed the phase purity. The lattice parameters were determined by

7
Pawley profile fitting for powder samples of CeAgGa3 and YbAgGa3 (Figure S3.2) using
TOPAS software.36
2.2.6 Single Crystal XRD
Single crystal XRD data of REAgxGa4-x (RE = La-Nd, Sm-Gd, Yb) were first collected at
room temperature on selected plate-shaped single crystals using a Bruker Smart–CCD
diffractometer equipped with a usual focus, 2.4 kW sealed tube X-ray source with graphite
monochromatized Mo-Kα radiation (λ = 0.7107 Å) operating at 50 kV and 30 mA, with the ω
scan mode. Temperature-dependent data were collected in the range of 100-500 K using a
Bruker D8 Venture diffractometer (Photon CMOS detector) equipped with a micro focus, 2.4
kW sealed tube X-ray source with graphite monochromatic Mo-Kα radiation (λ = 0.71073 Å)
operating at 50 kV and 30 mA, with ω scan mode. Commercially available super glue was used
to mount the very tiny plate shaped single crystals on a thin glass (~0.1 mm) fiber. A full sphere
having 60 frames was acquired up to 73.28˚ in 2θ. The individual frames were collected with
steps of 0.50˚ and an exposure time of 10 s per frame. SAINT37 and SADABS38 programs were
used to integrate the diffraction profiles and absorption correction respectively. The analyses of
systematic absences led us to decide that systems were crystallizing in centrosymmetric
tetragonal space group I4/mmm. Platon program in WinGx system, ver. 1.80.0539 was employed
to check the additional symmetry.
2.2.7 Magnetic Measurements
A Quantum Design MPMS-SQUID magnetometer was used to perform the magnetic
measurements. For the measurements, polycrystals obtained from arc melting and induction
heating were used after grinding followed by verification of phase identity and purity by powder
XRD) Under the applied magnetic field (H) of 1 KOe, the temperature dependent data were

8
collected for Field Cooled mode between 2 and 300 K. Magnetization data were also collected
for REAgxGa4-x at 2 K and 300 K with field sweeping from -70000 Oe to 70000 Oe (Figure S4).
The magnetic measurements were also performed anisotropically on single crystals of
REAgxGa4-x (RE = La-Nd, Sm-Gd, Yb) grown using metal flux technique. The measurement
parameters were the same as were for the polycrystalline samples.
2.2.8 Electrical Resistivity
The conventional AC four probe setup was used to perform the resistivity measurements in
the 1T field on REAgxGa4-x pellets. A strongly conducting silver epoxy paste was adhered to give
contacts on the pressed pellets with four very thin copper wires. Commercial QD-PPMS was
used to collect the data in the range of 3-300 K. Reproducible results were obtained for several
batches.
2.2.9 X-ray absorption near edge spectroscopy (XANES)
XANES experiments at various temperatures on REAgxGa4-x (RE = La, Ce, Nd, Eu, and Yb)
were performed at PETRA III, P65 beamline of DESY, Germany. Measurements at the Eu LIII-
edge and Yb LIII edge were performed in a transmission mode while measurements at the Ce LIII,
Nd LIII and La LIII edge were performed in fluorescence mode at ambient pressure using gas
ionization chambers to monitor the incident and transmitted X-ray intensities. A Si [111] double
crystal monochromator was used to obtain the monochromatic X-rays which was calibrated by
defining the inflection point (first derivative maxima) of Cu foil as 8980.5 eV, ionization
chambers filled with suitable gases were used to record the incident (I0) and transmitted (It)
photon intensities simultaneously at different edges and a PIPS detector was used for the
fluorescent signals. Pellets for the measurements were made by homogeneously mixing the
sample with an inert cellulose matrix to have an X-ray absorption edge jump close to one.
9
3 Results and Discussions
3.1 Structure Refinement
SHELXS 97 was used to solve the crystal structures and SHELXL was used to refine them
with anisotropic atomic displacement parameters (ADPs) for all atoms employing full matrix
least-squares method.40 The crystallographic parameters in the centrosymmetric space group
(I4/mmm) of the previously reported compound CeAgGa341 were taken in the insitial step of the
refinement to solve and refine the structures of all other compounds REAgxGa4-x (RE = La-Nd,
Sm-Gd, Yb). To confirm the precise composition, a discrete series of least square cycles was
used to refine the occupancy parameters, The refinement value (<5%) and thermal parameters
and bond lengths were found in quite acceptable range. The atomic composition obtained after
the structure refinement is non-stochiometric as the Ag1 and Ga1 atoms are occupied at the 4d
Wyckoff site. To get a better picture of stoichiometry the Ga2 (4e Wyckoff site) was also mixed
with Ag and tried to refine which resulted in unacceptable refinement parameters. At the end of
final refinement cycle, we could not get rid of small electron residual densities (less than 9%) in
LaAgGa3, PrAgGa3, and SmAgGa3 which is very common to observe as the structure consists of
entirely heavy atoms.42 The packing diagrams were generated using Diamond43. The data
collection, structure refinement, standard atomic positions and ADPs at 293 K of the compounds
are listed in Table 1, S1 and S2, respectively.
3.2 Crystal Structure
The crystal structure of REAgxGa4-x along the b direction is drawn in Figure 2. The bonds to
the RE atoms are not shown to accentuate the three-dimensional [AgGa3] skeleton. As reported
earlier,35 the crystal structures of compounds belonging to REAgxGa4-x series form a three-
dimensional network by comprising of a complex polyanionic network of [AgGa](2+δ)-

10
entrenched with REs. These networks are pooled through the edges of Ag and Ga atoms along
the ac plane..
The coordination environments of the constituent atoms in the crystal system are shown in
Figure 3a-c. The RE atoms are surrounded in 8-equatorial capped hexagonal prism environment
having coordination number 22 (Ce4M8Ga10), Ga2 atoms are coordinately surrounded in
tricapped trigonal prism manner (M4GaCe4) with coordination number 9), while mixed atoms (M
= Ag+Ga) are in cuboctahedron environment (M4Ga4Ce4). Within the first coordination sphere,
the average bond distance between RE and Ga atoms was calculated to be 3.26 Å. The smallest
individual bond distances between RE and Ga were found to be 3.3281(14) Å, 3.2876(8) Å,
3.2675(15) Å, 3.2488(3) Å, 3.2168(6) Å, and 3.2382(10) Å for RE = La, Ce, Pr, Nd, Sm, and Yb,
respectively, near to the calculated ones considering REs trivalent atomic radii. The Eu-Ga
(3.329 Å) bond distance was found to be larger than the Sm-Ga pair (3.217 Å) that gives an
indication towards the oxidation state of Eu ion as divalent which was confirmed by magnetic
measurements and XANES study, later. The average bond distance of RE-Ga2 and RE-Ga1 for
all compounds is in the range 3.457-3.260 Å (Ga2 is unmixed, and Ga1 is mixed position). Table
2 lists the specific bond distances [Å] in the compounds of this series at room temperature with
estimated standard deviations.
The unit cell parameters a, c, c/a, Δa/a, Δc/c and volume of the REAgxGa4-x compounds
have been compared in Figure 4 (a–f). The volume of the unit cells was found to be decreasing
with the decrease in covalent radii of the REs. This can be accounted to the well-known
lanthanide contraction. EuAgGa3 was found to be an exception with an increase in the unit cell
volume, which could be due to the divalent nature of Eu. However, interestingly NdAgGa3 also

11
deviates from the linearity. Such structural instability was also noticed in the case of NdCuGa3
and PrCuGa3.44
Assuming the structural instability based on our previous reports on REAgxGa4-x
compounds,35,44 temperature dependent single crystal XRD data at various temperatures (100,
200, 300, 400, 450 and 500 K) have been collected and refined the crystal structure at each
temperature (Table S4 to S11). Since Ce, Eu, and Yb usually exhibit different oxidation states,
unusual temperature-dependent lattice parameters may be attributed to the dependence of their
oxidation state. However, it is observed that other compounds also showed similar behavior and
may be attributed to the dependence on RE atom size, which may be due to the charge transfer
between RE and Ag or Ga at different temperatures. Close inspection of the data for all the
compounds revealed that there is a slight increase in cell volume (Figure 4c) and lattice
parameter a and b (Figure 4a) with temperature as anticipated by lattice thermal expansion.
However, temperature dependent expansion along c direction (Figure 4b) is negligible which
results in a decrease in the c/a ratio with an increase in temperature suggesting a strong
anisotropy existing in the systems (Figure 4f).
The variation in c parameter for all compounds within the temperature range 100-450 K has
been compared and found almost negligible (Figure 4b) suggesting zero thermal expansion2
behavior along c direction. The driving force for this behavior could be due to one of the reasons
-
1. Valence fluctuation as expected in the case of Ce, Eu, and Yb-based compounds2
2. Charge transfer between RE and Ag and/or Ga12
3. Unique geometric features exhibit in the crystal structure of the compound12

12
To understand the anisotropic thermal expansion behavior due to valence fluctuation or
partial charge transfer between RE and Ag and or Ga atoms, the magnetic measurements were
performed anisotropically along the c axis and ab plane on the single crystals of CeAgGa3,
PrAgGa3, NdAgGa3, and EuAgGa3. Among all the compounds, CeAgGa3, EuAgGa3, and
YbAgGa3 are expected to show variable valences - Ce3+/4+, Eu2+/3+, and Yb2+/3+.45 On the other
hand, RE in remaining compounds expected to exist in the most stable trivalent state. Magnetic
measurement is a signature experiment to understand the valence fluctuation with temperature
dependent non-liner inverse susceptibility curve. Very interestingly, the inverse susceptibility
data of all the samples (Figure 5) show a non-linear curve along the c-direction and linear trend
in ab plane, which confirms the anisotropic behavior. The magnetic moment calculated using the
formula 2.828×√(χm×T) (where χm is a magnetic moment, and T is respective temperature) is
tabulated in Table 5 (Figure 6) with fitting parameters given in Table S14. Relatively large
magnetic moment observed along c direction for all compounds compared to ab plane suggesting
the heavy RE atoms are orientated along the c direction causing hindrance in thermal expansion
along c direction, which is either due to valence fluctuation or geometrical features associated
with the crystal structure. The difference in the magnetic behavior between anisotropic
measurements hints towards a slight valence fluctuation playing a role in ZTE along c direction.
Since there is no abrupt change in the magnetic moments, the probability of ZTE due to valence
fluctuation can be ruled out.
To gain more insight on the valence fluctuation, temperature dependent XANES experiment
was carried out on REAgxGa4-x involving RE = Ce, Nd and La at a temperature of 10 K, 100 K,
200 K and 300 K. These compounds were chosen for this study because Ce is expected to have
stable 3+ and 4+ oxidation state, whereas La and Nd has a single stable trivalent oxidation state.

13
The diamagnetic nature of La and magnetic nature of Nd were utilized for the controlled studies.
XANES is a powerful tool to confirm the various elements’ valence state in a compound. The
amounts of both electronic configurations were estimated relatively by fitting the curves
following the previously reported literature.46 A peak at 5727 eV in Figure 7d corresponds to
Ce3+ oxidation state. Similarly, a peak at 6215 eV and 5490 eV corresponds to La3+ and Nd3+in
Figure 7a and 7g, respectively. Since there are no profound shifts in the energy of the
absorption edge at different temperatures, the ZTE due to valence fluctuation can be ruled out.
The temperature dependent XANES measurements support the magnetic measurements as
discussed earlier.
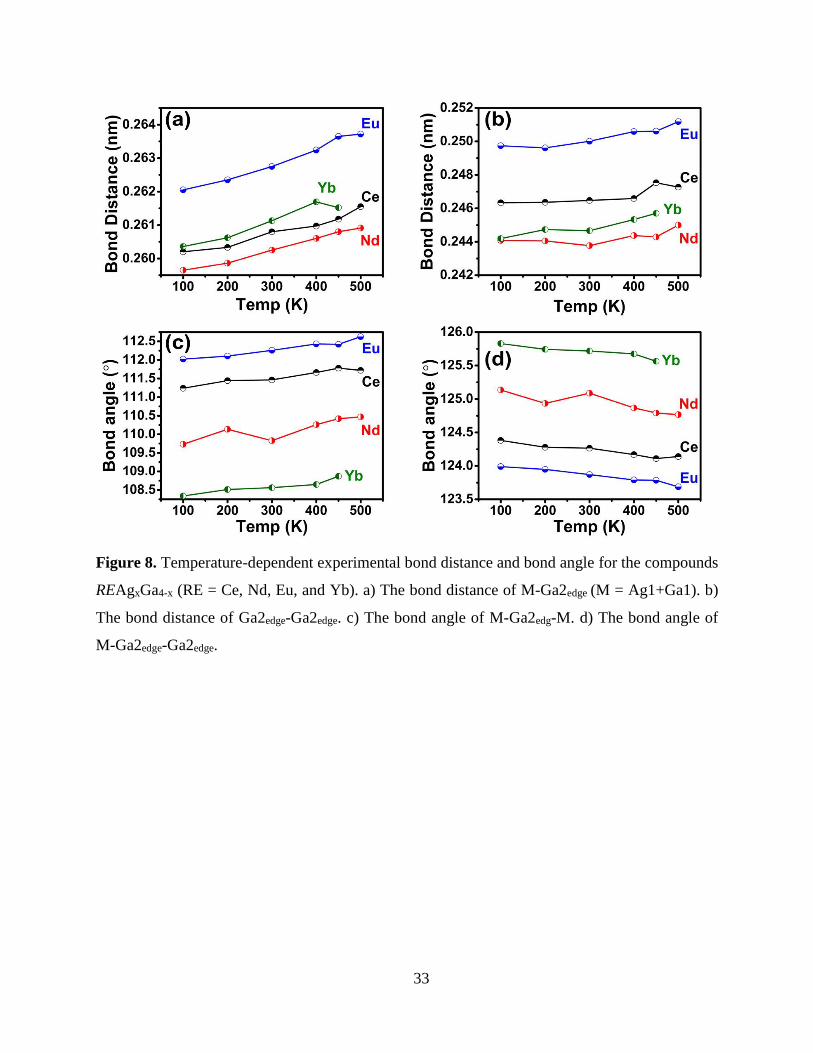
In the next step, we have considered the geometrical factors associated within the crystal
structures. Since the observed trend is similar in all compounds, NdAgGa3 has been picked
randomly to understand the associated geometrical features. With an enhancement in the M-
Ga2edge bond distance from 2.5965(5) to 2.6091(11) (temperature from 100 K to 500 K),
surprisingly a negligible increase (~0.0091Å) was observed for Ga2edge-Ga2edge distance along c
direction. Similarly there is a linear increase of the bond angles Ga2edge-M-Ga2edge (109.732(14)
at 100 K to 110.468(32) at 450 K) and M-Ga2edge-M (70.659(11) at 100 K to 71.025(26) at 450
K) and decrease in bond angles of M-Ga2edge-Ga2edge (125.134(21) at 100 K to 124.766(47) at
450 K) and Ga2centre-M-Ga2edge (109.341(14) at 100 K to 108.975(32) at 450 K) as shown in
Figures 8 and S6. Similar trends were observed for compounds EuAgGa3 and YbAgGa3 as
shown in Figures 8, S7 and S8. The atomic movement has been meticulously observed (Figures
S6 a-f, S9, Tables 3 and S3) by being more specific taking the example of NdAgGa3 in a
particular temperature range of 100 – 200 K.. Going from 100 K to 200 K, there is an increase of
~0.0091Å in the Ndcentre-Ga2edge bond length, i.e., 3.2415(3) to 3.2506(3) Å. On the other hand,

14
Ndcentre-M distance remains almost the same, i.e., 3.4465(2) to 3.4458(3) Å. The bonds along ab
plane M-Ga2centre/edge Ag1/Ga1-Ag1/Ga1 and Ndcorner-Ga2centre increases respectively 2.5965(5) to
2.5986(4) Å, 3.0029(2) to 3.0128(2) Å and 3.2414(3) to 3.2506(3)) Å. Along the c direction,
Ga2edge-Ga2edge bond distances remain same 2.4408(15) to 2.4406(15) Å, and Ndcorner-Ga2edge
bond distance decreases by ~0.0126Å (from 4.2089(9) to 4.1963(9) Å). So, the increase in ab
plane due to Ndcentre/corner-Ga2edge/centre is entirely overcome by the decrease in Ndcorner-Ga2edge
bond if we assume the increase in Ndcentre-Ga2edge bond length is due to movement of Ga2edge
atom completely in c direction (which is obviously not purely) with an enhancement of c lattice
parameter is 2×0.0126, i.e., ~0.0252Å. Since the c parameter is already shortening by ~0.0252 Å
so the increase may be occurring in a and/or b directions. So, it can be concluded that c
parameter is slightly decreasing going from 100 to 200 K due to compression of Ndcorner-Ga2edge
bond length and the expansion along ab plane is due to increased Ndcentre/corner-Ga2edge/centre bond
length.
The detailed bond analysis suggests, only the lattice parameters along the ab plane are
thermally expanding while the atoms in c direction are having almost fixed positions resulting in
near ZTE. There are two similar atomic arrangements constructing a V-shaped layer along both a
and b directions in zig-zag fashion. For the sake of simplicity, only the top layer has been shown
in Figure 9. These layers consist of alternate -M-Ga-M-Ga-M-Ga atoms where M = Ag+Ga
atoms, while in c direction there is a linear arrangement of -RE-Ga-M-Ga-RE- atoms (Figure 2).
As the temperature increases the atoms lying in zig-zag V-shaped layer start expanding along ab
plane (shown by dashed arrow in Figure 9 from the original position; shown by black arrow in
Figure 9) in such a way that the Ga2edge-M-Ga2edge slab elongates along ab plane by adjusting

15
the angle of Ga2edge-M-Ga2edge while maintaining the thickness of slab Ga2edge-M-Ga2edge almost
unaltered. Consequently, the lattice parameter c shows NZTE. -
Based on the above anisotropic near zero thermal expansion observation, the expansivity
indicatrix is shown using PASCal47 (Figure S10). The coefficient of thermal expansions (CTE)
with respect to anisotropic lattice parameter c (αc) and volume (αv) are calculated in the
temperature range of 100 – 500 K (Table 4 and S12). Also, observed and calculated percentage
change in the lattice parameters are given in Table S13.
4 Physical Properties
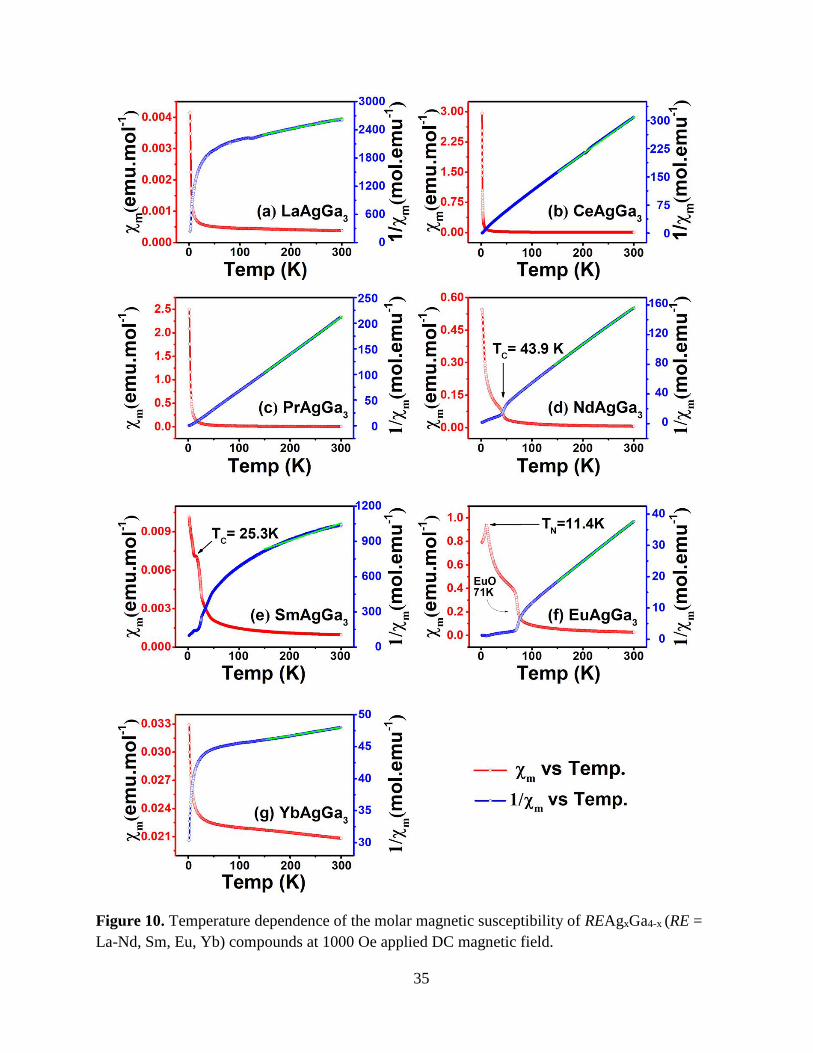
The temperature dependent DC magnetic susceptibility measurement was performed on
powder samples of all compounds to understand the overall isotropic TE. The anisotropic
magnetic behavior was deduced from the measurements on rod-shaped single crystals measured
along ab plane and c direction. The measurements were performed at an applied magnetic field
of 1000 Oe within a temperature range of 2-300 K (Figure 10). The data were fit in the
temperature range of 150-300 K in accordance with Curie-Weiss law48,49 for all the compounds
except YbAgGa3
The values of observed magnetic ordering and effective magnetic moment eff (in Bohr
magneton B) obtained by fitting the curves above 150 K are mentioned in Table 5 for all the
compounds which agree to previous report by Grin et al.35 Usually, RE based intermetallics
exhibit a slight increase in magnetic susceptibility with increase in magnetic field at lower
temperatures, which could be due to magnetic impurities and or crystal field contributions.50,51.
LaAgGa3 was found to be diamagnetic in the entire range, and the remaining compounds show
weak paramagnetic behavior in the entire temperature range. Except SmAgGa3 and EuAgGa3,

16
the experimental values of eff for all compounds agree well with calculated values obtained
from Hund’s rules fot RE3+. For EuAgGa3, the magnetic moment (eff) 7.9B/Eu ion confirms the
presence of Eu2+ valence state and it exhibits antiferromagnetic ordering at 11.4 K. It must be
noted that due to the mixing of the excited crystal field levels and lowest lying levels, Sm3+ is
often show a reduced magnetic moment. And here also, SmAgGa3 has the room temperature
magnetic moment of 1.58 B/Sm3+ ion which is in accordance with the fact.52
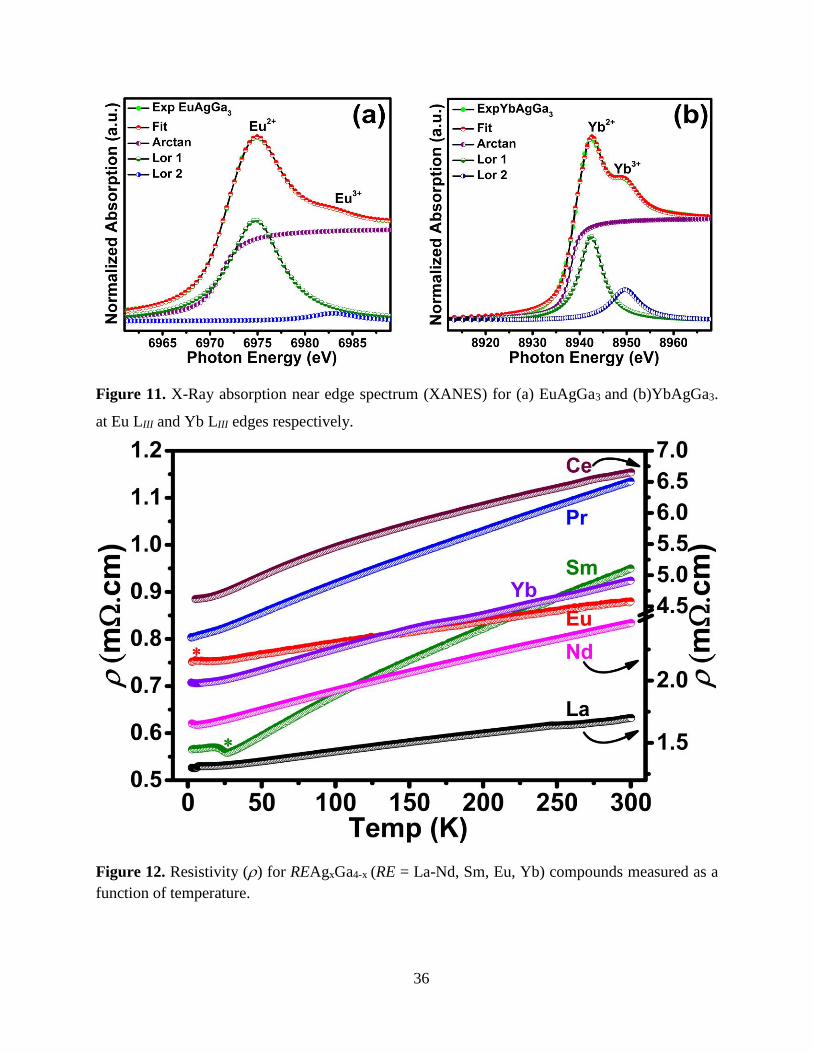
Also, to get the exact oxidation state of the Eu and Yb in the EuAgGa3 and YbAgGa3, the
room temperature XANES data of these two compounds at the RE-LIII edge were recorded. The
compound EuAgGa3 exhibit a characteristic signal of Eu2+ observed at 6975 eV53-55 (Figure 11a)
and a weak shoulder at ~6983 eV suggesting the presence of some Eu3+. Area integration under
the peaks suggests ~94% presence of Eu2+ while ~6% presence of Eu3+ corresponding to average
Eu valence of 2.06. The ambiguity (∼6%) in Eu3+ state can be accounted to the several settings
used to denote the white-line resonances, edge-step and systematic errors depending upon fitting-
model.56 This result confirms the predominant divalent nature of Eu, as surmised from the
EuAgGa3 unit cell volume (Figure 4f) and the magnetic susceptibility(Figure 10f).
Room temperature XANES measurement at ambient pressure was performed for the
compound YbAgGa3 also at the Yb LIII-edge (Figure 11b). The spectrum shows two absorption
peaks centered at 8943.6 (intense) and 8949.6 eV characteristic of Yb3+ and Yb2+ respectively.56
Area integration under the peaks suggests ~77% presence of Yb2+ and ~23% of Yb3+ confirming
YbAgGa3 as a mixed-valent compound.
Temperature dependent electrical resistivity of the REAgxGa4-x compounds are shown in
Figure 12 which decrease linearly as the temperature decreases, a typical phenomenon for
metallic compounds.57,58 The magnetic ordering observed in the magnetic measurements
17
confirmed with the anomalies in the resistivity data at the corresponding temperature (shown by
* in Figure 12). Interestingly, in the case of NdAgGa3, the anomaly was too weak to observe in
the resistivity measurement. The room temperature resistivity of REAgxGa4-x compounds ranges
from 0.88 mΩ.cm (EuAgGa3) to 6.6 mΩ.cm (CeAgGa3) is listed in Table 6
Conclusion
In summary, anisotropic near ZTE was observed in the family of REAgxGa4-x (RE = La-Nd,
Sm, Eu and Yb) compounds. A combination of various techniques such as temperature
dependent single crystal XRD, temperature dependent anisotropic magnetic measurements and
temperature dependent XANES confirm that geometric features of the crystal structure play a
critical role in the ZTE behavior along c-direction. The diverse crystal structures earlier observed
in RETX3 systems from BaAl4 family were well exploited here to study the ZTE behavior. Since
the atom packing in known 15 different crystal structures are very close in nature, it can be
concluded that minute symmetry changes responsible for the anisotropic ZTE behavior, which is
well explained by temperature dependent single XRD data by considering bond angles, bond
lengths, and anisotropic thermal parameters. The present work not only discusses about the
anisotropic ZTE behavior but also offers an explicit and inclusive understanding of local
structural features of these compounds, which could extend to other members in RETX3
compounds from BaAl4 family.

18
Acknowledgments: We thank Prof. C.N.R. Rao, F.R.S for his constant support and
guidance. Vidyanshu thanks, ICMS, JNCASR for financial support, S.R., and U. S. thank UGC
and CSIR for research fellowship respectively. We thank the Department of Science and
Technology, India for the financial support. Parts of this research were also carried out at the
light source PETRA III at DESY, a member of the Helmholtz Association (HGF) and we thank
Dr. Edmund Welter for assistance in using PETRA III beamline P65 at DESY, Germany. Thanks
to Ms. Selvi for SEM analyses, and Mr. Somnath Ghara for his assistance with the magnetic and
resistance measurements.
Supporting information: The Supporting Information is available free of charge on the ACS
Publications website at DOI:
X-ray crystallographic file in CIF format; crystallographic tables for crystal data, structure
refinement, atomic coordinates and anisotropic displacement parameters; EDX; analyses from
powder XRD patterns; magnetization curves; and expansivity indicatrix plot.

19
References
(1) Tallentire, S. E.; Child, F.; Fall, I.; Vella-Zarb, L.; Evans, I. R.; Tucker, M. G.;
Keen, D. A.; Wilson, C.; Evans, J. S. O. Systematic and controllable negative, zero, and positive
thermal expansion in cubic Zr1-xSnxMo2O8. J. Am. Chem. Soc. 2013, 135, 12849-12856.
(2) Salvador, J. R.; Guo, F.; Hogan, T.; Kanatzidis, M. G. Zero thermal expansion in
YbGaGe due to an electronic valence transition. Nature 2003, 425, 702-705.
(3) Schultz, P. C.; Smyth, H. T.: Amorphous Materials; Wiley: New York, 1970.
(4) Shiga, M. lnvar alloys. Curr. Opin. Solid State Mater. Sci. 1996, 1, 340-348.
(5) Mary, T. A.; Evans, J. S. O.; Vogt, T.; Sleight, A. W. Negative thermal expansion
from 0.3 to 1050 kelvin in ZrW2O8. Science 1996, 272, 90.
(6) Baughman, R. H.; Galvao, D. S. Crystalline networks with unusual predicted
mechanical and thermal properties. Nature 1993, 365, 735-737.
(7) Michael, J. C.; Andrew, L. G.; Matthew, G. T.; David, A. K.; Martin, T. D.; Lars,
P.; John, S. O. E. Local structure in Ag3[Co(CN)6]: colossal thermal expansion, rigid unit modes
and argentophilic interactions. J. Phys. Condens. Matter 2008, 20, 255225.
(8) Arvanitidis, J.; Papagelis, K.; Margadonna, S.; Prassides, K.; Fitch, A. N.
Temperature-induced valence transition and associated lattice collapse in samarium fulleride.
Nature 2003, 425, 599-602.
(9) Azuma, M.; Chen, W.-t.; Seki, H.; Czapski, M.; Olga, S.; Oka, K.; Mizumaki, M.;
Watanuki, T.; Ishimatsu, N.; Kawamura, N.; Ishiwata, S.; Tucker, M. G.; Shimakawa, Y.;
Attfield, J. P. Colossal negative thermal expansion in BiNiO3 induced by intermetallic charge
transfer. Nat. Commun. 2011, 2, 347.
(10) Zheng, X. G.; Kubozono, H.; Yamada, H.; Kato, K.; Ishiwata, Y.; Xu, C. N. Giant
negative thermal expansion in magnetic nanocrystals. Nat. Nano. 2008, 3, 724-726.
(11) Takenaka, K.; Takagi, H. Giant negative thermal expansion in Ge-doped anti-
perovskite manganese nitrides. App. Phys. Lett. 2005, 87, 261902.
(12) Peter, S. C.; Chondroudi, M.; Malliakas, C. D.; Balasubramanian, M.; Kanatzidis,
M. G. Anomalous Thermal Expansion in the Square-Net Compounds RE4TGe8 (RE = Yb, Gd; T
= Cr–Ni, Ag). J. Am. Chem. Soc. 2011, 133, 13840-13843.

20
(13) Margadonna, S.; Prassides, K.; Chondroudi, M.; Salvador, J. R.; Kanatzidis, M.
G. Temperature-induced abrupt volume inflation in the mixed-valence ternary Zintl phase
Yb8Ge3Sb5. Chem. Commun. 2005, 0, 5754-5756.
(14) Zhang, Y.; Islam, Z.; Ren, Y.; Parilla, P. A.; Ahrenkiel, S. P.; Lee, P. L.;
Mascarenhas, A.; McNevin, M. J.; Naumov, I.; Fu, H. X.; Huang, X. Y.; Li, J. Zero Thermal
Expansion in a Nanostructured Inorganic-Organic Hybrid Crystal. Phy. Rev. Lett. 2007, 99,
215901.
(15) Chen, J.; Hu, L.; Deng, J.; Xing, X. Negative thermal expansion in functional
materials: controllable thermal expansion by chemical modifications. Chem. Soc. Rev. 2015, 44,
3522-3567.
(16) Chu, C. N.; Saka, N.; Suh, N. P. Negative thermal expansion ceramics: A review.
Mater. Sci. Eng. 1987, 95, 303-308.
(17) Sleight, A. W. Compounds That Contract on Heating. Inorg. Chem. 1998, 37,
2854-2860.
(18) Hayase, M.; Shiga, M.; Nakamura, Y. Spontaneous Volume Magnetostriction and
Lattice Constant of Face-Centered Cubic Fe-Ni and Ni-Cu Alloys. J. Phy. Soc. Jpn. 1973, 34,
925-933.
(19) Yanming, H.; Xuemin, Z.; Bowen, W.; Yizhe, Y.; Fang, W. Anomalous thermal
expansion and magnetic properties of Tm2Fe17−xCrx compounds. J. Appl. Phys. 2010, 108,
023915.
(20) Wang, J. L.; Campbell, S. J.; Tegus, O.; Marquina, C.; Ibarra, M. R.
Magnetovolume effect and magnetic properties of Dy2Fe17-xMnx. Phys. Rev. B 2007, 75, 174423.
(21) Khosrovani, N.; Sleight, A. W.; Vogt, T. Structure of ZrV2O7from −263 to 470°C.
J. Solid State Chem. 1997, 132, 355-360.
(22) Dörrscheidt, W.; Schäfer, H. Die struktur des BaPtSn3, BaNiSn3 und SrNiSn3 und
ihre verwandtschaft zum ThCr2Si2-strukturtyp. J. Less Common Met. 1978, 58, 209-216.
(23) Andress, K. R.; Alberti, E. Röntgenographische Untersuchung der
Legierungsreihe Aluminium-Barium. Z. Metallkd. 1935, 27, 126-128.
(24) Zarechnyuk, O. S.; Krypyakevych, P. I.; Gladyshevskii, E. I. Ternary
intermetallic compounds with a BaAl4 type superlattice. Sov. Phys. Crystallogr. 1965, 9, 706-
708.

21
(25) Lander, J. The crystal structures of NiO.3BaO, NiO.BaO, BaNiO3 and
intermediate phases with composition near Ba2Ni2O5; with a note on NiO. Acta Crystallogr.
1951, 4, 148-156.
(26) Bodak, O. I.; Kotur, B. Y.; Gladyshevskii, E. I. The system scandium-nickel-
silicon. Dopov Akad. Nauk Ukr. Ser A 1976, 38, 655-657.
(27) Bodak, O. I.; Pecharskii, V. K.; Mruz, O. Y.; Zavodnik, V. Y.; Vitvitska, G. M.;
Salamakha, P. S. Crystal Structure of the compounds RNiGe3
(R=Y,Nd,Sm,Gd,Tb,Dy,Ho,Er,Tm,Lu). Dopov Akad. Nauk Ukr. RSR 1985, 1985, 36-38.
(28) Bodak, O. I.; Seropegin, Y. D.; Sologub, O. L.; Pecharskii, V. K.; Gribanov, A.
V. New Structural Typies-Germanides Ce, Rh and Pt. Coll. Abs. Eur. Crystallogr. Meet. (12th)
Moscow 1989, 2.
(29) Ferguson, M. J.; Hushagen, R. W.; Mar, A. Crystal structures of La3ZrSb5,
La3HfSb5, and LaCrSb3. Structural relationships in ternary rare-earth antimonides. J. Alloy
Compd. 1997, 249, 191-198.
(30) Seidel, S.; Hoffmann, R.-D.; Poettgen, R. SrPdGa3 - An orthorhombic
superstructure of the ThCr2Si2 type. Z. Kristallogr. Cryst. Mater. 2014, 229, 421-426.
(31) Eisenmann, B.; Schäfer, H. Käfigstrukturen in intermetallischen Verbindungen:
zur Kenntnis von LaRuSn3, CeRuSn3, PrRuSn3 und NdRuSn3. J. Less Common Met. 1986, 123,
89-94.
(32) Biehl, E.; Deiseroth, H. J. Rb5Hg19: A new defect variant of the BaAl4 structure
type. Z. Anorg. Allg. Chem. 1999, 625, 389-394.
(33) Johansson, C. H.; Linde, J. O. Röntgenographische Bestimmung der
Atomanordnung in den Mischkristallreihen Au-Cu und Pd-Cu. Ann. Phys. 1925, 78, 439-460.
(34) Subbarao, U.; Peter, S. C. Crystal Growth and Properties of YbCuGa3: First
Monoclinic System in the RETX3 Family. Cryst. Growth Des. 2013, 13, 953-959.
(35) Grin, Y. N.; Hiebl, K.; Rogl, P.; Eibler, R. Ternary gallides REAgxGa4−x (RE= La,
Ce, Pr, Nd, Sm). J. Less Common Met. 1986, 115, 367-372.
(36) Bruker, A.: Topas V4. 2: General profile and structure analysis software for
powder diffraction data. In Bruker AXS, Karlsruhe, Germany, 2009.
(37) SAINT; 6.02 ed.; Bruker AXS Inc.: Madison, Wisconsin, USA, 2000.

22
(38) Sheldrick, G. M.: Bruker Analytical X-ray Systems Inc. In SADABS: Madison,
WI, 1997; Vol. 5.10.
(39) Farrugia, L. J. WinGX. A Windows Program for Crystal Structure Analysis. J.
Appl. Crystallogr. 1999, 32, 837−838.
(40) Sheldrick, G. M. SHELXS-97 and SHELXL-97, Program for Crystal structure
solution and refinement. University of Göttingen, Germany 1997.
(41) Gumeniuk, R. V.; Akselrud, L. G.; Stel’makhovych, B. M.; Kuz’ma, Y. B. The
gallium-rich region of the Ce–Ag–Ga system. J. Less Common Met. 2005, 389, 127-132.
(42) Yin, W.; Zhang, D.; Zhou, M.; Iyer, A. K.; Pöhls, J.-H.; Yao, J.; Mar, A.
Quaternary rare-earth selenides Ba2REGaSe5 and Ba2REInSe5. J. Solid State Chem. 2018, 265,
167-175.
(43) Diamond: In Crystal impact; version 3.0g ed.; Rathausgasse: Bonn, Germany,
2011.
(44) Subbarao, U.; Rayaprol, S.; Dally, R.; Graf, M. J.; Peter, S. C. Swinging
Symmetry, Multiple Structural Phase Transitions, and Versatile Physical Properties in RECuGa3
(RE = La–Nd, Sm–Gd). Inorg. Chem. 2016, 55, 666-675.
(45) Varma, C. M. Mixed-valence compounds. Rev. Mod. Phys. 1976, 48, 219-238.
(46) Chondroudi, M.; Balasubramanian, M.; Welp, U.; Kwok, W.-K.; Kanatzidis, M.
G. Mixed Valency in Yb7Co4InGe12: A Novel Intermetallic Compound Stabilized in Liquid
Indium. Chem. Mater. 2007, 19, 4769-4775.
(47) Cliffe, M. J.; Goodwin, A. L. PASCal: a principal axis strain calculator for
thermal expansion and compressibility determination. J. Appl. Crystallogr. 2012, 45, 1321-1329.
(48) Kittel, C.; McEuen, P.: Introduction to solid state physics; Wiley New York,
1996; Vol. 8.
(49) Smart, J. S.: Effective field theories of magnetism; Saunders, 1966.
(50) Chondroudi, M.; Peter, S. C.; Malliakas, C. D.; Balasubramanian, M.; Li, Q. A.;
Kanatzidis, M. G. Yb3AuGe2In3: An Ordered Variant of the YbAuIn Structure Exhibiting
Mixed-Valent Yb Behavior. Inorg. Chem. 2011, 50, 1184-1193.
(51) Peter, S. C.; Eckert, H.; Fehse, C.; Wright, J. P.; Attfield, J. P.; Johrendt, D.;
Rayaprol, S.; Hoffmann, R. D.; Pöttgen, R. Structural, magnetic, and spectroscopic studies of
YAgSn, TmAgSn, and LuAgSn. J. Solid State Chem. 2006, 179, 2376-2385.

23
(52) Buschow, K. H. J.; van Diepen, A. M.; de Wijn, H. W. Moment Reduction in
Magnetically Ordered Samarium Intermetallics. Phys. Rev. B 1973, 8, 5134-5138.
(53) Inoue, T.; Kubozono, Y.; Kashino, S.; Takabayashi, Y.; Fujitaka, K.; Hida, M.;
Inoue, M.; Kanbara, T.; Emura, S.; Urugad, T. Electronic structure of Eu@C60 studied by
XANES and UV–VIS absorption spectra. Chem. Phys. Lett. 2000, 316, 381−386.
(54) Sarkar, S.; Subbarao, U.; Joseph, B.; Peter, S. C. Mixed valence and
metamagnetism in a metal flux grown compound Eu2Pt3Si5. J. Solid State Chem. 2015, 225, 181-
186.
(55) Sarkar, S.; Peter, S. C. Structural Phase Transitions in a New Compound
Eu2AgGe3. Inorg. Chem. 2013, 52, 9741-9748.
(56) Peter, S. C.; Subbarao, U.; Rayaprol, S.; Martin, J. B.; Balasubramanian, M.;
Malliakas, C. D.; Kanatzidis, M. G. Flux Growth of Yb6.6Ir6Sn16 Having Mixed-Valent
Ytterbium. Inorg. Chem. 2014, 53, 6615-6623.
(57) Dremov, R. V.; Koblyuk, N.; Mudryk, Y.; Romaka, L.; Sechovsky, V. Electrical
resistivity and magnetism in some ternary intermetallics. J. Alloy Compd. 2001, 317, 293-296.
(58) He, J.; Ling, G.; Jiao, Z. Magnetic and transport properties of cubic AuBe5-type
YbCu5-xGax system. Physica B 2001, 301, 196-202.

24
Table 1. Crystal data and structure refinement for REAgxGa4-x (RE = La, - Nd, Sm, Eu and Yb) at 293 K.
Empirical
formula LaAg0.80(2)Ga3.20(2) CeAg0.83(2)Ga3.17(2)
PrAg0.75(2)
Ga3.25(2)
NdAg1.05(1)
Ga2.95(1)
SmAg0.97(1)Ga3.03(
1)
EuAg0.72(2)Ga3.28
(2)
YbAg0.57(2)Ga3.43
(2)
Formula weight 448.50 450.66 448.21 463.18 467.38 458.31 473.86
Wavelength 0.71073 Å
Crystal system Tetragonal
Space group I4/mmm
Unit cell
dimensions (Å)
a = 4.3637(17)
c = 10.768(6)
a = 4.3106(3)
c = 10.803(1)
a = 4.2835(5)
c = 10.7889(15)
a = 4.2660(6)
c = 10.835(2)
a = 4.2133(5)
c = 10.847(2)
a = 4.3633(4)
c = 10.8576(10)
a = 4.2422(4)
c = 10.9824(17)
Volume (Å3) 205.0(2) 200.74(3) 197.96(5) 197.19(7) 192.56(6) 206.71(4) 197.64(5)
Density (g/cm3) 7.265 7.456 7.519 7.801 8.061 7.357 7.962
Absorption
coefficient (mm-1) 34.451 35.841 37.310 37.698 40.466 39.179 49.020
F(000) 388 391 390 402 404 397 406
Crystal size (mm3) 0.10x0.07x0.04 0.10 x 0.07 x 0.09 0.07x0.05x0.08 0.05x0.08x0.07 0.06x0.05x0.09 0.07x0.05x0.08 0.10x0.05x0.08
θ range for data
collection 5.041 to 24.864° 3.77 to 30.78° 3.777 to 33.233° 3.761 to 24.918° 3.757 to 24.990° 3.75 to 31.28° 3.711 to 24.957°
Index ranges
-5<=h<=4,
-5<=k<=5,
-12<=l<=6
-6<=h<=5,
-6<=k<=6,
-14<=l<=15
-6<=h<=5,
-6<=k<=5,
-16<=l<=11
-4<=h<=5,
-5<=k<=5,
-12<=l<=10
-4<=h<=4,
-4<=k<=4,
-12<=l<=12
-6<=h<=6,
-5<=k<=6,
-15<=l<=12
-5<=h<=4,
-5<=k<=5,
-12<=l<=12
Reflections
collected 652 1035 915 773 645 1108 664
Independent
reflections 70 [Rint = 0.1443]
102 [Rint =
0.0644]
129 [Rint =
0.0944] 71 [Rint = 0.0718] 67 [Rint = 0.0995]
104 [Rint =
0.0721]
71 [Rint =
0.0788]
Completeness 92.1% 80.3% 100% 100% 100% 83.1% 100%
Ref. method Full-matrix least-squares on F2
Data / restraints /
parameters 70 / 0 / 10 102 / 0 / 10 129 / 0 / 10 71 / 0 / 10 67 / 0 / 10 104 / 0 / 10 71 / 0 / 10
Goodness-of-fit 1.125 1.393 1.188 1.088 1.488 1.187 0.919
Final R indices [I >
2σ(I)]
Robs = 0.0483, wRobs
= 0.1059
Robs = 0.0345,
wRobs = 0.0813
Robs = 0.0525,
wRobs = 0.1409
Robs = 0.0206,
wRobs = 0.0517
Robs = 0.0666,
wRobs = 0.1793
Robs = 0.0214,
wRobs = 0.0441
Robs = 0.0299,
wRobs= 0.0779
R indices [all data] Rall = 0.0497, wRall
= 0.1082
Rall = 0.0345,
wRall = 0.0813
Rall= 0.0527, wRall
= 0.1409
Rall= 0.0212,
wRall = 0.0530
Rall= 0.0666,
wRall = 0.1793
Rall = 0.0214,
wRall = 0.0441
Rall = 0.0299,
wRall = 0.0779
Ext. coefficient 0.015(5) 0.076(11) 0.014(4) 0.016(2) 0.048(2) 0.105(7) 0.020(3)
Largest diff. peak
and hole (e·Å-3) 2.825 and -1.457 1.231 and -3.186 6.411 and -3.277 1.613 and -1.612 4.246 and -3.147 2.120 and -1.693 2.311 and -1.556
R = Σ||Fo|-|Fc|| / Σ|Fo| for Fo2>2σ(Fo
2), wR = Σ[w(|Fo|2 - |Fc|2)2] / Σ[w(|Fo|4)]1/2 and calc w=1/[σ2(Fo 2)+(0.0359p)2+6.1794p] where p = (Fo 2+2 Fc 2)/3

25
Table 2. Selected bond lengths [Å] for REAgxGa4-x (RE = La-Pr, Sm, Eu and Yb) at 293 K with
estimated standard deviations in parentheses, where M1 = Ag1|Ga1.
Atom Label d [Å] Atom Label d [Å]
LaAg0.80Ga3.20 SmAg0.97Ga3.03
La—Ga2 3.3278(15) Sm—Ga2 3.2185(6)
La—M1 3.4651(13) Sm— M1 3.4339(4)
M1—Ga2 2.6173(16) M1—Ga2 2.5827(8)
M1— M1 3.0856(12) M1— M1 2.9793(4)
Ga2—Ga2 2.493(5) Ga2—Ga2 2.436(3)
CeAg0.9Ga3.10 EuAg0.72Ga3.28
Ce—Ga2 3.2864(9) Eu—Ga2 3.3252(3)
Ce— M1 3.4545(4) Eu— M1 3.4812(1)
M1—Ga2 2.6045(12) M1—Ga2 2.6261(5)
M1— M1 3.0451(4) M1— M1 3.0816(1)
Ga2—Ga2 2.472(4) Ga2—Ga2 2.4983(17)
PrAg0.75Ga3.25 YbAg0.57Ga3.43
Pr—Ga2 3.2665(9) Yb—Ga2 3.2401(8)
Pr— M1 3.4441(3) Yb— M1 3.4695(4)
M1—Ga2 2.6001(13) M1—Ga2 2.6100(11)
M1— M1 3.0289(4) M1— M1 2.9997(3)
Ga2—Ga2 2.446(4) Ga2—Ga2 2.450(4)
Table 3. Selected bond lengths (Å) for NdAg1.05Ga2.95 at 100 K and 200 K temperatures with
estimated standard deviations.
Atoms Distance (Å); 100 K Distance (Å); 200 K
Nd—Ga2 3.2415(3) 3.2506(3)
Nd— M1 3.4465(2) 3.4458(3)
M1—Ga2 2.5965(5) 2.5986(4)
M1— M1 3.0029(2) 3.0128(2)
Ga2—Ga2 2.4408(15) 2.4406(15)
Ga2— M1 2.5965(5) 2.5986(4)
Ga2—Nd 3.2414(3) 3.2506(3)

26
Table 4. The coefficients of linear and volume thermal expansion αc along crystallographic c
direction (CTE) for REAgxGa4-x (RE = Ce, Nd, Eu and Yb) with their operating temperature
range.
Sr. No. Compound αc (×10-6 K-1) αv (×10-5 K-1) Temperature Range
1 CeAg0.90Ga3.10 -0.42 6.78 100 – 500 (K)
2 NdAg0.05Ga2.95 -1.27 4.67 100 – 500 (K)
3 EuAg0.72Ga3.28 5.71 5.77 100 – 500 (K)
4 YbAg0.57Ga3.43 6.62 5.32 100 – 450 (K)
Table 5. Anisotropic and isotropic magnetic moments of REAgxGa4-x (RE = La-Nd, Sm, Eu and
Yb) with their magnetic ordering temperature. Anisotropic measurements were performed on
single crystals grown using the metal flux technique while Isotropic measurements were
performed on powder samples.
Sample Magnetic Moment (µB) B.M. Observed Magnetic
Ordering
Temp. (K) Anisotropic (CW Fit) Isotropic
c ab @ Room
Temp
CW Fit
(150-300K)
CeAgGa3 3.47 2.41 2.7865 2.8 2.69 (Tc)
PrAgGa3 4.26 3.91 3.3603 3.3 3.3 (Tc)
NdAgGa3 4.3 3.74 3.9218 3.9 43.5 (Tc)
SmAgGa3 1.5119 1.5 10.0 (Tc)
EuAgGa3 2.94 2.65 1.8436 7.9 11.4 (TN)
YbAgGa3 Temp
independent
2.8 (Tc)
Table 6. The resistivity of REAgxGa4-x (RE = La-Nd, Sm, Eu, Yb) at 300K.
S.No. Material Resistivity ρ (mΩ-cm)
1. LaAgGa3 1.69
2. CeAgGa3 6.64
3. PrAgGa3 1.13
4. NdAgGa3 2.45
5. SmAgGa3 0.95
6. EuAgGa3 0.88
7. YbAgGa3 0.92
27
Figures
Figure 1. SEM images of typical REAgxGa4-x (RE = La-Nd, Sm, Eu and Yb) single crystals grown by metal flux technique.

28
Figure 2. The crystal structure of REAgxGa4-x (RE = La-Nd, Sm, Eu, Yb) along the b-axis is
shown. The unit cell is drawn as solid yellow lines. Zig-zag atomic arrangement of Ag and Ga
atoms is seen along ab plane.
Figure 3. The coordination environment of (a) RE (RE = La-Nd, Sm, Eu, Yb), (b) Ga and (c) M
(Ag+Ga) atoms in REAgxGa4-x.

29
Figure 4. Temperature-dependent lattice parameters of the compounds REAgxGa4-x (RE = La-
Nd, Sm, Eu, Yb); (a) a and b axes, (b) c axis, (c) c/a, (d) (aT – a300K)/a300K, (e) (cT – c300K)/c300K
(f) unit cell volume.

30
Figure 5. Temperature dependence of the inverse anisotropic molar magnetic susceptibility of
CeAgGa3, NdAgGa3, PrAgGa3, and EuAgGa3 at 1000 Oe applied DC magnetic field along (a) ab
plane and (b) c axis. (The insets show anisotropic magnetic susceptibility in the range of 0-15K)

31
Figure 6. Temperature dependence of the anisotropic magnetic moment (µB) of CeAgGa3,
NdAgGa3, PrAgGa3, and EuAgGa3 at 1000 Oe applied DC magnetic field.

32
Figure 7. Temperature dependent X-ray absorption near edge spectra (XANES); (a-c) LaAgGa3 at respective edges, (d-f) CeAgGa3 at
respective edges and (g-i) NdAgGa3 at respective edges.
33
Figure 8. Temperature-dependent experimental bond distance and bond angle for the compounds
REAgxGa4-x (RE = Ce, Nd, Eu, and Yb). a) The bond distance of M-Ga2edge (M = Ag1+Ga1). b)
The bond distance of Ga2edge-Ga2edge. c) The bond angle of M-Ga2edg-M. d) The bond angle of
M-Ga2edge-Ga2edge.

34
Figure 9. Zig-zag atomic layer arrangement along ab plane (the bottom layer has been excluded
for the simplicity). The black arrow represents the initial position of the atoms while the dashed
arrow represents the movement of atoms along ab plane.
35
Figure 10. Temperature dependence of the molar magnetic susceptibility of REAgxGa4-x (RE =
La-Nd, Sm, Eu, Yb) compounds at 1000 Oe applied DC magnetic field.
36
Figure 11. X-Ray absorption near edge spectrum (XANES) for (a) EuAgGa3 and (b)YbAgGa3.
at Eu LIII and Yb LIII edges respectively.
Figure 12. Resistivity () for REAgxGa4-x (RE = La-Nd, Sm, Eu, Yb) compounds measured as a
function of temperature.

37
For Table of Contents Only
Synopsis
The anisotropic ZTE behavior was observed in a family of compounds REAgxGa4-x (RE = La-
Nd, Sm, Eu and Yb). The geometric features associated with the structural distortion cause the
anisotropic ZTE along c-direction.