Embed Size (px)
Citation preview
Anisotropy of sandstone permeability
CREWES Research Report � Volume 14 (2002) 1
Anisotropy of sandstone permeability
Rudi Meyer
ABSTRACT
Small-scale probe permeability measurements on differently oriented faces of highly compacted and quartz-cemented Viking Formation sandstones yield detailed permeability distributions that appear to be diagnostic of the grain- and lamina-scale fabric of the samples. Permeability anisotropy of a single �structureless'-appearing sample is low, reflected by a kV / kH-ratio of 0.7; corresponding k-distributions are homogeneous. Permeability anisotropy of a strongly laminated sample is variable, with kV / kH-ratios of 0.1 and 2.8, thought to be a function of the variability of the pore network connectivity for any given lamina. Significantly, the pore network anisotropy established during deposition has been maintained after several kilometres of burial, and cementation and dissolution processes. Lamina-perpendicular permeability distributions are very homogeneous relative to those of kH, which is taken to imply that fluid-fluid displacement processes are potentially more efficient in that orientation.
In comparison to the dataset presented herein, industry-standard core analyses of kMAX, k90, and kV, do not appear to yield relevant kV / kH-ratios that may be linked to the evolution of permeability anisotropy with depth. In future work, quantitative measures of pore network anisotropy will be compared to multi-directional probe permeability data to test causal relationships between permeability and pore network evolution.
INTRODUCTION
A sediment or sedimentary rock is defined to be anisotropic with respect to permeability when the magnitude of permeability at a given sample point changes with the direction of fluid flow through that sample. Permeability anisotropy in sediments is thought to be caused by the presence of grain-scale or layer-scale heterogeneities which have a preferred orientation (Lewis, 1988). Particularly in siliciclastic sands, singular grain-scale fabrics or mm- to cm-scale laminae, are commonly the result of discrete events of current deposition. Except in the case of coarse sands and gravels -with particle size > 0.5 mm, grain-scale fabrics are usually microscopic in nature. In contrast, laminae are by definition the thinnest depositional unit recognisable with the naked eye (Otto, 1938). Lamina are distinguished from adjacent layers by particle size (e.g. coarse grains of quartz and very small clay particles), composition (e.g. feldspar versus mica), and/or colour, as in orange, oxide-rich versus black, carbonaceous laminae. The orientation of laminar heterogeneities in sands and sandstones typically ranges from sub-horizontal, as produced from vertical aggradation of particles settling out of suspension, to surfaces inclined up to about 25 degrees from the horizontal, such as the avalanche slopes (foresets) of cross-bedded dunes. Flow or permeability anisotropy established during deposition, may be further modified by burial diagenetic processes including compaction, dissolution, and cementation of grains.
Meyer
2 CREWES Research Report � Volume 14 (2002)
Laminar heterogeneities of the type described above are very common in sandstone reservoirs, resulting in successive layers that may differ in permeability by several orders of magnitude (Weber and Van Geuns, 1990; Halvorsen, 1993). If layering is horizontal, such structure will not only give rise to different horizontal permeabilities (kH), but also a different vertical permeability (kV). If the small-scale layered fabric is tilted from the horizontal, distinct horizontal permeabilities are referenced to that structure, that is, oriented either parallel or perpendicular to the strike of inclined foreset surfaces (Weber, 1982); the associated vertical permeability is still oriented at a high-angle to laminae, but at < 90 degrees.
Recent investigations have shown that small-scale laminar structures characteristic of sandstones have a strong influence on highly anisotropic permeability fields. This anisotropy controls single-phase fluid flow as well as two-phase effective mobility of immiscible phases such as oil-water, and, provides a framework to upscale the effects of such structures to field-scale grids for reservoir models (Ringrose et al., 1993; Ringrose and Corbett, 1994; Tidwell and Wilson, 1997). The derivation of relevant kV / kH ratios is of great importance to predict and guide hydrocarbon recovery at the time scale of a few decades typical of subsurface exploitation schemes, but also to model secondary migration processes leading to the location and filling of hydrocarbon reservoirs over geologic time. The recent studies addressing the distribution of small-scale permeability have benefited from the development and refinement of the probe permeameter. Also known as mini-permeameter, it is a tool used to run flow experiments through effective volumes on the order of 0.1�1 cm3, to derive the corresponding small-scale permeabilities (Eijpe and Weber, 1971; Goggin et al., 1988; Goggin, 1993; Suboor and Heller, 1995; Garrison et al., 1996).
In this study I present the results of probe permeameter gas flow measurements carried-out in different orientations on two (2) samples from the Viking Formation cored at depth, from about 2500 m below KB. Bedding/laminae are indistinct in one of the samples, making it relatively isotropic, whereas another sample contains a number of contrasting, inclined laminae within a cross-bedded set. Although the sandstone has been strongly modified by diagenetic processes (e.g. compaction, quartz cementation, and selective dissolution of chert grains), the anisotropy of kH and kV remains as expected from the nature of depositional structures. The experiments are then briefly discussed in comparison to permeability trends from horizontal and vertical plugs of Virgelle Member sandstone at Writing-on-Stone Provincial Park, southern Alberta (Meyer, 1998; Meyer and Krause, 1998), and, contrasted with a partial sample of kV / kH-ratios derived from conventional core analyses of the Viking Formation in the Alberta Basin.
The results are taken to suggest that permeability anisotropy of laminated sandstones, initially established during deposition, can still be recognised at depth, just as the equivalent relative homogeneity of kV is still detectable. Therefore, pore network anisotropy must also be maintained and, hence, progressive changes in permeability anisotropy with depth may be recorded by the (predictable?) evolution of pore network geometry and changes in the corresponding kV / kH ratios. Clearly, kV / kH-ratios derived from industry-standard multi-directional core analyses (e.g. kmax, k90, and kV) are not suitable to test such causal relationships.
Anisotropy of sandstone permeability
CREWES Research Report � Volume 14 (2002) 3
METHODOLOGY AND DATA FOR THIS STUDY
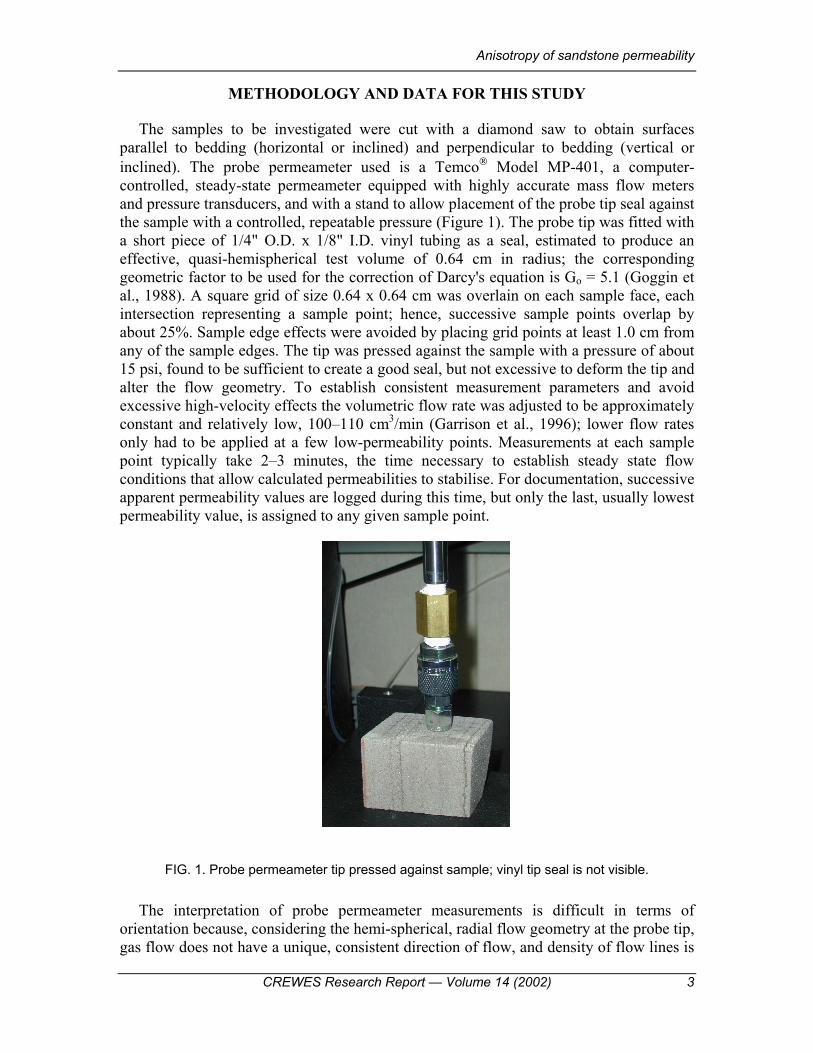
The samples to be investigated were cut with a diamond saw to obtain surfaces parallel to bedding (horizontal or inclined) and perpendicular to bedding (vertical or inclined). The probe permeameter used is a Temco Model MP-401, a computer-controlled, steady-state permeameter equipped with highly accurate mass flow meters and pressure transducers, and with a stand to allow placement of the probe tip seal against the sample with a controlled, repeatable pressure (Figure 1). The probe tip was fitted with a short piece of 1/4" O.D. x 1/8" I.D. vinyl tubing as a seal, estimated to produce an effective, quasi-hemispherical test volume of 0.64 cm in radius; the corresponding geometric factor to be used for the correction of Darcy's equation is Go = 5.1 (Goggin et al., 1988). A square grid of size 0.64 x 0.64 cm was overlain on each sample face, each intersection representing a sample point; hence, successive sample points overlap by about 25%. Sample edge effects were avoided by placing grid points at least 1.0 cm from any of the sample edges. The tip was pressed against the sample with a pressure of about 15 psi, found to be sufficient to create a good seal, but not excessive to deform the tip and alter the flow geometry. To establish consistent measurement parameters and avoid excessive high-velocity effects the volumetric flow rate was adjusted to be approximately constant and relatively low, 100�110 cm3/min (Garrison et al., 1996); lower flow rates only had to be applied at a few low-permeability points. Measurements at each sample point typically take 2�3 minutes, the time necessary to establish steady state flow conditions that allow calculated permeabilities to stabilise. For documentation, successive apparent permeability values are logged during this time, but only the last, usually lowest permeability value, is assigned to any given sample point.
FIG. 1. Probe permeameter tip pressed against sample; vinyl tip seal is not visible.
The interpretation of probe permeameter measurements is difficult in terms of orientation because, considering the hemi-spherical, radial flow geometry at the probe tip, gas flow does not have a unique, consistent direction of flow, and density of flow lines is
Meyer
4 CREWES Research Report � Volume 14 (2002)
not homogeneous (Garrison et al., 1996). This uncertainty in permeability orientation was clearly demonstrated for the case of non-steady-state, pressure-decay probe measurements (Meyer and Krause, 2001). In this study, the use of a steady-state probe permeameter at controlled, slow flow rates, minimises the uncertainty. Nonetheless, future work is planned to calibrate probe measurements based on simple, possibly synthetic porous media.
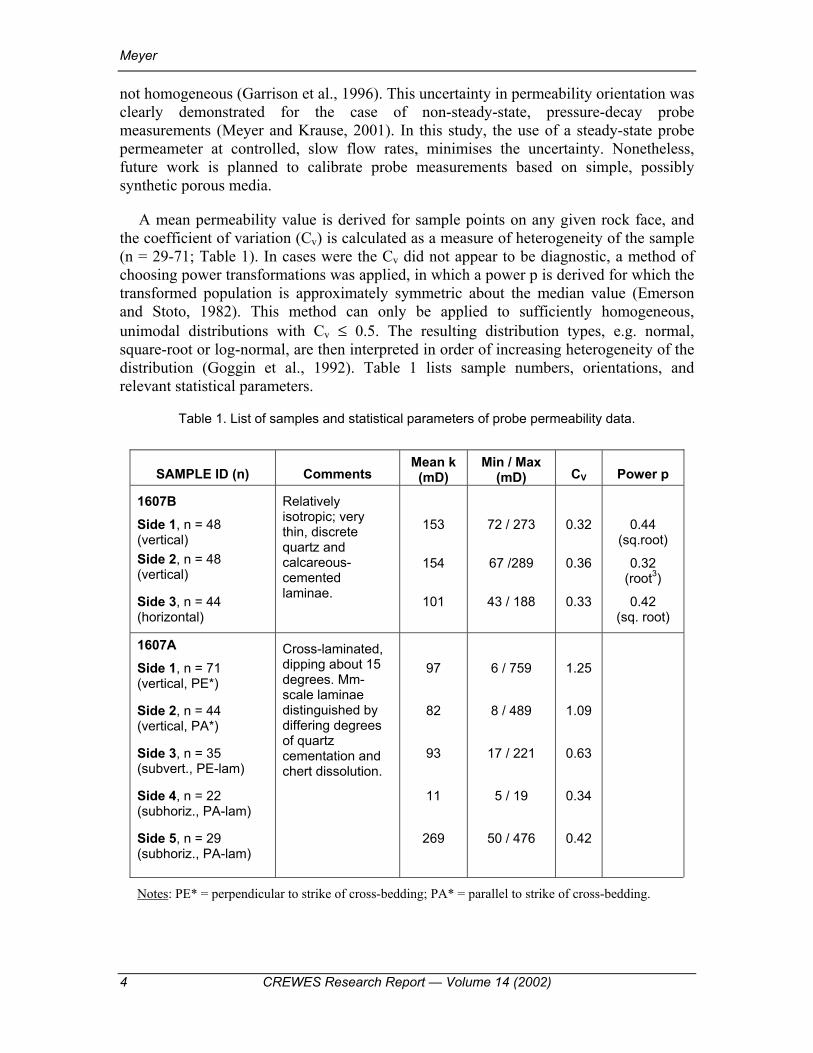
A mean permeability value is derived for sample points on any given rock face, and the coefficient of variation (Cv) is calculated as a measure of heterogeneity of the sample (n = 29-71; Table 1). In cases were the Cv did not appear to be diagnostic, a method of choosing power transformations was applied, in which a power p is derived for which the transformed population is approximately symmetric about the median value (Emerson and Stoto, 1982). This method can only be applied to sufficiently homogeneous, unimodal distributions with Cv ≤ 0.5. The resulting distribution types, e.g. normal, square-root or log-normal, are then interpreted in order of increasing heterogeneity of the distribution (Goggin et al., 1992). Table 1 lists sample numbers, orientations, and relevant statistical parameters.
Table 1. List of samples and statistical parameters of probe permeability data.
SAMPLE ID (n) Comments Mean k
(mD) Min / Max
(mD) CV Power p
1607B Side 1, n = 48 (vertical) Side 2, n = 48 (vertical)
Side 3, n = 44 (horizontal)
Relatively isotropic; very thin, discrete quartz and calcareous-cemented laminae.
153
154
101
72 / 273
67 /289
43 / 188
0.32
0.36
0.33
0.44 (sq.root)
0.32 (root3)
0.42 (sq. root)
1607A Side 1, n = 71 (vertical, PE*)
Side 2, n = 44 (vertical, PA*)
Side 3, n = 35 (subvert., PE-lam)
Side 4, n = 22 (subhoriz., PA-lam)
Side 5, n = 29 (subhoriz., PA-lam)
Cross-laminated, dipping about 15 degrees. Mm-scale laminae distinguished by differing degrees of quartz cementation and chert dissolution.
97
82
93
11
269
6 / 759
8 / 489
17 / 221
5 / 19
50 / 476
1.25
1.09
0.63
0.34
0.42
Notes: PE* = perpendicular to strike of cross-bedding; PA* = parallel to strike of cross-bedding.
Anisotropy of sandstone permeability
CREWES Research Report � Volume 14 (2002) 5
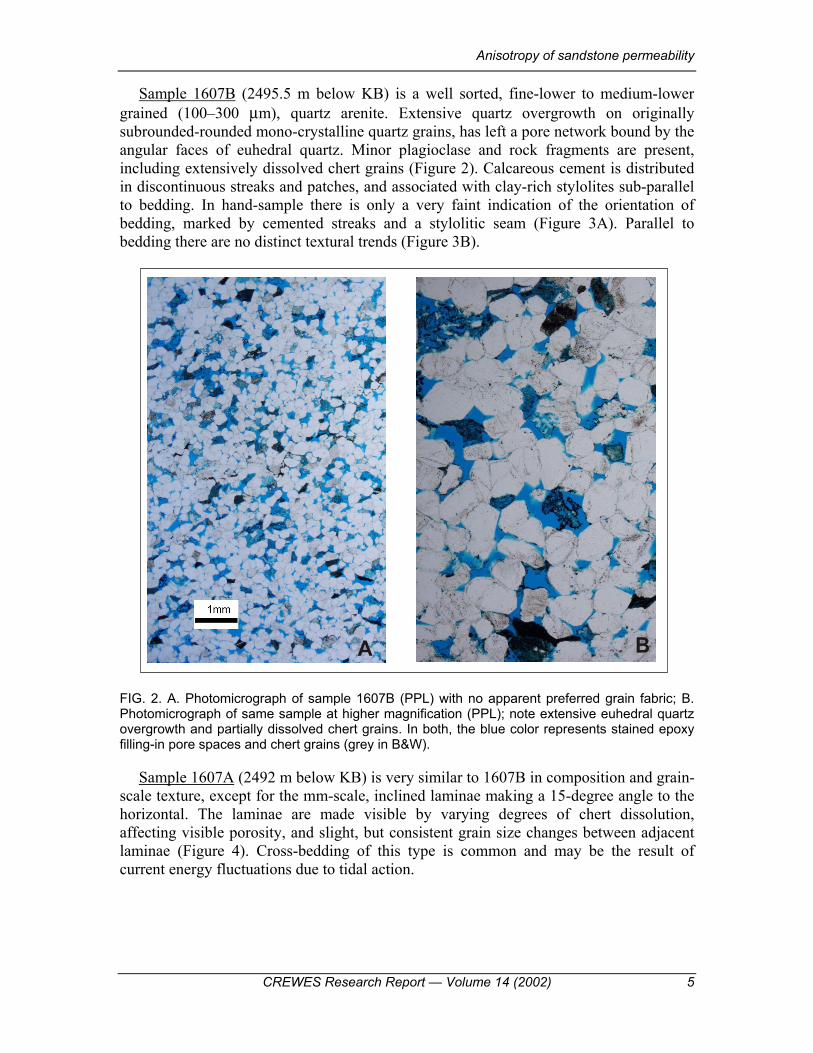
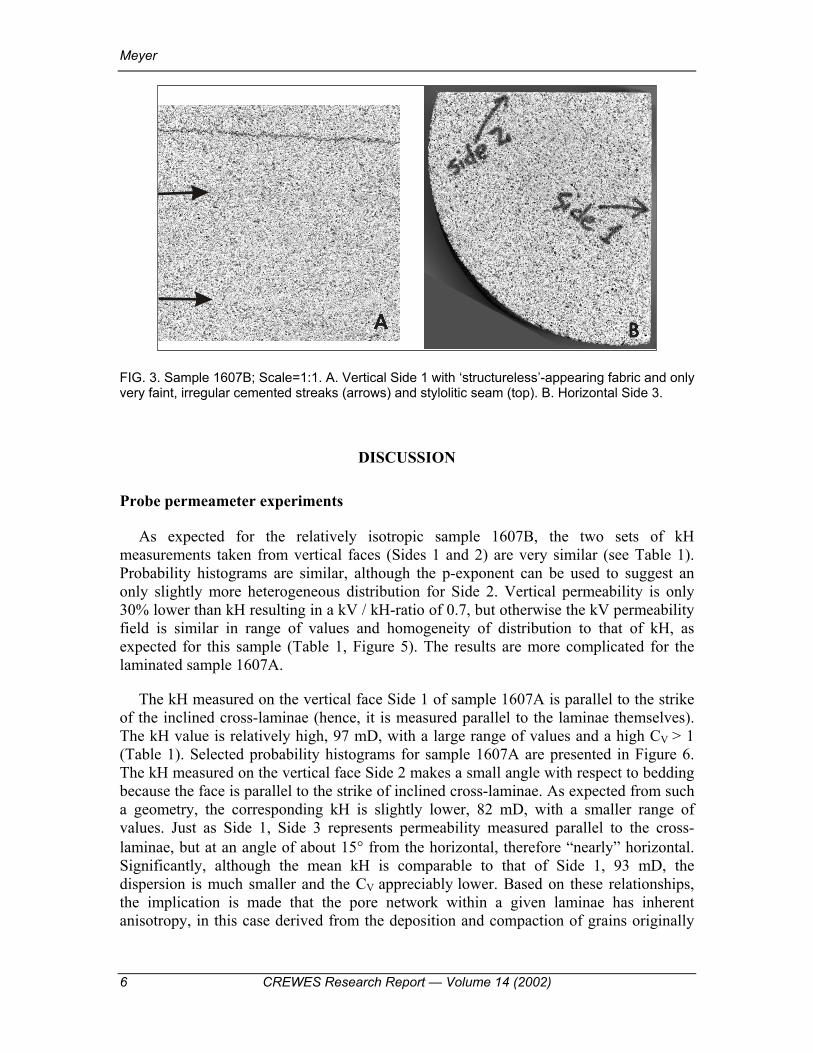
Sample 1607B (2495.5 m below KB) is a well sorted, fine-lower to medium-lower grained (100�300 µm), quartz arenite. Extensive quartz overgrowth on originally subrounded-rounded mono-crystalline quartz grains, has left a pore network bound by the angular faces of euhedral quartz. Minor plagioclase and rock fragments are present, including extensively dissolved chert grains (Figure 2). Calcareous cement is distributed in discontinuous streaks and patches, and associated with clay-rich stylolites sub-parallel to bedding. In hand-sample there is only a very faint indication of the orientation of bedding, marked by cemented streaks and a stylolitic seam (Figure 3A). Parallel to bedding there are no distinct textural trends (Figure 3B).
A B
FIG. 2. A. Photomicrograph of sample 1607B (PPL) with no apparent preferred grain fabric; B. Photomicrograph of same sample at higher magnification (PPL); note extensive euhedral quartz overgrowth and partially dissolved chert grains. In both, the blue color represents stained epoxy filling-in pore spaces and chert grains (grey in B&W).
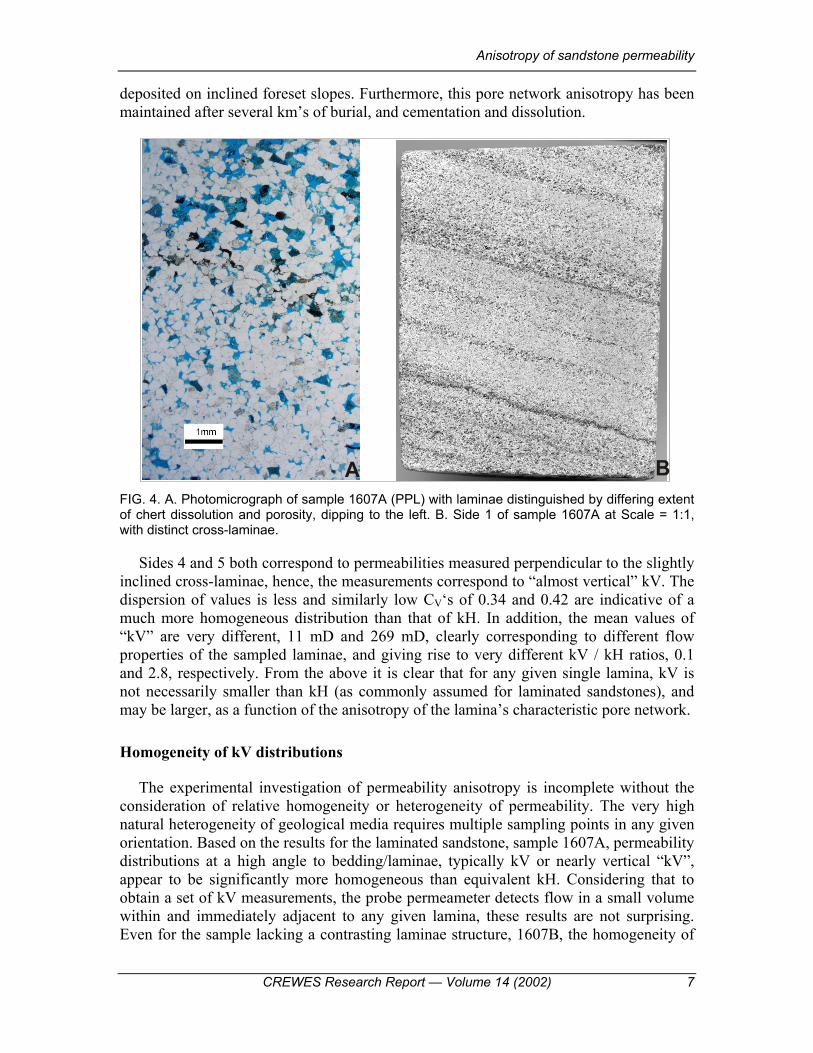
Sample 1607A (2492 m below KB) is very similar to 1607B in composition and grain-scale texture, except for the mm-scale, inclined laminae making a 15-degree angle to the horizontal. The laminae are made visible by varying degrees of chert dissolution, affecting visible porosity, and slight, but consistent grain size changes between adjacent laminae (Figure 4). Cross-bedding of this type is common and may be the result of current energy fluctuations due to tidal action.
Meyer
6 CREWES Research Report � Volume 14 (2002)
FIG. 3. Sample 1607B; Scale=1:1. A. Vertical Side 1 with �structureless�-appearing fabric and only very faint, irregular cemented streaks (arrows) and stylolitic seam (top). B. Horizontal Side 3.
DISCUSSION
Probe permeameter experiments
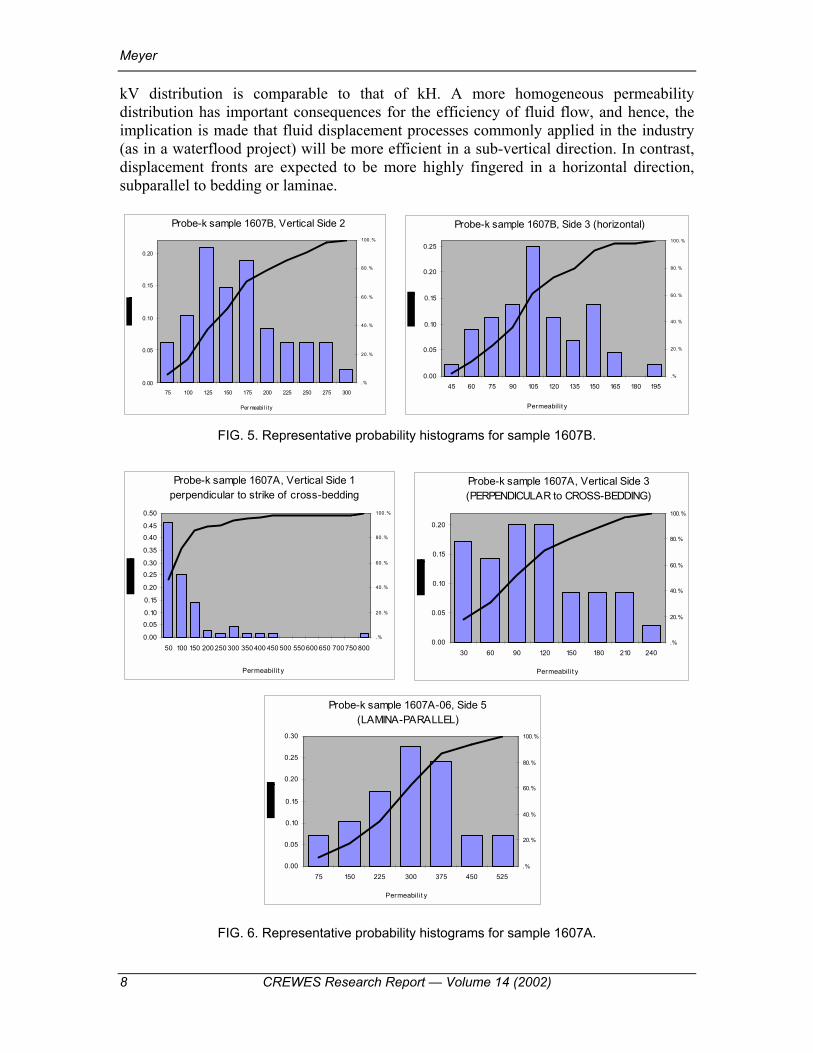
As expected for the relatively isotropic sample 1607B, the two sets of kH measurements taken from vertical faces (Sides 1 and 2) are very similar (see Table 1). Probability histograms are similar, although the p-exponent can be used to suggest an only slightly more heterogeneous distribution for Side 2. Vertical permeability is only 30% lower than kH resulting in a kV / kH-ratio of 0.7, but otherwise the kV permeability field is similar in range of values and homogeneity of distribution to that of kH, as expected for this sample (Table 1, Figure 5). The results are more complicated for the laminated sample 1607A.
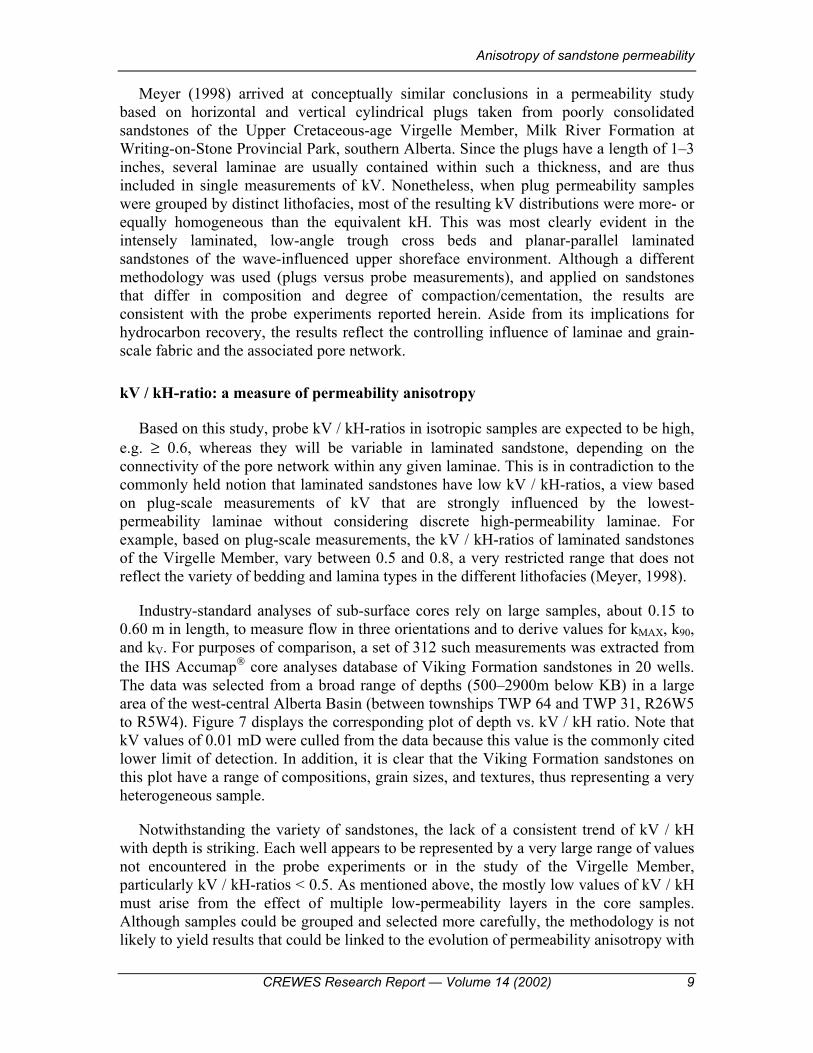
The kH measured on the vertical face Side 1 of sample 1607A is parallel to the strike of the inclined cross-laminae (hence, it is measured parallel to the laminae themselves). The kH value is relatively high, 97 mD, with a large range of values and a high CV > 1 (Table 1). Selected probability histograms for sample 1607A are presented in Figure 6. The kH measured on the vertical face Side 2 makes a small angle with respect to bedding because the face is parallel to the strike of inclined cross-laminae. As expected from such a geometry, the corresponding kH is slightly lower, 82 mD, with a smaller range of values. Just as Side 1, Side 3 represents permeability measured parallel to the cross-laminae, but at an angle of about 15° from the horizontal, therefore �nearly� horizontal. Significantly, although the mean kH is comparable to that of Side 1, 93 mD, the dispersion is much smaller and the CV appreciably lower. Based on these relationships, the implication is made that the pore network within a given laminae has inherent anisotropy, in this case derived from the deposition and compaction of grains originally
Anisotropy of sandstone permeability
CREWES Research Report � Volume 14 (2002) 7
deposited on inclined foreset slopes. Furthermore, this pore network anisotropy has been maintained after several km�s of burial, and cementation and dissolution.
A B FIG. 4. A. Photomicrograph of sample 1607A (PPL) with laminae distinguished by differing extent of chert dissolution and porosity, dipping to the left. B. Side 1 of sample 1607A at Scale = 1:1, with distinct cross-laminae.
Sides 4 and 5 both correspond to permeabilities measured perpendicular to the slightly inclined cross-laminae, hence, the measurements correspond to �almost vertical� kV. The dispersion of values is less and similarly low CV�s of 0.34 and 0.42 are indicative of a much more homogeneous distribution than that of kH. In addition, the mean values of �kV� are very different, 11 mD and 269 mD, clearly corresponding to different flow properties of the sampled laminae, and giving rise to very different kV / kH ratios, 0.1 and 2.8, respectively. From the above it is clear that for any given single lamina, kV is not necessarily smaller than kH (as commonly assumed for laminated sandstones), and may be larger, as a function of the anisotropy of the lamina�s characteristic pore network.
Homogeneity of kV distributions
The experimental investigation of permeability anisotropy is incomplete without the consideration of relative homogeneity or heterogeneity of permeability. The very high natural heterogeneity of geological media requires multiple sampling points in any given orientation. Based on the results for the laminated sandstone, sample 1607A, permeability distributions at a high angle to bedding/laminae, typically kV or nearly vertical �kV�, appear to be significantly more homogeneous than equivalent kH. Considering that to obtain a set of kV measurements, the probe permeameter detects flow in a small volume within and immediately adjacent to any given lamina, these results are not surprising. Even for the sample lacking a contrasting laminae structure, 1607B, the homogeneity of
Meyer
8 CREWES Research Report � Volume 14 (2002)
kV distribution is comparable to that of kH. A more homogeneous permeability distribution has important consequences for the efficiency of fluid flow, and hence, the implication is made that fluid displacement processes commonly applied in the industry (as in a waterflood project) will be more efficient in a sub-vertical direction. In contrast, displacement fronts are expected to be more highly fingered in a horizontal direction, subparallel to bedding or laminae.
Probe-k sample 1607B, Vertical Side 2
0.00
0.05
0.10
0.15
0.20
75 100 125 150 175 200 225 250 275 300
Per meabi l i ty
.%
20.%
40.%
60.%
80.%
100.%
Probe-k sample 1607B, Side 3 (horizontal)
0.00
0.05
0.10
0.15
0.20
0.25
45 60 75 90 105 120 135 150 165 180 195
Permeabilit y
.%
20.%
40.%
60.%
80.%
100.%
FIG. 5. Representative probability histograms for sample 1607B.
Probe-k sample 1607A, Vertical Side 1perpendicular to strike of cross-bedding
0.00
0.05
0.10
0.15
0.20
0.25
0.30
0.35
0.40
0.45
0.50
50 100 150 200 250 300 350 400 450 500 550 600 650 700 750 800
Permeabilit y
.%
20.%
40.%
60.%
80.%
100.%
Probe-k sample 1607A, Vertical Side 3(PERPENDICULAR to CROSS-BEDDING)
0.00
0.05
0.10
0.15
0.20
30 60 90 120 150 180 210 240
Permeabilit y
.%
20.%
40.%
60.%
80.%
100.%
Probe-k sample 1607A-06, Side 5(LAMINA-PARALLEL)
0.00
0.05
0.10
0.15
0.20
0.25
0.30
75 150 225 300 375 450 525
Permeabilit y
.%
20.%
40.%
60.%
80.%
100.%
FIG. 6. Representative probability histograms for sample 1607A.
Anisotropy of sandstone permeability
CREWES Research Report � Volume 14 (2002) 9
Meyer (1998) arrived at conceptually similar conclusions in a permeability study based on horizontal and vertical cylindrical plugs taken from poorly consolidated sandstones of the Upper Cretaceous-age Virgelle Member, Milk River Formation at Writing-on-Stone Provincial Park, southern Alberta. Since the plugs have a length of 1�3 inches, several laminae are usually contained within such a thickness, and are thus included in single measurements of kV. Nonetheless, when plug permeability samples were grouped by distinct lithofacies, most of the resulting kV distributions were more- or equally homogeneous than the equivalent kH. This was most clearly evident in the intensely laminated, low-angle trough cross beds and planar-parallel laminated sandstones of the wave-influenced upper shoreface environment. Although a different methodology was used (plugs versus probe measurements), and applied on sandstones that differ in composition and degree of compaction/cementation, the results are consistent with the probe experiments reported herein. Aside from its implications for hydrocarbon recovery, the results reflect the controlling influence of laminae and grain-scale fabric and the associated pore network.
kV / kH-ratio: a measure of permeability anisotropy
Based on this study, probe kV / kH-ratios in isotropic samples are expected to be high, e.g. ≥ 0.6, whereas they will be variable in laminated sandstone, depending on the connectivity of the pore network within any given laminae. This is in contradiction to the commonly held notion that laminated sandstones have low kV / kH-ratios, a view based on plug-scale measurements of kV that are strongly influenced by the lowest-permeability laminae without considering discrete high-permeability laminae. For example, based on plug-scale measurements, the kV / kH-ratios of laminated sandstones of the Virgelle Member, vary between 0.5 and 0.8, a very restricted range that does not reflect the variety of bedding and lamina types in the different lithofacies (Meyer, 1998).
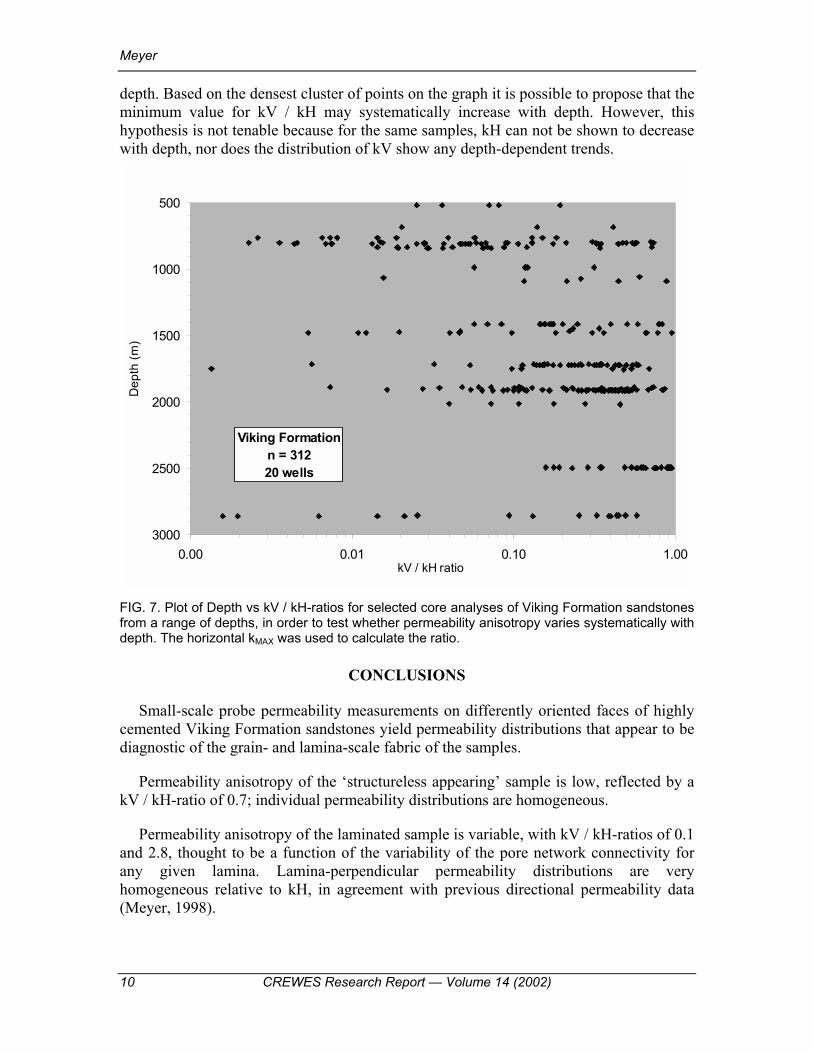
Industry-standard analyses of sub-surface cores rely on large samples, about 0.15 to 0.60 m in length, to measure flow in three orientations and to derive values for kMAX, k90, and kV. For purposes of comparison, a set of 312 such measurements was extracted from the IHS Accumap core analyses database of Viking Formation sandstones in 20 wells. The data was selected from a broad range of depths (500�2900m below KB) in a large area of the west-central Alberta Basin (between townships TWP 64 and TWP 31, R26W5 to R5W4). Figure 7 displays the corresponding plot of depth vs. kV / kH ratio. Note that kV values of 0.01 mD were culled from the data because this value is the commonly cited lower limit of detection. In addition, it is clear that the Viking Formation sandstones on this plot have a range of compositions, grain sizes, and textures, thus representing a very heterogeneous sample.
Notwithstanding the variety of sandstones, the lack of a consistent trend of kV / kH with depth is striking. Each well appears to be represented by a very large range of values not encountered in the probe experiments or in the study of the Virgelle Member, particularly kV / kH-ratios < 0.5. As mentioned above, the mostly low values of kV / kH must arise from the effect of multiple low-permeability layers in the core samples. Although samples could be grouped and selected more carefully, the methodology is not likely to yield results that could be linked to the evolution of permeability anisotropy with
Meyer
10 CREWES Research Report � Volume 14 (2002)
depth. Based on the densest cluster of points on the graph it is possible to propose that the minimum value for kV / kH may systematically increase with depth. However, this hypothesis is not tenable because for the same samples, kH can not be shown to decrease with depth, nor does the distribution of kV show any depth-dependent trends.
500
1000
1500
2000
2500
30000.00 0.01 0.10 1.00
kV / kH ratio
Dep
th (m
)
Viking Formationn = 31220 wells
FIG. 7. Plot of Depth vs kV / kH-ratios for selected core analyses of Viking Formation sandstones from a range of depths, in order to test whether permeability anisotropy varies systematically with depth. The horizontal kMAX was used to calculate the ratio.
CONCLUSIONS
Small-scale probe permeability measurements on differently oriented faces of highly cemented Viking Formation sandstones yield permeability distributions that appear to be diagnostic of the grain- and lamina-scale fabric of the samples.
Permeability anisotropy of the �structureless appearing� sample is low, reflected by a kV / kH-ratio of 0.7; individual permeability distributions are homogeneous.
Permeability anisotropy of the laminated sample is variable, with kV / kH-ratios of 0.1 and 2.8, thought to be a function of the variability of the pore network connectivity for any given lamina. Lamina-perpendicular permeability distributions are very homogeneous relative to kH, in agreement with previous directional permeability data (Meyer, 1998).
Anisotropy of sandstone permeability
CREWES Research Report � Volume 14 (2002) 11
In comparison to the dataset presented herein, industry-standard core analyses of kMAX, k90, and kV, do not appear to yield relevant kV / kH-ratios that may be linked to the evolution of permeability anisotropy with depth.
Results of this study justify further detailed probe permeameter sampling, and to test the link between the distribution of permeability in relevant directions and quantitative measures of pore network anisotropy.
ACKNOWLEDGMENTS
I thank CREWES and CREWES� sponsors for their ongoing financial support. I also thank NSERC for additional support through grants EQP240865 and RGP238252.
REFERENCES
Eijpe, R. and Weber, K.J., 1971. Mini-permeameters for consolidated rock and unconsolidated sand: The American Association of Petroleum Geologists Bulletin, 55, p. 307-309.
Emerson, J.D. and Stoto, M.W., 1982. Exploratory methods for choosing power transformations: Journal of the American Statistical Association, 82, p. 103-108.
Garrison, Jr., J. R, R. D. Hazlett, D. K. Babu, H. Laali, and L. D. Smallwood, 1996. Electronic flow rate-controlled probe permeametry: Theory, instrumentation, accuracy, precision, limitations, and application: In Situ, 20, no. 2, 161-198.
Goggin, D.J., 1993. Probe permeametry: is it worth the effort: Marine and Petroleum Geology, 10, p. 299-308.
Goggin, D.J., Thrasher, R.L., and Lake, L.W., 1988. A theoretical and experimental analysis of minipermeameter response including gas slippage and high velocity flow effects: In Situ, 12, no. 1&2, p. 79-116.
Goggin, D.J., Chandler, M.A., Kocurek, G., and Lake, L.W., 1992. Permeability transects of eolian sands and their use in generating random permeability fields: SPE Formation Evaluation, p. 7-16.
Halvorsen, C., 1993. Probe permeametry applied to a highly laminated sandstone reservoir: Marine and Petroleum Geology, 10, p. 347-351.
Lewis, J.J.M., 1988. Outcrop-derived quantitative models of permeability heterogeneity for genetically different sand bodies: SPE Paper 18153 presented at the 63rd Annual Technical Conference and Exhibition of the Society of Petroleum Engineers, Houston, Texas, Oct 2-5, 1988, 449-463.
Meyer, R., 1998, Sedimentology, petrology and permeability characterization of the Upper Cretaceous Virgelle Member, Milk River Formation, Writing-on-Stone Provincial Park, Alberta, Canada: Calgary, University of Calgary, Doctoral Dissertation, 456 p.
Meyer, R. and Krause, F.F., 1998. Patterns of directional permeability heterogeneity in Upper Cretaceous (Santonian) Virgelle Member sandstones, Writing-on-Stone Provincial Park, Alberta, Canada, Abstract to be presented at 1998 Joint Convention of CSPG/CSEG/CWLS, Calgary, Alberta, June 15-19, 1998.
Meyer, R. and F. F. Krause, 2001. A comparison of plug- and probe-derived permeabilities in cross-bedded sandstones of the Virgelle Member, Alberta, Canada: The influence of flow directions on probe permeametry. American Association of Petroleum Geologists Bulletin, 85, no. 3, p. 477�489.
Otto, G.H., 1938. The sedimentation unit and its use in field sampling: Journal of Geology, 46, 569-582. Ringrose, P.S., Sorbie, K.S., Corbett, P.W.M., and Jensen, J.L., 1993. Immiscible flow behaviour in
laminated and cross-bedded sandstones: Journal of Petroleum Science and Engineering, 9, p. 103-124.
Ringrose, P.S. and Corbett, P.W.M., 1994. Controls on two-phase fluid flow in heterogeneous sandstones, In Parnell, J. (editor), Geofluids: Origin, migration and evolution of fluids in sedimentary basins, Geological Society Special Publication No. 78, London, 372 pp.
Suboor, M. A. and Heller, J. P., 1995. Minipermeameter characteristics critical to its use: In Situ, 19, (3), 225-248.
Meyer
12 CREWES Research Report � Volume 14 (2002)
Tidwell, V.C. and Wilson, J.L., 1997. Laboratory method for investigating permeability upscaling: Water Resources Research, 33, (7), 1607-1616.
Weber, K.J. and Van Geuns, L.C., 1990. Framework for constructing clastic reservoir simulation models: Journal of Petroleum Technology, 42, p. 1248-1297.
Weber, K.J., 1982. Influence of common sedimentary structures on fluid flow in reservoir models: Journal of Petroleum Technology, 34, p. 665-672.


![Permeability evolution during localized deformation in ... · 2. Rock Material and Experimental Procedure [6] Our sandstone block is from the Gildehausen quarry, near the village](https://img.pdfslide.net/doc/110x75/5ed21359c96e9244bf54adec/permeability-evolution-during-localized-deformation-in-2-rock-material-and.jpg)