Embed Size (px)
Citation preview
ANN- ANFIS Based Forecast Model for Predicting
PV and Wind Energy Generation
K. Ranjith Kuamr, Member IAENG, M.Surya Kalavathi, Member IAENG
Abstract- Carbon emissions from economic activity continue to
rise and India is the third-largest emitter among individual
countries. The Renewable Energy is the way forward and the
problems in harvesting it should surmount through policy and
technical approaches s. The prime disadvantage with most of the
Renewable Energy resources is their susceptibility to the whim
and vagaries of nature and becoming a variable random source
of power. Predicting the power from these variable power
sources define and determine the operation of these system. In
this paper ANN- ANFIS based forecast model for predicting the
PV Generation and Wind energy generation is presented. The
designed forecast model is trained using historical data. The
results of the proposed model are validated and compared by
considering data sets from two power generating stations. The
proposed model is designed using MATLAB and is presented in
the form of a Graphical User Interface (GUI).
Index Terms-Forecasting, Photovoltaic, Wind Energy, Artificial
Neural Network, Adaptive Neuro Fuzzy Inference System
I.INTRODUCTION
Energy is critical, directly or indirectly, in the entire process
of evolution, growth and survival of all living beings and it
plays a vital role in the socioeconomic development and
human welfare of a country. Energy has come to be known as
a strategic commodity’ and any uncertainty about its supply
can threaten the functioning of the economy, particularly in
developing economies. Achieving energy security in this
strategic sense is of fundamental importance not only to
India’s economic growth but also for the human development
objectives that aim at the alleviation of poverty,
unemployment and meeting the Millennium Development
Goals (MDGs) [1].
In response to present scenario of energy consumption,
India is gradually shifting the focus towards its renewable
energy resources. The launch of Jawaharlal Nehru National
Solar Mission (JNNSM) has created a lot of interest in the
India solar sector. To create demand and attract investment in
the sector, the government is providing various incentives.
India’s solar PV market has grown by 75% in 2010 and
50% in 2011. India has huge potential for solar PV and with
the right policy support from the Indian Government; India
can become a major player in the solar market globally. One
of the main features of the Mission is to make India a global
leader in solar energy and the mission envisages an installed
Manuscript received March 18, 2016; revised April 7, 2016.
The authors are with the Department of Electrical and Electronics
Engineering,, Jawaharlal Nehru Technological University Hyderabad,
Telangana 500085, India(e-mail: [email protected];
solar generation capacity of 20 GW by 2022. This could in
fact be much larger due to private initiatives [2]. India is
endowed with rich solar energy resources. Because of its
location between the Tropic of Cancer and the Equator, India
has an average annual temperature that ranges from 250C –
27.50C. Being a tropical country, India has huge potential for
solar power generation. The average intensity of solar
radiation received in India is 200 MW/km2 with 250–300
sunny days in a year. As per government estimates, India
receives 5,000tn kWh per year, with most parts of the country
receiving 4-7 kWh per square meter per day [3].
Wind energy is the kinetic energy associated with
movement of large masses of air. Wind energy has been the
fastest growing renewable energy sector in the country. Along
with good sunshine hours India is blessed with 7517 km of
coastline and its territorial waters extend up to 12 nautical
miles into the sea. India is the 3rd largest annual wind power
market in the world and provides great business opportunities
for both domestic and foreign investors. India is a prevailing
market for the wind industry and Indian wind sector
representing annual growth in 2.1GWof new installations. The
global wind markets grew by an average 28% per year in
terms of total installed capacity during the last decade.
According to IEA projection India will needed 327 GW power
generation capacity in 2020.Wind power would then produce
close to 81 TWh every year by 2020 and 174 TWh by 2030.
Research and development activities are being undertaken
through research institutions, national laboratories, universities
and industry for the development of cost effective
technologies and systems to improve the quality of power
generation from wind Grid parity is also implemented in wind
power where it depends on the wind quality and distribution
factor. Forecasting the output power of these renewable
resources is a significant problem for electric power
departments to adjust dispatch planning in time, boost the
reliability of electric system operation and the connection
level of renewable power plants and reduce spinning the
reserve capacity of generation systems [4, 5].
The primary disadvantage with wind and solar energy
resources is that they are unpredictable which limit their
capacity to act as primary energy sources. An alternative is to
combine one or more renewable energy sources to form a
hybrid system. The complimentary behavior of wind and solar
power sources can be used to design a reliable hybrid energy
system. In the past few years; PV power forecasting has been
widely studied. Short-term power prediction methods for PV
power plants mainly include two categories: physical methods
and statistical methods. Physical methods mean that a physical
equation is established for forecasting according to the PV
power generation process and system characteristics and in
combination with forecast weather data [6, 7]. Statistical
Proceedings of the World Congress on Engineering 2016 Vol I WCE 2016, June 29 - July 1, 2016, London, U.K.
ISBN: 978-988-19253-0-5 ISSN: 2078-0958 (Print); ISSN: 2078-0966 (Online)
WCE 2016

methods aim to summarize inherent laws to forecast the output
power of PV power plants based on historical power data [8,
9, 10, 11, 12, 13, 14]. The above methods have their respective
advantages, but the non-stationary characteristics of PV power
output have an important influence on the convergence and
properties of the above methods. Since solar irradiance
received at a site on the Earth’s surface shows periodicity and
non-stationary characteristics due to the influence of Earth’s
rotation and revolution, output power data of PV plants shows
one day periodicity. In other words, the power output presents
a rising trend before noon, and presents a declining trend after
noon. If an effective method to reduce the non-stationary
characteristics of PV output power is not adopted,
conventional power prediction methods cannot guarantee the
precision of forecasting results, or even the convergence of the
method [15]. Relevant research has achieved good results in
wind power prediction [16].
Artificial neural network (ANN) has been viewed as a
convenient way to forecast solar radiation intensity and power
output of PV system, which can be trained to overcome the
limitations of traditional methods to solve complex problems,
and to solve difficult problems which are hard to model and
analyze [15]. In this work a comprehensive model to predict
the solar power output and output of a wind energy systems
based on historical data is presented. The work explores the
option of using prediction methods based on Artificial Neural
Networks (ANN) and an Adaptive Neuro-Fuzzy Inference
System (ANFIS) for predicting the power output.
II. DETERMINATION OF INPUT VARIABLES FOR
THE POWER FORECASTING MODEL
Generally, sufficiently accurate solar irradiance data can be
input into a formula to derive predicted output power.
Predicting power output from renewable energies is closely
related to weather forecast predictions. To predict the amount
of solar irradiance or power generated, various environmental
factors, such as solar irradiance, cloud cover, atmospheric
pressure, and temperature, along with the conversion
efficiency of PV panels, installation angles, dust on a PV
panel, and other random factors must be considered. All these
factors affect PV system output. Hence, in choosing input
variables for a prediction model, one should consider
deterministic factors strongly correlated with power
generation. Additionally, time-series data for PV power
generation are strongly auto correlated and therefore these
historical data should be the input data of the forecasting
model. To establish an accurate and reliable output power
prediction model for a PV power plant, it is necessary to
analyze the effect factors for the PV power plant output. In the
physical sense, global solar irradiance received on the ground
is a direct influencing factor on the voltage effect of PV cells.
The Pearson product-moment correlation coefficient, also
known as r, can measure the direction and strength of the
linear relationship between two variables, which is a method
to quantify non-deterministic relationship. The value of
PPMCC ranges between -1 to +1, where 1 is total positive
correlation, 0 is no correlation, and − 1 is total negative
correlation. Table I provides the Pearson product-moment
correlation coefficient between PV output and environmental
factors under typical weather conditions.
It can be seen from Table I that the correlation coefficient
between the power output of a PV power generator and solar
irradiance is greater than 0.8, which means they are highly
correlated, while the correlation coefficient between PV power
generation output and temperature is greater than 0.3, which
means these factors are positively and low-level correlated
TABLE I PEARSON PRODUCT-MOMENT CORRELATION COEFFICIENT
BETWEEN PV OUTPUT AND ENVIRONMENTAL FACTORS
Weather
Condition
Pearson Product-Moment Correlation Coefficient
Irradiance Temperature Humidity Wind
Speed
Clear 0.966 0.322 -0.527 -0.229
Cloudy 0.891 0.441 -0.511 -0.025
Overcast 0.987 0.409 -0.478 0.125
Rainy 0.923 0.410 0.039 -0.178
The correlation coefficient of humidity indicates a low but
negative correlation. The correlation between PV power
generation output and wind speed is small. Table II provides
the Pearson product-moment correlation coefficient between
wind speed and power output. Pearson correlation of power
and wind speed is 0.816. According to Table II, there is a
high correlation between wind speed and power output.
TABLE II
PEARSON PRODUCT-MOMENT CORRELATION COEFFICIENT
BETWEEN WIND SPEED AND POWER OUTPUT
Wind Condition Pearson Product-Moment Correlation
Coefficient
None 0 -0.09
Low 0.1-0.3
Medium 0.3-0.5
High 0.5-1.0
III.DESCRIPTION OF THE PROPOSED FORECASTING
SYSTEM
In this work, both Artificial Neural Networks (ANN) and
ANFIS (Adaptive Neuro Fuzzy Inference System) have been
employed to forecast power for PV and Wind Energy
Systems. Both the systems are trained using historical data
sets.
An artificial neural network (ANN) includes selection of
inputs, outputs, network topology and weighed connection of
node. Input features will correctly reflect the characteristics of
the problem [18]. Another major work of the ANN design is to
choose network topology. This is done experimentally through
a repeated process to optimize the number of hidden layers
and nodes according to training and prediction accuracy. In
this work 9 Environmental Parameters namely Global
horizontal irradiance, Global diffused irradiance, Ambient
Temperature, Precipitation, Wind Speed, Air pressure, Sun
shine duration, Relative Humidity and Surface Temperature.
Another network is designed by considering 4 inputs like
Global horizontal irradiance; Global diffused irradiance,
Ambient Temperature and Surface Temperature. Similarly to
Proceedings of the World Congress on Engineering 2016 Vol I WCE 2016, June 29 - July 1, 2016, London, U.K.
ISBN: 978-988-19253-0-5 ISSN: 2078-0958 (Print); ISSN: 2078-0966 (Online)
WCE 2016

forecast the wind energy, wind speed and angle of wind
direction relative to the turbine blades are considered as
inputs.
In this work a Feed – Forward Back Propagation network is
used. A TRAINLM training function along with
LEARNGDM adaptive learning function is used of training
and adaptation of the network. MSE is used to compute the
performance measure. The total network comprises of 2 layers
with layer one having 9 neurons and using a TANSIG transfer
function.
Adaptive Neuro-Fuzzy Inference System (ANFIS) is a class of
adaptive networks that is functionally equivalent to fuzzy
inference system. Sugeno type ANFIS [16] uses a hybrid
learning algorithm to identify parameters of Sugeno-type
fuzzy inference system. It applies a combination of the least
squares method and the back propagation gradient descent
method for training FIS membership function parameters to
emulate a given training data set. An ANFIS works [17] by
applying neural learning rules to identify and tune the
parameters and structure of a Fuzzy Inference System (FIS).
There are several features of the ANFIS which enable it to
achieve great success in a wide range of scientific
applications. The attractive features of an ANFIS include: easy
to implement, fast and accurate learning, strong generalization
abilities, excellent explanation facilities through fuzzy rules,
and easy to incorporate both linguistic and numeric knowledge
for problem solving. According to the neuro-fuzzy approach, a
neural network is proposed to implement the fuzzy system, so
that structure and parameter identification of the fuzzy rule
base are accomplished by defining, adapting and optimizing
the topology and the parameters of the corresponding neuro-
fuzzy network. The network can be regarded both as an
adaptive fuzzy inference system with the capability of learning
fuzzy rules from data, and as a connectionist architecture
provided with linguistic meaning.
Global horizontal irradiance; Global diffused
irradiance, Ambient Temperature and Surface Temperature
form the input vectors for the network and similarly to
forecast the wind energy, wind speed and angle of wind
direction relative to the turbine blades are considered as
inputs. In the proposed work both Back propagation and
Hybrid methods of optimization are employed.
IV.DATA SETS USED FOR THE ANALYSIS
In this work 9 environmental parameters namely Global
horizontal irradiance, Global diffused irradiance, Ambient
Temperature, Precipitation, Wind Speed, Air pressure, Sun
shine duration, Relative Humidity and Surface Temperature
are considered as inputs to train the proposed forecast system.
The Data pertains to 10 MW power plants in Kalipi, Andhra
Pradesh, India. The model is scaled down to 10 KW for
simplification of analysis. The Latitude of the site is:
13.99288730 and Longitude is: 77.45872390. The site is
located at an altitude of 548 meters from the mean sea level.
The Data format considered to train the proposed model
comprises of 3960 individual data sets pertaining to hourly
data for 365 days .The data hour is considered from 7 am to 6
pm. Each individual data set comprises 9 data points
pertaining to different parameters being employed in the
forecast system. The sample data set used in the training of
ANN PV forecast model is given in the Table III.
In order to train the forecast for the wind energy system, the
data is obtained from Sotavento Galicia experimental wind
energy farm [19]. The data considered include wind speed and
angle of wind direction relative to the turbine blades.
TABLE III
SAMPLE DATA SET USED IN TRAINING THE ANN FORECAST
MODEL
G_Gh
(Global
Horizontal )
119 76 70 237 78 341 660 345
G_Dh
(Global
Diffused )
75 76 70 227 78 312 350 289
Ambient
Temperature 24.5 24.7 24.7 25.5 25.4 26.3 27.8 28.2
Precipitation 0 0 0 0 0 0 0 0
Wind speed 1.5 0.8 3.3 1.8 1.5 1.8 2 1.3
Air pressure 940 940 940 940 940 940 940 940
Sunshine
Duration 30 1 0 3 0 5 46 10
Relative
Humidity 62 63 68 62 63 59 55 51
Surface
Temp 25.2 24.9 24.8 27.3 25.6 29.1 33.9 31.3
The main technical details of wind system data are as
follows [19]
Number of wind turbines: 24
Technologies present: 5
Different models: 9
Power rating of the wind farm: 17.56 MW
Average annual generation: 33,364 MWh
Prevailing winds: on the east-west axis
Average wind speed at the site: 6.41 m/s
In order simplify the forecast system; again the considered
data of PV generating station is scaled down to 10 KW
systems. A total of 1440 data sets pertaining to hourly
monitoring for a 60 day period are considered to train the
forecast system. The sample data set is given in the Table IV
and Table V summarizes the details about the data base used
in this study. The wind generation is scaled down to 17.56
KW for the simplification analysis.
Table V summarizes the database of PV and Wind
generating stations used in this study for forecasting the PV
and wind energy systems.
TABLE IV
SAMPLE DATA SET USED IN TRAINING THE FORECAST MODEL
FOR WIND ENERGY
Wind
Speed
( m/s) 6.54 9.89 12.68 14.35 10.84 11.43 13.23 15.3 14.65 14.15
Angle
(degrees) 147 150 144 145 150 165 187 207 231 238
Proceedings of the World Congress on Engineering 2016 Vol I WCE 2016, June 29 - July 1, 2016, London, U.K.
ISBN: 978-988-19253-0-5 ISSN: 2078-0958 (Print); ISSN: 2078-0966 (Online)
WCE 2016

TABLE V
DATABASE UTILIZED IN THIS STUDY
V.FORECASTING RESULTS AND DISCUSSIONS
The forecasting tool is designed in the form of a Graphical
User Interface (GUI). The GUI is coded using MATLAB R
2012a and the simulations are run in a Pentium i3 system with
a RAM of 4 GB. The screen shot of the proposed system is
depicted in the figure 1.The proposed GUI has the following
functions
a) It has provision to feed the different environmental factors
related to both the wind energy and the PV cell
b) It has provisions to enter the site data, in terms of latitude,
Fig 1. Graphical User Interface of the proposed system
Longitude, altitude and also the time, day, month and year of
prediction
c) It has a built in clear sky based forecast model to predict the
irradiation for a particular geo location for a specific day and
time.
d) It has two forecast for both ANN and ANFIS
(d1) In the case of ANN : Forecast I is the Forecast arrived at
by considering all 9 environmental factors and Forecast II is
the one arrived at by considering 4 factors like Global
diffused and normal irradiance , ambient temperature and
surface temperature.
TABLE VI
DATA POINTS USED IN THE VALIDATION FOR PV FORECAST
SD1 SD2 SD3 SD4 SD5
G_Gh
( Global
Horizontal )
34 98 532 836 973
G_Dh
( Global
Diffused )
34 52 134 147 101
Ambient
Temperature
28.1 20.5 24.4 29.7 28.3
Precipitation
0 0 0 0 0
Wind speed
1.5 0.2 0.7 4.1 0.3
Air pressure
941 944 944 947 949
Sunshine
Duration
2 17 55 59 60
Relative
Humidity
54 78 63 35 40
Surface Temp
27.9 20.9 29.8 36.1 39
Actual
Generation
Scaled to 10
KW
( KWh)
0.20574 1.175237 5.9933 8.8797 9.9185
(d2) In the case of ANFIS Forecast Iis arrived at by
having Hybrid optimization and Forecast II is arrived by
having Back propagation optimization. The ANFIS system for
solar forecast considers only 4 factors like (Global diffused
and normal irradiance, ambient temperature and surface
temperature)
In order to validate the results of the proposed work, the
forecast is tested against 5 data points for both PV and Wind
energy. The data points being considered for validation are
sampled to represent high, medium and low values of the
parameters being considered in the forecast model.
The data points being considered for analysis of the PV
system is given in the table VI.
Data
Sources
Installed
Capacity
Sampling
Data
Measurement Item Total
number
of data
points
Kalipi Solar
Power
Installation
10 MW
Average
values for
60-minute
(i) PV generation
(ii)Atmospheric
temperature
(iii) Solar irradiance
( Global and Diffused)
(W/m2)
(iv) PV module
temperature
(v) Ambient
temperature
(vi) Wind speed
(vii) Precipitation
(viii) Duration of
sunshine
(ix) Atmospheric
Pressure
71280
Sotavento
Galicia wind
energy farm
17.56
MW
Average
values for
60-minute
(i) Wind generation
(ii) wind speed
(iii) Wind Angle
2880
Proceedings of the World Congress on Engineering 2016 Vol I WCE 2016, June 29 - July 1, 2016, London, U.K.
ISBN: 978-988-19253-0-5 ISSN: 2078-0958 (Print); ISSN: 2078-0966 (Online)
WCE 2016
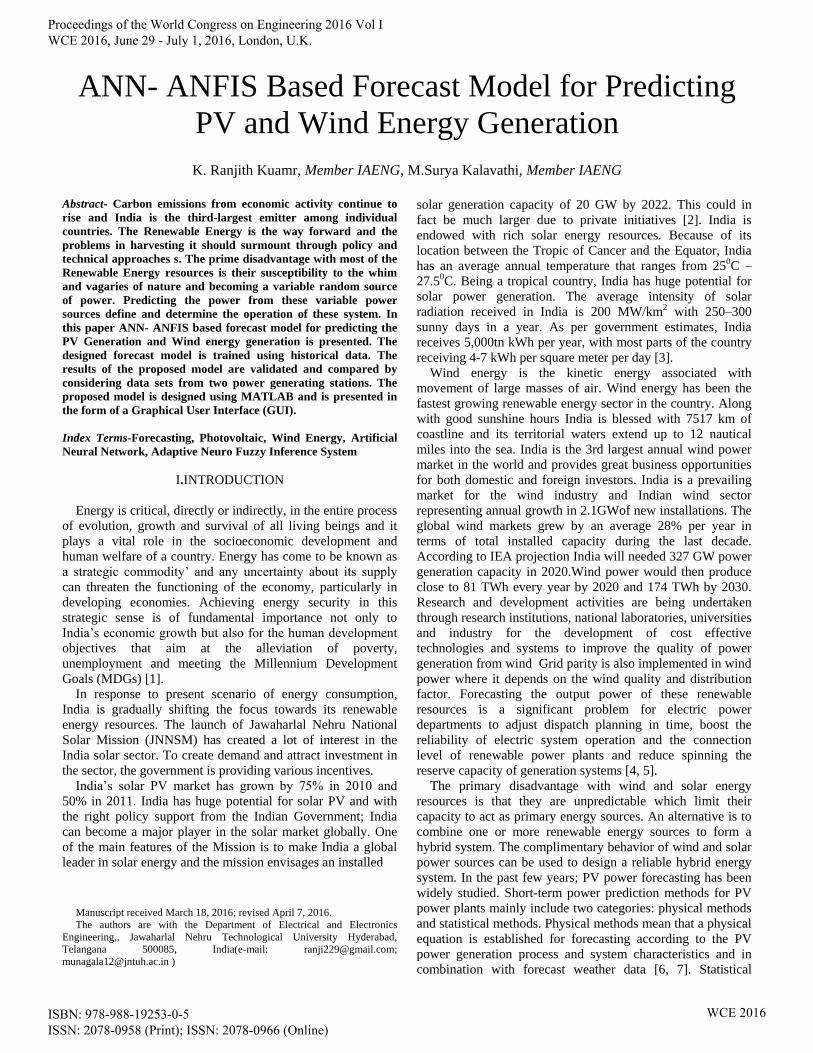
The result of the forecast for the above data set is discussed in
the following section; the results are being described through a
series of tables TABLE VII
FORECAST FOR PV GENERATION BY ANN – FORECAST I
Data Point SD1 SD2 SD3 SD4 SD5
Actual
Value
0.2057
4 1.17524 5.9933 8.8797 9.9185
Predicted
Value
0.3552
1 0.94286 6.106 8.75604 9.84484
% Error -72.649 19.7729 -1.8804 1.39261 0.74265
TABLE VIII
FORECAST FOR PV GENERATION BY ANN – FORECAST II
Data Point SD1 SD2 SD3 SD4 SD5
Actual
Value
0.20574 1.17524 5.9933 8.8797 9.9185
Predicted
Value
0.3688615 0.910558 5.35801 8.58571 10.0603
% Error 79.2853 22.52133 10.6 3.31081 -1.42965
TABLE XI
FORECAST FOR PV GENERATION BY ANFIS – FORECAST I
Data
Point SD1 SD2 SD3 SD4 SD5
Actual
Value
0.20574 1.17524 5.9933 8.8797 9.9185
Predicted
Value
0.364641 0.797184 5.31916 8.08136 10.7236
% Error -77.2339 32.16824 11.24823 8.990619 -8.11715
TABLE X
FORECAST FOR PV GENERATION BY ANFIS – FORECAST II
Data
Point SD1 SD2 SD3 SD4 SD5
Actual
Value
0.20574 1.17524 5.9933 8.8797 9.9185
Predicted
Value
0.37844 0.78824 5.40998 8.10273 10.6893
% Error -83.94 32.929 9.73287 8.74996 -7.7713
From the table VII, table VIII, table XI and table X following
observations can be inferred
a) For very low insolation values all the forecast methods
results in very high error percentage, this can be evident from
the fact the least error percentage is 72.64 % being delivered
by the forecast by ANN Forecast I ( which considers all the 9
parameters for forecast )
b) As there is increase in the insolation values, there is
substantial and appreciable increase in the prediction accuracy
and subsequently a decrease in the error percentage. It can be
observed that the error percentage stands at 19.79 for SD2 as
predicted by ANN Forecast I
c) At higher insolation values the percentage of error
drastically falls and the best forecast being delivered by ANN
Forecast I. It has given a forecast with an error as less as 0
.74265 % for SD5.
d) When the comparison is inferred between different
forecasting methods, between ANN and ANFIS, ANN
delivers better results. In particular the forecast delivered by
ANN Forecast I which considers all the 9 parameters for
forecast is superlative.
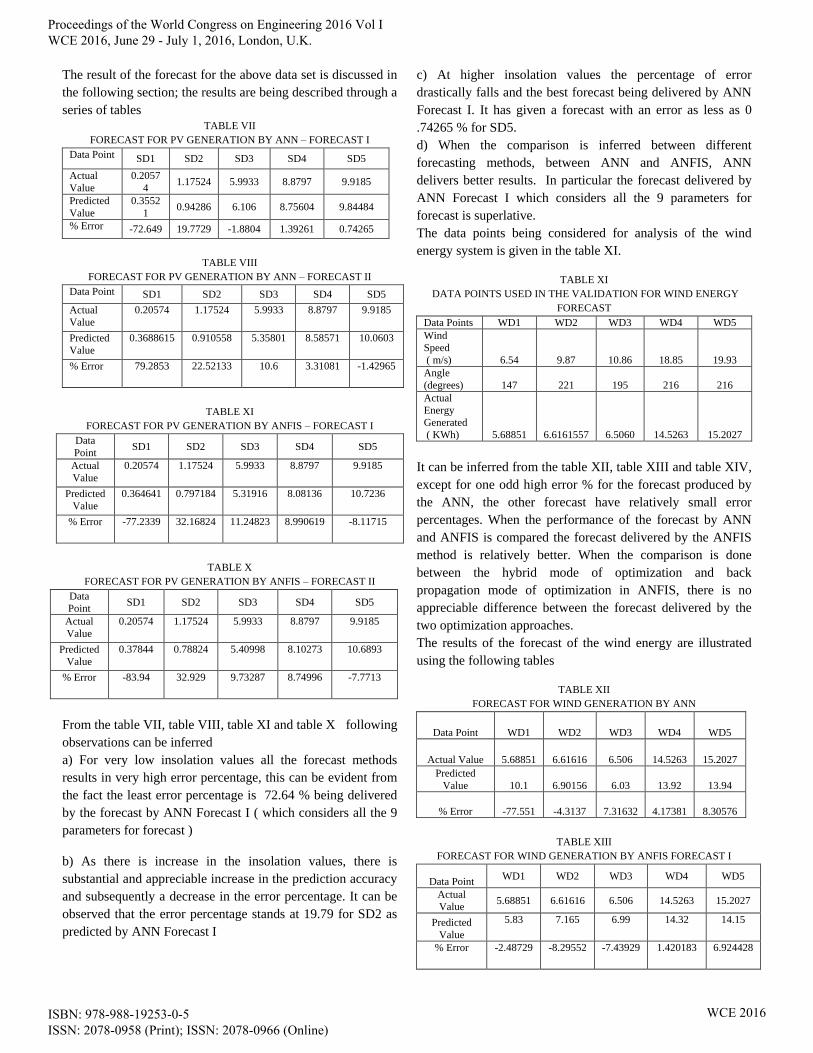
The data points being considered for analysis of the wind
energy system is given in the table XI.
TABLE XI
DATA POINTS USED IN THE VALIDATION FOR WIND ENERGY
FORECAST Data Points WD1 WD2 WD3 WD4 WD5
Wind
Speed
( m/s) 6.54 9.87 10.86 18.85 19.93
Angle
(degrees) 147 221 195 216 216
Actual
Energy
Generated
( KWh) 5.68851 6.6161557 6.5060 14.5263 15.2027
It can be inferred from the table XII, table XIII and table XIV,
except for one odd high error % for the forecast produced by
the ANN, the other forecast have relatively small error
percentages. When the performance of the forecast by ANN
and ANFIS is compared the forecast delivered by the ANFIS
method is relatively better. When the comparison is done
between the hybrid mode of optimization and back
propagation mode of optimization in ANFIS, there is no
appreciable difference between the forecast delivered by the
two optimization approaches.
The results of the forecast of the wind energy are illustrated
using the following tables
TABLE XII
FORECAST FOR WIND GENERATION BY ANN
Data Point WD1 WD2 WD3 WD4 WD5
Actual Value 5.68851 6.61616 6.506 14.5263 15.2027
Predicted
Value 10.1 6.90156 6.03 13.92 13.94
% Error -77.551 -4.3137 7.31632 4.17381 8.30576
TABLE XIII
FORECAST FOR WIND GENERATION BY ANFIS FORECAST I
Data Point WD1 WD2 WD3 WD4 WD5
Actual
Value 5.68851 6.61616 6.506 14.5263 15.2027
Predicted
Value
5.83 7.165 6.99 14.32 14.15
% Error -2.48729 -8.29552 -7.43929 1.420183 6.924428
Proceedings of the World Congress on Engineering 2016 Vol I WCE 2016, June 29 - July 1, 2016, London, U.K.
ISBN: 978-988-19253-0-5 ISSN: 2078-0958 (Print); ISSN: 2078-0966 (Online)
WCE 2016
TABLE XIV
FORECAST FOR WIND GENERATION BY ANFIS FORECAST II
Data Point WD1 WD2 WD3 WD4 WD5
Actual Value 5.68851 6.61616 6.506 14.5263 15.2027
Predicted
Value
5.92 7.163 6.91 14.34 14.18
% Error -4.0694 -8.2653 -6.2097 1.2825 6.72709
There are several evaluation criteria for forecasting models,
such as Mean Absolute Error (MAE), Root Mean Square Error
(RMSE), and others. In this work, the Normalized Root Mean
Square Error (NRMSE) was utilized because it can provide the
comparative analysis for different installed-capacity cases. It
is defined as follows:
𝑁𝑅𝑀𝑆𝐸 = 100 1
𝑁
(𝑃𝑎𝑖−𝑃𝑗
𝑖)2
𝑃𝑖𝑛𝑠𝑡𝑎𝑙𝑙%𝑁
𝑖=1 (1)
Where P install, Pa, Pf, indicate installed capacity, actual power
output, and power forecast value, respectively, and N is the
total number of samples.
VI.CONCLUSION
As the search for clean energy continues to grow, PV and
Wind energy systems will be one of the most important
contributors towards delivering the required energy. In this we
have implemented a forecast method based on ANN and
ANFIS for predicting the output power with help of ANN and
ANFIS models trained using historical data. It can be inferred
from the results that in regard to predicting the PV generation
ANN based forecast delivers better results when compared to
the ANFIS based forecast. On the other hand the ANFIS based
model delivers better result for forecasting the wind
generation. It is also observed that in a hybrid system
involving PV and wind energy different forecast approaches
can be employed to predict the power output from different
sources. The outputs of the forecast models have multiple
applications including serving as inputs for energy
management system for hybrid PV systems.
REFERENCES [1] Annual Report of year 2013 by Central Electricity Authority of
India, Govt. of India, May 2013.
[2] A report on ―Load Generation Balance Report (2014- 15)‖,
Ministry of power, Central Electricity Authority of India, Govt.
of India.
[3] A report on Economic Survey of India, 2014-15
[4] Mandal, P.; Madhira, S.T.S.; haque, A.U.; Meng, J.;Pineda,
R.L. Forecasting power output of solar Photovoltaic system
using wavelet transform an artificial intelligence techniques.
Procedia Comput. Sci.,,2012, 12, 332–337.
[5] Ogliari, E.; Grimaccia, F.; Leva, S.; Mussetta, M. Hybrid
predictive models for accurate forecasting in PV systems.
Energies 2013, 6, 1918–1929.
[6] Lorenz, E.; Scheidsteger, T.; Hurka, J.; Heinemann, D.;Kurz,
C. gional PV power prediction for improved grid
integration.Prog. Photo-volt.2010, 19, 757–771.
[7] Lorenz, E.; Heinemann, D.; Kurz, C. Local and regional
photovoltaic Power prediction for large scale grid integration:
Assessment of a new algorithm for snow detection.
Prog.Photovolt.: Res. Appl. 2012, 20, 760–769.
[8] Karthikeyan, L.; Nagesh Kumar, D. Predictability of
nonstationary timeseries using wavelet and EMD based ARMA
models. J. Hydrol 2013, 502, 103–119.
[9] Mellit, A.; Kalogirou, S.A. Artificial intelligence techniques
for photo-voltaic applications: A review. Prog.Energy
Combust. Sci. 2008, 34, 574–632.
[10] Pedro, H.T.C.; Coimbra, C.F.M. Assessment of
forecastingtechniques for solar power production with no
exogenous inputs. Sol. Energy 2012, 86, 2017–2028.
[11] Voyant, C.; Muselli, M.; Paoli, C.; Nivet, M.‐L.Numerical
weather prediction (NWP) and hybrid ARMA/ANN model to
predict global radiation. Energy2012, 39, 341–355.
[12] Monteiro, C.; Santos, T.; Fernandez‐Jimenez, L.;
Ramirez‐Rosado, I.; Terreros‐Olarte, M. Short‐term power
forecasting model for Photo voltaic plants based on historical
similarity.Energies 2013, 6, 2624–2643.
[13] Mellit, A.; Benghanem, M.; Kalogirou, S.A. An adaptive
wavelet‐network model for forecasting daily total
solar‐radiation. Appl.Energy 2006, 83, 705–722.
[14] Catalão, J.P.S.; Pousinho, H.M.I.; Mendes, V.M.F. Short‐term
wind power forecasting in Portugal by neural networks and
wavelet transform. Renew. Energy 2011, 36, 1245–1251.
[15] Adnan So¨zen, ErolArcakoglu, Mehmet O¨zalp, and Naci C¸
aglar, ―Forecasting based on neural network approach of solar
potential in Turkey,‖ Renewable Energy, vol. 30, pp. 1075-
1090, June 2005
[16] Adaptive Neuro-Fuzzy Systems, Azar, Ahmad Taher, Electrical
Communications & Electronics Systems Engineering
Department, Modern Science and Arts University (MSA),ISBN
978-953-7619-92-3,pp216
[17] Jang, J.S.R..Anfis: Adaptive-network-based fuzzy inference
system. IEEE transaction on System, Man andCybernitics
1993;23(3):665–685.
[18] S. Rajasekaran and G. A. V. Pai, Neural Networks, Fuzzy
Logic and Genetic Algorithms—Synthesis and Applications,
Prentice-Hall Press, New Delhi, India, 2006.
[19] Real Time wind data from Sotavento Galicia, S.A.,
Government of Galicia, 1997.
Proceedings of the World Congress on Engineering 2016 Vol I WCE 2016, June 29 - July 1, 2016, London, U.K.
ISBN: 978-988-19253-0-5 ISSN: 2078-0958 (Print); ISSN: 2078-0966 (Online)
WCE 2016


![Predicting Heart Attack through Explainable Artificial ... · to integrate ANFIS with optimisation algorithms, GA was employed to train ANFIS for diagnosis of heart disease in [6]](https://img.pdfslide.net/doc/110x75/5e3da01e0057bf24146c9052/predicting-heart-attack-through-explainable-artificial-to-integrate-anfis-with.jpg)