Embed Size (px)
Citation preview

The Effect of Amblyopia
on Motor and Psychosocial Skills
in Children
Thesis submitted by
Ann Webber
BAppSc(Optom) MS
A thesis in fulfilment of the requirements
for the degree of Doctor of Philosophy
Faculty of Health, School of Optometry & IHBI
Queensland University of Technology Brisbane, Australia

Thesis Outline
ii
THESIS TABLE OF CONTENTS
PhD Research Supervisors vii
Keywords vii
Abstract viii
List of Publications and/or Manuscripts arising from PhD research xii
List of Tables xiii
List of Figures xv
Abbreviations xvi
Statement of original authorship xvii
Acknowledgments xviii
Chapter 1 INTRODUCTION 1
Chapter 2 LITERATURE REVIEW 8
2.1 Background 8
2.2 Prevalence 10
2.3 Risk Factors for Amblyopia 13
2.4 Natural History 15
2.5 Impact of amblyopia on visual function (psychophysics) 16
2.6 Impact of amblyopia on visual pathways (neural processing) 17
2.7 Amblyopia treatment 19
2.7.1 Refractive correction 20
2.7.2 Correction of abnormal ocular alignment or opacity 21
2.7.3 Occlusion and penalisation 22
2.7.4 Emotional impact of treatment 23
2.7.5 Functional impact of treatment 25

Thesis Outline
iii
2.8 Disability associated with amblyopia 26
2.8.1 Impact of amblyopia on motor skills 30
2.8.2 Impact of amblyopia on eye movements 32
2.8.3 Impact of amblyopia on psychosocial skills 33
2.8.4 Impact of amblyopia on educational outcomes 35
2.9 Summary 36
Chapter 3 GENERAL METHODS 39
3.1 Research Questions 40
3.2 Participants 40
3.2.1 Amblyopic subjects 41
3.2.2 Control subjects 42
3.2.3 Age-matching 43
3.3 Ethical clearance 44
3.4 Test setting 45
3.5 Vision Assessment 46
3.5.1 Visual Acuity 46
3.5.2 Stereoacuity 47
3.6 Fine Motor Skills Assessment 48
3.7 Eye Movements Assessment 53
3.7.1 Developmental Eye Movement Test 53
3.7.2 Visagraph Eye Movement Recording 54
3.8 Self-Esteem Assessment 56
3.8.1 Children from grade 3 school level 56
3.8.2 Children preschool to grade 2 school level 58
3.9 Assessment of Educational Achievement 59
3.10 Statistical Analysis 61
Chapter 4 RESULTS FINE MOTOR SKILLS 62
4.1 Abstract 62
4.2 Introduction 64
4.3 Methods 67
4.3.1 Participants 67
4.3.2 Vision Assessment 68

Thesis Outline
iv
4.3.3 Fine Motor Skills Assessment 68
4.3.4 Statistical Analysis 70
4.4 Results 72
4.4.1 Impact of aetiology 78
4.4.2 Impact of binocularity 78
4.4.3 Determinants of fine motor skills performance 80
4.5 Discussion 81
4.6 Acknowledgements 87
Chapter 5 RESULTS SELF ESTEEM 88
Part A 88
5.1 Abstract 88
5.2 Introduction 90
5.3 Methods 93
5.3.1 Participants 93
5.3.2 Vision assessment 94
5.3.3 Self-esteem assessment 95
5.3.4 Statistical Analysis 97
5.5 Results 98
5.5.1 Sample characteristics 98
5.5.2 Perceived Self-Esteem Scores 100
5.5.3 Impact of aetiology 101
5.5.4 Determinants of social acceptance score within amblyopic
group 102
5.6 Discussion 105
Part B 108
5.7 Abstract 108
5.8 Introduction 109
5.9 Methods 110
5.9.1 Participants 110
5.9.2 Self-Perception Assessment 111
5.10 Results 112
5.11 Discussion 113

Thesis Outline
v
Chapter 6 RESULTS EYE MOVEMENTS 116
Part A 116
6.1 Abstract 116
6 .2 Introduction 118
6.3 Methods 121
6.3.1 Participants 121
6.3.2 Vision Assessment 121
6.3.3 Developmental Eye Movement Test 122
6.3.4 Statistical Analysis 123
6.4 Results 124
6.4.1 Visual determinants of DEM outcome measures. 128
6.4.2 Impact of treatment success 129
6.5 Discussion 130
Part B 135
6.6 Abstract 135
6.7 Introduction 137
6.8 Methods 140
6.8.1 Participants 140
6.8.2 Eye Movements 141
6.8.3 Statistical Analysis 145
6.9 Results 146
6.10 Discussion 149
Chapter 7 RESULTS ACADEMIC SCORES 153
7.1 Abstract 153
7.2 Introduction 155
7.3 Methods 157
7.3.1 Participants 157
7.3.2 Assessment of Educational achievement 157
7.3.3 Statistical Analysis 160
7.4 Results 160
7.4.1 Validation of Internal BSS tests with External QSA
standardised tests 161

Thesis Outline
vi
7.4.2 Vision and BSS educational outcomes 162
7.4.3 Motor Skills and educational outcomes 163
7.5 Discussion 166
Chapter 8 GENERAL DISCUSSION 169
8.1 Introduction 169
8.2 Implications for theory 175
8.3 Implications for public health policy 181
8.4 Implications for Clinical Practice 183
8.5 Limitations and Further Research 185
8.6 Summary 188
REFERENCES 190

Thesis Outline
vii
PhD Research Supervisors
Principal Supervisor Professor Joanne Wood
QUT School of Optometry and IHBI
Associate Supervisor Professor Brian Brown
QUT School of Optometry and IHBI
Associate Supervisor Assoc Professor Glen Gole
Departments of Ophthalmology and Paediatrics/Child
Health, University of Queensland
Keywords
Amblyopia, strabismus, anisometropia, fine motor skills, eye movements,
self-esteem, psychosocial, stereopsis, visual acuity, education

Thesis Outline
viii
Abstract
Background/Aims In an investigation of the functional impact of amblyopia on
children, the fine motor skills, perceived self-esteem and eye movements of
amblyopic children were compared with that of age-matched controls. The influence
of amblyogenic condition or treatment factors that might predict any decrement in
outcome measures was investigated.
The relationship between indirect measures of eye movements that are used clinically
and eye movement characteristics recorded during reading was examined and the
relevance of proficiency in fine motor skills to performance on standardised
educational tests was explored in a sub-group of the control children.
Methods Children with amblyopia (n=82; age 8.2 ± 1.3 years) from differing causes
(infantile esotropia n=17, acquired strabismus n=28, anisometropia n=15, mixed
n=13 and deprivation n=9), and a control group of children (n=106; age 9.5 ± 1.2
years) participated in this study. Measures of visual function included monocular
logMAR visual acuity (VA) and stereopsis assessed with the Randot Preschool
Stereoacuity test, while fine motor skills were measured using the Visual-Motor
Control (VMC) and Upper Limb Speed and Dexterity (ULSD) subtests of the
Brunicks-Oseretsky Test of Motor Proficiency. Perceived self esteem was assessed
for those children from grade 3 school level with the Harter Self Perception Profile
for Children and for those in younger grades (preschool to grade 2) with the Pictorial
Scale of Perceived Competence and Acceptance for Young Children. A clinical
measure of eye movements was made with the Developmental Eye Movement
(DEM) test for those children aged eight years and above. For appropriate case-

Thesis Outline
ix
control comparison of data, the results from amblyopic children were compared with
age-matched sub-samples drawn from the group of children with normal vision who
completed the tests. Eye movements during reading for comprehension were
recorded by the Visagraph infra-red recording system and results of standardised
tests of educational performance were also obtained for a sub-set of the control
group.
Results Amblyopic children (n=82; age 8.2 ± 1.7 years) performed significantly
poorer than age-matched control children (n=37; age 8.3 ± 1.3 years) on 9 of 16 fine
motor skills sub-items and for the overall age-standardised scores for both VMC and
ULSD items (p<0.05); differences were most evident on timed manual dexterity
tasks. The underlying aetiology of amblyopia and level of stereoacuity significantly
affected fine motor skill performance on both items. However, when examined in a
multiple regression model that took into account the inter-correlation between visual
characteristics, poorer fine motor skills performance was only associated with
strabismus (F1,75 = 5.428; p =0. 022), and not with the level of stereoacuity,
refractive error or visual acuity in either eye.
Amblyopic children from grade 3 school level and above (n=47; age 9.2 ± 1.3 years),
particularly those with acquired strabismus, had significantly lower social acceptance
scores than age-matched control children (n=52; age 9.4 ± 0.5 years) (F(5,93) = 3.14; p
= 0.012). However, the scores of the amblyopic children were not significantly
different to controls for other areas related to self-esteem, including scholastic
competence, physical appearance, athletic competence, behavioural conduct and
global self worth. A lower social acceptance score was independently associated with
a history of treatment with patching but not with a history of strabismus or wearing

Thesis Outline
x
glasses. Amblyopic children from pre-school to grade 2 school level (n=29; age = 6.6
± 0.6 years) had similar self-perception scores to their age-matched peers (n=20; age
= 6.4 ± 0.5 years).
There were no significant differences between the amblyopic (n=39; age 9.1 ± 0.9
years) and age-matched control (n = 42; age = 9.3 ± 0.38 years) groups for any of
the DEM outcome measures (Vertical Time, Horizontal Time, Number of Errors
and Ratio (Horizontal time/Vertical time)). Performance on the DEM did not significantly
relate to measures of VA in either eye, level of binocular function, history of
strabismus or refractive error.
Developmental Eye Movement test outcome measures Horizontal Time and
Vertical Time were significantly correlated with reading rates measured by the
Visagraph for both reading for comprehension and naming numbers (r>0.5). Some
moderate correlations were also seen between the DEM Ratio and word reading
rates as recorded by Visagraph (r=0.37).
In children with normal vision, academic scores in mathematics, spelling and reading
were associated with measures of fine motor skills. Strongest effect sizes were seen
with the timed manual dexterity domain, Upper Limb Speed and Dexterity.
Conclusions Amblyopia may have a negative impact on a child’s fine motor skills
and an older child’s sense of acceptance by their peers may be influenced by
treatment that includes eye patching. Clinical measures of eye movements were not
affected in amblyopic children.
A number of the outcome measures of the DEM are associated with objective
recordings of reading rates, supporting its clinical use for identification of children

Thesis Outline
xi
with slower reading rates. In children with normal vision, proficiency on clinical
measures of fine motor skill are associated with outcomes on standardised measures
of educational performance. Scores on timed manual dexterity tasks had the
strongest association with educational performance.
Collectively, the results of this study indicate that, in addition to the reduction in
visual acuity and binocular function that define the condition, amblyopes have
functional impairment in childhood development skills that underlie proficiency in
everyday activities. The study provides support for strategies aimed at early
identification and remediation of amblyopia and the co-morbidities that arise from
abnormal visual neurodevelopment.

Thesis Outline
xii
List of Publications and/or Manuscripts arising from PhD research
Webber AL, Wood JM, Gole GA, Brown B. (2009). “The effect of amblyopia on the
Developmental Eye Movement test in children.” Optom Vis Sci 86(6): 760-66.
Webber AL, Wood JM, Gole GA, Brown B. (2008). “The effect of amblyopia on
self-esteem in children.” Optom Vis Sci 85(11): 1074-1081.
Webber AL, Wood JM, Gole GA, Brown B. (2008). “The effect of amblyopia on
fine motor skills in children.” Invest Ophthalmol Vis Sci 49(2): 594-603.
Webber, AL (2007). "Amblyopia treatment: an evidence-based approach to
maximising treatment outcome." Clin Exp Optom 90(4): 250-257.
Webber, AL and Wood JM (2005). "Amblyopia: prevalence, natural history,
functional effects and treatment." Clin Exp Optom 88(6): 365-375.
ARVO Abstract
Webber AL, Wood JM, Gole GA, Brown B (2007)
“The Effect of Amblyopia on Motor and Psychosocial Skills in Children”
Invest Ophthalmol Vis Sci 48: E-Abstract 4888.

Thesis Outline
xiii
List of Tables
Chapter 2
Table 2.1 Reported prevalence of amblyopia 11
Table 2.2 Visual standards required to enter UK occupations 29
Chapter 3
Table 3.1 Aetiological grouping of amblyopic participants 41
Table 3.2 Number and age of participants in amblyopic and control
groups for the tests employed in the study. 44
Table 3.3 Sub-items comprising Visual-motor control and Upper-limb
Speed and dexterity items of BTOMP 50
Table 3.4 Paired samples test for difference between scorers 52
Chapter 4
Table 4.1 Sub-items comprising Visual-motor control and
Upper-limb speed and dexterity items of BTOMP 71
Table 4.2 Age, gender and vision characteristics of participants 74
Table 4.3 Median (range) for fine motor skills sub-tests for amblyopic
and age-matched control subjects 76
Table 4.4 Mean (standard error) for age standardised fine motor skills
scores for amblyopic and age-matched control subjects 77
Table 4.5 Proportion of sub-groups scoring in above average or
higher ranges on fine motor skills tasks 77
Table 4.6 Fine motor skills scores for stereoscopic groups 78
Table 4.7 Intercorrelations between vision parameters examination
and fine motor skills performance 80
Table 4.8 Multiple linear regression model of fine motor skills
performance in total group 81

Thesis Outline
xiv
Chapter 5
Table 5.1 Participant age, visual acuity and refractive characteristics 99
Table 5.2 Mean (standard deviation) SPPC domain scores 101
Table 5.3 Social acceptance mean (standard deviation) for amblyopic
subgroups and control group 101
Chapter 6
Table 6.1 Age, gender, refractive and vision characteristics of samples 126
Table 6.2 Developmental Eye Movement test outcomes 127
Table 6.3 Number of subjects with DEM scores below 15th percentile 128
Table 6.4 Difference in DEM results between Amblyopic VA groups 129
Table 6.5 Difference in DEM results between Binocular function groups 129
Table 6.6 DEM and Visagraph outcome measures in control children 146
Table 6.7 Pearson correlation co-efficients calculated between DEM and
Visagraph findings 147
Chapter 7
Table 7.1 Summary of vision and fine motor skills results in BSS group 161
Table 7.2 Correlation analysis between BSS measures and
QSA measures of mathematics, reading, spelling 162
Table 7.3 Relationship between age, vision and educational scores 163
Table 7.4 Grade 4 cohort – relationship between Motor skills and
Educational Achievement Scores 163
Table 7.5 Grade 5 cohort – relationship between Motor skills and
Educational Achievement Scores 165

Thesis Outline
xv
List of Figures Chapter 3
Figure 3.1 Research plan 39
Figure 3.2 Schematic of screening/threshold VA protocol employed 46
Figure 3.3 Randot Preschool Stereoacuity Test 47
Figure 3.4 Examples of tasks performed in Upper Limb Speed
and Dexterity domain of BOTMP 49
Figure 3.5 DEM Test Cards A and C 54
Figure 3.6 Visagraph Eye Movement Recording 55
Figure 3.7 Example from Pictorial Questionnaire 58
Chapter 4
Figure 4.1 Proportion of amblyopic and control groups in clinical performance bands 75 Figure 4.2 Visual-motor control standardised score for amblyopia and control groups 79 Figure 4.3 Upper-limb speed and dexterity standardised score for amblyopia and control groups 79
Chapter 5
Figure 5.1 Mean social acceptance subscale scores for amblyopia aetiological subgroups and control children. 102
Chapter 6
Figure 6.1 Visagraph III recording goggles 142
Figure 6.2 Graph of original tracing from which Visagraph measures are derived 143 Figure 6.3 Reporting report generated by Visagraph 145
Figure 6.4 Variation in Visagraph Reading Rate with DEM Horizontal Time 148 Figure 6.5 Variation in Visagraph Numbers Naming Rate with DEM
Horizontal Time 148 Figure 6.6 Variation in Visagraph Reading Rate with DEM Ratio 149
Chapter 7
Figure 7.1 Bi-variate distribution of Mathematics standard score and ULSD standard score in Grade 4 cohort 164 Figure 7.2 Bi-variate distribution of Spelling standard score and ULSD standard score in Grade 5 cohort 165

Thesis Outline
xvi
Abbreviations
VA Visual Acuity
BOTMP Brunicks-Oseretsky Test of Motor Proficiency
ULSD Upper Limb Speed and Dexterity
VMC Visual Motor Control
SPPC Self Perception Profile for Children
PSPCSA Pictorial Scale of Perceived Competence and Social Acceptance for Young Children
DEM Developmental Eye Movement test
QUT Queensland University of Technology
IHBI Institute of Health and Biomedical Innovation
HTA Health Technology Assessment

Thesis Outline
xvii
Statement of original authorship
“The work contained in this thesis has not been previously submitted for a degree or
diploma at any other higher education institution. To the best of my knowledge and
belief the thesis contains no material previously published or written by another
person except where due reference is made.”
Signed:……………………………………..
Date:………………………..

Thesis Outline
xviii
Acknowledgments
My special thanks go to Professor Joanne Wood, Associate Professor Glen Gole and
Professor Brian Brown for their encouragement and support during my PhD candidature
at Queensland University of Technology.
I sincerely thank my husband Brad Gregory for his support and encouragement of
my PhD studies and my practice colleagues for assisting my leave from the practice
for this period of time.
I would like to thank all the participants and their families for their co-operation; the
staff of Dr Gole’s practice and the Administration of Bulimba State School for their
help in recruitment. Thanks to Diana Battisutta, Cameron Hurst and Philippe
Lacherez of IHBI for assistance with biostatistics.
This work was supported by Queensland University of Technology (QUT) and the
Institute of Health and Biomedical Innovation (IHBI).

Introduction Chapter 1
1
Chapter 1 INTRODUCTION
Amblyopia is the most common cause of reduced vision in children and young
people (Robaei et al. 2006b), with significant costs to both the individual and
community in terms of screening and treatment. Amblyopia results from abnormal
development of the visual system and affects approximately three percent of the
adult population (Attebo et al. 1998; Brown et al. 2000). Clinically, amblyopia is
diagnosed when there is a difference in visual acuity (VA) between the eyes of two
lines or more, a pre-disposing amblyogenic condition is present, and there is no
sign of visible ocular or visual pathway disease.
Amblyopia is usually classified according to the underlying cause, which, most
commonly, are strabismus (misalignment of the eyes), anisometropia (significant
difference in refractive error between eyes), or form deprivation (presence of media
opacity such as cataract). These conditions create monocular blur or ocular
misalignment, which if present during the critical period of visual development (up
to about 7 years of age) (Daw 1998), can lead to a loss or rearrangement of neural
connections within the visual cortex (Ciuffreda et al. 1991; Daw 2006).
While much has been reported about the visual characteristics of amblyopia, the
natural history of the condition and appropriate detection and treatment strategies
(Simons 2005), the functional disadvantage of amblyopia has not been fully
explored, particularly in the childhood population in whom amblyopia is most often
diagnosed and treated (Snowden and Stewart-Brown 1997a).
Community funded childhood vision screening programs target the presence of
amblyopia and its risk factors, mainly strabismus or refractive error. These

Introduction Chapter 1
2
screenings have aimed to provide a safety net by identifying children with risk
factors for amblyopia while they are still within the critical period of treatment
efficacy. However, the continued funding of vision screening has been questioned
due to the lack of evidence on the long-term impact of amblyopia, the extent of
disability that amblyopia and strabismus have, and their impact on quality of life
(Snowden and Stewart-Brown 1997a; Carlton et al. 2008).
A 1997 Health Technology Assessment (HTA) review of literature into the
conditions targeted in pre-school vision screening concluded that the literature is
deficient in good quality research into the natural history of these conditions, the
disability associated with them and the efficacy of available treatments (Snowden
and Stewart-Brown 1997a). Following its publication, the HTA’s review
conclusions were much debated in the literature, with criticism that its
recommendations were not objective and that the shortage of data regarding the
effectiveness of amblyopia treatment may result in a premature disassembly of pre-
school vision screening programs (Rahi and Dezateux 1997; Stewart-Brown and
Snowden 1998; Williams et al. 1998). However, a positive outcome of the
publication was that it provided the impetus for a series of well-conducted
randomised control trials particularly pertaining to amblyopia treatment (The
Pediatric Eye Disease Investigator Group 2002a; Clarke et al. 2003; The Pediatric
Eye Disease Investigator Group 2003b; The Pediatric Eye Disease Investigator
Group 2003c; Holmes and Clarke 2006).
While the surge in publications regarding amblyopia treatment has provided
clinicians with good evidence on which to base clinical treatment guidelines (Holmes
and Clarke 2006; Webber 2007), there is still only limited published evidence

Introduction Chapter 1
3
regarding the deficits in functional performance that may occur with abnormal
development of the visual system. A recent population based study of educational,
health and social outcomes, which failed to identify any “real life” functional impact
of the visual deficits associated with amblyopia, highlighted the need for further
research on what it means to be amblyopic (Rahi et al. 2006). A more recent HTA
review of the clinical benefits and cost-effectiveness of screening programs for
amblyopia and strabismus in children up to the age of 4-5 years has again
emphasised the paucity of evidence regarding the functional impact of amblyopia
(Carlton et al. 2008).
While the monocular performance of the amblyopic visual system has been
extensively explored, particularly for threshold measures of sensitivity or acuity in
order to gain an insight to visual neurodevelopment (McKee et al. 2003), there have
been only limited investigations of the performance of amblyopes under habitual
supra-threshold binocular viewing conditions (Grant et al. 2007). In particular, little
has been reported on the impact of amblyopia on the ability to complete activities of
daily living that impact on career opportunities or career choices (Snowden and
Stewart-Brown 1997b). Even though amblyopia is the most common disorder seen
in paediatric ophthalmic practice in industrialised countries, few studies report on the
impact of the condition on tasks relevant to the activities of children (Hrisos et al.
2003), or on tasks pertinent to the activities of amblyopic children and their
educational achievement (Carlton et al. 2008; Engel-Yeger 2008).
The study presented in this thesis aimed to investigate disability attributable to
amblyopia in children and to ascertain the impact of the condition and its treatment
in the childhood population targeted by vision screening programs. It is hoped that

Introduction Chapter 1
4
the results of this study will inform clinicians working with amblyopic children of
the decrements in developmental skills that may arise as an outcome of the
condition or its treatment.
The performance of amblyopic children from a range of aetiologies was compared
to that of age-matched control children with normal visual development on age-
appropriate, standardised tests of motor and psychosocial skills. A standardised
clinical assessment test of fine motor skills was selected to allow comparison of
performance of both the amblyopic and control children to published normative
data and to provide a guide to the clinical significance of motor performance
results. The influence of aetiology and visual factors that might predict any
decrement in motor performance was also explored.
The psychosocial impact of amblyopia was investigated by comparison of
perceived self esteem scores between groups of amblyopic and control children.
Age-appropriate standardised clinical questionnaires were used for measurement of
self-perception scores and the influence of visual and treatment factors for
amblyopia on self-perception scores was examined.
A standardised clinical indirect measure of eye movements was employed to assess
the quality of oculomotor performance in amblyopic and control children aged
from eight years of age. While a more direct recording of eye movements during
reading was considered, recordings proved unreliable through the refractive
correction worn by the majority of the amblyopic children. The outcomes of the
indirect eye movement measure were tested for correlation with direct recordings
of eye movements made during reading in a subset of the control children.

Introduction Chapter 1
5
Outcomes on standardised educational tests were gathered in a subset of the control
children to provide a means of exploring the relationship between motor skills and
academic achievement. Approval to access standardised educational achievement
data of the children who attended a local primary school, Bulimba State School, was
granted by both the school principal and Education Queensland, the Department
responsible for state schools in Queensland. As the children who formed the
amblyopic sample attended many different schools and school districts around
South-East Queensland, it was not within the scope of this study to attain access to
comparable standardised educational data for the amblyopic group.
A number of publications have arisen from this study and form Chapters four to six
in the thesis. The development and writing of these papers was undertaken by the
first author and supported by Joanne Wood, Glen Gole and Brian Brown. The co-
authors have given permission for the papers to be included in this thesis.
The review of the literature provided in Chapter 2 is a summary of research relevant
to the current understanding of amblyopia, including the prevalence and risk factors
for amblyopia, the changes to visual function and underlying neural processing that
occur and recent studies of amblyopia treatment. Current evidence regarding the
functional and psychosocial impact of amblyopia and its treatment are discussed.
Particular attention has been focused on studies that report performance in paediatric
populations.
The specific research questions addressed in this thesis are identified and the
methodology used to provide data to investigate these questions is described in the
general methods chapter, Chapter 3. The chapter is organised around three main

Introduction Chapter 1
6
topics: the participants, the standardised test procedures, and the statistical
analysis.
The results of the investigation of fine motor skills are presented in Chapter 4
(Webber et al. 2008a). The performance of a sample of children with amblyopia
of differing aetiologies on standardised, age-appropriate tests of fine motor skills
performance under habitual binocular conditions was compared with that of an
age-matched control group of children. The influence of patient aetiology and
measured visual characteristics was examined by testing whether these factors were
associated with outcome measures of fine motor skill.
The psychosocial skills assessment results are reported in Chapter 5. Perceived self
esteem was assessed for those children of grade 3 school level and above with the
Harter Self Perception Profile for Children (SPPC) and for those from preschool to
grade 2 school level with the Pictorial Scale of Perceived Competence and
Acceptance for Young Children (PSPCA). The use of different questionnaires for the
age groups made it necessary to consider the data of these age groups separately.
Chapter 5 Part A, reported the self-perception scores of amblyopic and control
children of grade 3 school level and above (aged from eight years). The relationship
between self-perception scores and various subject characteristics suggested by the
literature as likely to have psychosocial impact (history of strabismus, wearing of
glasses, patching regimen and visual acuity deficit) were tested (Webber et al.
2008b). In addition to the published results for the older cohort of children, the self-
esteem of children from preschool to grade 2 (aged from five to eight years) was
compared between amblyopic children and age-matched controls and is presented in
Chapter 5 Part B.

Introduction Chapter 1
7
The performance of amblyopic children on the Developmental Eye Movement
(DEM) test, a commonly used clinical measure of saccadic eye movements, was
compared with that of age-matched controls and is presented in Chapter 6 Part A.
The influence of aetiology and visual characteristics on the outcome measures of the
DEM was also explored (Webber et al. 2009). The correlation between DEM
measures and infra-red recordings of eye movements during reading for
comprehension in a group of children with normal vision is also presented as part of
this chapter that reports on eye movements (Chapter 6 Part B).
The relationship between proficiency in fine motor skills and educational outcomes
was explored by determining the correlations between outcome fine motor skills
scores and standardised measures of numeracy and literacy in a group of children
with normal vision who attended a local primary school. This analysis is presented
in Chapter 7.
The results from all sections of the research completed as part of this thesis are
considered and discussed collectively in terms of addressing the original research
questions and hypotheses in the general discussion chapter (Chapter 8). The
implications of the study findings for clinical practice and health policy are also
discussed, along with the limitations of the present study and suggestions for further
research directions.

Literature Review Chapter 2
8
Chapter 2 LITERATURE REVIEW
2.1 Background
Amblyopia is the consequence of disruption of the normal neurological development
of the visual system and can occur with varying levels of severity. Deprivation of
pattern vision or abnormal binocular interactions during early childhood can cause a
decrease in visual acuity which is primarily unilateral. While amblyopia principally
affects one eye, the non-amblyopic eye often has an array of small but measurable
deficits (Simons 2005). There is no obvious ocular disease underlying the reduced
visual acuity, rather there is some pre-disposing condition that influences the post-
natal neuro-development of the visual system. The most common pre-disposing
conditions for amblyopia are strabismus (causing disruption of binocular vision
development), refractive error (particularly anisometropia or hyperopia), or, more
rarely, media opacification (such as congenital cataracts) causing reduction in image
quality. The relationship between strabismus and amblyopia is complex in that, as
well as being a cause of amblyopia, strabismus and anisometropia can also both arise
as a result of amblyopia (McKee et al. 2003). The visual impact is most severe with
prolonged, early abnormal visual experience. That is, the earlier in post-natal visual
development the predisposing condition presents and the longer the duration of
abnormal visual experience, the worse the amblyopic deficit (Von Noorden 1996).
Binocular vision describes the integration of the images from the two eyes to achieve
a single image. This has a sensory-motor component that describes the co-ordinated
eye movements necessary to align the images from the two eyes, and a sensory

Literature Review Chapter 2
9
component that describes the cortical integration of the two images for resultant
three-dimensional stereoscopic vision. Binocular vision can be degraded in
amblyopia from suppression of the image in the amblyopic eye or abnormal retinal
correspondence (Bloch and Wick 1991; McKee et al. 2003), both of which are
thought to reduce the perception of diplopia that results from ocular misalignment.
Clinically, the level of sensory binocular vision is measured by testing stereoacuity.
Most amblyopes with a history of strabismus have little or no clinically measurable
stereoacuity, even if VA has improved after treatment and no longer meets the
clinical criteria of a two line difference in VA between eyes. In contrast, many
anisometropic amblyopes have some residual stereoacuity that may be as good as the
resolution of the amblyopic eye permits (McKee et al. 2003).
Amblyopia is usually classified according to the presenting visual condition believed
to have caused the impaired visual development. An example of this classification is
that used by Attebo et al. (1998), where amblyopia was identified in their population
cohort as (1) anisometropic, if there was a difference in the spherical or cylindrical
refractive error between the two eyes of one dioptre or more and no strabismus was
present; (2) strabismic, if heterotropia or micro-squint was present without
anisometropia or high refractive error; (3) mixed, if anisometropic amblyopia and
strabismic amblyopia co-existed or (4) stimulus deprivation, if there was some
obstruction to vision during the sensitive period of visual development (this included
high refractive errors) (Attebo et al. 1998).
The term “isoametropic amblyopia” may be used with either unilateral or bilateral
amblyopia secondary to a significant bilateral refractive error. Refractive correction

Literature Review Chapter 2
10
does not immediately correct vision, however, VA usually improves once the
corrective lenses have been worn for a few months (Ciuffreda et al. 1991).
2.2 Prevalence
The reported prevalence of amblyopia varies, due to differences between studies
regarding how amblyopia is defined and the characteristics of the sample (see Table
2.1). For example, studies involving populations attending ophthalmologists’
practices, such as those reported by Irvine and De Roeth (see Table 2.1), are not
representative of the general population and typically report a relatively high
prevalence of amblyopia. Australian adult population-based cohort studies that
aimed to avoid such bias reported the prevalence of amblyopia to be 3.06% (n=4721)
(Brown et al. 2000) and 3.2% (n=3654) when amblyopia was defined as a best
corrected VA of 6/9 or worse (VA ≤0.2 logMAR) (Attebo et al. 1998) in the absence
of pathological causes of reduced vision. If the definition for amblyopia was instead
given as two lines difference in VA, the prevalence amblyopia was reported to be
2.6% (Attebo et al. 1998).
Australian studies of childhood populations have reported that 1.8% of a sample of
6-year old children (n=1741) (Robaei et al. 2006a) and 1.7% of a sample of 12 year
old children (n=2353) (Robaei et al. 2006b) either had amblyopia or had been treated
for amblyopia (defined as VA ≤ 6/12 and at least a two line difference in VA
between eyes).

Literature Review Chapter 2
11
Table 2.1: Reported prevalence of amblyopia
Populations Prevalence (%) Recruited soldiers
1.0 Irvine 1945*1.0 Helveston 1965*1.4 Theodore et al. 1946*1.8 Evens and Kuypers 1967*2.4 Glover and Brewster 1944*3.2 Downing 1945*
Preschool and school-age children0.5 Friedman et al. 1980*1.3 Russell et al. 1961*1.7 DaCunha and Jenkins1961*1.8 Flom and Neumaier 1966*2.7 McNeil 1955*3.1 Frandsen 1960*3.5 Vereecken et al. 1966*3.0 Thompson et al. 19911.1 Williams et al. 2003 ALSPAC– early screening 2.0 Williams et al. 2003 ALSPAC – late screening 1.0 (Eibschitz-Tsimhoni et al. 2000) – early screening2.6 (Eibschitz-Tsimhoni et al. 2000) – late screening
Adult general population 2.9 Vinding et al. 1991*3.1 3.2
Brown et al. 2000Attebo et al. 1998
Ophthalmic patients 4.0 Irvine 1945*4.5 De Roeth 1945*5.3 Cole 1959*
*From Von Noorden 1996 with recent studies added into table (Thompson et al. 1991; Attebo et al.
1998; Brown et al. 2000; Eibschitz-Tsimhoni et al. 2000; Williams et al. 2003)
The proportional distribution of various types of amblyopia also varies between
studies, depending upon the characteristics of the study sample and the definition of
amblyopia used. Attebo et al.’s (1998) Australian adult population study which
defined amblyopia as best corrected VA of ≤ 6/9, reported the main cause of
amblyopia to be anisometropia (50%), with strabismus being the pre-disposing
Literature Review Chapter 2
12
condition in 19%, mixed (both strabismus and anisometropia) in 27% and visual
deprivation in 4% (Attebo et al. 1998). In a cohort of North American children
undergoing treatment for moderate amblyopia (amblyopic VA of 6/12 to 6/30;
n=409; mean age 5.3 years) the causes were found to be strabismus in 38%,
anisometropia in 37%, and mixed in 24% of cases (The Pediatric Eye Disease
Investigator Group 2002b). In children with severe amblyopia (amblyopic VA 6/30
to 6/120; n=175; mean age 4.8 years) the causes were found to be anisometropia in
34%, strabismus in 27% and mixed in 38% of cases (The Pediatric Eye Disease
Investigator Group 2003b). In all studies the prevalence of deprivation amblyopia is
relatively rare, reflective of the low incidence of underlying pathology such as
infantile cataract (2 to 4.5 of every 10 000 births) (Rahi and Dezateux 1999; Holmes
et al. 2003).
The Avon Longitudinal Study of Parents and Children (ALSPAC), a UK population
birth cohort study, reported the prevalence of amblyopia at 7.5 years of age
(Williams et al. 2003). Of 6,081 children, 16.7% had attended preschool vision
screening (age 3-4 years) and all the children had been offered vision screening in
the school reception class (age 4-5 years). The prevalence of amblyopia was
significantly lower in those children who had received preschool screening and
subsequent treatment for an amblyogenic condition compared with those who had
not (1.1% v 2.0%, p=0.05). This finding supports that of an Israeli study which
found a 1% prevalence of amblyopia in 8 year old children previously screened and
treated for amblyopia (n=808), compared with 2.6% in a matched population that had
not received treatment (n=782) (Eibschitz-Tsimhoni et al. 2000).

Literature Review Chapter 2
13
In summary, contemporary population studies of amblyopia indicate a prevalence of
approximately 3% in untreated childhood populations and current adult populations.
With detection and treatment of the amblyogenic condition by five years of age, the
prevalence of clinically significant amblyopia reduces to around 2%. With detection
and treatment before three years of age, the prevalence of clinically significant
amblyopia reduces to around 1% (Eibschitz-Tsimhoni et al. 2000; Williams et al.
2003).
2.3 Risk Factors for Amblyopia
Amblyopia is more than four times more common in premature infants or infants
who are small for gestational dates (Tychsen 1992), or who have a first-degree
relative with amblyopia (Abrahamsson et al. 1999). While it has been observed that
a family history of strabismus is a significant predicting factor, few genetic loci for
strabismus or amblyopia have been identified (Abrahamsson et al. 1999; Michaelides
and Moore 2004).
In infants with neuro-developmental delay the prevalence of amblyopia is six times
greater than in healthy, full-term infants (van Hof-Van Duin et al. 1989; Pike et al.
1994). Patients at most risk for amblyopia are infants who experience early stimulus
deprivation. Visual deprivation prior to three months of age need not be prolonged
to result in the development of amblyopia, and is highly correlated with later
development of sensory nystagmus in bilateral cases and strabismus in both
monocular and bilateral cases (Tychsen 1992).

Literature Review Chapter 2
14
In strabismus, the diplopia caused by misalignment of the visual axes can lead to
binocular rivalry and suppression of input from the non-dominant eye at the level of
the visual cortex. Infantile esotropia (otherwise known as congenital esotropia)
generally presents before six months of age, when the developing visual system can
be most at risk for amblyopia. Maintained or preferred fixation by the dominant eye,
as opposed to freely alternating fixation, (unilateral versus alternating strabismus),
increases the likelihood of amblyopia (Laws et al. 2000). If not corrected early, the
resultant amblyopia can be profound and difficult to reverse. Even in patients who
have had early surgery, with an outcome of good VA in both eyes, stereoacuity may
not recover from the early disruption of binocular vision (McKee et al. 2003).
Refractive error represents a risk for developing amblyopia, either due to the creation
of dissimilar images in anisometropic amblyopia, or as a driving factor for
accommodative esotropia (acquired esotropia). Children identified at screening as at
risk for amblyopia due to hyperopia greater than or equal to 3.5 D in any meridian,
were 13 times more likely to become strabismic and six times more likely to show
measurable acuity deficits by four years of age compared with controls (Atkinson et
al. 1996). Wearing a partial spectacle correction reduced these risk ratios to 4:1 and
2.5:1 respectively and did not interfere with the process of emmetropisation (the
reduction in magnitude of refractive error seen in young children) (Atkinson et al.
1996).
Strabismus, hyperopia and amblyopia are often present in the same children. In their
report of prevalence and risk factors for common vision problems in children at the
age of 7 years (n=7825), the ALSPAC team reported that of 365 children with
hyperopia of at least +2.00 D in either eye, 124 (34%) had clinically significant

Literature Review Chapter 2
15
convergent strabismus and 158 (43.3%) had past or present amblyopia. Overall, 199
(54.5%) children with hyperopia had either strabismus or amblyopia, while 83 (22%)
had both (Williams et al. 2008). The ALSPAC study also considered family social
class and socioeconomic status, parental self-reported hyperopia, history of
strabismus/amblyopia in first-degree relative, maternal smoking during pregnancy,
child’s ethnicity, gestation, birth weight and gender in their analysis of potential risk
factors for hyperopia, strabismus or amblyopia in seven year old children. They
reported that children from the lowest occupational social class background were
1.82 times more likely to be hyperopic than children from the highest social class.
Amblyopia and convergent strabismus also tended to increase as social class
decreased (Williams et al. 2008).
2.4 Natural History
The studies of early treatment intervention regimens allow better understanding of
the natural history of amblyopia. Randomised controlled treatment trials (Clarke et
al. 2003), together with reviews of patients who have not been compliant with
treatment (Simons and Preslan 1999), indicate that amblyopia does not recover
without treatment. Populations that undergo early intervention and treatment have a
lower prevalence of amblyopia than those that do not, implying that amblyopia does
not improve of its own accord (Williams et al. 2003). Intervention is required to
maximise potential VA in the affected eye, however, the age at which that
intervention will still be effective has not been confirmed and is the subject of on-
going studies (The Pediatric Eye Disease Investigator Group 2004; The Pediatric Eye
Disease Investigator Group 2005b).

Literature Review Chapter 2
16
2.5 Impact of amblyopia on visual function (psychophysics)
While amblyopia is usually diagnosed clinically from a difference in VA between the
eyes, other monocular visual functions are also affected, including contrast
sensitivity, vernier acuity, steadiness of fixation, motion perception and temporal
processing (Asper et al. 2000a; McKee et al. 2003). Amblyopia results in marked
losses of contrast sensitivity, particularly at high spatial frequencies (Ciuffreda et al.
1991). Amblyopic eyes can have decreased accommodative amplitude and increased
accommodative lag (Asper et al. 2000a), and can display oculomotor deficits
including inaccurate or unsteady fixation and inaccurate tracking pursuits; the
tracking pursuits of the non-amblyopic eye can also be less accurate than in age-
matched controls (Bedell et al. 1985).
Binocular vision, the cortical fusion of images arising from the two eyes necessary
for fine levels of stereoacuity, is commonly disrupted in amblyopia, although the
findings of a recent study suggest that binocular summation and inter-ocular
suppression are present in strabismic amblyopia (Baker et al. 2008). In their study of
427 adults with amblyopia or with risk factors for amblyopia, McKee et al. (2003)
reported that while only about ten percent of subjects with strabismus or both
strabismus and anisometropia passed both of their tests of binocular vision
(stereoacuity and binocular motion integration), nearly two thirds (64%) of subjects
with anisometropia alone passed both tests of binocular vision (McKee et al. 2003).
The existence of multiple neural mechanisms underlying different visual functions is
suggested by evidence of variation in the rates at which a particular visual function
develops (Skoczenski and Norcia 2002). In the normal visual system, pattern
detection and resolution (acuity measures) and position discrimination measures

Literature Review Chapter 2
17
(vernier acuity) mature at different rates; grating acuity reaches its adult-level at
around six years of age, whereas vernier acuity shows an increasing phase after six
years of age that lasts until ten to 14 years of age (Skoczenski and Norcia 2002).
Visual-motor hand-eye co-ordination skills also mature over the period extending
through infancy, beyond the critical period for amblyopia, until around 12 years of
age (Grant et al. 2007).
The emphasis of psychophysical studies of amblyopia has been to explore the spatial,
temporal and oculomotor characteristics of the abnormally developed visual system
to gain an understanding of visual neurodevelopment. However, these studies do not
necessarily provide a full representation of the impact of amblyopia on visually
directed tasks in everyday circumstances. In normal everyday vision, stimuli have
contrast levels well above the threshold levels reported in psychophysical studies.
Functionally, it is important to investigate the extent to which the impairment of
amblyopia influences performance under habitual supra-threshold conditions.
2.6 Impact of amblyopia on visual pathways (neural processing)
Studies of the neurophysiology of the visual pathways of amblyopes indicate that the
most profound and consistent effects of amblyopia are at the striate cortex, with the
pattern of changes in cortical neurophysiology dependant on the cause of amblyopia
(Ciuffreda et al. 1991). A loss of binocularly driven neurons is found when
amblyopia results from strabismus, while a loss of neurons driven by the deprived
eye is found in animals with amblyopia created by occlusion of one eye (Ciuffreda et
al. 1991). A selective loss of neurons tuned to higher spatial frequencies is found in
animal models of anisometropia (Movshon et al. 1987). Human psychophysical

Literature Review Chapter 2
18
studies have also determined that the pattern of visual function characteristics varies
between those with a history of blur (anisometropia and form deprivation) and those
with a history of ocular misalignment (strabismus) (McKee et al. 2003)
Anatomical and functional studies indicate the presence of parallel visual pathways
leading to the visual cortex via the lateral geniculate nucleus (LGN), known as the
magnocelluar (M) and parvocellular (P) pathways, and concurrent visual streams, the
dorsal parietal and the ventral temporal pathways, have also been described beyond
the striate visual cortex (Asper et al. 2000b). The dorsal stream is dominated by the
M-type pathway, with some input from the P-type pathway. The dorsal pathway is
primarily involved with perception of motion, depth, control of eye movements and
localisation of targets in space (Asper et al. 2000b). The ventral pathway extends
from the primary visual cortex to the inferior temporal cortex (IT) of the temporal
lobe and has input from both M and P-type cells. The ventral pathway is mainly
involved in the identification of pattern, resolution of fine detail and colour
perception (Asper et al. 2000b). However, the division into parallel visual pathways
may not be clear cut with evidence accumulating both of convergence of the M and P
inputs and of functional interactions between the neural mechanisms involved in the
processing of shape (ventral) and motion (dorsal) information about objects
(Simmers et al. 2005).
Contemporary animal studies, psychophysical and human neuro-imaging studies
suggest that deficits may exist beyond the striate cortex in the amblyopic visual
system (Barnes et al. 2004), particularly in extra-striate pathways that predominantly
process motion information (Simmers et al. 2005). While changes to extra-striate
pathways are reported (Barnes et al. 2004; Simmers et al. 2005), the extent of

Literature Review Chapter 2
19
alterations to neural connections beyond the striate cortex in amblyopia is yet to be
fully explored.
Controversy regarding the neurophysiological site of the visual deficit occurring in
amblyopia has arisen from conflicting results in electrophysiological studies (Hess
2001). While it has been suggested that some visual dysfunction in amblyopia may
exist at the retinal level, the balance of evidence still suggests that the primary site of
the deficit associated with amblyopia is at the visual cortex (Hess 2001; Westheimer
2004).
The functional impact of the neurological changes in the amblyopic visual system on
visual-motor processing, and how that may affect the performance of visually
directed tasks under habitual binocular viewing conditions, has not been established.
The differences between strabismic and anisometropic amblyopia in the patterns of
monocular and binocular visual loss suggest two distinct developmental anomalies
(Tolchin and Lederman 1977; Bloch and Wick 1991; McKee et al. 2003). If the
neurophysiological changes that occur in amblyopia are different as a result of
monocular blur versus oculo-motor misalignment, then we might expect differences
in functional ability between amblyopes of differing aetiologies.
2.7 Amblyopia treatment
Amblyopia treatment usually entails correction of the underlying pre-disposing
condition followed by a period of deprivation or penalisation of the dominant eye to
promote maximum visual experience for the amblyopic eye. Some conditions that
cause amblyopia, such as infantile esotropia, present very early in life and are
Literature Review Chapter 2
20
therefore treated early in life, while other acquired strabismic conditions may not
manifest until later in early childhood. Differences between aetiological groups also
exist in treatment regimens, in that some amblyopic children will require surgery for
strabismus or media opacity, while others have refractive correction for
accommodative strabismus or anisometropia. Some children will undergo patching
for up to six months while others with greater depth of amblyopia, as is often the
case with deprivation amblyopia, may continue with patching for more prolonged
periods.
A number of multi-centre randomised controlled treatment trials of amblyopia
treatment have been conducted over the last decade by the Pediatric Eye Disease
Investigator Group (PEDIG) (Holmes and Clarke 2006). Together with trials that
have monitored the dose of occlusion received (Stewart et al. 2005), the PEDIG
studies demonstrate that the younger the child when treatment commences, the more
rapid the response to treatment and the better the visual outcome. However, the
upper age limit at which improvements in VA can be achieved is yet to be
established, with reports of improvement with treatment or after loss of the non-
amblyopic eye even into adulthood (Klaeger-Manzanell et al. 1994; Mohan et al.
2004; The Pediatric Eye Disease Investigator Group 2008b).
2.7.1 Refractive correction
It is well established that correction of any underlying refractive error is critical in
amblyopia treatment (Bloch and Wick 1991). However, it is only more recently that
the extent to which the correction of refractive error alone might reduce amblyopia
has been explored (Moseley et al. 2002; Stewart et al. 2004a; The Pediatric Eye

Literature Review Chapter 2
21
Disease Investigator Group 2006; Cotter et al. 2007). Correction of refractive error
alone for a period of 18 weeks resulted in significant improvements in VA of the
amblyopic eye in newly diagnosed amblyopic children (n=65; mean age 5.1 years)
(mean improvement of 0.24 logMAR). This improvement did not differ significantly
as a function of the type of amblyopia, or the age of the patient (Stewart et al.
2004a). Refractive adaptation prior to commencement of occlusion or penalisation
therapy may have significant benefits, including improved VA during occlusion
which may assist compliance and, in some cases, unnecessary patching can be
avoided (Stewart et al. 2004b; The Pediatric Eye Disease Investigator Group 2006;
Stewart et al. 2007). Refractive correction is now considered a distinct component of
amblyopia treatment and it is recommended that the benefit of refractive correction
be fully realised before commencing occlusion or penalisation treatment (Holmes
and Clarke 2006).
2.7.2 Correction of abnormal ocular alignment or opacity
It has been conservatively estimated that 17% of patients with amblyopia will
undergo alignment surgery, 1.5% will require cataract extraction and 1.5% will
require ptosis surgery (Membreno et al. 2002). While population-based studies
addressing the distribution and incidence of each type of strabismic amblyopia are
not available, a cost-utility analysis study estimated from case series and anecdotal
experience that approximately 60-75% of strabismic amblyopes are accommodative,
with 60% of patients with accommodative esotropia not fully correctable with
spectacles and requiring surgery for ocular alignment (Membreno et al. 2002). The
subgroup of strabismus patients with amblyopia who would require alignment

Literature Review Chapter 2
22
surgery was estimated to be between 48% and 62% of all amblyopic patients with
strabismus (Membreno et al. 2002).
2.7.3 Occlusion and penalisation
The mainstay of treatment for amblyopia for the last 250 years has been occlusion of
the better eye by an opaque patch (patching). However, therapeutic regimens have
lacked standardisation, with the length of patching ranging from a few minutes a day
to all waking hours, and in some cases treatment may last many months or even
years. Recent studies that have investigated the relative merits of patching and
atropine penalisation have commented on the considerable variation in treatment
practices between eye care practitioners with regard to the number of hours of initial
patching prescribed (The Pediatric Eye Disease Investigator Group 2002b). PEDIG
(2002b) reported that, while the number of hours of patching prescribed had no
relationship to patient age, it was related to the VA in the amblyopic eye (i.e. depth
of amblyopia).
While randomised controlled treatment trials have shown patching and atropine
penalisation therapy to be successful in treating amblyopia in children younger than
seven years (The Pediatric Eye Disease Investigator Group 2002a; The Pediatric Eye
Disease Investigator Group 2002b; Stewart et al. 2004b), the question of the upper
age limit for successfully treating amblyopia has still not been fully addressed.
Preliminary treatment studies in children older than seven years have indicated that
VA can be improved in these older children and adolescents (The Pediatric Eye
Disease Investigator Group 2004; The Pediatric Eye Disease Investigator Group
2008b). While a preliminary study found an average of one extra logMAR line of
Literature Review Chapter 2
23
improvement when the patient performed near activities during occlusion or
penalisation (The Pediatric Eye Disease Investigator Group 2005a), the benefits of
active versus passive therapy during patching were not confirmed by randomised
controlled treatment trial (The Pediatric Eye Disease Investigator Group 2008a).
2.7.4 Emotional impact of treatment
Amblyopia treatment may create negative behaviour changes in children and have an
impact on family life (The Pediatric Eye Disease Investigator Group 2003a; Choong
et al. 2004; Hrisos et al. 2004). Parents of children undergoing patching for
amblyopia report distress or an increase in conflict at home, even for relatively short
periods of patching, which most parents linked with a decrease in child’s confidence
from poor vision under occlusion conditions (Searle et al. 2000). These behaviour
changes appear to be more profound in children with a greater level of amblyopia.
What has not been established is whether these behavioural changes are due to
greater visual impairment under penalised conditions in children with worse
amblyopia, or, due to the longer duration of penalisation treatment that tends to be
prescribed in those with worse amblyopia. Even though not all parents report that
their child’s activities are affected, the degree of compliance with treatment and
observations of changes in patterns of behaviour has been found to depend on the
level of amblyopia (Parkes 2001). The behaviour of the child during treatment
influences compliance, which raises the possibility that the efficacy of treatment
could be reduced by poor compliance in those children with the greatest need
(Simons et al. 1997).

Literature Review Chapter 2
24
Children prescribed patching were found to be more upset and showed more
resistance to their treatment than those prescribed glasses alone (Hrisos et al. 2004).
However, in congenital monocular cataract patients (n=22) who had their better eye
patched for a significant percentage of their early childhood years, no significant
evidence of developmental delay or increased behavioural problems were found
when compared to their siblings who had normal visual development (Smith et al.
1991).
More recent studies have found that most children report feeling self-conscious and
ashamed during amblyopia treatment, particularly due to patching or wearing
glasses, and that it was the responses of their peers that most influenced their feelings
of embarrassment (Koklanis et al. 2006). Children currently wearing glasses or with
a history of wearing eye patches are also approximately 35% more likely to be
victims of physical or verbal bullying (Horwood et al. 2005; Koklanis and
Georgievski 2007).
Reports regarding the impact of patching on parental distress or stress levels,
however, vary. Hrisos et al. (2004) report that many parents experienced difficulty
with patching and were more likely to be upset by this treatment than parents whose
children were treated with glasses alone, although, the levels of distress and
difficulty reported by parents were quite low (Hrisos et al. 2004). Conversely,
Choong et al. (2004) found that carers of children undergoing patching did not
experience significantly more stress or perceive their child as exhibiting less
psychosocial wellbeing than carers of children who were not patched. In addition,
carers’ stress level and child’s psychosocial well-being within the patched group did
not change significantly following the onset of occlusion therapy (Choong et al.

Literature Review Chapter 2
25
2004). PEDIG report that although results on their Amblyopia Treatment Index
questionnaire indicated that both patching and atropine treatments were well
tolerated by the child and family, atropine received more favourable scores overall,
and for all three questionnaire subscales (adverse effects of treatment; difficulty with
compliance; social stigma) (The Pediatric Eye Disease Investigator Group 2003a).
While these studies have examined the psychosocial impact of amblyopia treatment
on treated children and their families, they have involved a number of shortcomings,
including the use of specifically developed questionnaires, for which normative data
were not available for comparison, and failure to address psychosocial issues that
may extend beyond the treatment period.
2.7.5 Functional impact of treatment
The ability to perform everyday tasks while undertaking amblyopia treatment has not
been documented in children with amblyopia, even though this is often cited as the
reason for poor compliance with occlusion or penalisation (Hiscox et al. 1992;
Simons et al. 1997). During patching all input from the affected eye is blocked,
thereby reducing field of vision, eliminating residual stereoacuity, and limiting VA to
that of the amblyopic eye, while with atropine treatment the child may experience
significant glare from the dilated pupil (Holmes and Clarke 2006). However, there is
a lack of studies specifically investigating functional disability during treatment from
reduced VA and reduction in binocular input on tasks of importance to children.

Literature Review Chapter 2
26
2.8 Disability associated with amblyopia
Evidence based reviews of the literature regarding amblyopia and its treatment
have highlighted the lack of evidence on the long-term impact of amblyopia, the
extent of disability that amblyopia and strabismus produce and their impact on
quality of life. In particular, measures of how the condition or its treatment affect
ability to perform tasks of daily living or psychological well-being have not been
reported (Snowden and Stewart-Brown 1997a; Carlton et al. 2008).
Approximately two-thirds of parents of amblyopic children were reported to express
concerns regarding the disability associated with amblyopia (Campbell and Charney
1991). Parents of children with an earlier diagnosis of amblyopia (before the age of
five years) were more likely to consider amblyopia a very serious problem than
parents of children with a later diagnosis, even though parents of children with later
diagnoses more frequently reported that their child had problems attributed to
amblyopia. Problems reported by the parents of children with amblyopia were
typically those of school performance rather than related to social or athletic
activities (Campbell and Charney 1991). These findings contradict those of
Snowdon and Stewart-Brown (1997b) who conducted semi-structured interviews
with a small number of parents of children with amblyopia (n=11). These parents did
not regard amblyopia as a disabling condition, with little impact on career choice or
motor function. The overall conclusions of the study were that treatment of
amblyopia by patching may result in more disabling outcomes than the condition
itself. However, the study conclusions are limited by the small sample size, and the
lack of information provided regarding VA, stereopsis or aetiology of the amblyopic
children and the absence of a control group (Snowden and Stewart-Brown 1997b).
Literature Review Chapter 2
27
There is little data pertaining to the negative impact of amblyopia from a population
perspective. Chua and Mitchell (2004) examined the consequences of amblyopia for
education, occupation and long-term vision loss and reported that amblyopia did not
affect lifetime occupational class, although relatively few amblyopes obtained
university degrees (Chua and Mitchell 2004). In their population based study of the
educational, health and social outcomes of a 1958 birth cohort (n=8861), Rahi et al.
(2006) reported that children with amblyopia did as well as their peers in age
appropriate tests of mathematics, reading, comprehension, and perceptual and motor
skills at ages 7, 11 and 16 years. They showed that children with amblyopia were
generally not more likely to have significant behavioural problems or maladjustment
at home or school than those without amblyopia. However, amblyopes with a
moderate to severe VA deficit were significantly more likely to report having had a
road accident when they were the driver that resulted in injury requiring hospital
care. This study highlighted the need for further research from a patient perspective
on what it means to be amblyopic (Rahi et al. 2006).
Utility measures are preference-based estimates of health-related quality of life, and
are increasingly being used in economic evaluations of healthcare interventions.
Good vision in both eyes provided a substantial improvement in utility value, a
patient’s perception of quality of life, as compared with good vision in only one eye
(Membreno et al. 2002; Konig and Barry 2004). Patient feedback indicates that the
psychological stress of having only one good seeing eye to rely on and the
apprehension resulting from the knowledge that many eye diseases eventually affect
both eyes, is likely to play a major role in decreasing an individual’s quality of life
(Brown et al. 2001). In a cost-utility reference-case analysis, treatment for

Literature Review Chapter 2
28
amblyopia resulted in a gain of between $US 2053 and $US 2509 per quality-
adjusted life-year (Membreno et al. 2002).
The potential visual disability due to loss of visual function of the non-amblyopic eye
can be calculated and is an argument for amblyopia treatment to maximise visual
potential in each eye. A UK study found that of 102 employed people with
amblyopia who lost vision in their better eye, only 36 were able to continue in paid
employment due to the subsequent vision impairment, and patients with amblyopia
have a projected lifetime risk of vision impairment following loss of the fellow eye
of at least 1.2% (Rahi et al. 2002). Based upon a population based cohort of subjects
aged 55 years or over (n=5220) of whom 192 (3.7%) were amblyopic, van Leeuwen
et al. (2007) reported that amblyopia nearly doubles the lifetime risk of bilateral
vision impairment.
Poor VA in the worst eye can impact on ability to achieve the minimum visual
standard required for some career choices and a commercial driver’s licence. Patients
with amblyopia are excluded from a wide range of jobs, which increases with the
severity of the amblyopia (Adams and Karas 1999). Table 2.2 reports a summary of
occupations that would not be possible for those with poor VA in one eye.

Literature Review Chapter 2
29
Table 2.2: Visual standards required to enter UK occupations (Adams and Karas
1999).
Visual Acuity in worse eye with correction Job excluded
< 6/60 Merchant Navy (engine room, radio staff, catering department, surgeon)
6/60 All army regiments 6/36 All Royal Naval duties
6/18
Large goods vehicle driver Bus driver Post Office driver Metropolitan cab driver Private pilot Train driver London Transport line duties Fork lift truck driver Police Prison officer
6/12
Commercial pilot Flight navigator Flight engineer Air traffic control officer All non-flying Royal Air Force personnel Merchant seaman (deck duties) Life boat crew
6/9
Royal Air Force pilot Royal Air Force navigator Royal Air Force aircrew Fire Brigade Army regiments where minimum 6/6 in each eye is specified Royal Navy aircrew and certain branches of Royal Marines
The ability to appreciate the depth of one object relative to another is often required
for efficient and safe job performance. While the monocular cues to depth (e.g.
overlay, motion parallax, and atmospheric haze) are often all that are required, when
precise judgment of relative depth is essential to job performance there may be
justification for a binocular vision (i.e., stereopsis) requirement. Examples of

Literature Review Chapter 2
30
occupations in which stereopsis may be required include crane and forklift operators.
A demonstration of a moderate degree of stereopsis (i.e., 80 arc seconds) has been
suggested as a binocular vision standard for occupational safety (Good et al. 1996).
The benefit of an improvement in visual ability in the amblyopic eye can also be
quantified by quality of life scores and can result in positive cost-analysis of
treatment (Membreno et al. 2002; Konig and Barry 2004).
2.8.1 Impact of amblyopia on motor skills
Many amblyopes have little or no stereopsis, the functional significance of which has
rarely been reported (Fielder and Moseley 1996). Most studies that have investigated
the benefit of binocular vision have compared performance under monocular and
binocular conditions (Jones and Lee 1981; Joy et al. 2001), and have generally
concluded that stereoscopic binocular vision facilitates control of manipulation,
reaching and balance (Jones and Lee 1981). People who lack stereopsis are found to
have difficulty performing tasks which rely on three dimensional visual cues,
however, there are many individuals who perform well on tests of manual dexterity
even though their stereopsis is poor (Murdoch et al. 1991). In a study of reaching
and grasping deficits, adults with amblyopia have been shown to have visuo-motor
deficits, mainly in movement planning, under both binocular and non-dominant eye
viewing conditions (Grant et al. 2007). The differences between amblyopic subjects
and controls included prolonged execution times and more errors, the extent of which
co-varied with the depth of amblyopia, although not its aetiology. These authors
proposed that a speed-accuracy trade-off operates when quantifying the reaching and
grasping behaviour in amblyopes, that is, amblyopes may slow down their approach

Literature Review Chapter 2
31
to an object to allow them more time to accurately judge its position (Grant et al.
2007).
Parents of strabismic children whose eyes have been aligned surgically have reported
that the child’s visuo-motor skills have suddenly and vastly improved following
surgery (Von Noorden 1996). This observation was confirmed in a study that
assessed infants’ performances on a standardised test of child developmental
milestones (the Bayley Scale of Infant Development), both before and after surgery
for infantile esotropia. Following surgery, 35% of children showed an increase in
performance on tests of fine motor skills and 41% of children recorded an
improvement in visually directed reaching and grasping. The greatest post-operative
improvement was found in the subtest item that involved depth perception, where the
child was required (without monocular clues such as a difference in colour) to
identify a depression in a piece of wood (Rogers et al. 1982).
In an investigation of motor control skills in a group of children with congenital
esotropia aged four to six years, untreated strabismic children had poorer total scores
on the Movement Assessment Battery for Children (Movement ABC) than age-
matched controls and particularly performed worse on the subscale that assessed
manual dexterity (Caputo et al. 2007). Children who had undergone surgery for
congenital esotropia (strabismus) showed post-operative improvements in motor
performance, however, these improvements did not correlate with measured
improvements in stereopsis (Caputo et al. 2007).
In non-strabismic, pre-school children with reduced acuity in one eye (6/9 to 6/60),
stereoacuity, independent of VA, was significantly associated with performance on
tasks requiring fine visuo-motor control (bead threading task) (Hrisos et al. 2006).

Literature Review Chapter 2
32
No significant differences were found between these children and age-matched
controls on other items in the battery (measures of visuo-motor integration, visual
spatial processing, visual attention, and gross visuo-motor skills) (Hrisos et al. 2006).
In summary, while it has been assumed that the reduced depth perception or reduced
resolution that accompany amblyopia would result in reduced fine motor skill
performance there is little published evidence to support these assertions. The
performance of amblyopic children on standardised clinical tests of fine motor skills
that allow comparison with published normative data has not been reported, and the
relative performance of amblyopic children from differing aetiologies has not been
compared.
2.8.2 Impact of amblyopia on eye movements
While the visual anomalies known to be associated with amblyopia, such as reduced
VA in both the affected and fellow eye, reduced or absent stereopsis, and poor
fixation control may be expected to have an impact on the fluency of eye movements
under habitual binocular viewing conditions, the performance of amblyopic children
on clinical tests of eye movements has not previously been reported.
Amblyopes have poorer control of fixation in both the amblyopic and non-amblyopic
eye (Kandel et al. 1980) and binocular coordination of saccades is impaired in
strabismic amblyopes, particularly those with large angle strabismus (Kapoula et al.
1997). Anomalous oculomotor behaviour was also reported in both the fellow and
amblyopic eyes of strabismic amblyopes (Bedell et al. 1985). Even though abnormal
eye movement control and poor accuracy and stability of fixation have been

Literature Review Chapter 2
33
suggested as direct causes of the poor reading skills of some individuals (Eden et al.
1993; Kulp and Schmidt 1997; Coulter and Shallo-Hoffmann 2000; Maples 2003),
there has been little study of reading skills in amblyopes. While a functionally
relevant reading impairment (reduced maximum reading speed under binocular
viewing conditions) has been reported in micro-strabismic children (n=20, age 11.5 ±
1.1 years) (Stifter, Burggasser et al. 2005), how this may relate to the control of
binocular eye movements required for reading text across a page has not been
investigated in amblyopic subjects.
Understanding the influence of amblyopia on clinical test performance is important
for clinicians when interpreting test results and for providing advice to parents
regarding the consequences of amblyopia. Clinical treatment plans for amblyopia
aim to improve VA and binocular function outcomes. However, the relationship
between degraded vision and performance on commonly used clinical tests of eye
movements is yet to be fully established and warrants further study.
2.8.3 Impact of amblyopia on psychosocial skills
The psychosocial impact of strabismus and amblyopia and the relationship between
amblyopic characteristics and scores on vision-related quality of life questionnaires
have been described in the last decade (Burke et al. 1997; Choong et al. 2004; van de
Graaf et al. 2004; Archer et al. 2005; Koklanis et al. 2006). While early literature
mainly presented anecdotal references to the psychological impact of cosmetically
obvious strabismus (Alberman et al. 1971), more recent studies have examined the
effect of strabismus and amblyopia on an individual’s self-esteem, interpersonal
relationships and employability (Packwood et al. 1999; Coats et al. 2000).

Literature Review Chapter 2
34
These studies provide an understanding of the adults’ perspective on the
psychosocial impact of amblyopia, but have not specifically investigated the impact
of the condition from the perspective of a child with amblyopia. While studies have
reported child victimisation or bullying associated with amblyopia (Horwood et al.
2005), the self-esteem of children treated for amblyopia has not been previously
described.
Forty-one percent of parents whose children had strabismus surgery believed that
strabismus adversely affected their child’s psychological development or self-esteem
(Eustis and Smith 1987), while adults with strabismus reported difficulty with self-
image, securing employment, interpersonal relationships, school, work and sports
(Satterfield et al. 1993). Two studies have demonstrated that cosmetically obvious
strabismus creates a significant negative social prejudice for patients which can
significantly reduce an applicant’s ability to obtain employment (Olitsky et al. 1999;
Coats et al. 2000).
Amblyopic adults without strabismus reported that amblyopia interfered with both
school and work to some degree, and felt it affected their lifestyle (Packwood et al.
1999). Sixty percent of amblyopes were concerned by associated teasing or ridicule,
with the majority reporting some concern that amblyopia had an effect on self-
image.
Children from about six years of age develop a negative perception towards
individuals with strabismus and children with noticeable strabismus are viewed
negatively by teachers (Uretmen et al. 2003). While strabismus surgery results in
improvements in social, emotional and functional measures of a child’s health status

Literature Review Chapter 2
35
(Archer et al. 2005), it is not clear how a previous history of strabismus affects self-
esteem in children in the longer term.
Many children with amblyopia need to wear glasses to correct their refractive error,
even after completion of occlusion or penalisation amblyopia therapy. Individuals
who wear glasses rate themselves lower in terms of their physical attractiveness
(Terry and Brady 1976), which, as well as affecting psychological well-being, can
affect motivation and behaviour (Harter 1999). Also, children currently wearing
glasses or with a history of wearing eye patches are approximately thirty-five percent
more likely to be victims of physical or verbal bullying than children with normal
vision (Horwood et al. 2005).
How amblyopia or its treatment may impact on self-esteem in children, or the
relative influence of condition or treatment factors that may be associated with
reduced self-esteem, have not previously been reported. Exploring self-esteem in
different aetiological sub-groups may be informative, as well as examining both the
wearing of glasses and the influence of patching regimes within the analysis of self-
esteem in amblyopic children.
2.8.4 Impact of amblyopia on educational outcomes
Education, occupation and employment are considered key life outcomes, and, while
these have been studied at a population level (Rahi et al. 2006), there have not been
case-control studies that have specifically measured and compared educational
outcomes of amblyopes to their peers with normal vision. Ritty et al. (1993)
determined from observations made in 4th and 5th grade classrooms, that VA, contrast

Literature Review Chapter 2
36
resolving abilities, accommodation and convergence abilities and oculomotor
activities make up the primary demands placed on the visual system by classroom
ergonomics. In their study, seventy-five percent of the time related to academic tasks
in the classroom was found to be spent on reading and writing at near distances and
on tasks that require alternate near to distance viewing. They concluded that
classroom ergonomic conditions require extensive near work and students with
ocular motor dysfunctions may have difficulty meeting the expectations of the
classroom (Ritty et al. 1993). Despite measurable deficits in vision that may be
expected to create difficulty with visually directed tasks in the classroom, the
educational outcomes of children with amblyopia have had little mention in the
literature.
2.9 Summary
Amblyopia is the most common cause of reduced vision in children and young
people, with significant costs to both the individual and community for screening and
treatment. Recent randomised controlled trials of treatment for amblyopia and early
screening and treatment studies have provided evidence regarding the natural history
of amblyopia and efficacy of treatment, however, reports of disability for the patient
with amblyopia are not conclusive and do not specifically address skills that are of
importance to children. Psychophysical and electrophysiological studies of
amblyopia have sought to explore the visual characteristics associated with the
condition to aid understanding of the neurological changes that occur in abnormal
development, rather than seeking to describe the impact of the condition on activities
important from a quality of life perspective.

Literature Review Chapter 2
37
Under everyday binocular viewing conditions, reduced monocular visual function in
the amblyopic eye may have little detrimental effect on visual resolution or detection,
however, deficits in depth perception may represent the main functional visual
impairment of amblyopes in everyday circumstances. The impact of these vision
anomalies on tasks important to children warrants investigation and is the focus of
the research described in this thesis.
While a number of functionally relevant deficits in tasks that contribute to quality of
life have now been reported (Grant et al. 2007), the educational, health and social life
outcomes of amblyopes do not appear to be affected (Rahi et al. 2006). Parental
concern regarding the amblyopic child’s performance has been described, however,
specific research into which visually directed tasks may be impaired by amblyopia is
limited to studies with only small sample sizes. Few studies have investigated the
performance of amblyopes under habitual binocular viewing conditions and, even
though amblyopia is the most common disorder seen in paediatric ophthalmic
practice in industrialised countries, there has been only limited research regarding the
impact of the condition on tasks pertinent to the activities of children, such as
drawing and copying or fine manual dexterity tasks.
Even after treatment is completed, patients with a history of amblyopia commonly
still have some visual function anomaly, such as reduced stereoacuity or binocular
fusion, abnormal accommodation or poor ocular-motor function. In addition to
determining the extent of functionally relevant deficits in performance that may
result from abnormal visual development, it is important to have an understanding of
how children with amblyopia perform on clinical tests commonly used in paediatric
practice.

Literature Review Chapter 2
38
There are reports in the literature regarding the impact of amblyopia therapy on
family life, however, none of these studies have adequately addressed the effect of
treatment on health-related quality of life from the child’s perspective. The need for
studies to quantify the quality of life impact of amblyopia and/or strabismus, during
childhood as well as during the longer term, has been identified with an appeal for
studies to quantify the effects of amblyopia and strabismus during childhood (Carlton
et al. 2008).
To aid evaluation of the effectiveness of preschool vision screening, Snowden and
Stewart-Brown (1997a) specifically identified the need for research regarding the
extent of the disability attributable to the target conditions of vision screenings. The
study reported in this thesis examined the impact of amblyopia on motor and
psychosocial skills in children. It aimed to characterise the nature and degree of
limitation to skills that underlie tasks common in childhood and how this relates to
type or severity of amblyopia. As well as leading to a greater understanding of the
disability that may be associated with amblyopia to advise public policy, the findings
of the study will inform clinicians working with amblyopic children of the
consequences of the condition and its treatment.

General Methods Chapter 3
39
Chapter 3 GENERAL METHODS
The study presented in this thesis measured the motor and psychosocial skills of
children with a history of treatment for amblyopia and compared their performance
to children with normal visual development. Specifically, fine motor skills, clinical
eye movements and self-esteem were assessed, employing standardised, age-
appropriate clinical tools whose validity and reliability has been established in the
literature. Visual acuity and stereoacuity were measured and data regarding
aetiology and treatment was gathered. The relevance of proficiency in motor
performance to educational outcomes was explored in children with normal visual
development. Figure 3.1 outlines the research plan of the study.
Figure 3.1 Research Plan
Amblyopic Group Measure VA, stereoacuity, fine motor skills, saccadic eye movements and perceived self esteem. Gather information regarding aetiology, treatment and refractive error.
Control Group Measure VA, stereoacuity, fine motor skills, saccadic eye movements and perceived self esteem.
Analyse for differences between groups.
Sub-Group of Controls Infra-red recording of eye movements during reading. Gather standardised educational outcomes in Control Group.
Analyse for correlations.
Multiple regression analysis to investigate influence of visual or treatment characteristics on performance outcome measures.

General Methods Chapter 3
40
3.1 Research Questions
The specific research questions of the study were:
(1) Do children with amblyopia have poorer fine motor skills than age-matched
control children? Can a decrement in fine motor skills score be predicted
from visual characteristics?
(2) Do children with amblyopia have poorer self-esteem than age-matched
children with normal vision development? Can self-esteem scores be
predicted from condition or treatment information?
(3) Do children with amblyopia have poorer outcomes on clinical measures of
eye movements than children with normal vision development? Can
performance on clinical tests of eye movements be predicted from measured
vision characteristics?
(4) How do measures of fine motor skill relate to measures of educational
performance in children with normal visual development?
3.2 Participants
One hundred and eighty-eight children participated in this study, including 82
children who had been diagnosed and treated for amblyopia or amblyogenic
conditions (age 8.2 ± 1.3 years; range 4.5 to 14.0 years) from differing causes
(infantile esotropia n=17, acquired strabismus n=28, anisometropia n=15, mixed
n=13 and deprivation n=9), and 106 control subjects (age 9.5 ± 1.2 years; range 5.5
to 10.7 years). All participants were carried in full-term pregnancies and had no
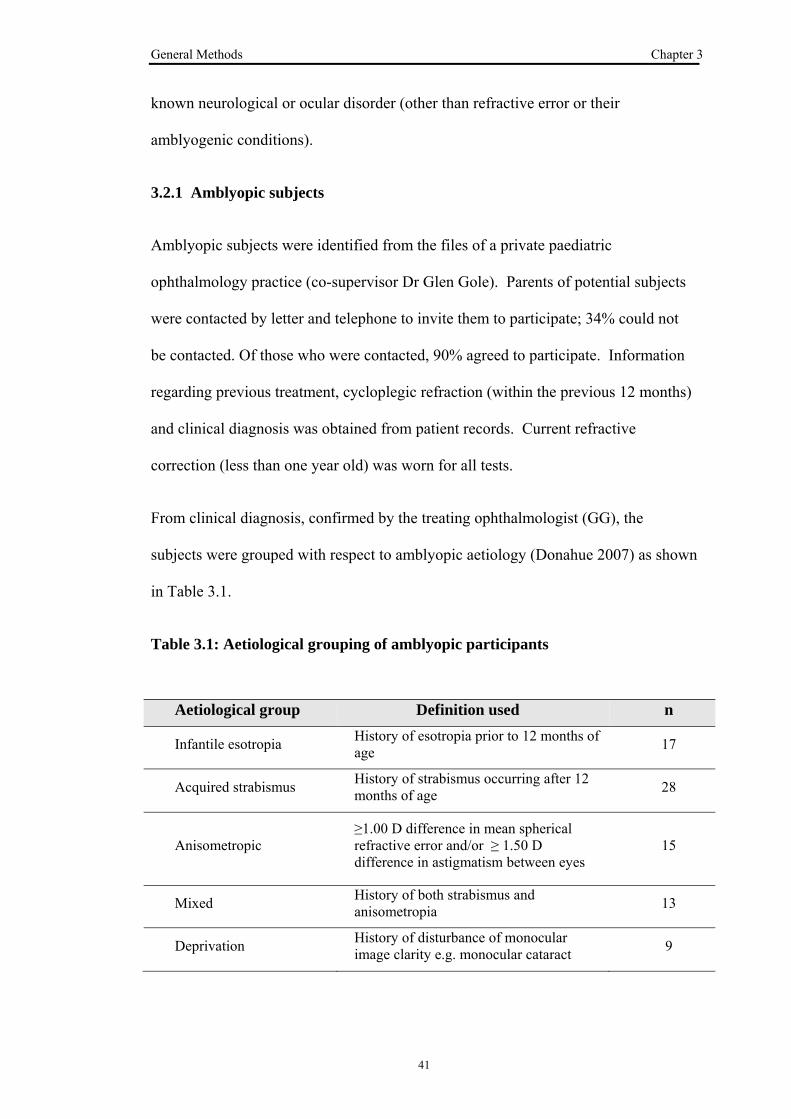
General Methods Chapter 3
41
known neurological or ocular disorder (other than refractive error or their
amblyogenic conditions).
3.2.1 Amblyopic subjects
Amblyopic subjects were identified from the files of a private paediatric
ophthalmology practice (co-supervisor Dr Glen Gole). Parents of potential subjects
were contacted by letter and telephone to invite them to participate; 34% could not
be contacted. Of those who were contacted, 90% agreed to participate. Information
regarding previous treatment, cycloplegic refraction (within the previous 12 months)
and clinical diagnosis was obtained from patient records. Current refractive
correction (less than one year old) was worn for all tests.
From clinical diagnosis, confirmed by the treating ophthalmologist (GG), the
subjects were grouped with respect to amblyopic aetiology (Donahue 2007) as shown
in Table 3.1.
Table 3.1: Aetiological grouping of amblyopic participants
Aetiological group Definition used n
Infantile esotropia History of esotropia prior to 12 months of age 17
Acquired strabismus History of strabismus occurring after 12 months of age 28
Anisometropic ≥1.00 D difference in mean spherical refractive error and/or ≥ 1.50 D difference in astigmatism between eyes
15
Mixed History of both strabismus and anisometropia 13
Deprivation History of disturbance of monocular image clarity e.g. monocular cataract 9

General Methods Chapter 3
42
3.2.2 Control subjects
Control subjects were recruited from two sources. Firstly, from a local primary
(elementary) school (Bulimba State School BSS) (n=73) via a letter sent home to
parents outlining the purpose of the study; 60% of invited students were granted
parental consent to participate. Secondly, control children were recruited from
subjects recalled from the Infant Photo-Screening Study (Royal Children’s Hospital
RCH) (n=33). The Infant Photo-Screening study originally recruited from birth
records in Brisbane in 1995. In letters sent to RCH infant photoscreening study
participants that requested a review of VA and stereoacuity, an additional request
was made for them to participate as a control subject for this study of motor and
psychosocial skills. Those who indicated willingness to participate in this study were
contacted by telephone to confirm their understanding of the purpose of the study
and to book an appointment time.
The BSS group was drawn from a small geographic catchment area according to the
enrolment management plan of the school, whereas the RCH group was drawn from
the greater Brisbane area, reflective of original recruitment from birth records in
1995. Comparison was made of the outcome scores on the tests of vision, fine motor
skills, saccadic eye movements and self-esteem between the two control groups to
confirm that the BSS group was representative of children from a broader geographic
catchment. No significant difference was found between the two control groups in all
fine motor skills outcome scores or Developmental Eye Movement (DEM) test
outcomes (p>0.05) and in all but one self-esteem measure; in the self-esteem
measure that scored self-perception of behavioural conduct, the RCH group scored

General Methods Chapter 3
43
significantly lower (3.01 ± 0.57) than the BSS group (3.28 ± 0.51) (F(2,93) = 3.95;
p=0.023).
3.2.3 Age-matching
The age of the amblyopic children ranged from 4.5 to 14.0 years. The fine motor
skills test employed in the study, the Brunicks-Oseretsky Test of Motor Proficiency
(BOTMP), can be used to assess skills in children from four to fourteen years of age
and was conducted on all recruited children.
Children aged less than eight years of age were not tested with the DEM test due to
poor reliability and high variation in number naming skills in younger children.
Prior to eight years of age most children are still developing their reading skills and
assessment of reading fluency parameters is highly variable, with many preschool
aged children being unable to complete the DEM test (Kulp and Schmidt 1997).
The DEM test was thus conducted on thirty-nine amblyopic children (age 9.1 ± 0.9
years).
The self-esteem questionnaire formats were different for children in grade 3 or older
versus those in younger grades. Perceived self-esteem was assessed for those
children in grade 3 or higher at school with the Harter Self Perception Profile for
Children (SPPC), which tested across six self-esteem domains. Forty-seven
amblyopic children (age 9.2 ± 1.3 years) completed the SPPC. Those children from
pre-school to grade 2 were tested with the Pictorial Scale of Perceived Competence
and Acceptance for Young Children (PSPCA) that tested across three self-esteem
domains. Twenty-nine amblyopic children (age 6.6 ± 0.6 years) completed the
pictorial self-esteem questionnaires that were suitable for children from preschool to
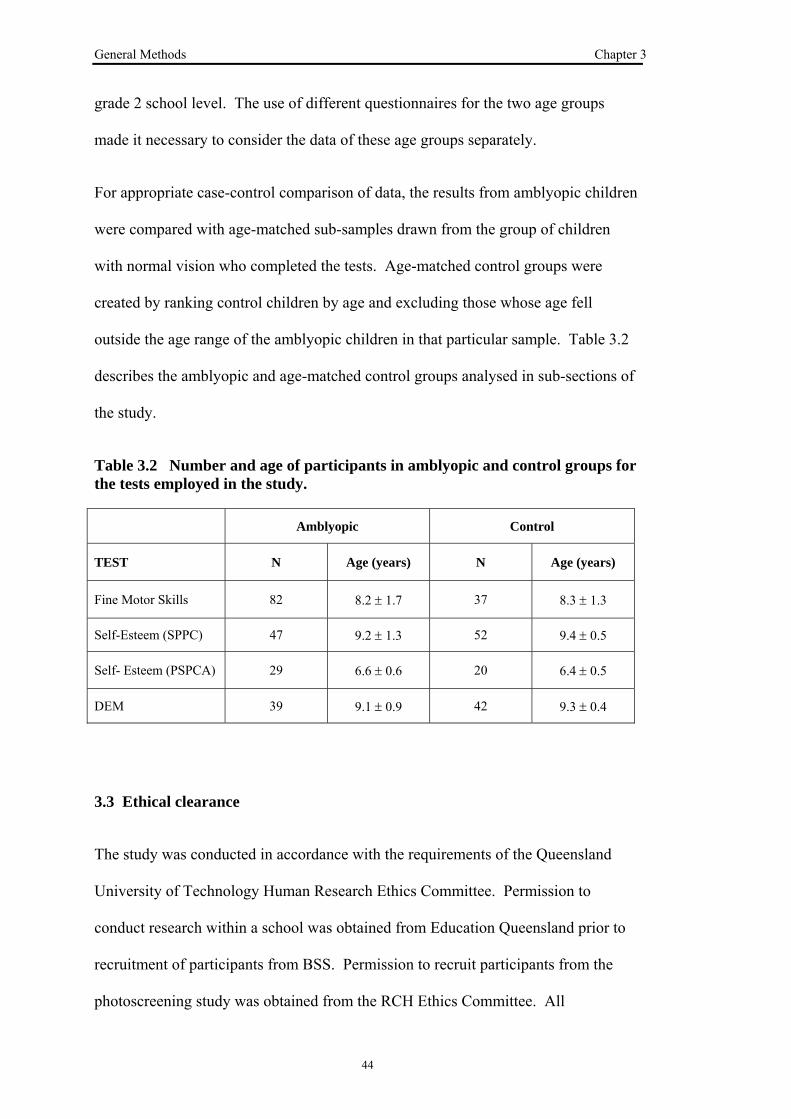
General Methods Chapter 3
44
grade 2 school level. The use of different questionnaires for the two age groups
made it necessary to consider the data of these age groups separately.
For appropriate case-control comparison of data, the results from amblyopic children
were compared with age-matched sub-samples drawn from the group of children
with normal vision who completed the tests. Age-matched control groups were
created by ranking control children by age and excluding those whose age fell
outside the age range of the amblyopic children in that particular sample. Table 3.2
describes the amblyopic and age-matched control groups analysed in sub-sections of
the study.
Table 3.2 Number and age of participants in amblyopic and control groups for the tests employed in the study.
Amblyopic Control
TEST N Age (years) N Age (years)
Fine Motor Skills 82 8.2 ± 1.7 37 8.3 ± 1.3
Self-Esteem (SPPC) 47 9.2 ± 1.3 52 9.4 ± 0.5
Self- Esteem (PSPCA) 29 6.6 ± 0.6 20 6.4 ± 0.5
DEM 39 9.1 ± 0.9 42 9.3 ± 0.4
3.3 Ethical clearance
The study was conducted in accordance with the requirements of the Queensland
University of Technology Human Research Ethics Committee. Permission to
conduct research within a school was obtained from Education Queensland prior to
recruitment of participants from BSS. Permission to recruit participants from the
photoscreening study was obtained from the RCH Ethics Committee. All

General Methods Chapter 3
45
participants were given a full explanation of the experimental procedures and written
informed consent was obtained from both parent and child. The option to withdraw
from the study at any time was explained to both parent and child. All protocols were
in accord with the guidelines of the Declaration of Helsinki.
3.4 Test setting
Amblyopic children were tested in standard clinical consulting rooms either at the
practice of Dr Glen Gole or of the PhD candidate. Illumination was standard
overhead fluorescent full room lighting for all tests. New testing equipment was
specifically purchased for the project and used in all testing situations. For VA
testing the child stood at a marked line three metres from a wall mounted Bailey-
Lovie logMAR chart. The child was seated opposite the examiner (the PhD
candidate) at a height appropriate table setting for tests of stereopsis, fine motor
skills and DEM and for completion of the self-esteem questionnaire.
Testing of BSS control children was conducted individually in a separate room made
available by the school. Full room illumination by overhead fluorescent lighting
matched the standard clinical setting. Testing of RCH control children was either at
the practice of the PhD candidate or in a clinical consulting room made available by
QUT School of Optometry Clinic.
All testing was conducted by the candidate and the standard scoring procedures as
outlined in the test manuals was followed. Complete assessment of vision, fine
motor skills, perceived self esteem and DEM took about 45 minutes per subject. All
tests were completed within one test session by all subjects. Visagraph eye
movement recording was performed on a separate occasion for control subjects from

General Methods Chapter 3
46
grades 4 and 5 BSS (n=59). Recording time was approximately 15 minutes per
subject.
3.5 Vision Assessment
3.5.1 Visual Acuity
Visual acuity (VA) was measured using a three metre Bailey-Lovie logMAR chart
following a screening/threshold procedure based on the Amblyopia Treatment Study
VA protocol (The Pediatric Eye Disease Investigator Group et al. 2001). The child
read the first letter of each row from the top of the logMAR chart until an error was
made (screening). The child was then redirected to two rows above the screening
error row and asked to attempt each letter until four incorrect responses were made
(threshold). The VA for each eye was scored on a letter by letter basis in 0.02
logMAR increments. A schematic of the screening/threshold VA protocol used is
shown in Figure 3.2.
Figure 3.2: Schematic of screening/threshold VA protocol employed
Screening phase Read the first letter of each row until an error is made
Threshold Phase Starting 2 lines above error made on screening phase, read along row of letters recording letters correctly identified

General Methods Chapter 3
47
3.5.2 Stereoacuity
The level of stereoacuity was assessed with the three book Randot Preschool
Stereoacuity test (Birch et al. 1997), chosen for its lack of monocular cues and
because the task could easily be completed in a short time by the age group being
tested (Figure 3.3). Viewing distance for all stereoacuity tests was 40 cm. Testing
was conducted according to the test manufacturer’s instructions. Each book contains
two sets of four random dot shapes (one is blank, the other three contain shapes) that
can be named or matched to the easily visible black-and-white shapes on the other
side of the book. Book 1 was presented first to test 200 arcsec and 100 arcsec levels
of disparity. If the child was able to correctly identify two of three shapes at both of
the disparity levels then Book 2 was presented next to test 60 arcsec and 40 arcsec
disparity. If the child was unable to identify two of the three shapes at 200 arcsec
disparity then Book 3 was presented instead to test 800 arcsec and 400 arcsec
disparity.
Figure 3.3: Randot Preschool Stereoacuity Test
Stereoacuity was defined as the smallest disparity at which the child was able to
correctly identify at least two of three shapes. A maximum of 18 correct responses

General Methods Chapter 3
48
was possible if the child identified the six shapes for all three books. For analysis,
stereoacuity was scored according to the number of correct responses made. For
example, a score of 18 indicated that the child correctly identified all disparity
objects in the books, including the three 40 arcsec. A score of zero indicated that the
child did not identify any of the 800 arcsec disparity objects. Stereoacuity response
was grouped as follows: “nil” if no stereoscopic response could be measured,
“reduced” if response indicated stereopsis between 800 and 60 seconds of arc and
“normal” if response indicated stereopsis better than or equal to 40 seconds of arc.
If the child was unable to identify any disparity objects in the Randot Stereoacuity
test, suppression was confirmed by the Mirror-Pola technique (Siderov 2001). The
child wore the polarised glasses of the stereoacuity test and viewed themselves in a
mirror. The child was asked to report the colour of the polarised lenses as seen in the
mirror. If the child was not suppressing, both lenses would appear grey when viewed
by the child in the mirror. If the child was suppressing, the lens before the
suppressed eye would appear black, while the lens before the dominant eye would
appear grey. Suppression was confirmed by this technique in all children who were
unable to identify any disparity objects in the Randot Stereoacuity test.
3.6 Fine Motor Skills Assessment
The Brunicks-Oseretsky Test of Motor Proficiency (BOTMP) was used to evaluate
fine motor skills using Item 7 Visual Motor Control (VMC) and Item 8 Upper Limb
Speed and Dexterity (ULSD) (Bruininks 1978). The BOTMP is an individually
administered test that gives a measure of motor proficiency, as well as separate
measures of both gross and fine motor skills of children from 4 to 14 years of age.

General Methods Chapter 3
49
The VMC item comprises eight sub-items to measure the ability to integrate visual
responses with highly controlled motor responses. The ULSD item comprises eight
timed sub-items that measure hand and finger dexterity, hand speed and arm speed.
The sub-items are described in Table 3.3 and Figure 3.4 shows examples of the tasks
undertaken in the ULSD item.
Figure 3.4: Examples of tasks performed in Upper Limb Speed and Dexterity
domain of BOTMP
In addition to being appealing to children, the BOTMP has been designed to provide
uniform testing conditions and to facilitate ease of administration and scoring
(Bruininks 1978). Performance on each sub-item is expressed as either the number of
units completed within a fixed time period or as the number of errors made in
performing the task. Point scores for each sub-item allow raw scores to be converted
to a common set of scale values which are then added together for each of the two
fine motor skills items (Bruininks 1978). Results are converted to subtest age-
standardised scaled scores of performance relative to published normative values
(Bruininks 1978).

Table 3.3: Sub-items comprising Visual-motor control and Upper-limb speed and dexterity items of BTOMP(Bruininks 1978)
Visual Motor Control - all tasks are done with preferred hand Sub item Description Record
1: Cutting circle Cuts out a bold circle embedded within six concentric circles.
Number of errors 2: Drawing through crooked path Draws a pencil line through a crooked path. 3: Drawing through straight path Draws a pencil line through a straight path. 4: Drawing through curved path Draws a pencil line through a curved path. 5: Copying circle
Copies a geometric shape. Accuracy of shape reproduction following specific scoring guidelines
6: Copying triangle 7: Copying diamond 8: Copying overlapping shapes Upper Limb Speed and Dexterity – all tasks are done with preferred hand except for item 2 (which requires both hands). A practice trial precedes each test run.
1: Placing pennies in a box Places pennies one at a time into an open box. The number of pennies placed into the box correctly in 15 seconds
2: Placing pennies in two boxes with both hands
Simultaneously picks up a penny with each hand and places the pennies into separate boxes. The subject is given a maximum of 50 seconds to place seven pairs of pennies into the boxes correctly.
The time taken to complete the task. A time of 50 seconds is recorded if the subject places fewer than seven pairs of pennies into the boxes correctly.
3: Sorting shape cards Sorts a mixed deck of red and blue cards into two piles, separating them by colour.
The number of cards correctly sorted in 15 seconds.
4: Stringing beads Strings beads onto a shoelace. The number of beads placed correctly in 15 seconds.
5: Displacing pegs Displaces pegs with 2 mm base diameter on a pegboard, moving each peg to the hole directly above it.
The number of pegs displaced correctly in 15 seconds.
6: Drawing vertical lines Draws straight lines between pairs of horizontal lines. The number of vertical lines drawn correctly in 15 seconds. Accuracy following specific test guidelines.
7: Making dots in circles Makes a pencil dot inside each of a series of circles The number of circles dotted correctly in 15 seconds.
8: Making dots Makes pencil dots on a blank page The number of separate dots made in 15 seconds.
50

General Methods Chapter 3
51
The scoring procedure as outlined in the test manuals was followed. To ensure
scoring was appropriate, a sub-sample of score sheets (n=20) were re-scored by an
independent researcher to confirm accuracy of scoring. The re-scored subset
included results from both amblyopes (n=10) and controls (n=10), however, score
sheets were de-identified so that the scorer was masked to participant group. Paired-
samples t-tests indicated no significant difference in scoring between examiners on
15 of 16 subtests. Table 3.4 gives mean and standard deviation of test scores for the
fine motor skills sub-items and results of paired t-tests for the difference between
scorers. Bold italics highlights items that were significantly different between
scorers (Item 8.6 drawing vertical lines); the principal examiner (the PhD candidate)
scores were slightly higher (mean score 5.6 ± 1.7) than the second examiner (mean
score assigned 4.6 ± 1.7).

General Methods Chapter 3
52
Table 3.4 Paired Samples Test for difference between scorers. Bold Italics
identifies the item that had a sig. difference in scores (p<0.05)
Mean (std dev)
t (df=19) p Principal Examiner
Second Examiner
ITEM 7 Visual Motor Control
1: Cutting circle 3.65 (0.93) 3.45 (1.28) 1.21 0.214
2: Drawing through crooked path 3.60 (0.82) 3.65 (0.67) -1.00 0.330
3: Drawing through straight path 3.60 (0.68) 3.55 (0.76) 0.57 0.577
4: Drawing through curved path 2.90 (1.17) 2.70 (1.26) 1.29 0.214
5: Copying circle 1.85 (0.37) 1.85 (0.37) 0.00 1.000
6: Copying triangle 2.00 (0.00) 1.95 (0.22) 1.00 0.330
7: Copying diamond 1.85 (0.37) 1.80 (0.41) 0.44 0.666
8: Copying overlapping shapes 1.55 (0.69) 1.60 (0.68) -0.57 0.577
ITEM 8 Upper Limb Speed and Dexterity
1: Placing pennies in a box 4.40 (1.23) 4.40 (1.23) - -
2: Placing pennies in two boxes with both hands 9.25 (0.91) 9.25 (0.91) - -
3: Sorting shape cards 4.30 (1.46) 4.05 (1.39) 1.00 0.330
4: Stringing beads 2.2 (1.01) 2.25 (1.07) -1.00 0.330
5: Displacing pegs 4.20 (0.83) 4.25 ().79) -1.00 0.330
6: Drawing vertical lines 5.60 (1.73) 4.65 (2.11) 3.44 0.003
7: Making dots in circles 4.85 (1.53) 4.65 (1.50) 1.29 0.214
8: Making dots 5.50 (2.12) 5.55 (2.06) -1.00 0.330

General Methods Chapter 3
53
3.7 Eye Movements Assessment
3.7.1 Developmental Eye Movement Test
Saccadic eye movements of all of the amblyopes aged eight years and above were
assessed with the DEM test (Garzia 1990). Thirty-nine amblyopic children (aged 9.1
± 0.9 years) completed the DEM. Their results were compared with an age-matched
subgroup of forty-two control children (aged 9.3 ± 0.4 years)
The test consisted of two subtests with 40 numbers arranged in vertical columns
(Tests A and B), and a subtest with 80 irregularly spaced numbers arranged in 16
horizontal rows (Test C) (Figure 3.5). The child was asked to name aloud the single
digit numbers as quickly and accurately as possible. The times taken to read aloud
the 80 numbers in both the four vertical columns (vertical time) and the sixteen line
horizontal array (horizontal time) were recorded. The number of omission and
addition errors was recorded and test times were adjusted for errors made.
Upon completion of the test, a ratio was calculated by dividing the time taken to read
the 80 numbers in the horizontal array by the total time for reading the 80 numbers in
vertical subsets. The outcomes from the DEM test are Vertical time, Horizontal
time, Number of Errors and Ratio(horizontal time/vertical time). Results were converted
to standard scores and percentile ranks based on published age-normative data for
this test (Richman and Garzia 1987).

General Methods Chapter 3
54
Figure 3.5: DEM Test Cards A and C
3.7.2 Visagraph Eye Movement Recording
Eye movements were also assessed in participants in grades 4 and 5 in the BSS
control group (n=59) (mean age 9.7 ± 0.6; range 8.6 to 10.8 years) by the Visagraph
III which is an eye-movement recording system that uses goggles containing infrared
sensors to capture eye position information during reading (Taylor & Associates).1
Visagraph recordings of amblyopic children were also attempted, however,
recordings were unreliable through the spectacle correction worn by the majority of
the amblyopic group of children. Figure 3.6 shows a participant wearing the
Visagraph goggles during recording.
1 Taylor&Associates. 200 E. Second St., Suite 2, Huntington Station, NY 11746.

General Methods Chapter 3
55
Figure 3.6: Visagraph Eye Movement Recording
There are three types of recording tests with the Visagraph III: a reading recording
where the eye movements made when reading a short age-appropriate paragraph text
are captured; a numbers recording where the test card is a series of numbers between
1 and 5; and a visual skills recording where stability of fixation and accuracy of
motility are assessed. Comprehension tests were administered following the reading
evaluation to confirm that the child was reading for comprehension rather than
merely giving the appearance of reading.
From the Visagraph recordings a number of measures of eye movements made
during the reading task are summarised in a Reading Report. Outcome measures
used for analysis were the number of fixations per 100 words, number of regressions
per 100 words, span of recognition, average duration of fixations and reading rates.
Average span of recognition effectively refers to the amount of print that is perceived
and processed with each fixation. The span of recognition was specified in units of
“words” and was calculated by dividing the number of fixations into the number of
words in the specified paragraph. Fixation duration refers to the length of time that
the eye pauses or remains fixated on a word. Reading rate refers to the number of
words read per unit time and was specified in words per minute (Ciuffreda and
Tannen 1995a). Normative data have been established for these measures for readers

General Methods Chapter 3
56
from grade 1 through to college level. For the numbers task the measures reported
included: fixations per 100 numbers, regressions per 100 numbers, average duration
of fixation and reading rate both with and without re-reads (numbers per minute).
Normative data has not been established for the numbers task. As the data obtained
for each eye separately differed by less than five percent, findings for right and left
eye were averaged for analysis of Visagraph outcomes for both the reading and
number naming tasks.
3.8 Self-Esteem Assessment
3.8.1 Children from grade 3 school level
Self-esteem in children aged eight years and above was assessed with the Self
Perception Profile for Children (SPPC), an age-appropriate, standardised measure
that has been used extensively to measure self-esteem in several different groups of
children (Harter and Pike 1984; Harter 1985; Granleese and Joseph 1994). The
psychometric properties of the SPPC, including validity and reliability, have been
independently established (Marsh and Holmes 1990). This instrument, which has
been used in studies of self-esteem in myopic children (Dias et al. 2002; Dias et al.
2005), was chosen because it provides testing across several domains important to
children’s lives as well as testing global self-worth. The child completed a 36 item
self-reporting scale consisting of six specific domains described below. Six
questions were asked in each domain, each consisted of two logically opposed
statements, for example, “Some kids would rather play outdoors in their spare time
BUT other kids would rather watch TV”. To reduce response bias, half of the items
started with the more positive statement. The child indicated which statement was

General Methods Chapter 3
57
“more true” of themselves and indicated whether the statement was “really true for
me” or “sort of true for me”. Items were scored from one to four, where four
indicated the most and one represented the least adequate self-judgment. Subscale
scores were calculated by averaging the responses to each item within a domain.
Thus, the SPPC gives six mean values, one from each domain, that range from one to
four. Age-appropriate normative data are available for the SPPC test (Harter 1985).
The six domains assessed by the SPPC are:
• Scholastic Competence – the child’s perception of competence or ability within
the realm of scholastic or school related performance.
• Social Acceptance - the degree to which the child is accepted by peers or feels
popular.
• Athletic Competence – the child’s perception of competence in sports and
outdoor games.
• Physical Appearance – the degree to which the child is happy with the way
he/she looks, likes his/her height, weight, body, face, hair, or feels that they are
good-looking.
• Behavioural Conduct – the degree to which children like the way they behave, do
the right thing, act the way they are supposed to, avoid getting into trouble and do
the things they are supposed to do.
• Global Self-Worth - the extent to which the child likes him/herself as a person, is
happy with the way they are leading their life and is generally happy with
him/herself. This is a global judgement of worth as a person, rather than a
domain specific competence or adequacy.

General Methods Chapter 3
58
Forty-seven children who had been treated for amblyogenic conditions (age 9.2 ± 1.3
years) completed the SPPC questionnaire. Their scores were compared with those of
an age-matched subgroup of control subjects (n=52; age 9.4 ± 0.5 years).
3.8.2 Children preschool to grade 2 school level
A pictorial presentation questionnaire, the Pictorial Scale of Perceived Competence
and Acceptance for Young Children, was used for children who were preschool to
grade 2 school level (Harter and Pike 1984). The children were presented with a
pictorial questionnaire of 18 situations and asked to identify which child in that
situation they are most like. The questionnaire taps into three domains: cognitive
competence, physical competence and peer acceptance. The child was given a
sample item at the beginning of the questionnaire and was instructed to choose which
child in the pictorial situation they are most like. The choice is refined further by
asking if they are “very like” the child in the situation chosen or “a little like” the
child in the situation. Figure 3.7 is an example from the pictorial questionnaire for
grade 1 to grade 2 boys.
Figure 3.7: Example from Pictorial Questionnaire
This boy is good at climbing
This boy is not very good at climbing

General Methods Chapter 3
59
Items were scored from 1 to 4, where 4 indicated the most adequate self-judgment
and 1 represented the least adequate self judgment. Items with each subscale were
counter-balanced such that three items were worded with the most adequate
statement on the left and three items were worded with the most adequate statement
on the right. Scores from the child’s protocol were transferred onto a data coding
sheet where all items for a given subscale were grouped together to facilitate the
calculation on the mean for each subscale. Scoring resulted in a total of six subscale
means that defined a given child’s profile.
The outcome measure is a score between 1.0 and 4.0 on subscales. The results can
be compared with reported mean and standard deviations for different aged children.
Twenty-nine children with a history of treatment for amblyopia (age = 6.6 ± 0.6
years) and twenty age-matched controls (age = 6.4 ± 0.5 years) completed the
Pictorial Scale of Perceived Competence and Acceptance for Young Children.
3.9 Assessment of Educational Achievement
Educational data on standardised measures of literacy and numeracy measured
internally by the school at the start of the school year were collected on the BSS
control children who were in either grade 4 or grade 5 (n=57; two were absent from
school on the day of testing). Mathematics, reading and spelling were tested using
standardised assessment tools by the classroom teacher in class time at the beginning
of the school year. Mathematics level was assessed with the Progressive
Achievement Test in Mathematics (Australian Council for Educational Research
2005), spelling was assessed using the Single Word Spelling Test (SWST) (Sacre

General Methods Chapter 3
60
and Masterson 2001) and reading was assessed with the Reading Progress Test
(RPT) (Vincent et al. 1997).
In addition, results on Queensland Years 3, 5 and 7 tests in Aspects of Literacy and
Numeracy (QSA 3,5,7) were also obtained from the school for 29 of the 57 children
(those children in grade 5 who sat the tests), allowing validation of the achievement
scores obtained by the classroom teachers. The QSA 3,5,7 tests, developed
specifically for Queensland students and managed by the Queensland Studies
Authority on behalf of the Queensland Government (Queensland Studies Authority
2004), are based on Queensland syllabuses and are designed to cover a wide range of
children's abilities across the State. As for the internal school-based educational
assessment, the children completed the tests in their classroom with their regular
classroom teacher, and answer booklets were marked external to the school by the
Queensland Studies Authority. Aspects of Measurement and Data, Number, and
Space are assessed in the Numeracy Test. Aspects of Reading and Viewing, Spelling,
and Writing, are assessed in the Literacy Test.
In order to access QSA test results, permission was obtained from the principal of
BSS together with that of each child’s parent. As the amblyopic children were drawn
from a paediatric ophthalmology practice and the RCH control children were
originally identified from their hospital of birth they attended different state schools,
catholic schools or independent schools within South-East Queensland. Obtaining
permission to access QSA test results from each school department authority and
school principal was logistically outside the scope of this study.

General Methods Chapter 3
61
3.10 Statistical Analysis
All data were tested for normality using the Kolmogorov-Smirnov test. Where the
data were normally distributed, the results from the amblyopes were compared with
those of the control group using one-way ANOVA or t-tests with a significance level
of 0.05 (Statistical Package for the Social Sciences – SPSS V14). When statistically
significant differences were found between means, Bonferroni post-hoc tests were
used. Non-parametric tests were used where the data were not normally distributed.
Pearson’s correlation co-efficients were calculated to explore the relationships
between vision characteristics and skills performance with Bonferroni correction to
account for multiple comparisons (Curtin and Schulz 1998).
General linear multiple regression models were examined to investigate the
independent influence of subject visual characteristics on skills scores. The impact of
collinearity among explanatory factors was examined by calculation of variance
inflation factors (VIF) (Ryan 1997); multi-collinearity (unacceptably high degree of
correlation between investigated factors) was defined as a VIF value of 3 or more
(Ryan 1997).
Correlation analysis was undertaken to test for association between the two measures
of educational outcomes (internal BSS tests and QSA tests), and to test for
association between measures of fine motor skills and clinical eye movements and
educational outcomes.

The effect of amblyopia on fine motor skills in children. Chapter 4
62
Chapter 4 RESULTS
FINE MOTOR SKILLS
"The effect of amblyopia on fine motor skills in
children."
Webber AL, Wood JM, Gole GA, Brown B. (2008) “The effect of amblyopia on fine
motor skills in children.” Invest Ophthalmol Vis Sci ;49(2):594-603.
4.1 Abstract
Aim: To investigate the functional impact of amblyopia in children, the fine motor
skills of amblyopes and age-matched controls were compared. The influence of
visual factors that might predict any decrement in fine motor skills was also
explored.
Methods: Vision and fine motor skills were tested in a group of amblyopic children
(n=82; age 8.2 ± 1.7 years) of differing causes (infantile esotropia n=17, acquired
strabismus n=28, anisometropia n=15, mixed n=13 and deprivation n=9), and age-
matched controls (n=37; age 8.3 ± 1.3 years). Visual-Motor Control (VMC) and
Upper-Limb Speed and Dexterity (ULSD) items of the Bruininks-Oseretsky Test of
Motor Proficiency were assessed and logMAR visual acuity (VA) and Randot
stereopsis were measured. Multiple regression models were used to identify the
visual determinants of fine motor skills performance.

The effect of amblyopia on fine motor skills in children. Chapter 4
63
Results: Amblyopes performed significantly poorer than controls on 9 of 16 fine
motor skills sub-items and for the overall age-standardised scores for both VMC and
ULSD items (p<0.05); effects were most evident on timed tasks. Amblyopia
aetiology and level of binocular function significantly affected fine motor skill
performance on both items; however, when examined in a multiple regression model
that took into account the inter-correlation between visual characteristics, poorer fine
motor skills performance was associated with strabismus (F1,75 = 5.428; p =0. 022),
but not with the level of binocular function, refractive error or VA in either eye.
Conclusions: Fine motor skills were reduced in amblyopic children, particularly
those with strabismus, compared to controls. The deficits in motor performance were
greatest on manual dexterity tasks requiring speed and accuracy.
Keywords:
Amblyopia, fine motor skills, stereopsis, binocular vision, strabismus

The effect of amblyopia on fine motor skills in children. Chapter 4
64
4.2 Introduction
Amblyopia, affects approximately three percent of the population (Attebo et al. 1998;
Brown et al. 2000) and is clinically defined as a two line or greater difference in
visual acuity (VA) between the eyes in the presence of a pre-disposing amblyogenic
condition, and in the absence of visible ocular or visual pathway pathology. The
condition is most commonly associated with strabismus (misalignment of the
oculomotor system), anisometropia (significant difference in refractive error between
eyes), or form deprivation (presence of media opacity such as cataract) and is usually
classified according to these underlying aetiological conditions. If present during the
critical period of visual development (up to about seven years of age) (Daw 1998)
the optical or oculomotor deficits lead to abnormal neurodevelopment of the visual
system, with a loss or rearrangement of neural connections within the visual cortex
(Daw 2006).
An extensive body of literature describes the adaptations in spatial vision that occur
in the amblyopic eye including reductions in optotype VA, grating acuity, contrast
sensitivity and vernier acuity (McKee et al. 2003). In addition, the non-amblyopic
eye often displays small but measurable deficits, such as slightly poorer VA,
compared to the dominant eye of normal observers (McKee et al. 2003; Simons
2005). Disruption of binocular function with resultant reduction in stereopsis is
common, particularly in amblyopes with a history of strabismus (McKee et al. 2003;
Simons 2005). Differences in spatial vision and binocular adaptations exist between
aetiological groups, suggesting that different neural changes occur under the
influence of monocular blur in the case of anisometropia and form deprivation, as
opposed to ocular misalignment in strabismus (McKee et al. 2003). The severity of

The effect of amblyopia on fine motor skills in children. Chapter 4
65
the amblyopic deficit, as defined by VA deficit and binocular adaptations, depends
on many factors, including the cause of amblyopia, the age of the patient at
diagnosis, the duration of abnormal visual experience and the presence of
complicating factors (McKee et al. 2003).
While much is known about the visual characteristics of amblyopia, the natural
history of the condition and appropriate detection and treatment strategies (Simons
2005), the functional disadvantage of amblyopia has not been fully explored
(Snowden and Stewart-Brown 1997a). A recent population based study of
educational, health and social outcomes, which failed to identify any “real life”
functional impact of the visual deficits associated with amblyopia, highlighted the
need for further research on what it means to be amblyopic (Rahi et al. 2006). Few
studies have investigated the performance of amblyopes under habitual binocular
viewing conditions and, even though amblyopia is the most common disorder seen in
paediatric ophthalmic practice in industrialised countries, there has been only limited
research on the impact of the condition on drawing and copying or fine manual
dexterity tasks pertinent to the activities of children.
Many amblyopes have little or no stereopsis, the functional significance of which has
rarely been reported (Fielder and Moseley 1996). Most studies that have investigated
this issue have compared performance under monocular and binocular conditions
(Jones and Lee 1981; Joy et al. 2001), generally concluding that binocular vision
facilitates control of manipulation, reaching and balance (Jones and Lee 1981), and
that people who lack stereopsis have difficulty performing tasks which rely on three
dimensional visual cues (Murdoch et al. 1991). There are, however, many individuals
who perform well on tests of manual dexterity even though their stereopsis is poor

The effect of amblyopia on fine motor skills in children. Chapter 4
66
(Murdoch et al. 1991), and a recent study of children who had undergone surgery for
congenital esotropia (strabismus) showed post-operative improvements in motor
performance which were not correlated with measured improvements in stereopsis
(Caputo et al. 2007).
If the neurophysiological changes that occur in amblyopia are different under
conditions of monocular blur versus oculo-motor misalignment, then we might
expect differences in performance between amblyopes with a history of strabismus
and those without. Alternatively, if resolution is an influencing factor, performance
may be limited by the level of VA in the better eye, as this predicts VA under
binocular conditions (Rubin et al. 2000). Presence of hyperopic refractive error, a
common finding in children with amblyopia, is associated with mild delays across
many aspects of visuo-cognitive and visuo-motor development (Atkinson et al. 2005;
Atkinson et al. 2007), therefore the magnitude of hyperopic refractive error should be
considered when investigating the determinants of fine motor skill performance.
The present investigation compared the performance of a sample of children with
amblyopia of differing aetiologies on standardised, age-appropriate tests of fine
motor skill performance under habitual binocular conditions with an age-matched
group of children without amblyopia. The influence of patient aetiology and
measured visual characteristics was examined by testing whether these factors were
associated with outcome measures of fine motor skills.

The effect of amblyopia on fine motor skills in children. Chapter 4
67
4.3 Methods
4.3.1 Participants
One hundred and nineteen children participated in this study, including 82 children
who had been diagnosed and treated for amblyopia or amblyogenic conditions (age
8.2 + 1.7 years) and 37 age-matched control subjects (age 8.3 + 1.3 years). The
amblyopic group included children who had been successfully treated and children
who still had a residual VA deficit (greater than 0.2 logMAR difference in VA
between eyes). Amblyopic subjects were identified from the files of a private
paediatric ophthalmology practice. Parents of potential subjects were contacted by
letter and telephone to invite them to participate; 34% could not be contacted. Of
those who were contacted, 90% agreed to participate. Control subjects were
recruited from a local primary (elementary) school via a letter to parents outlining the
purpose of the study; 60% of invited students were granted parental consent to
participate. All children were carried in full-term pregnancies and had no known
neurologic or ocular disorder (other than refractive error or their amblyogenic
conditions).
Information regarding previous treatment, cycloplegic refraction (within previous 12
months) and clinical diagnosis was obtained from patient records. Refractive
correction (typically less than one year old) was worn for all tests. From clinical
diagnosis, confirmed by the treating ophthalmologist (GG), the subjects were
grouped with respect to amblyopic aetiology (Donahue 2007) as follows:
Infantile esotropia - history of esotropia prior to 12 months of age (n=17).
Acquired strabismus - history of strabismus occurring after 12 months of age
(n=28).

The effect of amblyopia on fine motor skills in children. Chapter 4
68
Anisometropic - ≥1.00 D difference in mean spherical refractive error and/or
≥ 1.50 D between the eyes in astigmatism (n=15)
Mixed - history of both strabismus and anisometropia (n=13)
Deprivation - history of disturbance of monocular image clarity e.g. monocular
cataract (n=9)
4.3.2 Vision Assessment
Visual acuity was measured using a 3 m logMAR chart using a screening/threshold
procedure based on the Amblyopia Treatment Study VA protocol (The Pediatric Eye
Disease Investigator Group et al. 2001). The child read the first letter of each row
from the top of the logMAR chart until an error was made (screening). The child
was then redirected to two rows above the screening error row and asked to attempt
each letter until four incorrect responses were given (threshold). Resultant VA for
each eye was scored on a letter by letter basis. Level of binocular function was
assessed with the Randot Preschool stereopsis test (Birch et al. 1997), chosen for its
lack of monocular cues and because the task could easily be completed in a short
time by the age group being tested. Suppression was confirmed by the Mirror-Pola
technique (Siderov 2001) if no stereoscopic response was obtained on the Randot
test.
4.3.3 Fine Motor Skills Assessment
Fine motor skills were evaluated using Item 7 Visual Motor Control (VMC) and Item
8 Upper Limb Speed and Dexterity (ULSD) of the Bruininks-Oseretsky Test of
Motor Proficiency (BOTMP) (Bruininks 1978). The BOTMP is an individually
administered test that gives a measure of motor proficiency as well as separate
measures of both gross and fine motor skills of children from 4 to 14 years of age.
The effect of amblyopia on fine motor skills in children. Chapter 4
69
The VMC item comprises eight sub-items to measure the ability to integrate visual
responses with highly controlled motor responses. The ULSD item comprises eight
timed sub-items that measure hand and finger dexterity, hand speed and arm speed.
The sub-items are described in Table 4.1. In addition to being appealing to children,
the BOTMP has been designed to provide uniform testing conditions and to facilitate
ease of administration and scoring (Bruininks 1978).
Performance on each sub-item is expressed as either the number of units completed
within a fixed time period or as the number of errors made in performing the task.
Point scores for each sub-item allow raw scores to be converted to a common set of
scale values which are then added together for each of the two fine motor skills items
(Bruininks 1978). Results are converted to subtest age-standardised scaled scores of
performance relative to published normative values (Bruininks 1978).
Subjects also completed a self-esteem questionnaire and developmental eye
movement (DEM) test of digit naming speed during the test session; these findings
will be presented elsewhere. Complete assessment of vision, fine motor skills,
perceived self esteem and DEM took about 45 minutes per subject and were
completed within one test session by all subjects.
The study was conducted in accordance with the requirements of the Queensland
University of Technology Human Research Ethics Committee. All participants were
given a full explanation of the experimental procedures and written informed consent
was obtained from both parent and child. The option to withdraw from the study at
any time was explained to both parent and child. All protocols were in accord with
the guidelines of the Declaration of Helsinki.

The effect of amblyopia on fine motor skills in children. Chapter 4
70
4.3.4 Statistical Analysis
All data were tested for normality using the Kolmogorov-Smirnov test. Where the
data were normally distributed, the results from the amblyopes were compared with
those of the control group using one-way ANOVA (Statistical Package for the Social
Sciences – SPSS V14), with a significance level of 0.05. When statistically
significant differences were found between means, Bonferroni post-hoc tests were
used. Non-parametric tests were used where the data were not normally distributed.
Pearson’s correlation co-efficients were calculated to explore the relationships
between vision characteristics and fine motor skills performance; to account for
multiple comparisons, statistical significance was adjusted to 0.01 (Curtin and Schulz
1998). General linear multiple regression models were examined to investigate the
independent influence of subject visual characteristics on fine motor skills scores.
The impact of collinearity among explanatory factors was examined by calculation of
variance inflation factors (VIF) (Ryan 1997); multi-collinearity (unacceptably high
degree of correlation between investigated factors) was defined as a VIF value of 3
or more (Ryan 1997).

The effect of amblyopia on fine motor skills in children. Chapter 4
71
Table 4.1: Sub-items comprising Visual-motor control and Upper-limb speed
and dexterity items of BTOMP (Bruininks 1978)
Visual Motor Control - all tasks are done with preferred hand
Sub item Description Record
1: Cutting circle Cuts out a bold circle embedded within six concentric circles.
Number of errors 2: Drawing through crooked path
Draws a pencil line through a crooked path.
3: Drawing through straight path
Draws a pencil line through a straight path.
4: Drawing through curved path
Draws a pencil line through a curved path.
5: Copying circle
Copies a geometric shape. Accuracy of shape reproduction following specific scoring guidelines
6: Copying triangle
7: Copying diamond
8: Copying overlapping shapes
Upper Limb Speed and Dexterity – all tasks are done with preferred hand except for item 2 (which requires both hands). A practice trial precedes each test run.
Sub item Description Record
1: Placing pennies in a box Places pennies one at a time into an open box.
The number of pennies placed into the box correctly in 15 seconds
2: Placing pennies in two boxes with both hands
Simultaneously picks up a penny with each hand and places the pennies into separate boxes. The subject is given a maximum of 50 seconds to place seven pairs of pennies into the boxes correctly.
The time taken to complete the task. A time of 50 seconds is recorded if the subject places fewer than seven pairs of pennies into the boxes correctly.
3: Sorting shape cards Sorts a mixed deck of red and blue cards into two piles, separating them by colour.
The number of cards correctly sorted in 15 seconds.
4: Stringing beads Strings beads onto a shoelace. The number of beads placed correctly in 15 seconds.
5: Displacing pegs
Displaces pegs with 2 mm base diameter on a pegboard, moving each peg to the hole directly above it.
The number of pegs displaced correctly in 15 seconds.
6: Drawing vertical lines Draws straight lines between pairs of horizontal lines.
The number of vertical lines drawn correctly in 15 seconds. Accuracy following specific test guidelines.
7: Making dots in circles Makes a pencil dot inside each of a series of circles
The number of circles dotted correctly in 15 seconds.
8: Making dots Makes pencil dots on a blank page The number of separate dots made in 15 seconds.

The effect of amblyopia on fine motor skills in children. Chapter 4
72
4.4 Results
The amblyopic children had a greater inter-ocular difference in VA than age-matched
control children, had poorer VA in their best seeing eye and were less likely to have
normal stereopsis (p<0.05). Sixty-five of the amblyopic subjects (80%) and one
control subject (3%) wore a hyperopic refractive correction. No significant
differences in age or gender were found between the amblyopic and control groups.
Table 4.2 summarises the mean and standard errors for the age, gender and vision
characteristics of the two groups and presents the results of statistical analysis for
differences between the groups.
On average the subjects with amblyopia had 0.09 logMAR VA in the better eye and
0.38 logMAR in the worst eye. In the control group there was very little difference
between eyes (-0.006 logMAR in the better eye; 0.004 logMAR in the worst eye). In
addition to significant differences between the amblyopia and control groups (F(1,117)
= 21.59; p<0.000) and between sub-groups (F(5,113) = 5.58; P<0.000), post hoc testing
indicated significant differences in VA in the better eye between the control group
and the infantile esotropia and acquired strabismus amblyopic sub-groups.
Amblyopic subjects with acquired strabismus had the least inter-ocular difference in
VA (0.13 logMAR), whilst those with deprivation amblyopia had the greatest mean
difference in inter-ocular VA (1.27 logMAR). These variations between sub-groups
were statistically significant (F(5,113) = 17.95; P<0.000), with the differences also
reaching significance between the deprivation group and all other amblyopia sub-
groups and the control group (Table 4.2).
The stereopsis scores were not normally distributed, but rather there was a floor and
ceiling effect because there were many subjects whose stereopsis was equal to or
better than the highest stereoacuity level tested (40”) and many who could not pass

The effect of amblyopia on fine motor skills in children. Chapter 4
73
the test at any level. Subjects were therefore grouped according to their stereopsis
level; “nil” if no stereoscopic response could be measured, “reduced” if response
indicated stereopsis between 800 and 60 seconds of arc and “normal” if response
indicated stereopsis better than or equal to 40 seconds of arc. The majority of control
group subjects (89%) had normal stereopsis (≤ 40 seconds of arc) (Fielder and
Moseley 1996) compared with only six percent of the amblyopic group. Most
subjects with infantile esotropia (88%) had no measurable stereopsis, whilst, 73% of
anisometropic amblyopes had reduced levels of stereopsis, with 20% of the
anisometropes having normal stereopsis. The variation in level of stereopsis was
significant both between the amblyopic and control groups (χ2 (df=2) = 82.47; p<0.000)
and between subgroups (χ2(df=10) = 111.22; p<0.000)(Table 4.2).
Fine motor skills involving VMC tasks and ULSD tasks were poorer in amblyopic
subjects than in control subjects, both in terms of overall scores and sub-item results.
Significant differences in performance were found between the amblyopic and
control groups on three of the eight sub-items measured in the VMC subtest (drawing
straight path, copying triangle, copying diamond) and on six of the eight sub-items
measured in the ULSD item (pennies in box, sorting cards, stringing beads,
displacing pegs, drawing vertical lines, making dots). Median and range for sub-
items scores and sub-item sums (which determine the item scores) are given in Table
4.3, together with significance values for tests of difference between groups. These
data are not normally distributed and so non-parametric tests were used.

Table 4.2: Age, gender and vision characteristics of test and age-matched control groups.
Control
Total Amblyopia
Group
STATISTICAL SIGNIFICANCE Between Amblyopia and
Control Group Infantile
Esotropia Acquired
Strabismus Anisometropia Mixed Deprivation
STATISTICAL SIGNIFICANCE
One-Way ANOVA Between amblyopic
aetiology groups and control group
N=37 N = 82 p N=17 N=28 N=15 N=13 N=9 p
Age (years) 8.3 (1.3) 8.2 (1.7) 0.06 a 0.807 7.79 (.44) 8.11 (.30) 8.47 (.38) 8.33 (.58) 8.64 (.40) 0.51 a 0.770
Gender (% Female) 48.6% 54.9% 0.26 b 0.613 52.9% 67.9% 26.7% 53.8% 66.7% 7.81 b 0.167
Stereopsis
Nil 0 (0.0%) 50 (61%)
82.47
(df=2) <0.000
15 (88%) 18 (64%) 1 (7%) 9 (69%) 7 (78%)
111.22
(df=10) <0.000 800 – 60 sec arc 4 (11%) 27 (33%) 2 (12%) 8 (29%) 11 (73%) 4 (31%) 2 (22%)
≤ 40 sec arc 33 (89%) 5 (6%) 0 (0 %) 2 (7%) 3 (20%) 0 (0%) 0 (0%)
Inter Ocular Difference in VA (logMAR) 0.02 (0.00) 0.31 (0.06) 10.97 a 0.001 0.26 (0.12) 0.13 (0.03) 0.22 (0.03) 0.22 (0.04) 1.27 (0.37) 17.95 a <0.000
VA in Best Eye (logMAR) -0.01 (0.01) 0.10 (0.01) 21.59 a <0.000 0.10 (0.03) 0.12 (0.03) 0.08 (0.03) 0.09 (0.03) 0.02 (0.04) 5.58 a <0.000
VA in Worst Eye (logMAR) 0.00 (0.01) 0.38 (0.05) 29.55 a <0.000 0.36 (0.11) 0.25 (0.04) 0.30 (0.42) 0.31 (0.05) 1.08 (0.24) 20.37 a <0.000
Refractive error (dioptres)c 0.08 (0.08) 2.30 (0.25) 49.47 a <0.000 1.21 (0.42) 3.72 (0.48) 3.00 (0.40) 4.03 (0.39) 0.53 (0.43) 23.75 a <0.000
a one-way ANOVA F(5,113) b Chi-Square df = 5 for AGE; df = 1 for Binocular for amblyopic v control and df = 5 for aetiology subgroup analysis
c Spherical equivalent refractive error averaged between eyes
74

The effect of amblyopia on fine motor skills in children. Chapter 4
75
Age-standardised scaled scores, calculated from the sub-item sum (Bruininks 1978),
were significantly lower in the amblyopic group compared with the control group for
both the VMC item and the timed ULSD item (p<0.05). The magnitude of
difference between groups was greater for the timed ULSD item, with the amblyopes
scoring on average 3.70 standard points lower than controls in this item, whilst the
difference between amblyopes and controls was 1.73 standard points for the VMC
item (Table 4.4).
An estimate of the level of clinical performance on an overall item can be derived
from the age-standardised scaled score by referring to published normative data
(Bruininks 1978). For both fine motor skills domains, a greater proportion of the
amblyopic group had below average scores than the control group and less of the
amblyopic group achieved above average scores (VMC χ2 = 6.5; p=0.040; ULSD χ2
= 9.35; p=0.009) (Figure 4.1). Differences were also evident between subgroups
(VMC χ2 = 19.13; p=0.039; ULSD χ2 = 20.18; p=0.028) (Table 4.5).
Fine Motor Skills Clinical Performance Grading
Amblyopic Control N.a.N. Amblyopic Control
% o
f Gro
up
0
20
40
60
80
100
Visual Motor Control Upper Limb Speedand Dexterity
Below AverageAverageAbove Average
Figure 4.1: Proportion of amblyopic and control groups in clinical performance
bands

Table 4.3: Median (Range) for fine motor skills sub-tests for amblyopic and age-matched control subjects** stat sig 0.05 level
Control N=37
All Amblyopes N=82
χ2 p
Infantile Esotropia
N=17
Acquired Strabismus N=28
Anisometropia N=15
Mixed N=13 Deprivation N=9
Kruskal Wallis
p
VISUAL MOTOR CONTROL
7-1 CUTTING CIRCLE 4 (0 - 4) 4 (0 – 4) 0.065 4 (0 - 4) 4 (0 - 4) 4 (2 - 4) 4 (3 - 4) 4 (3 - 4) .138
7-2 DRAWING CROOKED PATH 4 (2 - 4) 4 (0 – 4) 0.053 4 (1 - 4) 4 (0 - 4) 4 (2 - 4) 4 (2 - 4) 4 (2 - 4) .157
7-3 DRAWING STRAIGHT PATH 4 (2 - 4) 4 (0 – 4) 0.017** 3 (2 - 4) 4 (2 - 4) 4 (1 - 4) 3 (0 - 4) 4 (4 - 4) .001**
7-4 DRAWING CURVED PATH 3 (0 - 4) 3 (0 – 4) 0.352 2 (0 - 4) 3 (2 - 4) 4 (0 - 4) 2 (0 - 4) 4 (2 - 4) .063
7-5 COPYING CIRCLE 2 (1 - 2) 2 (0 – 2) 0.147 2 (1 – 2) 2 (0 – 2) 4 (2 - 4) 2 (2 – 2) 2 (2 – 2) .024**
7-6 COPYING TRIANGLE 2 (2 - 2) 2 (0 – 2) 0.027** 2 (1 – 2) 2 (0 – 2) 2 (1 – 2) 2 (1 – 2 ) 2 (2 – 2) .064
7-7 COPYING DIAMOND 2 (1 - 2) 1 (0 – 2) 0.004** 1 (0 – 2) 1 (0 – 2) 2 (0 – 2) 1 (0 – 2) 2 (1 – 2) .021**
7-8 COPYING PENCILS 2 (0 - 2) 2 (0 – 2) 0.861 2 (0 – 2) 1 (0 – 2) 2 (0 – 2) 2 (0 – 2) 2 (1 – 2) .167
SUM ITEM 7 22 (10 - 24) 21 (6 - 24) 0.014** 19 (6 - 24) 20.50 (8 - 24) 22 (12 - 24) 20 (8 - 23) 23 (22 - 24) .002**
UPPER LIMB SPEED AND DEXTERITY
8-1 PENNIES IN BOX 5 (1 - 6) 4 (1 - 6) 0.003** 4 (1 - 6) 3.5 (1 - 5) 4 (2 - 6) 4 (3 - 5) 5 (3 - 6) .012**
8-2 PENNY PAIRS IN BOX 10 (6 – 10) 9 (1 - 10) 0.088 9 (1 – 10) 9 (4 - 10) 10 (7 - 10) 9 (7 -10) 10 (9 -10) .014**
8-3 SORTING CARDS 4 (1 – 7) 3 (1 -7) 0.036** 3 (1 - 7) 3 (1 - 5) 3 (2 - 6) 3 (2 - 7) 4 (3 - 6) .045**
8-4 STRINGING BEADS 2 (1 – 5) 2 (1 – 4) 0.023** 2 (1 - 4) 1.5 (1 - 3) 2 (1 - 3) 2 (1 - 3) 2 (1 - 3) .097
8-5 DISPLACING PEGS 4 (3 – 7) 4 (2 – 7) 0.046** 4 (2 - 5) 4 (2 -5) 4 (3 - 6) 4 (3 - 6) 5 (4 - 7) .043**
8-6 DRAWING VERT LINES 6 (3 – 8) 5 (0 - 8) 0.000** 5 (1 - 8) 4 (0 - 6) 5 (2 - 7) 5 (2 - 7) 5 (4 - 6) .003**
8-7 DOTS IN CIRCLES 5 (2 – 7) 4 (1 – 8) 0.062 5 (2 - 7) 4 (1 - 6) 5 (2 - 7) 4 (3 -7) 6 (4 - 8) .001**
8-8 MAKING DOTS 6 (3 – 7) 5 (1 – 9) 0.048** 6 (1 - 9) 4.5 (2 - 8) 6 (2 -8) 6 (1 - 8) 6 (5 - 8) .022**
SUM ITEM 8 42 (24 - 53) 37 (11 - 50) 0.000** 39 (11 - 49) 35 (17 - 42) 40 (23 - 48) 37 (26 - 46) 41 (35 - 50) .000**
76

Table 4.4: Mean (standard error) for age standardised fine motor skills scores for amblyopic and age-matched control subjects Bold Italic font indicates stat sig differences between groups ** Post hoc Bonferroni indicates sig diff
Table 4.5: Proportion of sub-groups scoring in above average or higher ranges on fine motor skills tasks
AMBLYOPIC SUBGROUPS All
Amblyopes N=82
Control N=37
χ2 (df=10)
Asymp. Sig.
(2-sided) p
χ2 (df=2)
Asymp. Sig.
(2-sided) p
Infantile Esotropia
N=17
Acquired Strabismus
N=28
Anisometropia N=15
Mixed N=13
Deprivation N=9
Visual Motor Control
Above Average 8 (47%) 14 (50%) 9 (60%) 5 (38%) 9 (100%) 45 (55%) 29 (78%)
19.13 0.039 6.46 0.040 Average 9 (53%) 13 (46%) 5 (33%) 7 (54%) 0 (0%) 34 (41%) 8 (22%)
Below Average 0 (0%) 1 (4%) 1 (7%) 1 (8%) 0 (0%) 3 (4%) 0 (0%)
Upper Limb Speed and Dexterity
Above Average 6 (35%) 7 (25%) 3 (20%) 5 (39%) 6 (67%) 27 (33%) 22 (59%)
20.18 0.028 9.35 0.009 Average 9 (53%) 13 (46%) 10 (67%) 6 (46%) 3 (33%) 41 (50%) 14 (38%)
Below Average 2 (12%) 8 (29%) 2 (13%) 2 (15%) 0 (0%) 14 (17%) 1 (3%)
Control N=37
All Amblyopes N=82
ANOVA Infantile Esotropia
N=17
Acquired Strabismus
N=28
Anisometropia N=15
Mixed N=13
Deprivation N=9
ANOVA F(1,117) p F(5,113) p
STANDARD
SCORE VMC 20.57 (0.55) 18.84 (0.46) 4.95 0.028 18.94 (0.87) 18.07 (0.82) 19.33 (1.15) 17.92 (1.30) 21.56 (0.75) 2.31 0.049
STANDARD
SCORE
ULSD
19.89 (0.86)** 16.46 (0.58) 12.65 0.001 17.29 (1.22) 14.71(1.01)** 16.27 (1.28) 17.23 (1.60) 19.56(1.35) 3.946 0.002
TOTAL FMS
SCORE 40.73(1.11)** 35.30 (0.79) 15.536 <0.000 36.24 (1.64) 32.79 (1.28)** 35.60 (1.74) 35.15(1.87) 41.11 (2.25)** 5.472 <0.000
77

The effect of amblyopia on fine motor skills in children. Chapter 4
78
4.4.1 Impact of aetiology
Subgroup aetiology significantly impacted on the age-standardised scaled score for
both VMC and ULSD items and the overall fine motor skills score (ANOVA, F(5,113);
p <0.05,) (Table 4.4 and Figures 4.2 and 4.3). Post hoc testing identified a significant
difference between the acquired strabismic and the control group in the timed ULSD
item, and the acquired strabismic group scored significantly poorer than both the
control and deprivation groups for the overall fine motor skills score.
4.4.2 Impact of binocularity
The level of stereopsis significantly impacted score achieved for both the visual
motor control (VMC) item (F 2,116 = 4.712; p=0.011) and the upper limb speed and
dexterity (ULSD) item (F 2,116 = 4.178; p=0.018) as well as on the total fine motor
skills score (F 2,116 = 6.405; p=0.002). Post hoc analysis indicated that the subgroup
with normal stereopsis performed significantly better than both the no stereopsis and
reduced stereopsis groups both on the ULSD item and overall fine motor skills score
and performed better than the reduced stereopsis group on the VMC item (Table 4.6).
Table 4.6: Fine motor skills scores for stereoscopic groups * ‡ Post hoc Bonferroni indicates sig diff
No stereopsis N=50
Reduced stereopsis
N=31
Normal Stereopsis
N=38
ANOVA
F(2,116) p
Visual Motor Control (VMC)
Standard score 19.02 (0.58) 18.03 (0.77)* 20.84 (0.53)* 4.712 0.011
Upper Limb Speed and
Dexterity (ULSD)
Standard Score
16.62 (0.74)‡ 16.45 (0.90)* 19.47 (0.83)* ‡ 4.178 0.018
Fine Motor Skills
Total Score 35.82 (1.02)‡ 34.81 (1.39)* 40.32 (1.00)*‡ 6.405 0.002

The effect of amblyopia on fine motor skills in children. Chapter 4
79
Infa
ntile
eso
tropi
a (n
=17)
Acqu
ired
stra
bism
us (n
=28)
Anis
omet
ropi
a (n
=15)
Mix
ed (n
=13)
Dep
rivat
ion
(n=9
)
N.a
.N.
All A
mbl
yope
s (n
=82)
Con
trol (
n=37
)
Vis
ual-m
otor
con
trol
stan
dard
ised
sco
re
16
18
20
22
24
Figure 4.2: Visual-motor control standardised score for amblyopia and control groups.
Infa
ntile
eso
tropi
a (n
=17)
Acqu
ired
stra
bism
us (n
=28)
Anis
omet
ropi
a (n
=15)
Mix
ed (n
=13)
Dep
rivat
ion
(n=9
)
N.a
.N.
All A
mbl
yope
s (n
=82)
Con
trol (
n=37
)
Upp
er L
imb
spee
d an
d de
xter
ity s
tand
ardi
sed
scor
e
14
16
18
20
22
Figure 4.3: Upper-limb speed and dexterity standardised score for amblyopia and control groups.

The effect of amblyopia on fine motor skills in children. Chapter 4
80
4.4.3 Determinants of fine motor skills performance
There were a number of significant correlations between the visual characteristics
measured in this study, as well as between some of the vision factors and the fine
motor skills scores (p<0.01) (Table 4.7). Multiple regression analysis was employed
to determine which visual characteristics could best predict any decrements in fine
motor skills performance when the inter-correlation between the visual factors was
taken into account.
Table 4.7: Intercorrelations between vision parameters examination and fine
motor skills performance ** indicates statistically significant correlation
VISION CHARACTERISTICS FINE MOTOR SKILLS RESULT
BINOCULAR AVERAGE
REFRACTIVE ERROR
VA WORST EYE
VA BEST EYE
STANDARD SCORE
VMC
STANDARD -SCORE
ULSD
TOTAL FINE MOTOR SKILLS SCORE
STRABISMUS .601** -.484** -.080 -.392** .267** .281** .354**
BINOCULAR -.304** -.388** -.270** .060 .139 .136
AVERAGE REFRACTIVE ERROR .195 .324** -.182 -.285** -.311**
VA WORSE EYE .243** .013 -.074 -.048
VA BEST EYE -.147 -.018 -.093
** Correlation is significant at the 0.01 level (2-tailed).
The influence of VA (in either eye) and refractive error, together with history of
strabismus, (which included participants with a history of infantile esotropia,
acquired strabismus or mixed aetiology) and level of binocular function were
investigated in a general linear model to determine their independent influences on
fine motor skills scores. The model was tested to determine the influence of these
participant qualities on the overall fine motor skills score (sum of VMC and ULSD
standardised scores). The general linear multiple regression model indicated that
when the inter-relationships between these subject characteristics was taken into
account, fine motor skills performance was significantly associated with a history of

The effect of amblyopia on fine motor skills in children. Chapter 4
81
strabismus (F1,75 = 5.428; p =0. 022) but not to the level of binocular function,
measures of refractive error, or of VA in best and worst eyes (Table 4.8).
Table 4.8: Multiple linear regression model of fine motor skills performance in
total group. Bold Italics indicates statistically significant association
N Mean Std error Regression coefficient
(B) Std. Error
F significance
Partial Eta 2
Strabismus Yes 58 34.43 1.27 36.109 2.218 5.428 .022 .046 No 61 39.04 1.09 40.715 1.119
Stereopsis Nil 50 37.64 1.26 -.063 2.385 1.862 .160 .032
Reduced 31 34.86 1.25 -2.836 1.968 Normal 38 37.70 1.55 0(a) .
Average Refractive Error -.517 .329 2.470 .119 .022
VA in Worst Eye -.162 1.977 .007 .935 .000
VA in Best Eye 4.630 5.237 .781 .379 .007
a This parameter is set to zero because it is redundant.
4.5 Discussion
Visual acuity and binocular vision were assessed in a group of amblyopic children,
and their fine motor skills were tested under habitual binocular viewing conditions,
using an age-appropriate standardised test. Their performance was compared with
that of an age-matched control group and the influence of aetiology and binocularity
on fine motor skills performance was examined in a multiple regression model that
accounted for inter-correlation between possible explanatory factors.
Fine motor skills performance of children with amblyopia was poorer than age-
matched control children on 9 of 16 fine motor skills sub-items. The mean age-
standardised scores for both visual motor control (VMC) and upper limb speed and
dexterity (ULSD) items were lower in the amblyopic group than the control group.
The deficits in performance for amblyopic compared to the control children were
more marked in the timed tasks of manual dexterity that comprise the ULSD item.

The effect of amblyopia on fine motor skills in children. Chapter 4
82
Importantly, comparison of the distributions of overall scores indicated that the
consistent decrement in the amblyopic group was not a consequence of a few
individuals showing large deficits, but rather a global reduction in performance
overall. The median scores were lower in the amblyopic group however, the
negative skews of the distributions were not greater.
When the fine motor skill performance scores were compared to published normative
data, a range in motor skills ability is seen in both groups, however, a larger
proportion of the amblyopic group had scores which fell in the below average
performance range and a smaller proportion performed in the above average range
for both fine motor skills domains (Figure 4.1). The difference between amblyopia
and control groups was more profound in the battery of tasks that required speed and
dexterity (ULSD) rather than tasks that required accuracy and control (VMC). This
finding agrees with the results reported in a recent study that used the Movement
Assessment Battery for Children (Movement ABC) to investigate motor control in a
group of children with congenital esotropia aged four to six years (Caputo et al.
2007), where it was found that, in addition to poorer total scores, the strabismic
children performed worse than age-matched controls on the subscale that assessed
manual dexterity (Caputo et al. 2007). A speed-accuracy trade-off has been
proposed when quantifying the reaching and grasping behaviour in amblyopic
subjects (Grant et al. 2007). During the timed ULSD tasks, where for the majority of
sub-items only 15 seconds was allowed to perform the tasks, there was less
opportunity for visual feedback to influence the outcome score and no opportunity
for compensatory slowing of response times. It is possible that the amblyopic
children adopted a compensatory strategy of slowing down their response in order to

The effect of amblyopia on fine motor skills in children. Chapter 4
83
accurately complete the drawing tasks required for the VMC tasks, because slowed
response times provide opportunity for visual feedback during the task.
In a study of prehension (reaching and grasping) characteristics in adults with
amblyopia, Grant et al.(2007) found that amblyopic subjects, under both binocular
and non-dominant eye viewing conditions, showed a range of deficits in their
approach to an object and when closing and applying grasp. The differences
between their amblyopic subjects and controls included prolonged execution times
and more errors, the extents of which co-varied with the existing depth of amblyopia,
although not its aetiology. Our finding that ULSD tasks are impacted to a greater
extent by the presence of amblyopia than VMC tasks agrees with the finding of
Grant et al.(2007) that amblyopes have the greatest difficulties with motor
performance tasks when they are timed. Grant et. al.(2007) suggested that the level
of binocular function could discriminate the degree of impairment on some, but not
all, key indices of prehension control and that depth of amblyopia influences
performance on average movement execution time. However, the confounding
influence of inter-correlation between VA deficit and loss of binocular function,
whilst acknowledged, was not accounted for in their analysis.
We anticipated that the aetiology of amblyopia could influence performance on fine
motor skills tasks due to hypothesised differences in visual neural development
between those with a history of blur (anisometropia and form deprivation) and those
with a history of ocular misalignment (strabismus). Indeed, we found significant
differences in performance between subgroups and that not all amblyopic groups
displayed a deficit in fine motor skills. Whilst we recognise that the deprivation
group had the smallest sample size (n=9), their fine motor skills performance

The effect of amblyopia on fine motor skills in children. Chapter 4
84
equalled that of the control group and all of this group performed in either the
average or above average performance levels, even though this group had the highest
inter-ocular VA deficit and few of these subjects had binocular perception. Subjects
with acquired strabismus, whose ocular misalignment was diagnosed later than 12
months of age, had the lowest fine motor skills scores, even though this group had
the least inter-ocular VA deficit. This suggests that factors other than the depth of
amblyopia influence performance on the fine motor skills tasks measured. It has
been suggested that two distinct developmental anomalies account for the differential
pattern of vision losses in amblyopia between aetiological groups (McKee et al.
2003). Hand-eye co-ordination skills are normally acquired over the period extending
through infancy, beyond the critical period for amblyopia, until around 12 years of
age (Grant et al. 2007). Our finding that strabismus has the greatest negative
influence on fine motor skills performance may indicate that the neurological
changes associated with strabismus have a detrimental influence on the development
of hand-eye co-ordination skills.
The variation in the proportion of subjects in each aetiological group who had
binocular function was similar to that reported by McKee et al. (McKee et al. 2003),
who found that all the normal control subjects and two thirds of anisometropes
passed their two tests of binocular function, whilst only about 10% of strabismics
showed a binocular response. In our study, many of the strabismic amblyopia
subjects who had VA in the treated eye almost equal to that of the preferred eye gave
no binocular response, however, the majority (93%) of the anisometropic subgroup
had some level of measurable stereopsis, even though only 20% of the anisometropes
had normal levels of stereopsis. Fine motor skills performance was worst in the
binocular function group that had reduced stereopsis, compared with those who had

The effect of amblyopia on fine motor skills in children. Chapter 4
85
normal stereopsis and also those who had no measurable stereopsis (suppression
confirmed by Mirror-Pola). However, when analysed in the multiple regression
model that takes into account the inter-correlation between strabismus and stereopsis,
the influence of level of stereopsis was not found to be significant.
Previous studies have attempted to correlate performance on fine motor skills with a
deficit in VA or reduced stereopsis (Hrisos et al. 2006; Mazyn et al. 2007). When
ball catching skills are assessed, subjects with poor stereopsis have poorer
interceptive performance under temporal constraints and respond less well to specific
training to improve performance (Mazyn et al. 2007). Lack of stereopsis has been
suggested to account for delayed neuro-developmental performance of infants with
strabismus (Rogers et al. 1982), and in non-strabismic amblyopes, stereopsis,
independent of visual acuity, was found to influence performance on visual motor
integration (design copying) (Hrisos et al. 2006). However, a recent study that
reported improvements in motor co-ordination in children who underwent late
surgery for congenital esotropia (strabismus) could not relate the changes to post-
operative changes in stereopsis (Caputo et al. 2007). Our finding that VA in the
better eyes of normal subjects was on average slightly better than that in the
dominant eyes of amblyopic subjects, agrees with previous studies (McKee et al.
2003; Grant et al. 2007), and post hoc testing confirmed that subjects with a history
of infantile esotropia or acquired strabismus had the poorest VA in their better eye.
However, VA in either the better or worse eye did not influence performance on fine
motor skills and therefore cannot account for the difference in motor skills scores
observed between the groups. Reductions in VA and reduced stereopsis are highly
related making it difficult to disentangle the relative contributions of each to motor
control. We have tried to account for these known inter-relationships by examining

The effect of amblyopia on fine motor skills in children. Chapter 4
86
fine motor skills scores in a multiple regression model that took into account the
inter-correlation that exists between vision characteristics. When our general linear
model which included the history of strabismus and the level of binocular function
and measures of VA in better and worse eyes and mean refractive error was applied,
only the presence of strabismus emerged as a significant influencing factor on fine
motor skills outcome performance.
This study explored the possible functional impact associated with amblyopia in a
childhood population and has demonstrated that amblyopia has a functional impact
that goes beyond the monocular VA deficit and loss of binocular function that define
the condition. We have shown that children with amblyopia perform more poorly on
a range of standardised, age-appropriate tasks designed to assess the motor skills
needed in practical, everyday tasks. This particularly applies to amblyopic children
with strabismus, and the impact of amblyopia was greatest on manual dexterity tasks
that require speed and accuracy. Importantly, our results represent the first time that
the relative contribution of various vision characteristics on fine motor skills
performance has been determined in a large sample of amblyopic subjects from a
range of aetiologies. This study has not separated the amblyopic children into
treated and untreated cohorts, therefore we cannot comment on whether successful
treatment of amblyopia results in a relative reduction in the magnitude of a fine
motor skills deficit. We are currently exploring the relationship between these fine
motor skills scores and standardised measures of educational performance in a larger
group of normal children. Clinicians may wish to make parents and carers of
children diagnosed with amblyopia aware of this more global impact when
discussing the consequences of the condition.

The effect of amblyopia on fine motor skills in children. Chapter 4
87
4.6 Acknowledgements
This work was supported by Queensland University of Technology (QUT) and the
Institute of Health and Biomedical Innovation (IHBI). The authors thank all the
participants for their co-operation; the staff of Dr Gole’s practice for their help in
recruitment; and Diana Battisutta and Cameron Hurst of IHBI for assistance with
biostatistics. This manuscript is based on data presented as a poster at the
Association for Research in Vision and Ophthalmology meeting in May 2007, Fort
Lauderdale, Florida.

The effect of amblyopia on self-esteem in children. Chapter 5
88
Chapter 5 RESULTS
SELF ESTEEM
Part A
"The effect of amblyopia on self-esteem in children."
Webber AL, Wood JM, Gole GA, Brown B. (2008) “The effect of amblyopia on
self-esteem in children.” Optom Vis Sci ;85(11):1074-1081.
5.1 Abstract
Aim: In an investigation of the psychosocial impact of amblyopia on children, the
perceived self-esteem of children who had been treated for amblyopia was compared
with that of age-matched controls. The influence of amblyopia condition or
treatment factors that may impact self-perception scores was also explored.
Methods: Children with a history of treatment for amblyopia (n=47; age 9.2 ± 1.3
years) and age-matched controls (n=52; age 9.4 ± 0.5 years) completed a
standardised age-appropriate questionnaire based evaluation of perceived self-esteem
(Harter Self Perception Profile for Children). Their vision characteristics and
treatment regimen were also recorded. Bivariate correlation analysis was used to
investigate the amblyopic characteristics and treatment factors that may have
influenced self-perception scores in the amblyopic group.

The effect of amblyopia on self-esteem in children. Chapter 5
89
Results: Children treated for amblyopia had significantly lower social acceptance
scores than age-matched control children. In other areas related to self-esteem,
including scholastic competence, physical appearance, athletic competence,
behavioural conduct and global self worth, amblyopic children gave scores similar to
those of control children. Within the amblyopic group, a lower social acceptance
score was significantly correlated with a history of treatment with patching but not
with a history of strabismus or wearing of glasses.
Conclusions: Self-perception of social acceptance was lower in children treated for
amblyopia compared with age-matched controls. A reduction in these scores was
associated with a history of patching treatment but not with a history of strabismus or
spectacle wear.
Keywords
Amblyopia, strabismus, self-esteem, psychosocial,

The effect of amblyopia on self-esteem in children. Chapter 5
90
5.2 Introduction
Amblyopia is the most prevalent visual disorder in children, affecting approximately
three percent of the population (Attebo et al. 1998; Brown et al. 2000). It is
clinically defined by a difference of two lines in visual acuity between eyes in the
absence of ocular pathology, and in the presence of a predisposing amblyogenic
factor (such as strabismus, anisometropia or deprivation) during the period of
development of the visual system (from birth to about 8 years of age) (Daw 2006).
Amblyopia is usually treated by correction of the underlying condition (surgery or
refractive correction with glasses or contact lenses) followed by a period of occlusion
or atropine penalisation of the non-amblyopic eye to promote neurodevelopment of
the affected visual pathways. Treatment has traditionally been applied only during
childhood, the time of optimum plasticity of visual development, although recent
randomised controlled treatment trials have provided evidence for successful
treatment outcomes in older children and adolescents (The Pediatric Eye Disease
Investigator Group 2005b).
The psychosocial impact of strabismus and amblyopia and their treatment on an
individual’s quality of life have gained recent attention in the literature (Burke et al.
1997; Choong et al. 2004; Archer et al. 2005; Koklanis et al. 2006). Early literature,
mainly anecdotal, reported on the psychological implications of cosmetically
obvious strabismus (Alberman et al. 1971; Tolchin and Lederman 1977), but more
recent studies have examined the effect of strabismus and amblyopia on an adult’s
self-esteem, interpersonal relationships and employability (Olitsky et al. 1999; Coats
et al. 2000; Williams and Harrad 2006). These studies have provided an
understanding of the adult’s perspective on the psychosocial impact of amblyopia,

The effect of amblyopia on self-esteem in children. Chapter 5
91
but few studies have specifically investigated the impact of the condition and its
treatment from the perspective of a child with amblyopia.
While the presence of cosmetically obvious strabismus does not appear to influence
how young children, aged from three to eight years, select a playmate (Johns et al.
2005), children from about six years of age have been reported to develop a negative
perception towards individuals with strabismus and children with noticeable
strabismus are viewed negatively by teachers (Uretmen et al. 2003). However,
following strabismus surgery improvements in social, emotional and functional
measures of a child’s health status have been reported (Archer et al. 2005).
Many children with amblyopia need to wear glasses to correct their refractive error,
even after completion of occlusion or penalisation amblyopia therapy. Individuals
who wear glasses rate themselves lower in terms of their physical attractiveness
(Terry and Brady 1976), which, as well as affecting psychological well-being, can
affect motivation and behaviour (Harter 1999). While quality of life scores are lower
in adult spectacle wearers than in either contact lens wearers or adults who have had
refractive surgery (Pesudovs et al. 2006), recent studies of self-esteem in myopic
children have found self-perception scores are not associated with spectacle wear
(Dias et al. 2002; Lyon et al. 2002; Dias et al. 2005), nor do they change when
refractive correction was changed to contact lenses (Terry et al. 1997). A child who
wears glasses may be perceived by their peers to look smarter, but attitudes about
their shyness, honesty, attractiveness, athleticism and play selection are not
influenced by whether they wear glasses (Wallline et al. 2008).
Treatment of amblyopia by either occlusion or atropine penalisation was found to be
reasonably well accepted by both the child and the parent during randomized

The effect of amblyopia on self-esteem in children. Chapter 5
92
controlled treatment trials (The Pediatric Eye Disease Investigator Group 2003a;
Choong et al. 2004; Hrisos et al. 2004). However, more recent studies have found
that most children report feeling self-conscious and ashamed during amblyopia
treatment, particularly due to patching or wearing glasses, and that it was the
responses of their peers that most influenced their feelings of embarrassment
(Koklanis et al. 2006), and children currently wearing glasses or with a history of
wearing eye patches are approximately 35% more likely to be victims of physical or
verbal bullying (Horwood et al. 2005).
Some conditions that cause amblyopia, such as infantile esotropia, present very early
in life and are therefore treated early in life, while other acquired strabismic
conditions may not manifest until later in early childhood. Treatment regimens also
differ between aetiological groups, in that some amblyopic children will have
undergone surgery for strabismus or media opacity, while others will have required
refractive correction for accommodative strabismus or anisometropia. Some children
will undergo patching for up to six months while others with greater depth of
amblyopia, as is often the case with deprivation amblyopia, may continue on
patching for more prolonged periods. Perhaps children detected and treated by
patching before they enter school and begin to more formally socialise with their
peer group are less likely to feel self-conscious or ashamed of treatment than those
who are of school age when patched and are acquiring a sense of self in general and
self-esteem in particular (Harter 1988).
The self-esteem of a child that has been treated for amblyopia or the relative
influence of condition or treatment factors that may be associated with reduced self-
esteem have not previously been reported. Exploring self-esteem results across

The effect of amblyopia on self-esteem in children. Chapter 5
93
aetiological sub-groups may be informative as well as examining both the wearing of
glasses and influence of patching regime within the analysis of self-esteem in
amblyopic children.
In this study we measured the self-perception profile of children who had been
treated for amblyopia from a range of causes and compared their results with an age-
matched control group. The relationships between self-perception scores and various
subject characteristics implied by the literature to have psychosocial impact (history
of strabismus, wearing of glasses, patching regimen and visual acuity deficit) were
tested.
5.3 Methods
5.3.1 Participants
Ninety-nine children participated in this study, including 47 children who had been
treated for amblyogenic conditions (age 9.2 ± 1.3 years) and 52 age-matched control
subjects (age 9.4 ± 0.5 years). Parents of potential amblyopic group subjects were
identified from the files of a private paediatric ophthalmology practice. Sixty-six
percent of potential subjects were contactable by letter and telephone and were
invited to participate; of these 90% agreed to participate in the study. Control
subjects were recruited from a local primary (elementary) school via a letter to
parents outlining the purpose of the study; 60% of invited students were granted
parental consent to participate in the study. Signed consent was obtained from
participating children and their parent.
All children had received ophthalmological treatment for the underlying
amblyogenic condition (surgery or refractive correction) so did not have cosmetically

The effect of amblyopia on self-esteem in children. Chapter 5
94
obvious strabismus at the time of the study and had concluded occlusion or
penalisation treatment. All subjects were carried in full-term pregnancies and had no
known neurological or ocular disorder (other than refractive error or their
amblyogenic conditions).
5.3.2 Vision assessment
Information regarding clinical diagnosis, cycloplegic refraction (within the previous
12 months) and previous treatment, particularly with regard to patching regimen, was
obtained from the patient records of the amblyopic subjects. From this clinical
information, the subjects were grouped with respect to amblyopic aetiology
(Donahue 2007) as follows:
• Infantile esotropia – history of esotropia prior to 12 months of age (n=7).
• Acquired strabismus – history of strabismus occurring after 12 months of age
(n=15).
• Anisometropic – ≥1.00 D difference in mean spherical refractive error and/or
≥ 1.50 D between the eyes in astigmatism (The Pediatric Eye Disease
Investigator Group 2006) (n=9)
• Mixed – history of both strabismus and anisometropia (n=9)
• Deprivation – history of disturbance of monocular image clarity e.g.
monocular cataract (n=7)
Strabismic subjects were all aligned to within 15 prism dioptres by refractive
correction, by previous surgery or by both.
Subjects who were treated with patching (n=32) were grouped with respect to their
age when patched and duration of patching as follows:
• Age when patched

The effect of amblyopia on self-esteem in children. Chapter 5
95
• Wore patch when of school age (greater than 5 years of age) (n= 23)
• Wore patch before school age (less than 5 years of age) (n=9)
• Duration of patching
• Period of treatment by patching extended beyond 12 months (n=21)
• Period of treatment by patching was less than 12 months (n=11)
• Period elapsed since last patched
• Patched within previous 12 months (n=5)
• Not patched within previous 12 months (n=27)
Visual acuity (VA) was measured using a 3 m logMAR chart, and scored on a letter
by letter basis for each eye separately with the current optical correction (based on
cycloplegic refraction measured within previous 12 months). Level of binocular
function was assessed with the Randot Preschool Stereoacuity test (Birch et al.
1997), chosen for its lack of monocular cues and because the task could easily be
completed in a short time by the age group being tested. Suppression was confirmed
by the Mirror-Pola technique (Siderov 2001) if no stereoscopic response was
obtained on the Randot test.
5.3.3 Self-esteem assessment
Self-esteem was assessed with the Self Perception Profile for Children (SPPC), an
age-appropriate, standardised measure with established validity and reliability that
has been used extensively to measure self-esteem in children in several different
groups of children. (Harter and Pike 1984; Harter 1985; Granleese and Joseph 1994)
The psychometric properties of the SPPC, including validity and reliability, have
been independently established (Marsh and Holmes 1990). This instrument, which
has been used in studies of self-esteem in myopic children (Dias et al. 2002; Dias et
The effect of amblyopia on self-esteem in children. Chapter 5
96
al. 2005), was chosen because it provides testing across several domains important to
children’s lives as well as testing global self-worth. The child completed a 36 item
self-reporting scale consisting of six specific domains described below. Six
questions were asked in each domain, each consisted of two logically opposed
statements, for example, “Some kids would rather play outdoors in their spare time
BUT other kids would rather watch TV”. To reduce response bias, half of the items
started with the more positive statement. The child indicated which statement was
“more true” of themselves and indicated whether the statement was “really true for
me” or “sort of true for me”. Items were scored from one to four, where four
indicated the most and one represented the least adequate self-judgment. Subscale
scores were calculated by averaging the response to each item within a domain.
Thus, the SPPC gives six mean values, one from each domain, that range from one to
four. Age-appropriate normative data are available for the SPPC test (Harter 1985).
The six domains assessed by the SPPC are:
• Scholastic Competence – self perception of competence or ability within the
realm of scholastic or school related performance.
• Social Acceptance – how much the child feels accepted by peers or popular.
• Athletic Competence – the child’s perception of competence in sports and
outdoor games.
• Physical Appearance – the degree to which the child is happy with the way
he/she looks, likes his/her height, weight, body, face, hair, or feels that they are
good-looking.
• Behavioural Conduct – the degree to which children like the way they behave, do
the right thing, act the way they are supposed to, avoid getting into trouble and do
the things they are supposed to do.

The effect of amblyopia on self-esteem in children. Chapter 5
97
• Global Self-Worth - the extent to which the child likes him/herself as a person, is
happy with the way they are leading their life and is generally happy with
him/herself. This is a global judgement of worth as a person, rather than a
domain specific competence or adequacy.
Subjects also completed tests of fine motor skills (Bruiniks Oseretsky Test of Motor
Proficiency (Bruininks 1978)) and the developmental eye movement test (DEM)
(Garzia 1990) during the test session. Complete assessment of perceived self-
esteem, vision, fine motor skills and DEM took about 45 minutes per subject and was
completed within one test session by all subjects
The study was conducted in accordance with the requirements of the Queensland
University of Technology Human Research Ethics Committee and the guidelines of
the Declaration of Helsinki.
5.3.4 Statistical Analysis
The results from the amblyopic group were compared with those of the control group
using independent samples t-test (Statistical Package for the Social Sciences – SPSS
V14), the criterion for statistical significance was 0.05. One-way ANOVA was used
to test for differences between aetiological sub-groups. When statistically significant
differences were found between sub-group means, Bonferroni post-hoc tests were
used to examine where differences lay. Where the data were not normally
distributed, non-parametric chi-squares tests were used to test for differences
between groups. Pearson’s correlation coefficients were calculated to explore the
relationships between amblyopia condition and treatment characteristics and self
perception scores; the criterion for statistical significance was 0.05.

The effect of amblyopia on self-esteem in children. Chapter 5
98
5.5 Results
5.5.1 Sample characteristics
Table 5.1 presents the mean age, gender, and vision measures for the amblyopic and
control children together with the proportion of the groups with a history of
strabismus, history of patching and who wore glasses. These data are also shown for
each amblyopia aetiology sub-group. The amblyopic and control groups were not
significantly different in age or gender.
On average the subjects with amblyopia had 0.07 logMAR VA in the better eye and
0.44 logMAR in the worst eye. In the control group there was very little difference
between eyes (-0.03 logMAR in the better eye; -0.01 logMAR in the worst eye). In
addition to significant differences between the amblyopic and control group and
between subgroups (p<0.05), post hoc testing indicates that participants whose
amblyopia was caused by visual deprivation had the worst VA in their amblyopic eye
and the greatest inter-ocular VA difference compared to all other amblyopia
subgroups and controls.
The stereopsis scores were not normally distributed, but rather there was a floor and
ceiling effect because there were many control subjects whose stereopsis was equal
to or better than the highest stereoacuity level tested (40”) and many amblyopes who
could not pass the test at any level. Subjects were therefore grouped according to
their stereopsis level; “nil” if no stereoscopic response could be measured, “reduced”
if response indicated stereopsis between 800 and 60 seconds of arc and “normal” if
response indicated stereopsis better than or equal to 40 seconds of arc. The majority
of control group subjects (96%) had normal stereopsis (≤ 40”)(Fielder and Moseley
1996) compared with only six percent of the amblyopic group.

Table 5.1: Mean (SD) Age, visual acuity and refractive characteristics of groups. Bold Italics font indicates statistically significant differences between
groups
Total Amblyopia Group Control
Tests for difference Between Amblyopia and Control Group
Infantile Esotropia
Acquired Strabismus Anisometropia Mixed Deprivation
One-Way ANOVA Between Amblyopic
aetiology groups and control group
N = 47 N=52
a t (df=97) b χ2 (df=1) c χ2 (df=2)
p N=7 N=15 N=9 N=9 N=7
a F (5,93) b χ2 (df=5) c χ2 (df=10)
p
Age (years) 9.2 (1.3) 9.4 (0.5) -1.086 a 0.280 9.2 (1.4) 9.1 (1.3) 9.5 (0.9) 9.2 (1.9) 9.1 (0.9) 0.397 a 0.850
Gender (% Female)
23
(49%) 24
(46%) 0.07 b 0.47 3
(43%) 10
(67%) 3
(33%) 3
(33%) 4
(57%) 4.02 b 0.547
Strabismic (% Yes)
31
(66%) 0
(0%) 49.93 b <0.001 100% 100% 0% 100% 0% 99.0 b <0.001
Wears glasses (% Yes)
39
(83%) 4
(8%) 56.95 b <0.001 4
(57%) 15
(100%) 9
(100%) 9
(100%) 2
(29%) 99.29 b <0.001
Wore Patch (% Yes)
32 (68%)
0 (0%)
52.31 a <0.001 4 (57%)
10 (67%)
3 (33%)
9 (100%)
6 (86%) 62.86 a <0.001
Stereopsis
Nil 30 (64%)
0 (0%)
80.632 c <0.001
7 (100%)
12 (80%)
0 (0%)
6 (67%)
5 (71%)
117.06 c <0.001 800 – 60 sec arc
14 (30%)
2 (4%)
0 (0%)
2 (13%)
7 (78%)
3 (33%)
2 (29%)
≤ 40 sec arc
3 (6%)
50 (96%)
0 (0%)
1 (7%)
2 (22%)
0 (0%)
0 (0%)
VA Best Eye (logMAR) 0.07 (0.11) -0.03 (0.05) 5.687 a <0.000 0.10 (0.13) 0.08 (0.09) 0.04 (0.09) 0.08 (0.12) 0.03 (0.13) 1.92 a 0.098
VA Worst Eye (logMAR) 0.44 (0.67) -0.01 (0.05) 4.849 a <0.001 0.33 (0.25) 0.21 (0.20) 0.29 (0.19) 0.25 (0.19) 1.51 (1.29)** 20.95 a <0.001
Inter-Ocular Difference in VA (logMAR)
0.38 (0.65) 0.02 (0.03)** 3.945 a <0.001 0.23 (0.27) 0.13 (0.16) 0.21 (0.12) 0.22 (0.15) 1.47 (1.19)** 25.14 a <0.001
99

The effect of amblyopia on self-esteem in children. Chapter 5
100
All subjects with infantile esotropia had no measurable stereopsis, whilst, all
anisometropic amblyopes had some measurable level of stereopsis, with 22% of the
anisometropes having normal stereopsis. The variation in level of stereopsis was
significant both between the amblyopic and control groups (χ2(df=2) = 80.63; p<0.001)
and between subgroups (χ2(df=10) = 117.06; p<0.001)(Table 5.2).
Amblyopic children were more likely to have had strabismus, to have worn a patch
and to wear glasses. Sixty-six percent of the amblyopic group had a history of
strabismus, 83% wore glasses and 68% had a history of having worn a patch. Of the
control group, none had a history of strabismus or patching and four children (8%)
currently wore glasses. All of the amblyopic children and all but one of the controls
had been advised to wear their glasses full time. Of the 32 amblyopic children who
had been patched, 23 (72%) were more than 5 years old when patched and 21 (66%)
were patched for more than 12 months duration. Whilst none of the amblyopic group
was currently undergoing patching, five had been patched within the 12 months prior
to participation in the study.
5.5.2 Perceived Self-Esteem Scores
Table 5.2 presents the self-perception domain score mean and standard deviation for
the amblyopic and control children. Children with amblyopia had significantly lower
scores on the social acceptance domain “feels accepted by peers” or “feels popular”
than age-matched control children (t (df=97) = -2.553, p = 0.012). No significant
differences were found between the amblyopic and control groups in the other four
domain specific judgments (scholastic competence, athletic competence, physical
appearance and behavioural conduct) or in global perception of worth or esteem as a
person (global self worth).

The effect of amblyopia on self-esteem in children. Chapter 5
101
Table 5.2: Mean (standard deviation) SPPC domain scores. Bold Italics font
indicates statistically significant differences between groups
Amblyopic (n = 47)
Control (n= 52) t(df=97) p
Scholastic competence 3.03 (0.65) 2.89 (0.63) 1.030 0.306
Social acceptance 3.00 (0.70) 3.31 (0.50) -2.553 0.012
Athletic competence 3.07 (0.67) 3.15 (0.58) -0.646 0.520
Physical appearance 3.35 (0.45) 3.42 (0.42) -0.711 0.479
Behavioral conduct 3.20 (0.69) 3.23 (0.53) -0.261 0.794
Global self-worth 3.50 (0.47) 3.53 (0.40) -0.257 0.796
5.5.3 Impact of aetiology
There were significant differences between the amblyopic subgroups in social
acceptance scores (F (5,87)=3.14, p = 0.012), and post hoc Bonferroni tests confirmed
these differences were significant between the acquired strabismus and control
groups (Table 5.3). The deprivation group recorded the same mean score as the
acquired strabismus group, however, this was not identified by post hoc tests as
significantly different from the control group, due to smaller sample size and larger
standard deviation. Similarly, the anisometropia group scored as highly has the
control group (Figure 5.1).
Table 5.3: Social Acceptance scores mean (standard deviation) for amblyopic
subgroups and control group. ** Post Hoc Bonferroni confirms significant difference between
groups (p<0.05)
Infantile
Esotropia Acquired
Strabismus Aniso-
metropia Mixed Deprivation Control Sig.
One-Way ANOVA
N=7 N=15 N=9 N=9 N=7 N=52 F(5,87) p
SOCIAL ACCEPTANCE
3.07 (0.81) 2.76 (0.70)** 3.44 (0.39) 3.07
(0.56) 2.76 (0.91) 3.31 (0.50)** 3.14 0.012

The effect of amblyopia on self-esteem in children. Chapter 5
102
Figure 5.1: Mean Social Acceptance subscale scores for amblyopia aetiological
subgroups and control children. Error bars represent ± 1 SE. ** Bonferroni
post hoc tests indicate significant differences between groups
5.5.4 Determinants of social acceptance score within amblyopic group
Table 5.4 presents the Pearson correlation coefficients calculated within the
amblyopic sample between social acceptance score and amblyopia condition factors
(history of strabismus and VA measures) and treatment factors (wears glasses and
history of treatment by patching). As well as a number of significant correlations
between the condition and treatment characteristics measured in this study, only a
history of patching significantly correlated with social acceptance score (p<0.05).

The effect of amblyopia on self-esteem in children. Chapter 5
103
Table 5.4: Correlations between vision and treatment characteristics and social acceptance score of amblyopic group. Pearson correlation co-efficients presented. ** Correlation is significant at the 0.01 level.* Correlation is significant at the 0.05 level (2-tailed).
The influence of amblyopia condition or treatment factors that may impact on social
acceptance score was further investigated by testing for differences in self-esteem
between treatment or condition sub-groups (Table 5.5). No significant difference
was found between amblyopic children with a history of strabismus and those
without, or between those who did or did not wear spectacles or between levels of
refractive error. A significant difference in social acceptance score was found
between those amblyopic children who had a history of treatment by patching (n=32)
and those who did not (n=15) (tdf=45 = -2.328; p=0.024)
Table 5.5: Influence of condition or treatment factors on social acceptance score Bold Italics indicates statistically significant association
n Social Acceptance
Score Mean (Std Deviation)
a T(df=45) b F(3,43)
Sig.
Strabismus Yes 31 2.92 (0.68) -1.034 a 0.446
No 16 3.15 (0.73)
Wears Glasses Yes 39 3.00 (0.64) 0.087 a 0.931
No 8 2.98 (0.98)
Wore Patch Yes 32 2.85 (0.71) -2.328 a 0.024
No 15 3.33 (0.55) Level of refractive correction
Nil 8 2.98 (0.98) 0.602 b
0.618
+0.25D to +2.75 16 3.11 (0.62)
+3.00D to +5.75D 16 3.03 (0.58)
>+6.00D 7 2.69 (0.80)
Wears glasses
History of patching
VA in Best Eye
VA in Worst Eye
Inter-ocular VA
difference
Social Acceptance
Score History of Strabismus 0.272 0.182 0.201 -0.383** 0-.427** -0.152 Wears glasses 0.054 0.047 -0.468** -0.488** 0.013 History of patching -0.031 0.139 0.148 -0.328* VA in Best Eye 0.241 0.083 -0.211 VA in Worst Eye 0.987** -0.256 Inter-ocular VA difference -0.228
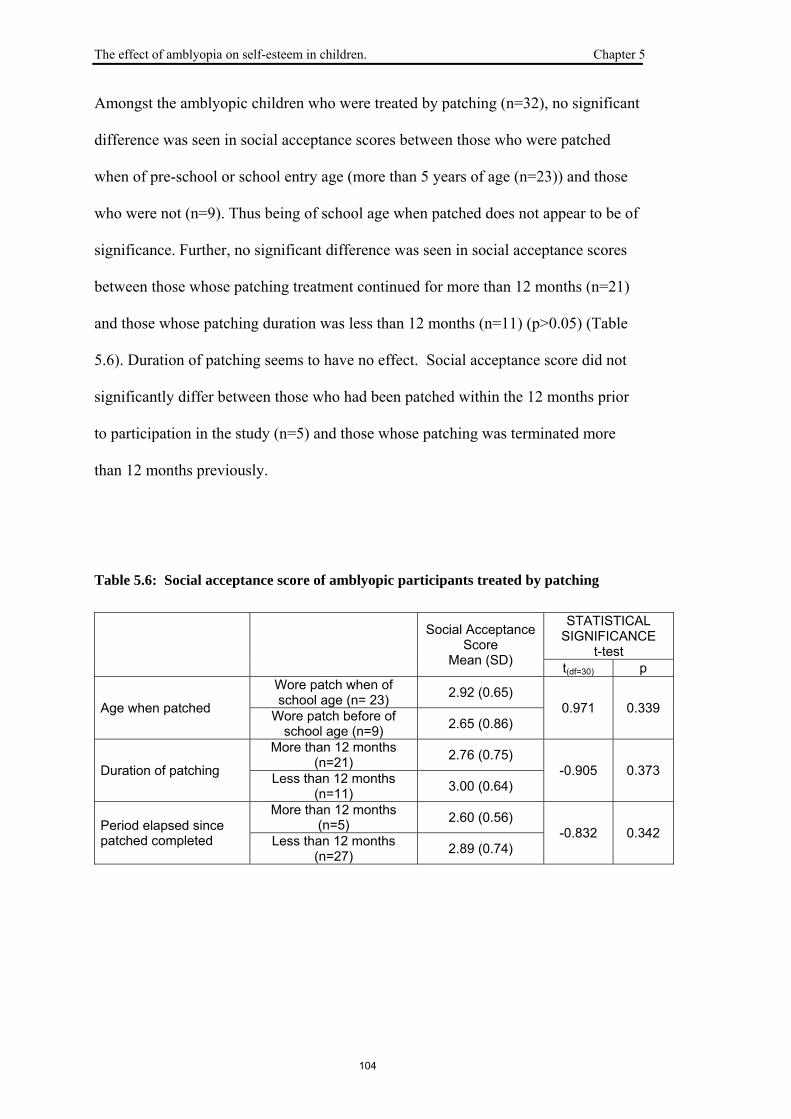
The effect of amblyopia on self-esteem in children. Chapter 5
104
Amongst the amblyopic children who were treated by patching (n=32), no significant
difference was seen in social acceptance scores between those who were patched
when of pre-school or school entry age (more than 5 years of age (n=23)) and those
who were not (n=9). Thus being of school age when patched does not appear to be of
significance. Further, no significant difference was seen in social acceptance scores
between those whose patching treatment continued for more than 12 months (n=21)
and those whose patching duration was less than 12 months (n=11) (p>0.05) (Table
5.6). Duration of patching seems to have no effect. Social acceptance score did not
significantly differ between those who had been patched within the 12 months prior
to participation in the study (n=5) and those whose patching was terminated more
than 12 months previously.
Table 5.6: Social acceptance score of amblyopic participants treated by patching
Social Acceptance Score
Mean (SD)
STATISTICAL SIGNIFICANCE
t-test t(df=30) p
Age when patched
Wore patch when of school age (n= 23) 2.92 (0.65)
0.971 0.339 Wore patch before of school age (n=9) 2.65 (0.86)
Duration of patching
More than 12 months (n=21) 2.76 (0.75)
-0.905 0.373 Less than 12 months (n=11) 3.00 (0.64)
Period elapsed since patched completed
More than 12 months (n=5) 2.60 (0.56)
-0.832 0.342 Less than 12 months (n=27) 2.89 (0.74)

The effect of amblyopia on self-esteem in children. Chapter 5
105
5.6 Discussion
The measurement of perceived self-esteem by use of a standardised age-appropriate
questionnaire in this study revealed that children who had been treated for amblyopia
had lower social acceptance scores than age-matched control children. Lower social
acceptance scores were particularly found for subjects whose amblyopia was caused
by acquired strabismus, all of whom wore glasses and two-thirds of whom had been
treated with patching and for those with deprivation amblyopia who had the greatest
amblyopic VA deficit. Lower social acceptance score was found to be correlated
with a history of patching, but not with wearing glasses or with a history of
strabismus.
In other areas related to self-esteem, including scholastic competence, physical
appearance, athletic competence, behavioural conduct and global self worth, the
amblyopic children gave scores similar to those of control children. While fine
motor skills (Webber et al. 2008a) and on reaching and grasping have been recently
reported to be reduced in amblyopia (Grant et al. 2007), our sample of amblyopia
children perceived their athletic competence as highly as their peers.
Previous studies have suggested that the necessity to wear glasses or an eye patch
can draw negative attention to a child (Horwood et al. 2005; Koklanis et al. 2006),
with resultant victimisation or bullying and negative psychosocial effects. Our
findings suggest that the negative attention drawn by wearing an eye patch impacts
on the measure of self-esteem that relates to social acceptance. Studies of self-esteem
in myopic children showed that whilst lower self-perception scores were associated
more visual discomfort symptoms, they did not relate to magnitude of refractive error

The effect of amblyopia on self-esteem in children. Chapter 5
106
(Dias et al. 2002), and did not vary with type of spectacle lens worn (Dias et al.
2005). Our findings support the conclusion that wearing glasses does not impact on
a child’s self-esteem and does not vary with magnitude of refractive correction.
Together with the findings that wearing glasses does not significantly impact on self-
esteem in myopic children (Dias et al. 2002; Dias et al. 2005), our results suggest
that it is wearing an eye patch, rather than glasses, that creates the sense of being less
well accepted and is potentially responsible for the stigma that has been reported to
be associated with amblyopia therapy (Koklanis et al. 2006).
The findings of this study are important given the evidence from recent treatment
trials which have specifically investigated the improvement in amblyopia that can be
achieved through spectacle correction alone (Stewart et al. 2004a; The Pediatric Eye
Disease Investigator Group 2006; Cotter et al. 2007). Evidence now exists that for
some children with amblyopia, both strabismic (Cotter et al. 2007) and anisometropic
(The Pediatric Eye Disease Investigator Group 2006), correction of refractive error
alone can sufficiently improve visual acuity to the point that patching would no
longer be considered necessary (Stewart et al. 2007). Our study indicates that
spectacle wear does not contribute to reduced social acceptance in amblyopic
children and emphasises the importance of exploring refractive correction as a first
line of attack to treat amblyopia, with the hope that patching with its potential
negative psychosocial effects may be minimised or avoided altogether. Indeed, it
has now been established that reduced amounts of patching are as effective as full
time patching (The Pediatric Eye Disease Investigator Group et al. 2003; The
Pediatric Eye Disease Investigator Group 2003b; The Pediatric Eye Disease
Investigator Group 2003d), and monitored occlusion trials have demonstrated

The effect of amblyopia on self-esteem in children. Chapter 5
107
positive dose-response improvement in VA for up to 400 hours of patching with
most improvement occurring in the first six weeks of patching (Stewart et al. 2004b;
Stewart et al. 2007). Whilst not explored in this study, the use of atropine for
penalisation rather than use of an occlusive patch has been suggested to have less
social consequences and better acceptance by some amblyopic children (The
Pediatric Eye Disease Investigator Group 2003a).
Clinicians are faced with the challenge of designing treatment regimens that are
effective in restoring vision with minimal psychosocial side-effects. Our study
provides evidence that amblyopia can impact on the self-esteem domain related to
social interaction. There may be a psychosocial benefit to the child if patching is
minimised and limited to times of day when the child has less interaction with social
peers.
Acknowledgements
This work was supported by Queensland University of Technology (QUT) and the
Institute of Health and Biomedical Innovation (IHBI). The authors thank all the
participants for their co-operation; the staff of Dr Gole’s practice for their help in
recruitment; and Philippe Lacherez, Diana Battisutta and Cameron Hurst of IHBI for
assistance with biostatistics. This manuscript is based on data presented as a poster
at the Association for Research in Vision and Ophthalmology meeting in May 2007,
Fort Lauderdale, Florida.

The effect of amblyopia on self-esteem in children. Chapter 5
108
Part B
The effect of amblyopia on self-esteem in
preschool to grade 2 school level children.
5.7 Abstract
Aim: In an investigation of the psychosocial impact of amblyopia, the perceived
self-esteem of amblyopic children from preschool to grade 2 school level was
compared with that of age-matched controls.
Methods: Children with a history of treatment for amblyopia (n=29; age = 6.6 ± 0.6
years) and age-matched controls (n=20; age = 6.4 ± 0.5 years) completed a
standardised age-appropriate pictorial questionnaire based evaluation of perceived
self-esteem (The Pictorial Scale of Perceived Competence and Acceptance for
Young Children).
Results: There were no significant differences in self perception scores of the
amblyopic children compared to the controls in the domains of cognitive
competence, physical competence and peer acceptance.
Conclusions: Amblyopic children from preschool to grade 2 school level are
relatively robust in their perception of cognitive and physical ability and acceptance
by their peers.

The effect of amblyopia on self-esteem in children. Chapter 5
109
5.8 Introduction
Community funded screenings for amblyopia have questioned the age at which
children should be screened. Contemporary studies have reported that visual
outcomes are improved when amblyopia is detected and treated before six years of
age (Eibschitz-Tsimhoni et al. 2000; Williams et al. 2003). In the previous chapter
(Chapter 5 Part A) we reported data on the self-perception scores of children from
Grade 3 school level (aged from approximately eight years) measured with the
Harter Self Perception Profile for Children. Our data showed that self-perception of
social acceptance was lower in children treated for amblyopia compared with age-
matched controls and a reduction in these scores was associated with a history of
patching treatment but not with a history of strabismus or spectacle wear.
Younger children may potentially be less affected by the social stigma associated
with wearing an eye patch as part of amblyopia treatment, because it is only from
middle to late childhood (from 8 to 11 years of age) that children begin to perceive
their own competence or acceptance in comparison with others, particularly their
peers (Harter 1988; Harter 1999). Younger children thus may lack the requisite
skills (e.g. social comparison) to allow them to distinguish between ideal and real
self-concepts (Harter 1999). In addition, young children, aged from three to eight
years, have been reported not to be influenced by the presence of a cosmetically
obvious strabismus when selecting a playmate (Johns et al. 2005).
In Chapter 5 Part A we suggested that there may be a psychosocial benefit to the
child if patching is minimised and limited to times of the day when the child has less
interaction with social peers. Of interest is whether children who are younger than
eight years of age are more robust in their perception of peer acceptance. If so, there

The effect of amblyopia on self-esteem in children. Chapter 5
110
may be a psychosocial benefit to identifying and treating children before they are of
an age that peer comparison begins to form a basis for these aspects of self-esteem.
In this section we report data on the self-perception scores of children less than eight
years of age who have been treated for amblyopia and compare their results with
those of an age-matched control group. To test children from kindergarten to second
grade the Pictorial Scale of Perceived Competence and Social Acceptance for Young
Children (PSPCSA) was designed as an extension of the Perceived Competence
Scale for Children use with younger age groups. As with the older child’s version, a
domain-specific approach was taken (Harter and Pike 1984). In the PSPCSA the
domains assessed were cognitive competence, physical competence and peer
acceptance. Separate versions of the pictorial instrument are necessary for two age
groupings, one suitable for Preschool/Kindergarten (approximately five to six years
of age) and a second appropriate for First and Second grades (approximately seven to
eight years of age) with separate books for assessment of girls and boys.
5.9 Methods
5.9.1 Participants
Forty-nine children participated in this study, including 29 children who had been
treated for amblyogenic conditions (age = 6.6 ± 0.6 years) and 20 age-matched
control subjects (age = 6.4 ± 0.5 years). The amblyopic sample had children from a
range of aetiologies: infantile esotropia (n=8); acquired strabismus (n=11);
anisometropia (n=5); mixed (n=4); deprivation (n=1). The amblyopic children and
nine of the control children also participated in the study of fine motor skills reported
in Chapter 4. The amblyopic children were recruited from the files of a private

The effect of amblyopia on self-esteem in children. Chapter 5
111
paediatric ophthalmology practice as previously described in section 3.2.1.of the
General Methods chapter. Eleven extra control subjects were recruited for this
section of the study from a local primary (elementary) school via an email that
outlined the purpose of the study to parents of children in Grades one and two.
All amblyopic children had received ophthalmological treatment for the underlying
amblyogenic condition (surgery or refractive correction) so did not have cosmetically
obvious strabismus at the time of the study. All subjects were carried in full-term
pregnancies and had no known neurological or ocular disorder (other than refractive
error or their amblyogenic conditions).
5.9.2 Self-Perception Assessment
Children younger than eight years of age (pre-school to grade 2) were tested with a
pictorial questionnaire of 18 situations, and asked to identify which child in that
situation they are most like. The activities depicted in each item were identical for
girls and boys, however, the gender of the target child was different so that subjects
could be asked to respond to a same-gender child. Administration of the pictorial
questionnaire was according to test instructions. The child was given a sample item
at the beginning of the questionnaire and was instructed to choose which child in the
pictorial situation they were most like. The choice was refined further by asking if
they were “very like” the child in the situation chosen or “a little like” the child in the
situation. The questionnaire tapped into three domains: cognitive competence,
physical competence and peer acceptance. Figure 5.2 shows an example from the
Grade 1 to Grade 2 booklet for boys.

The effect of amblyopia on self-esteem in children. Chapter 5
112
Figure 5.2.: Example from Grade 1 to Grade 2 booklet for Boys
Items were scored from 1 to 4, where 4 indicated the most adequate self-judgment
and 1 represented the least adequate self judgment. Items with each subscale were
counter-balanced such that three items were worded with the most adequate
statement on the left and three items were worded with the most adequate statement
on the right. Scores from the child’s protocol were transferred onto a data coding
sheet where all items for a given subscale were grouped together to facilitate
calculation of the mean for each subscale. Scoring results in a total of six subscale
means that defined a given child’s profile.
Means and standard deviations of subscale means for control samples are provided in
the manual that accompanies the test booklets (Harter and Pike 1984). The outcome
is a score between 1 and 4 on subscales.
5.10 Results
The self-perception scores of the amblyopic children were not significantly different
from those of their age-matched peers for the three domain specific judgments of
cognitive competence, physical competence and peer acceptance and were also
comparable with published normative data. Table 5.7 presents the mean and
standard deviations of self-perception domain scores for the amblyopic and control
This boy is good at climbing
This boy is not very good at climbing

The effect of amblyopia on self-esteem in children. Chapter 5
113
children together with those of a normative sample tested by the authors of the
PSPCSA (Harter and Pike 1984) (n=109; age = 6.9 years). While the cognitive
competence score of the amblyopic group was found to be lower than that of the
control group, a difference that approached statistical significance, the scores of the
amblyopic children were comparable to the published normal values for their age
group.
Table 5.7: Self-perception subscale scores Estimated Marginal Means
(standard error) for younger children.
AMBLYOPIA N=29
CONTROL N=20
ANOVA SIGNIFICANCE
Harter Normative data(Harter and
Pike 1984) N=109 F(1,46) p
Cognitive Competence 3.44 (0.51) 3.69 (0.36) 3.388 0.072 3.4 (0.35)
Physical Competence 3.39 (0.50) 3.54 (0.43) 1.217 0.276 3.4 (0.39)
Peer Acceptance 3.02 (0.58) 3.20 (0.57) 1.257 0.268 3.1 (0.55)
5.11 Discussion
Children with a history of amblyopia who were from preschool to grade 2 school
level gave self-perception scores in the domains of cognitive competence, physical
competence and peer acceptance that were similar to those of age-matched control
children. This finding concurs with that of a recently published study of gross motor
abilities and self perception in amblyopic children aged from four to seven years that
also employed the PSPCSA (Engel-Yeger 2008).

The effect of amblyopia on self-esteem in children. Chapter 5
114
We have previously reported that older children, from grade 3 school level, have
lower scores on the social acceptance domain “feels accepted by peers” or “feels
popular” and that the lower social acceptance score was found to be correlated with a
history of patching, but not with wearing glasses or with a history of strabismus. In
the equivalent domain in the Pictorial scale, peer acceptance, the younger amblyopic
children did not show a reduction in self-perception scores compared to the controls.
Self-perceptions of competence are belief systems that become more clearly
differentiated with age (Byrne 1996; Marsh and Hattie 1996). As a child progresses
through the developmental stages of childhood the nature of self-representations
alters and can be identified at sequential stages of childhood. Self-representation of
very young children, aged 3 to 4 years, generally reflects descriptions of behaviours,
ability, emotions, possessions and preferences that are potentially observable by
others (Harter 1999). They generally lack the requisite skills (e.g. social comparison)
to allow them to distinguish between ideal and real self-concepts, so self-
representations are likely to be unrealistically positive and generally demonstrate all-
or-nothing thinking in which usually their descriptions are all positive (Harter 1999).
This continues in children aged 5 to 7 years with typically very positive self-
representations as the child continues to overestimate his or her own abilities (Harter
1999). In middle to late childhood (from 8 to 11 years of age) the child rates
themselves based on comparison with others, particularly their peers (Harter 1988;
Harter 1999).
Williams and Harrod (2006) report that in those children who had a vision screening
at 3 years and 1 month (who therefore would be classified as receiving early
intervention for amblyopia) almost 50% fewer reported having been bullied,

The effect of amblyopia on self-esteem in children. Chapter 5
115
compared with children screened by the school nurse in the first year of school (aged
between 4 and 5 years). They also reported that there was no bullying in children
who wore glasses, supporting our previous conclusion that patching, rather than
wearing of glasses, has negative psychosocial consequences for children (Williams
and Harrad 2006).
While the causes of reduced social-acceptance scores, like bullying, in older children
can be multifactorial, our finding that peer-acceptance in younger amblyopic children
is comparable to age-matched peers supports the suggestion that the timing of
intervention may influence the psychosocial implications for a child who is treated
with patching.
In the previous chapter (Chapter 5 Part A) we suggested that if a child was of school
age there may be a psychosocial benefit to the child if patching is minimised and
limited to times of day when the child has less interaction with social peers. Our
finding that the peer acceptance score of younger amblyopes is relatively robust
further supports the suggestion that identification of amblyopia and treatment prior to
the age when peer comparisons begin to emerge, that is, prior to approximately eight
years of age, may be of psychosocial benefit to the child. Our findings indicate that
there may be benefits in psychosocial as well as visual outcomes if children are
identified and treated prior to entry into formalised schooling, when peer
comparisons begin to emerge and awareness of differences created by amblyopia
treatment, especially patching, can occur.

The effect of amblyopia on the DEM test in children Chapter 6
116
Chapter 6 RESULTS
CLINICAL MEASURES OF EYE MOVEMENTS
Part A
“The effect of amblyopia on the Developmental
Eye Movement (DEM) test in children.”
Webber AL, Wood JM, Gole GA, Brown B. (2009) “The effect of amblyopia on the
Developmental Eye Movement test in children.” Optom Vis Sci 86(6): 760-6.
6.1 Abstract
Aim: To investigate the functional impact of amblyopia in children, the performance
on a clinical test of eye movements was compared between groups of amblyopic and
age-matched control children. The influence of visual factors on test outcome
measures was explored.
Methods: Eye movements were assessed with the Developmental Eye Movement
(DEM) test, in a group of children with amblyopia (n=39; age 9.1 ± 0.9 years) of
different causes (infantile esotropia n=7; acquired strabismus n=10; anisometropia
n=8; mixed n=8; deprivation n= 6) and in an aged matched control group (n = 42;
age = 9.3 ± 0.38 years). LogMAR visual acuity (VA), Randot stereopsis and
refractive correction were also recorded in both groups.
Results: No significant difference was found between the amblyopic and age-
matched control groups in outcome measures of the DEM (Vertical time, Horizontal

The effect of amblyopia on the DEM test in children Chapter 6
117
time, number of errors and Ratio (Horizontal time/Vertical time)). Outcome measures of the
DEM did not significantly relate to measures of VA in either eye, level of binocular
function, history of strabismus or refractive error.
Conclusions: The performance of amblyopic children on the DEM, a commonly
used, clinical measure of eye movements, has not previously been reported.
Amblyopia has no effect on eye movements when assessed with the DEM, despite
significant impairment of binocular vision, and reduced VA in both the better and
amblyopic eye in our sample of amblyopic children.

The effect of amblyopia on the DEM test in children Chapter 6
118
6 .2 Introduction
Approximately three percent of the population develop amblyopia (Attebo et al.
1998; Brown et al. 2000), poor vision that results from abnormal visual experience
during early childhood. Children with amblyopia may have poorer visual acuity in
both the affected and fellow eye, little or no stereopsis or binocular fusion and poorer
efficiency in their accommodation and oculo-motor control (McKee et al. 2003).
While much has been reported of the visual characteristics of amblyopia and the
neurological adaptations that underlie these effects (McKee et al. 2003; Anderson
and Swettenham 2006; Levi 2006), there is little published evidence of the disability
associated with amblyopia (Snowden and Stewart-Brown 1997a) particularly with
regard to the ability to complete activities of daily living that impact on career
opportunities or career choices for amblyopes (Hartmann et al. 2000), or on tasks
pertinent to the activities of amblyopic children and their educational achievement.
People with a history of amblyopia are reported to feel it has affected their school
and career choices (Campbell and Charney 1991; Satterfield et al. 1993; Packwood et
al. 1999), however a recent birth cohort study involving 8861 participants reported
that amblyopia did not significantly impact educational, health or social outcomes
(Rahi et al. 2006).
In addition to reduced visual acuity, contrast sensitivity and position acuity (McKee
et al. 2003), amblyopes have poorer control of fixation in both the amblyopic and
non-amblyopic eye (Kandel et al. 1980) and binocular coordination of saccades is
impaired in strabismics, particularly those with large angle strabismus (Kapoula et al.
1997). Although a causal relationship between “poor” eye movements and reading
has not been confirmed (Starr and Rayner 2001), assessment of eye movements in

The effect of amblyopia on the DEM test in children Chapter 6
119
poor readers is routine in clinical paediatric optometry practice (Scheiman and Wick
1994), and is recommended in optometric clinical guidelines for the evaluation of
learning-related vision problems (Garzia et al. 2006). While the visual anomalies
known to be associated with amblyopia, such as reduced visual acuity (VA) in both
affected and fellow eye, reduced or absent stereopsis, and poor fixation control may
be expected to impact the fluency of eye movements under habitual binocular
viewing conditions, the performance of amblyopic children on clinical tests of eye
movements has not previously been reported.
The most common assessment of eye movements in optometric practice is
observation of fixation ability, saccadic eye movements and pursuit eye movements
and grading of these eye movements for smoothness and accuracy on a 1 to 4 scale
(Scheiman and Wick 1994; Ciuffreda and Tannen 1995b). While the grading scales
are simple to administer, the reliability and repeatability and quantification of clinical
observation have been questioned (Scheiman and Wick 1994). Although less
common in clinical practice, objective infrared recording of eye movements during
reading for comprehension can be provided by the Visagraph II Eye-Movement
recording system (Scheiman and Wick 1994). While the highly detailed description
of eye movements provided by Visagraph is comprehensive, the relatively high
equipment costs, significantly longer time required for testing and relatively high
degree of technical knowledge required to obtain a valid recording have limited its
use in clinical practice.
An alternative clinical test of saccadic eye movements is the Developmental Eye
Movement Test (DEM) (Garzia 1990) which gives a measure of visual-verbal
oculomotor skills and rapid automatized naming (RAN) (Tassinari and De Land

The effect of amblyopia on the DEM test in children Chapter 6
120
2005). The DEM is a standardised clinical test of saccadic eye movements and is
recommended for use in optometric practice for the evaluation of learning-related
vision problems in children (Garzia et al. 2006).
We have previously reported that amblyopia impacts on outcomes of fine motor
skills tests of visual motor control and upper-limb speed and dexterity, and that
poorer fine motor skill performance was associated with a history of strabismus
(Webber et al. 2008a). The deficits in motor performance were greatest on timed
manual dexterity tasks reflecting both speed and accuracy. We speculated that the
outcomes on the DEM test, which are also judged on speed and accuracy, may be
similarly affected in a group of amblyopes.
In addition to a history of strabismus, the visual anomalies associated with amblyopia
that we hypothesise may influence DEM test outcomes include the level of VA in the
better eye, as this predicts VA under binocular conditions (Rubin et al. 2000), level
of stereopsis as a measure of binocular fusion and inter-ocular VA difference as a
measure of depth of amblyopia. Hyperopia will also be considered as it has been
linked with poor performance compared with controls on several spatial cognitive
and motor tests (Atkinson et al. 2005; Atkinson et al. 2007), and hyperopic children
demonstrate poor reading performances compared with emmetropic and myopic
children (Shankar et al. 2007).
In this study, performed under habitual binocular viewing conditions, we used the
DEM to obtain a quantitative assessment of saccadic eye movements in a sample of
children with amblyopia of differing aetiologies and compared outcome measures
with that of an age-matched group of children. The influence of amblyopia aetiology

The effect of amblyopia on the DEM test in children Chapter 6
121
and measured visual characteristics were examined by testing whether these factors
were associated with outcome measures of the DEM.
6.3 Methods
6.3.1 Participants
Thirty-nine children (aged 9.1 ± 0.9 years) who had been diagnosed and treated for
amblyopia or amblyogenic conditions and forty-two control children (aged 9.3 ± 0.4
years) participated in this study. Potential amblyopic subjects were recruited from
the private practice of a paediatric ophthalmologist (GG) and control subjects were
recruited from a local primary (elementary) school. Details of their recruitment and
clinical characteristics have been previously reported (Webber et al. 2008a; Webber
et al. 2008b). Amblyopia in our subjects resulted from a range of causes; seven had a
history of infantile esotropia, ten had history of acquired strabismus, eight had
history of anisometropia, eight had history of both strabismus and anisometropia and
six had a history of disturbance of monocular image clarity such as congenital
cataract (deprivation). All had received ophthalmological treatment for the
underlying amblyogenic condition (surgery or refractive correction) and had
concluded occlusion or penalisation treatment. The group included both children
with successful treatment outcome and children who still had clinically significant
amblyopia (greater than 0.2 logMAR difference in VA between eyes). Refractive
correction (typically less than one year old) was worn for all tests.
6.3.2 Vision Assessment
Visual acuity was measured in each eye using a 3 metre logMAR chart while the
child wore their refractive correction based on cycloplegic refraction within the

The effect of amblyopia on the DEM test in children Chapter 6
122
previous twelve months. The resultant VA for each eye was scored on a letter by
letter basis. The level of binocular function was assessed with the Randot Preschool
Stereoacuity test (Birch et al. 1997; Birch et al. 2008), chosen for its established
validity and normative data. Suppression was confirmed by the Mirror-Pola
technique (Siderov 2001) if no stereoscopic response was obtained on the Randot
test.
6.3.3 Developmental Eye Movement Test
Saccadic eye movements were assessed with the Developmental Eye Movement
(DEM) test (Garzia 1990), in which the time taken for a series of numbers (single
digits) to be seen, recognised and spoken with accuracy is measured. The test
consists of two subtests with 40 numbers arranged in vertical columns (Tests A and
B), and a subtest with 80 irregularly spaced numbers arranged in 16 horizontal rows
(Test C). The child is asked to name aloud the single digit numbers as quickly and
accurately as possible and the times taken to read aloud the 80 numbers in both the
four vertical columns (vertical time) and the sixteen line horizontal array (horizontal
time) are recorded. The number of omission and addition errors is recorded and test
times are adjusted for errors made. Upon completion of the test, a ratio was
calculated by dividing the time taken to read the 80 numbers in the horizontal array
by the total time for reading the 80 numbers in vertical subsets. The outcomes from
the DEM test are Vertical time, Horizontal time, Number of Errors and Ratio(horizontal
time/vertical time). Results can be converted to standard scores and percentile ranks based
on published age-normative data for this test (Richman and Garzia 1987).
Both amblyopic and control subjects also completed a self-esteem questionnaire and
tests of fine motor skills performance during the test session; the findings of these

The effect of amblyopia on the DEM test in children Chapter 6
123
tests have been published elsewhere (Webber et al. 2008a; Webber et al. 2008b).
Complete assessment of vision, fine motor skills, perceived self esteem and DEM
took about 45 minutes per subject and were completed within one test session by all
subjects.
All participants were given a full explanation of the experimental procedures and the
option to withdraw from the study at any time was explained to both parent and
child. Written informed consent was obtained from the parent prior to participation in
the study. The study was conducted in accordance with the requirements of the
Queensland University of Technology Human Research Ethics Committee and all
protocols concurred with the guidelines of the Declaration of Helsinki.
6.3.4 Statistical Analysis
All data were tested for normality using the Kolmogorov-Smirnov test. Where the
data were normally distributed, the results from the amblyopes were compared with
those of the control group using independent samples t-test and results between
amblyopic subgroups were compared with a one-way ANOVA (Statistical Package
for the Social Sciences – SPSS V14), using a significance level of 0.05. When
statistically significant differences were found between means, Bonferroni post-hoc
tests were used. Non-parametric tests were used where the data were not normally
distributed. Pearson’s correlation co-efficients were calculated to explore the
relationships between DEM measures and subject vision characteristics; to account
for multiple comparisons, a significance level of 0.01 was used (Curtin and Schulz
1998).

The effect of amblyopia on the DEM test in children Chapter 6
124
6.4 Results
No significant differences in age or gender were found between the amblyopic and
control groups. On average the subjects with amblyopia had 0.06 logMAR VA in the
better eye and 0.44 logMAR in the worst eye. In the control group there was very
little difference between eyes (-0.03 logMAR in the better eye; -0.01 logMAR in the
worst eye). Twenty-nine of the amblyopic subjects (73%) and three control subjects
(7%) wore a hyperopic refractive correction.
When compared with age-matched control children, the amblyopic children had a
greater inter-ocular difference in VA, poorer VA in both their better and worse eyes
and were less likely to have normal stereopsis (40 sec of arc) (p<0.05). Table 1
summarises the mean and standard errors for the age, gender, refractive and vision
characteristics of the amblyopic and control groups and presents the results of
statistical analysis for differences between groups.
Subjects were grouped according to their stereopsis level; “nil” if no stereoscopic
response could be measured, “reduced” if response indicated stereopsis between 800
and 60 seconds of arc and “normal” if response indicated stereopsis better than or
equal to 40 seconds of arc. The level of stereopsis varied significantly both between
the amblyopic and control groups (χ2 (df=2) = 66.08; p<0.001) and between subgroups
(χ2(df=8) = 18.87; p<0.001)(Table 1). The majority of control group subjects (98%)
had normal stereopsis (≤ 40 sec of arc) (Fielder and Moseley 1996) compared with
only eight percent of the amblyopic group. All subjects with infantile esotropia had
no measurable stereopsis, whilst 75% of anisometropic amblyopes had reduced
levels of stereopsis; 25% of the anisometropes had normal stereopsis.

The effect of amblyopia on the DEM test in children Chapter 6
125
In addition to significant differences between the amblyopia and control groups,
significant differences were measured between amblyopic aetiology subgroups in
VA worst eye, intra-ocular VA difference, level of stereopsis and average refractive
error (Table 6.1). Post hoc testing indicated that those with aetiology of deprivation
had significantly poorer VA in worst eye and greater inter-ocular VA difference than
the other subgroups and the difference in refractive error was significant between the
deprivation and mixed aetiology sub-groups.
Mean and standard deviation of DEM outcome measures Vertical time, Horizontal
time, Number of Errors and Ratio(horizontal time/vertical time) are shown for the amblyopic
and control groups in Table 6.2. No significant differences in outcome measures of
the DEM were found between the amblyopic and age-matched control groups, and
the data for each group was comparable with published DEM normative data for
children aged between 9 and 10 years of age (Richman and Garzia 1987). In
addition, outcome measures of the DEM did not significantly differ between
amblyopic subgroups (Table 6.2).

Table 6.1: Age, gender, refractive and vision characteristics of samples. Mean (standard deviation) of data is presented.
a
a one-way ANOVA F(4,39) ‡ Post hoc Bonferroni indicates differences between sub-groups
Control
Total Amblyopia
Group
STATISTICAL SIGNIFICANCE
Between Amblyopia and Control Group
Amblyopic Sub-groups STATISTICAL SIGNIFICANCE
One-Way ANOVA Between Amblyopic
aetiology groups Infantile
Esotropia Acquired
Strabismus Anisometropia Mixed Deprivation
N=42 N = 39 t (df=79) p N=7 N=10 N=8 N=8 N=6 F or χ2 p
Age (years) 9.34 (0.38) 9.12 (0.96) -1.214 0.228 9.51 (1.26) 8.90 (0.83) 9.64 (0.79) 8.56 (0.82) 9.26 (0.86) 1.888 a 0.135
Gender (% Female) 20 (48%) 17 (43%)
χ2 (df=2)
0.664 0.404 29% 50% 38% 38% 50% 1.564
(χ2df=4) 0.815
Stereopsis
Nil 0 (0%) 23 (59%) χ2 (df=2) 66.08
<0.001
7 (100%) 7 (70%) 0 (0%) 5 (63%) 4 (67%)
18.87
(χ2df=8) 0.016 800” – 60” 1 (2%) 13 (33.3%) 0 (0%) 2 (20%) 6 (75%) 3 (38%) 2 (29%)
≤ 40” 41 (98%) 3 (7.7%) 0 (0 %) 1 (10%) 2 (25%) 0 (0%) 0 (0%)
Inter Ocular Difference in VA (logMAR) 0.02 (0.03) 0.38 (0.52) 4.475 <0.001 0.51 (0.72) 0.11 (0.10) ‡ 0.22 (0.18) ‡ 0.21 (0.16) ‡ 1.09 (0.69) ‡ 6.254a 0.001
VA in Best Eye (logMAR) -0.03 (0.05) 0.06 (0.11) 4.726 <0.001 0.06 (0.12) 0.09 (0.10) 0.05 (0.10) 0.08 (0.13) 0.00 (0.10) 0.748 a 0.566
VA in Worst Eye (logMAR) -0.01 (0.05) 0.44 (0.50) 5.710 <0.001 0.57 (0.68) 0.21 (0.13) ‡ 0.27 (0.12) ‡ 0.28 (0.21) ‡ 1.09 (0.73) ‡ 5.180 a 0.002
Refractive error (dioptres) 0.16 (0.63) 2.92 (2.49) 6.941 <0.001 1.17 (1.21) 4.23 (3.20)‡ 2.75 (1.66) 4.59 (1.56)‡ 0.79 (1.50) ‡ 5.044 a 0.003
126

127
Table 6.2: Developmental Eye Movement test outcomes – mean (standard deviation)
‡ Post hoc tests indicate significant differences between sub-groups
OUTCOME MEASURE Control
Total Amblyopia
Group
Normative data
(age 9.0-9.99)
STATISTICAL SIGNIFICANCE
Between Amblyopia and Control Group
Amblyopic Sub-groups STATISTICAL SIGNIFICANCE
Between Amblyopic
aetiology groups Infantile
Esotropia Acquired
Strabismus Anisometropia Mixed Deprivation
N = 42 N=39 N=84 T(df=79) p N=7 N=10 N=8 N=8 N=6 F(4,39) p
Vertical Adjusted Time (seconds)
41.12 (6.79) 42.13 (9.05) 42.33 (8.20) 0.570 0.570 39.29 (6.85) 42.90 (9.22) 37.38 (3.96) 42.50 (5.68) 50.00 (14.93) 2.098 0.103
Horizontal Adjusted Time (seconds)
52.71 (11.54) 53.18 (16.96) 51.13 (13.30) 0.145 0.885 47.29 ( 8.75) 52.80 (13.68) 46.63 (6.61) ‡ 56.38 (19.77) 65.17 (29.03) ‡ 1.386 0.260
Number of Errors 0.98 (2.42) 1.62 (3.60) 2.17 (4.10) 0.944 0.348 2.71 (5.62) 0.60 (1.35) 0.38 (0.52) 1.50 (3.51) 3.83 (5.23) 1.198 0.329
Ratio (Horizontal Time/Vertical Time)
1.27 (0.19) 1.25 (0.20) 1.21 (0.19) -0.551 0.583 1.21 (0.17) 1.23 (021) 1.25 (0.15) 1.31 (0.28) 1.26 (0.17) 0.264 0.899

The effect of amblyopia on the DEM test in children Chapter 6
128
An indication of the clinical significance of the DEM outcomes was derived by
referring to published normative data (Richman and Garzia 1987). As well as
presenting mean and standard deviation for normative groups, the DEM handbook
provides calculation of a standard score and indication of percentile rank of
performance against the normative data. Results were determined to be abnormal if
the subject scored in the 15th percentile or below, considered outside the normal
range by standardised and validated testing of the DEM (Scheiman et al. 1996). The
number of subjects in either group whose outcome result was outside the range of
published normative data (Richman and Garzia 1987) is shown in Table 6.3. No
significant difference was seen between amblyopic and control groups in the number
of subjects who meet this clinical criterion for poor outcome.
Table 6.3: Number of subjects with DEM scores below 15th percentile
Total
N (% of subjects)
Amblyopic Group Control Group
Chi-square (df=1)
p
Horizontal Time ≥ 53 seconds 6 (7%) 4 (10%) 2 (5%) 0.890 0.345
Vertical Time ≥ 64 seconds 12 (15%) 6 (15%) 6 (14%) 0.032 0.858
Number of Errors ≥ 4 11 (14%) 6 (15%) 5 (12%) 0.209 0.648
Ratio ≥ 1.40 15 (19%) 7 (18%) 8 (19%) 0.016 0.899
6.4.1 Visual determinants of DEM outcome measures.
Pearson correlation coefficients were calculated between DEM outcome measures
and the characteristics of the subjects that we considered might influence oculo-
motor control (history of strabismus, VA in better eye, VA in worse eye, intra-ocular
VA difference, average refractive error and level of stereopsis). As expected, there
were a number of significant intercorrelations between the subject visual

The effect of amblyopia on the DEM test in children Chapter 6
129
characteristics, and between the outcome measures of the DEM (p<0.05). However,
no significant correlations were found between the DEM outcome measures and
subject visual characteristics.
6.4.2 Impact of treatment success
Within the amblyopic group no significant differences were found in DEM outcomes
between those children who would be clinically described as having successful
versus unsuccessful treatment outcome (0.2 logMAR difference in VA between eyes)
(Table 6.4).
Table 6.4: Difference in DEM results between Amblyopic VA groups
DEM Outcome Measure VA in worse eye ≤ 2.0
logMAR N = 19
VA in worse eye >2.0 logMAR N =20
t(df=37) p
Vertical Time (seconds) 41.26 (6.69) 42.95 (10.95) -0.5777 0.568
Horizontal Time (seconds) 53.37 (14.26) 53.00 (19.63) 0.067 0.947
Number of Errors 1.89 (4.04) 1.35 (3.20) 0.468 0.642
Ratio(Horizontal Time/Vertical Time) 1.29 (0.23) 1.21 (0.15) 1.314 0.197
The influence of binocular function was explored by testing for differences in DEM
outcomes between stereopsis groups. Whilst those with no measurable stereopsis
recorded the highest mean number of errors, the differences between stereopsis
groups were not statistically significant for any of the DEM outcome measures as
shown in Table 6.5.
Table 6.5: Difference in DEM results between Binocular function groups
DEM Outcome Measure Nil stereopsis N = 23
Reduced stereopsis
N=14
Normal stereopsis
N =44 F(2,78) p
Vertical Time (seconds) 43.52 (10.60) 40.29 (6.56) 41.02 (6.59) 0.985 0.378
Horizontal Time (seconds) 55.78 (20.73) 49.29 (9.46) 52.61 (11.21) 0.919 0.403
Number of Errors 2.43 (4.04) 0.50 (0.76) 0.93 (2.38) 2.495 0.089
Ratio(Horizontal Time/Vertical Time) 1.26 (0.24) 1.22 (0.13) 1.27 (0.16) 0.416 0.661

The effect of amblyopia on the DEM test in children Chapter 6
130
6.5 Discussion
This is the first study to report the performance of amblyopic children on a clinical
measure of saccadic eye movements and to compare that performance with normally
sighted control children. Our findings indicate that, despite significantly reduced VA
in both the fellow and affected eyes, reduced or absent stereopsis and significantly
greater hyperopic refractive error, amblyopic children gave scores similar to those of
control children for the outcome measures of the Developmental Eye Movement
(DEM) test, including Vertical time, Horizontal time, Number of Errors and
Ratio(horizontal time/vertical time).
In addition to determining that the ability of amblyopic children to quickly execute
saccades to fixate, identify and name single digits was equal to that of age-matched
peers, we found that the outcome measures of the DEM did not significantly relate to
measures of VA in either eye, levels of binocular function or magnitude of refractive
correction.
The prevalence of clinically unacceptable performance on the DEM was equivalent
in the amblyopic and control groups and agreed with published normative data for
the DEM test, suggesting that under habitual binocular viewing conditions amblyopia
does not carry with it a functionally relevant reduction in saccadic eye movement
speed and accuracy.
The DEM provides an indirect, quantitative evaluation of saccadic eye movements
based on the speed by which a series of numbers can be seen, recognised and
verbalised with accuracy (Tassinari and De Land 2005). It is thus purported to detect
oculomotor dysfunction and is recommended in optometric clinical practice
guidelines for the quantitative evaluation of saccadic eye movements in children for

The effect of amblyopia on the DEM test in children Chapter 6
131
learning-related vision problems(Garzia et al. 2006). The Horizontal sub-test mimics
the eye movements made during reading, with saccades of variable length required to
fixate on the irregularly spaced single digits (N10 font size) along horizontal rows,
while the Vertical subtests give a base measure of how quickly the child can name 80
numbers without having to make the saccadic eye movements along rows. The time
to complete the task and the number of errors are the clinical outcomes, with
significantly slower and/or error prone performance on the Horizontal task than the
Vertical task, that is higher Ratio score, indicating poor saccadic eye movement
control. Poor performance on both the Vertical and Horizontal subtests would
indicate slow automatic naming ability.
Despite recognition of reading as an important vision dependent ability that
contributes to an individual’s quality of life (Uusitalo et al. 1999), few studies have
evaluated the impact of amblyopia on reading under habitual binocular viewing
conditions. Specific reading disability was found to be relatively rare in a small
sample of children with amblyopia (n=20) (Koklanis et al. 2006) and not more
prevalent than reported in the general population. Likewise, we found that the
proportion of amblyopic children whose DEM results were determined to be
abnormal was not greater in the amblyopic group than in either the control group or
published normative data.
Stifter et. al. (2005) have recently reported a functionally relevant reading
impairment (reduced maximum reading speed under binocular viewing conditions) in
micro-strabismic children (n=20, age 11.5 ± 1.1 years). A sustained and prevalent
controversy in reading eye movement research is whether fluent reading is controlled
by low-level eye movement efficiency or whether it is influenced by the more

The effect of amblyopia on the DEM test in children Chapter 6
132
moment-to-moment cognitive processes (Starr and Rayner 2001). In children without
amblyopia, poor performance on outcome measures of the DEM has been associated
with parental observation of signs of poor reading fluency in children (n=84, age
10.0 ± 2.2 years) such as losing place or omitting words when reading or copying
and re-reading lines unknowingly (Tassinari and De Land 2005), and has been found
to predict students with below average reading performance (Larter et al. 2004). We
wished to establish whether amblyopic children had poorer saccadic eye movement
efficiency, as measured by the DEM, to determine if poorer eye movement control
during reading explained the slower reading speed reported by Stifter et. al.(2005).
Our finding that amblyopia has no effect on eye movements when assessed with the
DEM indicates that the deficit in binocular reading speed reported in amblyopic
children (Stifter et al. 2005) is not due to poor saccadic eye movement control. Stifter
et. al. also report that better binocular reading speed in the amblyopic group was
associated with more central and steady fixation and better sensory binocular
function, but did not relate to age, VA, accommodative impairment, strabismic angle
or refractive error (Stifter et al. 2005). In the present study, timed outcome measures
on the DEM were not associated with history of strabismus, VA in either eye, level
of binocular function or magnitude of refractive error.
It has been reported that the reading speed of well-corrected fluent observers reading
ordinary text with adequate light under adequate lighting conditions is limited by
letter spacing (crowding), not size (acuity) (Pelli et al. 2007). This is independent of
text size, contrast, and luminance given that text contrast is at least four times the
threshold contrast for an isolated letter (Pelli et al. 2007). Levi et al have recently
demonstrated that crowding rather than acuity limits reading in amblyopic observers,
as well as normal observers, in both central and peripheral vision (Levi et al. 2007).

The effect of amblyopia on the DEM test in children Chapter 6
133
Crowding should not influence the DEM task that consists of 3mm tall, high contrast
single digits (approximately N10) with 5mm between rows of numbers and spacing
of 10 to 25 mm between numbers. However, the extent to which crowding may
explain the reduction in reading speed under binocular conditions reported by Stifter
et.al. (2005) remain unclear, even though crowding would not be anticipated to
contribute to resolution under the binocular viewing conditions that the difference
between micro-strabismic and control children was measured.
Neurophysiological evidence indicates dysfunction in amblyopes in both primary and
secondary visual area and regions within the parieto-occipital cortex and ventral
temporal cortex (Anderson and Swettenham 2006). The poorer performance of
amblyopes compared with controls on timed manual dexterity tasks (Grant et al.
2007; Webber et al. 2008a), may reflect dysfunction in higher order cortical process
inherent in amblyopia and its sensory motor integration. While the correlation
between upper limb speed and dexterity scores and the DEM Ratio suggests a trend,
the DEM task is not impaired to the same extent as the fine motor skills tasks. The
saccadic eye movements and the visual-verbalisation required to perform the DEM
are not degraded to the same extent as fine motor skills by amblyopia.
This indicates that the oculomotor control required for the DEM is a lower order
task, not influenced to the same degree by the neurophysiological changes inherent in
amblyopia.
Amblyopia remains the most common cause of reduced vision in children and young
people, with significant costs to both the individual and community for screening and
treatment. While a number of functionally relevant deficits in tasks that contribute to
quality of life have now been reported (Grant et al. 2007), the educational, health and
social life outcomes of amblyopes does not appear to be impeded (Rahi et al. 2006).

The effect of amblyopia on the DEM test in children Chapter 6
134
In addition to determining the extent of functionally relevant deficits in performance
that may accompany amblyopia, it is important to have an understanding of how
children with amblyopia perform on clinical tests commonly used in paediatric
practice. Such understanding is important for clinicians interpreting test results and
for providing advice to parents and carers of the consequences of amblyopia.
Clinical treatment plans for amblyopia aim to improve visual acuity and binocular
function outcomes, however, the relationship between degraded vision and
performance both on clinical tests of visual efficiency and on tasks relevant to
children is yet to be fully established.

The relationship between DEM and Visagraph recorded eye movements Chapter 6
135
Part B
Relationship between DEM and Visagraph III recorded eye movements in children
6.6 Abstract
Aim: To investigate the relationship between indirect measures of eye movements
commonly used in clinical practice and direct eye movement recordings made during
reading for comprehension in children.
Methods: Participants with normal vision (n=59; age = 9.7 ± 0.6) were recruited
from elementary (primary) school grades 4 and 5. Eye movements were assessed
with the Developmental Eye Movement (DEM) test and Visagraph III infra-red
recordings of eye movements were made during both reading for comprehension and
naming numbers.
Results: Children with slower Visagraph recorded reading rates tended to have
slower DEM Horizontal Times (r = -0.547) and slower DEM Vertical Times (r = -
0.414). Similarly, children with slower Visagraph recorded number calling rates
tended to have slower DEM Horizontal Times (r=-0.716) and slower DEM Vertical
Times (r=-0.665). The Number of Errors recorded during the DEM test did not
significantly relate to Visagraph recorded measures of reading fluency. Children
with higher DEM Ratios had slower Visagraph recorded reading rates during reading
for comprehension (r = 0.368).

The relationship between DEM and Visagraph recorded eye movements Chapter 6
136
Conclusions: A number of the outcome measures of the DEM are strongly
associated with objective infra-red eye movement recordings of reading rates
indicating the clinical usefulness of the DEM for the identification of children with
slower rates of reading.
The relationship between DEM and Visagraph recorded eye movements Chapter 6
137
6.7 Introduction
Clinical assessment of the oculomotor system is recommended in the optometric
management of learning-related vision problems (Garzia et al. 2006). Methods of
evaluating oculomotor performance range from gross observation, to use of
quantitative rating scales, to indirect measures of eye movements and finally to direct
measure of eye movements with infra-red recording systems.
In optometric practice the most common assessment of eye movements is
observation of fixation stability, saccadic eye movements and pursuit eye movements
and grading of these eye movements for smoothness and accuracy on a rating scale
from 1 to 4 (Scheiman and Wick 1994). Grading scales that have normative data
include the Northeastern State University College of Optometry Oculomotor Test
(NSUCO) and the Southern California College of Optometry (SCCO) rating system
(Scheiman and Rouse 2006). However, while the grading scales are simple to
administer and require no special equipment, the reliability, repeatability and
quantification of clinical observation has been questioned (Scheiman and Wick 1994;
Scheiman and Rouse 2006).
Indirect measures of eye movements provide a more quantitative method of
evaluating saccadic eye movements during tasks that simulate reading. Some of
these tests include the Pierce Saccadic Test, the King-Devick Saccadic Test and the
Developmental Eye Movement (DEM) Test (Scheiman and Rouse 2006). These
three tests are designed on the same principle; the patient is asked to call out a series
of numbers arranged in horizontal rows as quickly as possible without using a finger
or pointer as a guide. The time taken to call out all numbers and the amount of errors

The relationship between DEM and Visagraph recorded eye movements Chapter 6
138
made are compared to normative tables. To account for poor automaticity in number
naming skills, the DEM also measures the time to call out the same amount of
numbers arranged in vertical columns. The DEM is considered the best clinical
indirect method of evaluating saccadic eye movements because the test design
accounts for automaticity in number-naming skills (Scheiman and Rouse 2006) and it
is used clinically by optometrists to assess oculomotor skills and rapid automatized
naming (RAN) (Tassinari and De Land 2005).
Poor performance on the DEM test has been reported to correlate with parental
observation of reading errors, such as losing place or omitting words when reading or
re-reading lines unknowingly (Tassinari and De Land 2005). The timed outcomes of
the DEM have been found to predict performance on a test of academic achievement,
the English Language Arts section of the Test of New York State Standards (Lack
2005). High correlation with the reading subtest of the Wide Range Achievement
Test (WRAT) was reported in the initial validation study of the DEM (n=58; mean
age 8.9 years) (Richman and Garzia 1987).
Although less common in clinical practice, the Visagraph III Eye Movement
recording system has been identified as the best clinical method for direct eye
movement recording (Scheiman and Wick 1994; Scheiman and Rouse 2006). The
pattern of eye movements recorded during reading can be described by several
features. These include fixations, regressions, return-sweep saccades, span of
recognition, fixation duration and reading rate (Ciuffreda and Tannen 1995a).
Fixations refer to the total number of times the eyes move during reading. The eyes
move from one fixation point to another by left-to-right progressive saccades of 1 to
2 degrees. Regressions refer to fixations that are directed from right-to-left by

The relationship between DEM and Visagraph recorded eye movements Chapter 6
139
“backward” movements during reading. In established readers, regressions make up
about 10% to 15 % of saccades during reading. Children learning to read and poor
readers make a greater number of regressions (Ciuffreda and Tannen 1995a).
Return-sweep saccades refers to the large right-to-left slightly oblique saccadic eye
movement that shifts the eyes from near the end of one line to near the beginning of
the next line of text. The return-sweep saccades are typically 12 to 20 degrees in
angular extent, with saccadic durations of 40 to 54 msec (Ciuffreda and Tannen
1995a).
While the highly detailed record of eye movements provided by the Visagraph is
comprehensive, the relatively high equipment costs, significantly longer time
required for testing and relatively high degree of technical knowledge required to
obtain a valid recording may have limited its use in clinical practice (Scheiman and
Rouse 2006). The Visagraph is reported to produce data that is reliable, however, the
relationship between Visagraph data and measures of reading comprehension have
yet to be conclusively established (Colby et al. 1998).
In our study of the impact of amblyopia in children, performance on the DEM was
compared between groups of amblyopic and age-matched control children. To gain a
more detailed description of the eye movements made during reading we also tried to
obtain Visagraph infra-red recording whilst reading for comprehension in the
amblyopic children. However, we found such recordings were unreliable through the
spectacle corrections worn by the majority of the amblyopic group of children. We
therefore focused on how the outcome measures of the DEM would relate to the
pattern of eye movements recorded during reading for comprehension with the
Visagraph and particularly whether the DEM would identify children with slow

The relationship between DEM and Visagraph recorded eye movements Chapter 6
140
reading rates measured objectively. While correlations have been reported in normal
children between DEM Horizontal time and the number of fixations (r=0.350),
duration of fixation (r=0.496) and numbers per minute reading rate (r=-0.259)
recorded with the Visagraph during a comparable number naming task (Lack 2005),
the relationship between the Visagraph recordings of eye movement characteristics
during reading for comprehension and outcomes of the DEM has not previously been
described. To investigate the relationship between these two clinical oculomotor
measures we recorded eye movements in a group of children from primary
(elementary) school grades 4 and 5 both during reading for comprehension and
number-naming, a task similar to that employed in the DEM. The strength and
direction of relationships between the Visagraph measures and outcome scores on the
DEM test were explored.
6.8 Methods
6.8.1 Participants
Subjects (n=59; age = 9.7 ± 0.6) were recruited from a local primary (elementary)
school (Bulimba SS). Recruitment was as previously described in the Methodology
chapter, section 3.2.2. Only children in grades 4 and 5 participated in this evaluation
of eye movements. Children in earlier grades were not included due to the greater
variability of reading fluency parameters in younger ages, as children are still
developing reading skills (Kulp and Schmidt 1997).
Subjects completed tests of visual acuity and stereoacuity, fine motor skills and a
self-esteem questionnaire as described in sections 3.5, 3.6 and 3.8 of the
Methodology chapter. Complete assessment of vision, fine motor skills, perceived
self esteem and DEM took about 45 minutes per subject and were completed within

The relationship between DEM and Visagraph recorded eye movements Chapter 6
141
one test session by all subjects. Infra-red recording of eye movements during both
reading for comprehension and naming aloud numbers were made with the
Visagraph III at a second session and took about 20 minutes per subject to complete.
6.8.2 Eye Movements
Two measures of eye movements were made in this group of children.
6.8.2.1 Developmental Eye Movement Test
Firstly, saccadic eye movements were assessed with the DEM test (Garzia 1990), in
which the time taken for a series of numbers (single digits) to be seen, recognised
and spoken with accuracy was measured.
The test consisted of two subtests with 40 numbers arranged in vertical columns
(Tests A and B), and a subtest with 80 irregularly spaced numbers arranged in 16
horizontal rows (Test C) (Figure 3.5). The child was asked to name aloud the single
digit numbers as quickly and accurately as possible and the time taken to read aloud
the 80 numbers in both the four vertical columns (vertical time) and the sixteen line
horizontal array (horizontal time) were recorded. The number of omission and
addition errors was recorded and test times were adjusted for errors made.
Upon completion of the test, a ratio was calculated by dividing the time taken to read
the 80 numbers in the horizontal array by the total time for reading the 80 numbers in
vertical subsets. The outcomes from the DEM test are Vertical time, Horizontal
time, Number of Errors and Ratio(horizontal time/vertical time). Results were converted
to standard scores and percentile ranks based on published age-normative data for
this test (Richman and Garzia 1987).

The relationship between DEM and Visagraph recorded eye movements Chapter 6
142
6.8.2.2 Visagraph
Secondly, reading eye movements were recorded with the Visagraph III eye-
movement recording system that uses goggles containing infra-red sensors to capture
eye position information during reading (as shown in Figure 6.1)
Figure 6.1: Visagraph III recording goggles. (From Taylor Associates/Communications Inc 2008)
Two types of clinical recording tests were made with the Visagraph III: a reading
recording where the eye movements made when reading a short age-appropriate
paragraph text are captured and a number recording where the test card consists of a
series of numbers between 1 and 5. Comprehension tests were administered
following the reading evaluation to confirm that the child was reading for
comprehension, rather than merely giving the appearance of reading. From the
Visagraph recordings a number of measures of eye movements made during the
reading task are summarised in a Reading Report. Figure 6.2 shows an example of a
plot of the trace produced by the Visagraph. Traces for both right (red) and left
(blue) eye are shown. The right tracing of each pair are the original data and the left
of each pair are the computed traces from which the measures in the Reading Report
are derived.

The relationship between DEM and Visagraph recorded eye movements Chapter 6
143
Recording Type: 15 - Firehouse Level: 2 Rate (wpm): 100 Comprehension %: 70 GLE: 1.6 Examiner: Ann Webber
09/20/2005
Figure 6.2 Graph of original tracing for left eye (red) and right eye (blue) from which Visagraph measures are derived.
Recordings where the comprehension score was less than 70% should be discarded,
however, all subjects scored greater than 70% correct on the multiple choice
comprehension test. The comprehension test was administered immediately after the
reading was complete. Ten questions with “yes” or “no” optional responses were
read aloud to the subject. The subject’s responses were recorded by the examiner.

The relationship between DEM and Visagraph recorded eye movements Chapter 6
144
Outcome measures used for analysis were the number of fixations per 100 words,
number of regressions per 100 words, span of recognition, average duration of
fixations and reading rates. Average span of recognition effectively refers to the
amount of print that is perceived and processed with each fixation. The span of
recognition was specified in units of “words” and was calculated by dividing the
number of fixations into the number of words in the specified paragraph. Fixation
duration refers to the length of time that the eye pauses or remains fixated on a word.
Reading rate refers to the number of words read per unit time and was specified in
words per minute. For the numbers task the measures reported included: fixations
per 100 numbers, regressions per 100 numbers, average duration of fixation and
reading rate both with and without re-reads (numbers per minute). As the data
obtained for each eye separately differed by less than five percent, findings for the
right and left eye were averaged for analysis of Visagraph outcomes for both the
reading and number naming tasks.
From the Visagraph recordings a number of measures of eye movements made
during the reading task are summarised in a Reading Report (An example is shown
in Figure 6.3).

The relationship between DEM and Visagraph recorded eye movements Chapter 6
145
Recording Type: 15 - Firehouse Level: 2 Rate (wpm): 100 Comprehension %: 70 GLE: 1.6 Examiner: Ann Webber
Reading Report 09/20/2005 Measurement Left Right Grade
Norm Goal Fixations/100 words 201 196 129 < 94 Regressions/100 words 32 28 28 < 17 Avg. Span of Recognition 0.50 0.51 0.78 > 1.06
Avg. Duration of Fixation .30 .31 .27 < .25 Reading Rate (wpm) 100 173 > 277
Reading Rate w/o Rereads 100 - -
Directional Attack Difficulty 16% 22% < 18%
Grade Level Efficiency (GLE) 1.6 Cross Correlation 97%
Lines Found/ Countable Lines 7/7
Figure 6.3: Reporting report generated by Visagraph. Results highlighted in red are considered clinically poor performance for age or grade.
6.8.3 Statistical Analysis
Pearson’s correlation co-efficients (r) were calculated to test for associations
between DEM measures and the eye movement parameters derived from the
Visagraph reports; to account for multiple comparisons, a significance level of 0.01
was used (Curtin and Schulz 1998).

The relationship between DEM and Visagraph recorded eye movements Chapter 6
146
6.9 Results
The mean, standard deviation and range of DEM test outcomes and Visagraph
outcome measures of number of fixations, number of regressions, duration of
fixation, span of recognition and reading rates for both silent reading for
comprehension and naming aloud numbers are presented in Table 6.6.
Table 6.6: DEM and Visagraph outcome measures in control children (n=59)
Mean Std.
Deviation Minimum Maximum
Developmental
Eye Movement
Test (DEM)
Vertical adjusted time (seconds) 40.4 7.0 29 65
Horizontal adjusted time (seconds) 51.2 11.1 30 85
Number of Errors 1.3 2.9 0 10
Ratio Horizontal Time/Vertical Time 1.26 0.17 1.0 1.8
Visagraph
Recording during
silent reading for
comprehension
Average number of Fixations per 100 words 168 37.3 101.5 257
Average number of Regressions per 100 words
29 14 5 74
Average span of recognition 0.62 0.14 0.39 0.99
Average duration of fixation (seconds) 0.29 0.05 0.22 0.46
Average reading rate (words per minute) 130 34 70 231
Visagraph
Recording while
naming numbers
aloud
Average number of Fixations per 100 numbers
180.5 42.5 124 361
Average number of Regressions per 100 numbers
32 23 1 122
Average duration of fixation (seconds) 0.30 0.07 0.18 0.53
Average reading rate (numbers per minute) 118.8 25.7 61 187
There were a number of significant correlations between some of the DEM and
Visagraph outcomes measured in this study (p<0.01) as can be seen in Table 6.7.

The relationship between DEM and Visagraph recorded eye movements Chapter 6
147
Table 6.7: Pearson correlation co-efficients calculated between DEM and Visagraph findings. **Bold indicates statistically significant correlation (p<0.01)
Visagraph Silent reading for comprehension
Visagraph Oral digit reading
DEM Test Number Fixations
Number Regression
Span Recognition
Duration Fixation
Reading Rate
(WPM) Number Fixations
Number Regression
Duration Fixation
Number Reading
Rate Vertical Adjusted Time
.277 .301 -.296 .300 -.414** .351** .255 .424** -.665**
Horizontal Adjusted Time
.407** .263* -.418** .355** -.547** .414** .224 .413** -.716**
Number of Errors -.042 -.087 -.004 .247 -.138 -.046 -.064 .193 -.103
Ratio (Vertical Time /Horz Time)
.317 .048 -.306 .184 -.368** .196 -.009 .154 -.310
Children with slower reading rates measured with the Visagraph tended to have
slower DEM Horizontal Times (r=-0.547) and slower DEM Vertical Times (r=-
0.414). Similarly, children with a slower number naming rate tended to have slower
DEM Horizontal Times (r=-0.716) and slower DEM Vertical Times (r=-0.665).
Figure 6.4 shows the bivariate correlation between Visagraph silent reading rate and
DEM Horizontal Time; approximately thirty percent of the variation in reading rate
could be predicted from the DEM Horizontal Time.
Stronger relationships were seen between DEM measures and Visagraph parameters
recorded during number naming (a task similar to DEM) than those recorded during
the silent reading for comprehension task. Figure 6.5 shows the variation in numbers
naming rate with DEM Horizontal Time, where the Horizontal Time predicted
approximately half of the variance seen in numbers naming per minute rate.

The relationship between DEM and Visagraph recorded eye movements Chapter 6
148
Figure 6.4: Variation in Visagraph Reading Rate with DEM Horizontal Time
Figure 6.5: Variation in Visagraph Numbers Reading Rate with DEM Horizontal Time
DEM Horizontal Time90 8070605040 30
Visa
grap
h R
eadi
ng R
ate
(WPM
)
250
200
150
100
50
R Sq Linear = 0.299
DEM Horizontal Adjusted Time90 80706050 4030
Visa
grap
h N
umbe
rs R
eadi
ng R
ate
(NPM
)
180
150
120
90
60
R Sq Linear = 0.512

The relationship between DEM and Visagraph recorded eye movements Chapter 6
149
The number of errors recorded during the DEM test was not significantly associated
with any of the measures of reading fluency recorded by Visagraph.
Children with a higher DEM Ratio had slower reading rates recorded during reading
for comprehension (r = 0.368); however, as shown in Figure 6.6, only 13 percent of
the variation in Visagraph reading rate could be predicted from the DEM Ratio
outcome.
Figure 6.6: Variation in Visagraph Reading Rate with DEM Ratio
6.10 Discussion
The DEM is a clinical measure commonly used by optometrists to assess saccadic
eye movements and is recommended for use in the evaluation of children for
learning-related vision problems. However, the relationship between the outcome
measures of the DEM and infra-red recorded eye movements during reading for
DEM Ratio (Horizontal Time / Vertical Time)1.81.61.41.21.00.8
Visa
grap
h R
eadi
ng R
ate
(WPM
)
250
200
150
100
50
R Sq Linear = 0.135

The relationship between DEM and Visagraph recorded eye movements Chapter 6
150
comprehension has not previously been reported in children. The DEM outcome
measure of Horizontal adjusted time, the time taken to name aloud numbers
irregularly spaced in a horizontal array that mimics the reading task, showed the
strongest associations with Visagraph outcome measures. Children with a longer
DEM Horizontal time tended to have an increased number of fixations, reduced span
of recognition, increased duration of fixation and ultimately slower reading rate as
measured by the Visagraph during reading for comprehension. As would be
expected, the strength of the relationship between the DEM and Visagraph recorded
measures was even greater when the task was naming numbers, a task similar to that
used in the DEM test.
The number of errors made during the DEM test, which mainly resulted from
skipping a row of numbers on the Horizontal task, did not significantly correlate with
infra-red recording of reading rates. Recording of the number and type of errors is
important in the DEM so that both the Vertical time and Horizontal time can be
adjusted to account for the number of digits actually named by the child. That is, if a
child skips a line of digits in the horizontal test and therefore calls out five fewer
digits than required the Horizontal time will be lower than the test design expects.
One second is added to the recorded time for each digit skipped; similarly one
second is deducted for each digit called twice. The DEM examiner’s booklet advises
that Error scores are not taken into account in their clinical response categories and
that clinicians should consider Error scores independently. Similarly, our data
suggests that Error scores alone are not useful for the identification of children with
lower recorded reading rates.

The relationship between DEM and Visagraph recorded eye movements Chapter 6
151
Clinically, a high DEM Ratio score (proportionally greater time to name numbers in
the horizontal array relative to the vertical) is considered to indicate an ocular motor
deficiency. High Ratio scores suggest greater difficulty in number calling when
horizontal eye movements are required than the baseline number calling performance
recorded during the vertical task. Poor ocular motor control has been suggested to
contribute to poor reading fluency, however, in our data only thirteen percent of the
variation in reading rate when reading for comprehension could be accounted for by
the DEM ratio. Similarly, the DEM Ratio did not correlate with the number of
fixations or regressions made during either the reading for comprehension or number
reading tasks. These findings are in agreement with those reported by Lack (2005) in
his comparison of the DEM with the Visagraph Numbers test and in Richman and
Garzia’s (1987) study of validity of the DEM, where the test authors determined the
correlation between DEM measures and scores on the reading subtest of the Wide
Range Achievement Test (WRAT) in 58 children (mean age 8.9 years). In accord
with our findings, reading scores were more highly correlated with DEM Horizontal
time (r=-0.78) than with DEM Ratio (r=-0.55) (Richman and Garzia 1987).
The associations between DEM outcomes measures and the objective recordings
obtained from the Visagraph, particularly those between horizontal time and reading
rate, where thirty percent of the variance in recorded reading rate was associated with
the DEM Horizontal time (Figure 6.4), suggest that the timed outcomes of the DEM
may be useful clinically for the identification of children who have slower reading
rates. The data suggest that it is the Horizontal adjusted time, rather than the Ratio,
that is the most useful measure. The DEM is recommended in optometric clinical
guidelines for the assessment of ocular motor efficiency in children being evaluated
for learning-related vision problems (Garzia et al. 2006), however, how the DEM

The relationship between DEM and Visagraph recorded eye movements Chapter 6
152
outcomes relate to learning has not been fully established. Our data supports the
clinical use of the DEM for the identification of children who may have slower
reading rates, however, the relationship between reading rate and learning or between
DEM outcomes and learning have not been fully established.
The Visagraph provides highly detailed quantification of the eye movement pattern
during reading tasks. Its clinical use in optometric practice is, however, limited by
the relatively high equipment costs, significantly longer time required for testing and
relatively high degree of technical knowledge required to obtain valid recordings.
Future studies that address the technical shortcomings of the Visagraph to provide
reliable measures through the habitual correction of amblyopic children would
provide useful information regarding objectively measured patterns of eye
movements made by amblyopic children during reading tasks.

Relationship between educational outcomes and fine motor skills Chapter 7
153
Chapter 7 RESULTS
ACADEMIC SCORES
Relationship between fine motor skills and
academic scores in children.
7.1 Abstract
Aim: In order to investigate the functional implications of fine motor skill
proficiency, the relationships between measures of fine motor skills and educational
outcomes were explored in children with normal vision.
Methods: Participants with normal vision (n=57; age = 9.7 ± 0.6 years) recruited
from elementary (primary) school grades 4 and 5, were assessed on a battery of
vision tests including Bailey-Lovie logMAR VA and Randot Preschool Stereoacuity
test. Fine motor skills were assessed using Visual Motor Control and Upper Limb
Speed and Dexterity subtests of the Brunicks-Oseretsky Test of Motor Proficiency.
Results from standardised tests of literacy and numeracy were obtained from school
records and, for a subset of children, from independent State-wide testing (n=29).
The relationships between educational outcomes and vision and fine motor skills
were explored with bivariate correlation analyses.
Results: In the younger cohort (grade 4; n=29; age 9.3 ± 0.4 years), children with
better Upper Limb Speed and Dexterity scores were likely to have higher
mathematics scores (r= 0.472), however, none of the educational test results were
significantly correlated with Visual Motor Control scores. In the grade 5 cohort

Relationship between educational outcomes and fine motor skills Chapter 7
154
(n=28; age 10.2 ± 0.3 years) children with higher Upper Limb Speed and Dexterity
scores tended to have higher education scores in both spelling (r= 0.471) and reading
(r= 0.371) and those with higher Visual Motor Control scores tended to have higher
spelling scores (r= 0.354).
Conclusions: Proficiency on clinical measures of fine motor skills was associated
with better outcomes on standardised measures of educational performance,
particularly in children in grade 5. Educational performance was most highly
correlated with outcome measures that reflect speed and accuracy.

Relationship between educational outcomes and fine motor skills Chapter 7
155
7.2 Introduction
Education, occupation and employment are recognised as key outcomes across a life
course and have been evaluated at a population level in the investigation of the
functional impact of amblyopia (Rahi et al. 2006). We reported in Chapter 4 that
amblyopic children performed worse than age-matched controls on nine of sixteen
fine motor skills sub-items and for the overall age-standardised scores for both visual
motor control and upper limb speed and dexterity items.
Poor fine motor skills have been implicated in poor academic performance due to the
need for more time to copy material or complete work, which in turn can negatively
influence self-esteem (McHale and Cermak 1992). Fine motor skills are believed to
influence the quality and quantity of the child’s learning and achievement in the
classroom and the development of the child’s self-esteem and motivation (McHale
and Cermak 1992). The types of tasks that involve fine motor skills in the classroom
include writing, drawing, using an eraser, ruling lines, steadying paper, taking books
from the desk, turning pages, using scissors and undertaking craft activities. There is
variation in the amount of time spent on fine motor activities in a classroom,
reflective of teaching styles rather than variation in grade level; that is, in some
classrooms the primary learning modality is fine motor activity, whereas in other
classrooms group discussion or oral instruction predominates (McHale and Cermak
1992).
In the preceding chapters, the effect of amblyopia on a range of motor skills, as well
as self-esteem, was described, however, the question of relevance to a child’s quality
of life remains. The children with amblyopia had worse performance than the age-
matched control children on a range of standardised, age-appropriate tasks designed
Relationship between educational outcomes and fine motor skills Chapter 7
156
to assess the motor skills needed in practical, everyday tasks. While the impact of
amblyopia was greatest on manual dexterity tasks that required speed and accuracy,
visual motor control scores were also reduced in the amblyopic group. As children
in elementary (primary) school are reported to spend thirty to sixty percent of their
day performing hand writing and other fine motor tasks (McHale and Cermak 1992),
we sought to explore the relationships between fine motor skills scores and
standardised measures of educational achievement.
In this chapter we determined the relationship between outcome measures on fine
motor skills tasks and scores on standardised tests of educational attainment in
children with normal vision. This allowed us to indirectly consider the implications
of the deficits found in these skills in amblyopic children. This indirect approach to
interpreting the educational implication of the decrements in fine motor skills in
amblyopic children was taken because, while it was relatively easy to gain approval
from the relevant school authority to obtain the educational outcomes of the control
children who attended Bulimba State School, this was not the case for the amblyopic
children who attended different schools and school districts across South East
Queensland.
In this chapter we explored the relationships between outcome scores of the
Brunicks-Oseretsky Test of Motor Proficiency (BOTMP) and results of standardised
tests of mathematics, spelling and reading in children with normal vision.
Understanding the relationships between fine motor skills proficiency and
educational outcomes may provide insight into the implications of the decrements in
fine motor skills found in children with amblyopia.
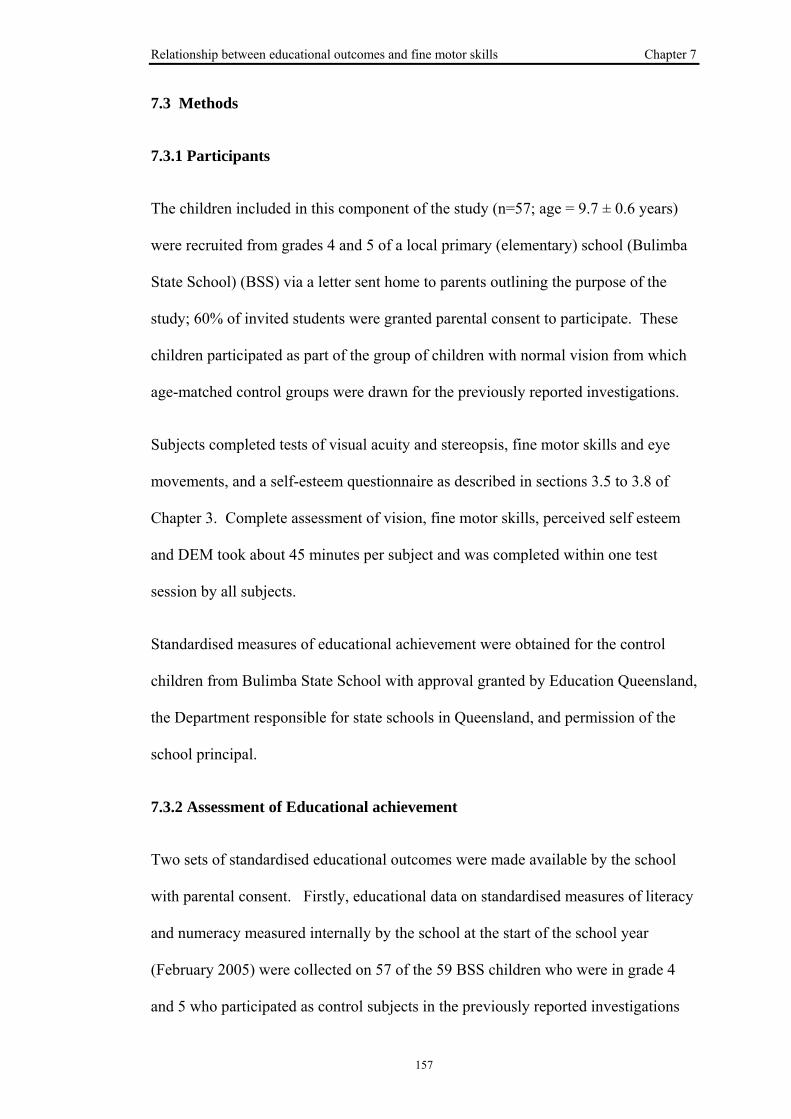
Relationship between educational outcomes and fine motor skills Chapter 7
157
7.3 Methods
7.3.1 Participants
The children included in this component of the study (n=57; age = 9.7 ± 0.6 years)
were recruited from grades 4 and 5 of a local primary (elementary) school (Bulimba
State School) (BSS) via a letter sent home to parents outlining the purpose of the
study; 60% of invited students were granted parental consent to participate. These
children participated as part of the group of children with normal vision from which
age-matched control groups were drawn for the previously reported investigations.
Subjects completed tests of visual acuity and stereopsis, fine motor skills and eye
movements, and a self-esteem questionnaire as described in sections 3.5 to 3.8 of
Chapter 3. Complete assessment of vision, fine motor skills, perceived self esteem
and DEM took about 45 minutes per subject and was completed within one test
session by all subjects.
Standardised measures of educational achievement were obtained for the control
children from Bulimba State School with approval granted by Education Queensland,
the Department responsible for state schools in Queensland, and permission of the
school principal.
7.3.2 Assessment of Educational achievement
Two sets of standardised educational outcomes were made available by the school
with parental consent. Firstly, educational data on standardised measures of literacy
and numeracy measured internally by the school at the start of the school year
(February 2005) were collected on 57 of the 59 BSS children who were in grade 4
and 5 who participated as control subjects in the previously reported investigations

Relationship between educational outcomes and fine motor skills Chapter 7
158
(two students were absent from school on the day of testing). Mathematics, reading
and spelling were tested with standardised assessment tools by the usual classroom
teacher in class time at the beginning of the school year (February 2005).
Mathematics was assessed with the Progressive Achievement Test in Mathematics
Revised (PATMaths Revised) (Australian Council for Educational Research 2005),
spelling was assessed using the Single Word Spelling Test (SWST) (Sacre and
Masterson 2001) and reading was assessed with the Reading Progress Test (RPT)
(Vincent et al. 1997).
The PATMaths Revised tests are used in Australian schools to provide information
to teachers about the level of achievement attained by their students in the skills and
understanding of mathematics. There are six tests which cover grade year levels
from 4 to 9 in Queensland and require 45 minutes testing time. Raw scores on a test
can be converted to a norm-referenced percentile rank using 1997 norms.
Preparation of the tests involved extensive review and revision to confirm high
reliability and validity over a large cohort of children (Australian Council for
Educational Research 2005).
The Single Word Spelling Test (SWST) is a series of tests designed to assess the
spelling attainment of 5 to 14 year olds. The tests are intended for group
administration and take approximately 30 minutes each to administer. Test D was
administered to grade 4 students and Test E to grade 5 students. The SWST series
was standardised in June 2000 using a sample of schools in the UK. High measures
of reliability, repeatability and content validity were reported (Sacre and Masterson
2001).
Relationship between educational outcomes and fine motor skills Chapter 7
159
The Reading Progress Tests are a series of seven tests for children aged 5 to 11 years.
Each test has cross-sectional normal values which give standardised scores and
reading ages, as well as ability scores and has high repeatability and validity. The
tests are made up of three main types of comprehension question: (1) identifying the
meaning of individual words, (2) selecting the right answer from a number of choices
after reading a short story, non-fiction passage or poem, and (3) choosing, or
supplying, missing words in a short story or non-fiction passage. The children work
through the tests at their own pace after an initial explanation by the teacher,
generally requiring 45-50 minutes to complete the tests (Vincent et al. 1997).
The second set of standardised test outcomes, results on the Queensland Studies
Authority (QSA) Years 3, 5 and 7 tests in Aspects of Literacy and Numeracy, were
also obtained from the school on a subset of 29 of the 57 children (those children in
Grade 5 who sat the tests in August 2005), allowing validation of the achievement
scores obtained by the classroom teachers. The QSA 3,5,7 tests, developed
specifically for Queensland students and managed by the Queensland Studies
Authority on behalf of the Queensland Government (Queensland Studies Authority
2004), are based on Queensland syllabuses and are designed to cover a wide range of
children's abilities across the state. Results are reported as scaled scores. As for the
internal tests of educational ability, the children completed the tests in their
classroom with their regular classroom teacher, and answer booklets were marked by
the Queensland Studies Authority external to the school. Aspects of Measurement
and Data, Number, and Space are assessed in the Numeracy Test. Aspects of
Reading and Viewing, Spelling, and Writing, are assessed in the Literacy Test.

Relationship between educational outcomes and fine motor skills Chapter 7
160
7.3.3 Statistical Analysis
Pearson’s correlation co-efficients (r) were calculated to test the correlation between
the two sets of educational achievement data and to explore the relationships
between fine motor skills scores and measures of literacy and numeracy; to account
for multiple comparisons, a significance level of 0.01 was used (Curtin and Schulz
1998).
7.4 Results
Table 7.1 shows that the children included in this study had on average -0.03
logMAR VA in their better eye and -0.02 logMAR VA in their poorer eye, with an
average of 0.013 logMAR difference in acuity between eyes. The majority (56/57)
of the group scored 18 out of 18 on the Randot stereopsis test, indicating at least 40
seconds of arc stereoacuity. One subject scored 16 out of 18, identifying all items up
to 60 seconds of arc disparity and one out of three 40 seconds of arc items. Two
subjects wore glasses to correct hyperopic refractive error.
Fine motor skills scores were derived from the sum of scores on eight tasks within
both the visual motor control and upper limb speed and dexterity domains of the
Brunicks-Oseretsky Test of Motor Proficiency. The item sum scores were converted
to subtest age-standardised scaled scores of performance relative to published
normative values (Bruininks 1978) as per section 3.6. An estimate of the level of
clinical performance on an overall item was derived from the age-standardised scaled
score by referring to published normative data (Bruininks 1978). The clinical
performance was graded to be at, or above, average for age in all of the children for
the Visual Motor Control domain and in 95% of the children for the Upper Limb
Speed and Dexterity domain.

Relationship between educational outcomes and fine motor skills Chapter 7
161
Table 7.1: Summary of vision and fine motor skills results in BSS group (n=59)
Mean
(Std. Deviation) Vision VA Best Eye (logMAR) -0.029 (0.044) VA Worst (logMAR) -0.016 (0.044) Intra-ocular VA Difference 0.013 (0.019) Stereopsis (number correct out of 18) 17.95 (0.294)
Fine Motor Skills Visual Motor Control Sum of sub-items 22.7 (1.3)
Standard Score 20.6 (2.5) Upper Limb Speed and Dexterity Sum of sub-items 45.6 (4.3)
Standard Score 18.3 (3.7)
7.4.1 Validation of Internal BSS tests with External QSA standardised tests
Outcome scores on the QSA state wide standardised tests were highly associated
with scores achieved on internal BSS tests. Table 7.2 presents the Pearson correlation
coefficients between the BSS results and the QSA results (n=29).
Table 7.2: Correlation analysis between BSS measures and QSA measures of mathematics, reading, spelling N=29. ** Correlation is significant at the 0.01 level. * Correlation is significant at the 0.05 level.
QSA standardised test results – Grade 5 2005
Numeracy Literacy
BSS Internal tests NUMBER NUMERACY MEASURE-MENT AND
DATA SPACE
READING AND
VIEWING WRITING SPELLING
Mathematics Standard Score .655** .645** .393* .552** .685** .106 .272
Spelling Standard Score .380 .487* .312 .581 .652** .099 .763**
Reading Standard Score .402* .563* .402* .642** .801** .359 .557**

Relationship between educational outcomes and fine motor skills Chapter 7
162
The strongest correlations were noted between those components of educational
ability that tested similar educational tasks across the two tests; that is, the BSS
Reading score and the QSA Reading and Viewing score (r=0.801), BSS spelling
score and QSA Spelling (r=0.763) and BSS Math score and QSA Number (r=0.655).
The finding of a strong association between the two educational measures, even
though the internal tests were taken at the start of the school year while the QSA tests
were taken more than mid-way through the school year, suggests that the relationship
between the two approaches is likely to be robust, given that some children may have
made relative gains during this time. The strength of the association between the two
measures provides support for the use of the internal school tests (BSS) as a measure
of educational outcomes. As the BSS educational scores were available for the
larger cohort of fifty seven children, they were used as the measure of educational
outcome for the subsequent analyses.
7.4.2 Vision and BSS educational outcomes
The BSS Mathematics, Reading and Spelling outcome scores were not associated
with measures of vision (VA in either eye, VA difference or stereoacuity). Table 7.3
presents Pearson correlation coefficients calculated between the vision and education
measures.
The outcome spelling score was, however, significantly related to age (r = -0.400).
To account for confounding influence of age in subsequent analysis, the tests for
correlation between motor skills and educational outcome were conducted separately
for the grade 4 and grade 5 cohorts.
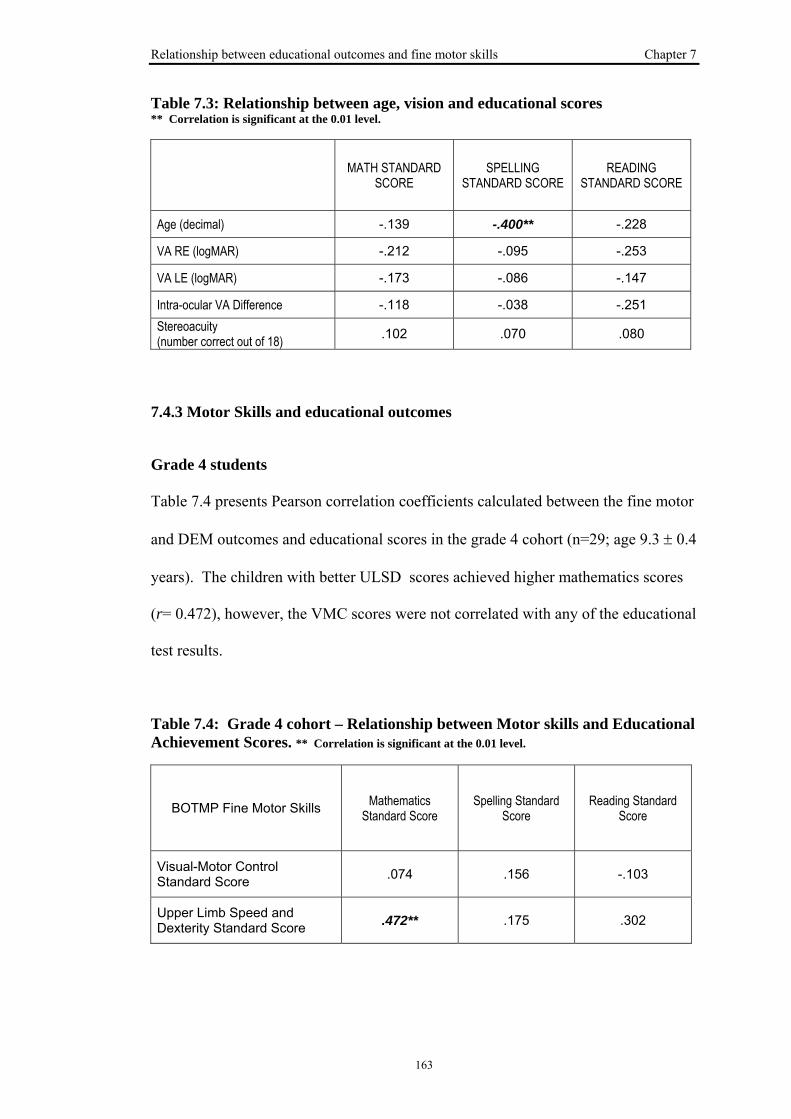
Relationship between educational outcomes and fine motor skills Chapter 7
163
Table 7.3: Relationship between age, vision and educational scores ** Correlation is significant at the 0.01 level.
MATH STANDARD SCORE
SPELLING STANDARD SCORE
READING STANDARD SCORE
Age (decimal) -.139 -.400** -.228
VA RE (logMAR) -.212 -.095 -.253
VA LE (logMAR) -.173 -.086 -.147
Intra-ocular VA Difference -.118 -.038 -.251 Stereoacuity (number correct out of 18) .102 .070 .080
7.4.3 Motor Skills and educational outcomes
Grade 4 students
Table 7.4 presents Pearson correlation coefficients calculated between the fine motor
and DEM outcomes and educational scores in the grade 4 cohort (n=29; age 9.3 ± 0.4
years). The children with better ULSD scores achieved higher mathematics scores
(r= 0.472), however, the VMC scores were not correlated with any of the educational
test results.
Table 7.4: Grade 4 cohort – Relationship between Motor skills and Educational Achievement Scores. ** Correlation is significant at the 0.01 level.
BOTMP Fine Motor Skills Mathematics Standard Score
Spelling Standard Score
Reading Standard Score
Visual-Motor Control Standard Score .074 .156 -.103
Upper Limb Speed and Dexterity Standard Score .472** .175 .302

Relationship between educational outcomes and fine motor skills Chapter 7
164
Figure 7.1 is a plot of the bivariate distribution of mathematics score and USLD
standard score. While the spread in the data is apparent in the graph, a positive
correlation is seen, with a tendency for higher mathematics scores in those children
with higher ULSD scores. Approximately 22 percent of the variation in mathematics
score can be accounted for by ULSD score.
Figure 7.1: Bivariate distribution of Mathematics standard score and ULSD standard score in Grade 4 cohort
Grade 5 students
Table 7.5 presents Pearson correlation coefficients calculated between the fine motor
skills and DEM outcomes and educational scores in the grade 5 cohort (n=28; age
10.2 ± 0.3 years). Significant correlations (p<0.01) were found between ULSD and
both Spelling (r= 0.471) and Reading scores (r= 0.371) and between VMC and
Spelling (r= 0.354). The fine motor skills scores accounted for 12 to 22 percent of
the variation in these educational scores.
Upper Limb Speed and Dexterity Standard Score25201510 5
Mat
hem
atic
s St
anda
rd S
core
100
80
60
40
20
0
R Sq Linear = 0.222
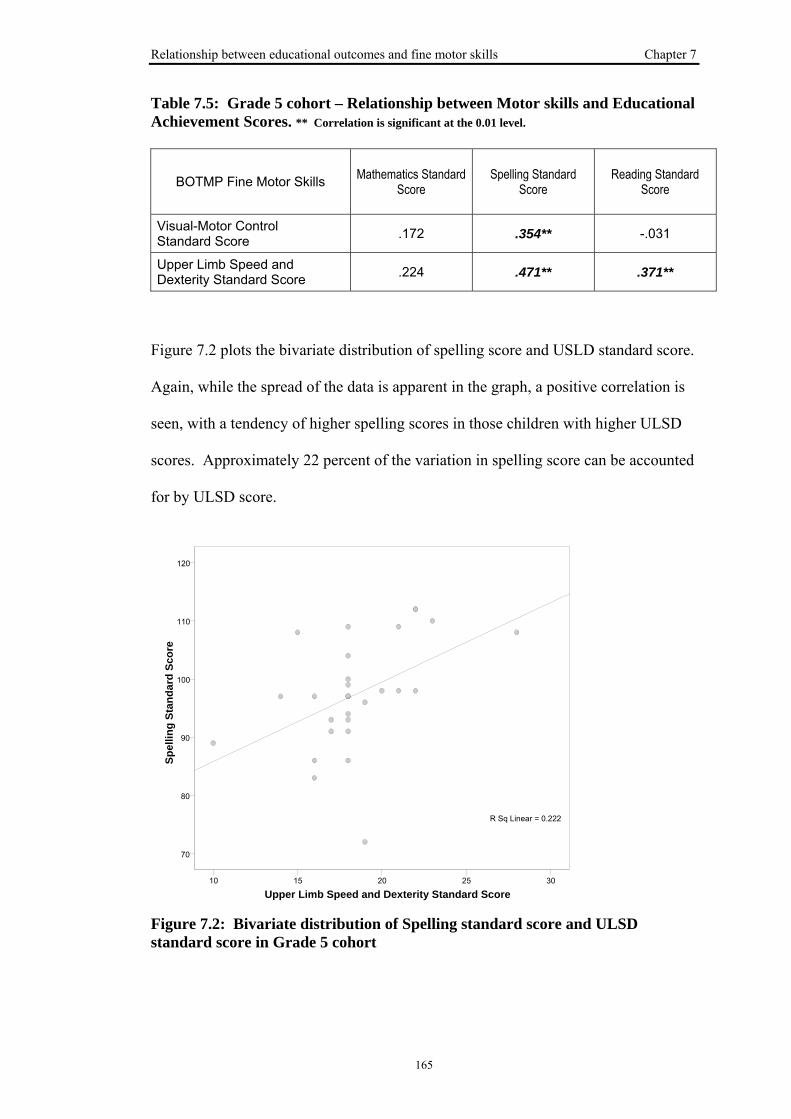
Relationship between educational outcomes and fine motor skills Chapter 7
165
Table 7.5: Grade 5 cohort – Relationship between Motor skills and Educational Achievement Scores. ** Correlation is significant at the 0.01 level.
BOTMP Fine Motor Skills Mathematics Standard Score
Spelling Standard Score
Reading Standard Score
Visual-Motor Control Standard Score .172 .354** -.031
Upper Limb Speed and Dexterity Standard Score .224 .471** .371**
Figure 7.2 plots the bivariate distribution of spelling score and USLD standard score.
Again, while the spread of the data is apparent in the graph, a positive correlation is
seen, with a tendency of higher spelling scores in those children with higher ULSD
scores. Approximately 22 percent of the variation in spelling score can be accounted
for by ULSD score.
Figure 7.2: Bivariate distribution of Spelling standard score and ULSD standard score in Grade 5 cohort
Upper Limb Speed and Dexterity Standard Score30252015 10
Spel
ling
Stan
dard
Sco
re
120
110
100
90
80
70
R Sq Linear = 0.222

Relationship between educational outcomes and fine motor skills Chapter 7
166
7.5 Discussion
Proficiency on clinical measures of fine motor skills was associated with better
outcomes on standardised measures of educational performance, particularly in
children in grade 5. Educational performance was most highly correlated with fine
motor skills measures that reflect speed and accuracy. Significant associations were
found between measures of fine motor skill proficiency and educational achievement
scores, with performance on the upper limb speed and dexterity (ULSD) item (timed
manual dexterity tasks) showing the strongest association with education outcomes.
The fine motor skills scores accounted for 12 to 22 percent of the variation in these
educational scores.
This sample of children with normal vision had few examples of below average
clinical performance on the tests of fine motor skill. The clinical performance was
graded to be at, or above average for age for all of the children in the VMC domain
and for ninety-five percent of the children in the ULSD domain. Nevertheless, there
were some reasonably strong relationships between ULSD and mathematics scores in
the grade 4 group and between ULSD and spelling and reading in the grade 5 cohort.
The finding that VMC had relatively little association with educational outcomes was
somewhat surprising as this was the item that involved more pencil-to-paper
activities. However, unlike the ULSD tasks, the scoring of the VMC does not reflect
the time required to complete the task. The timing element may be an important
factor, in that children slow to complete a task may not finish all the work required in
a test situation and thus achieve a lower score.
While our results are not evidence for a causative relationship between fine motor
skills and educational outcomes, they do suggest a tendency for children with lower

Relationship between educational outcomes and fine motor skills Chapter 7
167
proficiency scores on standardised tests of fine motor skills to achieve lower scores
on education tests than those children with higher scores. Poor fine motor skills have
been suggested to contribute to poor academic performance, due to need for more
time to copy material or complete work (McHale and Cermak 1992). Another theory
would be that whatever factor is influencing proficiency for timed manual dexterity
tasks may similarly influence learning in other domains which would be reflected in
the education scores.
This pilot study of a small group of children with normal vision provides an indirect
measure of how proficiency in fine motor skills might influence educational
outcomes of children with a history of amblyopia. This approach was taken because
standardised measures of educational achievement were readily obtainable for the
control children from Bulimba State School, with permission granted by Education
Queensland and the school principal. The sample of amblyopic children who
participated in the study reported in the previous chapters were drawn from the
private practice of a paediatric ophthalmologist and attended either state schools,
independent schools or catholic schools from a broad geographic region of south-east
Queensland. Access to educational data of the amblyopic children would therefore
have required additional approval from Independent Schools Queensland and from
Queensland Catholic Education Commission as well as permission from each
amblyopic child’s school principal which was outside the scope of the present study.
We sought to explore the implications of fine motor skill proficiency by determining
the relationships between fine motor skills scores and educational measures. Our
results suggest that deficits in fine motor proficiency may be expected to have
negative educational consequences for amblyopic children, although this question

Relationship between educational outcomes and fine motor skills Chapter 7
168
requires a prospective study to further clarify the relationship. Future studies are
planned to more directly measure the impact of amblyopia on educational outcomes,
an important quality of life measure in children; such studies would involve gaining
access to standardised educational measures in children with amblyopia.

General Discussion Chapter 8
169
Chapter 8 GENERAL DISCUSSION
8.1 Introduction
A Health Technology Assessment report published in 1997 concluded that the
evidence for the value of childhood vision screening for amblyopia or its aetiological
conditions did not support any expansion of current screening programmes; indeed, it
recommended that the National Screening Committee should consider halting the
existing programme (Snowden and Stewart-Brown 1997a). The authors specifically
highlighted the lack of evidence on the long-term impact of amblyopia, the extent of
disability that amblyopia and strabismus have and their impact on quality of life. The
review conclusions were much debated in the literature, with criticism that its
recommendations were not objective and that a lack of adequate data regarding the
effectiveness of amblyopia treatment might result in a premature disassembly of pre-
school vision screening programs (Rahi and Dezateux 1997; Stewart-Brown and
Snowden 1998; Williams et al. 1998).
The study presented in this thesis sought to address the identified deficit in the
literature by determining the impact of amblyopia on functional outcomes, including
motor and psychosocial skills in children, and hence considered the extent of
possible disability that accompanies amblyopia in the paediatric population.
Specifically, the performance of amblyopic children was measured and compared
with that of age-matched controls on standardised clinical tests of fine motor skills
and saccadic eye movements. The relative influence of the cause and extent of
amblyopia on outcome scores was investigated to determine which factors were most
likely to contribute to motor skills performance. The psychosocial impact of

General Discussion Chapter 8
170
amblyopia and its treatment was explored by comparing self-esteem scores between
amblyopic and control children, using a clinical measure of self-perception that
tested across a number of domains of importance to children’s lives as well as global
self-worth.
Performance of amblyopic children on standardised developmental tests of fine
motor skills was poorer than that of controls, particularly in those amblyopes with a
history of strabismus. The deficits in fine motor skills scores were greatest on manual
dexterity tasks involving speed and accuracy. However, there were no significant
differences in outcome scores between amblyopic children and controls on the
Developmental Eye Movement test (DEM), an indirect measure of saccades.
We found that amblyopia can negatively impact on the self-esteem domain related to
social interaction in children aged from approximately eight years of age. However,
self-esteem scores in global self-worth and other domains considered of importance
in children’s lives, including athletic ability and physical appearance, were not
affected by amblyopia. Self-esteem scores in younger amblyopic children (aged five
to eight years) were not different to those of controls.
We explored the relationship between fine motor skills scores and standardised test
scores in reading, spelling and mathematics in a subgroup of control children. Our
analysis found that outcomes on standardised measures of educational performance
are associated with clinical measures of fine motor skills. Scores on timed manual
dexterity tasks had the strongest association with educational performance.
Collectively, the results of this study indicate that, in addition to the reduction in
visual acuity and binocular function that define the condition, amblyopes
demonstrate functional impairment in those childhood development skills that

General Discussion Chapter 8
171
underlie proficiency in everyday activities. The study provides support for strategies
aimed at early identification and remediation of amblyopia and the co-morbidities
that may arise from abnormal visual neurodevelopment.
The specific research questions of the study were:
(1) Do children with amblyopia have poorer fine motor skills than age-matched
control children? Can a decrement in fine motor skills score be predicted from
vision characteristics?
Amblyopic children performed worse than age-matched control children on nine of
sixteen fine motor skills tasks. The deficits in motor performance were greatest on
manual dexterity tasks requiring speed and accuracy. Importantly, comparison of the
distributions of overall scores indicated that the consistent decrement in the
amblyopic group was not a consequence of a few individuals showing large deficits,
but rather a global reduction in performance. When the fine motor skill performance
scores were compared to published normative data, a range of motor skills ability
was seen in both groups, however, a larger proportion of the amblyopic group had
scores which fell in the “below average” performance range and a smaller proportion
performed in the “above average” range for both fine motor skills domains. The
difference between amblyopic and control groups was greater in the battery of tasks
that required speed and dexterity (ULSD) rather than tasks that required accuracy
and control (VMC). Both amblyopia aetiology and level of binocular vision were
related to fine motor skills scores. However, when the inter-relationships between
various factors was taken into account, performance on the fine motor skills tasks
was associated with a history of strabismus, but not with level of stereopsis or inter-

General Discussion Chapter 8
172
ocular difference in VA. We concluded that fine motor skills were reduced in our
sample of amblyopic children, particularly those with strabismus, compared to
controls. The deficits in motor performance were greatest on manual dexterity tasks
requiring speed and accuracy.
(2) Do children with amblyopia have poorer self-esteem than age-matched children
with normal vision development? Can self-esteem scores be predicted from
condition or treatment information?
Self-perception of social acceptance was lower in amblyopic children aged from
grade three school level (approximately eight years of age) compared with age-
matched controls. Lower social acceptance scores were found for subjects whose
amblyopia was caused by acquired strabismus, all of whom wore glasses and two-
thirds of whom had been treated with patching, and for those with deprivation
amblyopia who had the greatest amblyopic VA deficit. In other areas related to
self-esteem, including scholastic competence, physical appearance, athletic
competence, behavioural conduct and global self worth, amblyopic children had
scores similar to those of control children. A reduction in social-acceptance scores
was associated with a history of patching treatment but not with a history of
strabismus or spectacle wear.
Self-esteem scores of amblyopic children from preschool to grade two school level
(aged from five to eight years) were similar to those of age-matched children with
normal visual development, including the domain that related to peer-acceptance.
Compared with older children, children less than eight years are thought to be less
influenced by the responses of their peers and may therefore be less conscious of
General Discussion Chapter 8
173
the stigma associated with wearing an eye patch during treatment. Our study
indicates that spectacle wear does not contribute to reduced social acceptance in
amblyopic children and emphasises the importance of exploring refractive
correction as the first step in treatment of amblyopia, with the hope that patching,
with its potential negative psychosocial effects, may be minimised or avoided
altogether.
(3) Do children with amblyopia have poorer outcomes on clinical measures of eye
movements than children with normal vision development? Can performance on
clinical tests of eye movements be predicted from measured vision
characteristics?
In our sample of amblyopic children, the outcomes measures on the DEM test were
equivalent to those of age-matched children with normal vision, indicating that the
ability of amblyopic children to quickly execute the saccades required to fixate,
identify and name single digits was not significantly different to that of their age-
matched peers. In addition, we found that the outcome measures of the DEM did not
significantly relate to VA in either eye, or to inter-ocular VA difference, levels of
stereoacuity, or magnitude of refractive correction.
The DEM test is an indirect measure of saccades and is commonly employed by
optometrists for the clinical assessment of oculomotor efficiency. The Visagraph III
Eye-Movement recording system uses goggles containing infrared sensors to capture
eye position during reading. We investigated the relationship between the outcome
measures of the DEM and objective recordings of eye movement characteristics

General Discussion Chapter 8
174
during reading for comprehension in children with normal vision. We found that
those children with slow DEM outcomes (particularly Horizontal time) tended to
have slower words per minute reading rate calculated from Visagraph recording. Our
findings support the clinical use of the timed outcomes of the DEM to aid
identification of children who are likely to have slower reading rate. However, the
relationships between DEM outcomes, Visagraph recorded eye movement
characteristics and measures of reading or learning are yet to be established.
(4) How do measures of fine motor skill relate to measures of educational
performance in children with normal visual development?
To investigate the functional implications of fine motor skill performance, the
relationships between measures of fine motor skills and educational outcomes were
explored in children with normal vision. The amblyopic children attended a variety
of schools and districts throughout South-East Queensland which made access to
their standardised test results logistically outside the scope of this study. Proficiency
on clinical measures of fine motor skill was associated with better outcomes on
standardised measures of educational performance for the control children.
Educational performance was most highly correlated with those fine motor skill
measures that reflect speed and accuracy.
While our results are not evidence for a causative relationship between fine motor
skills and educational outcomes, they do suggest a tendency for children with lower
scores on standardised tests of fine motor skills to achieve lower scores on education
tests than those children with higher scores. Alternatively, a factor that influences

General Discussion Chapter 8
175
proficiency on timed manual dexterity tasks may similarly influence learning in other
domains which would be reflected in the education scores.
8.2 Implications for theory
It is important to consider the findings of this study in the context of current
knowledge of the neurophysiological changes underlying amblyopia. Abnormal
visual experience early in life interferes with the neuro-development of the visual
pathway and results in loss of visual function. Neurophysiological evidence
indicates dysfunction in amblyopes in both primary and secondary visual areas,
regions within the parieto-occipital cortex and the ventral temporal cortex (Anderson
and Swettenham 2006). The most profound and consistent changes in the visual
pathways are at the striate cortex (Ciuffreda et al. 1991), however, amblyopia is also
believed to impact on the extra-striate pathways, predominantly those which process
motion information (Simmers et al. 2003), although the extent of these changes is
less well known
We hypothesized that the aetiology of amblyopia would influence performance on
fine motor skills tasks, given the differences in results of electrophysiological studies
of neurophysiology and psychophysical studies of visual function of amblyopes with
a history of blur (anisometropia and form deprivation) and those with a history of
ocular misalignment (strabismus). Indeed, in addition to significant differences in
fine motor skill scores between amblyopic and control children, we found significant
differences in scores between amblyopia subgroups, where not all of the amblyopic
groups displayed a deficit in fine motor skills. Our results suggest that the cause of
amblyopia, rather than the extent of the clinical visual deficit, determines the impact
of amblyopia on fine motor skill development. Our finding that strabismus has the

General Discussion Chapter 8
176
greatest negative influence on fine motor skills performance may indicate that
neurological changes associated with strabismus have a detrimental influence on the
development of hand-eye co-ordination skills.
McKee et al. (2003) suggest that individuals with amblyopia should be classified
based on two distinct developmental anomalies that account for the differential
pattern of vision losses in amblyopia found between aetiological groups. These are
the developmental anomaly arising from blurred or obscured vision during early
development, as is the case in anisometropic and deprivation amblyopia; and that
resulting from disruption to the development of binocular vision in the central visual
field, as occurs with strabismus (McKee et al. 2003). Our finding that strabismic
amblyopes had poorer fine motor skills scores than those whose amblyopia resulted
from blurred or obscured vision suggests that neurophysiological change beyond the
primary visual cortex may be more profound in the developmental anomaly arising
from ocular misalignment. Whether this neurological consequence is subsequent to
the relative pattern of the visual losses described by McKee et al. (2003) or a co-
existing consequence of the primary condition is not known.
Previous studies have attempted to correlate performance on fine motor skills with a
deficit in VA or reduction in stereopsis (Rogers et al. 1982; Hrisos et al. 2006;
Caputo et al. 2007; Grant et al. 2007; Mazyn et al. 2007). We determined the
relative contributions of these to fine motor skill performance in a multiple
regression analysis that took into account the inter-relationship between factors. This
analysis indicated that it was the cause of amblyopia, rather than the extent of VA or
stereoacuity loss, that correlated with fine motor skill performance. This implies that
performance on this test of fine motor skills was not limited due to blur or loss of

General Discussion Chapter 8
177
depth perception making the task more difficult, but rather genuinely reflects poorer
fine motor proficiency in those children whose amblyopia is a consequence of ocular
misalignment.
Our investigation involved the evaluation of two domains of fine motor skills: VMC
and ULSD. While the scores of the amblyopic children were poorer than those of
control children in both domains, the greatest decrement in performance was in
ULSD tasks, whose scores were based on the number of times the manual dexterity
task was successfully completed within a set time frame. The amblyopic children
may have adopted a compensatory strategy of slowing down their responses, in order
to provide the opportunity for visual feedback during the task, allowing accurate
completion of the drawing and cutting tasks, hence achieving better scores in this
domain. However, during the timed ULSD tasks there was less opportunity for visual
feedback to influence the outcome score and no opportunity for compensatory
slowing of response times. This speed-accuracy trade-off was proposed by Grant et
al. (2007) when quantifying the reaching and grasping behaviour of amblyopic
subjects. Relative to controls, amblyopes showed a range of deficits in their approach
to an object and when closing and applying grasp, including prolonged execution
times and more errors (Grant et al. 2007). That is, on the timed manual dexterity
tasks amblyopes may have slowed their motor response in order to accurately
complete the tasks because they could not see the tasks clearly, or loss of
stereoacuity limited judgement of position of the tasks. Their findings were
suggested to be compatible with altered processing in amblyopia at both the primary
visual cortex and beyond, although they reported no significant difference in the
movement kinematics or error rates between strabismic and non-strabismic
amblyopes. (Grant et al. 2007).

General Discussion Chapter 8
178
Our multiple regression analysis lends greater support to the hypothesis that
amblyopia arising subsequent to strabismus influences the neural development of
fine motor skill dexterity, rather than the residual loss of visual clarity and depth
perception making the fine motor skills tasks more difficult to perform. Amblyopes
have been reported to have deficits in visual processing of global-orientation and
global-motion whose cortical locus is likely to be beyond the striate cortex,
particularly affecting the dorsal extrastriate processing stream (Simmers et al. 2003;
Simmers et al. 2005). Our finding is compatible with neurophysiological changes
beyond the primary visual cortex, with the suggestion that this change may be more
profound in strabismic amblyopia. Neurophysiological studies that further explore
differences between amblyopic developmental groups in abnormal
neurodevelopment beyond the striate cortex may provide further insight into the
underlying mechanisms.
Our exploratory study in a small group of children with normal vision tested the
relationships between fine motor skill scores and outcomes on standardised tests of
reading, spelling and mathematics. While our results are not evidence for a causative
relationship between fine motor skills and educational outcomes, they do suggest a
tendency for children with lower proficiency scores on standardised tests of fine
motor skills to achieve lower scores on education tests than those children with
higher scores. Poor fine motor skills have been suggested to contribute to poor
academic performance due to the need for more time to copy material or complete
work (McHale and Cermak 1992). An alternative hypothesis is that whatever factor
is influencing proficiency for timed manual dexterity tasks may similarly influence
learning in other domains which are reflected in the education scores. Inclusion of
General Discussion Chapter 8
179
measures of educational outcomes in future studies of functional effects of
amblyopia is warranted.
We hypothesised that amblyopic children would not perform as well as control
children on a clinical test of saccadic eye movements. While we recognise that the
DEM is an indirect measure of saccades, the task does require rapid eye movements
to change fixation between numbers for accurate identification and naming of digits.
Like the ULSD items of the fine motor skills test, the DEM outcomes are scored
based upon the time taken to complete the tasks. However, unlike the fine motor
skills test outcomes, the amblyopic children performed as well as age-matched
controls on the DEM test and the outcome measures on the DEM were not associated
with a history of strabismus, VA in either eye, level of binocular function or
magnitude of refractive error.
Our results thus demonstrate that the saccadic eye movements and visual-
verbalisation skills required to perform the DEM are not degraded by amblyopia to
the same extent as visual-motor control and visually-directed manual dexterity
required for the fine motor skills tasks. This indicates the involvement of different
neural pathways that are not altered to the same extent by amblyopic neuro-
development. Functional neuro-imaging studies in humans have contributed to the
identification and localization of regions comprising a network involved in saccade
generation (McDowell et al. 2008). At the sub-cortical level, this network includes
the striatum, thalamus, and superior colliculus; cortically, the network includes
primary visual cortex and extrastriate cortex, regions of posterior parietal cortex, and
the frontal eye field and supplementary eye field in frontal cortex. Our findings may
suggest that saccadic execution is a lower order neurological task than that of motor

General Discussion Chapter 8
180
planning and is not influenced to the same degree by the neurophysiological changes
inherent in amblyopia.
Alternatively, the DEM may not have been a sensitive enough test of saccadic eye
movements to reveal differences between amblyopes and controls. Further study of
binocular eye movement characteristics in amblyopia is warranted, particularly those
eye movements that may relate to the performance of functional tasks such as
reading. Employment of direct measures of eye movements using oculomotor
recording techniques may provide a more sensitive measure than the clinical test
used in this study.
In our study of the impact of amblyopia on self-esteem we showed that children with
a history of amblyopia who were at preschool to grade 2 school level had similar
self-perception scores in the domains of cognitive competence, physical competence
and peer acceptance to those of age-matched control children. However, older
amblyopic children, from grade 3 school level and above, had lower scores on the
social acceptance domain “feels accepted by peers” or “feels popular” than their age-
matched peers. Our finding that children less than eight years of age are robust in
their self-evaluation is consistent with current knowledge of the development of a
child’s self-perception. Highly positive self-concept is believed to persist throughout
the early childhood years, with typically very positive self-representations as the
child continues to overestimate his or her own abilities (Harter 1999). It is only
during middle to late childhood (from 8 to 11 years of age ) that the child’s rating of
themselves becomes increasing based on comparison with others, particularly their
peers (Harter 1988; Harter 1999).

General Discussion Chapter 8
181
Our study provides further support for concerns raised by others that patching can
have negative psychosocial consequences for children, particularly if the patching is
conducted when the child is old enough to be aware of the differences between
themselves and their peers, or when the child starts school when the potential for
bullying arises (Koklanis and Georgievski 2007) (Williams and Harrad 2006).
8.3 Implications for public health policy
During the decade since the Snowden and Stewart-Brown (1997a) first questioned
whether vision screening to detect amblyopia, refractive error and strabismus should
continue, evidence supporting continued childhood vision screening has emerged.
From a population perspective, studies have now described the association between
amblyopia and lifetime risk of vision impairment (Rahi et al. 2002; van Leeuwen et
al. 2007). Debate has continued regarding the benefits of community funded vision
preschool screenings to detect the conditions that may cause amblyopia, with the
cost-effectiveness of screening found to be dependant on the long-term utility effects
of loss of vision in one eye (Carlton et al. 2008). The lifetime risk of bilateral vision
impairment is much higher for amblyopes than for controls; being as high as eighteen
percent for those with amblyopia compared with ten percent in non-amblyopes (van
Leeuwen et al. 2007). While data for the natural history of untreated amblyopia are
still scarce, randomised controlled treatment trials (Clarke et al. 2003), and reviews
of patients who have not been compliant with treatment (Simons and Preslan 1999),
indicate that amblyopia does not recover without intervention. Our study provides
evidence that amblyopia results in poorer outcomes on tests of those skills required
for proficiency in daily living tasks and which relate to childhood academic
performance. A higher proportion of our amblyopic sample than our controls had

General Discussion Chapter 8
182
outcome scores that were clinically rated as being “below average”; seventeen
percent of the amblyopic children had “below average” scores in ULSD compared
with three percent of the control children
The optimal time for visual screening has also been the subject of debate (Dutton and
Cleary 2003). Preschool vision screening, at age 3 to 4 years, has been advocated
rather than screening at school entry when children are generally 4 to 5 years of age.
This is supported by findings that early screening for amblyopia risk factors lowers
the later prevalence and severity of amblyopic deficits (Eibschitz-Tsimhoni et al.
2000; Williams et al. 2002). However, Clarke et al.’s finding that treatment efficacy
is not reduced if treatment is deferred, suggests that screening and treatment is not
critical at 4 years of age and could be delayed until during the first year of school.
(Clarke et al. 2003). In our study we demonstrated that amblyopic children from
preschool to grade 2 school level had similar peer-acceptance scores to those of
children with normal vision, however, differences were evident in older amblyopic
children. Our findings thus suggest a psychosocial benefit if patching is completed
before the age that children begin to make peer-comparisons in their formation of
self-perception (that is before approximately eight years of age). Indeed, recent
amblyopia treatment studies have found that part-time patching is effective in
restoring VA and that the course of patching treatment need not extend beyond six
months (Stewart et al. 2007). Collectively this evidence suggests that early screening
for amblyopic risk factors, allowing completion of patching therapy before the start
of formal schooling, may carry psychosocial benefits for the child by avoiding the
negative attention of patching at school.

General Discussion Chapter 8
183
8.4 Implications for Clinical Practice
Fine motor skills are believed to underlie thirty to sixty percent of primary
(elementary) school classroom activities, such as cutting and colouring, and
especially writing tasks (McHale and Cermak 1992). Early evaluation and treatment
of fine motor skills is recommended due to the negative effects of handwriting
difficulties on a child’s academic performance and self-esteem (Ratzon et al. 2007).
Visual-motor control problems may interfere with a child’s ability to acquire writing
skills and fully participate in student activities (Ratzon et al. 2007), and performance
on a visual analysis and visual motor integration task was found to relate to academic
performance in 7, 8 and 9 year olds (Kulp 1999).
Deficits in fine motor skills in pre-school to primary (elementary) school aged
amblyopic children were found in both VMC and ULSD domains. Clinicians should
be made aware of the potential for reduced fine motor skills in children with
strabismic amblyopia, so that they can prompt early referral for evaluation of these
skills and early remediation if appropriate. Alternatively, changes to classroom
activities may be appropriate for those disadvantaged by reduced skills, such as
allowance of more time to complete tasks, or incorporation of programs to practice
these skills to better proficiency, either during school or homework time. Planned
studies of the educational outcomes of amblyopic children are needed to more
directly determine how they relate to vision and fine motor skill deficits.
Clinicians are also faced with the challenge of designing treatment regimens that are
effective in restoring vision with minimal psychosocial side-effects. Our study
provides evidence that amblyopia can impact on social interactions, particularly in
amblyopes with acquired strabismus, and suggests psychosocial benefits if patching

General Discussion Chapter 8
184
is minimised and limited to times of day when the child has less interaction with
social peers. These findings regarding self-esteem are important given the evidence
from recent treatment trials which have specifically investigated the improvement in
amblyopia that can be achieved through spectacle correction alone. Importantly, our
study indicates that spectacle wear does not contribute to reduced social acceptance
in amblyopic children and emphasises the importance of exploring refractive
correction as the first step in treating amblyopia, with the hope that patching with its
potential negative psychosocial effects may be minimised or avoided altogether. Our
finding that the peer-acceptance score of amblyopic children in preschool to grade 2
school level is similar to that of controls supports the suggestion that identification
and treatment prior to the age when peer comparisons begin to emerge may be of
psychosocial benefit to the child.
The DEM test is employed by optometrists to diagnose oculomotor dysfunction, with
a high Ratio(Horizontal Time/Vertical Time) believed to be indicative of poor saccadic eye
movement control. Given the endorsement of the DEM for ocular motor evaluation
in the optometric assessment of learning-related vision problems in children
(Scheiman and Rouse 2006), studies are needed that describe how its outcomes
specifically relate to eye movements, particularly during reading. In our pilot study
conducted in a sub-group of the control children we found a number of significant
relationships between DEM outcome measures and the objective recordings obtained
from the Visagraph. In particular, DEM Horizontal time accounted for thirty percent
of the variance in words per minute reading rate calculated from Visagraph
recording. This suggests that the timed outcomes of the DEM may be useful
clinically for the identification of children who are likely to be slower readers. Our
findings also suggest that the most useful DEM measure for identifying children with

General Discussion Chapter 8
185
a slower reading rate is Horizontal Time, rather than Ratio. While our findings
support the clinical use of the DEM for the identification of children who may have
slower reading rates, the relationship between Visagraph calculated reading rates,
DEM outcomes and more extensive measures of reading or learning have not been
fully explored.
8.5 Limitations and Further Research
The study presented in this thesis aimed to investigate the functional outcomes of
amblyopia in children and to ascertain the impact of the condition and its treatment
in the childhood population targeted by vision screening programs. Our findings
demonstrate that amblyopia has a functional impact that goes beyond the monocular
VA deficit and loss of binocular function that define the condition. We have shown
that children with amblyopia perform more poorly on a range of standardised, age-
appropriate tasks designed to assess the motor skills needed in practical, everyday
tasks. This particularly applies to amblyopic children with strabismus, and the
impact of amblyopia was greatest on manual dexterity tasks that require speed and
accuracy. Importantly, our results represent the first time that the relative
contribution of various vision characteristics on fine motor skills performance has
been determined in a large sample of amblyopic subjects from a range of aetiologies.
However, as with any study there were some limitations to our experimental
approach, often driven by practical considerations, and which form the basis of
suggestions for future work and these are considered below.
As Nilsson (2007) suggested, evaluation of the benefits of screening and treating
visual anomalies, should ideally include three groups: (1) normal controls, (2)
untreated amblyopes and (3) amblyopes after successful treatment (Nilsson 2007).

General Discussion Chapter 8
186
While our study did not include an untreated amblyopic group, there was a range of
VA in the amblyopic eye after treatment from 0.0 logMAR to 2.0 logMAR, an
indicator of relative treatment success. Correlation analysis indicated that the fine
motor skill deficit found in the amblyopic group was not related to amblyopic VA,
which suggests that successful treatment does not necessarily restore normal motor
function.
Future studies that examine changes in fine motor skill performance before and after
treatment for strabismic versus anisometropic amblyopes, would allow determination
of whether improvement in fine motor skills correlates with either improvements in
stereoacuity or VA and whether differences exist between developmental anomaly
groups. This type of study would need to control for the expected improvement in
developmental skills with age, so tests would need to have established good quality
age-matched normative data, or comparisons would need to be made with untreated
controls that were longitudinally tested at the same time intervals.
Our study employed a clinical measure of stereoacuity, the Randot stereoacuity test.
While this test has established reliability and is suitable for use in the children (Birch
et al. 2008), it does not test to threshold levels of stereoacuity. This resulted in
stereopsis scores that were not normally distributed, instead many subjects had
stereoacuity equal to or better than the highest level tested (40 seconds of arc) and
many could not pass the test at any level. Future studies that explore the relationship
between task performance and stereoacuity should include stereoacuity measures that
test to threshold.
We suggested that the reduction in performance of the amblyopic group was not a
function of greater difficulty seeing the task, but rather reflected an effect of

General Discussion Chapter 8
187
amblyopia on neural pathways beyond the primary visual cortex. This hypothesis
could be further explored by removing all visual cues for both the amblyopic and
control groups in tests of motor performance, such as timed manual dexterity.
In our study of the impact of amblyopia in children, the performance on the DEM
was compared between groups of amblyopic and age-matched control children. To
gain a more detailed description of the eye movements made during reading we also
attempted Visagraph infra-red recording whilst reading for comprehension in the
amblyopic children. However, we found such recordings were unreliable when made
through the spectacle correction worn by the majority of the amblyopic children.
Future studies should address the technical shortcomings of the Visagraph, or use
alternative objective recording techniques to gain reliable measures. This would
provide useful information regarding the pattern of eye movements made by
amblyopic children during reading tasks. Amblyopia is reported to affect
accommodation and fixation stability, ocular measures that were not assessed in this
study. Future studies that measure accommodation characteristics and fixation
stability and how they relate to recorded eye movements may provide insight into the
deficits in reading performance reported in amblyopes (Stifter, Burggasser et al.
2005).
We sought to explore the implications of fine motor skill proficiency by determining
the relationships between fine motor skill scores and educational measures. An
inference that may be drawn from our study is that deficits in fine motor proficiency
may be expected to have negative educational consequences for amblyopic children.
Future studies that have access to standardised educational measures in children with

General Discussion Chapter 8
188
amblyopia will allow a more direct measure of the impact of amblyopia on
educational outcomes, an important quality of life measure in children.
In this study a single, unmasked examiner (the PhD candidate) tested and scored all
subjects. While it is acknowledged that ideally the examiner should have been
masked to participant grouping, this was not possible in this study as the candidate
was responsible for recruitment of participants as well as conducting all testing. To
monitor for bias a sub-sample of score sheets (n=20) were re-scored by an
independent researcher masked to the participant group. Paired-samples t-tests
indicated no significant difference in scoring between examiners on 15 of 16
subtests. Masking of the examiner to participant grouping would be desirable in
future studies that examine functional skills in amblyopic children.
8.6 Summary
In addition to the visual deficits of reduced VA and stereoacuity that define
amblyopia, we demonstrated that amblyopic children have reduced performance on
standardised measures of fine motor skills involved in practical, everyday tasks.
This particularly applies to amblyopic children with a history of strabismus, with the
impact of amblyopia being greatest on manual dexterity tasks that require speed and
accuracy. As well as differences between amblyopes and controls in mean scores,
we found that relatively more amblyopic children had scores that were classified as
“below average” and fewer amblyopic children scored “above average”.
Importantly, this is the first study to report the relative contribution of various vision
characteristics to motor performance in a large sample of amblyopes, with amblyopia
resulting from a range of causes.

General Discussion Chapter 8
189
The psychosocial impact of amblyopia was evident in our study of self-esteem. Self-
perception of social acceptance was lower in amblyopic children in grade 3 or above
compared with that of with age-matched controls, with lowest scores found in
children whose amblyopia was caused by acquired strabismus. The self-perception
scores of younger amblyopic children, including peer acceptance, were not different
from those of controls.
We found no evidence of a deficit in ocular motor skills in our sample of amblyopic
children, where the outcomes scores of the DEM, a clinical measure of eye
movements, were similar between the amblyopes and controls. The outcome scores
of the DEM were also found to be associated with reading rates measured using
objective infrared recording of eye movements in children with normal vision.
In children with normal vision, those with higher fine motor skills scores
(particularly in timed manual dexterity tasks) tended to have higher outcome scores
on standardised education tests. While not evidence of a causative relationship
between fine motor skills and academic achievement, the implied effect of fine motor
skills deficits warrants further investigation.
In summary, this study provides evidence that, in addition to the reduced VA and
binocular function that define the condition, amblyopes have functional impairments
in childhood development skills that underlie proficiency in everyday activities. The
study provides support for strategies aimed at early identification and treatment of
amblyopia and the identification of co-existing deficits in the development of
visually directed skills that may arise from abnormal visual neurodevelopment.

References
190
REFERENCES
Abrahamsson, M., Magnusson, G. and Sjostrand, J. (1999). "Inheritance of
strabismus and the gain of using heredity to determine populations at risk of
developing strabismus." Acta Ophthalmol Scand 77: 653-7.
Adams, G. and Karas, M. (1999). "Effect of amblyopia on employment prospects."
Br J Ophthalmol 83(3): 378c-.
Alberman, E. D., Butler, N. R. and Gardiner, P. A. (1971). "Children with squints: A
handicapped group?" Practitioner 206(April): 501-506.
Anderson, S. J. and Swettenham, J. B. (2006). "Neuroimaging in human amblyopia."
Strabismus 14(1): 21-35.
Archer, S. M., Musch, D. C., Wren, P. A., Guire, K. E. and Del Monte, M. A. (2005).
"Social and Emotional Impact of Strabismus Surgery on Quality of Life in
Children." J AAPOS 9(2): 148-151.
Asper, L., Crewther, D. and Crewther, S. G. (2000a). "Review Strabismic Amblyopia
Part 1: Psychophysics." Clin Exp Optom 83(2): 49-58.
Asper, L., Crewther, D. and Crewther, S. G. (2000b). "Review Strabismic
Amblyopia Part 2: Neural processing." Clin Exp Optom 83(4): 200-211.
Atkinson, J., Braddick, O., Anker, S., Ehrlich, D., King, J., Watson, P. and Moore, A.
(1996). "Two infant vision screening programmes: prediction and prevention
of strabismus and amblyopia from photo- and videorefractive screening." Eye
10(2): 189-198.
Atkinson, J., Braddick, O., Nardini, M. and Anker, S. (2007). "Infant Hyperopia:
detection, distribution, changes and correlates - outcomes from the
Cambridge infant screening programs." Optom Vis Sci 84(2): 84-96.

References
191
Atkinson, J., Nardini, M., Anker, S., Braddick, O., Hughes, C. and Rae, S. (2005).
"Refractive errors in infancy predict reduced performance on the Movement
Assessment Battery for Children at 3 1/2 and 5 1/2 years of age." Dev Med
Child Neurol 47: 243-251.
Attebo, K., Mitchell, P., Cumming, R., Smith, W., Jolly, N. and Sparkes, R. (1998).
"Prevalence and causes of amblyopia in an adult population." Ophthalmology
105(1): 154-159.
Australian Council for Educational Research (2005). Progressive Achievement Tests
in Mathematics - 3rd Edition. Camberwell VIC 3124, ACER Press.
Baker, D. H., Meese, T. S. and Hess, R. F. (2008). "Contrast masking in strabismic
amblyopia: Attenuation, noise, interocular suppression and binocular
summation." Vis Res 48(15): 1625-1640.
Barnes, G., Hess, R., Dumoulin, S., Achtman, R. and Pike, G. (2004). "The cortical
deficit in humans with strabismic amblyopia." J Physiol 533(1): 281-297.
Bedell, H. E., Flom, M. and Barbeito, R. (1985). "Spatial aberrations and acuity in
strabismus and amblypia." Invest Ophthalmol Vis Sci 26: 909.
Birch, E. E., Williams, C., Drover, J., Fu, V., Cheng, C., Northstone, K., Courage, M.
and Adams, R. (2008). "Randot Preschool Stereoacuity Test: Normative data
and validity." J AAPOS 12(1): 23-26.
Birch, E. E., Williams, C., Hunter, J., Lapa, M. C. and ALSPAC (1997). "Random
Dot Stereoacuity of Preschool Children." J Ped Ophthalmol Strab 34: 217-
222.
Bloch, D. and Wick, B. (1991). "Differences between strabismic and anisometropic
amblyopia: Research findings and impact on management." Prob Optom
3(2): 276-292.

References
192
Brown, M. M., Brown, G. C., Sharma, S., Busbee, B. and Brown, H. (2001).
"Quality of life associated with unilateral and bilateral good vision."
Ophthalmology 108(4): 643-647.
Brown, S. A., Weih, L. M., Fu, C. L., Dimitrov, P., Taylor, H. R. and McCarty, C. A.
(2000). "Prevalence of amblyopia and associated refractive errors in an adult
population in Victoria, Australia." Ophthal Epidemiol 7(4): 249-258.
Bruininks, R. H. (1978). Bruininks-Oseretsky Test of Motor Proficiency, Examiner's
Manual. Minnesota, American Guidance Service,.
Burke, J. P., Leach, C. M. and Davis, H. (1997). "Psychosocial implications of
strabismus surgery in adults." J Ped Ophthalmol Strab 34: 159-164.
Byrne, D. E. (1996). Academic self-concept: Its structure, measurement and
relationship with academic achievement. Handbook of self-concept. B. A.
Bracken. New York, Wiley: 287-316.
Campbell, L. R. and Charney, E. (1991). "Factors associated with delay in diagnosis
of childhood amblyopia." Pediatrics 87(2): 178-185.
Caputo, R., Tinelli, F., Bancale, A., Campa, L., Frosini, R., Guzzetta, A., Mercuri, E.
and Cioni, G. (2007). "Motor coordination in children with congenital
strabismus: Effects of late surgery." Eur J Paediatr Neurol 11(5): 285-291.
Carlton, J., Karnon, J., Czoski-Murray, C., Smith, K. and Marr, J. (2008). "The
clinical effectiveness and cost-effectiveness of screening programmes for
amblyopia and strabismus in children up to the age of 4-5 years: a systematic
review and economic evaluation." Health Technology Assessment 12(25): 1-
230.
Choong, Y. F., Lukman, H., Martin, S. and Laws, D. E. (2004). "Childhood
amblyopia treatment: psychosocial implications for patients and primary
carers." Eye 18(4): 369-375.

References
193
Chua, B. and Mitchell, P. (2004). "Consequences of amblyopia on education,
occupation, and long term vision loss." Br J Ophthalmol 88(9): 1119-1121.
Ciuffreda, K., Levi, D. M. and Selenow, A. (1991). Amblyopia Basic and Clinical
Aspects. Stoneham, MA, Butterworth-Heinemann.
Ciuffreda, K. J. and Tannen, B. (1995a). Eye movements during reading. . Eye
Movement Basics for the Clinician. M. Sasser. St Louis, Missouri, Mosby-
Year Book, Inc: 161-183.
Ciuffreda, K. J. and Tannen, B. (1995b). Clinical Evaluation of Eye Movements. Eye
Movement Basics for the Clinician. M. Sasser. St Louis, Missouri, Mosby-
Year Book, Inc: 206-229.
Clarke, M., Wright, C., Hrisos, S., Anderson, J. D., Henderson, S. E. and Richardson,
S. R. (2003). "Randomised controlled trial of treatment of unilateral visual
impairment detected at preschool vision screening." BMJ 327: 1251-1254.
Coats, D. K., Paysse, E. A., Towler, A. J. and Dipboye, R. L. (2000). "Impact of
large angle horizontal strabismus on ability to obtain employment."
Ophthalmology 107(2): 402-405.
Colby, D., Laukkanen, H. and Yolton, R. (1998). "Use of the Taylor Visagraph II
system to evaluate eye movements made during reading." J Am Optom Assoc
69(1): 22-32.
Cotter, S., Edwards, A., Arnold, R., Astle, W., Barnhardt, C., Beck, R. W., Birch, E.
E., Donahue, S., Everett, D., Felius, J., Holmes, J. M., Kraker, R. T., Melia,
B. M., Repka, M. X., Wallace, D., Weise, K. and PEDIG (2007). "Treatment
of strabismic amblyopia with refractive correction." Am J Ophthalmol 143:
1060-1063.
Coulter, R. A. and Shallo-Hoffmann, J. (2000). "The presumed influence of attention
on accuracy in the developmental eye movement (DEM) test." Optom Vis Sci
77(8): 428-432.

References
194
Curtin, F. and Schulz, P. (1998). "Multiple correlations and Bonferroni's correction."
Biol Psychiatr 44(8): 775-777.
Daw, N. W. (1998). "Critical periods and amblyopia." Arch Ophthalmol 116(4): 502-
505.
Daw, N. W. (2006). Visual Development - second edition. New York, Springer
Science+Business Media, Inc.
Dias, L., Hyman, L., Manny, R. E. and Fern, K. (2005). "Evaluating the self-esteem
of myopic children over a three-year period: the COMET experience."
Optom Vis Sci 82(4): 338-47.
Dias, L., Manny, R. E., Hyman, L., Fern, K. and Correction of Myopia Evaluation
Trial, G. (2002). "The relationship between self-esteem of myopic children
and ocular and demographic characteristics." Optom Vis Sci 79(11): 688-696.
Donahue, S. (2007). "Pediatric Strabismus." New Eng J Med 356(10): 1040-1047.
Dutton, G. and Cleary, M. (2003). "Should we be screening for and treating
amblyopia?" BMJ 327: 1242-1243.
Eden, G. F., Stein, J. F., Wood, H. M. and Wood, F. B. (1993). "Differences in eye
movements and reading problems in dyslexic and normal children." Vis Res
34(10): 1345-1358.
Eibschitz-Tsimhoni, M., Friedman, T., Naor, J., Eibschita, N. and Friedman, Z.
(2000). "Early screening for amblyogenic risk factors lowers the prevalence
and severity of amblyopia." J AAPOS 4(4): 194-199.
Engel-Yeger, B. (2008). "Evaluation of gross motor abilities and self perception in
children with amblyopia." Disabil Rehabil 30(4): 243-248.
Eustis, S. and Smith, D. R. (1987). "Parental understanding of strabismus." J Ped
Ophthalmol Strab 24(5): 232-236.

References
195
Fielder, A. R. and Moseley, M. J. (1996). "Does stereopsis matter in humans?" Eye
10: 233-238.
Garzia, R., Borsting, E., Nicholson, S., Press, L., Scheiman, M. and Solan, H. (2006).
Optometric Clinical Practice Guideline: Care of the patient with learning
related vision problems. St Louis, MO, American Optometric Association.
Garzia, R. P. (1990). "A new visual-verbal saccade test: the developmental eye
movement test (DEM)." J Am Optom Assoc 61: 124-135.
Good, G., Weaver, J. and Augsburger, A. (1996). "Determination and application of
vision standards in industry." Am J Indust Med 30: 633-640.
Granleese, J. and Joseph, S. (1994). "Reliability of the Harter Self-Perception Prolfile
for Children and Predictors of Global Self-Worth." J Genetic Psychol 155(4):
487-492.
Grant, S., Melmoth, D., Morgan, M. and Finlay, A. (2007). "Prehension deficits in
amblyopia." Invest Ophthalmol Vis Sci 48(3): 1139-1148.
Harter, S. (1985). Manual for the self-perception profile for children: Revision of the
perceived competence scale for children. University of Denver.
Harter, S. (1988). Developmental processes in the construction of the self. Integrative
Processes and Socialization: Early to Middle Childhood. T. Yawkey and J.
Johnson. Hillsdale, NJ, L Erlbaum Associates: 45-78.
Harter, S. (1999). The construction of the self. New York, New York, The Guilford
Press.
Harter, S. and Pike, R. (1984). "The pictorial scale of perceived competence and
social acceptance for young children." Child Dev 55(6): 1969-1982.
Hartmann, E. E., Dobson, V., Hainline, L., Marsh-Tootle, W., Quinn, G. E., Ruttum,
M. S., Schmidt, P. P. and Simons, K. (2000). "Preschool Vision Screening:
Summary of a Task Force Report." Pediatrics 106(5): 1105-1116.

References
196
Hess, R. F. (2001). "Amblyopia: site unseen." Clin Exp Optom 84(6): 321-336.
Hiscox, F., Strong, N., Thompson, J. R., Minshull, C. and Woodruff, G. (1992).
"Occlusion for amblyopia: a comprehensive survey of outcome." Eye 6: 300-
304.
Holmes, J., Leske, D., Burke, J. and Hodge, D. (2003). "Birth prevalence of visually
significant infantile cataract." Ophthalmic Epidemiol 10: 67-74.
Holmes, J. M. and Clarke, M. P. (2006). "Amblyopia." Lancet 367: 1343-1351.
Horwood, J., Waylen, A., Herrick, D., Williams, C., Wolke, D. and Team, A. S.
(2005). "Common visual defects and peer victimization in children." Invest
Ophthalmol Vis Sci 46(4): 1177-1181.
Hrisos, S., Clarke, M., Anderson, J. D. and Wright, C. (2004). "Emotional Impact of
amblyopia treatment on preschool children." Ophthalmology 111: 1550-1556.
Hrisos, S., Clarke, M. and Wright, C. (2003). Visuo-motor skills in pre-school
children with a unilateral visual acuity deficit. AAPOS, Hawaii.
Hrisos, S., Clarke, M. P., Kelly, T., Henderson, J. and Wright, C. M. (2006).
"Unilateral visual impairment and neuro-developmental performance in pre-
school children." Br J Ophthalmol 90(7): 836-838.
Johns, H., Manny, R., Fern, K. and Hu, Y.-S. (2005). "The effect of strabismus on a
young child's selection of a playmate." Ophthal Physiol Opt 25(5): 400-407.
Jones, R. K. and Lee, D. N. (1981). "Why two eyes are better than one: the two
views on binocular vision." J Exp Psychol Hum Percept Perform 7(1): 30-40.
Joy, S., Davis, H. and Buckley, D. (2001). "Is stereopsis linked to hand-eye
coordination?" Br Orthoptic J 58: 38-41.
Kandel, G. L., Grattan, P. E. and Bedell, H. E. (1980). "Are the dominant eyes of
amblyopes normal?" Am J Optom Physiol Opt 57: 1-6.

References
197
Kapoula, Z., Bucci, M. P., Eggert, T. and Garraud, L. (1997). "Impairment of the
binocular coordination of saccades in strabismus." Vis Res 37(19): 2757-
2766.
Klaeger-Manzanell, C., Hoyt, C. S. and Good, W. V. (1994). "Two step recovery of
vision in the amblyopic eye after visual loss and enucleation of the fixing
eye." Br J Ophthalmol 78(6): 506-507.
Koklanis, K., Abel, L. and Aroni, R. (2006). "Psychosocial impact of amblyopia and
its treatment: a multidisciplinary study." Clin Exp Ophthalmol 34: 743-750.
Koklanis, K. and Georgievski, Z. (2007). "Patching treatment and bullying." Br J
Ophthalmol 91(1): 123-.
Koklanis, K., Georgievski, Z., Brassington, K. and Bretherton, L. (2006). "The
prevalence of specific reading disability in an amblyopic population. A
preliminary report." Binoc Vis Strab Quarterly 21(1): 27-32.
Konig, H.-H. and Barry, J.-C. (2004). "Cost effectiveness of treatment for
amblyopia: an analysis based on a probabilistic Markov model." Br J
Ophthalmol 88(5): 606-612.
Kulp, M. (1999). "Relationship between Visual Motor Integration Skill and
Academic Performance in Kindergarten through Third Grade." Optom Vis
Sci 76: 159-163.
Kulp, M. T. and Schmidt, P. P. (1997). "The relation of clinical saccadic eye
movement testing to reading in kindergarten and first graders." Optom Vis
Sci 74(1): 37-42.
Lack, D. (2005). "Comparison of the Developmental Eye Movement Test, the
Visagraph numbers test with a test of the english language arts." J Behav
Optom 16(3): 1-5.
Larter, S., Herse, P., Naduvilath, T. and Dain, S. (2004). "Spatial load factor in
prediction of reading performance." Ophthal Physiol Opt 24: 440-449.

References
198
Laws, D., Noonan, C., Ward, A. and Chandna, A. (2000). "Binocular fixation pattern
and visual acuity in children with strabismic amblyopia." J Ped Ophthalmol
Strab 37(1): 24-28.
Levi, D. M. (2006). "Visual processing in amblyopia: human studies." Strabismus
14(1): 11-19.
Levi, D. M., Song, S. and Pelli, D. S. (2007). "Amblyopic reading is crowded." J Vis
7(2): 1-17.
Lyon, D. W., Rainey, B. B. and Bullock, C. N. (2002). "The effects of glasses on the
self-concept of school-aged children." J Optom Vis Dev 33(1): 29-32.
Maples, W. C. (2003). "Visual factors that significantly impact academic
performance." Optometry 74(1): 35-49.
Marsh, H. and Holmes, I. (1990). "Multidimensional self-concepts: construct
validation of responses by children." Am Ed Res J 27: 89-117.
Marsh, H. W. and Hattie, J. (1996). Theoretical perspectives on the structure of self-
concept. Handbook of self-concept. B. A. Bracken. New York, Wiley: 38-90.
Mazyn, L., Lenoir, M., Montagne, G., Delaey, C. and Savelsbergh, G. (2007).
"Stereo vision enhances the learning of a catching skill." Exp Brain Res
179(4): 723-726.
McDowell, J., Dyckman, K., Austin, B. and Clementz, B. (2008). "Neurophysiology
and neuroanatomy of reflexive and volitional saccades: Evidence from
studies of humans." Brain Cog 68(3): 255-270.
McHale, K. and Cermak, S. A. (1992). "Fine motor activites in elementary school:
preliminary findings and provisional implications for children with fine motor
problems." Am J Occ Ther 46(10): 898-903.
McKee, S. P., Levi, D. M. and Movshon, J. A. (2003). "The pattern of visual deficits
in amblyopia." J Vis 3(5): 380-405.

References
199
Membreno, J. H., Brown, M. M., Brown, G. C., Sharma, S. and Beauchamp, G. R.
(2002). "A cost-utility analysis of therapy for amblyopia." Ophthalmology
109(12): 2265-2271.
Michaelides, M. and Moore, A. (2004). "The genetics of strabismus." J Med Genet
41: 641-646.
Mohan, K., Saroha, V. and Sharma, A. (2004). "Successful occlusion therapy for
amblyopia in 11- to 15-year-old children." J Ped Ophthalmol Strab 41(2): 89.
Moseley, M. J., Neufeld, M., McCarry, B., Charnock, A., McNamara, R., Rice, T.
and Fielder, A. R. (2002). "Remediation of refractive amblyopia by optical
correction alone." Ophthal Physiol Opt 22: 296-299.
Movshon, J., Eggers, H., Gizzi, M., Hendrickson, A., Kiorpes, L. and Boothe, R.
(1987). "Effects of early unilateral blur on the macque's visual system: III.
Physiological observations." J Neurosci 7(1340-1351).
Murdoch, J. R., McGhee, C. N. and Glover, V. (1991). "The relationship between
stereopsis and fine manual dexterity: pilot study of a new instrument." Eye 5:
642-643.
Nilsson, J. (2007). "The negative impact of amblyopia from a population perspective:
untreated amblyopia almost doubles the lifetime risk of bilateral vision
impairment." Br J Ophthalmol 91: 1417-1418.
Olitsky, S. E., Sudesh, S., Graziano, A., Hamblen, J., Brooks, S. E. and Shaha, S. H.
(1999). "The negative psychosocial impact of strabismus in adults." J
AAPOS 3(4): 209-211.
Packwood, E. A., Cruz, O. A., Rychwalski, P. J. and Keech, R. V. (1999). "The
psychosocial effects of amblyopia study." J AAPOS 3(1): 15-17.
Parkes, L. C. (2001). "An investigation of the impact of occlusion therapy on
children with amblyopia, its effect on their families, and compliance with
treatment." Br Orthoptic J 58: 30-37.

References
200
Pelli, D. G., Tillman, K. A., Freeman, J., Su, M., Berger, T. D. and Majaj, N. J.
(2007). "Crowding and eccentricity determine reading rate." J Vis 7(2): 1-36.
Pesudovs, K., Garamendi, E. and Elliott, D. B. (2006). "A Quality of Life
comparison of people wearing spectacles or contact lenses or having
undergone refractive surgery." J Refract Surg 22(1): 19-27.
Pike, M. G., Holmstrom, G., de Vries, L. S., Pennock, J. M., Drew, K. J., Sonksen, P.
M. and Dubowitz, L. M. (1994). "Patterns of visual impairment associated
with lesions of the preterm infant brain." Dev Med Child Neurol 36(10): 849-
862.
Queensland Studies Authority (2004). 2004 Queensland years 3, 5 and 7 tests in
aspects of literacy and numeracy: Test reporting handbook. PO Box 307,
Spring Hill QLD 4004.
Rahi, J., Cumberland, P. M. and Peckham, C. S. (2006). "Does amblyopia affect
educational, health and social outcomes? Findings from 1958 British birth
cohort." Br J Ophthalmol 332: 820-825.
Rahi, J. and Dezateux, C. (1999). "National cross sectional study of detection of
congenital and infantile cataract in the United Kingdom: role of childhood
screening and surveillance. The British Congenital Cataract Interest Group."
BMJ 318: 362-365.
Rahi, J. S. and Dezateux, C. (1997). "The future of preschool vision screening
services in Britain." BMJ 315(7118): 1247-1248.
Rahi, J. S., Logan, S., Timms, C., Russell-Eggitt, I. and Taylor, D. (2002). "Risk,
causes, and outcomes of visual impairment after loss of vision in the non-
amblyopic eye: a population-based study." Lancet 360(9333): 597-602.
Ratzon, N. Z., Dfraim, D. and Bart, O. (2007). "A short-term graphomotor program
for improving writing readiness skills of first-grade students." Am J Occ Ther
61(4): 399-405.

References
201
Richman, M. and Garzia, R. (1987). Developmental Eye Movement Test, Version 1,
Examiners Booklet.
Ritty, M., Solan, H. and Cool, S. (1993). "Visual and sensory-motor functioning in
the classroom: a preliminary report of ergonomic demands." J Am Optom
Assoc 64: 238-244.
Robaei, D., Huynh, S., Kifley, A. and Mitchell, P. (2006b). "Correctable and non-
correctable visual impairment in a population-based sample of 12-year-old
Australian children." Am J Ophthalmol 142: 112-118.
Robaei, D., Rose, K., Ojaimi, E., Kifley, A., Martin, F. and Mitchell, P. (2006a).
"Causes and associations of amblyopia in a population-based sample of 6-
year-old Australian children." Arch Ophthalmol 124(6): 878-884.
Rogers, G. L., Chazan, S. and Fellows, R. (1982). "Strabismus surgery and its effect
upon infant development in congenital esotropia." Ophthalmology 89(5):
479-483.
Rubin, G. S., Munoz, B., Bandeen-Roche, K. and West, S. K. (2000). "Monocular
versus Binocular Visual Acuity as Measures of Vision Impairment and
Predictors of Visual Disability." Invest Ophthalmol Vis Sci 41(11): 3327-
3334.
Ryan, T. P. (1997). Modern Regression Methods. New York, John Wiley & Sons,
Inc.
Sacre, L. and Masterson, J. (2001). Single Word Spelling Test (SWST). London,
NFER-Nelson.
Satterfield, D., Keltner, J. L. and Morrison, T. L. (1993). "Psychosocial aspects of
strabismus study." Arch Ophthalmol 111(Aug): 1100-1105.
Scheiman, M., Gallaway, M., Coulter, R., Reinstein, R., Ciner, E., Herzberg, C. and
Parisi, M. (1996). "Prevalence of vision and ocular disease conditions in a
clinical pediatric population." J Am Optom Assoc 67: 193-202.

References
202
Scheiman, M. and Rouse, M. (2006). Optometric Management of Learning-Related
Vision Problems. St Louis, Missourie, Mosby, Elsevier.
Scheiman, M. and Wick, B. (1994). Clinical Management of Binocular Vision.
Philadelphia, J.B. Lippincott Company.
Searle, A., Vedhara, K., Norman, P., Frost, A. and Harrad, R. (2000). "Compliance
with eye patching in children and its psychosocial effects: A qualitative
application of protection motivation theory." Psychology, Health & Medicine
5(1): 43-55.
Shankar, S., Evans, M. A. and Bobier, W. (2007). "Hyperopia and emergent literacy
of young children: pilot study." Optom Vis Sci 84(11): 1031-1038.
Siderov, J. (2001). Suppression: clinical characteristics, assessment and treatment.
Binoc Vis Orthopt. B. E. a. S. Doshi. Oxford, Butterworth Heinemann: 58-
64.
Simmers, A., Ledgeway, T. and Hess, R. (2005). "The influences of visibility and
anomalous integration processes on the perception of global spatial form
versus motion in human amblyopia." Vis Res 45(4): 449-460.
Simmers, A. J., Ledgeway, T., Hess, R. F. and McGraw, P. (2003). "Deficits to
global motion processing in human amblypia." Vis Res 43: 729-738.
Simons, K. (2005). "Amblyopia Characterization, Treatment, and Prophylaxis." Surv
Ophthalmol 50(2): 123-166.
Simons, K. A., Gotzler, K. C. and Vitale, S. (1997). "Penalization versus part-time
occlusion an binocular outcome in treatment of strabismic amblyopia."
Ophthalmology 104: 2156-2160.
Simons, K. A. and Preslan, M. (1999). "Natural history of amblyopia untreated
owing to lack of compliance." Br J Ophthalmol 83: 582-587.
Skoczenski, A. and Norcia, A. (2002). "Late maturation of visual hyperacuity."
Psych Sci 13(6): 537-541.

References
203
Smith, K. H., Baker, D. B., Keech, R. V., Adams, L. W., Rosa, R. H., Austin, C. J.
and Austin, K. M. (1991). "Monocular congenital cataracts: psychological
effects of treatment." J Ped Ophthalmol Strab 28(5): 245-249.
Snowden, S. K. and Stewart-Brown, S. L. (1997a). Preschool Vision Screening.
Health Technology Assessment, NHS R&D HTA Program. 1: 1-85.
Snowden, S. K. and Stewart-Brown, S. L. (1997b). Amblyopia and disability: a
qualitative study. Health Services Research Unit, University of Oxford.
Starr, M. S. and Rayner, K. (2001). "Eye movements during reading: some current
controversies." Trends in Cognitive Sciences 5(4): 156-163.
Stewart-Brown, S. L. and Snowden, S. K. (1998). "Evidence-based dilemmas in pre-
school vision screening." Arch Dis Child 78(5): 406-407.
Stewart, C. E., Fielder, A. R., Stephens, D. A., Moseley, M. J. and MOTAS, C.
(2005). "Treatment of Unilateral Amblyopia: Factors influencing visual
outcome." Invest Ophthalmol Vis Sci 46(9): 3152-3160.
Stewart, C. E., Moseley, M. J., Fielder, A. R., Stephens, D. A. and MOTAS, C.
(2004a). "Refractive adaptation in amblyopia: quantification of effect and
implications for practice." Br J Ophthalmol 88(12): 1552-1556.
Stewart, C. E., Moseley, M. J., Stephens, D. A. and Fielder, A. R. (2004b).
"Treatment Dose-Response in Amblyopia Therapy: The Monitored Occlusion
Treatment of Amblyopia Study (MOTAS)." Invest Ophthalmol Vis Sci 45(9):
3048-3054.
Stewart, C. E., Stephens, D. A., Fielder, A. R., Moseley, M. J. and ROTAS
Cooperative (2007). "Objectively monitored patching regimens for treatment
of amblyopia: randomised trial." BMJ 335(7622): 707-.
Stifter, E., Burggasser, G., Hirmann, E., Thaler, A. and Radner, W. (2005).
"Monocular and binocular reading performance in children with
microstrabismic amblyopia." Br J Ophthalmol 89: 1324-1329.

References
204
Tassinari, J. T. and De Land, P. N. (2005). "Developmental Eye Movement Test:
reliability and symptomatology." Optometry 76(7): 387-399.
Terry, R. and Brady, C. (1976). "Effects of framed spectacles and contact lenses on
self-rating of facial attractiveness." Percept Mot Skills 42(789-90).
Terry, R., Soni, P. and Horner, D. (1997). "Spectacles, contact lenses and children's
self-concepts: a longitudinal study." Optom Vis Sci 74(12): 1044-8.
The Pediatric Eye Disease Investigator Group (2002a). "A randomized trial of
atropine vs patching for treatment of moderate amblyopia in children." Arch
Ophthalmol 120(March): 268-277.
The Pediatric Eye Disease Investigator Group (2002b). "The clinical profile of
moderate amblyopia in children younger than 7 years." Arch Ophthalmol
120(March): 281-287.
The Pediatric Eye Disease Investigator Group (2003a). "Impact of patching and
atropine treatment on the child and family in the amblyopia treatment study."
Arch Ophthalmol 121(Nov): 1625-1632.
The Pediatric Eye Disease Investigator Group (2003b). "A randomized trial of
prescribed patching regimens for treatment of severe amblyopia in children."
Ophthalmology 110: 2075-2087.
The Pediatric Eye Disease Investigator Group (2003c). "A comparison of atropine
and patching treatments for moderate amblyopia by patient age, cause of
amblyopia, depth of amblyopia and other factors." Ophthalmology 110:
1632-1638.
The Pediatric Eye Disease Investigator Group (2003d). "The course of moderate
amblyopia treated with patching in children: experience of the amblyopia
treatment study." Am J Ophthalmol 136(4): 620-629.

References
205
The Pediatric Eye Disease Investigator Group (2004). "A prospective, pilot study of
treatment of amblyopia in children 10 to <18 years old." Am J Ophthalmol
137(3): 581-583.
The Pediatric Eye Disease Investigator Group (2005a). "A randomized pilot study of
near activities versus non-near activities during patching therapy for
amblyopia." J AAPOS 9: 129-136.
The Pediatric Eye Disease Investigator Group (2005b). "Randomized trial of
treatment of amblyopia in children aged 7 to 17 years." Arch Ophthalmol
123: 437-447.
The Pediatric Eye Disease Investigator Group (2006). "Treatment of anisometropic
amblyopia in children with refractive correction." Ophthalmology 113(6):
895-903.
The Pediatric Eye Disease Investigator Group (2008a). "A randomized trial of near
versus distance activities while patching for amblyopia in children aged 3 to
less than 7 years." Ophthalmology 115(11): 2071-2078.
The Pediatric Eye Disease Investigator Group (2008b). "Patching vs atropine to treat
amblyopia in children aged 7 to 12 years: a randomized trial." Arch
Ophthalmol 126(12): 1634-42.
The Pediatric Eye Disease Investigator Group, Holmes, J. M., Beck, R. W., Repka,
M. X., Leske, D. A., Kraker, R. T., Blair, C., Moke, P. S., Birch, E. E.,
Saunders, R. A., Hertle, R. W., Quinn, G. E., Simons, K. A. and Miller, J. M.
(2001). "The Amblyopia Treatment Study Visual Acuity Testing Protocol."
Arch Ophthalmol 119(Sep): 1345-1353.
The Pediatric Eye Disease Investigator Group, Repka, M. X., Beck, R. W., Holmes,
J. M. and Birch, E. E. (2003). "A randomized trial of patching regimens for
treatment of moderate amblyopia in children." Arch Ophthalmol 121(5): 603-
612.
References
206
Thompson, J. R., Woodruff, G., Hiscox, F., Strong, N. and Minshull, C. (1991). "The
incidence and prevalence of amblyopia detected in childhood." Public Health
105: 455-462.
Tolchin, J. G. and Lederman, M. E. (1977). "Congenital (infantile) esotropia:
psychiatric aspects." J Ped Ophthalmol Strab 15(3): 160-163.
Tychsen, L. (1992). Binocular Vision. Adler's Physiology of the Eye. W. Hart. St.
Louis, Mosby: chap. 24.
Uretmen, O., Egrilmez, S., Kose, S., Pamukcu, K., Akkin, C. and Palamar, M.
(2003). "Negative social bias against children with strabismus." Acta
Ophthalmol Scand 81(2): 138-142.
Uusitalo, R. J., Brans, T., Pessi, T. and Tarkkanen, A. (1999). "Evaluating cataract
surgery gains by assessing patients' quality of life using the VF-7." J Cataract
Refract Surg 25(7): 989-994.
van de Graaf, E. S., van der Sterre, G. W., Polling, J. R., van Kempen, H., Simonsz,
B. and Simonsz, H. J. (2004). "Amblyopia & Strabismus Questionnaire:
design and initial validation." Strabismus 12(3): 181-193.
van Hof-Van Duin, J., Evenhuis-van Leunen, A., Mohn, G., Baerts, W. and Fetter,
W. P. (1989). "Effects of very low birth weight (VLBW) on visual
development during the first year after term." Early Human Dev 20(3-4):
255-266.
van Leeuwen, R., Eijkemans, M. J. C., Vingerling, J. R., Hofman, A., de Jong, P. T.
V. M. and Simonsz, H. J. (2007). "Risk of bilateral visual impairment in
individuals with amblyopia: the Rotterdam study." Br J Ophthalmol 91(11):
1450-1451.
Vincent, D., Crumpler, M. and East London Assessment Group (1997). Reading
Progress Tests (RPT) Stage 1 and Stage 2. London, Hodder and Stoughton
Educational Division.

References
207
Von Noorden, G. K. (1996). Binocular Vision and Ocular Motility: theory and
management of strabismus - 5th edition. St Louis, Missouri, Mosby - Year
Book, Inc.
Wallline, J., Sinnott, L., Johnson, E., Ticak, A., Jones, S. and Jones, L. (2008).
"What do kids think about kids in eyeglasses? ." Ophthal Physiol Opt 28(3):
218-224.
Webber, A. L. (2007). "Amblyopia treatment: an evidence-based approach to
maximising treatment outcome." Clin Exp Optom 90(4): 250-257.
Webber, A. L., Wood, J. M., Gole, G. A. and Brown, B. (2008a). "The effect of
amblyopia on fine motor skills in children." Invest Ophthalmol Vis Sci 49(2):
594-603.
Webber, A. L., Wood, J. M., Gole, G. A. and Brown, B. (2008b). "The effect of
amblyopia on self-esteem in children." Optom Vis Sci 85: 1074-1081.
Webber, A. L., Wood, J. M., Gole, G. A. and Brown, B. (2009). "The effect of
amblyopia on the Developmental Eye Movement test in children." Optom Vis
Sci 86(6): 760-766.
Westheimer, G. (2004). "Center-surround antagonism in spatial vision: retinal or
cortical locus?" Vis Res 44(21): 2457-2465.
Williams, C. and Harrad, R. A. (2006). "Amblyopia: Contemporary Clinical Issues."
Strabismus 14: 43-50.
Williams, C., Harrad, R. A., Sparrow, J. M., Harvey, I., Golding, J., Lee, J., Adams,
G., Sloper, J., McIntyre, A., Fielder, A. R., Aylward, G. W., Rahi, J. and
Dezateux, C. (1998). "Future of preschool vision screening." BMJ 316(7135):
937a-.
Williams, C., Northstone, K., Harrad, R., Sparrow, J. M., Harvey, I. and Team, A. S.
(2002). "Amblyopia treatment outcomes after screening before or at 3 years:
follow up from randomised trial." BMJ 324(7353): 1549.

References
208
Williams, C., Northstone, K., Harrad, R. A., Sparrow, J. M. and Harvey, I. (2003).
"Amblyopia treatment outcomes after preschool screening v school entry
screening: observational data from a prospective cohort study. (Extended
Report)." Br J Ophthalmol 87(8): 988-994.
Williams, C., Northstone, K., Howard, M., Harvey, I., Harrad, R. A. and Sparrow, J.
M. (2008). "Prevalence and risk factors for common vision problems in
children: data from the ALSPAC study." Br J Ophthalmol 92(7): 959-964.