Embed Size (px)
Citation preview
MAY 2013 REPORT CARD OF COMMUNITY HEALTH INDICATORS
Growing Wellness Anne Arundel County Department of Health
Laura Neuman County Executive
Dr. Jinlene Chan Acting Health Officer

I am pleased to present the Anne Arundel County Department of Health’s 16th annual Report Card of Community Health Indicators. This report offers a comprehensive snapshot of our County’s health status and identifies how our County is doing in relation to Healthy People 2020, a set of national health goals for all Americans. The Department uses this report to track its progress toward achieving these goals and other health priorities for our County. The Department of Health works in a complex public health environment to support County residents in receiving physical, dental, behavioral, environmental and educational health services. In these challenging economic times and with a changing health care landscape, the services the Department provides are vital. The Department will serve as a leader and resource in the implementation of health care reform. The future of public health in our County will require collaborative partnerships and strong initiatives that promote healthy lifestyles and provide high quality personal and environmental health services. The Department spearheaded the establishment of the Healthy Anne Arundel Coalition in 2011 to help strengthen public-private partnerships to improve the County’s health. The Coalition’s vision is “Healthy County, Healthy People.” I would like to thank Department of Health staff, our partner organizations and concerned individuals throughout the County for their commitment and service to promote the health and wellness of County residents. Together, we can grow wellness in Anne Arundel County. Respectfully, Laura Neuman County Executive
County Executive’s Message
The proverb “cultivate the garden within” is appropriate to the work of the Department of Health and the County residents we serve. The Department’s vision is a vibrant County in which healthy people reside in healthy communities. Over the years, the Department has cultivated strong partnerships with government agencies, medical providers, educational institutions, community and faith-based groups, businesses, and individuals. The accomplishments of our Department depend on the relationships we cultivate and grow with our partners and the people we serve. This report highlights the accomplishments we have made toward Healthy People 2020 goals in several areas, including diabetes mortality, infant mortality and colorectal cancer screening. The report also identifies areas for improvement. Mental health and substance abuse are of concern locally and nationwide. This year’s report features data on opioid overdoses and adolescent suicide deaths and attempts. The report also shows that the County needs to improve in the areas of adult cigarette smoking, low weight births and mammography screening. Our ongoing efforts to address health disparities, whether related to income, education, race, ethnicity or geography, will remain an area of focus. I encourage all County residents to cultivate your gardens within by improving your personal health and wellness. Visit the Department’s website, www.aahealth.org, for recipes to promote good nutrition, tips for physical activity to get you moving, information about vaccines to prevent illness, preventive health services to help stay healthy, and other health information to help individuals and families lead healthier lives. Through the efforts of the Department of Health, our partners and County residents, we can grow a healthier County with healthier people. Warm regards, Jinlene Chan, M.D., M.P.H. Acting Health Officer
Health Officer’s Message
Demographics
Demographics 2
Selected Health Indicators
Healthy People 2020 3
Leading Causes of Death 5
Mortality Trends 6
Cancer Incidence 9
Cancer Mortality 10
Infant Health Indicators 11
Infant Mortality 12
Risk Factors and Health Care Coverage
Overweight and Obesity 14
Tobacco Use 15
Preventive Health Screening 16
Health Care Insurance 17
Communicable Diseases
General Disease Reporting 18
Selected Health Topics
Hispanic/Latino Health 19
Opioid Overdose 21
Adolescent Suicide 22
Pediatric Obesity 23
Contact Information
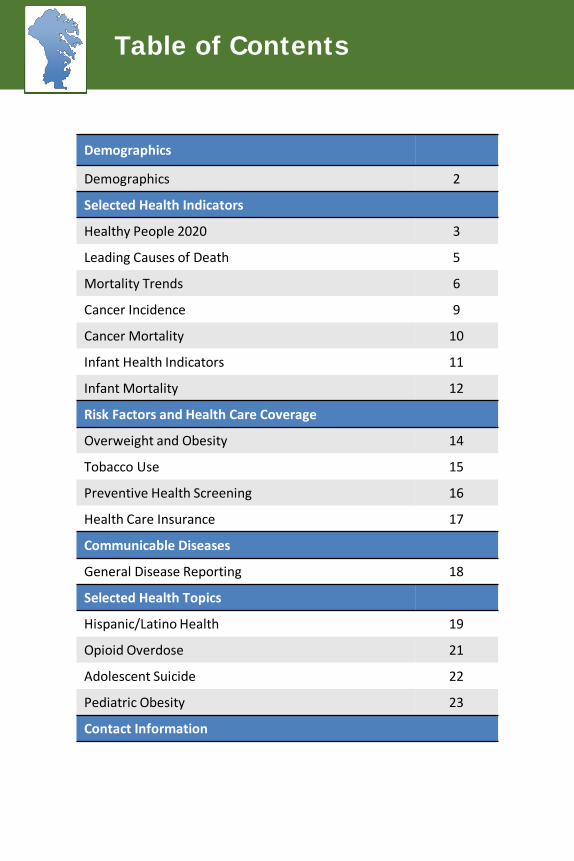
Table of Contents

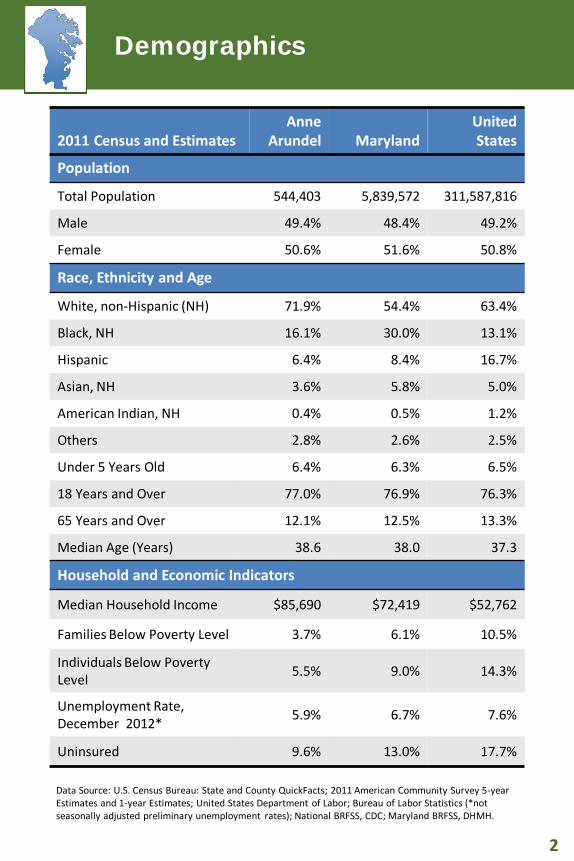
2011 Census and Estimates Anne
Arundel Maryland United States
Population
Total Population 544,403 5,839,572 311,587,816
Male 49.4% 48.4% 49.2%
Female 50.6% 51.6% 50.8%
Race, Ethnicity and Age
White, non-Hispanic (NH) 71.9% 54.4% 63.4%
Black, NH 16.1% 30.0% 13.1%
Hispanic 6.4% 8.4% 16.7%
Asian, NH 3.6% 5.8% 5.0%
American Indian, NH 0.4% 0.5% 1.2%
Others 2.8% 2.6% 2.5%
Under 5 Years Old 6.4% 6.3% 6.5%
18 Years and Over 77.0% 76.9% 76.3%
65 Years and Over 12.1% 12.5% 13.3%
Median Age (Years) 38.6 38.0 37.3
Household and Economic Indicators
Median Household Income $85,690 $72,419 $52,762
Families Below Poverty Level 3.7% 6.1% 10.5%
Individuals Below Poverty Level 5.5% 9.0% 14.3%
Unemployment Rate, December 2012* 5.9% 6.7% 7.6%
Uninsured 9.6% 13.0% 17.7%
Data Source: U.S. Census Bureau: State and County QuickFacts; 2011 American Community Survey 5-year Estimates and 1-year Estimates; United States Department of Labor; Bureau of Labor Statistics (*not seasonally adjusted preliminary unemployment rates); National BRFSS, CDC; Maryland BRFSS, DHMH.
Demographics
Indicator Anne Arundel
(as of 2011) National
2020 Goal
Met National
2020 Goal
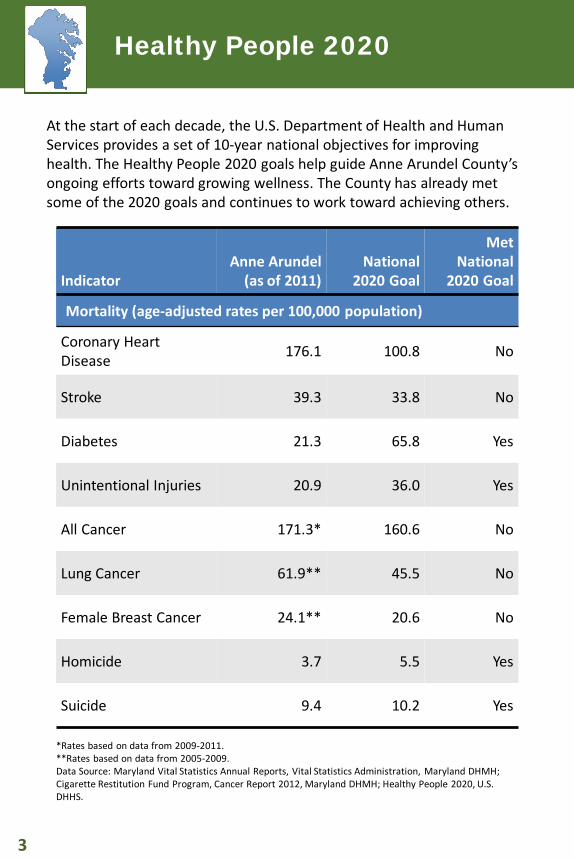
Mortality (age-adjusted rates per 100,000 population)
Coronary Heart Disease 176.1 100.8 No
Stroke 39.3 33.8 No
Diabetes 21.3 65.8 Yes
Unintentional Injuries 20.9 36.0 Yes
All Cancer 171.3* 160.6 No
Lung Cancer 61.9** 45.5 No
Female Breast Cancer 24.1** 20.6 No
Homicide 3.7 5.5 Yes
Suicide 9.4 10.2 Yes
*Rates based on data from 2009-2011. **Rates based on data from 2005-2009. Data Source: Maryland Vital Statistics Annual Reports, Vital Statistics Administration, Maryland DHMH; Cigarette Restitution Fund Program, Cancer Report 2012, Maryland DHMH; Healthy People 2020, U.S. DHHS.
At the start of each decade, the U.S. Department of Health and Human Services provides a set of 10-year national objectives for improving health. The Healthy People 2020 goals help guide Anne Arundel County’s ongoing efforts toward growing wellness. The County has already met some of the 2020 goals and continues to work toward achieving others.
Healthy People 2020
Indicator Anne Arundel
(as of 2011) National
2020 Goal
Met National
2020 Goal
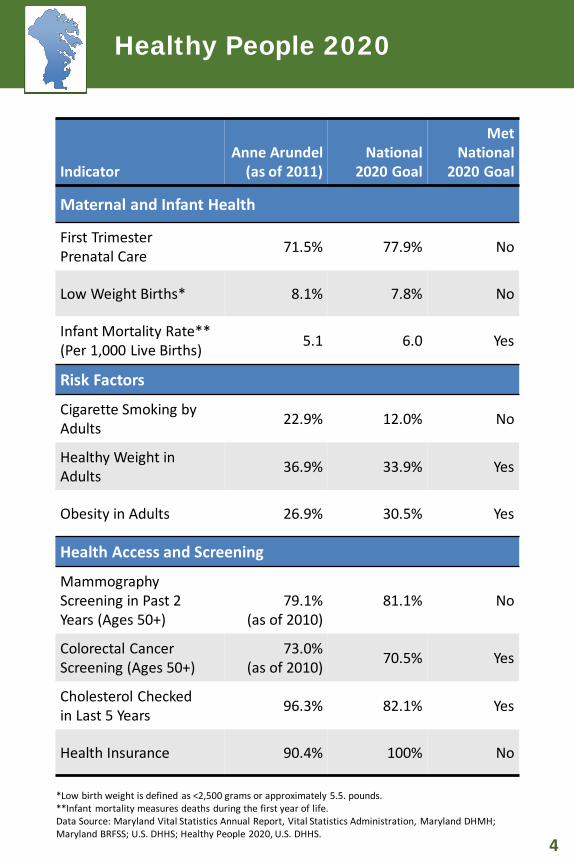
Maternal and Infant Health
First Trimester Prenatal Care 71.5% 77.9% No
Low Weight Births* 8.1% 7.8% No
Infant Mortality Rate** (Per 1,000 Live Births) 5.1 6.0 Yes
Risk Factors
Cigarette Smoking by Adults 22.9% 12.0% No
Healthy Weight in Adults 36.9% 33.9% Yes
Obesity in Adults 26.9% 30.5% Yes
Health Access and Screening
Mammography Screening in Past 2 Years (Ages 50+)
79.1%
(as of 2010) 81.1% No
Colorectal Cancer Screening (Ages 50+)
73.0% (as of 2010) 70.5% Yes
Cholesterol Checked in Last 5 Years 96.3% 82.1% Yes
Health Insurance 90.4% 100% No
*Low birth weight is defined as <2,500 grams or approximately 5.5. pounds. **Infant mortality measures deaths during the first year of life. Data Source: Maryland Vital Statistics Annual Report, Vital Statistics Administration, Maryland DHMH; Maryland BRFSS; U.S. DHHS; Healthy People 2020, U.S. DHHS.
Healthy People 2020
*Chronic lower respiratory diseases (CLRD) include both chronic obstructive pulmonary disease (COPD) and asthma. Data Source: Maryland Vital Statistics Annual Report, Vital Statistics Administration, Maryland DHMH.
49
70
70
105
125
128
195
213
883
921
0 200 400 600 800 1000
Suicide
Alzheimer's
Septicemia
Influenza and Pneumonia
Diabetes
Unintentional Injuries
Stroke
CLRD*
Heart Disease
Cancer
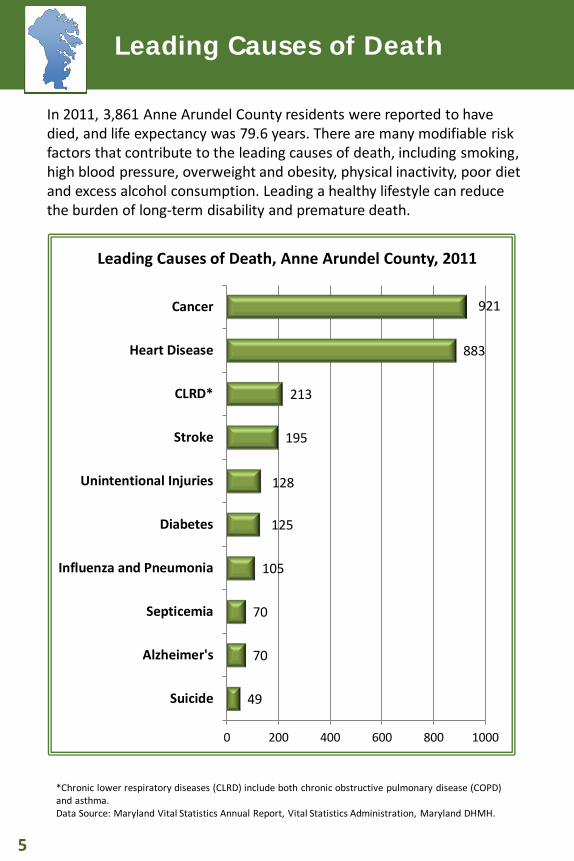
Leading Causes of Death, Anne Arundel County, 2011
In 2011, 3,861 Anne Arundel County residents were reported to have died, and life expectancy was 79.6 years. There are many modifiable risk factors that contribute to the leading causes of death, including smoking, high blood pressure, overweight and obesity, physical inactivity, poor diet and excess alcohol consumption. Leading a healthy lifestyle can reduce the burden of long-term disability and premature death.
Leading Causes of Death
Data Source: Maryland Vital Statistics Annual Reports, Vital Statistics Administration, Maryland DHMH.
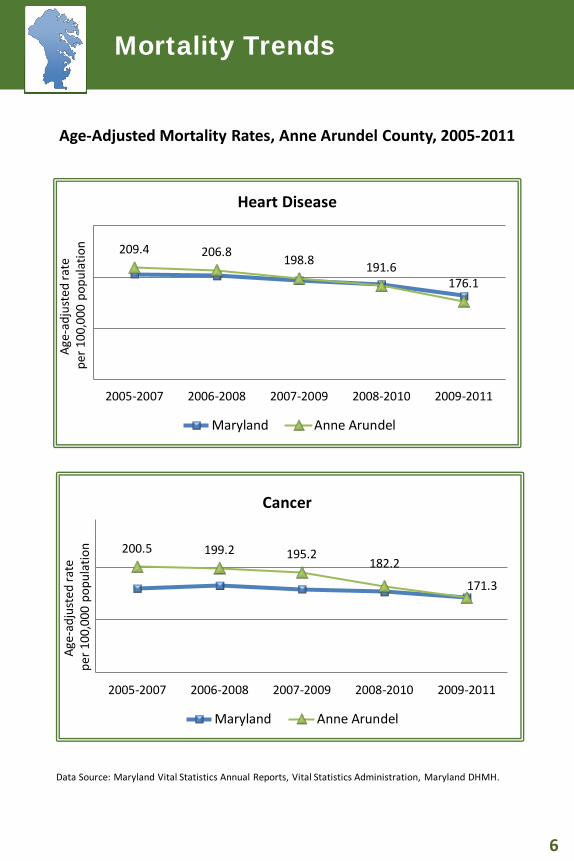
Age-Adjusted Mortality Rates, Anne Arundel County, 2005-2011
209.4 206.8 198.8 191.6 176.1
2005-2007 2006-2008 2007-2009 2008-2010 2009-2011
Maryland Anne Arundel
Age-
adju
sted
rate
pe
r 100
,000
pop
ulat
ion
200.5 199.2 195.2 182.2
171.3
2005-2007 2006-2008 2007-2009 2008-2010 2009-2011
Maryland Anne Arundel
Age-
adju
sted
rate
pe
r 100
,000
pop
ulat
ion
Cancer
Heart Disease
Mortality Trends
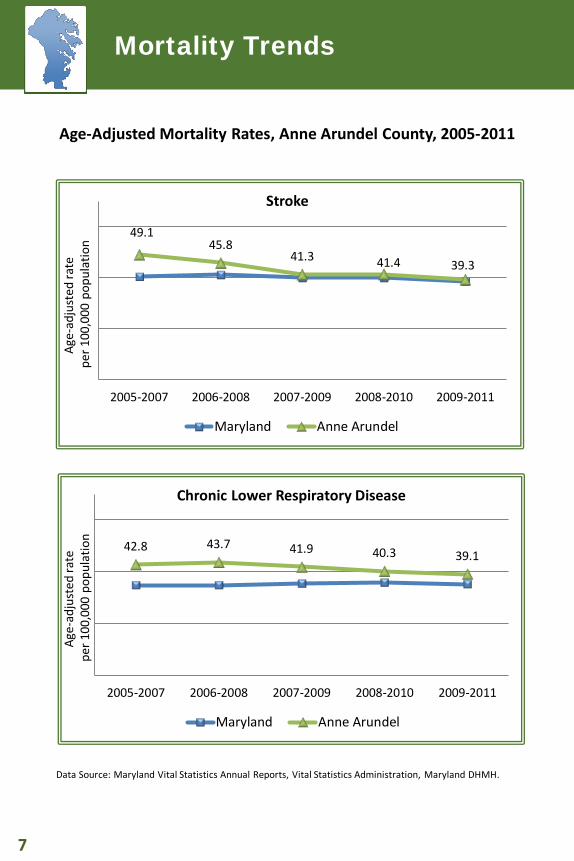
Age-Adjusted Mortality Rates, Anne Arundel County, 2005-2011
42.8 43.7 41.9 40.3 39.1
2005-2007 2006-2008 2007-2009 2008-2010 2009-2011
Maryland Anne Arundel
Age-
adju
sted
rate
pe
r 100
,000
pop
ulat
ion
Chronic Lower Respiratory Disease
49.1 45.8
41.3 41.4 39.3
2005-2007 2006-2008 2007-2009 2008-2010 2009-2011
Maryland Anne Arundel
Age-
adju
sted
rate
pe
r 100
,000
pop
ulat
ion
Stroke
Data Source: Maryland Vital Statistics Annual Reports, Vital Statistics Administration, Maryland DHMH.
Mortality Trends
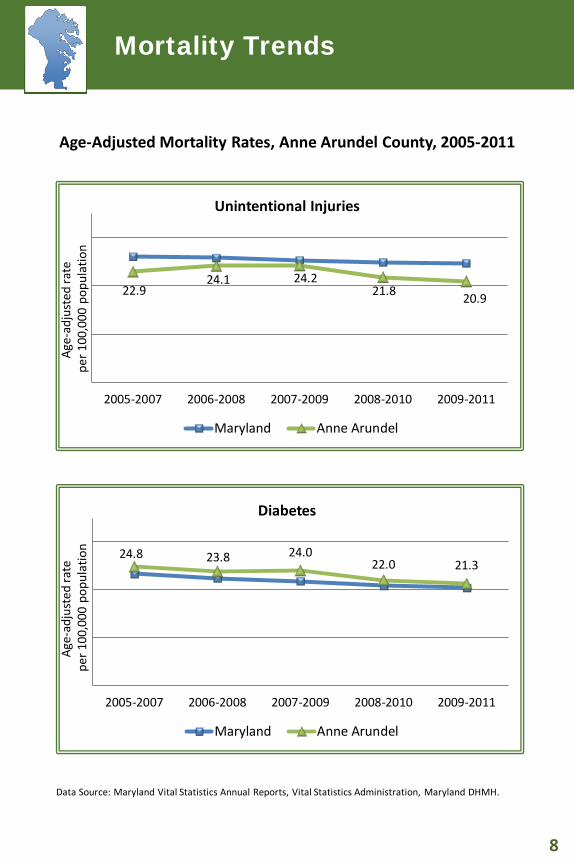
Age-Adjusted Mortality Rates, Anne Arundel County, 2005-2011
22.9 24.1 24.2
21.8 20.9
2005-2007 2006-2008 2007-2009 2008-2010 2009-2011
Maryland Anne Arundel
Age-
adju
sted
rate
pe
r 100
,000
pop
ulat
ion
Unintentional Injuries
24.8 23.8 24.0 22.0 21.3
2005-2007 2006-2008 2007-2009 2008-2010 2009-2011
Maryland Anne Arundel
Age-
adju
sted
rate
pe
r 100
,000
pop
ulat
ion
Diabetes
Data Source: Maryland Vital Statistics Annual Reports, Vital Statistics Administration, Maryland DHMH.
Mortality Trends
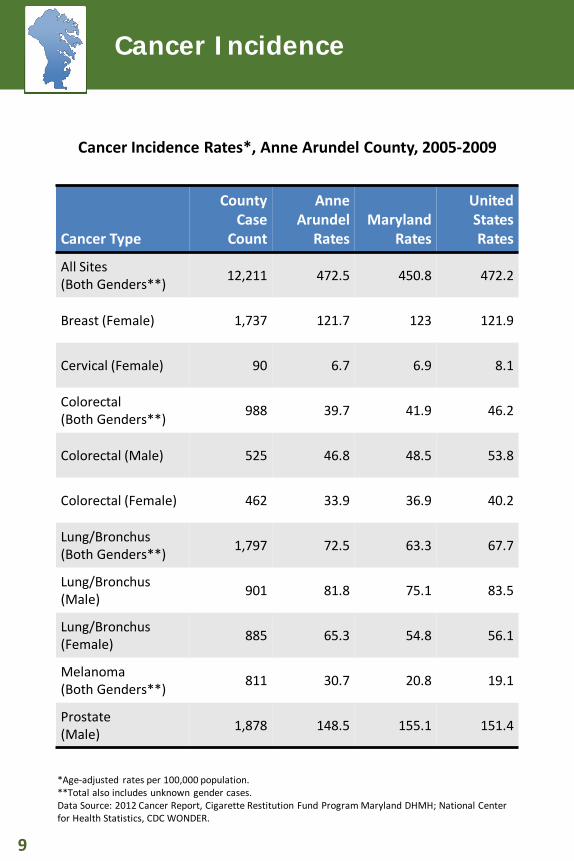
Cancer Type
County Case
Count
Anne Arundel
Rates Maryland
Rates
United States Rates
All Sites (Both Genders**) 12,211 472.5 450.8 472.2
Breast (Female) 1,737 121.7 123 121.9
Cervical (Female) 90 6.7 6.9 8.1
Colorectal (Both Genders**) 988 39.7 41.9 46.2
Colorectal (Male) 525 46.8 48.5 53.8
Colorectal (Female) 462 33.9 36.9 40.2
Lung/Bronchus (Both Genders**) 1,797 72.5 63.3 67.7
Lung/Bronchus (Male) 901 81.8 75.1 83.5
Lung/Bronchus (Female) 885 65.3 54.8 56.1
Melanoma (Both Genders**) 811 30.7 20.8 19.1
Prostate (Male) 1,878 148.5 155.1 151.4
*Age-adjusted rates per 100,000 population. **Total also includes unknown gender cases. Data Source: 2012 Cancer Report, Cigarette Restitution Fund Program Maryland DHMH; National Center for Health Statistics, CDC WONDER.
Cancer Incidence Rates*, Anne Arundel County, 2005-2009
Cancer Incidence
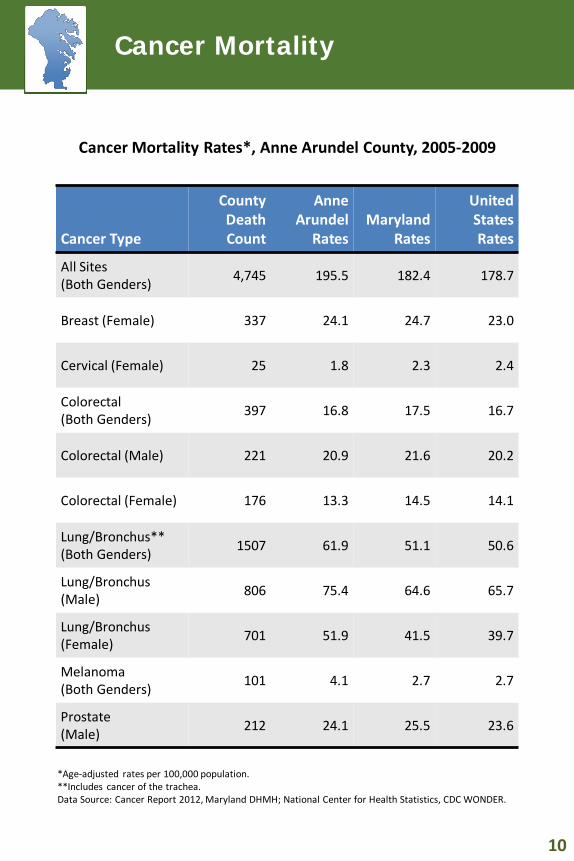
*Age-adjusted rates per 100,000 population. **Includes cancer of the trachea. Data Source: Cancer Report 2012, Maryland DHMH; National Center for Health Statistics, CDC WONDER.
Cancer Mortality Rates*, Anne Arundel County, 2005-2009
Cancer Type
County Death Count
Anne Arundel
Rates Maryland
Rates
United States Rates
All Sites (Both Genders) 4,745 195.5 182.4 178.7
Breast (Female) 337 24.1 24.7 23.0
Cervical (Female) 25 1.8 2.3 2.4
Colorectal (Both Genders) 397 16.8 17.5 16.7
Colorectal (Male) 221 20.9 21.6 20.2
Colorectal (Female) 176 13.3 14.5 14.1
Lung/Bronchus** (Both Genders) 1507 61.9 51.1 50.6
Lung/Bronchus (Male) 806 75.4 64.6 65.7
Lung/Bronchus (Female) 701 51.9 41.5 39.7
Melanoma (Both Genders) 101 4.1 2.7 2.7
Prostate (Male) 212 24.1 25.5 23.6
Cancer Mortality
2007 2008 2009 2010 2011
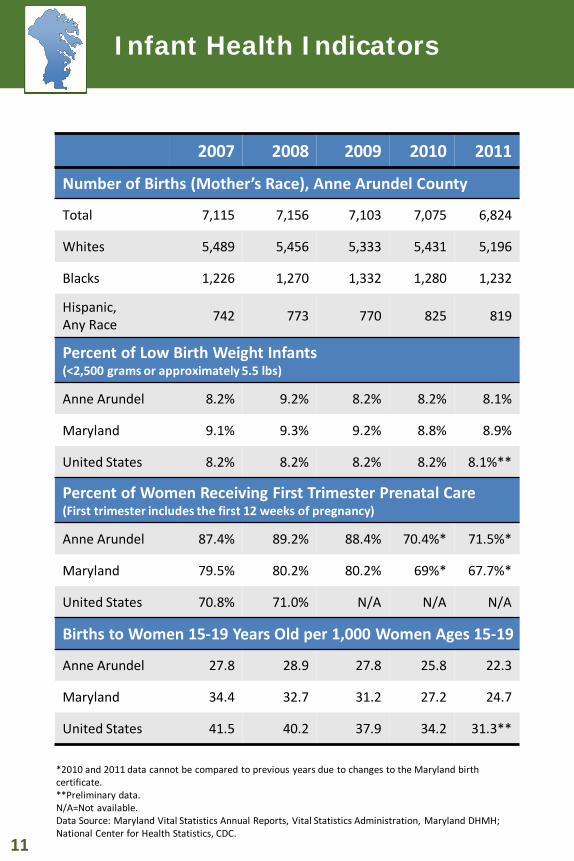
Number of Births (Mother’s Race), Anne Arundel County
Total 7,115 7,156 7,103 7,075 6,824
Whites 5,489 5,456 5,333 5,431 5,196
Blacks 1,226 1,270 1,332 1,280 1,232
Hispanic, Any Race 742 773 770 825 819
Percent of Low Birth Weight Infants (<2,500 grams or approximately 5.5 lbs)
Anne Arundel 8.2% 9.2% 8.2% 8.2% 8.1%
Maryland 9.1% 9.3% 9.2% 8.8% 8.9%
United States 8.2% 8.2% 8.2% 8.2% 8.1%**
Percent of Women Receiving First Trimester Prenatal Care (First trimester includes the first 12 weeks of pregnancy)
Anne Arundel 87.4% 89.2% 88.4% 70.4%* 71.5%*
Maryland 79.5% 80.2% 80.2% 69%* 67.7%*
United States 70.8% 71.0% N/A N/A N/A
Births to Women 15-19 Years Old per 1,000 Women Ages 15-19
Anne Arundel 27.8 28.9 27.8 25.8 22.3
Maryland 34.4 32.7 31.2 27.2 24.7
United States 41.5 40.2 37.9 34.2 31.3**
*2010 and 2011 data cannot be compared to previous years due to changes to the Maryland birth certificate. **Preliminary data. N/A=Not available. Data Source: Maryland Vital Statistics Annual Reports, Vital Statistics Administration, Maryland DHMH; National Center for Health Statistics, CDC.
Infant Health Indicators
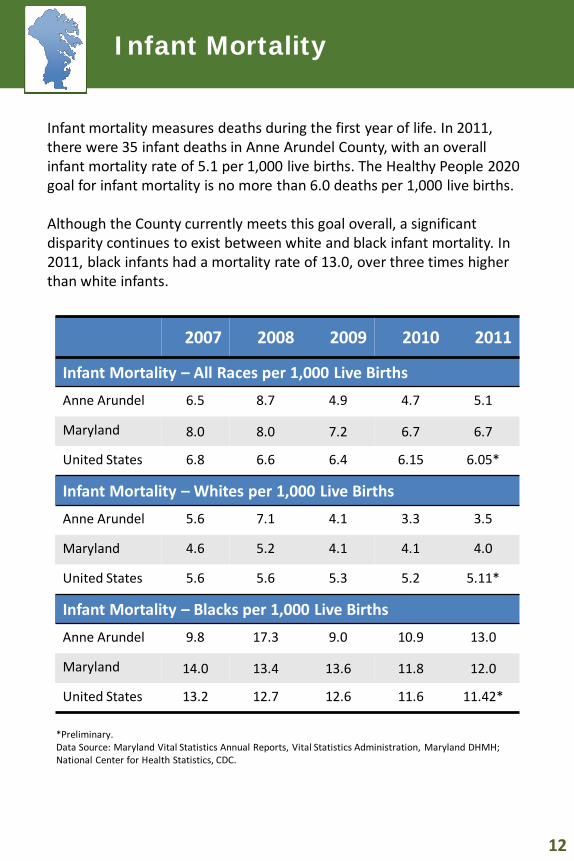
*Preliminary. Data Source: Maryland Vital Statistics Annual Reports, Vital Statistics Administration, Maryland DHMH; National Center for Health Statistics, CDC.
2007 2008 2009 2010 2011
Infant Mortality – All Races per 1,000 Live Births Anne Arundel 6.5 8.7 4.9 4.7 5.1
Maryland 8.0 8.0 7.2 6.7 6.7
United States 6.8 6.6 6.4 6.15 6.05*
Infant Mortality – Whites per 1,000 Live Births Anne Arundel 5.6 7.1 4.1 3.3 3.5
Maryland 4.6 5.2 4.1 4.1 4.0
United States 5.6 5.6 5.3 5.2 5.11*
Infant Mortality – Blacks per 1,000 Live Births Anne Arundel 9.8 17.3 9.0 10.9 13.0
Maryland 14.0 13.4 13.6 11.8 12.0
United States 13.2 12.7 12.6 11.6 11.42*
Infant mortality measures deaths during the first year of life. In 2011, there were 35 infant deaths in Anne Arundel County, with an overall infant mortality rate of 5.1 per 1,000 live births. The Healthy People 2020 goal for infant mortality is no more than 6.0 deaths per 1,000 live births. Although the County currently meets this goal overall, a significant disparity continues to exist between white and black infant mortality. In 2011, black infants had a mortality rate of 13.0, over three times higher than white infants.
Infant Mortality
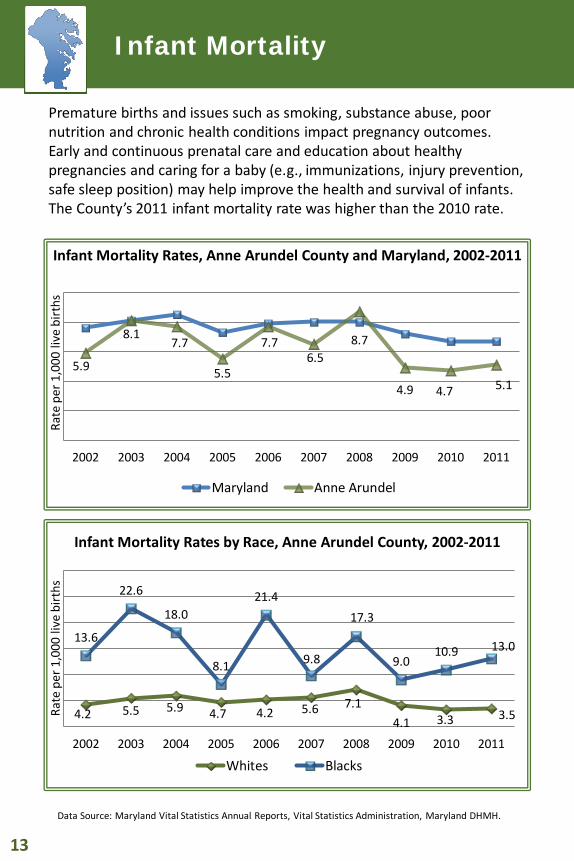
Data Source: Maryland Vital Statistics Annual Reports, Vital Statistics Administration, Maryland DHMH.
5.9
8.1 7.7
5.5
7.7 6.5
8.7
4.9 4.7 5.1
2002 2003 2004 2005 2006 2007 2008 2009 2010 2011
Maryland Anne Arundel
Rate
per
1,0
00 li
ve b
irths
Infant Mortality Rates, Anne Arundel County and Maryland, 2002-2011
4.2 5.5 5.9 4.7 4.2 5.6 7.1 4.1 3.3 3.5
13.6
22.6
18.0
8.1
21.4
9.8
17.3
9.0 10.9 13.0
2002 2003 2004 2005 2006 2007 2008 2009 2010 2011
Whites Blacks
Rate
per
1,0
00 li
ve b
irths
Infant Mortality Rates by Race, Anne Arundel County, 2002-2011
Premature births and issues such as smoking, substance abuse, poor nutrition and chronic health conditions impact pregnancy outcomes. Early and continuous prenatal care and education about healthy pregnancies and caring for a baby (e.g., immunizations, injury prevention, safe sleep position) may help improve the health and survival of infants. The County’s 2011 infant mortality rate was higher than the 2010 rate.
Infant Mortality
*BMI is measured as weight (pounds) multiplied by 703 divided by height (inches) squared. **2011 data cannot be compared with previous years’ data due to changes in data collection methodology. Data Source: National BRFSS, CDC; Maryland BRFSS.
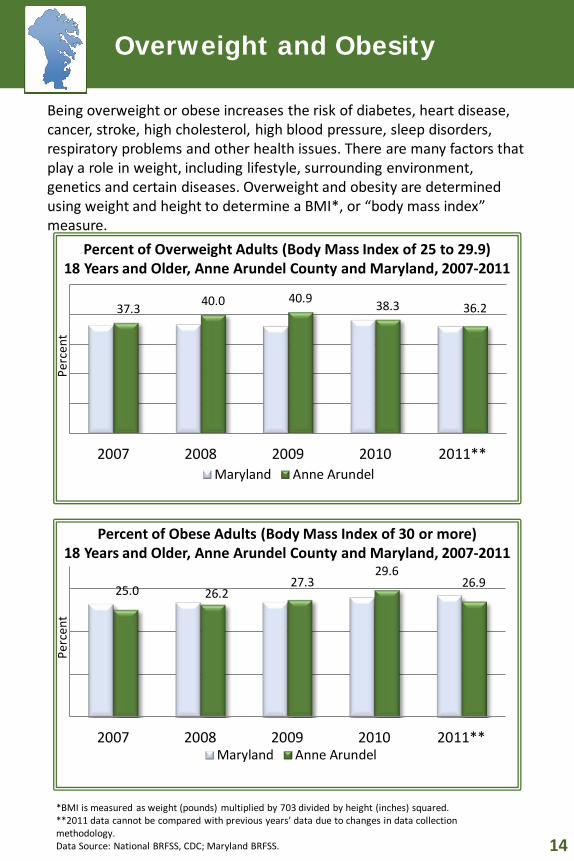
Being overweight or obese increases the risk of diabetes, heart disease, cancer, stroke, high cholesterol, high blood pressure, sleep disorders, respiratory problems and other health issues. There are many factors that play a role in weight, including lifestyle, surrounding environment, genetics and certain diseases. Overweight and obesity are determined using weight and height to determine a BMI*, or “body mass index” measure.
37.3 40.0 40.9 38.3 36.2
2007 2008 2009 2010 2011**Maryland Anne Arundel
Perc
ent
25.0 26.2 27.3
29.6 26.9
2007 2008 2009 2010 2011**Maryland Anne Arundel
Perc
ent
Percent of Obese Adults (Body Mass Index of 30 or more) 18 Years and Older, Anne Arundel County and Maryland, 2007-2011
Percent of Overweight Adults (Body Mass Index of 25 to 29.9) 18 Years and Older, Anne Arundel County and Maryland, 2007-2011
Overweight and Obesity
*2011 data cannot be compared with previous years’ data due to changes in data collection methodology. Data Source: National BRFSS, CDC; Maryland BRFSS.
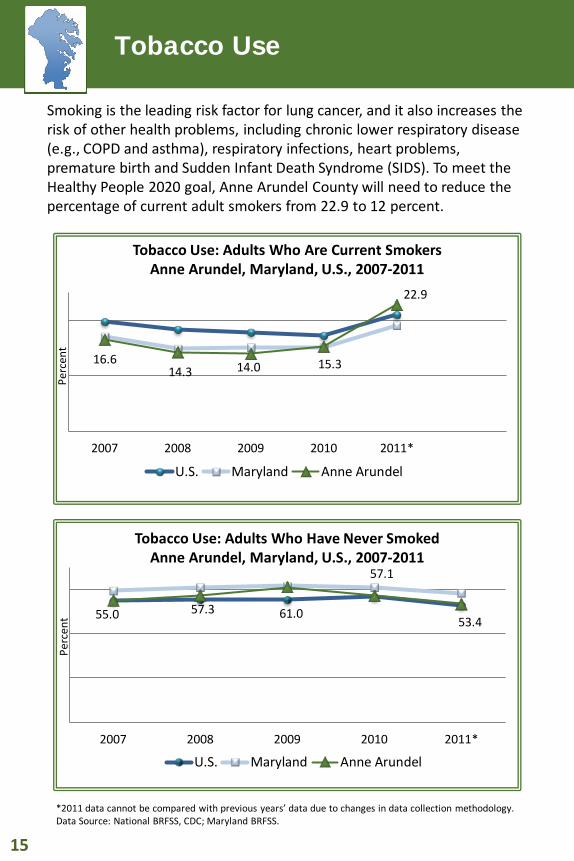
Smoking is the leading risk factor for lung cancer, and it also increases the risk of other health problems, including chronic lower respiratory disease (e.g., COPD and asthma), respiratory infections, heart problems, premature birth and Sudden Infant Death Syndrome (SIDS). To meet the Healthy People 2020 goal, Anne Arundel County will need to reduce the percentage of current adult smokers from 22.9 to 12 percent.
16.6 14.3 14.0 15.3
22.9
2007 2008 2009 2010 2011*
U.S. Maryland Anne Arundel
Tobacco Use: Adults Who Are Current Smokers Anne Arundel, Maryland, U.S., 2007-2011
55.0 57.3 61.0
57.1
53.4
2007 2008 2009 2010 2011*
U.S. Maryland Anne Arundel
Tobacco Use: Adults Who Have Never Smoked Anne Arundel, Maryland, U.S., 2007-2011
Perc
ent
Tobacco Use Pe
rcen
t
Data Source: National BRFSS, CDC; American Cancer Society.
67.3 72.7 76.4
73.0
2004 2006 2008 2010
U.S. Maryland Anne Arundel
Perc
ent
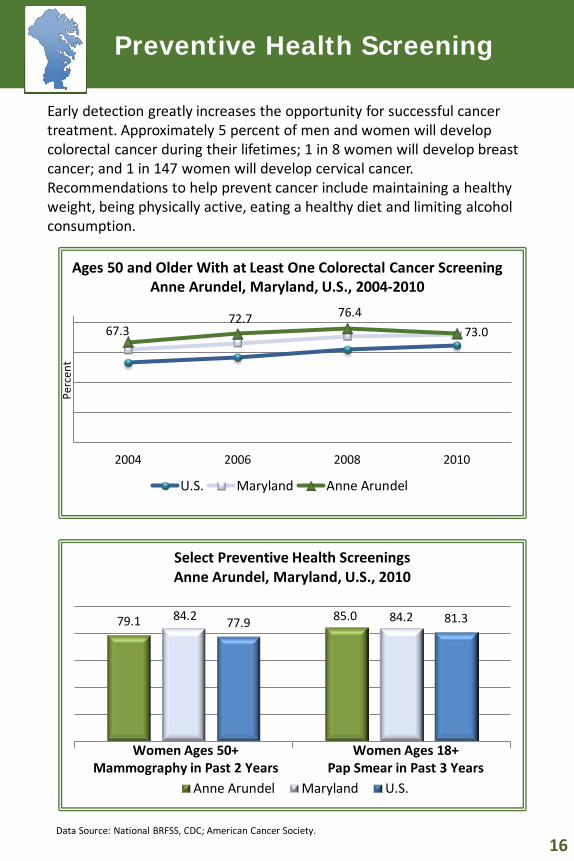
Ages 50 and Older With at Least One Colorectal Cancer Screening Anne Arundel, Maryland, U.S., 2004-2010
Perc
ent
79.1 85.0 84.2 84.2 77.9 81.3
Select Preventive Health Screenings Anne Arundel, Maryland, U.S., 2010
Anne Arundel Maryland U.S.
Women Ages 50+ Mammography in Past 2 Years
Women Ages 18+ Pap Smear in Past 3 Years
Early detection greatly increases the opportunity for successful cancer treatment. Approximately 5 percent of men and women will develop colorectal cancer during their lifetimes; 1 in 8 women will develop breast cancer; and 1 in 147 women will develop cervical cancer. Recommendations to help prevent cancer include maintaining a healthy weight, being physically active, eating a healthy diet and limiting alcohol consumption.
Preventive Health Screening
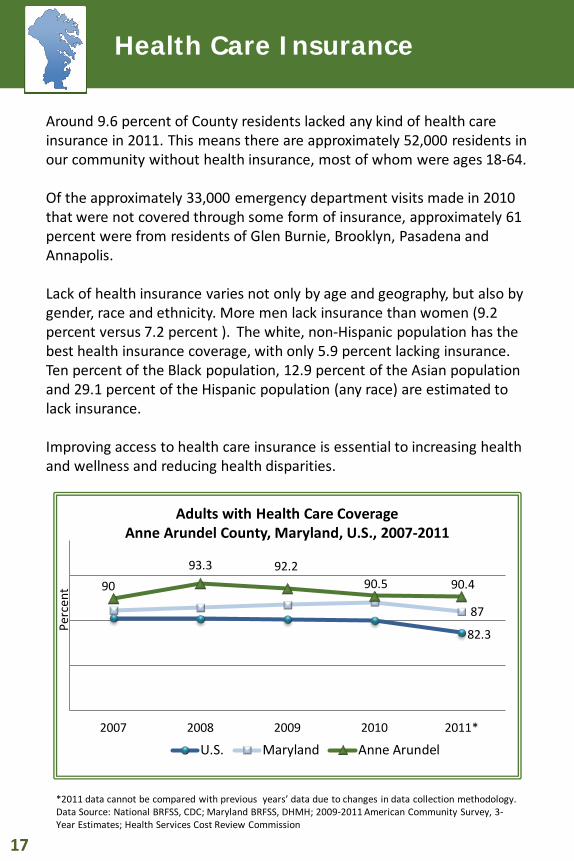
*2011 data cannot be compared with previous years’ data due to changes in data collection methodology. Data Source: National BRFSS, CDC; Maryland BRFSS, DHMH; 2009-2011 American Community Survey, 3-Year Estimates; Health Services Cost Review Commission
82.3
87
90 93.3 92.2
90.5 90.4
2007 2008 2009 2010 2011*
U.S. Maryland Anne Arundel
Perc
ent
Adults with Health Care Coverage Anne Arundel County, Maryland, U.S., 2007-2011
Around 9.6 percent of County residents lacked any kind of health care insurance in 2011. This means there are approximately 52,000 residents in our community without health insurance, most of whom were ages 18-64. Of the approximately 33,000 emergency department visits made in 2010 that were not covered through some form of insurance, approximately 61 percent were from residents of Glen Burnie, Brooklyn, Pasadena and Annapolis. Lack of health insurance varies not only by age and geography, but also by gender, race and ethnicity. More men lack insurance than women (9.2 percent versus 7.2 percent ). The white, non-Hispanic population has the best health insurance coverage, with only 5.9 percent lacking insurance. Ten percent of the Black population, 12.9 percent of the Asian population and 29.1 percent of the Hispanic population (any race) are estimated to lack insurance.
Improving access to health care insurance is essential to increasing health and wellness and reducing health disparities.
Health Care Insurance
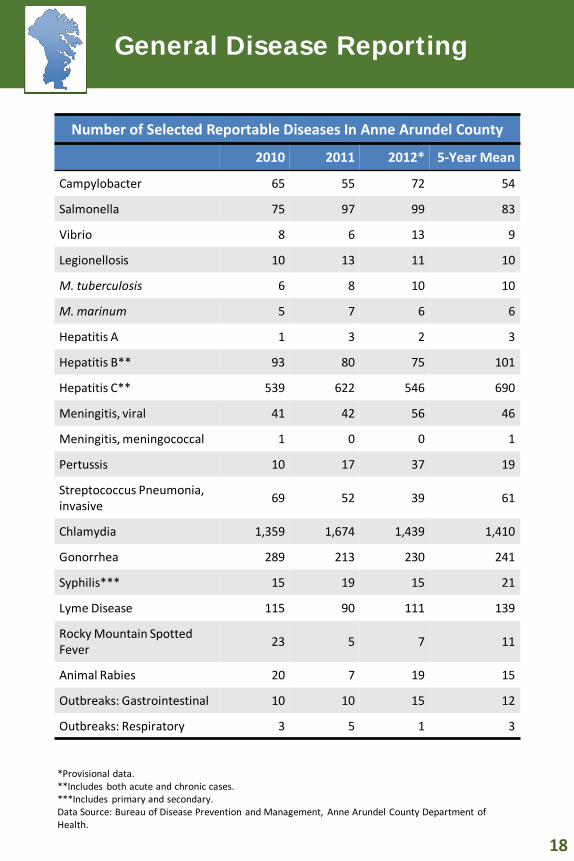
Number of Selected Reportable Diseases In Anne Arundel County
2010 2011 2012* 5-Year Mean
Campylobacter 65 55 72 54
Salmonella 75 97 99 83
Vibrio 8 6 13 9
Legionellosis 10 13 11 10
M. tuberculosis 6 8 10 10
M. marinum 5 7 6 6
Hepatitis A 1 3 2 3
Hepatitis B** 93 80 75 101
Hepatitis C** 539 622 546 690
Meningitis, viral 41 42 56 46
Meningitis, meningococcal 1 0 0 1
Pertussis 10 17 37 19
Streptococcus Pneumonia, invasive 69 52 39 61
Chlamydia 1,359 1,674 1,439 1,410
Gonorrhea 289 213 230 241
Syphilis*** 15 19 15 21
Lyme Disease 115 90 111 139
Rocky Mountain Spotted Fever 23 5 7 11
Animal Rabies 20 7 19 15
Outbreaks: Gastrointestinal 10 10 15 12
Outbreaks: Respiratory 3 5 1 3
*Provisional data. **Includes both acute and chronic cases. ***Includes primary and secondary. Data Source: Bureau of Disease Prevention and Management, Anne Arundel County Department of Health.
General Disease Reporting
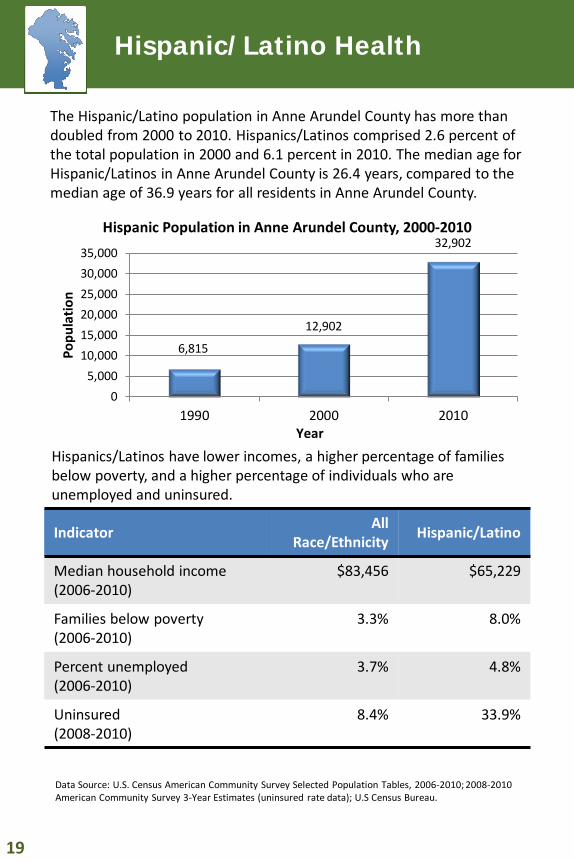
The Hispanic/Latino population in Anne Arundel County has more than doubled from 2000 to 2010. Hispanics/Latinos comprised 2.6 percent of the total population in 2000 and 6.1 percent in 2010. The median age for Hispanic/Latinos in Anne Arundel County is 26.4 years, compared to the median age of 36.9 years for all residents in Anne Arundel County.
Data Source: U.S. Census American Community Survey Selected Population Tables, 2006-2010; 2008-2010 American Community Survey 3-Year Estimates (uninsured rate data); U.S Census Bureau.
Hispanics/Latinos have lower incomes, a higher percentage of families below poverty, and a higher percentage of individuals who are unemployed and uninsured.
6,815
12,902
32,902
05,000
10,00015,00020,00025,00030,00035,000
1990 2000 2010
Popu
latio
n
Year
Hispanic Population in Anne Arundel County, 2000-2010
Indicator All Race/Ethnicity Hispanic/Latino
Median household income (2006-2010)
$83,456 $65,229
Families below poverty (2006-2010)
3.3% 8.0%
Percent unemployed (2006-2010)
3.7% 4.8%
Uninsured (2008-2010)
8.4% 33.9%
Hispanic/Latino Health
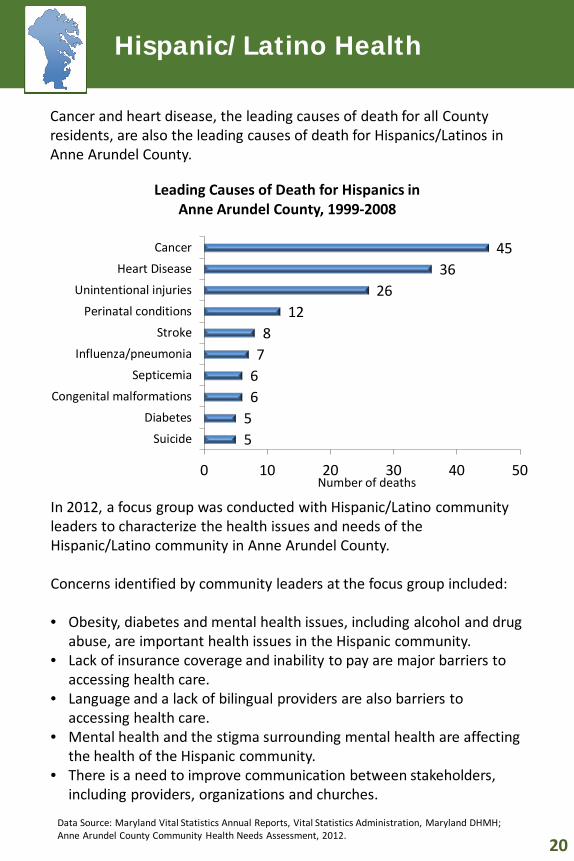
Cancer and heart disease, the leading causes of death for all County residents, are also the leading causes of death for Hispanics/Latinos in Anne Arundel County.
Data Source: Maryland Vital Statistics Annual Reports, Vital Statistics Administration, Maryland DHMH; Anne Arundel County Community Health Needs Assessment, 2012.
5 5 6 6 7 8
12 26
36 45
0 10 20 30 40 50
Suicide
Diabetes
Congenital malformations
Septicemia
Influenza/pneumonia
Stroke
Perinatal conditions
Unintentional injuries
Heart Disease
Cancer
Number of deaths
Leading Causes of Death for Hispanics in Anne Arundel County, 1999-2008
In 2012, a focus group was conducted with Hispanic/Latino community leaders to characterize the health issues and needs of the Hispanic/Latino community in Anne Arundel County. Concerns identified by community leaders at the focus group included: • Obesity, diabetes and mental health issues, including alcohol and drug
abuse, are important health issues in the Hispanic community. • Lack of insurance coverage and inability to pay are major barriers to
accessing health care. • Language and a lack of bilingual providers are also barriers to
accessing health care. • Mental health and the stigma surrounding mental health are affecting
the health of the Hispanic community. • There is a need to improve communication between stakeholders,
including providers, organizations and churches.
Hispanic/Latino Health
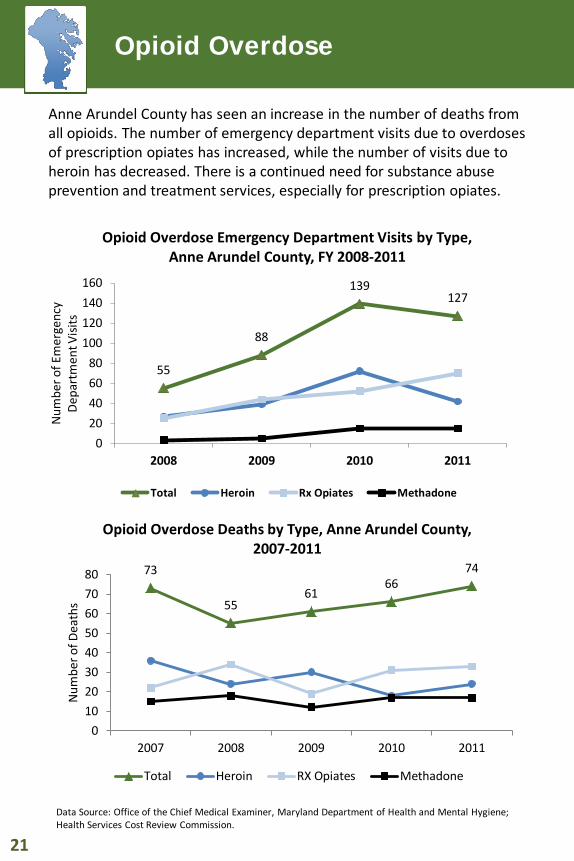
Anne Arundel County has seen an increase in the number of deaths from all opioids. The number of emergency department visits due to overdoses of prescription opiates has increased, while the number of visits due to heroin has decreased. There is a continued need for substance abuse prevention and treatment services, especially for prescription opiates.
Data Source: Office of the Chief Medical Examiner, Maryland Department of Health and Mental Hygiene; Health Services Cost Review Commission.
73
55 61
66 74
01020304050607080
2007 2008 2009 2010 2011
Num
ber o
f Dea
ths
Opioid Overdose Deaths by Type, Anne Arundel County, 2007-2011
Total Heroin RX Opiates Methadone
55
88
139 127
020406080
100120140160
2008 2009 2010 2011
Num
ber o
f Em
erge
ncy
Depa
rtm
ent V
isits
Opioid Overdose Emergency Department Visits by Type, Anne Arundel County, FY 2008-2011
Total Heroin Rx Opiates Methadone
Opioid Overdose
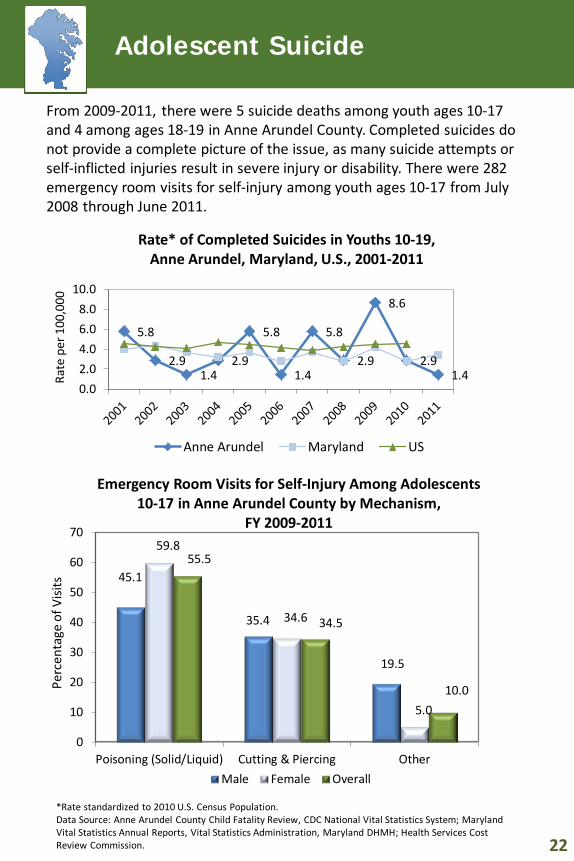
From 2009-2011, there were 5 suicide deaths among youth ages 10-17 and 4 among ages 18-19 in Anne Arundel County. Completed suicides do not provide a complete picture of the issue, as many suicide attempts or self-inflicted injuries result in severe injury or disability. There were 282 emergency room visits for self-injury among youth ages 10-17 from July 2008 through June 2011.
45.1
35.4
19.5
59.8
34.6
5.0
55.5
34.5
10.0
0
10
20
30
40
50
60
70
Poisoning (Solid/Liquid) Cutting & Piercing Other
Perc
enta
ge o
f Visi
ts
Emergency Room Visits for Self-Injury Among Adolescents 10-17 in Anne Arundel County by Mechanism,
FY 2009-2011
Male Female Overall
*Rate standardized to 2010 U.S. Census Population. Data Source: Anne Arundel County Child Fatality Review, CDC National Vital Statistics System; Maryland Vital Statistics Annual Reports, Vital Statistics Administration, Maryland DHMH; Health Services Cost Review Commission.
5.8
2.9 1.4
2.9
5.8
1.4
5.8
2.9
8.6
2.9 1.4
0.02.04.06.08.0
10.0
Rate
per
100
,000
Rate* of Completed Suicides in Youths 10-19, Anne Arundel, Maryland, U.S., 2001-2011
Anne Arundel Maryland US
Adolescent Suicide
Data Source: Anne Arundel County Department of Health Provider-based Survey of Children and Adolescents, 2012.
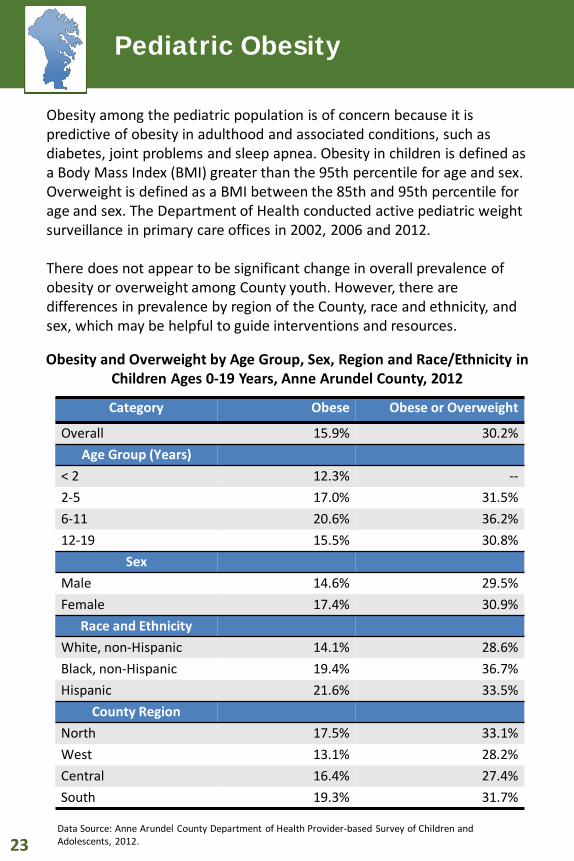
Obesity among the pediatric population is of concern because it is predictive of obesity in adulthood and associated conditions, such as diabetes, joint problems and sleep apnea. Obesity in children is defined as a Body Mass Index (BMI) greater than the 95th percentile for age and sex. Overweight is defined as a BMI between the 85th and 95th percentile for age and sex. The Department of Health conducted active pediatric weight surveillance in primary care offices in 2002, 2006 and 2012. There does not appear to be significant change in overall prevalence of obesity or overweight among County youth. However, there are differences in prevalence by region of the County, race and ethnicity, and sex, which may be helpful to guide interventions and resources.
Category Obese Obese or Overweight
Overall 15.9% 30.2% Age Group (Years)
< 2 12.3% -- 2-5 17.0% 31.5% 6-11 20.6% 36.2% 12-19 15.5% 30.8%
Sex Male 14.6% 29.5% Female 17.4% 30.9%
Race and Ethnicity White, non-Hispanic 14.1% 28.6% Black, non-Hispanic 19.4% 36.7% Hispanic 21.6% 33.5%
County Region North 17.5% 33.1% West 13.1% 28.2% Central 16.4% 27.4% South 19.3% 31.7%
Obesity and Overweight by Age Group, Sex, Region and Race/Ethnicity in Children Ages 0-19 Years, Anne Arundel County, 2012
Pediatric Obesity
Data Source: Ogden CL, Carroll MD, Kit BK, Flegal KM. “Prevalence of Obesity and Trends in Body Mass Index Among U.S. Children and Adolescents, 1999-2010.” JAMA. 2012;307(5); Anne Arundel County Pediatric Weight Survey, 2012.
Pediatric Obesity
048
121620
AACo 2002 AACo 2006 AACo 2012 U.S. 2009-2010
Perc
enta
ge
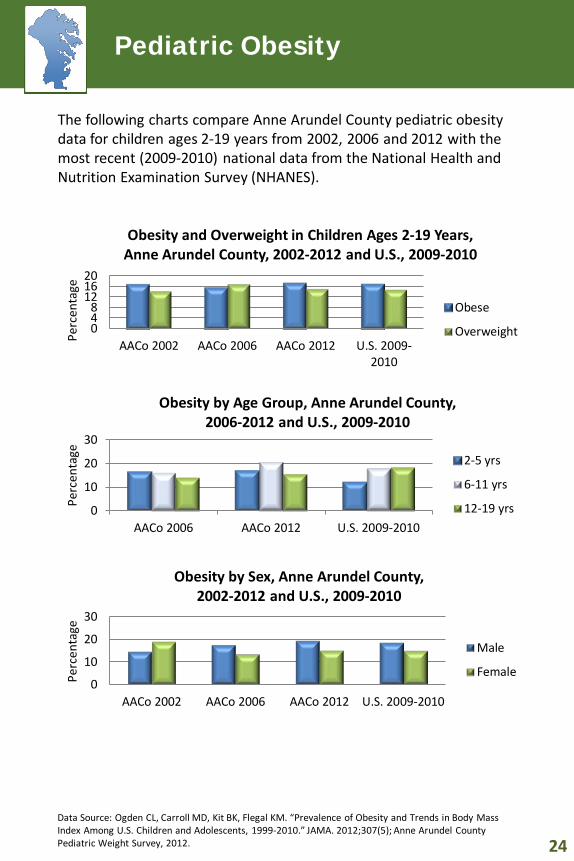
Obesity and Overweight in Children Ages 2-19 Years, Anne Arundel County, 2002-2012 and U.S., 2009-2010
Obese
Overweight
0
10
20
30
AACo 2006 AACo 2012 U.S. 2009-2010
Perc
enta
ge
Obesity by Age Group, Anne Arundel County, 2006-2012 and U.S., 2009-2010
2-5 yrs
6-11 yrs
12-19 yrs
0
10
20
30
AACo 2002 AACo 2006 AACo 2012 U.S. 2009-2010
Perc
enta
ge
Obesity by Sex, Anne Arundel County, 2002-2012 and U.S., 2009-2010
Male
Female
The following charts compare Anne Arundel County pediatric obesity data for children ages 2-19 years from 2002, 2006 and 2012 with the most recent (2009-2010) national data from the National Health and Nutrition Examination Survey (NHANES).
Compiled in 2013 by: Bikash Singh, M.P.H. Epidemiologist Technical and editorial assistance provided by: Jinlene Chan, M.D., M.P.H. Charles Dowd Laurie Fetterman, M.S.W. Elin Jones, M.S. Sara Luell Special thanks to the following individuals for their contributions to this report: Jason Bernhard, M.D. Brandon Johnson, M.H.S. Aisha Rivera Margarin, M.D., M.S. Sandra O’Neill, M.S. Donna Perkins, M.P.H. Tammy Servies, M.D. Jameson Voss, M.D.
Anne Arundel County Department of Health Office of Assessment, Planning & Response 3 Harry S. Truman Parkway, HD17 Annapolis, MD 21401 410-222-7280 www.aahealth.org
The services and facilities of the Anne Arundel County Department of Health are available to all regardless of race, color, religion, political affiliation, national origin, age, sex, sexual orientation or disability.
Contact Information