Embed Size (px)
Citation preview
Anne Arundel County
Transit Accessibility Analysis
and Map Consolidation
Iryna Bondarenko, Jennifer Hopkins, James Hull, David Lipscomb, Abidemi Olafusi
under the supervision of Professor Chao Liu
URSP688L: Planning Technologies
The University of Maryland – College Park
Fall, 2016
PALS - Partnership for Action Learning in Sustainability
An initiative of the National Center for Smart Growth
Gerrit Knaap, NCSG Executive Director
Uri Avin, PALS Director
1
Contents
Executive Summary 2
Background 3
Research Questions 3
Analysis Approach 4
Final Deliverables 4
Overview of Results 5
Online Transit Web Application 7
Map Interpretation 8
Transit Buffers Analysis 20
Recommendations 22
Limitations of the Analysis 22
Further Research 23
Task Coordination 23
Works Cited 24
Appendix 25
2
Executive Summary
Currently, Anne Arundel County has multiple state and local transit systems that serve its
residents, but no single resource that provides information on all of them. The team has been
tasked with creating a consolidated transit map, assessing transit accessibility, and making
recommendations for improving transit access.
Anne Arundel County residents, city officials, and tourists will benefit from bridging the gap
between accessibility and mobility with a modern transportation map. Our final product will
provide users with an online, user-friendly, and interactive application. This application will
visually integrate various transit systems to create an intermodal regional network map. The
online map includes features that help users discern route schedules, estimate their location in
relation to transit stops, and visualize links to other regional transportation networks. This
consolidated map will be an invaluable resource to transit users in Anne Arundel County.
We also investigated some transportation challenges within Anne Arundel County as it moves
towards a more comprehensive program. Though the current transportation network serves
many populated regions of the county, there are also areas with important amenities that lack
connectivity. These gaps and some potential remedies are also addressed in this report. This
analysis will aid planners and county officials as they approach transportation issues in the
future.
PALS SUMMARY: The foremost goal of this project was to prepare a consolidated transit map for
Anne Arundel County. In completing this task, we were able to examine some of the underlying
data that structures the network. The scrutiny of the underlying data compelled us to create
worker and population distribution maps with the transit network overlay. This visualization
allows us to make recommendations and see room for improvements.
3
Background
Anne Arundel County is located just south of the City of Baltimore in the State of Maryland. It is
the home of the state capital, Annapolis. The county totals 558 square miles and the Chesapeake
Bay determines the majority of the eastern border of the county. Between 2010 and 2015, the
county saw its population grow by 4.9% and now has a population of 564,195.1 About 77,400 of
residents are 65 years and older, and this number increased by 21.8% from 2010. Major
employers in the region include Fort George G. Meade, Northrop Grumman, the Anne Arundel
Medical Center, and the United States Naval Academy.2 The Baltimore/Washington International
Thurgood Marshall Airport (BWI) serves as the major international transportation hub for the
City of Baltimore and is located in the northern region of the county. At the local level, the
county is home to stops on the Maryland Transit Administration’s Light Rail and the MARC
Commuter rail service as well as numerous bus networks.
Research Questions
Our primary subject areas include:
an analysis of transit accessibility to and from employment centers
an investigation into whom the transit system serves
how best to present the consolidated transit map.
At the core of this project are questions about the accessibility of transit services throughout
Anne Arundel County. By creating a consolidated transit map, we will be positioned to examine
population and employment characteristics as they relate to transit accessibility (at the Census
block group and tract levels). The map will also visualize access to local services and amenities,
which can be further analyzed to determine the reach and effectiveness of county transit
services. We seek to answer the following questions:
1US Census QuickFacts, Anne Arundel County, 2015. 2Major Employers in Anne Arundel County, Maryland Department of Commerce.
4
With accessibility in mind, what are the strengths and weaknesses of each Anne Arundel
County transit system and what roles do they play in the network?
What services and amenities are most/least accessible? What are the impacts of those
findings?
What are the opportunities and challenges the transit system may face in the future?
Overall, what recommendations can we make with respect to current and future service?
What data or information might be missing that would provide a more complete or more
accurate analysis?
How can a consolidated transit map most effectively be used to improve transit?
Analysis Approach
To analyze the existing transportation system, its regional context, and its level of accessibility,
ArcGIS Desktop 10.3.1, ArcGIS Online, and ESRI Web AppBuilder were used. The following list
outlines the report’s areas of analysis:
provided data and regional context
strengths and weaknesses in current public transit system
population and employment distribution
transit accessibility to and from employment centers
accessibility to points of interest
walking accessibility to transit stops
mapping of key findings with points of interest and transit routes
online application to search and view transit routes, stops and key destinations.
Final Deliverables
Consolidated transit map with all transit systems and various variables related to transit
Locations of services and amenities throughout the county
5
Interactive consolidated transit map application hosted on ArcGIS Online (AGOL)
Concise analysis of the transit network
Basic recommendations to improve transit service
Overview of Results
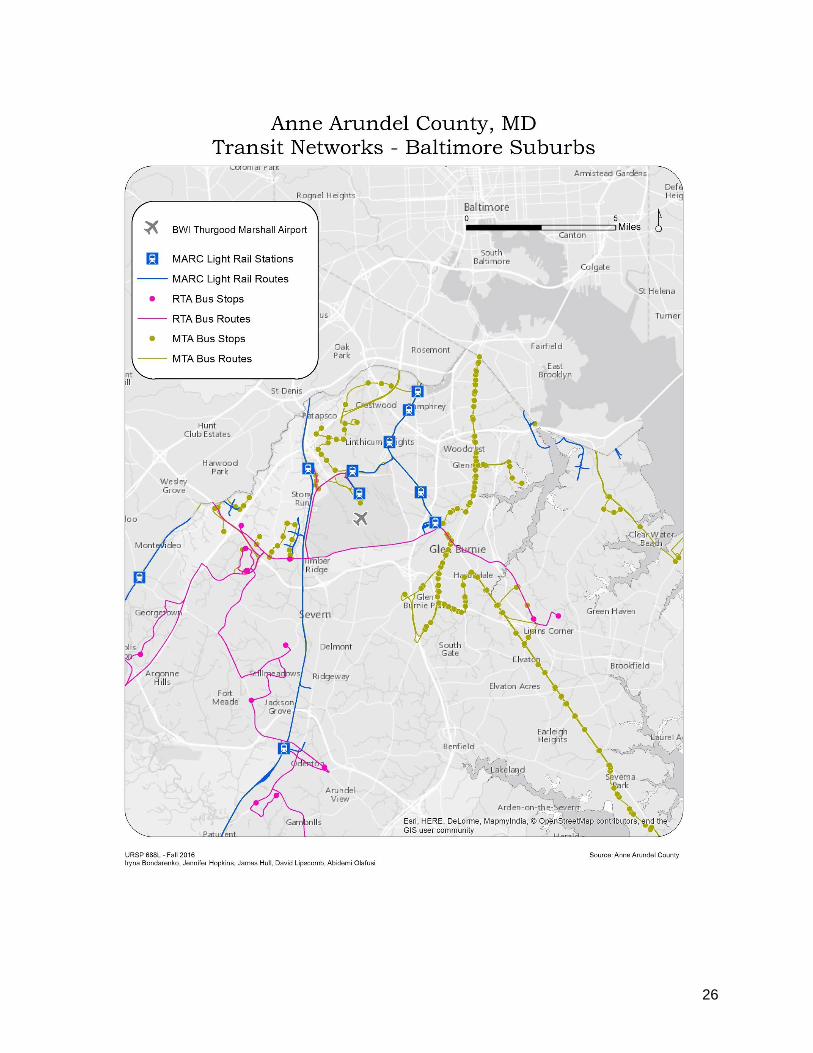
Anne Arundel County’s transit network service is diverse. Users can choose between the MARC
rail system or bus. MTA (Maryland Transit Authority), RTA (Regional Transit Authority) and the
City of Annapolis all contribute to the county’s bus transportation network. The MARC rail
stations are mostly concentrated in the northern part of the county near Baltimore. A few stops
outside city limits provide service to Odenton, Georgetown, and Maryland City. In total there are
11 light rail stations in Anne Arundel County. RTA provides service to the northwestern part of
the county with stations in Maryland City, Severn, Fort Meade, and Glen Burnie. There are 26
RTA transit stops.
RTA serves specific regions within Maryland, including Anne Arundel County, while the MTA
serves the entire state of Maryland. Analyzing the MTA bus stops reveals a dense network of
stops along Ritchie Highway, Maryland Route 2, and other roads connecting Baltimore to the
Annapolis area in the east by way of Glen Burnie and areas northeast of the Severn River.
Annapolis, the State’s capital, is a major population center in Anne Arundel County. The city’s
transit network has 238 bus stops of the total 414 transit stops in Anne Arundel County,
accounting for 57% of the county’s total transit stops.
Amenities
Airport: BWI is in the northern part of Anne Arundel County. The MARC line is the most
suitable means of transit to the airport from the northwestern parts of the county. Though
residents of Annapolis do not have direct access to MARC rail, they can transfer from
Annapolis transit to MTA, then to MARC. Though not easy, it is still an option for residents
trying to reach the airport on public transportation. For the northwestern area of the county,
6
the RTA and MARC transportation networks follow similar routes and provide a convenient
option for BWI access.
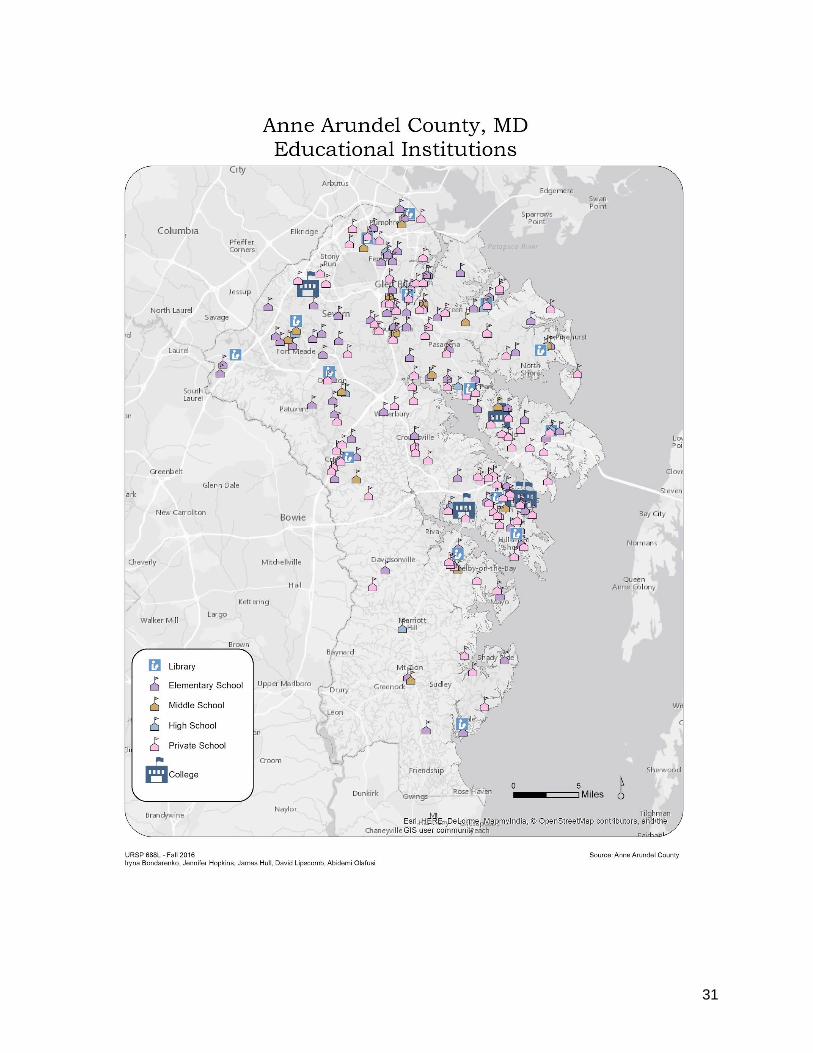
Education: There are 218 educational institutions in the county, which include elementary,
middle, and high schools, as well as private schools and libraries. Some are accessible by
MARC, Annapolis transit, RTA and MTA, depending on their location, however educational
institutions in the south, central, and portions of the east side of Anne Arundel County are
not accessible via transit.
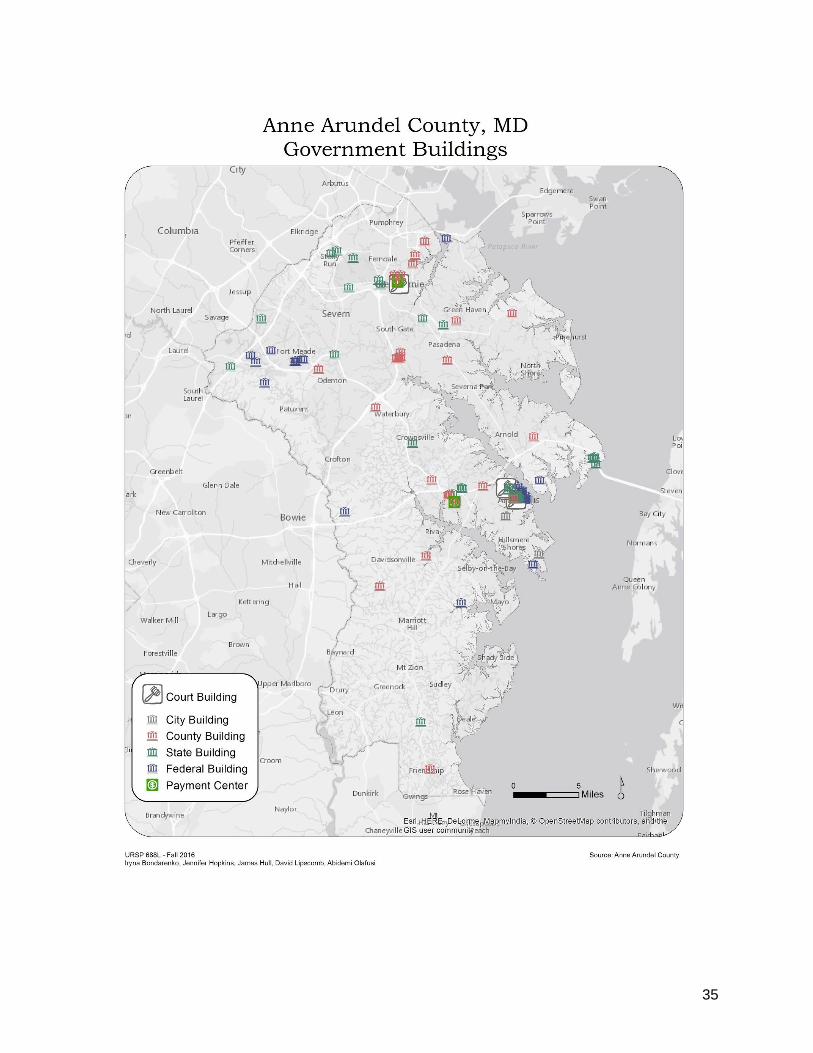
Government: There are 95 municipal or government buildings in Anne Arundel County that
were included in this study, as they likely serve as employment hubs and the location of
many county services. Payment centers, courts, and city, county, state and federal buildings
were included. They are widely dispersed, and there is relatively good access in the northern
and eastern parts of the county, though reaching some may require network transfers. For
government buildings located in the eastern part of the county, the Annapolis bus transit
provides access.
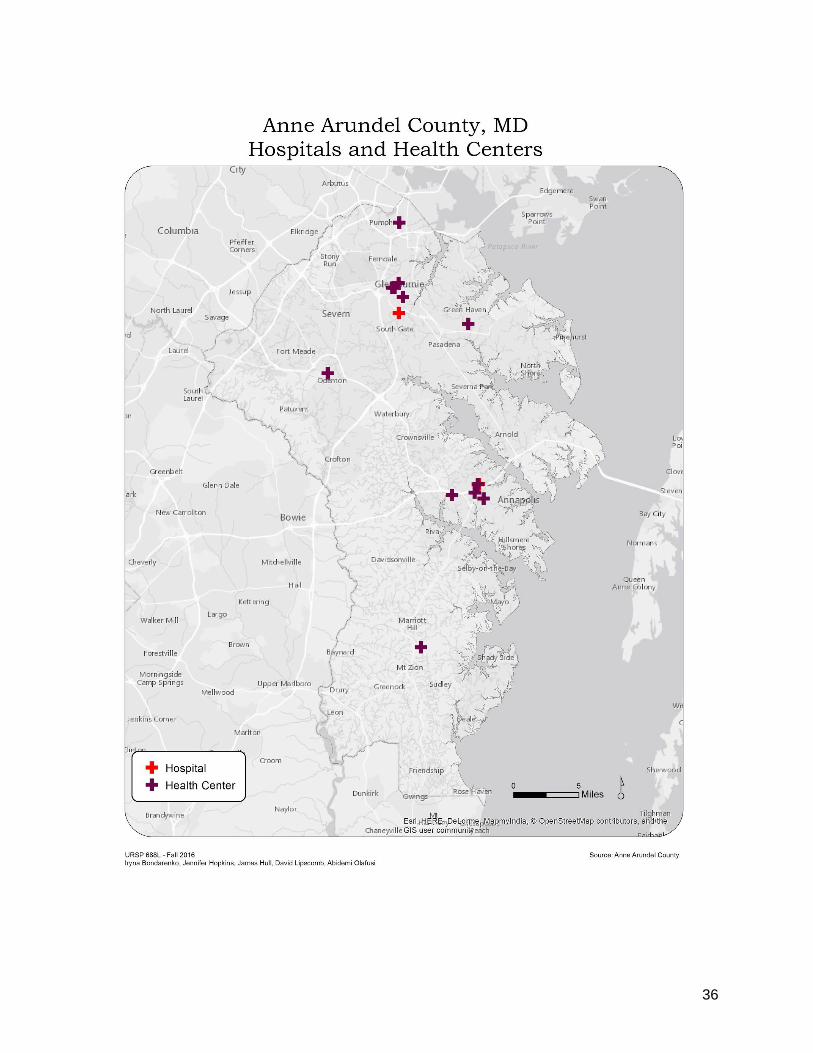
Health: There are 14 hospitals and health centers in the county. MARC, RTA, and MTA
provide service in the northern region of the county. Three out of the 14 health centers in
Annapolis can be reached by local Annapolis transit or the MTA services. Owensville Medical
Center, in the southern part of the county, lacks connectivity to any existing transit network.
Park-and-Ride: There are 22 Park-and-Ride facilities in the county, and county transit
systems reach all except one; Tracy’s Landing Park-and-Ride. Tracy’s Landing is in the
southern part of the county, which is underserved by transit.
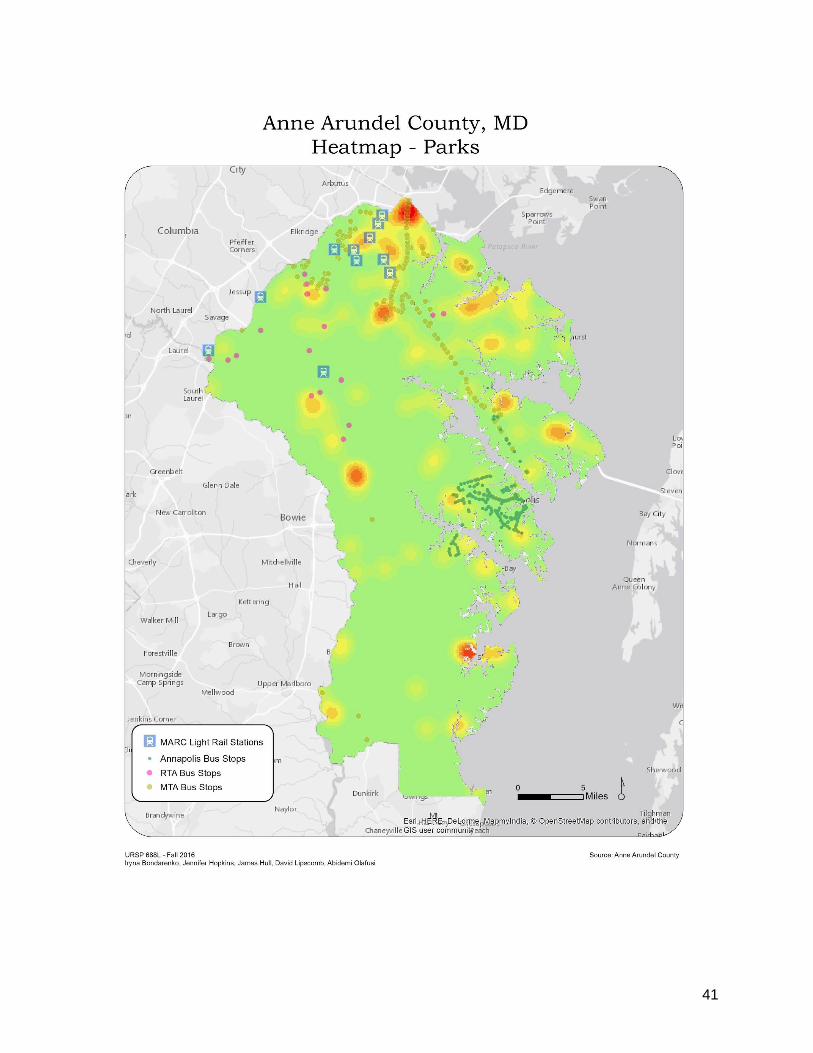
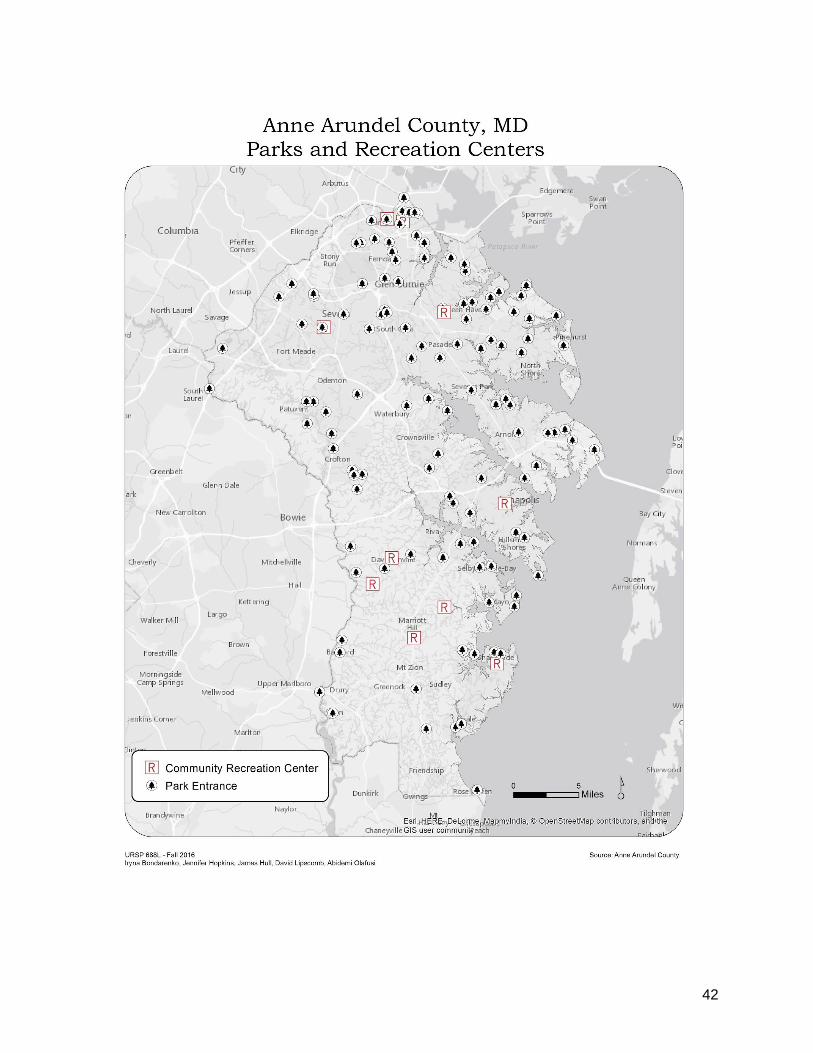
Parks and Recreation: There are 132 parks and community recreation centers in the county.
Many of them are within reach of transit, however, with they are widely spread out
throughout the county, and there are a fair number that the transit network do not reach.
These areas are in the southern and central parts of the county and in the eastern part of the
county along the Chesapeake Bay north of Annapolis. Driving seems to be the only way of
getting to those locations.
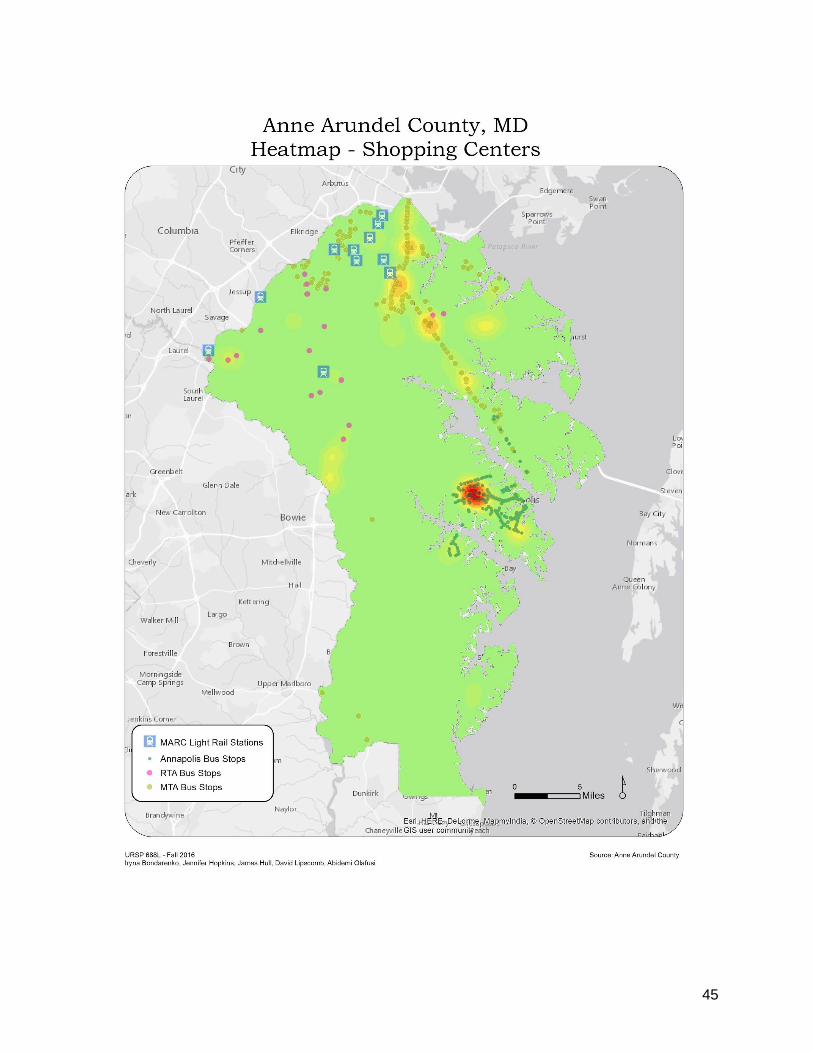
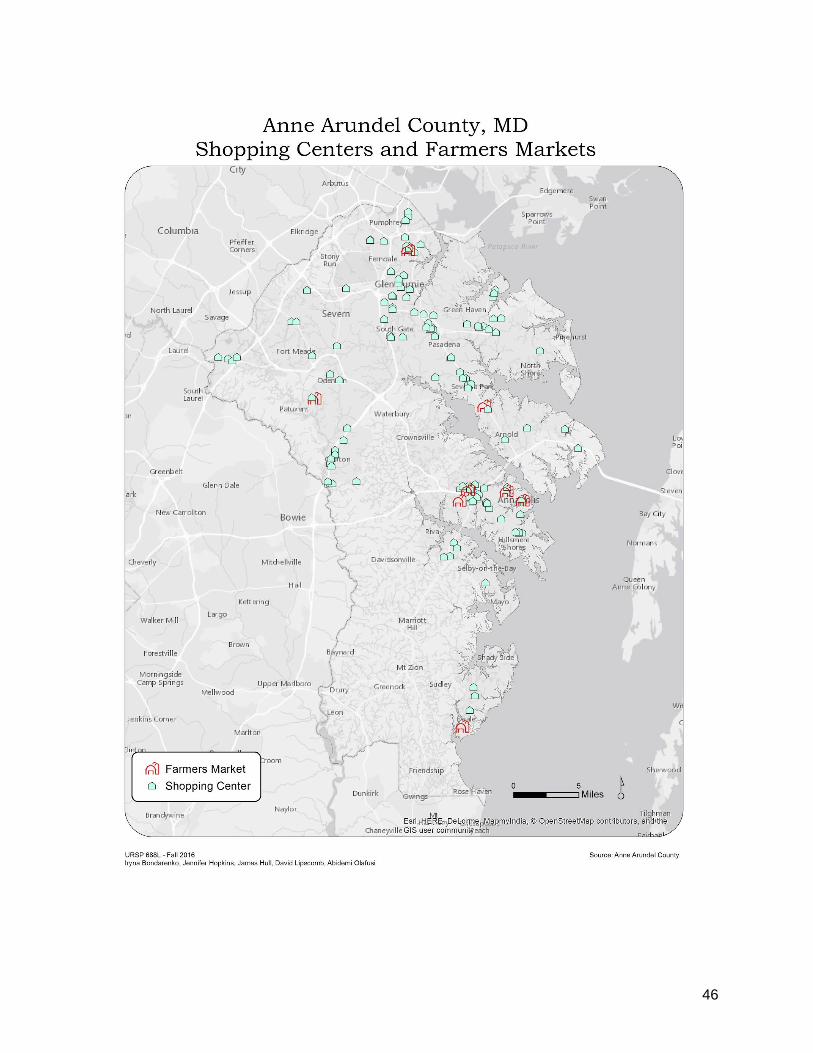
Shopping: There are 138 shopping centers in the county and all of them are easily accessible
by the existing transit network. The majority are in the northern part of the county and
7
around Annapolis. These areas have strong transit systems that provide citizens a means of
transportation to the shopping centers and boost local economies.
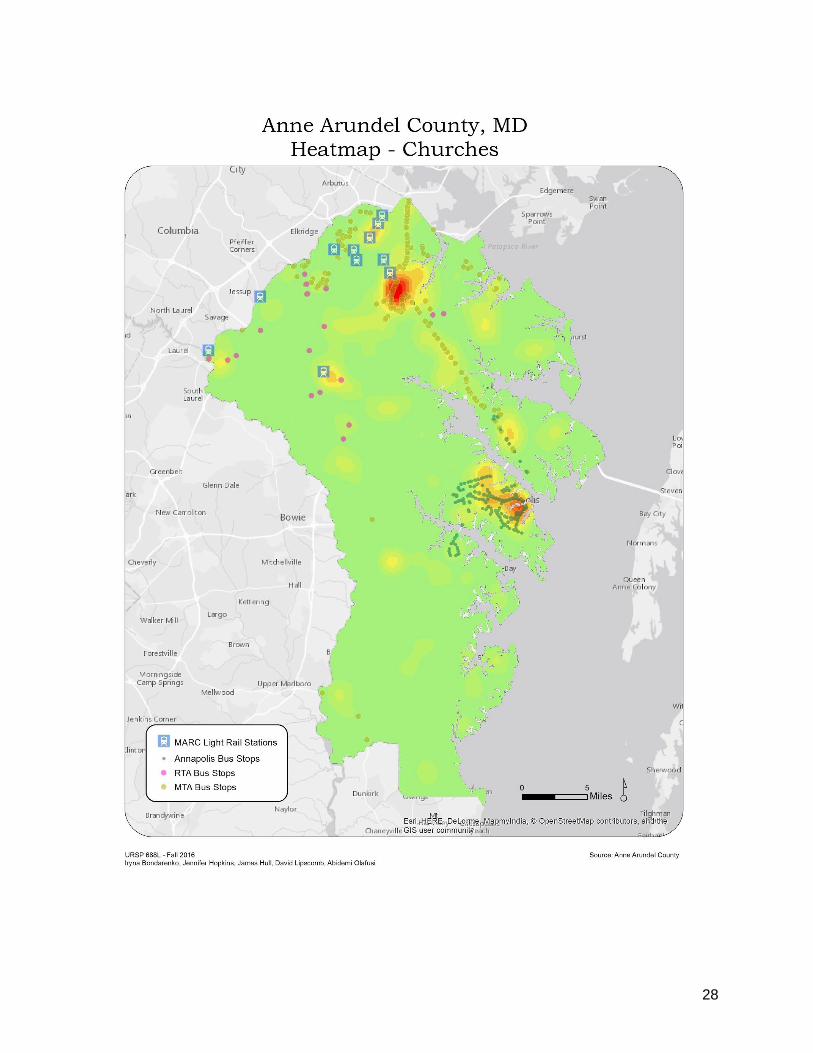
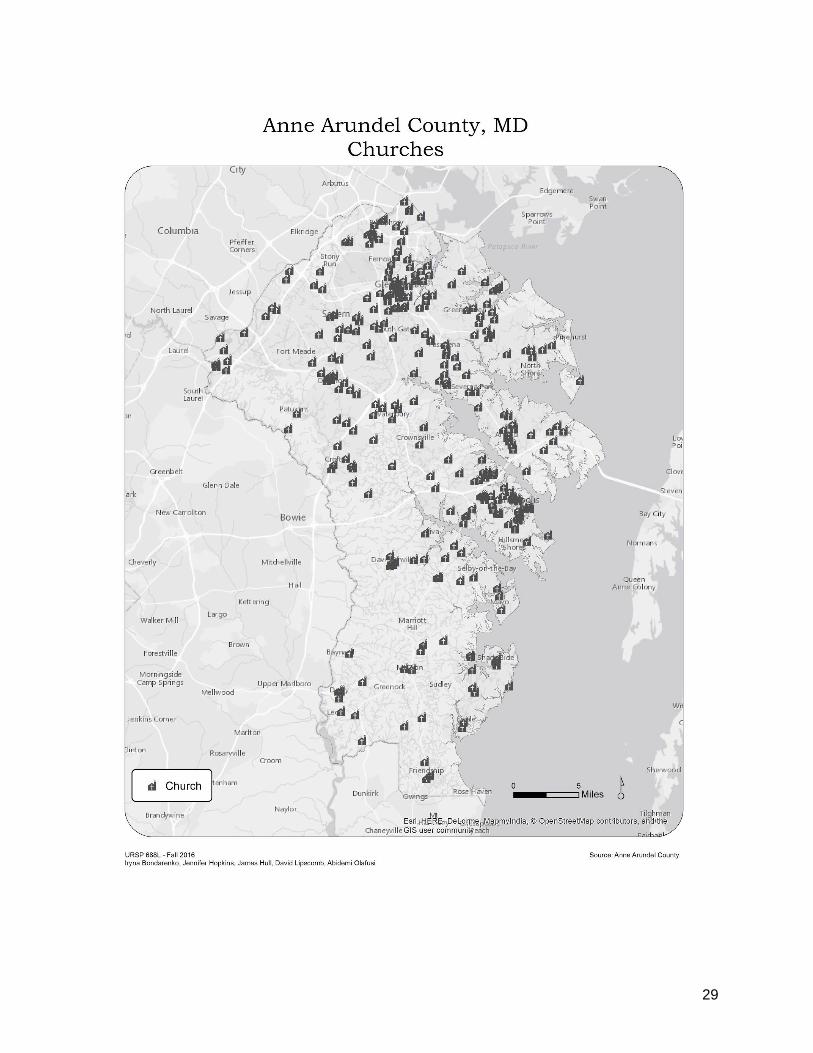
Churches: There are 287 churches in the county, many of which are accessible using public
transit. There is far more access to churches using transit for residents in the northern part
of the county as well as in the city of Annapolis versus the central and southern portions of
the county.
Online Transit Web Application
To assist the county in improving transit access for residents and visitors, we developed a web
application that maps all transit systems available in the county. Data was first formatted and
symbolized in ArcGIS Desktop 10.3 before being published and hosted on ArcGIS Online as a
collection of feature services. The feature services were compiled into a WebMap, which was
used as the source of data to develop an application using ESRI’s Web AppBuilder. This
application is available using a web browser on a desktop computer or mobile device. Users
must have an ArcGIS Online account to access the application. The application allows users to
view a map of the county transit systems and regional points of interest. It is designed to be
user-friendly and does not require any GIS experience or training for use.
These tools are available in the application:
About: provides basic information regarding the application’s purpose
Basemap Switcher: changes the basemap on the application
Directions: accesses directions between addresses and/or locations indicated on the map
Near Me: highlights transit stops and points of interest within a determined distance from an
address or location indicated on the map
Layer List: turns provided layers on and off, and zooms to layers
8
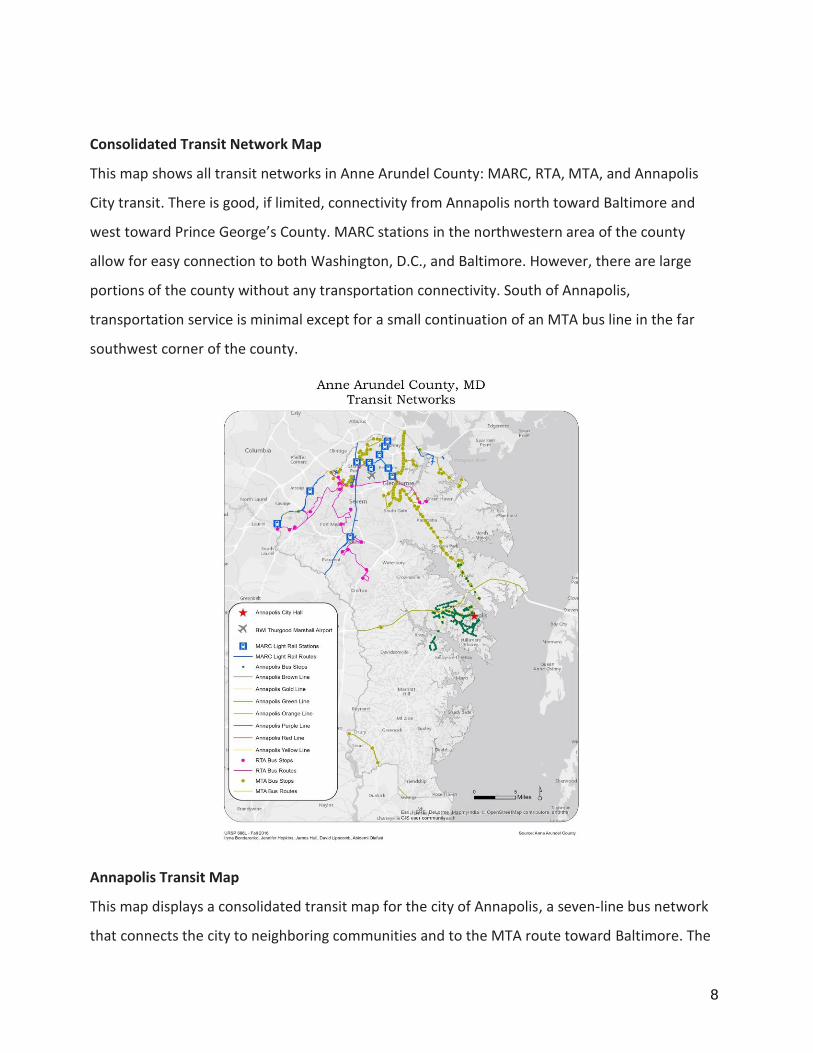
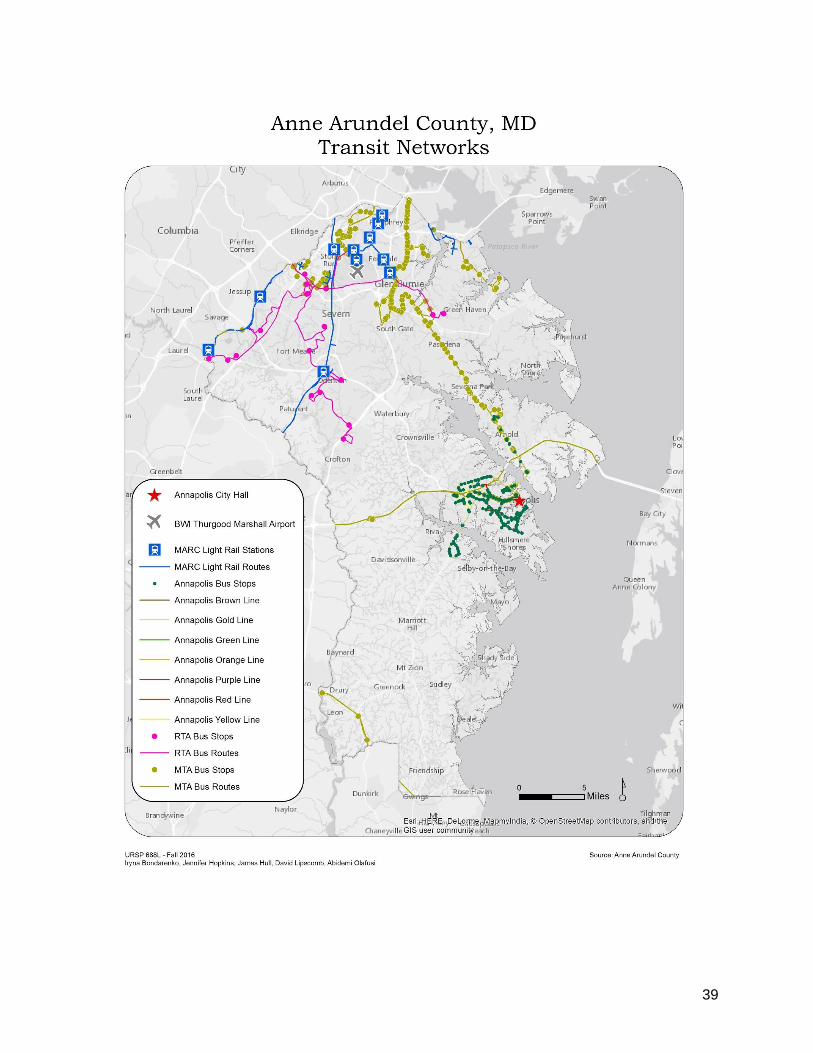
Consolidated Transit Network Map
This map shows all transit networks in Anne Arundel County: MARC, RTA, MTA, and Annapolis
City transit. There is good, if limited, connectivity from Annapolis north toward Baltimore and
west toward Prince George’s County. MARC stations in the northwestern area of the county
allow for easy connection to both Washington, D.C., and Baltimore. However, there are large
portions of the county without any transportation connectivity. South of Annapolis,
transportation service is minimal except for a small continuation of an MTA bus line in the far
southwest corner of the county.
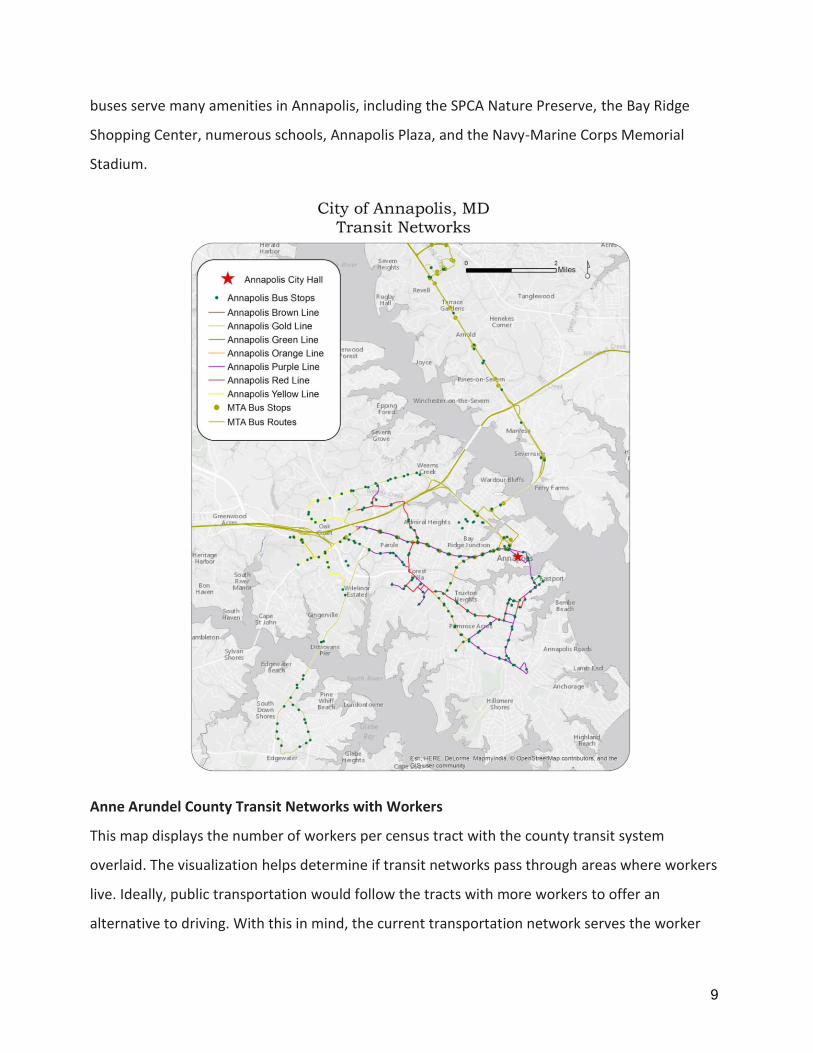
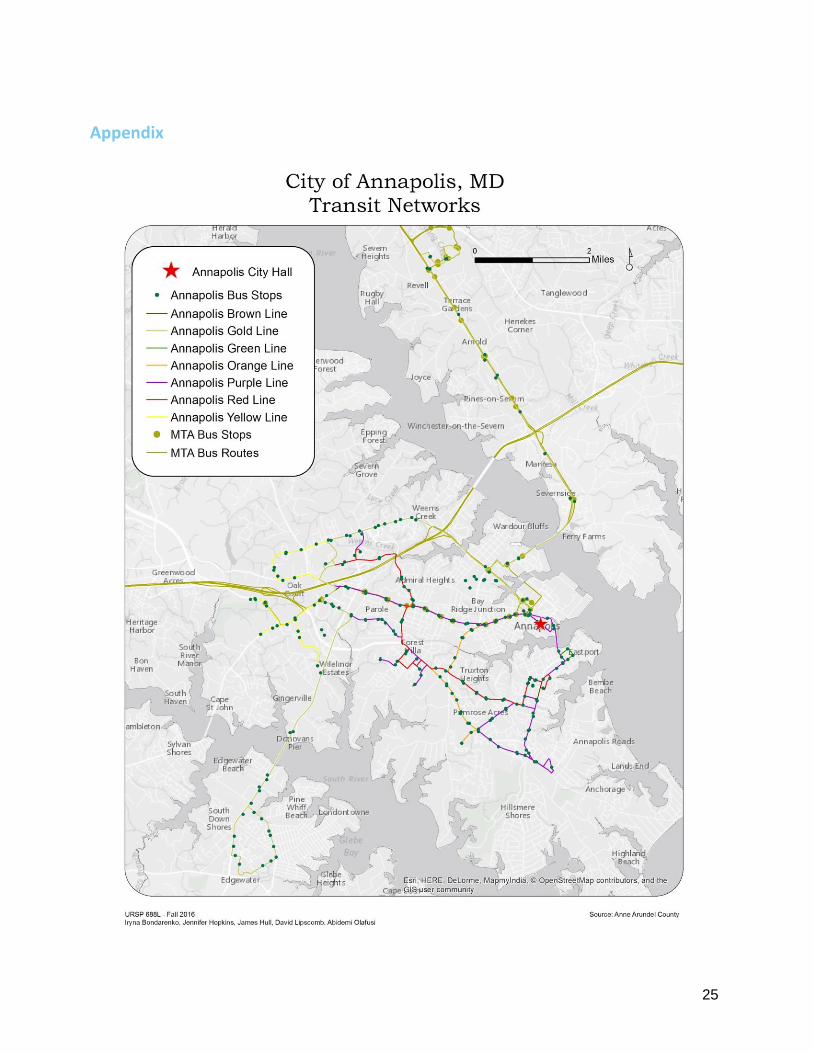
Annapolis Transit Map
This map displays a consolidated transit map for the city of Annapolis, a seven-line bus network
that connects the city to neighboring communities and to the MTA route toward Baltimore. The
9
buses serve many amenities in Annapolis, including the SPCA Nature Preserve, the Bay Ridge
Shopping Center, numerous schools, Annapolis Plaza, and the Navy-Marine Corps Memorial
Stadium.
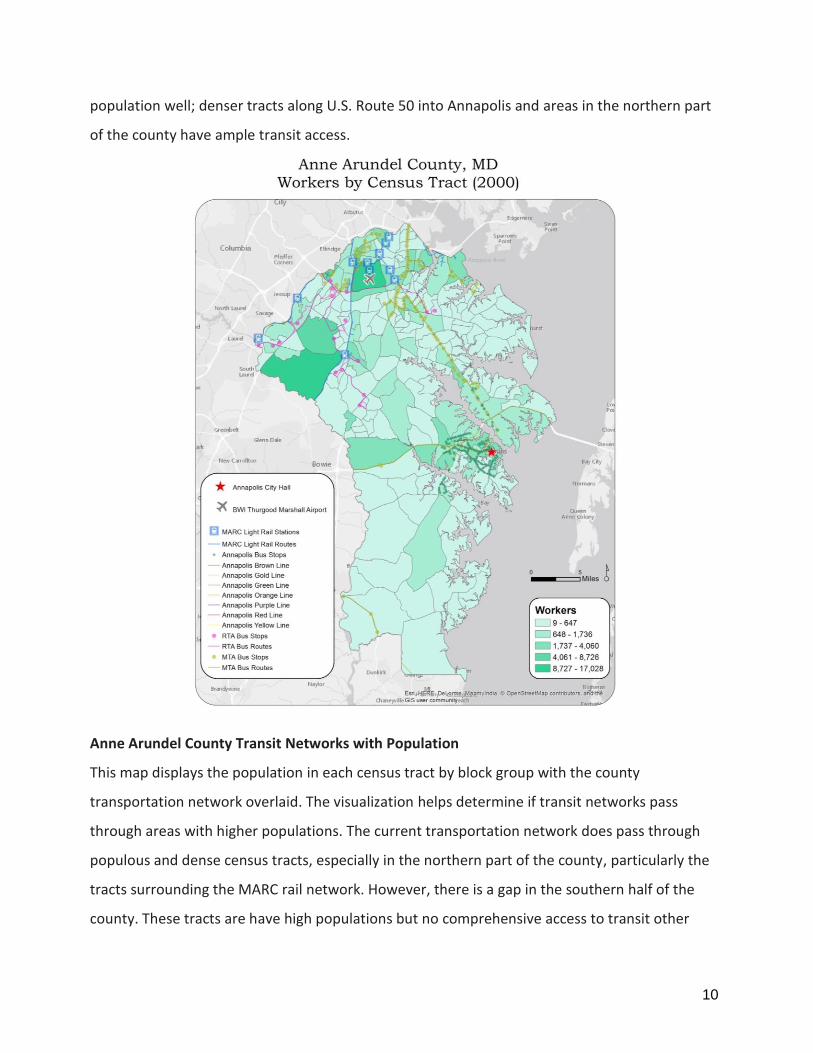
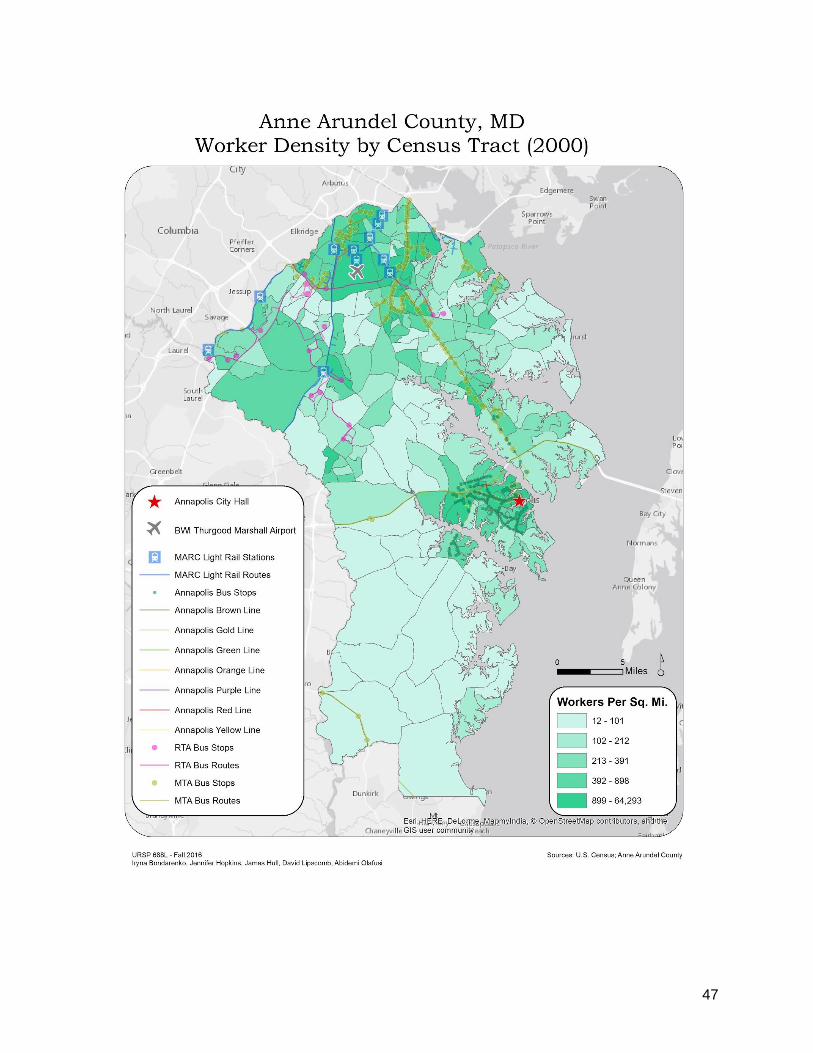
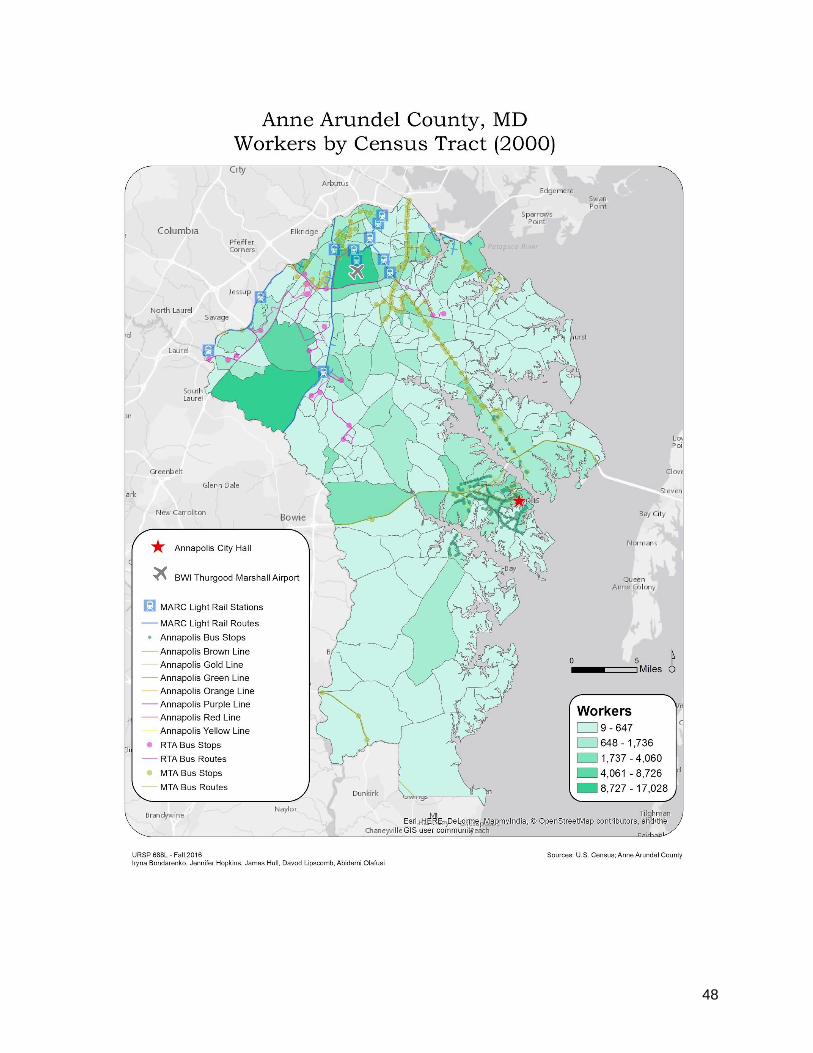
Anne Arundel County Transit Networks with Workers
This map displays the number of workers per census tract with the county transit system
overlaid. The visualization helps determine if transit networks pass through areas where workers
live. Ideally, public transportation would follow the tracts with more workers to offer an
alternative to driving. With this in mind, the current transportation network serves the worker
10
population well; denser tracts along U.S. Route 50 into Annapolis and areas in the northern part
of the county have ample transit access.
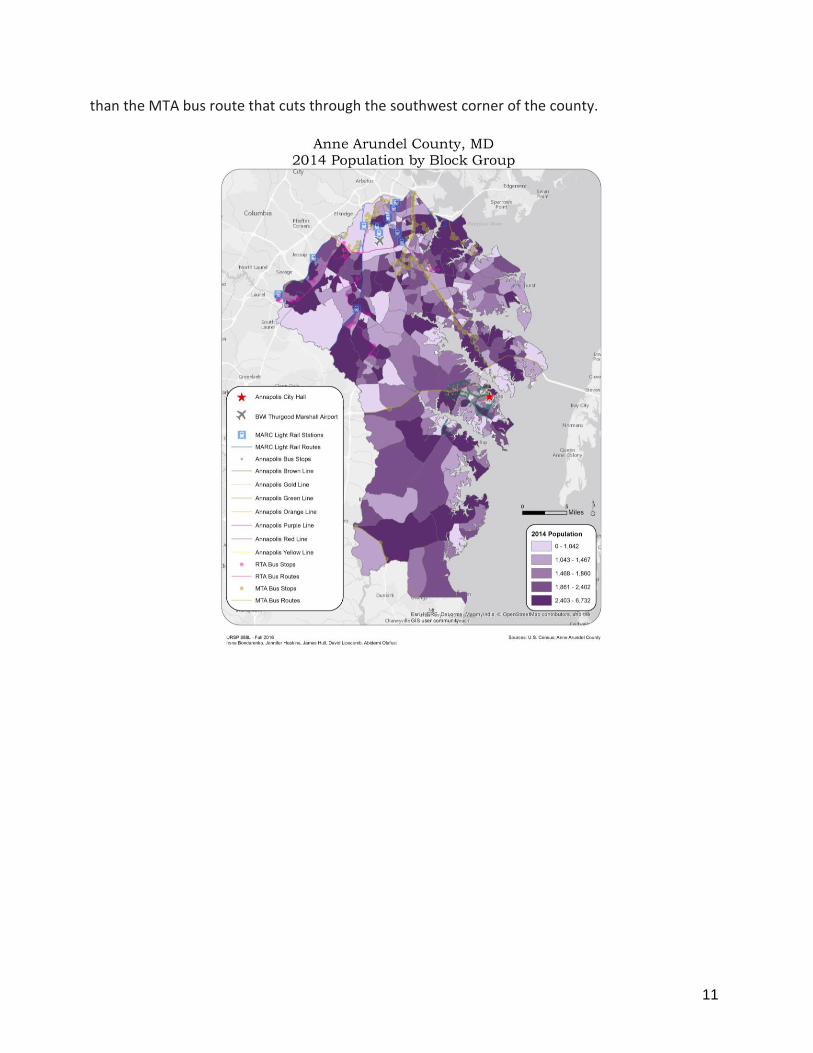
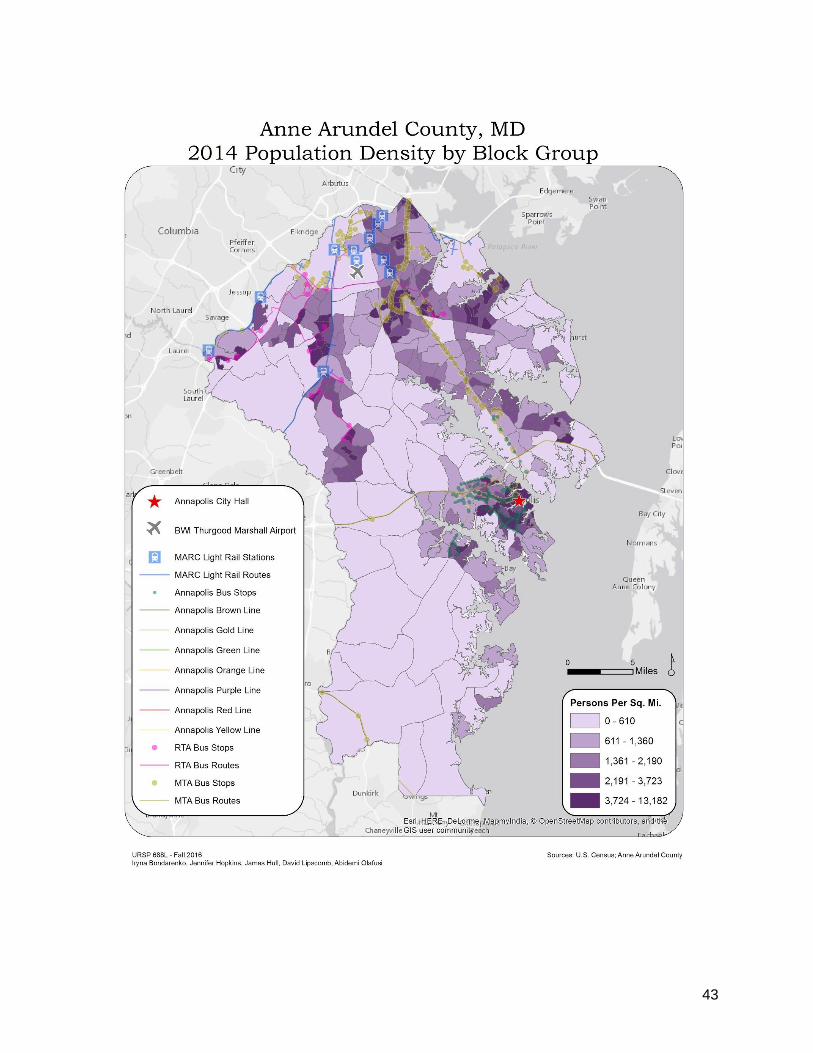
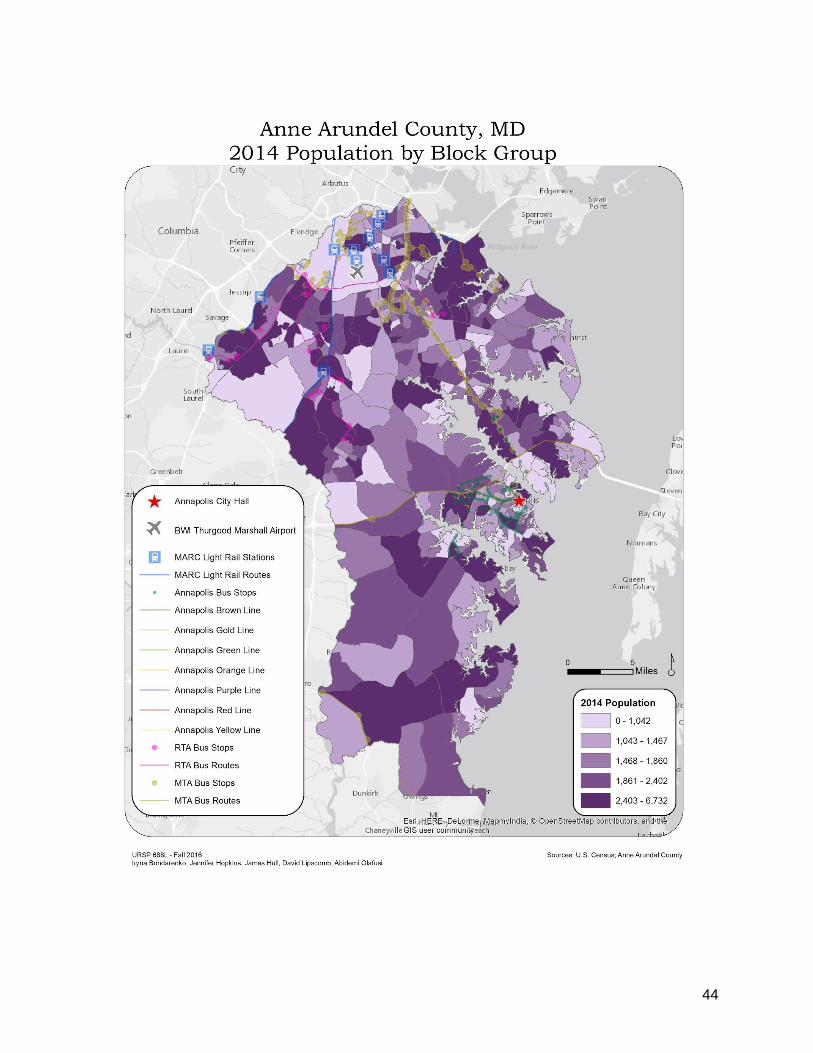
Anne Arundel County Transit Networks with Population
This map displays the population in each census tract by block group with the county
transportation network overlaid. The visualization helps determine if transit networks pass
through areas with higher populations. The current transportation network does pass through
populous and dense census tracts, especially in the northern part of the county, particularly the
tracts surrounding the MARC rail network. However, there is a gap in the southern half of the
county. These tracts are have high populations but no comprehensive access to transit other
11
than the MTA bus route that cuts through the southwest corner of the county.
12
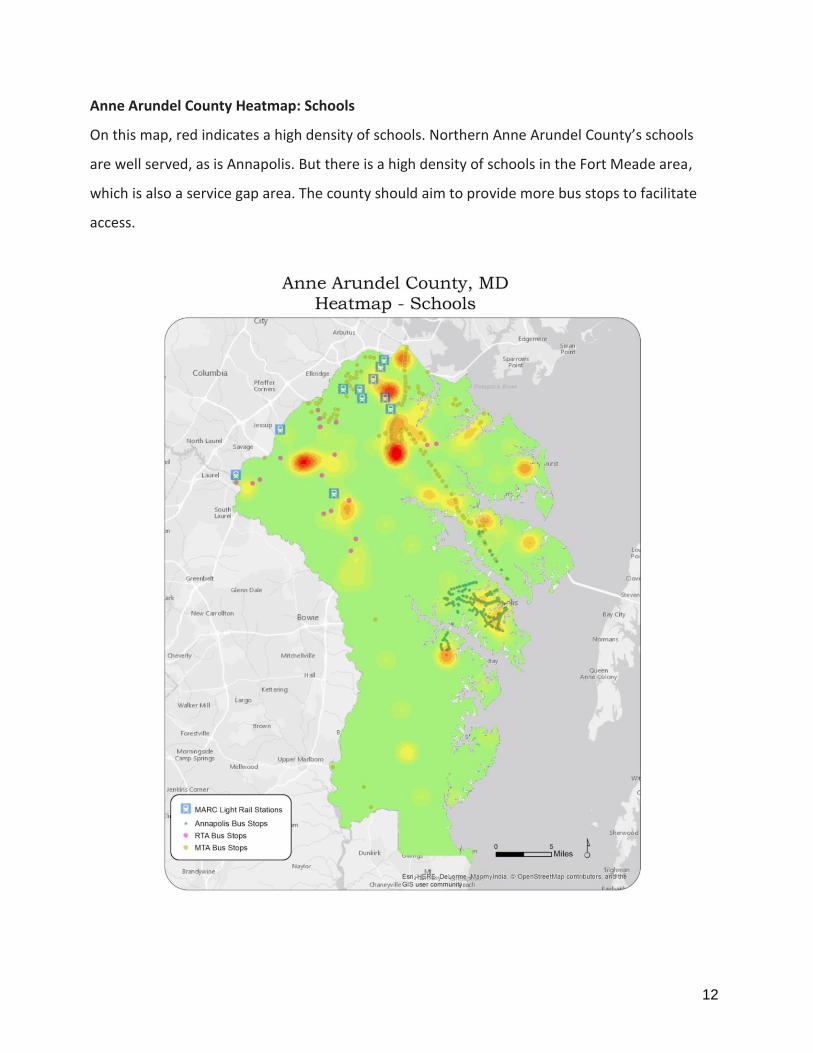
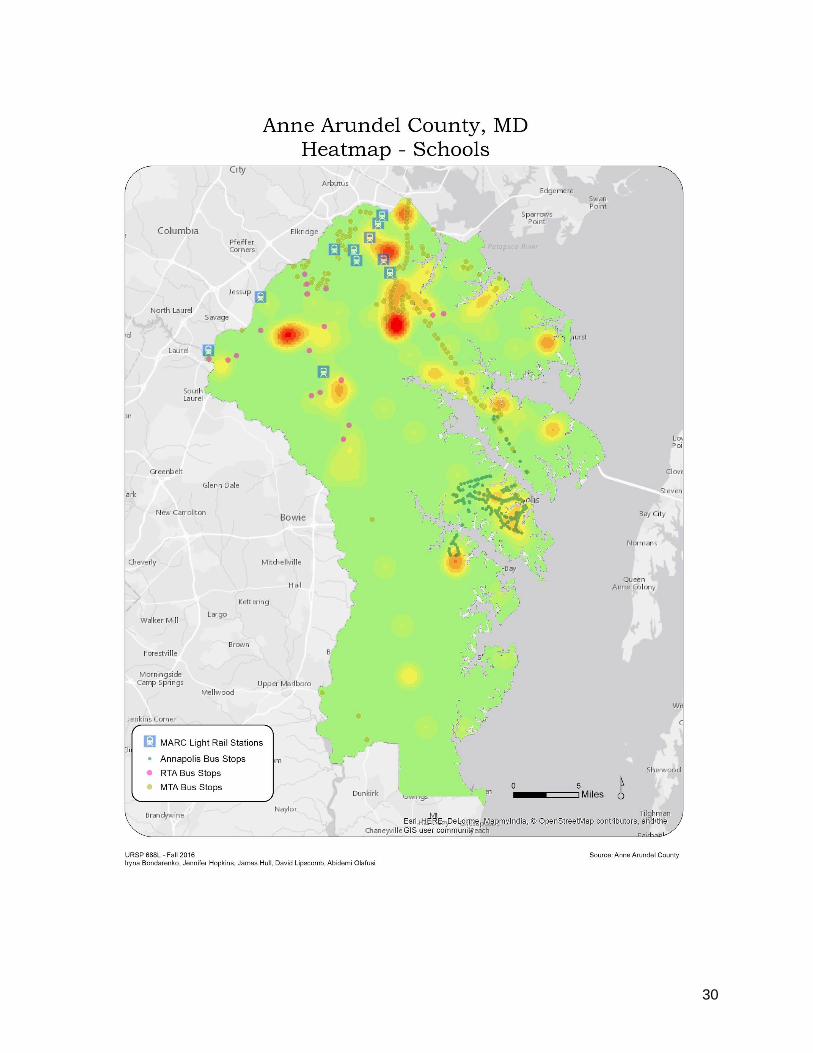
Anne Arundel County Heatmap: Schools
On this map, red indicates a high density of schools. Northern Anne Arundel County’s schools
are well served, as is Annapolis. But there is a high density of schools in the Fort Meade area,
which is also a service gap area. The county should aim to provide more bus stops to facilitate
access.
13
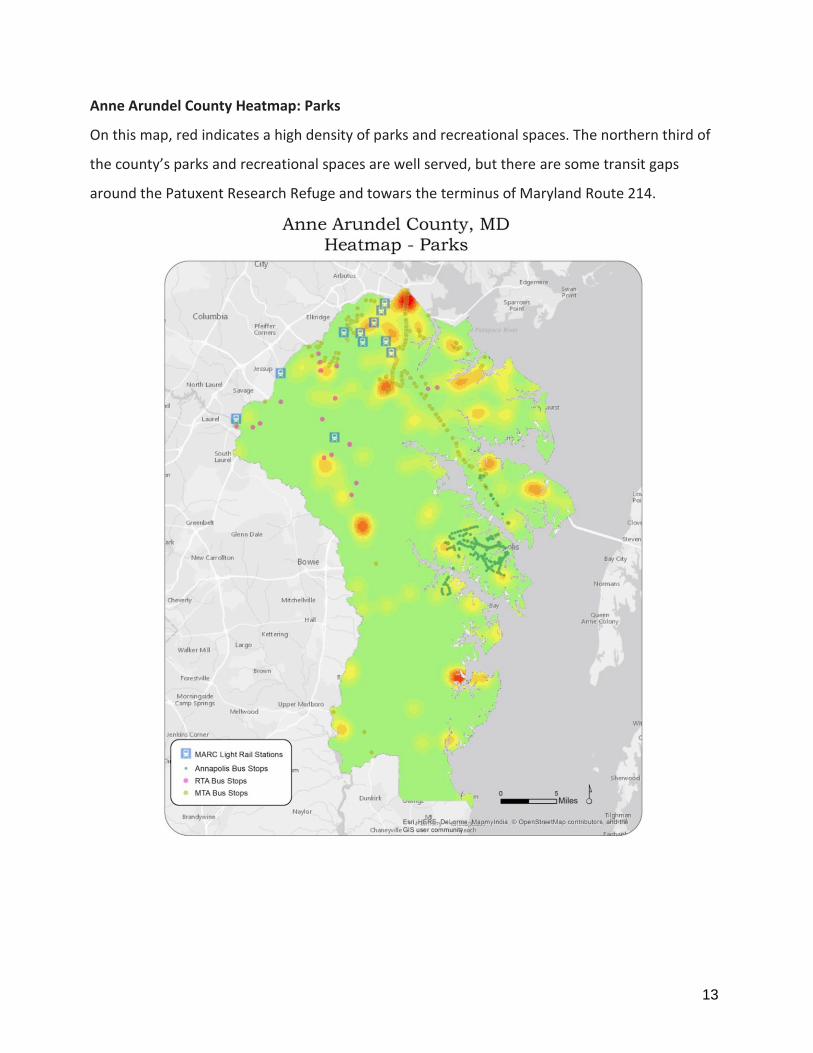
Anne Arundel County Heatmap: Parks
On this map, red indicates a high density of parks and recreational spaces. The northern third of
the county’s parks and recreational spaces are well served, but there are some transit gaps
around the Patuxent Research Refuge and towars the terminus of Maryland Route 214.
14
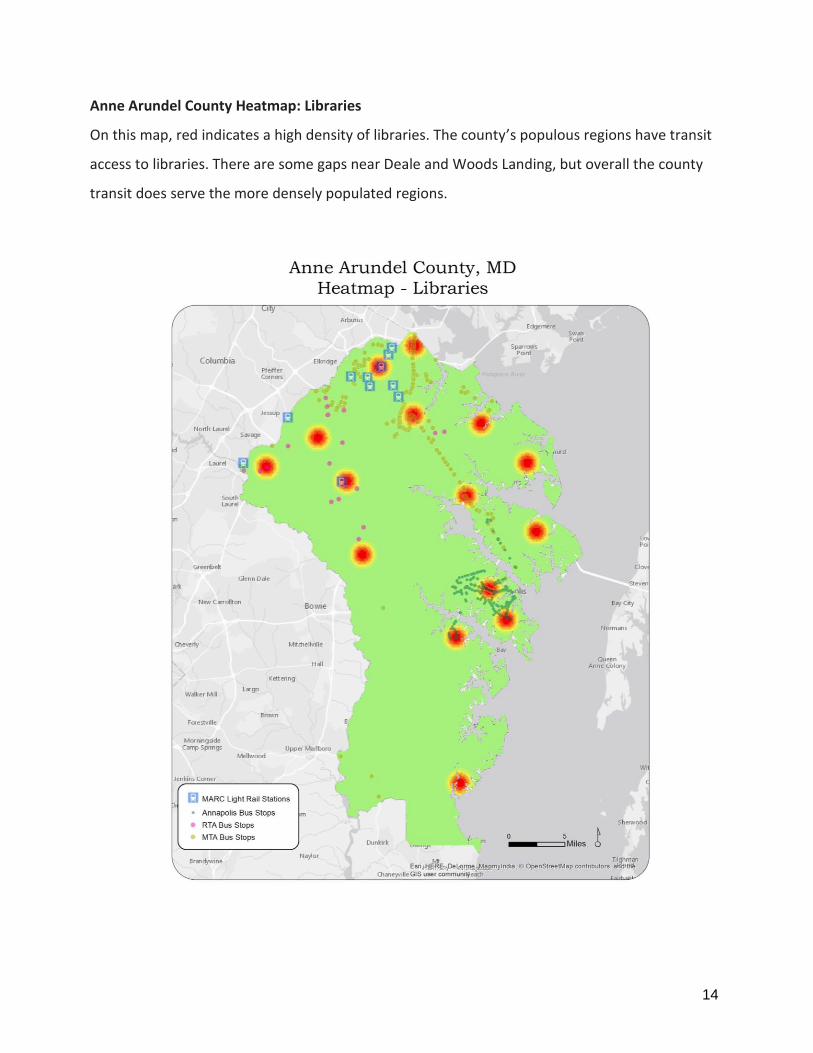
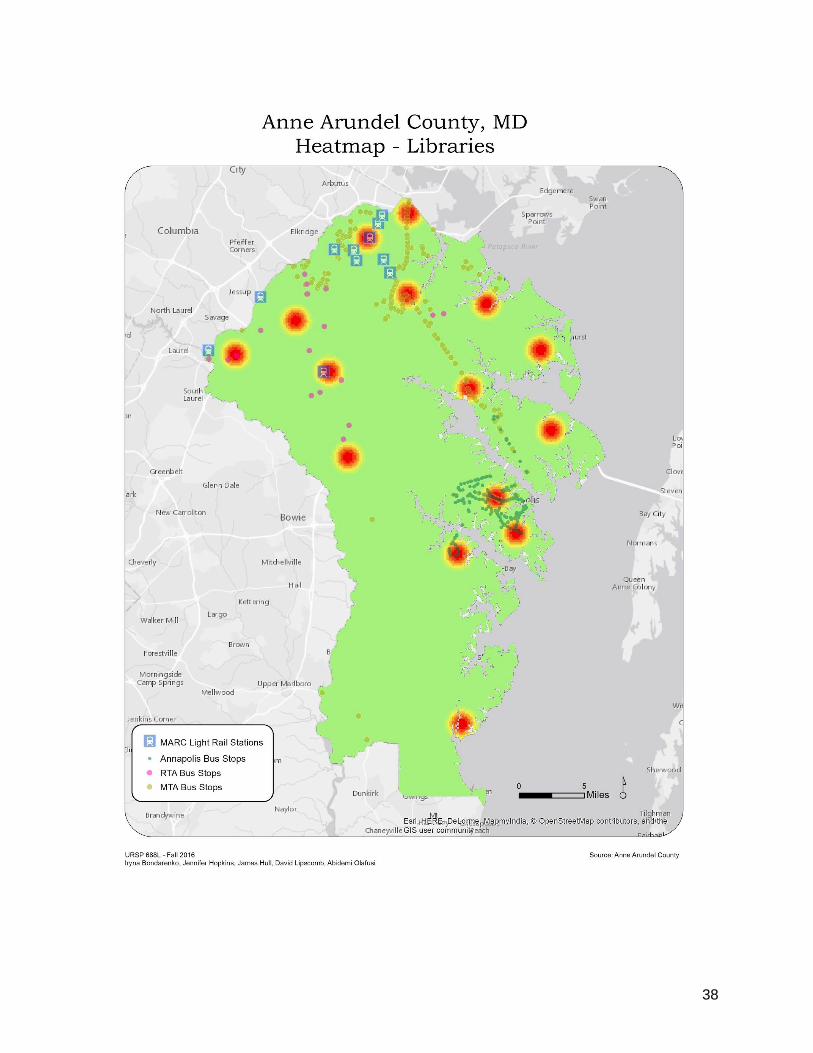
Anne Arundel County Heatmap: Libraries
On this map, red indicates a high density of libraries. The county’s populous regions have transit
access to libraries. There are some gaps near Deale and Woods Landing, but overall the county
transit does serve the more densely populated regions.
15
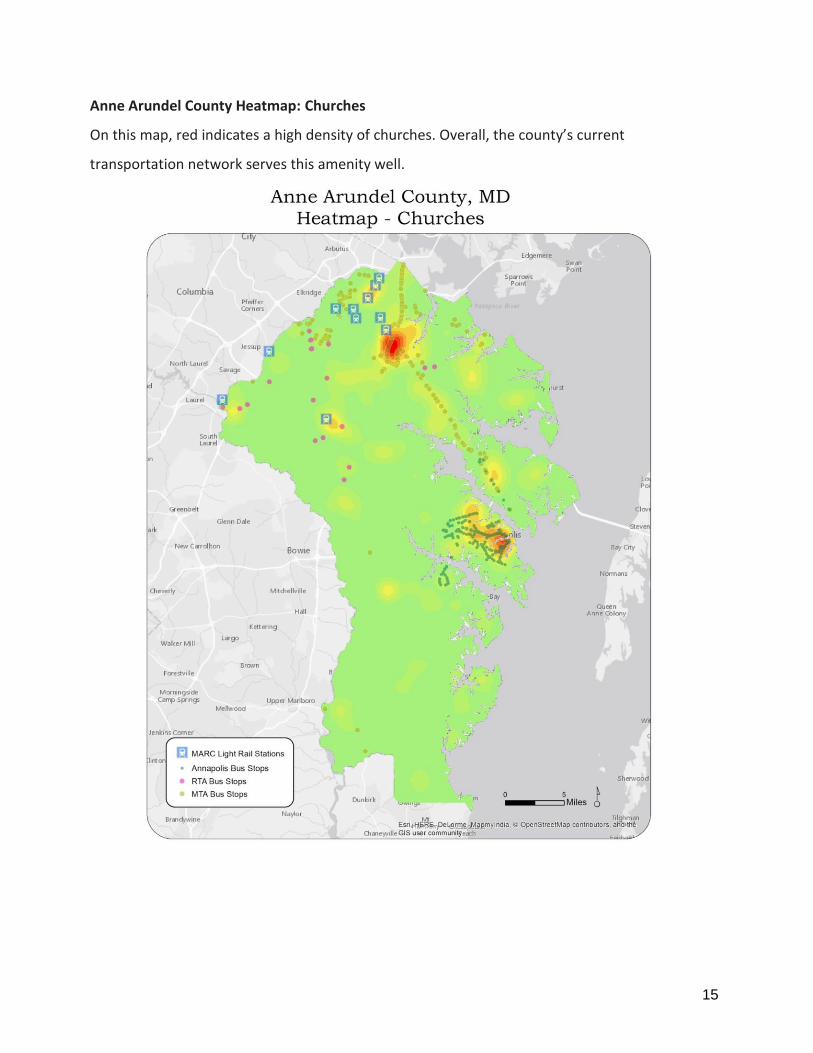
Anne Arundel County Heatmap: Churches
On this map, red indicates a high density of churches. Overall, the county’s current
transportation network serves this amenity well.
16
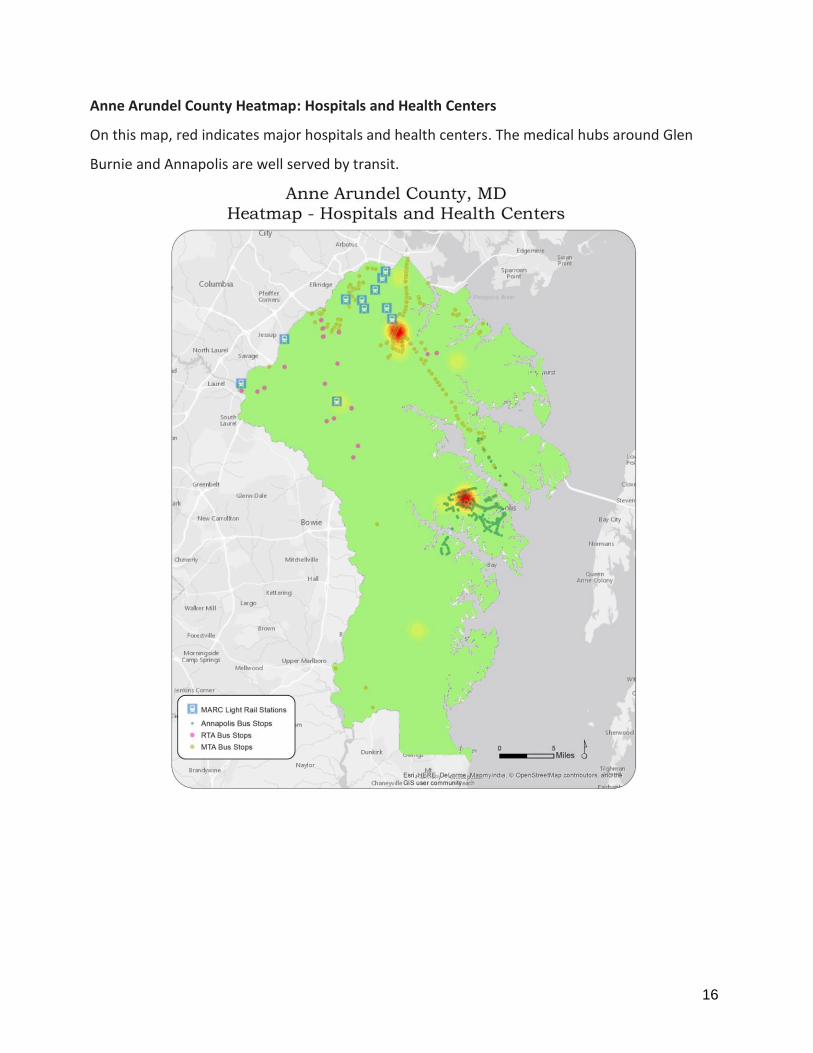
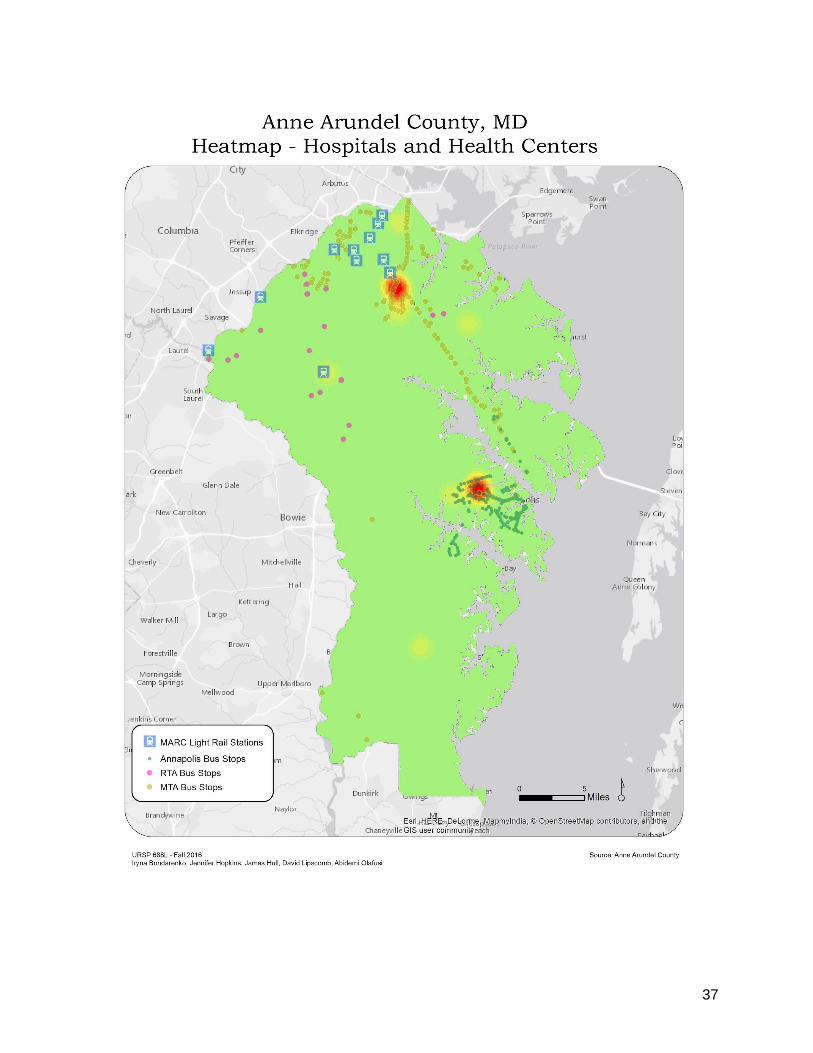
Anne Arundel County Heatmap: Hospitals and Health Centers
On this map, red indicates major hospitals and health centers. The medical hubs around Glen
Burnie and Annapolis are well served by transit.
17
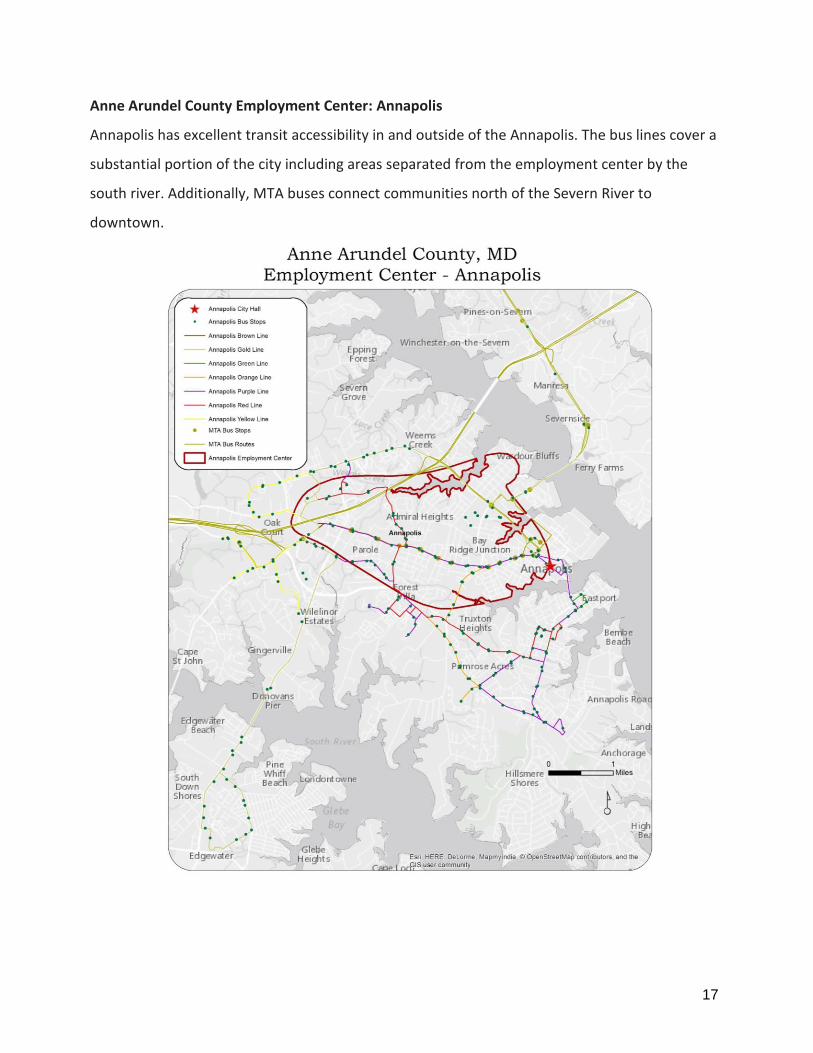
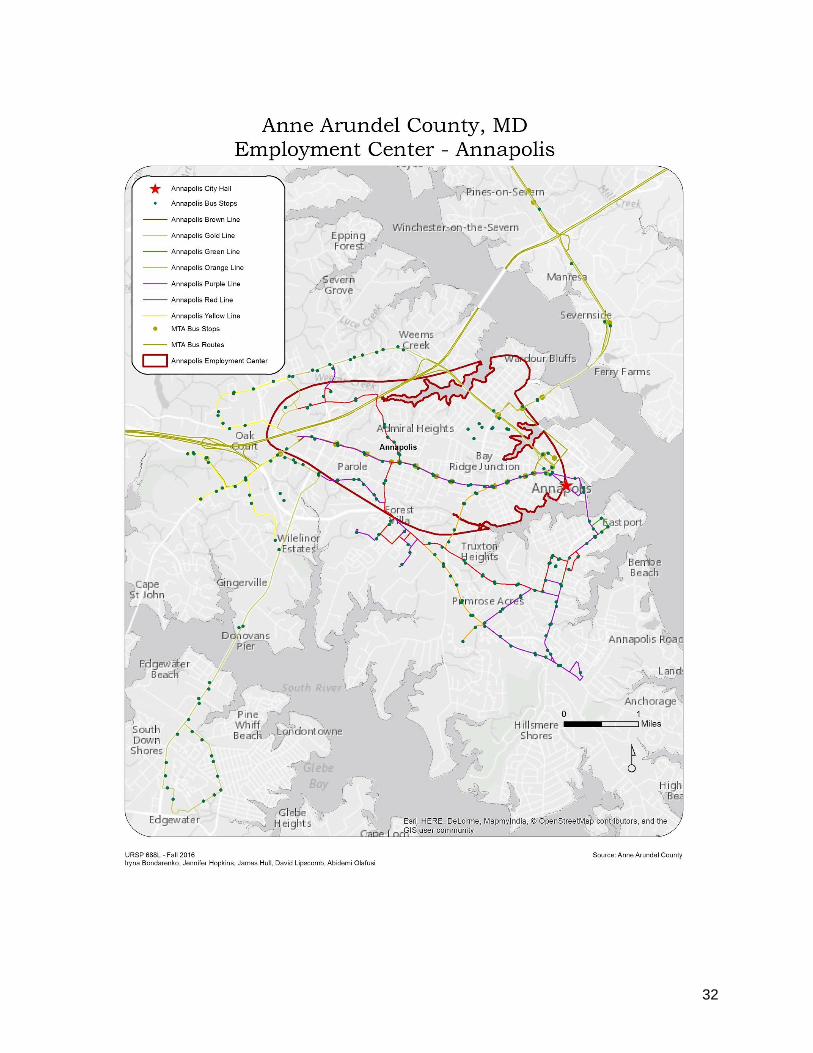
Anne Arundel County Employment Center: Annapolis
Annapolis has excellent transit accessibility in and outside of the Annapolis. The bus lines cover a
substantial portion of the city including areas separated from the employment center by the
south river. Additionally, MTA buses connect communities north of the Severn River to
downtown.

18
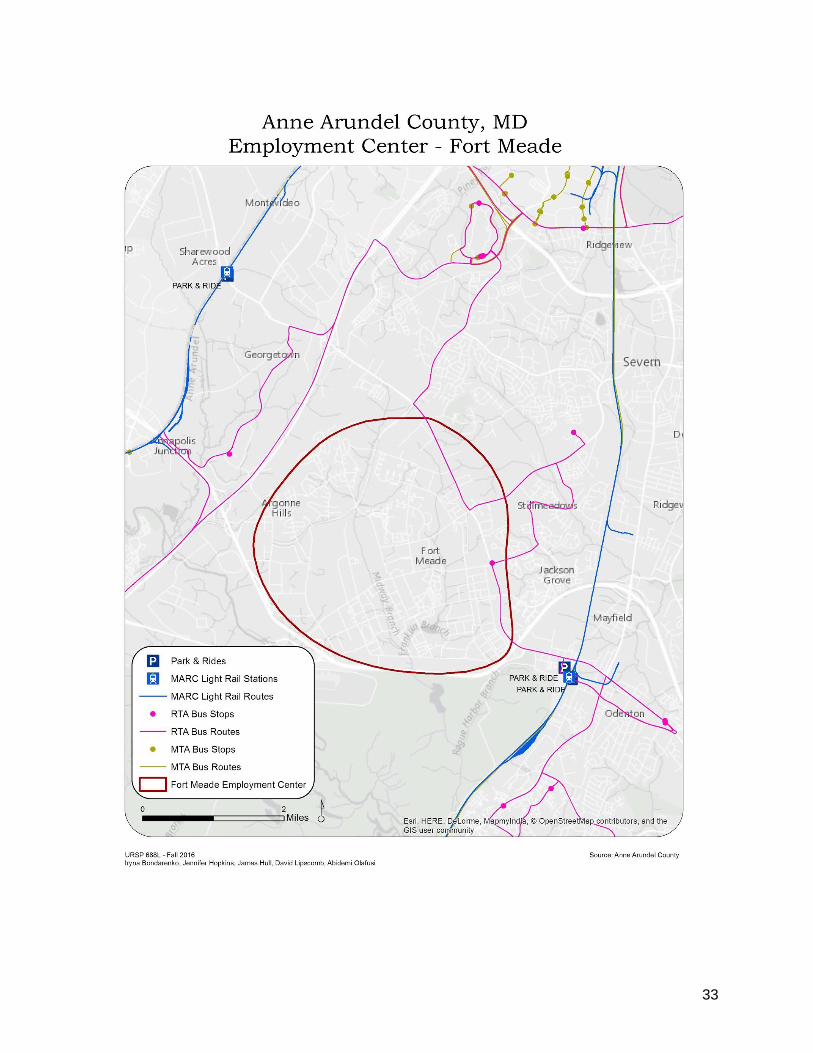
Anne Arundel County Employment Center: Fort Meade
The Fort Meade employment center has the weakest transit access based on the services the
team was asked to examine. However, the MeadeRide partnership operates several shuttle
services that connect commuters at locations inside the employment center to MARC rail
stations, BWI, and other parts of Maryland via the Intercounty Connector.3
3 “Transit Map.” MeadeRide. November 2016
19
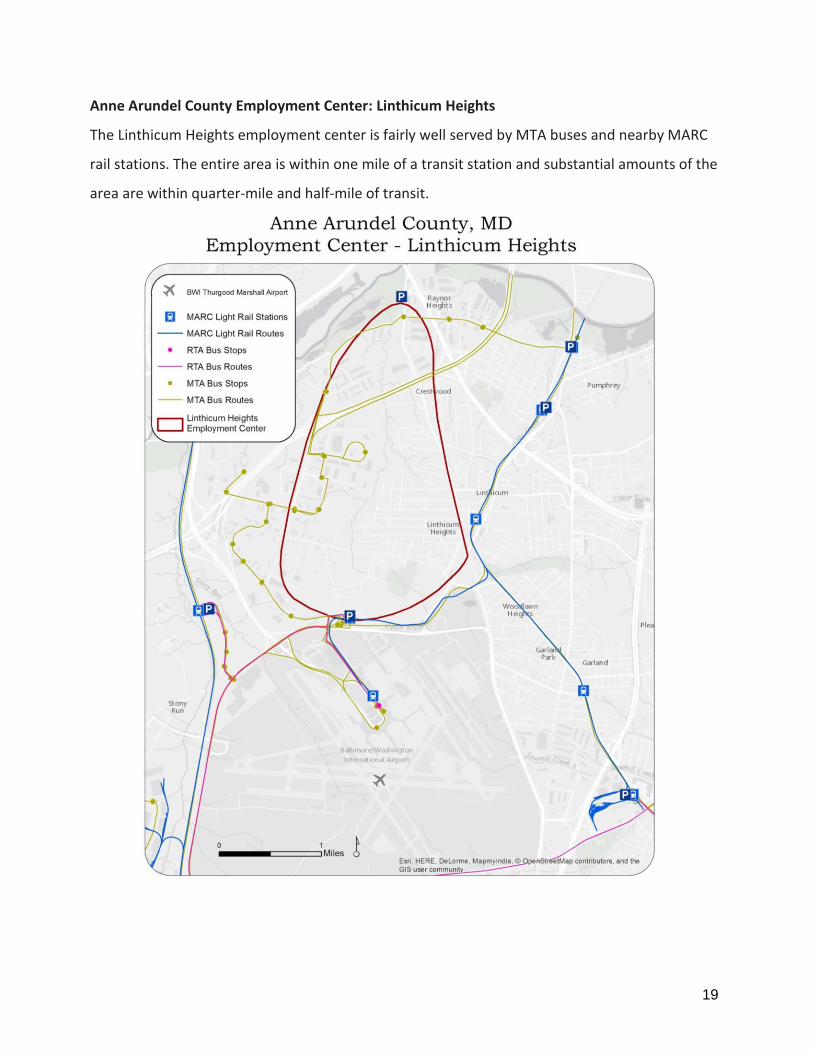
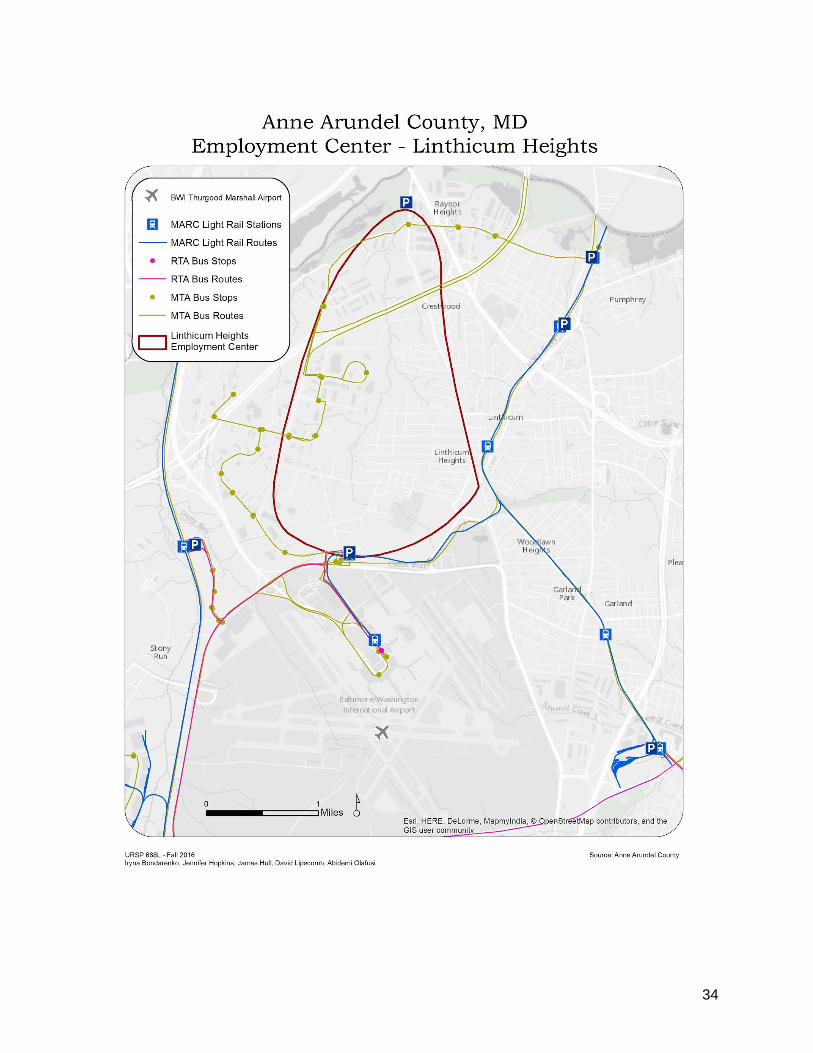
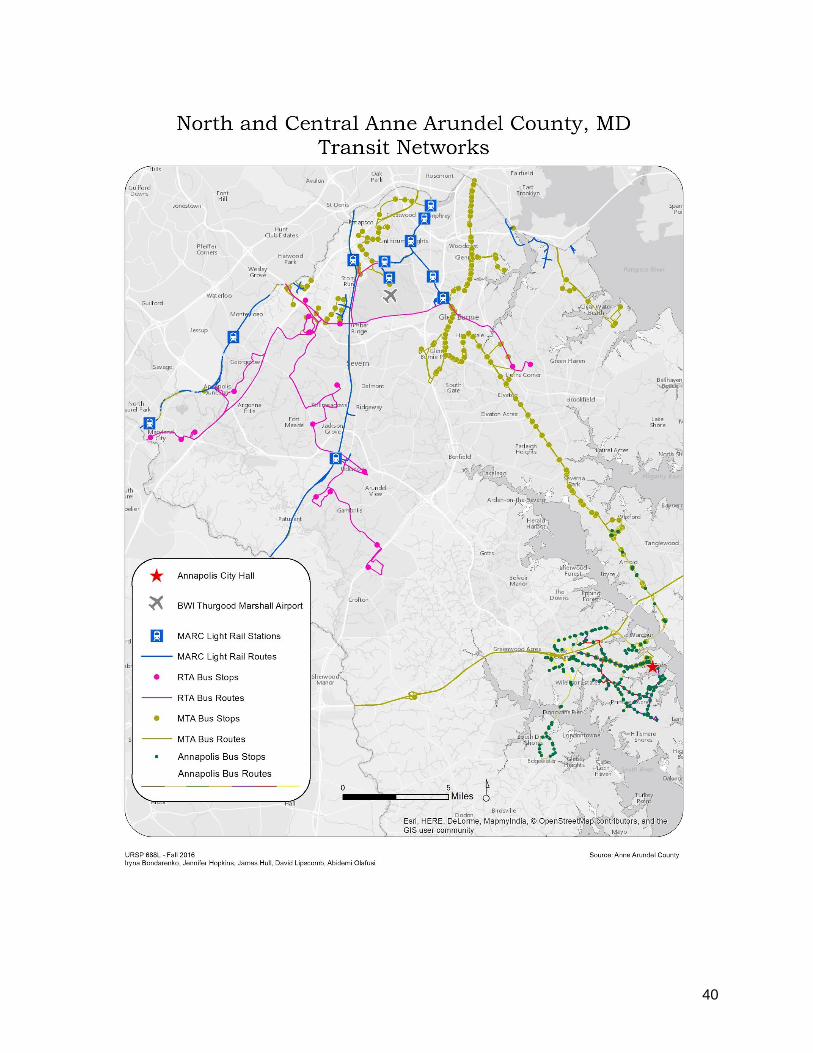
Anne Arundel County Employment Center: Linthicum Heights
The Linthicum Heights employment center is fairly well served by MTA buses and nearby MARC
rail stations. The entire area is within one mile of a transit station and substantial amounts of the
area are within quarter-mile and half-mile of transit.
20
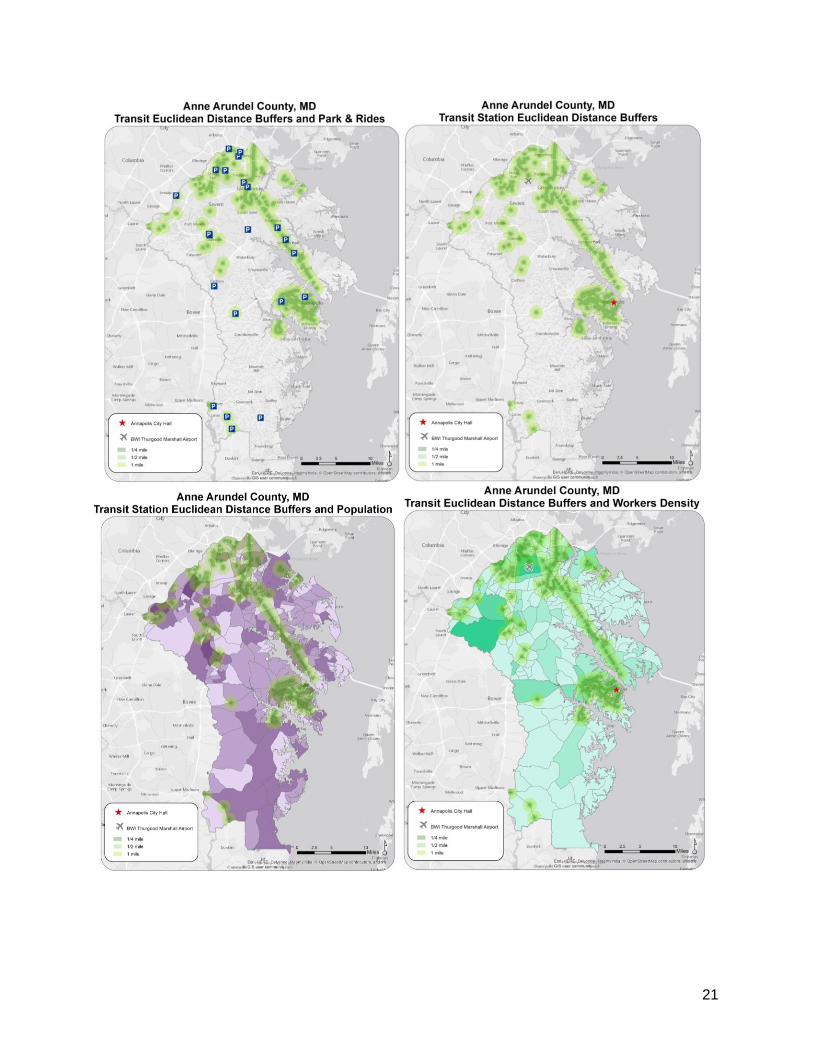
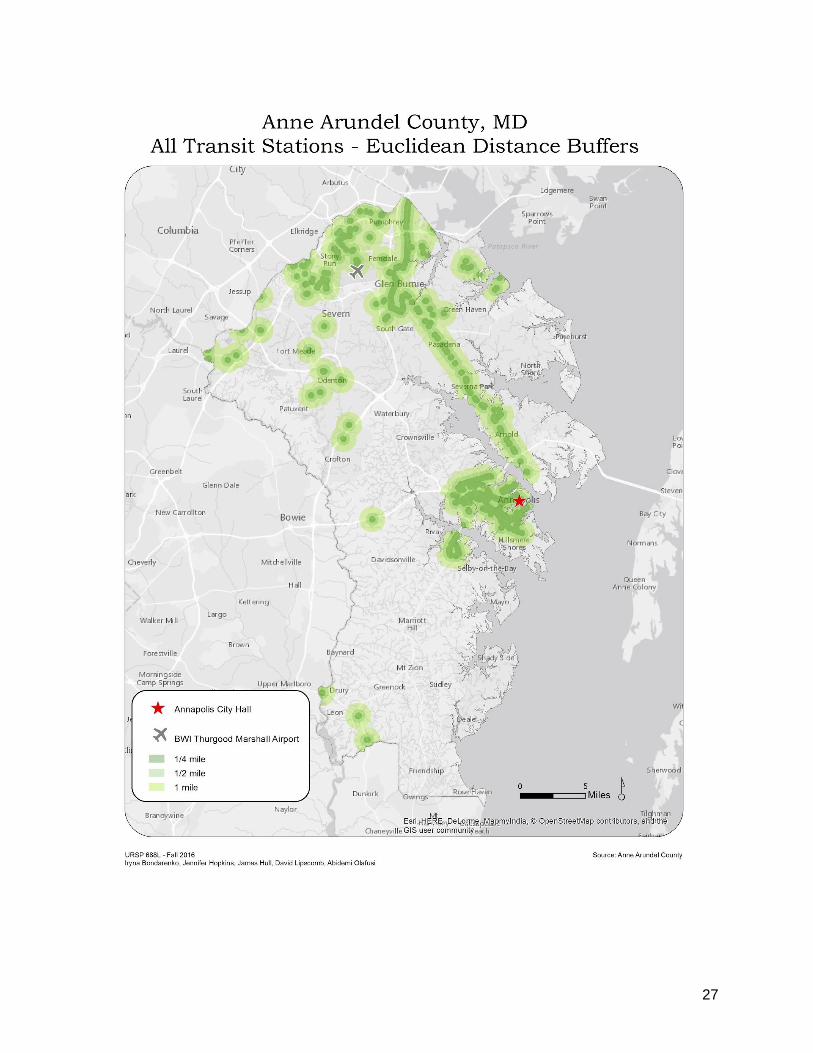
Transit Buffers Analysis
To visualize how many people in the county have pedestrian access to public transit, buffers
around bus and rail stops were created. According to research, most walking trips are no longer
than one mile.4 Maps were created showing quarter-, half- and one-mile walkable radii to public
transit stops. Of the County’s population 20% (110,822 people) live within a quarter-mile from
bus or rail stops, 42% (230,890 people) within a half-mile, and 77% (425,191 people) within one
mile of public transit. These percentages were reached using straight-line measures of distance,
which do not control for road detours and cul-de-sacs.
There are some large portions of the county with low access to public transit. These include
areas south and north of Annapolis, the southern region of the county, and central parts of the
county that fall between MTA and RTA bus transit routes. Areas with large concentrations of
workers are better covered by public transit routes. The main employment centers, Fort Meade,
Lithicum Heights, BWI, Glen Burnie, have at least one transit stop within walking distance. The
density of transit stops and routes is low in the county, which creates the problem of “last mile
access” for employers. With limited ability to reach jobs by transit, workers must use cars
instead of public transit. Furthermore, having transit access to employment centers, but not
access to residences results in poor transit connectivity, and systems cannot be used to their full
potential. Improving walkable access to transit from residences should be a focus for the County.
For further analysis, maps with these buffers are shown below.
4 Akar & Clifton, 2009, Nelson, Foley, O'gorman, Moyna & Woods, 2008
21
22
Recommendations
After a full analysis, the following recommendations were determined:
Expand the existing transit system to the southern and central portions of the county, with a
particular need in the south.
Improve existing “last mile” gaps by extending bus routes closer to main employment
centers.
Provide riders access to a consolidated transit map to assist in navigation and transit
awareness.
Improve walking access to transit stops from residences and points of interest.
Promote walking to transit stops to encourage transit use, especially for those living within a
half-mile of transit stops.
Limitations of the Analysis
Straight-line (Euclidian) distances are not completely accurate due to possible detours and
cul-de-sacs that limit or increase accessibility, depending on the situation.
Even if walkable access to a transit stop exists, proper connections, such as sidewalks, may
not be available. Such data was not available for analysis, nor did time permit such an
analysis for this report.
There is a lack of data about traffic and transit schedules and so, could not be included in the
analysis.
The maps of population and worker densities are approximations.
The land area calculations are based on each feature boundary, which includes water
features in addition to land, thus inflating the area of each feature.
The lack of data about other county transit services such as MeadeRide, limits the sharing of
transit-related data to transit users.
23
Further Research
Assess how many residents are within walkable distances from transit stops, by creating
buffers using the road network rather than straight-line measurements.
Determine number of workers in main employment centers and where they live to create
journey maps and better understand where connection gaps exist.
Analyze transit schedules to further assess transit connectivity and accessibility.
Locate potential barriers and accessibility gaps between pedestrian routes to transit to
prioritize where pedestrian routes can be improved and expanded.
Task Coordination
Iryna Bondarenko: analysis, recommendations, presentations, GIS mapping
Jennifer Hopkins: GIS mapping, AGOL functionality, application development
James Hull: analysis, lead final report, preliminary GIS mapping
David Lipscomb: analysis, recommendations, presentations, lead GIS mapping
Abidemi Olafusi: recommendations, analysis, presentations, overview of results
24
Works Cited
Akar, G., & Clifton, K. (2009). Influence of Individual Perceptions and Bicycle Infrastructure on
Decision to Bike. Transportation Research Record: Journal of the Transportation Research
Board, 2140, 165-172.
Engbers, L. H., & Hendriksen, I. J. (2010). Characteristics of a population of commuter cyclists in
the Netherlands: Perceived barriers and facilitators in the personal, social and physical
environment. Int J Behav Nutr Phys Act International Journal of Behavioral Nutrition and
Physical Activity, 7(1), 89.
Nelson, N. M., Foley, E., O'gorman, D. J., Moyna, N. M., & Woods, C. B. (2008). Active commuting
to school: How far is too far? Int J Behav Nutr Phys Act International Journal of Behavioral
Nutrition and Physical Activity, 5(1), 1.
25
Appendix
26
27
28
29
30
31
32
33
34
35
36
37
38
39
40
41
42
43
44
45
46
47
48