Embed Size (px)
Citation preview
Anne-Marie Roerink | 210 Analytics
Payments Benchmarks & Trends
September 18, 2015

NGA Antitrust Statement
The National Grocers Association is committed to complying with the antitrust laws. Therefore, to assure compliance the board of directors, members and staff must refrain from engaging in discussion that may result in antitrust violations such as agreements to fix prices or margins, allocate markets, engage in product, supplier or customer boycotts, and refusal to deal with industry members.
NGA appreciates your compliance with the law as the Board and members engage in association Board meetings, education programs and other activities to advance your competitiveness in today’s market.

Slide 3
Grocery Retailing Payments Study 2015
• Joint study between NGA and Balance Innovations• November to December fielding• Cross-section of independents
and regional chains• Report includes more detail by
sales volume, transactions and number of stores
Free copy of the report available

Slide 4
Welcome to our experts
Jim ShipleyChief Information OfficerDierbergs Markets
Shelley BoslerSVP, Alliances and MarketingBalance Innovations
Michael ThurowVP, Store SystemsHarp’s Food Stores
Slide 5
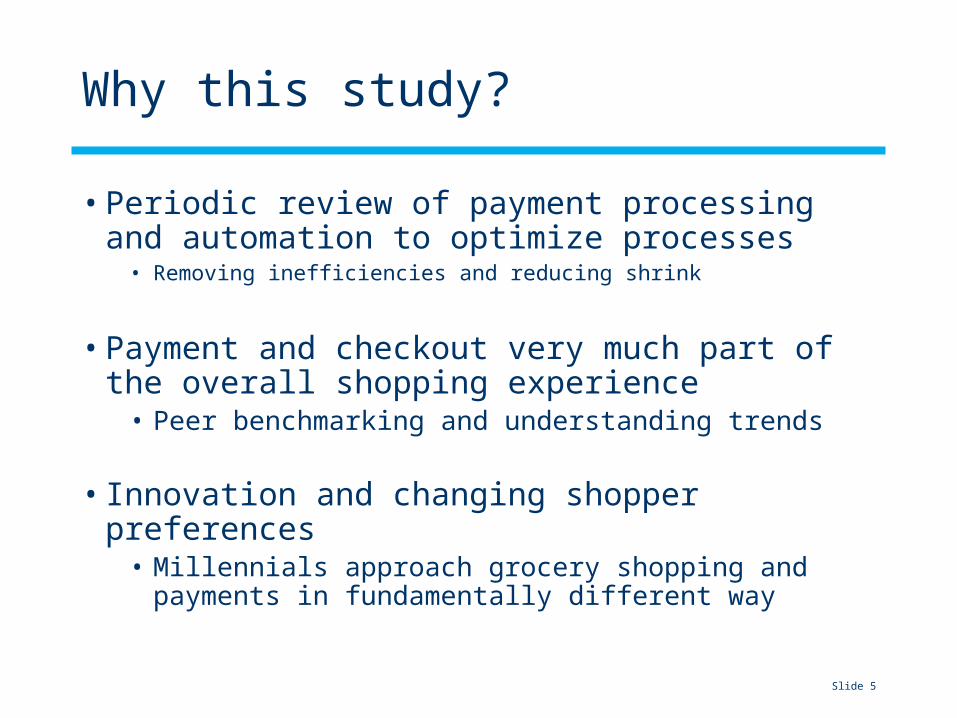
Why this study?
• Periodic review of payment processing and automation to optimize processes• Removing inefficiencies and reducing shrink
• Payment and checkout very much part of the overall shopping experience• Peer benchmarking and understanding trends
• Innovation and changing shopper preferences• Millennials approach grocery shopping and payments in
fundamentally different way
Slide 6
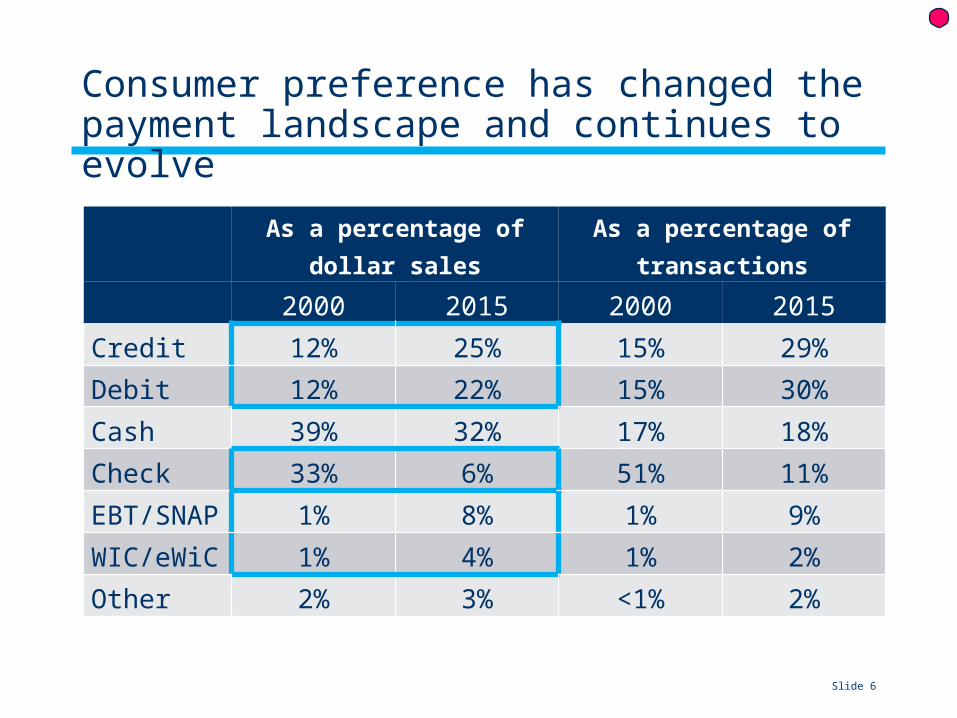
Consumer preference has changed the payment landscape and continues to evolve
As a percentage of dollar sales As a percentage of transactions
2000 2015 2000 2015Credit 12% 25% 15% 29%Debit 12% 22% 15% 30%Cash 39% 32% 17% 18%Check 33% 6% 51% 11%EBT/SNAP 1% 8% 1% 9%WIC/eWiC 1% 4% 1% 2%Other 2% 3% <1% 2%

Slide 7
Payments innovation is driving change
• EMV technology• 21% are done | 67% will meet deadline | 13% will miss deadline
• Mobile payments• Independents readying to accept mobile payments
Can accept mobile payment 24%Implementing in next year 16%Implementing in next 1-3 years 24%No plans at this time 36%
• Meanwhile, many shoppers in wait-and-see mode
80% ApplePay25% PayPal13% MCX/CurrentC36% Other

Slide 8
Shopper insight: mobile payments
• Majority of all age groups own smart phones• 11% didn’t know about mobile payments• 68% have no plans to use mobile payments anytime soon• 13% may do so later this year• 8% currently do with at least some regularity
• Mobile wallet research shows• Little gender difference• Huge age gap with 55% of users being ages 15-34• Highest usage among HH income < $50,000
and >$100,000• 40% of mobile wallet users say they use it as their primary
mode of paymentSource: Balance Innovations Consumer Poll Nielsen mobile wallet research
Slide 9
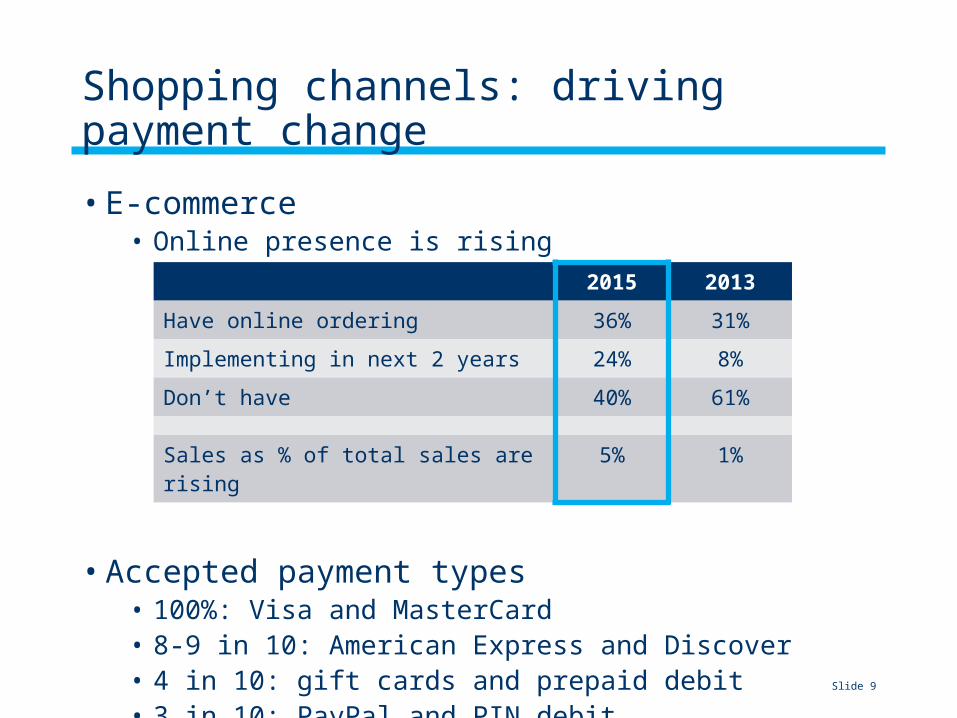
Shopping channels: driving payment change
• E-commerce• Online presence is rising
• Accepted payment types• 100%: Visa and MasterCard• 8-9 in 10: American Express and Discover• 4 in 10: gift cards and prepaid debit• 3 in 10: PayPal and PIN debit
2015 2013Have online ordering 36% 31%Implementing in next 2 years 24% 8%Don’t have 40% 61%
Sales as % of total sales are rising 5% 1%

Slide 10
Shopper insight: online shopping
• 1-2% of $600 billion food and beverage industry• Expected CAGR of 21%• Reaching $18 billion by 2018• Many different models
• Online order and third-party shipment• Online order and delivery from a distribution center
55% of online independents have home delivery• Specialty online• Online order with in-store or kiosk pickup
Source: BI Intelligence Retail Feedback Group
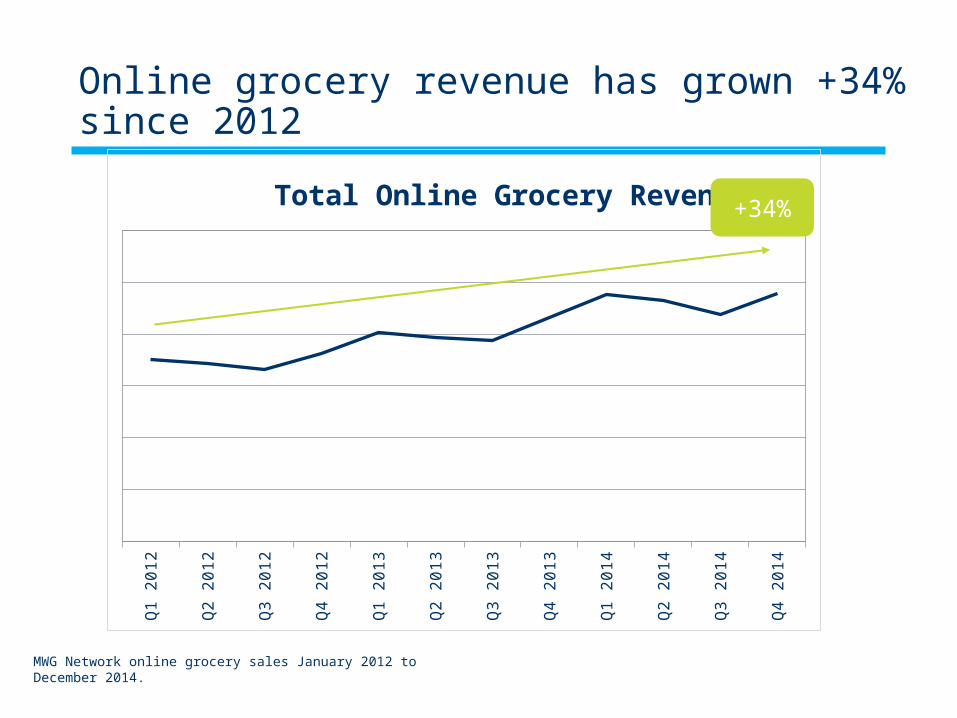
Online grocery revenue has grown +34% since 2012Q
1 2
012
Q2 2
012
Q3 2
012
Q4 2
012
Q1 2
013
Q2 2
013
Q3 2
013
Q4 2
013
Q1 2
014
Q2 2
014
Q3 2
014
Q4 2
014
Total Online Grocery Revenue+34%
MWG Network online grocery sales January 2012 to December 2014.
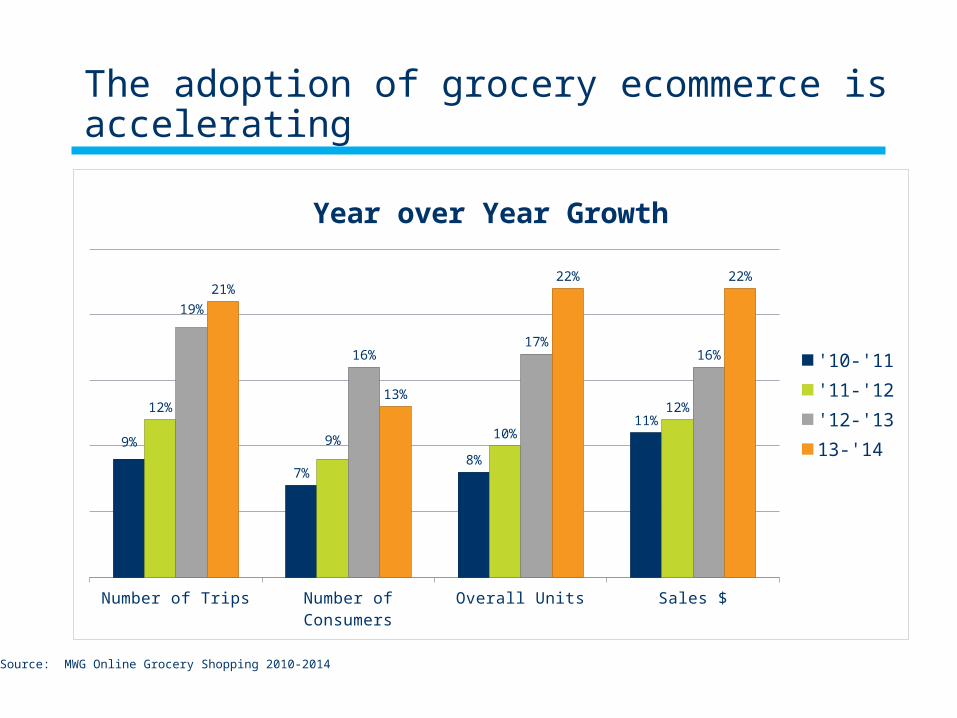
The adoption of grocery ecommerce is accelerating
Number of Trips Number of Consumers
Overall Units Sales $
9%
7%8%
11%12%
9% 10%
12%
19%
16%17%
16%
21%
13%
22% 22%
Year over Year Growth
'10-'11'11-'12'12-'1313-'14
Source: MWG Online Grocery Shopping 2010-2014
Slide 13
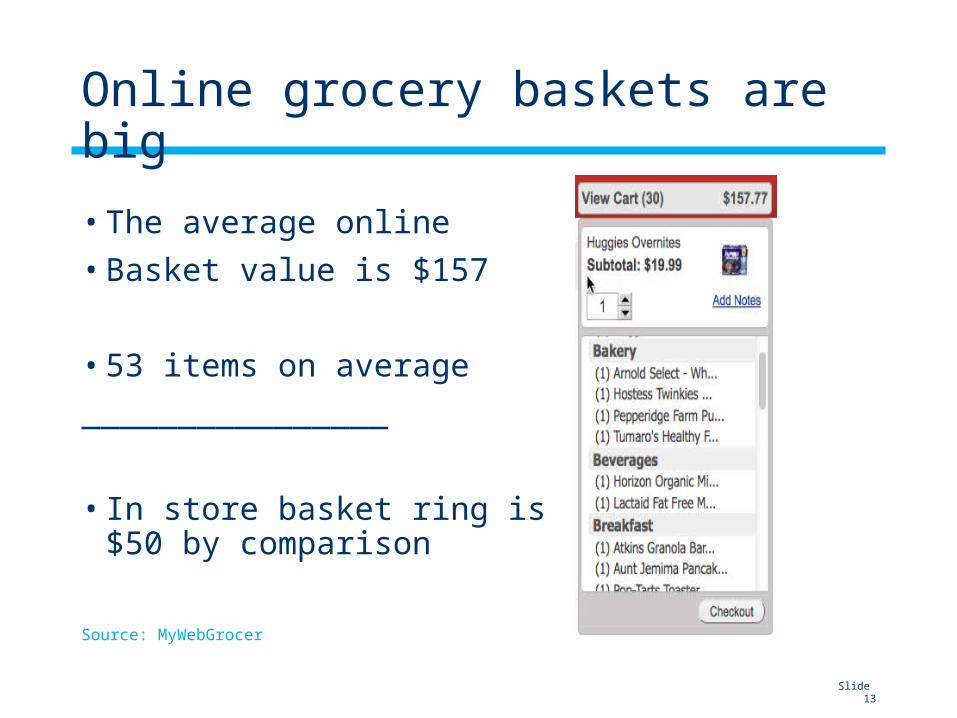
Online grocery baskets are big
• The average online• Basket value is $157
• 53 items on average________________
• In store basket ring is $50 by comparison
Source: MyWebGrocer
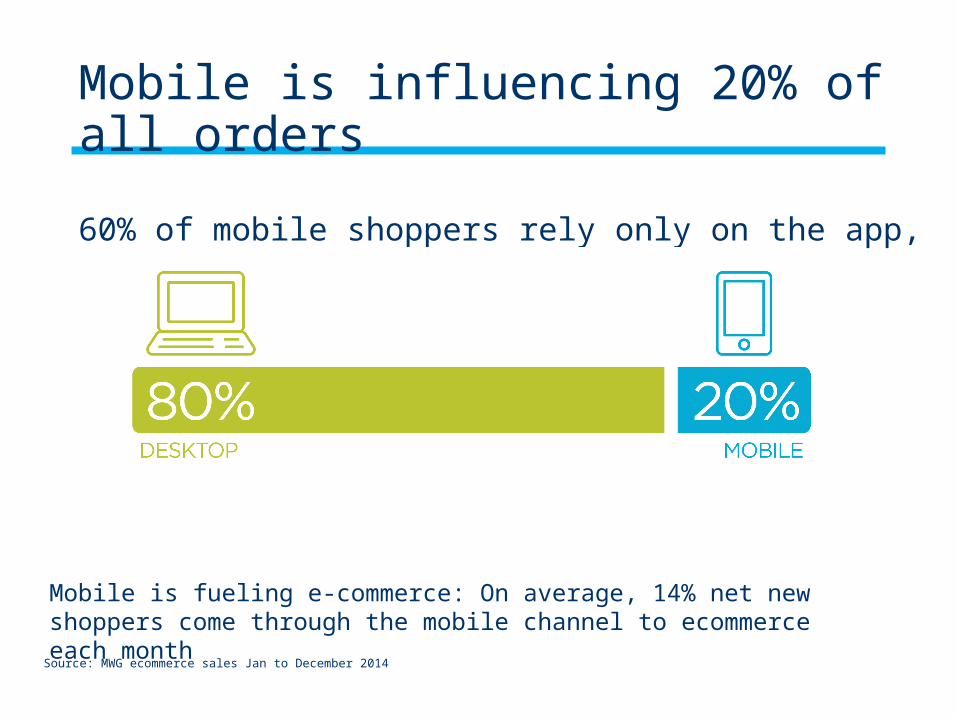
Source: MWG ecommerce sales Jan to December 2014
Mobile is fueling e-commerce: On average, 14% net new shoppers come through the mobile channel to ecommerce each month
Mobile is influencing 20% of all orders
60% of mobile shoppers rely only on the app, while 40% used desktop and app
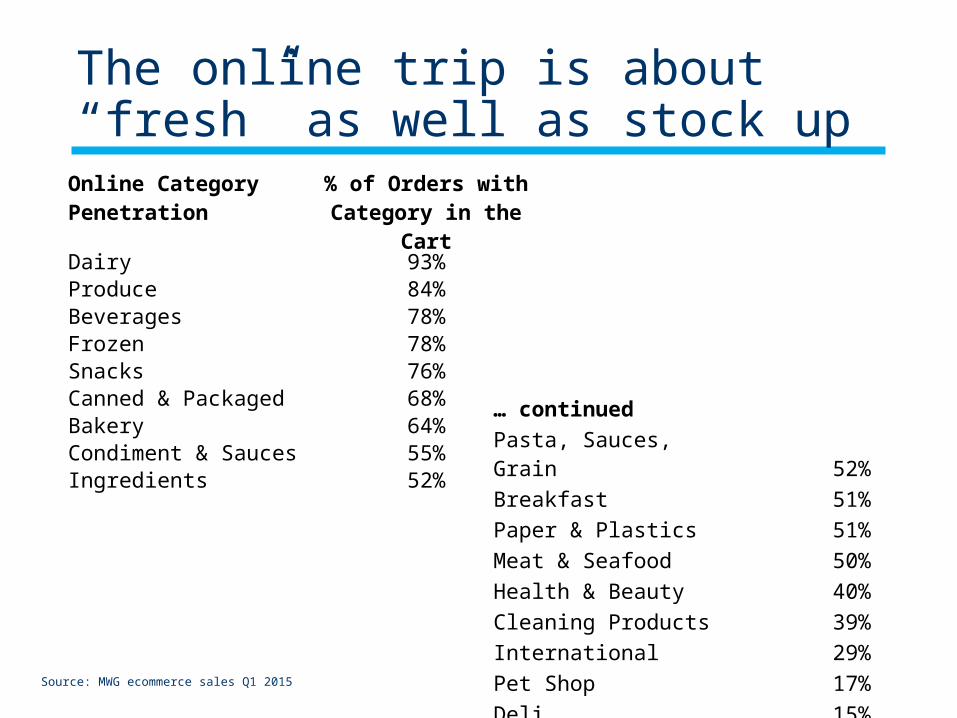
The online trip is about “fresh” as well as stock up
… continuedPasta, Sauces, Grain 52%Breakfast 51%Paper & Plastics 51%Meat & Seafood 50%Health & Beauty 40%Cleaning Products 39%International 29%Pet Shop 17%Deli 15%Baby Store 12%Source: MWG ecommerce sales Q1 2015
Online Category Penetration % of Orders with Category in the Cart
Dairy 93%Produce 84%Beverages 78%Frozen 78%Snacks 76%Canned & Packaged 68%Bakery 64%Condiment & Sauces 55%Ingredients 52%
Slide 16
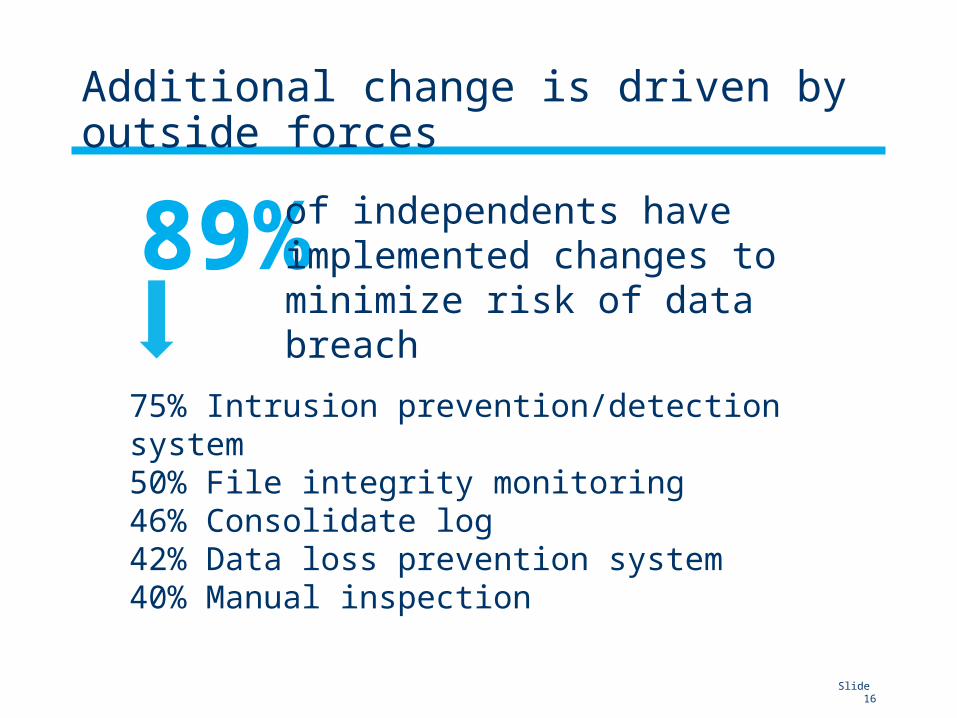
Additional change is driven by outside forces
89% of independents have implemented changes to minimize risk of data breach
75% Intrusion prevention/detection system50% File integrity monitoring46% Consolidate log42% Data loss prevention system40% Manual inspection
Slide 17
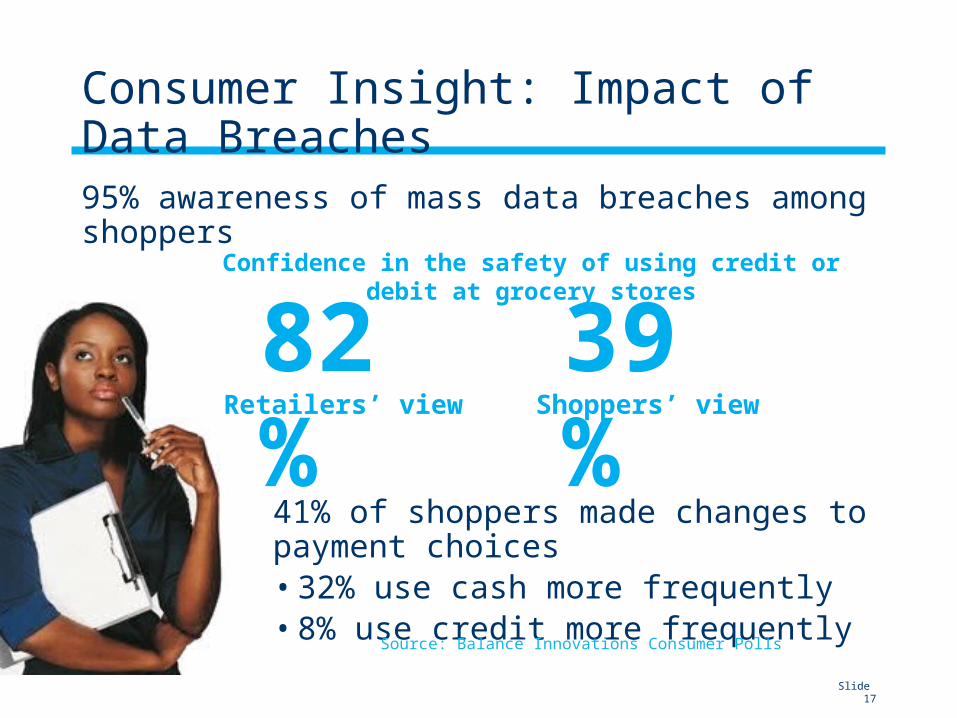
Consumer Insight: Impact of Data Breaches
95% awareness of mass data breaches among shoppers
41% of shoppers made changes to payment choices• 32% use cash more frequently• 8% use credit more frequently
Confidence in the safety of using credit or debit at grocery stores
82%Retailers’ view
39%Shoppers’ view
Source: Balance Innovations Consumer Polls

Slide 18
Incident Response Plans
• PR/customer outreach plan
In place: 38%Working on it 25%Don’t have 37%
• Consider development/review incident response plans• Cross-functional response team and involving law enforcement• Preserving evidence of the breach and securing IT systems• Breach notification letters• Credit monitoring and notification• Press release and FAQs
Slide 19
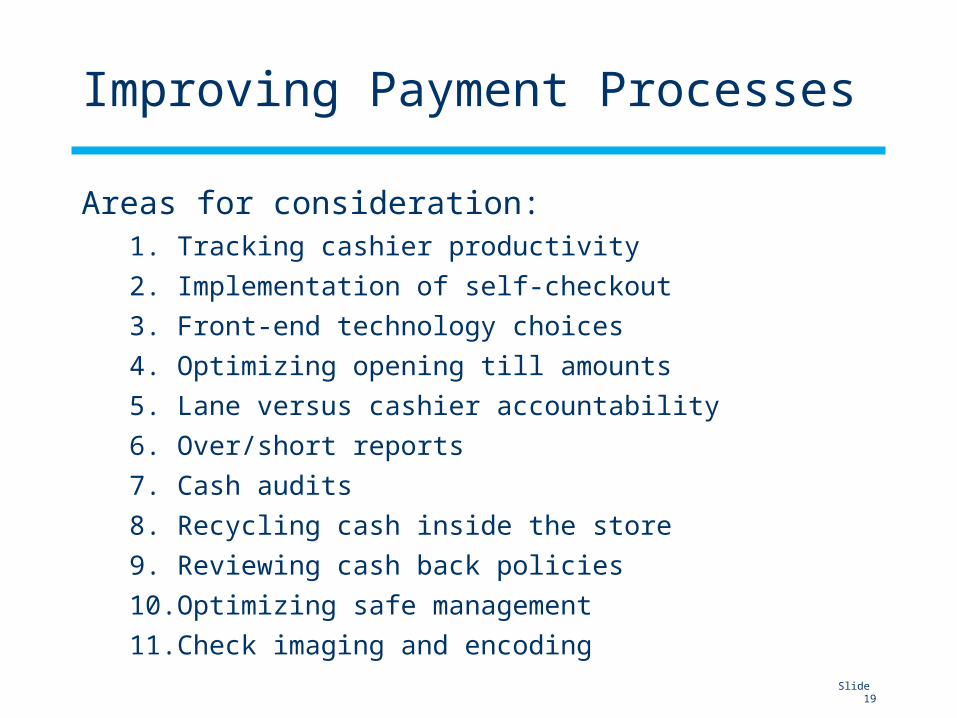
Improving Payment Processes
Areas for consideration:1. Tracking cashier productivity2. Implementation of self-checkout3. Front-end technology choices4. Optimizing opening till amounts5. Lane versus cashier accountability6. Over/short reports7. Cash audits8. Recycling cash inside the store9. Reviewing cash back policies10. Optimizing safe management11. Check imaging and encoding
Slide 20
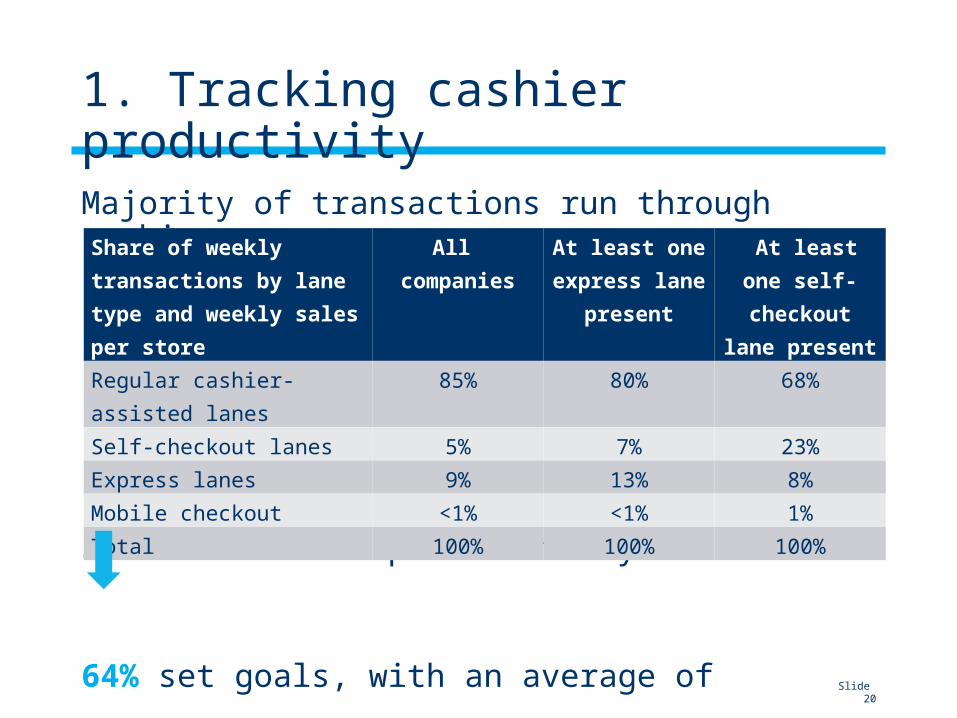
1. Tracking cashier productivity
Majority of transactions run through cashiers
52% track scans per minute by cashier
64% set goals, with an average of 20/minute
Share of weekly transactions by lane type and weekly sales per store
All companies
At least one express lane
present
At least one self- checkout lane
presentRegular cashier-assisted lanes 85% 80% 68%Self-checkout lanes 5% 7% 23%Express lanes 9% 13% 8%Mobile checkout <1% <1% 1%Total 100% 100% 100%

Slide 21
2. Implementing self-checkout
• 78% of independent grocers have self-checkout• Up from 66% in 2013• More prevalent among mid- and higher-volume stores• If present, average of four lanes• 56% no changes; 22% add lanes and 22% plan to reduce/eliminate
• Counting self-checkout lanes less frequently than regular tills• 44% daily and another 44% weekly• Higher-volume stores often start with higher amounts and count
less frequently
• Replenishing done daily or every few days

Slide 22
Shopper Insight: Cashiered Lanes
Prime drivers of satisfactory grocery trip:1. Value for money2. Good checkout experience:
- Friendly cashiers - Speedy checkout
Self-checkout use varies by demographic and trip mission
Weighing cost savings vs. the human touch
said cashiers positively influenced their trip
65%
Source: Retail Feedback Group
Slide 23
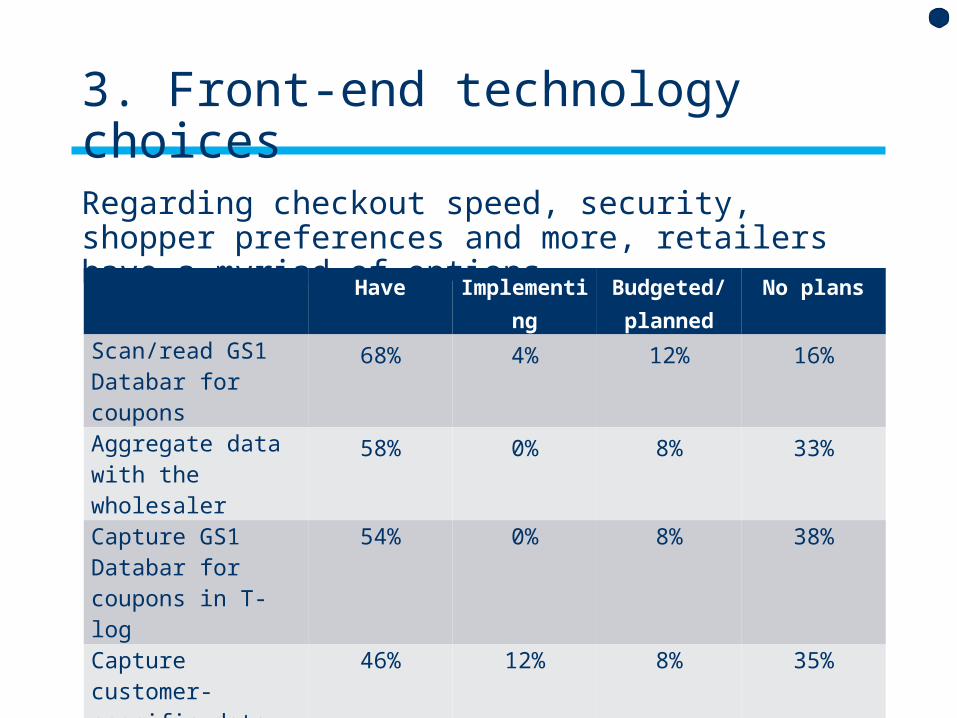
3. Front-end technology choices
Regarding checkout speed, security, shopper preferences and more, retailers have a myriad of options
Have Implementing Budgeted/planned
No plans
Scan/read GS1 Databar for coupons
68% 4% 12% 16%
Aggregate data with the wholesaler
58% 0% 8% 33%
Capture GS1 Databar for coupons in T-log
54% 0% 8% 38%
Capture customer-specific data
46% 12% 8% 35%
Electronic check conversion
42% 4% 12% 42%
Coin dispensers 19% 0% 0% 81%Smart safes 4% 0% 7% 89%

Slide 24
4. Optimizing opening till amounts
• Best practices relative to the opening till amount vary widely based on:• Sales and transactions per store per week• Lane versus cashier accountability• Cash back policies• Check cashing
• Averages• Cashier lanes: $228• Self-checkout: $1,760• Service desk: $450

Slide 25
Opening amount and drawer management practices affect operations
• Independent grocers count average of 11 drawers/day• Ranges from 5-25• For most, this means drawers are counted multiple times per day
• Average number of loans and pickups: 16• Ranges from 0-58
• Daily balance takes 2-3 hours
• Areas of consideration• Track/benchmark time for counting drawers• Optimize the opening amount to minimize loans and pickups and
simplify daily balance
Slide 26
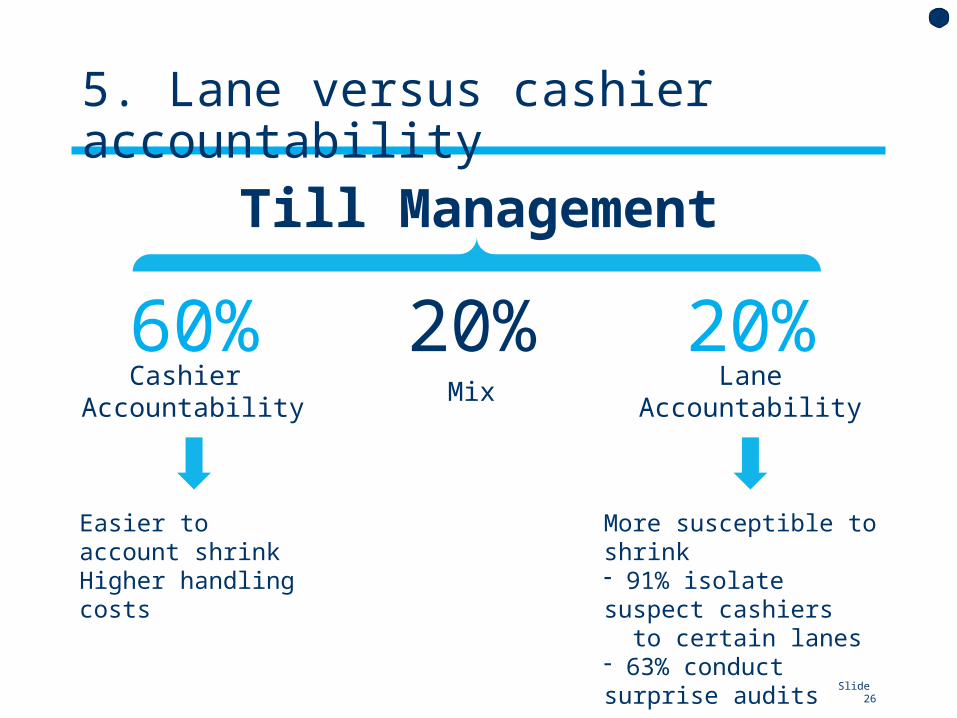
5. Lane versus cashier accountability
Till Management
20%Mix
60%Cashier
Accountability
20%Lane
Accountability
Easier to account shrinkHigher handling costs
More susceptible to shrink- 91% isolate suspect cashiers to certain lanes- 63% conduct surprise audits

Slide 27
6. Over/short reports
59% have automated over/short reports
Slide 28
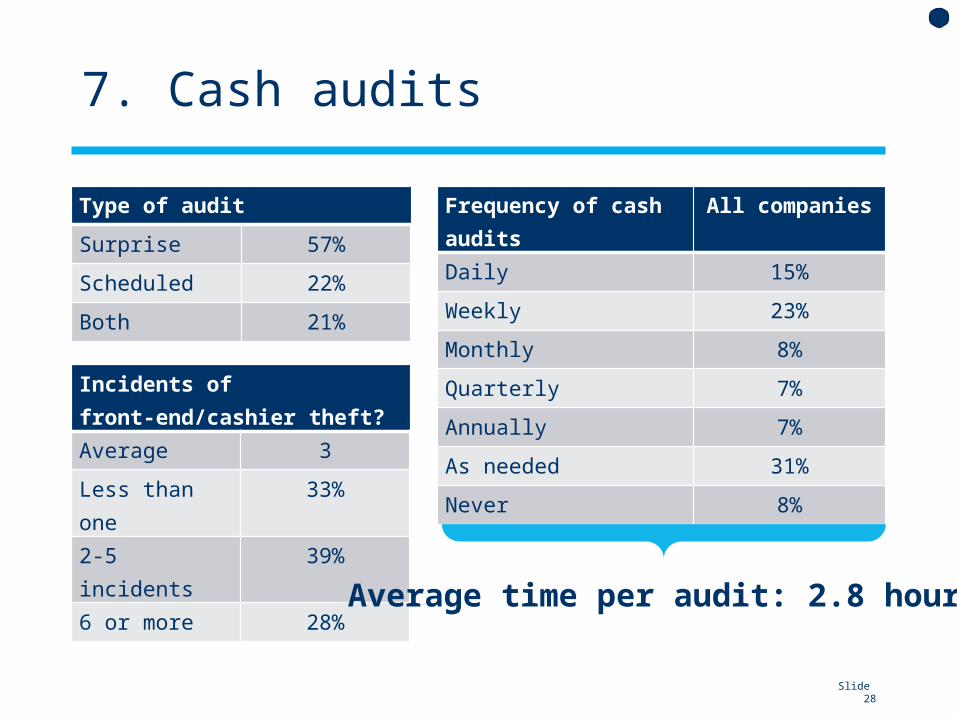
7. Cash audits
Type of audit
Surprise 57%
Scheduled 22%
Both 21%
Incidents of front-end/cashier theft?
Average 3
Less than one 33%
2-5 incidents 39%
6 or more 28%
Frequency of cash audits All companies
Daily 15%
Weekly 23%
Monthly 8%
Quarterly 7%
Annually 7%
As needed 31%
Never 8%
Average time per audit: 2.8 hours
Slide 29
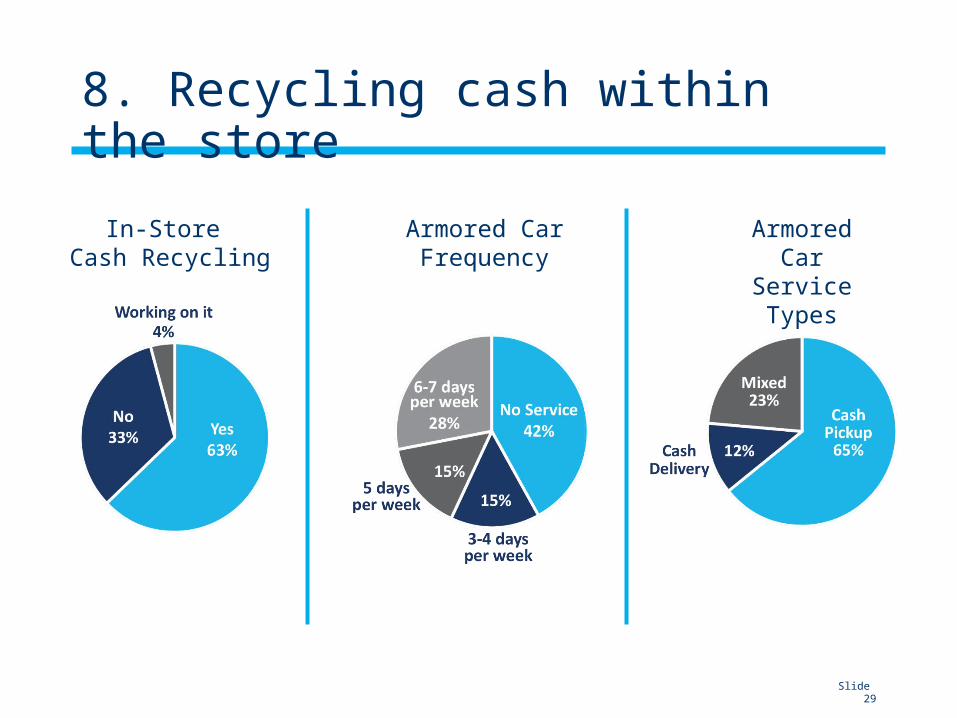
8. Recycling cash within the store
In-Store Cash Recycling
Armored Car Frequency
Armored Car Service Types
Slide 30
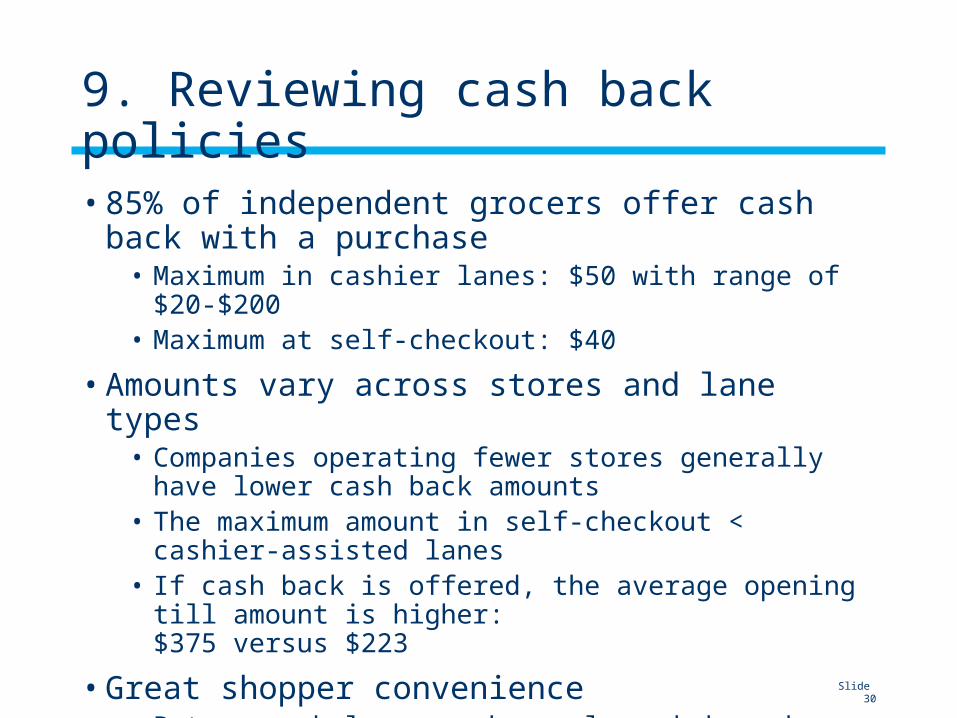
9. Reviewing cash back policies
• 85% of independent grocers offer cash back with a purchase• Maximum in cashier lanes: $50 with range of $20-$200• Maximum at self-checkout: $40
• Amounts vary across stores and lane types• Companies operating fewer stores generally have lower cash back
amounts• The maximum amount in self-checkout < cashier-assisted lanes• If cash back is offered, the average opening till amount is higher:
$375 versus $223
• Great shopper convenience• But can unbalance cash supply and demand
Slide 31
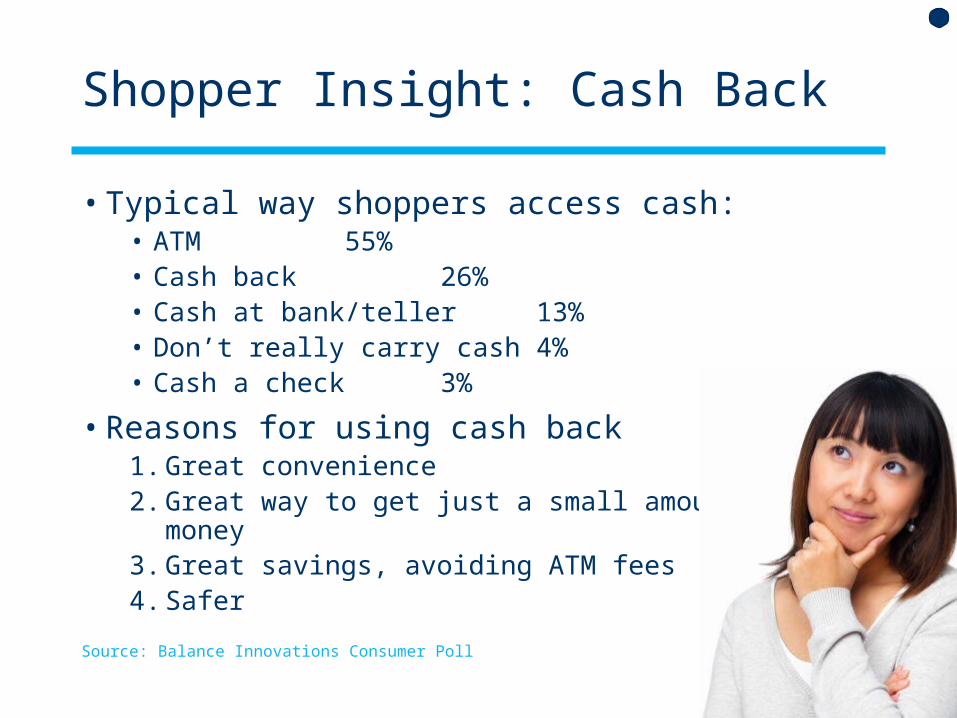
Shopper Insight: Cash Back
• Typical way shoppers access cash:• ATM 55%• Cash back 26%• Cash at bank/teller 13%• Don’t really carry cash 4%• Cash a check 3%
• Reasons for using cash back1. Great convenience2. Great way to get just a small amount of money3. Great savings, avoiding ATM fees4. Safer
Source: Balance Innovations Consumer Poll

Slide 32
10. Optimizing safe management
Down from 12% in 2013, 4% do not have set maximums for the amount held in the store’s safe.
• Average: $25,000• Range: $2,000-$80,000
• As % of weekly sales/store: 10%

Slide 33
11. Check imaging and encoding
• Checks are decreasing as a form of payment, but continue to generate the highest basket ring• Check volume at
independent grocersAverage
per monthAverage amount
Personal checks 1,003 $74
WIC 369 $22
Payroll 100 $256 *
*accepted by 63%
Slide 34
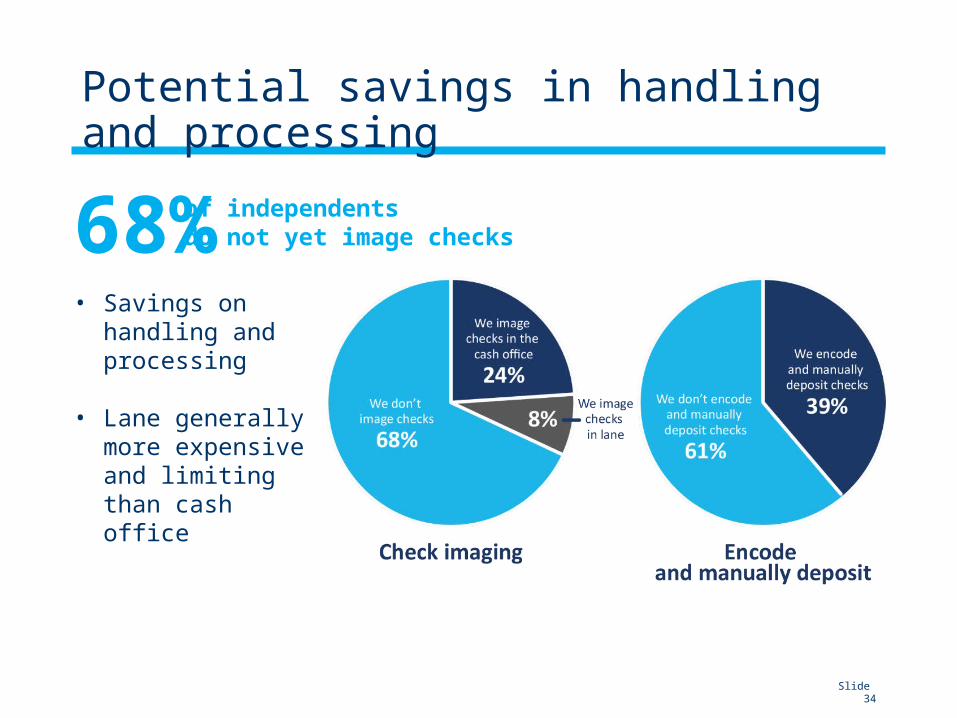
Potential savings in handling and processing
68% of independents do not yet image checks
• Savings on handling and processing
• Lane generally more expensive and limiting than cash office
Slide 35
Conclusions
• Payment landscape is changing• Consumer preferences• Innovation• Outside forces
• Wide range of cost components when handling payments• Efficient cash operations can reduce shrink, improve accuracy,
reduce labor costs and improve productivity• Benchmarks help identify and quantify areas for more streamlined
operations and cost cutting when processing payments• Gathering accurate data is the first step in identifying and
improving inefficient processes
Slide 36
Questions and copy of the presentation or report
• Janette at [email protected] • Anne-Marie at [email protected]
Free copy of the report available


![Benchmarks - May, 2011 | Benchmarks Onlineit.unt.edu/sites/default/files/benchmarks-05-2011.pdf · Benchmarks - May, 2011 | Benchmarks Online 4/28/16, 9:13:42 AM] By Patrick McLoud,](https://img.pdfslide.net/doc/110x75/5fe545814aa19825752e7bae/benchmarks-may-2011-benchmarks-benchmarks-may-2011-benchmarks-online-42816.jpg)