Embed Size (px)
Citation preview

Annex 1 Evaluation of test measurement techniques for NOX
CONTENTS
A1.1 Introduction and objectives of Task 1 .......2
A1.2 Methodology using 4-gas analysers ..........3 A1.2.1 TEST PROCEDURE AND MEASUREMENT PARAMETERS.............. 3 A1.2.2 VEHICLES TESTED.............................................................. 3 A1.2.3 TEST ARRANGEMENT .......................................................... 5
A1.3 Results ......................................................7 A1.3.1 VERIFICATION OF BASIC TEST CONCEPT............................... 7 A1.3.2 USE OF EXHAUST FLOW ...................................................... 8 A1.3.3 IDLE TEST ........................................................................13 A1.3.4 THE EFFECT OF FAILED EGR UNITS ON EMISSIONS OVER THE TYPE 1 TEST ..................................................................................17 A1.3.5 PROPORTION OF THE CURRENT DIESEL FLEET TESTED...........18 A1.3.6 PRIORISATION OF OPTIONS FOR A PRACTICAL TEST..............19
A1.4 Use of thermometry to check EGR functionality .....................................................24
A1.4.1 OBJECTIVE AND GENERAL METHODOLOGY............................24 A1.4.2 ASSESSMENT OF APPROACH...............................................25
A1.4.2.1 Vehicle 2 ...................................................................25 A1.4.2.2 Vehicle 6 ...................................................................25 A1.4.2.3 Vehicle 9 ...................................................................26
A1.4.3 GENERAL APPLICABILITY....................................................28 A1.4.4 CONCLUSIONS, DISCUSSION AND RECOMMENDATIONS.........30
A1.5 Conclusions and recommendations .........31 A1.5.1 CONCLUSIONS..................................................................31
A1.5.1.1 Assessment of approach using 4-gas analysers ...............31 A1.5.1.2 Assessment of approach using thermometry ...................32
A1.5.2 RECOMMENDATIONS .........................................................32
netcen
UNCLASSIFIED Low Emission Diesel Research – Phase 3 Report AEAT/ENV/R/1873 Issue 1 Annex 1 – Measurement techniques for NOX
A1.1 Introduction and objectives of Task 1
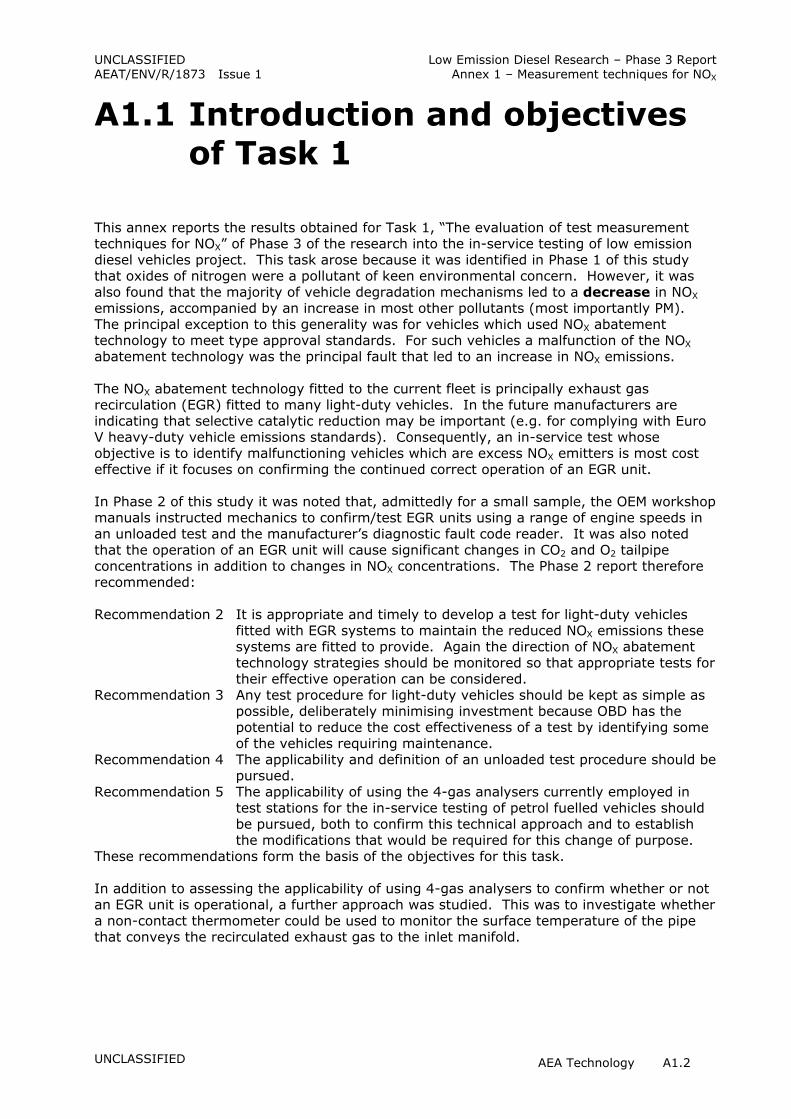
This annex reports the results obtained for Task 1, “The evaluation of test measurement techniques for NOX” of Phase 3 of the research into the in-service testing of low emission diesel vehicles project. This task arose because it was identified in Phase 1 of this study that oxides of nitrogen were a pollutant of keen environmental concern. However, it was also found that the majority of vehicle degradation mechanisms led to a decrease in NOX
emissions, accompanied by an increase in most other pollutants (most importantly PM). The principal exception to this generality was for vehicles which used NOX abatement technology to meet type approval standards. For such vehicles a malfunction of the NOX
abatement technology was the principal fault that led to an increase in NOX emissions.
The NOX abatement technology fitted to the current fleet is principally exhaust gas recirculation (EGR) fitted to many light-duty vehicles. In the future manufacturers are indicating that selective catalytic reduction may be important (e.g. for complying with Euro V heavy-duty vehicle emissions standards). Consequently, an in-service test whose objective is to identify malfunctioning vehicles which are excess NOX emitters is most cost effective if it focuses on confirming the continued correct operation of an EGR unit.
In Phase 2 of this study it was noted that, admittedly for a small sample, the OEM workshop manuals instructed mechanics to confirm/test EGR units using a range of engine speeds in an unloaded test and the manufacturer’s diagnostic fault code reader. It was also noted that the operation of an EGR unit will cause significant changes in CO2 and O2 tailpipe concentrations in addition to changes in NOX concentrations. The Phase 2 report therefore recommended:
Recommendation 2 It is appropriate and timely to develop a test for light-duty vehicles fitted with EGR systems to maintain the reduced NOX emissions these systems are fitted to provide. Again the direction of NOX abatement technology strategies should be monitored so that appropriate tests for their effective operation can be considered.
Recommendation 3 Any test procedure for light-duty vehicles should be kept as simple as possible, deliberately minimising investment because OBD has the potential to reduce the cost effectiveness of a test by identifying some of the vehicles requiring maintenance.
Recommendation 4 The applicability and definition of an unloaded test procedure should be pursued.
Recommendation 5 The applicability of using the 4-gas analysers currently employed in test stations for the in-service testing of petrol fuelled vehicles should be pursued, both to confirm this technical approach and to establish the modifications that would be required for this change of purpose.
These recommendations form the basis of the objectives for this task.
In addition to assessing the applicability of using 4-gas analysers to confirm whether or not an EGR unit is operational, a further approach was studied. This was to investigate whether a non-contact thermometer could be used to monitor the surface temperature of the pipe that conveys the recirculated exhaust gas to the inlet manifold.
UNCLASSIFIED AEA Technology A1.2
UNCLASSIFIED Low Emission Diesel Research – Phase 3 Report AEAT/ENV/R/1873 Issue 1 Annex 1 – Measurement techniques for NOX
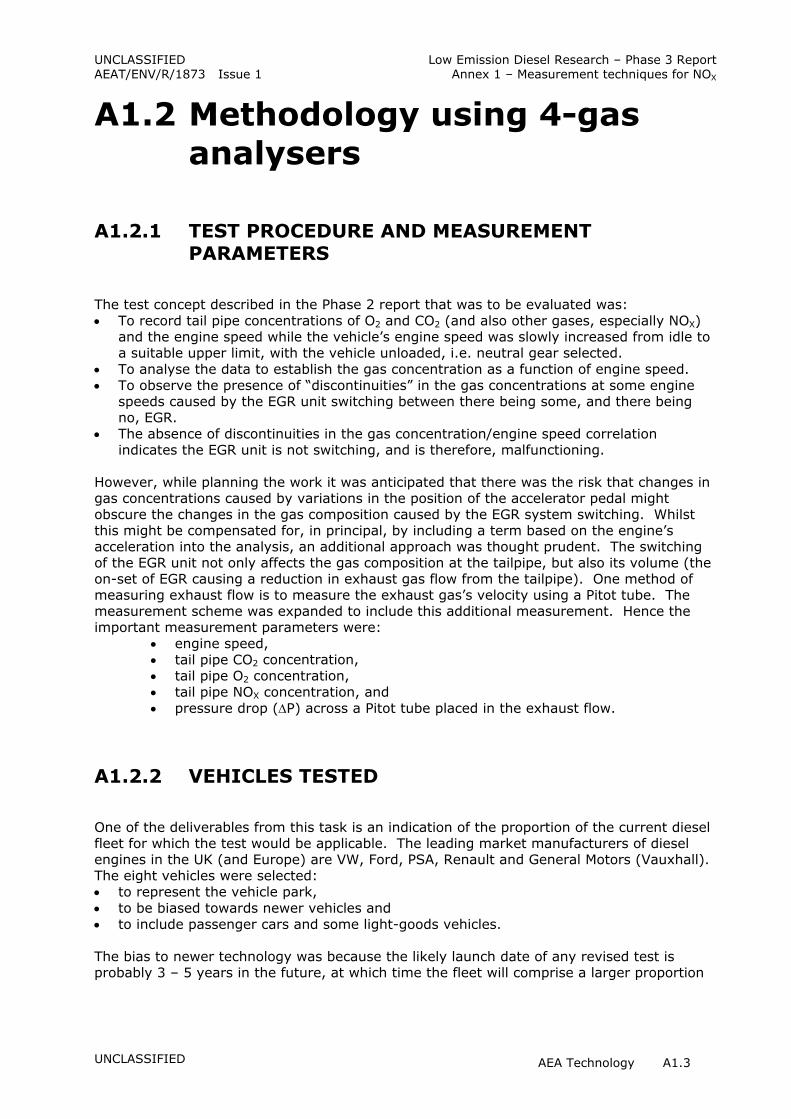
A1.2 Methodology using 4-gas analysers
A1.2.1 TEST PROCEDURE AND MEASUREMENT PARAMETERS
The test concept described in the Phase 2 report that was to be evaluated was: • To record tail pipe concentrations of O2 and CO2 (and also other gases, especially NOX)
and the engine speed while the vehicle’s engine speed was slowly increased from idle to a suitable upper limit, with the vehicle unloaded, i.e. neutral gear selected.
• To analyse the data to establish the gas concentration as a function of engine speed. • To observe the presence of “discontinuities” in the gas concentrations at some engine
speeds caused by the EGR unit switching between there being some, and there being no, EGR.
• The absence of discontinuities in the gas concentration/engine speed correlation indicates the EGR unit is not switching, and is therefore, malfunctioning.
However, while planning the work it was anticipated that there was the risk that changes in gas concentrations caused by variations in the position of the accelerator pedal might obscure the changes in the gas composition caused by the EGR system switching. Whilst this might be compensated for, in principal, by including a term based on the engine’s acceleration into the analysis, an additional approach was thought prudent. The switching of the EGR unit not only affects the gas composition at the tailpipe, but also its volume (the on-set of EGR causing a reduction in exhaust gas flow from the tailpipe). One method of measuring exhaust flow is to measure the exhaust gas’s velocity using a Pitot tube. The measurement scheme was expanded to include this additional measurement. Hence the important measurement parameters were:
• engine speed, • tail pipe CO2 concentration, • tail pipe O2 concentration, • tail pipe NOX concentration, and • pressure drop (∆P) across a Pitot tube placed in the exhaust flow.
A1.2.2 VEHICLES TESTED
One of the deliverables from this task is an indication of the proportion of the current diesel fleet for which the test would be applicable. The leading market manufacturers of diesel engines in the UK (and Europe) are VW, Ford, PSA, Renault and General Motors (Vauxhall). The eight vehicles were selected: • to represent the vehicle park, • to be biased towards newer vehicles and • to include passenger cars and some light-goods vehicles.
The bias to newer technology was because the likely launch date of any revised test is probably 3 – 5 years in the future, at which time the fleet will comprise a larger proportion
UNCLASSIFIED AEA Technology A1.3

UNCLASSIFIED Low Emission Diesel Research – Phase 3 Report AEAT/ENV/R/1873 Issue 1 Annex 1 – Measurement techniques for NOX
of what are currently the more modern vehicles than engines that are currently 5 or more years old. Hence fading technologies (e.g. IDI engines) were deliberately ignored.
In addition, one vehicle was selected because we became aware it possibly had a faulty EGR unit (failed through normal wear and tear) and it was therefore an obvious choice to test in its “as presented” (i.e. malfunctioning) state, and after it had been repaired.
The vehicles tested, and some of their key characteristics, are Vehicles 1 – 8 as listed in Table A1.1.
Table A1.1 Summary of vehicles tested
Vehicle Year of manufacture
Mileage Engine Comments
Vehicle 1, passenger car
1998 10,750 1.8 litre Di with turbo oxycat and EGR
Euro II spec
Vehicle 2, passenger car
2003 18,700 2.0 litre Di common rail with turbo, oxycat and EGR
Euro III spec
Vehicle 3, passenger car
1996 150,000 2.0 litre Di with turbo and EGR
Euro I spec
Vehicle 4, passenger car
2003 8,000 1.9 litre Di common rail with turbo, oxycat and EGR
Euro III spec
Vehicle 5, commercial van
2002 29,000 2.4 litre common rail with turbo, oxycat and EGR
Euro III spec
Vehicle 6, large passenger car
2003 6,000 2.7 litre common rail with turbo, oxycat and EGR
Euro III spec
Vehicle 7, passenger car
2003 7,650 2.2 litre common rail with turbo, oxycat and EGR
Euro III spec
Vehicle 8, passenger car
2003 1,300 2.0 litre common rail with turbo, oxycat and EGR
Euro III spec
Vehicle 9, passenger car
1998 1.9 litre, turbocharged with oxycat and EGR
Euro II spec
Vehicle 10, passenger car
late 2003 1.9 litre, turbocharged with oxycat and EGR
Euro III spec
Vehicle 11, small van
late 2004 1.9 litre, non-turbocharged with oxycat and cooled EGR
Euro III spec
Vehicle 12, passenger car
late 2002 2.0 litre, turbocharged with oxycat and cooled EGR
Euro III spec
Vehicle 13, passenger car
2004 1.9 litre, turbocharged with oxycat and EGR
Euro III spec
Vehicle 14, small MPV
2004 2.0 litre, turbocharged with oxycat and EGR
Euro III spec
Vehicle 15, pick-up truck
2004 2.5 litre turbocharged with oxycat and EGR
Euro III spec
Vehicle 16, passenger car
late 2004 1.9 litre, turbocharged with oxycat and EGR
Euro IV spec
UNCLASSIFIED AEA Technology A1.4

UNCLASSIFIED Low Emission Diesel Research – Phase 3 Report AEAT/ENV/R/1873 Issue 1 Annex 1 – Measurement techniques for NOX
A1.2.3 TEST ARRANGEMENT
The basic test configuration is shown schematically in Figure A1.1. The exhaust gas analyser rack used was a Horiba Mexa 7100 DEGR system. This is part of a test cell containing a light-duty transient engine dynamometer, and is logged using the cell’s data logging computer. Vehicles were tested by drawing some of their exhaust gases into the heated sampling lines of the Horiba system, which was physically moved so that the end of the sample line was at the external door of the cell.
Engine test cell
control and data logging system
Horiba Mexa 7100 EGR gas analysis
rack
Portable data
logging system
Synchronisation pulses
Engine speed meter
Differential pressure meter
Engine speed signal
Engine oil temperature
Exhaust temperature Peto tube
Exhaust gases
Figure A1.1 Test configuration for measuring gas concentrations to assess EGR operation
It was not easy to either rewire the Horiba system so that it could be logged by the portable data logger, nor to log the four channels recorded by the portable data logger using the engine test cell logging system. The compromise was to use the two data logging systems in parallel, with a common “digital” signal going to both systems which was used to provide synchronisation pulses.
Another pre-requisite of the methodology was the measurement of engine speed. Two approaches were used during the investigation. 1. Using a piezo-electric pressure transducer to detect pressure pulses in the pipes carrying
the high pressure fuel to the cylinders. 2. Using an electrical current transducer to detect the pulses of current used to drive the
electronically controlled fuel injectors.
The former requires: • access to the pipes carrying the high pressure fuel, • very clean pipes of the correct diameter,
UNCLASSIFIED AEA Technology A1.5

UNCLASSIFIED Low Emission Diesel Research – Phase 3 Report AEAT/ENV/R/1873 Issue 1 Annex 1 – Measurement techniques for NOX
• a section (e.g. at least 30 mm) of straight pipe onto which the transducer can be attached.
In practice, these requirements were often difficult to achieve, and the resultant engine speed data were (very) noisy and required editing/tidying before they could be used to generate gas concentration (or Pitot tube pressure)/engine speed correlations. This type of transducer is the only type that works on vehicles with rotary fuel pumps.
Many modern diesel vehicles use electronically controlled fuel injectors to determine when, and for how long, fuel is injected from a common rail into the cylinders. Six of the eight vehicles tested were of this type. For these vehicles the current pulses used to control fuel injection could be used to measure engine speed. In addition to poor accessibility for many engines, one further complication is that some vehicles use multiple injections per firing, and so an appropriate scalar divisor is required to give the correct engine speed.
UNCLASSIFIED AEA Technology A1.6

UNCLASSIFIED Low Emission Diesel Research – Phase 3 Report AEAT/ENV/R/1873 Issue 1 Annex 1 – Measurement techniques for NOX
A1.3 Results
A1.3.1 VERIFICATION OF BASIC TEST CONCEPT
The basic test concept was to record tail pipe concentrations of O2 and CO2 and the engine speed while the vehicle’s engine speed was slowly increased from idle to a suitable upper limit, with the vehicle unloaded, i.e. neutral gear selected.
Figure A1.2 shows these data for two vehicles. For Vehicle 1 the EGR unit was disabled in both the fully on and the fully off positions, whilst for Vehicle 2 data were collected with the unit disabled in the fully off position only.
When their EGR units were disabled in the fully off position both vehicles showed: • smoothly increasing CO2 tailpipe concentrations from around 2.0% to 3.0% as the
engine speed increased from idle (around 800 rev/min) to 4,000 rev/min, • a corresponding smooth decrease in tailpipe O2 concentrations from around 18.5% to
17.0% over the same engine speed range, • no discontinuities in either the CO2 or O2 gas concentration/engine speed traces.
Vehicle 1 with its EGR unit disabled in the fully on position showed: • a generally increasing CO2 tailpipe concentration from around 3.1% to 4.0% as the
engine speed increased from idle (around 800 rev/min) to 4,000 rev/min, • a corresponding generally decreasing tailpipe O2 concentration from around 16.8% to
15.2% over the same engine speed range, • no marked major discontinuities in either the CO2 or O2 gas concentration/engine speed
traces, and • a noticeably increased hysteresis between the tailpipe concentrations of both CO2 and O2
between when the engine speed increased and decreased.
This last observation could be a consequence of: • variable amounts of EGR occurring between when the engine speed increased and
decreased, • an intentional control strategy to increase NOX abatement, or • differences in fuelling levels.
The first of these is believed to be the most likely. It occurs because the takeoff point for the EGR gases is before the turbo-compressor, and consequently there is a higher pressure drop across the EGR feed-pipe when the turbo is accelerating relative to when it is decelerating. A similar hysteresis is observed when the EGR unit operates normally before the engine speed at which it is switched off.
When their EGR units working both vehicles showed: • CO2 tailpipe concentrations in the range 2.5% - 4.0% for engine speeds of 1,000 to
2,700 rev/min, • CO2 tailpipe concentrations smoothly increasing from around 2.2% - 3.0% for engine
speeds of 3,000 to 4,000 rev/min, • a corresponding O2 tailpipe concentrations in the range 16% - 17% for engine speeds of
1,000 to 2,700 rev/min, • O2 tailpipe concentrations smoothly increasing from around 18% - 17% for engine
speeds of 3,000 to 4,000 rev/min, • significant discontinuities in both the CO2 or O2 gas concentration/engine speed traces
within the range 2,500 to 3,000 rev/min.
UNCLASSIFIED AEA Technology A1.7
UNCLASSIFIED Low Emission Diesel Research – Phase 3 Report AEAT/ENV/R/1873 Issue 1 Annex 1 – Measurement techniques for NOX
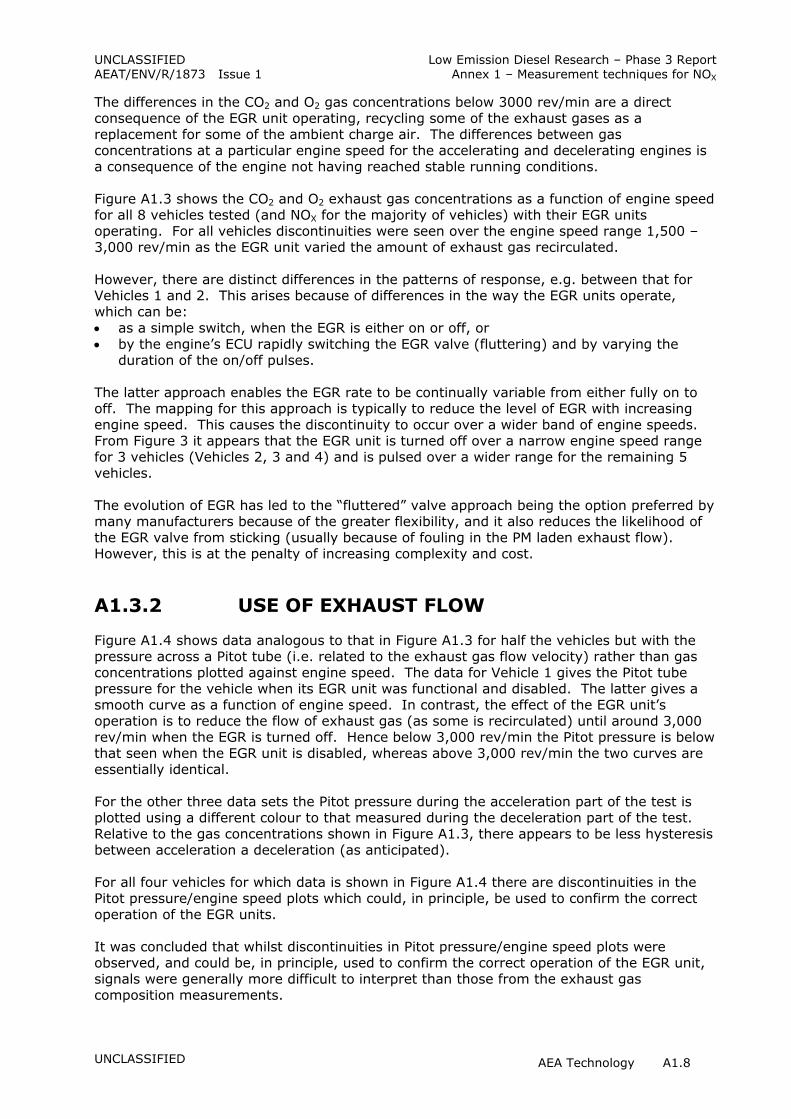
The differences in the CO2 and O2 gas concentrations below 3000 rev/min are a direct consequence of the EGR unit operating, recycling some of the exhaust gases as a replacement for some of the ambient charge air. The differences between gas concentrations at a particular engine speed for the accelerating and decelerating engines is a consequence of the engine not having reached stable running conditions.
Figure A1.3 shows the CO2 and O2 exhaust gas concentrations as a function of engine speed for all 8 vehicles tested (and NOX for the majority of vehicles) with their EGR units operating. For all vehicles discontinuities were seen over the engine speed range 1,500 – 3,000 rev/min as the EGR unit varied the amount of exhaust gas recirculated.
However, there are distinct differences in the patterns of response, e.g. between that for Vehicles 1 and 2. This arises because of differences in the way the EGR units operate, which can be: • as a simple switch, when the EGR is either on or off, or • by the engine’s ECU rapidly switching the EGR valve (fluttering) and by varying the
duration of the on/off pulses.
The latter approach enables the EGR rate to be continually variable from either fully on to off. The mapping for this approach is typically to reduce the level of EGR with increasing engine speed. This causes the discontinuity to occur over a wider band of engine speeds. From Figure 3 it appears that the EGR unit is turned off over a narrow engine speed range for 3 vehicles (Vehicles 2, 3 and 4) and is pulsed over a wider range for the remaining 5 vehicles.
The evolution of EGR has led to the “fluttered” valve approach being the option preferred by many manufacturers because of the greater flexibility, and it also reduces the likelihood of the EGR valve from sticking (usually because of fouling in the PM laden exhaust flow). However, this is at the penalty of increasing complexity and cost.
A1.3.2 USE OF EXHAUST FLOW
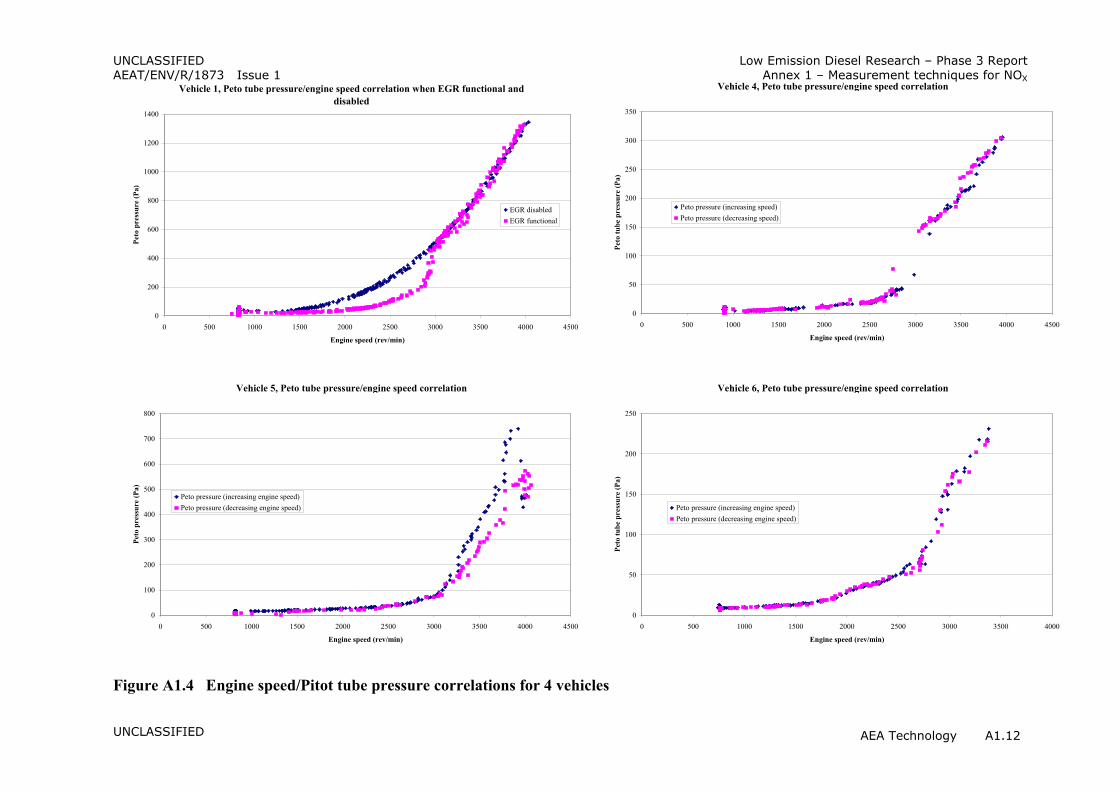
Figure A1.4 shows data analogous to that in Figure A1.3 for half the vehicles but with the pressure across a Pitot tube (i.e. related to the exhaust gas flow velocity) rather than gas concentrations plotted against engine speed. The data for Vehicle 1 gives the Pitot tube pressure for the vehicle when its EGR unit was functional and disabled. The latter gives a smooth curve as a function of engine speed. In contrast, the effect of the EGR unit’s operation is to reduce the flow of exhaust gas (as some is recirculated) until around 3,000 rev/min when the EGR is turned off. Hence below 3,000 rev/min the Pitot pressure is below that seen when the EGR unit is disabled, whereas above 3,000 rev/min the two curves are essentially identical.
For the other three data sets the Pitot pressure during the acceleration part of the test is plotted using a different colour to that measured during the deceleration part of the test. Relative to the gas concentrations shown in Figure A1.3, there appears to be less hysteresis between acceleration a deceleration (as anticipated).
For all four vehicles for which data is shown in Figure A1.4 there are discontinuities in the Pitot pressure/engine speed plots which could, in principle, be used to confirm the correct operation of the EGR units.
It was concluded that whilst discontinuities in Pitot pressure/engine speed plots were observed, and could be, in principle, used to confirm the correct operation of the EGR unit, signals were generally more difficult to interpret than those from the exhaust gas composition measurements.
UNCLASSIFIED AEA Technology A1.8

1
UNCLASSIFIED Low Emission Diesel Research – Phase 3 Report
AEAT/ENV/R/1873 Issue 1 Annex 1 – Measurement techniques for NOX
CO2 concentrations for Vehicle 1 with functional and disabled EGR unit O2 concentrations for Vehicle 1 with functional and disabled EGR unit
5 20
EGR permanently off, decreasing engine speed EGR functional, increasing engine speed
4 19 EGR permanently off, increasing engine speed EGR functional, decreasing engine speed EGR permanently on, increasing engine speed EGR permanently on, decreasing engine speed
CO
2 con
cent
ratio
n (%
)
3
2
O2 c
once
ntra
tion
(%)
O2 c
once
ntra
tion
(%)
18
17
EGR permanently off, decreasing engine speed EGR functional, increasing engine speed EGR permanently off, increasing engine speed
1 EGR functional, decreasing engine speed 16 EGR permanently on, increasing engine speed EGR permanently on, decreasing engine speed
0 15 0 500 1000 1500 2000 2500 3000 3500 4000 4500 0 500 1000 1500 2000 2500 3000 3500 4000 4500
Engine speed (rev/min) Engine speed (rev/min)
CO2 concentrations for Vehicle 2 with functional and disabled EGR unit O2 concentrations for Vehicle 2 with functional and disabled EGR unit
195 EGR disabled, increasing engine speed EGR functional, increasing engine speed EGR disabled, decreasing engine speed EGR functional, decreasing engine speed
4
18
17
CO
2 con
cent
ratio
n (%
)
3
2
16 EGR disabled, increasing engine speed EGR functional, increasing engine speed EGR disabled, decreasing engine speed EGR functional, decreasing engine speed
0 15 0 500 1000 1500 2000 2500 3000 3500 4000 4500 0 500 1000 1500 2000 2500 3000 3500 4000 4500
Engine speed (rev/min) Engine speed (rev/min)
Figure A1.2 Engine speed/CO2 and O2 exhaust gas concentration correlations for vehicles with their EGR units working/disabled
UNCLASSIFIED AEA Technology A1.9

100.0
6.00
8.00
12.00
14.00
6.00
8.00
UNCLASSIFIED AEAT/ENV/R/1873 Issue 1 Vehicle 1, gas concentrations/engine speed correlations
Low Emission Diesel Research – Phase 3 Report
Annex 1 – Measurement techniques for NOXVehicle 2, gas concentrations/engine speed correlations
20.00 200.0 20.00 200.0
18.00 18.00
16.00 150.0 16.00 150.0
O2 a
nd C
O2 c
once
ntra
tions
(%)
O2 a
nd C
O2 c
once
ntra
tions
(%)
NO
x co
ncen
trat
ion
(ppm
)
O2 a
nd C
O2 c
once
ntra
tions
(%)
O2 a
nd C
O2 c
once
ntra
tions
(%)
100.0
14.00
12.00
NO
x co
ncen
trat
ion
(ppm
) N
Ox
conc
entr
atio
n (p
pm)
CO2 (increasing engine speed) O2 (increasing engine speed)
CO2 (increasing engine speed) 10.00 10.00
O2 (increasing engine speed) CO2 (decreasing engine speed) CO2 (decreasing engine speed) 50.0 8.00 50.0 O2 (decreasing engine speed) O2 (decreasing engine speed) NOx (decreasing engine speed) NOx (decreasing engine speed) 6.00 NOx (increasing engine speed) NOx (increasing engine speed)
4.00 0.0 4.00 0.0
2.00 2.00
0.00 -50.0 0.00 -50.0 0 500 1000 1500 2000 2500 3000 3500 4000 4500 0 500 1000 1500 2000 2500 3000 3500 4000 4500
Engine speed (rev/min) Engine speed (rev/min)
Vehicle 3, gas concentrations/engine speed correlations Vehicle 4, gas concentrations/engine speed correlations
20.00 20.00 200.0
18.00 18.00 180.0
16.00 16.00 160.0
14.00 14.00 CO2 (increasing engine speed)
12.00 O2 (increasing engine speed) CO2 (decreasing engine speed)
10.00 O2 (decreasing engine speed)
CO2 (increasing engine speed) 12.00 O2 (increasing engine speed)
CO2 (decreasing engine speed) 10.00
O2 (decreasing engine speed) NOx (increasing engine speed)
8.00 NOx (decreasing engine speed)
6.00
4.00 4.00 40.0
2.00 2.00 20.0
0.00 0.00 0.0 0 500 1000 1500 2000 2500 3000 3500 4000 0 500 1000 1500 2000 2500 3000 3500 4000
Engine speed (rev/min) Engine speed (rev/min)
Figure A1.3 (part1) Engine speed/CO2 and O2 exhaust gas concentration correlations for 8 vehicles with working EGR units
UNCLASSIFIED AEA Technology A1.10
60.0
80.0
100.0
120.0
140.0

6.00
8.00
14.00
4.00
6.00
8.00
UNCLASSIFIED AEAT/ENV/R/1873 Issue 1
Vehicle 5, gas concentrations/engine speed correlations
Low Emission Diesel Research – Phase 3 Report
Annex 1 – Measurement techniques for NOX Vehicle 6, gas concentrations/engine speed correlations
20.00 300.0 20.00 200.0
18.00 18.00
16.00 250.0
16.00 150.0
O2 a
nd C
O2 c
once
ntra
tions
(%)
O2 a
nd C
O2 c
once
ntra
tions
(%)
NO
x co
ncen
trat
ion
(ppm
) N
Ox
conc
entr
atio
n (p
pm)
O2 a
nd C
O2 c
once
ntra
tions
(%)
O2 a
nd C
O2 c
once
ntra
tions
(%)
14.00
12.00 100.0
10.00 CO2 (increasing engine
NO
x co
ncen
trat
ion
(ppm
) N
Ox
conc
entr
atio
n (p
pm)
CO2 (increasing engine speed) 200.0 O2 (increasing engine speed)
12.00 CO2 (decreasing engine speed) O2 (decreasing engine speed)
10.00 NOx (increasing engine speed) 150.0 NOx (decreasing engine speed)
100.0
speed)O2 (increasing engine speed) 8.00 CO2 (decreasing engine
6.00 speed)O2 (decreasing engine speed)
NOx (decreasing engine 0.0 4.00 4.00 50.0
2.00 2.00
0.00 -50.0 0.00 0.0
0 500 1000 1500 2000 2500 3000 3500 4000 0 500 1000 1500 2000 2500 3000 3500 4000 4500
Engine speed (rev/min) Engine speed (rev/min)
Vehicle 8, gas concentrations/engine speed correlations Vehicle 7, gas concentrations/engine speed correlations
20.00 200.0 20.00 320.0
18.00 180.0 18.00 280.0
16.00 160.0 16.00 240.0
14.00 200.0
12.00 160.0
10.00 CO2 (increasing engine speed) 120.0 O2 (increasing engine speed)
80.0 CO2 (decreasing engine speed)
14.00 140.0
12.00 120.0
10.00
8.00
CO2 (increasing engine speed) O2 (increasing engine speed)
100.0
80.0 CO2 (decreasing engine speed) O2 (decreasing engine speed)
40.0 O2 (decreasing engine speed) 6.00 NOx (decreasing engine speed) NOx (increasing engine speed) NOx (increasing engine speed) 0.0 NOx (decreasing engine speed)
4.00
2.00 -40.0 2.00 20.0
0.00 -80.0 0 500 1000 1500 2000 2500 3000 3500 4000 4500
0.00 0 500 1000 1500 2000 2500 3000 3500 4000 4500
0.0
Engine speed (rev/min) Engine Speed (rev/min)
Figure A1.3 (part 2) Engine speed/CO2 and O2 exhaust gas concentration correlations for 8 vehicles with working EGR units
UNCLASSIFIED AEA Technology A1.11
40.0
60.0
50.0
600
800
UNCLASSIFIED Low Emission Diesel Research – Phase 3 Report AEAT/ENV/R/1873 Issue 1 Annex 1 – Measurement techniques for NOX
Vehicle 1, Peto tube pressure/engine speed correlation when EGR functional and Vehicle 4, Peto tube pressure/engine speed correlation disabled
3501400
3001200
2501000
Peto pressure (increasing speed) Peto pressure (decreasing speed)
0 500 1000 1500 2000 2500 3000 3500 4000 4500
Engine speed (rev/min)
EGR disabled EGR functional
0 500 1000 1500 2000 2500 3000 3500 4000 4500
Engine speed (rev/min)
Peto
tube
pre
ssur
e (P
a)Pe
to tu
be p
ress
ure
(Pa)
Peto
pre
ssur
e (P
a)Pe
to p
ress
ure
(Pa)
200
150
100400
50200
00
Vehicle 5, Peto tube pressure/engine speed correlation Vehicle 6, Peto tube pressure/engine speed correlation
800 250
700
200 600
Peto pressure (increasing engine speed) Peto pressure (decreasing engine speed) Peto pressure (increasing engine speed)
Peto pressure (decreasing engine speed)
500
400
300
200
150
100
50
100
0 0 0 500 1000 1500 2000 2500 3000 3500 4000 4500 0 500 1000 1500 2000 2500 3000 3500 4000
Engine speed (rev/min) Engine speed (rev/min)
Figure A1.4 Engine speed/Pitot tube pressure correlations for 4 vehicles
UNCLASSIFIED AEA Technology A1.12
UNCLASSIFIED Low Emission Diesel Research – Phase 3 Report AEAT/ENV/R/1873 Issue 1 Annex 1 – Measurement techniques for NOX
A1.3.3 IDLE TEST
An unexpected observation, made on Vehicle 1, is illustrated in Figure A1.5a. It was found that at idle the vehicle’s EGR unit was turned off. However, at low engine speeds above idle the EGR rate was set to around its maximum value. Consequently, merely touching the accelerator (sufficient to allow the engine speed to rise to around 900 rev/min) caused the EGR unit to be turned on. Over the next two minutes (at idle with the accelerator untouched) the EGR unit was turned off again.
If this behaviour was common to sufficient vehicles it could form the basis of an EGR check. Key advantages, relative to the procedure used to obtain the data shown in Figures 2 – 4, are: • the signal is less noisy • no engine speed measurement is required, the test is primarily conducted at low idle, • it is a much quicker, and simpler procedure for the tester.
The corresponding gas concentrations for Vehicle 1 when its EGR unit was disabled are shown in Figure A1.5b. Small perturbations are seen when the accelerator is touched, but the carbon dioxide and oxygen concentrations remain virtually constant.
Unfortunately one of the eight vehicles had already been returned when this phenomenon was observed, and consequently only seven vehicles were tested at idle.
The response of Vehicle 5, a light van, was similar to that from Vehicle 1 (see Figure A1.5c). These two vehicles were made by the same manufacturer.
Vehicles 4, 6 and 8 behaved similarly (see Figures A1.5d, A1.5e and A1.5f). The principal difference relative to Vehicles 1 and 5 is that the EGR unit, having been turned on in reponse to a touch on the accelerator, stays fully open for a while before being switched off (rather than turning off gradually over a period of around a minute).
However, two vehicles behaved distinctly differently. Unlike the previous five vehicles, Vehicles 2 and 7 had a high rate of EGR at idle (no matter how long they remained at idle). Carbon dioxide and oxygen concentrations were around 4% and 15%, respectively, rather than 2% and 18%.
Vehicle 2 was tested with its EGR unit both functional and disabled, Figures A1.5g and A1.5h. For both configurations merely touching the accelerator led to no change. However, there are large, easily measurable differences in CO2 and O2 concentrations between EGR functioning and disabled (CO2 4.2% → 1.9% and O2 15.0% → 18.2%, respectively). This is the scenario that leads to the largest increase in excess NOX
emissions. Consequently using a 4-gas analyser at idle can identify malfunctioning EGR units for this type of vehicle.
For vehicle 7 (Figure A1.5i) touching the accelerator produced no change. However, gentle sustained depression, such that the engine speed increased to 1,000 or 850 rev/min relative to idle at 750 rev/min, caused the EGR unit to switch the exhaust recirculation off. Allowing the engine to return to idle caused an immediate change as the EGR unit switched the EGR off. As for vehicle 2 this difference is clearly measurable and consequently using a 4-gas analyser at idle can identify malfunctioning EGR units for this type of vehicle too.
UNCLASSIFIED AEA Technology A1.13

6.00
8.00
12.00
14.00
16.00
18.00
UNCLASSIFIED Low Emission Diesel Research – Phase 3 Report AEAT/ENV/R/1873 Issue 1 Annex 1 – Measurement techniques for NOX
Figure 5a - Vehicle 1, Emissions at idle when EGR functional Figure 5b - Vehicle 1, Emissions at idle when EGR disabled
20.00 300.0 20.00 300.0
18.00
240.0 16.00
120.0
180.0
CO2 O2 NOX
Accelerator touched at these times
EGR turning off
EGR off
EGR fully on for this brief period
300 350 400 450 500 550 600 650 700 750
Elapsed time (s)
60.0
120.0
180.0
240.0
CO2 O2 NOX
Accelerator touched at these times
No EGR at any time, i.e. always fully off
0.0 200.00 250.00 300.00 350.00 400.00 450.00 500.00 550.00 600.00 650.00
Elapsed time (s)
O2 a
nd C
O2 c
once
ntra
tions
(%)
14.00
12.00
10.00
8.00
6.00
4.00 60.0 4.00
2.00 2.00
0.00 0.0 0.00
Figure 5c - Vehicle 5, Emissions at idle
NO
X co
ncen
trat
ion
(ppm
)
O2 a
nd C
O2 c
once
ntra
tions
(%)
NO
X co
ncen
trat
ion
(ppm
)
10.00
0
2
4
6
8
10
12
14
16
18
20
O 2 a
nd C
O2 c
once
ntra
tions
(%)
0
20
40
60
80
100
120
140
160
180
200
NO
X co
ncen
trat
ion
(ppm
)
CO2 O2 NOX
Accelerator touched at these
EGR off
EGR on for this brief period
EGR turning off
450 500 550 600 650 700 750 800 850
Engine speed (rev/min)
Figure A1.5 Gas concentrations at idle (part 1)
UNCLASSIFIED AEA Technology A1.14

6.00
8.00
12.00
14.00
240.0
280.0
UNCLASSIFIED Low Emission Diesel Research – Phase 3 Report AEAT/ENV/R/1873 Issue 1 Annex 1 – Measurement techniques for NOX
Figure 5d - Vehicle 4, Emissions at idle Figure 5e - Vehicle 6, Emissions at idle
20.00 200.0 20.00 400.0
360.0 18.00 180.0 18.00
320.0 16.00 160.0 16.00
CO2 O2 NOX
Accelerator touched at these times
EGR off EGR fully on
0 50 100 150 200 250 300 350 400 450
Elapsed time (s)
CO2 O2 NOX
Accelerator touched at these times
EGR off
EGR fully on
50 100 150 200 250 300 350 400 450 500
elapsed time (s)
O2 a
nd C
O2 c
once
ntra
tions
(%)
NO
X c
once
ntra
tion
(ppm
)
O2 a
nd C
O2 c
once
ntra
tions
(%)
14.00 140.0
120.0 12.00
10.00 200.0 10.00 100.0
8.00 160.0 80.0
6.00 120.0 60.0
80.0 4.00 40.0 4.00
40.0 2.00 20.0 2.00
0.0 0.00 0.0 0.00
Figure 5f - Vehicle 8, Emissions at idle
0.00
2.00
4.00
6.00
8.00
10.00
12.00
14.00
16.00
18.00
20.00
O 2 a
nd C
O2 c
once
ntra
tions
(%)
0.0
80.0
160.0
240.0
320.0
400.0
NO
X co
ncen
trat
ion
(ppm
)
CO2 O2 NOX
Accelerator touched at these times
EGR fully on
EGR off
150 200 250 300 350 400 450 500
Elapsed time (s)
NO
X c
once
ntra
tion
(ppm
)
Figure A1.5 Gas concentrations at idle (part 2)
UNCLASSIFIED AEA Technology A1.15

16.00
140.0
160.0
180.0
200.0
UNCLASSIFIED AEAT/ENV/R/1873 Issue 1
Low Emission Diesel Research – Phase 3 Report Annex 1 – Measurement techniques for NOX
Figure 5g - Vehicle 2, Emissions at idle when EGR functional Figure 5h - Vehicle 2, Emissions at idle when EGR disabled
20.00 20.00
CO2 O2 NOX
Accelerator touched at these times constant 1000 constant 1500 rev/min rev/min
200.0
18.00 18.00 180.0
16.00 160.0
CO2 O2 NOX
Accelerator touched at these times
constant 1000 rev/min
constant 1500 rev/min
NO
X co
ncen
trat
ion
(ppm
)
CO
2 and
O2 c
once
ntra
tions
(%) 14.00
CO
2 and
O2 c
once
ntra
tions
(%) 14.00 140.0
12.00 120.0 12.00 120.0
10.00 100.0 10.00 100.0
8.00 80.0 8.00 80.0
6.00 60.0 6.00 60.0
4.00 40.0 4.00 40.0
2.00 20.0 2.00 20.0
0.00 0.0 0.00 0.0 100 150 200 250 300 350 400 450
0 50 100 150 200 250 300 350 Elapsed time (s) Elapsed time (s)
Figure 5i - Vehicle 7, emissions at idle
200.0
0.00
2.00
4.00
6.00
8.00
10.00
12.00
14.00
16.00
18.00
O 2 a
nd C
O2 c
once
ntra
tions
(%)
CO2 O2 NOX
Accelerator touched at these times constant 1000 rev/min
constant 850 rev/min
EGR on
EGR off
20.00
180.0
160.0
140.0
120.0
100.0
80.0
60.0
40.0
20.0
0.0 0 50 100 150 200 250 300 350 400 450 500
Elapsed time (s)
NO
X c
once
ntra
tion
(ppm
)
NO
X co
ncen
trat
ion
(ppm
)
Figure A1.5 Gas concentrations at idle (part 3)
UNCLASSIFIED AEA Technology A1.16

UNCLASSIFIED Low Emission Diesel Research – Phase 3 Report AEAT/ENV/R/1873 Issue 1 Annex 1 – Measurement techniques for NOX
When the EGR unit was disabled it was found that gentle sustained pressure on the accelerator led to a small decrease in carbon dioxide concentrations and a corresponding small increase in oxygen concentrations. Given that no EGR is occurring at any time, these changes, which correspond to a slightly higher air/fuel ratio, are presumed to be a consequence of the increased charge air flow caused by the turbo-compressor raising the boost pressure.
Somewhat larger changes, but in the same direction, are seen when the EGR unit is functional. Again it is believed that these changes are not caused by the EGR unit switching and changing the rate of recirculation, but by changes in the charge air-flow. The data for Vehicle 2 in Figure A1.3 suggests the EGR unit’s mapping is relatively simple over the conditions investigated: it goes from “recirculation on” for engine speeds less than 2,800 rev/min to “recirculation off” for engine speeds above this threshold.
To summarise, for five of the seven vehicles tested merely gently touching the accelerator pedal at idle caused a working EGR unit to be turned on, and then to be turned off again. This offers the prospect of a much simplified in-service test.
For one of the seven vehicles the change was the opposite way round (with the vehicle having a high rather than zero EGR rate at idle). Also, sustained pressure to increase the engine speed to around 1,000 rev/min was required rather than merely touching the accelerator.
However, for one of the seven vehicles it appears that no switching occurs until the engine speed reaches around 2,800 rev/min. Notwithstanding, for this vehicle the high EGR rate at idle does enable vehicles whose EGR valve is stuck in the closed position to be identified. This is the fault that leads to excess NOX emissions.
Consequently it appears that an “idle test” is a realistic possibility for some vehicles. However, the results presented here indicate that no single test would be universally applicable. This would lead to a NOX inspection programme which involved different test procedures for different vehicles.
A1.3.4 THE EFFECT OF FAILED EGR UNITS ON EMISSIONS OVER THE TYPE 1 TEST
Table A1.2 contains the regulatory emissions from 3 vehicles tested over the Type 1 test (used at type approval) when the vehicles’ EGR units were operational and disabled. (One of these vehicles was tested as part of the Phase 2 studies, Vehicle 9, hence the lack of data from this vehicle in Figure A1.2 etc.)
Table A1.2 The effect of EGR operation on emissions performance Vehicle EGR unit CO2
(g/km) CO
(g/km) THC
(g/km) NOX
(g/km) Particulates
(g/km) Vehicle 1 Operational 165.2 0.269 0.021 0.454 0.083
Disabled 0.204 0.022 1.010 0.030 Vehicle 2 Operational 133.0 0.038 0.001 0.394 0.042
Disabled 136.8 0.038 0.006 0.939 0.020 Vehicle 9 Operational 161.4 0.444 0.045 0.696 0.028
Disabled 163.9 0.076 0.268 0.934 0.083
UNCLASSIFIED AEA Technology A1.17

UNCLASSIFIED Low Emission Diesel Research – Phase 3 Report AEAT/ENV/R/1873 Issue 1 Annex 1 – Measurement techniques for NOX
For all three vehicles disabling the EGR unit such that no EGR occurred led to the anticipated increase in NOX emissions. The extent of these increases, both as g/km and as a percentage increase relative to when the EGR unit is operational, are summarised in Table A1.3, together with their averages.
Table A1.3 The increase in NOX caused by failure of an EGR unit Vehicle Euro
standard NOX emissions (g/km) Size of increase
EGR unit functional EGR unit disabled g/km % Vehicle 9 Euro II 0.696 0.934 + 0.238 + 34% Vehicle 1 Euro II 0.454 1.010 + 0.556 + 122% Vehicle 2 Euro III 0.394 0.939 + 0.545 + 138% Averages 0.515 0.961 +0.446 +87%
If these data were representative of the fleet as a whole, then if 15% of vehicles had failed EGR systems this would lead to a 13% rise in the NOX inventory from this group of vehicles. These data feed in to the cost effectiveness analysis in Appendix 5.
A1.3.5 PROPORTION OF THE CURRENT DIESEL FLEET TESTED
Estimates have been made of the proportion of the diesel fleet which were examined in this survey. This was calculated from data provided by the SMMT for the sales of diesel vehicles for the calendar year 2002. Vehicles were categorised according to: • manufacturer, • model and • engine size.
For passenger vehicles (which comprised 7 of the 8 vehicles studied here) six of the vehicles could be bought new in 2002. The SMMT data base contained a total of 181 vehicle types (categorised using the three parameters listed above). On a pro rata scaling these six vehicle types represent 3.3% of vehicle sales. In terms of vehicle sales, the six models tested accounted for 16.5% of total sales in 2002, indicating we have selected popular models on average.
The SMMT data-base listed 33 different manufacturers. We assessed vehicles from six manufacturers (18.2%). The actual sales from the six manufacturers comprised 44.7% of total sales, again illustrating that we have selected, on average, the more popular manufacturers.
Another characteristic is that the same engine can be used by different manufacturers (e.g. within the VAG or PSA groups of companies) and within different models within the same manufacturer (e.g. in VW Golf, Passat and Sharan models). Purely on the basis of the engines fitted to diesel passenger vehicles, the six engine types tested represent 47.6% of total 2002 sales.
Overall, the vehicle types tested here, whilst only a small (3.3%) proportion of all types, encompassed a higher percentage of manufacturers and sales volume. The models were selected as a statistically valid sample, i.e. are representative of the diesel passenger car fleet as a whole.
UNCLASSIFIED AEA Technology A1.18

UNCLASSIFIED Low Emission Diesel Research – Phase 3 Report AEAT/ENV/R/1873 Issue 1 Annex 1 – Measurement techniques for NOX
A1.3.6 PRIORISATION OF OPTIONS FOR A PRACTICAL TEST
The comments below should be read in the context of this study having demonstrated that tailpipe carbon dioxide and oxygen concentrations can be used to check/confirm the satisfactory operation of an EGR unit.
The data collected and presented in Figures A1.1 to A1.4 are very useful for mapping when EGR is occurring. A fundamental, potentially useful aspect of the approach is that it is relevant for all vehicles. However, with the hindsight of experience this approach is too complex to be recommended as the procedure to be used for an in-service test. Challenging aspects include: • the need to have an engine speed signal input into the test system, • significant hysteresis between the acceleration and deceleration parts of the test, • no simple pass fail standard for all vehicles, and • a relatively high level of tester skill.
The measurement of exhaust flow velocity, via the pressure across a Pitot tube, overcomes the second challenge listed to a large extent but the other challenges remain. Hence it is rejected as being too complex to form the basis of an in-service test.
The measurement of carbon dioxide and oxygen concentrations at idle following a touch on the accelerator overcomes the other drawbacks. However, as was discussed in Section A1.3.3, no single procedure was found to give the same information for all eight vehicles assessed. Notwithstanding, the emissions test at idle did demonstrate that the EGR valve was not stuck for all eight vehicle types.
An alternative test procedure could be a two engine speed unloaded test. This has the attraction of being similar to the current in-service test for petrol-fuelled vehicles (fitted with catalysts) that is carried out in the decentralised test stations.
One drawback of this approach is that the optimum engine speed for maximum carbon dioxide (minimum oxygen) when the EGR rate is high varies from vehicle to vehicle. Similarly, the optimum engine speed for minimum carbon dioxide (maximum oxygen) when the EGR rate is low/off is also vehicle dependent. The engine speeds used to obtain the data plotted in Figure A1.6 are listed in Table A1.4.
Figure A1.6 shows the carbon dioxide and oxygen concentrations at low and high optimum engine speeds (when the EGR is on and off, respectively). Error bars are also included to reflect the hysteresis between the engine accelerating and decelerating conditions. This is equivalent to allowing some variation in engine speed during testing. One important conclusion from these data is that there are no universally applicable concentration thresholds (i.e. there is not a O2 concentration that is appropriate for all vehicles above which the EGR is on and below which it is off). The same also applies to CO2 concentrations.
UNCLASSIFIED AEA Technology A1.19

UNCLASSIFIED Low Emission Diesel Research – Phase 3 Report AEAT/ENV/R/1873 Issue 1 Annex 1 – Measurement techniques for NOX
Figure 6a, The carbon dioxide concentrations at a lower and higher optimum engine speeds for unloaded diesel engines
0
0.5
1
1.5
2
2.5
3
3.5
4
4.5
CO
2 con
cent
ratio
ns (%
)
Lower speed Higher speed
Vehicle 1 Vehicle 2 Vehicle 3 Vehicle 4 Vehicle 5 Vehicle 6 Vehicle 7 Vehicle 8
Figure 6b, The oxygen concentrations at a lower and higher optimum engine speeds for unloaded diesel engines
13.5
14
14.5
15
15.5
16
16.5
17
17.5
18
18.5
O 2 c
once
ntra
tions
(%)
Lower speed Higher speed
Vehicle 1 Vehicle 2 Vehicle 3 Vehicle 4 Vehicle 5 Vehicle 6 Vehicle 7 Vehicle 8
Figure A1.6 CO2 and O2 concentrations at optimum low and high engine speeds
UNCLASSIFIED AEA Technology A1.20

UNCLASSIFIED Low Emission Diesel Research – Phase 3 Report AEAT/ENV/R/1873 Issue 1 Annex 1 – Measurement techniques for NOX
Table A1.4 The optimum engine speeds for determining if an EGR unit operates for different vehicles Vehicle number Optimal lower engine speed Optimal upper engine speed Vehicle 1 2,500 rev/min 3,250 rev/min Vehicle 2 2,500 rev/min 3,250 rev/min Vehicle 3 2,500 rev/min 3,250 rev/min Vehicle 4 2,500 rev/min 3,250 rev/min Vehicle 5 2,500 rev/min 3,350 rev/min Vehicle 6 1,500 rev/min 3,000 rev/min Vehicle 7 2,100 rev/min 3,000 rev/min Vehicle 8 2,500 rev/min 3,400 rev/min
Notwithstanding, for all eight vehicles the CO2 concentration at the optimum lower engine speed (i.e. less than or equal to 2,500 rev/min) is higher than the concentration at the optimum higher engine speed (i.e. less than or equal to 3,000 rev/min). (In Figure A1.6a the darker (blue) column is longer than the lighter (yellow) column for all vehicles.) For an EGR valve that is stuck (being either permanently on or off) the order is the other way round, i.e. the CO2 concentration at the optimum lower engine speed is now lower than the concentration at the optimum higher engine speed.
For the oxygen concentrations the order is reversed, i.e. in Figure A1.6b the darker column is shorter than the lighter column for all vehicles, and when the EGR is stuck permanently on or off the darker column is longer than the lighter column for all vehicles.
The results of a two speed idle test could be expressed in terms of two questions:
For a working EGR system the answers would be:
• Is the CO2 concentration at low engine speed less than at high engine speed? True • Is the O2 concentration at low engine speed less than at high engine speed? False
For a non-operational EGR system, stuck either with the EGR valve open, closed, or at some intermediate state, the answers would be: • Is the CO2 concentration at low engine speed less than at high engine speed?
False • Is the O2 concentration at low engine speed less than at high engine speed? True
The position of a stuck EGR valve can be deduced from the actual gas concentrations, e.g. at the lower engine speed.
For closed, no EGR occurring 1.8% < CO2 concentration < 2.5% 18.5% < O2 concentration < 17.2%
For open, EGR occurring constantly 3% < CO2 concentration < 5% 16.7% < O2 concentration < 14%
At first glance the differences between the values looks uncomfortably small. However, the measurement precision is relatively high for the following reasons. • There are two independent sensors used to obtain the data, the CO2 and O2
concentration sensors. • The two gas concentrations are related such that 1.5xCO2 concentration + O2
concentration = 21 to 21.5%. (This allows the consistency between the two sensors to be checked.)
UNCLASSIFIED AEA Technology A1.21

UNCLASSIFIED Low Emission Diesel Research – Phase 3 Report AEAT/ENV/R/1873 Issue 1 Annex 1 – Measurement techniques for NOX
• There are a number of other meter checks that can be made, ranging from the meter values in clean air, to the exhaust from a gasoline vehicle, to the use of calibration gases.
• The species whose concentrations are measures are not minor pollutants (e.g. CO, NOX or hydrocarbons) but are the primary products of combustion. Consequently they are not subject to perturbations like catalyst temperature, but are a fundamental consequence of the engine running and converting a hydrocarbon fuel into mechanical work.
It greatly simplifies an in-service test if the same two engine speeds can be used for all vehicles. The prospects of achieving this were investigated. Figure A1.7 contains analogous data to that presented in Figure A1.6 but showing the CO2 and O2
concentrations at the same two engine speeds for all vehicles. The two speeds selected were 2,500 rev/min and 3,250 rev/min for the slower and faster engine speeds, respectively. These values were selected as compromise values from the optimum ones listed in Table A1.4. The use of standard, non-optimal speeds does reduce the difference in the height of the columns and/or the size of the error bars for some vehicles. Overall it does not change the answers to the two questions used to determine the test result. It does, however, reduce the margins of error and increases the possibility of an erroneous result.
UNCLASSIFIED AEA Technology A1.22

UNCLASSIFIED Low Emission Diesel Research – Phase 3 Report AEAT/ENV/R/1873 Issue 1 Annex 1 – Measurement techniques for NOX
Figure 7a, The carbon dioxide concentrations at 2,500 and 3,250 rev/min for unloaded diesel engines
0
0.5
1
1.5
2
2.5
3
3.5
4
4.5
CO
2 con
cent
ratio
n (%
)
2,500 rev/min 3,250 rev/min
Vehicle 1 Vehicle 2 Vehicle 3 Vehicle 4 Vehicle 5 Vehicle 6 Vehicle 7 Vehicle 8
Figure 7b, The oxygen concentrations at 2,500 and 3,250 rev/min for unloaded diesel engines
14
14.5
15
15.5
16
16.5
17
17.5
18
18.5
O 2 c
once
ntra
tion
(%)
2,500 rev/min 3,250 rev/min
Vehicle 1 Vehicle 2 Vehicle 3 Vehicle 4 Vehicle 5 Vehicle 6 Vehicle 7 Vehicle 8
Figure A1.7 CO2 and O2 concentrations at 2,500 rev/min (low) and 3,250 rev/min (high) engine speeds
UNCLASSIFIED AEA Technology A1.23

UNCLASSIFIED Low Emission Diesel Research – Phase 3 Report AEAT/ENV/R/1873 Issue 1 Annex 1 – Measurement techniques for NOX
A1.4 Use of thermometry to check EGR functionality
A1.4.1 OBJECTIVE AND GENERAL METHODOLOGY
The objective of this portion of research was to investigate the hypothesis that whether or not an EGR system is operating correctly can be found by monitoring the surface temperature of the pipe that carries the exhaust gas to the inlet manifold. Figure A1.8 shows, schematically, the layout for a typical EGR system. (The turbo compressor unit has been deliberately omitted because the approach suggested would work on vehicles with no turbo-compressor, and on vehicles that injected the EGR gas on either the high-pressure or low-pressure side of the inlet air.)
EGR control valve
Inlet air Exhaust gases Engine
Fuel
EGR pipe-work that could be monitored
Figure A1.8 Schematic of arrangement used for EGR systems
The preferred portion of EGR pipe-work to be monitored is that on the inlet air side of the EGR control valve because this will be cooler, and consequently its temperature will be primarily determined by the position of the EGR control valve. An alternative portion is the pipe-work on the exhaust gas side of the control valve. However, because the exhaust manifold’s surface temperature varies with engine speed (and load) there is an increased likelihood that the surface temperature of this portion of the EGR pipe-work is not solely determined by the position of the EGR valve.
The instrument used to measure surface temperatures was a Raytek Minitemp® MT4, a non-contact thermometer with a laser pointer. This comprises an infrared detector that senses the energy emitted and reflected from a surface. The unit’s electronics convert this signal into a temperature reading that is displayed on the unit. Its range is –18 to 275°C ± °C, and its precision is ± 0.2°C. The small hand held unit, which weighs around 200g, was easy to use and, from the experience gained, met its specification.
UNCLASSIFIED AEA Technology A1.24

UNCLASSIFIED Low Emission Diesel Research – Phase 3 Report AEAT/ENV/R/1873 Issue 1 Annex 1 – Measurement techniques for NOX
The investigation was structured to answer two key questions: • Does this approach work in practice? and • What is the general applicability of this approach to vehicles fitted with EGR units?
The first question was answered by studying three vehicles in some detail, whilst the second was answered by lifting the bonnet of a further 5 vehicles, and assessing the ease of line-of-sight access to the critical pipe-work.
A1.4.2 ASSESSMENT OF APPROACH
Three vehicles were selected for a detailed study, i.e. the collection of data from a warmed up vehicle with the EGR unit operating. There was an obvious advantage to be gained from choosing vehicles studied earlier in the project whose EGR rate/engine speed map was known. For this reason Vehicles 2 and 6 from the earlier study were selected. (The choice of Vehicle 2 had the additional advantage that it had been established how to disable the EGR unit, see Section A1.3.1, so that, in principle, this approach could be assessed on a vehicle with a working and disabled EGR unit.)
Unfortunately, none of the other 6 vehicles were available for this study, so the basis for selection of the third vehicle was primarily driven by vehicle availability and choosing a vehicle where there was good line-of-sight access to the required pipe-work.
A1.4.2.1 Vehicle 2
This vehicle was selected both because it was available and it was one of the better characterised from the earlier investigations. Further, its EGR unit could be disabled relatively easily, see Figure A1.3 Part 1.
To gain line-of-sight access to the engine the top cover had to be removed. This involved undoing 4 studs, using a socket on an extension, one of which fell into the engine compartment. Because this vehicle was fitted with an under-tray the stud was not easily recoverable. This provided a warning regarding how the removal of these covers can take longer than expected.
Once the engine could be seen it was found that the EGR control valve, and its pipe-work were totally shielded. The transversely mounted engine slants with its top towards the bulkhead. Whilst hands could squeeze through the gap to disconnect the vacuum pipe that controlled the EGR unit, the total lack of line of sight meant that no readings could be made using the Raytek instrument for this investigation.
A1.4.2.2 Vehicle 6
To gain line-of-sight access to this 2.7 litre turbo-charged engine required the engine cover to be removed. This involved unclipping 4 snap fit connectors, an easy task but with the risk of snapping one or more. The EGR pipe on the inlet manifold side of the EGR control valve was visible. However, this “pipe-work” was a cast manifold, which without dismantling appeared quite thick, with a large thermal mass.
From Figure A1.5e it is known that for this vehicle at idle the EGR normally allows no exhaust to recirculate, but touching the accelerator causes the unit to be opened, with exhaust gas flowing in to the inlet manifold for around 35 seconds. A test cycle was used
UNCLASSIFIED AEA Technology A1.25

UNCLASSIFIED Low Emission Diesel Research – Phase 3 Report AEAT/ENV/R/1873 Issue 1 Annex 1 – Measurement techniques for NOX
which comprised the EGR being turned on, by touching the accelerator every 15 seconds, for 150 seconds, and then left off for 60 seconds and then turned on for a further 90 seconds. The temperature obtained from the Raytek non-contact thermometer was noted every 15 seconds. Figure A1.9 shows the data collected. Generally there is only a poor correlation between the temperature and EGR status. The mean temperature and its standard deviation were calculated for the last 2 or 3 points recorded just before the EGR’s status changed. The results are tabulated below:
Tem
pera
ture
(deg
C)
80
75
70
65
60
55
50
EGR status Raytek reading
EGR on EGR on
EGR off
0 50 100 150 200 250 300 350
Time (s)
Figure A1.9 Graph of non-contact thermometer readings and EGR status for Vehicle 6
Raytek EGR on 75.2 ± 1.9°C EGR off 71.8 ± 1.0°C Thermocouple EGR on 64.7 ± 1.2°C EGR off 62.8 ± 1.0°C
The sequence was repeated using a surface thermocouple in contact with the inlet manifold. The data recorded is shown in Figure A1.10 and the mean temperature, together with its standard deviation, for the last 2 or 3 points before the EGR unit switched are tabulated above. The data shows that the thermocouple does give a small change 1.9°C but the error bars overlap. The non-contact thermometer too showed a small change 3.4°C.
Figure A1.3 (part 2) shows changes in the exhaust gas O2 and CO2 (and NOX) concentrations over the engine speed range 2,500 – 3,000 rev/min for this vehicle. Temperatures were higher, in the range 83 - 93°C for both measurement instruments, but again the signal to noise ratio was poor, and no conclusive increase in temperature was measurable.
A1.4.2.3 Vehicle 9
This vehicle was selected because of those studied when assessing the wider applicability of this approach, see the following section, it appeared to have a high probability of
UNCLASSIFIED AEA Technology A1.26

UNCLASSIFIED Low Emission Diesel Research – Phase 3 Report AEAT/ENV/R/1873 Issue 1 Annex 1 – Measurement techniques for NOX
Tem
pera
ture
(deg
C)
80
75
70
65
60
55
50
EGR status Surface thermocouple reading
EGR on EGR on
EGR off EGR off
0 50 100 150 200 250 300 350 400
Time (s)
Figure A1.10 Graph of surface thermocouple readings and EGR status for Vehicle 6
providing successful measurements. The drawback was that its engine speed/EGR status had not been mapped, nor had the behaviour of its EGR unit at idle.
To gain access to the engine 3 finger locking studs were undone such that the engine’s top cover could be removed. The EGR control unit was identified, and a piece of straight metal tubing between this unit and the inlet air manifold was clearly visible.
Figure A1.11 shows the temperatures indicated by the non-contact thermometer and a surface thermocouple when the warmed engine was at idle and its accelerator pedal was touched every 15 seconds over a period of 1 minute. The assumption has been made that the EGR unit remains open for a further 30 seconds, similar to what has been characterised for Vehicle 5. Both graphs show a clear increase in temperature when the accelerator is touched. The mean temperatures, and its standard deviation, for the last 2 or 3 points before the EGR unit’s status switched were calculated and are given below.
Raytek EGR off 63.8 ± 5.5°C EGR on 71.0± 2.0°C Thermocouple EGR off 78.8 ± 3.6°C EGR on 99.3 ± 2.1°C
The thermocouple recorded an increase in temperature of 20.5°C, a clearly visible temperature rise. The non-contact thermometer was reading lower than the thermocouple and recorded a temperature rise of around 7°C. (The low temperatures given by the Raytek are believed to be a consequence of the low emissivity of the shiny connecting pipe. Whilst this is a difficulty when measuring absolute temperatures, when measuring relative temperatures as here it merely reduces the size of the change.)
UNCLASSIFIED AEA Technology A1.27

UNCLASSIFIED Low Emission Diesel Research – Phase 3 Report AEAT/ENV/R/1873 Issue 1 Annex 1 – Measurement techniques for NOX
110
100
90
80
70
60
50
40
30
EGR off
EGR on
EGR status Contact thermocouple reading Raytek reading
EGR off
0 50 100 150 200 250 300 350
Figure A1.11 Graph of surface thermocouple and Raytek readings and EGR status for Vehicle 9
Overall, these data indicate that the approach suggested here does work in principle.
A1.4.3 GENERAL APPLICABILITY
The general applicability of this approach as a means of monitoring an EGR units functionality was assessed by augmenting the information from the three vehicles described in the previous section with some simple observations from a further 6 vehicles (vehicles 10 – 15 of Table A1.1). These findings are summarised in Table A1.5.
In total 9 different models from 7 manufacturers were studied to assess the general applicability of using a non-contact thermometer to assess whether, or not, an EGR unit was functional. For the two manufacturers where two models were studied, in one case one vehicle was a small MPV whilst the other was pick-up truck, and in the other case one vehicle was a passenger car whilst the other was a people carrier. Hence overall nine quite different manufacturer/engine configurations were assessed.
UNCLASSIFIED AEA Technology A1.28

UNCLASSIFIED Low Emission Diesel Research – Phase 3 Report AEAT/ENV/R/1873 Issue 1 Annex 1 – Measurement techniques for NOX
Table A1.5 Summary of findings pertaining to general applicability of using non-contact temperature to confirm EGR unit’s functionality
Engine characteristics Level of disassembly required Visibility of EGR pipe-work Vehicle 10 Small van 2 litre engine, non-turbo,
cooled EGR None – no engine covers Yes – stainless steel connecting
bellows clearly visible Vehicle 11 Passenger car 2 litre turbocharged
engine with cooled EGR 4 snap on screwed connectors Yes – stainless steel bellows on
exhaust side of pre-cooler visible Vehicle 12 Passenger car 1.9 litre turbocharged
engine 4 awkward catches on cover Good visibility of standard thin-
walled pipe, similar to Vehicle 9 Vehicle 13 People carrier 2 litre turbocharged
engine 5 retaining nuts, removing cover was a challenge from start to finish
No – EGR unit hidden, cf Vehicle 6 but turbo waste gate clearly visible
Vehicle 14 Pick-up truck 2.5 litre turbocharged engine
None – no engine covers Good visibility of standard thin-walled pipe, similar to Vehicle 9
Vehicle 15 Small MPV 1.9 litre turbocharged engine with cooled EGR
1 bolt and 3 clips Not know, cover not removed
UNCLASSIFIED AEA Technology A1.29

UNCLASSIFIED Low Emission Diesel Research – Phase 3 Report AEAT/ENV/R/1873 Issue 1 Annex 1 – Measurement techniques for NOX
A1.4.4 CONCLUSIONS, DISCUSSION AND RECOMMENDATIONS
From the above the conclusions that can be drawn are as follows.
• The measurement of the surface temperature of an EGR pipe by a non-contact thermometer can be used to check the functionality of an EGR system
• However, this approach can not be applied to all vehicles. (The data here indicated for 2 of 9 vehicles the pipe-work was not visible, and the use of a manifold rather than a pipe precluded a third vehicle from being checked. Taking into account the popularity of the vehicles tested it is estimated that the this approach can no be applied to around a third of vehicles.
• Even when the appropriate pipe-work can be monitored, the changes in temperature that occur were not very large in the context of the measurement accuracy. (For vehicle 9 a temperature rise of 7°C was seen.)
• Better results (larger signal and less noisy) were obtained using a contact thermocouple.
• Engine covers had to be removed from all the passenger cars studied to gain visual access to the key pipe-work. These covers were often quite awkward to remove.
• Neither of the two commercial vehicles studied had an engine cover.
The issue of the accuracy and precision of surface temperature measurements by the Raytek non-contact thermometer, within the context of this application with its change in temperature being 20° at best, is a weakness.
Firstly, there is the issue of the instrument’s field of view. It is recommended that the target is larger than the unit’s viewing spot size. This is given by the relationship:
Unit’s viewing spot size = 0.125 x surface to instrument distance.
For a 15 mm diameter pipe this would require a viewing distance of < 12 cm. This aspect could be overcome by using an instrument with a different optical arrangement.
Secondly, and more seriously, there is the generic approach of using the radiation coming from a surface to measure its temperature. The instrument uses a preset surface emissivity (0.95). Whilst this is appropriate to most painted, organic or oxidised surfaces, the instrument’s manual specifically states “Not recommended for use in measuring shiny or polished metal surfaces (stainless steel, aluminium etc.). The severity of this problem is reduced for relative measurements, rather than absolute measurements. Notwithstanding, it does have the effect of attenuating an already smallish and somewhat noisy signal.
Practically, a third challenge that was encountered was that for the Raytek instrument the axis of the laser pointer is displaced from the axis of the measurement disk by 15 mm. This is not an issue when, for example, measuring a 150 mm diameter area from a distance of 1 metre, indeed the laser spot considerably helps ensuring that the instrument is pointed at the centre of the measurement area. However, this 15 mm displacement is very significant when measuring a 15 mm diameter pipe, and appropriate compensation must be made.
On balance it is felt that whilst the primary principle for this option is proven, the implementation of the technology, the need to remove covers from the engine and the challenges concerned with practically implementing a test based on this principle, means that it is not recommended that this option for in-service testing of EGR units fitted to light-duty vehicles is pursued further.
UNCLASSIFIED AEA Technology A1.30

UNCLASSIFIED Low Emission Diesel Research – Phase 3 Report AEAT/ENV/R/1873 Issue 1 Annex 1 – Measurement techniques for NOX
A1.5 Conclusions and recommendations
A1.5.1 CONCLUSIONS
A1.5.1.1 Assessment of approach using 4-gas analysers
The primary objective of this portion of research was to assess whether the approach recommended from the Phase 2, desk based, study actually works in practice. If it does then additional questions to be answered include: What is the likelihood of this approach forming the foundation of an in-service test? What might a suitable test procedure be? and how applicable is the approach to the current (and probable future) vehicle fleet? This study has concluded as follows.
• The concept of verifying the continued correct operation of an EGR system by measuring CO2 and O2 tailpipe concentrations at several engine speeds for an engine under no load conditions has been confirmed.
• Mapping the exhaust gas concentrations as a function of engine speed over the range idle to 4,000 rev/min is too complex a procedure to form the basis of a viable simple test.
• Two possible test procedures have been considered – either observing the switching of the EGR valve at low idle, or using a 2 engine speed unloaded test somewhat similar to the current in-service test for gasoline fuelled light-duty vehicles.
• It is likely that no single test will applicable to all vehicles. A degree of vehicle specificity, (e.g. specifying the engine speed to be used, or the idle test procedure) will probably be required.
• It is unlikely that fixed CO2 and O2 concentrations could form a pass/fail limit that is applicable to all vehicle types.
• However, a relative measurement of the type the CO2 concentration at 2,500 should be greater than the CO2 concentration at 3,000 rev/min, and the O2 concentration at 2,500 should be greater than the O2 concentration at 3,000 rev/min appears universally applicable on the basis of the vehicles tested.
In terms of the pivotal role of EGR units as a means of reducing NOX emissions, and the applicability of the approach to the vehicle fleet, the study concluded:
• The effectiveness of EGR units on light-duty vehicles at reducing NOX emissions is significant. On average the emissions from vehicles with disabled EGR units was nearly double that emitted when the unit was operating correctly.
• The 6 modern light-duty passenger car diesel engines tested were fitted to 47.6% of all diesel vehicle sales in 2002 (i.e. the vehicles assessed whilst being only a sample of the fleet were, in practice, a significant proportion of it). Also, there is no reason to believe that the vehicles tested were not generally representative of the fleet as a whole.
• If a further vehicle that was partially characterised in the study (on thermometry approach) is included then the 7 models tested comprise 18.7% of the sales in 2002, and the 7 manufacturers accounted for 54.8% of all 2002 sales.
• Systematically reviewing whether or not current light-duty vehicle models are fitted with EGR units, by contacting manufacturers, led to > 99.5% of vehicle sales in 2002
UNCLASSIFIED AEA Technology A1.31

UNCLASSIFIED Low Emission Diesel Research – Phase 3 Report AEAT/ENV/R/1873 Issue 1 Annex 1 – Measurement techniques for NOX
being characterised, and found that EGR units were not fitted to 0.04% of passenger cars and 0.18% of light-duty commercial vehicles (see Table A5.13 in Annex 5).
A1.5.1.2 Assessment of approach using thermometry
Assessing the validity of the approach by a detailed study on three vehicles concluded: • For two of the three vehicles used the approach could not be used. • When there is a suitably appropriate pipe whose surface temperature can be
monitored, the signal to noise ratio was not high enough to convincingly demonstrate the practicality of the technique.
• A contact thermocouple gave a better signal to noise ratio than the non-contact thermometer.
A wider assessment of applicability, using a total of nine vehicles concluded as follows. • The approach is not valid for around a third of all vehicles. • For all seven passenger cars assessed the technique required the removal of an
engine cover prior to measurements being made. • Neither of the two commercial vehicles assessed had an engine cover.
Overall it is concluded that whilst the primary principle does work the likelihood of this approach forming the basis of an acceptable and practical in-service test is low.
A1.5.2 RECOMMENDATIONS
The conclusions from these studies lead to the recommendations below:
Recommendation A1.1 The cost effectiveness of approaches that use a 4-gas analyser as the basis for an in-service NOX test for light-duty vehicles fitted with EGR should be evaluated.
Recommendation A1.2 The use of thermometry to monitor EGR pipe-work surface temperatures as an approach for the in-service testing of light-duty vehicles fitted with EGR is not considered further.
Recommendation A1.2 is made in the context of the difficulties encountered with this approach, and there being a more feasible alternative (i.e. the use of 4-gas analysers).
The technical options recommended for cost effectiveness analysis encompass the options of using a two-engine speed unloaded test and the idle test. These should be assessed alongside the “do nothing” option as a baseline or starting point. Also the effect on NOX emissions of implementing some of the technical options outlined for PM from light-duty vehicles should be included. In summary, the 5 options are:
Option N1: Change nothing – i.e. continue to test for smoke using the current free acceleration test with its pass/fail limits.
Option N2: Adapt the current roadworthiness smoke test, as described in Option PL2 (Annex 4). Do not introduce an additional test procedure.
Option N3: Introduce a new procedure, using 4-gas analysers and a 2 speed idle test that is the same for all vehicles fitted with EGR.
UNCLASSIFIED AEA Technology A1.32

UNCLASSIFIED Low Emission Diesel Research – Phase 3 Report AEAT/ENV/R/1873 Issue 1 Annex 1 – Measurement techniques for NOX
Option N4: Using 4-gas analysers, introduce new procedures, based on a 2 speed idle test, that are vehicle type specific for all vehicle types fitted with EGR.
Option N5: Using 4-gas analysers, introduce new procedures based on a changes at idle only, that are vehicle type specific and apply to most vehicle types fitted with EGR.
The cost effectiveness of these five options is assessed in Annex 5.
UNCLASSIFIED AEA Technology A1.33