Embed Size (px)
Citation preview

Annex 1: Field protocol Annex 1-Table 1: Fish data
Fish data
Date (dd/mm/yyyy) Site code Sampling method Site name Sampling location
Name of watercourse Main river region XY co-ordinates GPS co-ordinates
Longitude Transect length [m] Latitude Fished area [m2]
Altitude[m] Wetted width [m]
Fish data
Fish species number of specimen length ≤150 mm
number of specimen length >150 mm
1 2 3 4 5 6 7 8 9
10 11 12 13 14 15 16 17 18 19 20 21 22 23 24 25 26 27 28 29 30 31 32 33 34 35
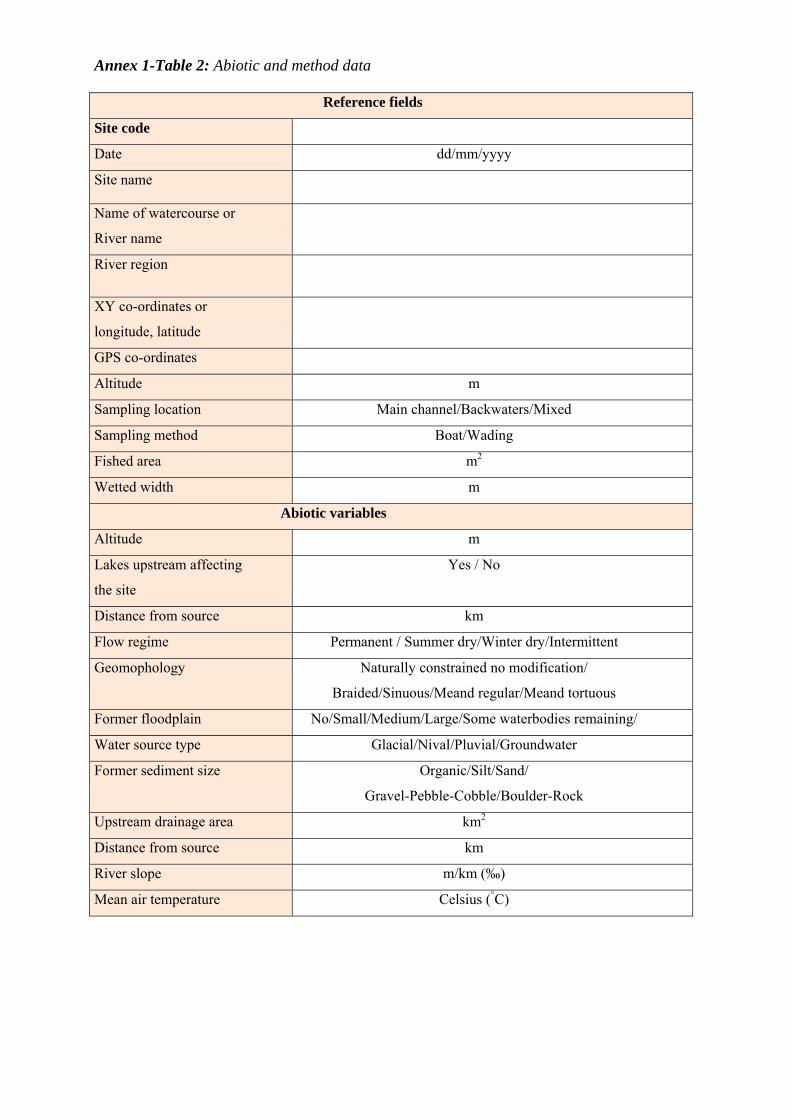
Annex 1-Table 2: Abiotic and method data
Reference fields
Site code
Date dd/mm/yyyy
Site name
Name of watercourse or
River name
River region
XY co-ordinates or
longitude, latitude
GPS co-ordinates
Altitude m
Sampling location Main channel/Backwaters/Mixed
Sampling method Boat/Wading
Fished area m2
Wetted width m
Abiotic variables
Altitude m
Lakes upstream affecting
the site
Yes / No
Distance from source km
Flow regime Permanent / Summer dry/Winter dry/Intermittent
Geomophology Naturally constrained no modification/
Braided/Sinuous/Meand regular/Meand tortuous
Former floodplain No/Small/Medium/Large/Some waterbodies remaining/
Water source type Glacial/Nival/Pluvial/Groundwater
Former sediment size Organic/Silt/Sand/
Gravel-Pebble-Cobble/Boulder-Rock
Upstream drainage area km2
Distance from source km
River slope m/km (‰)
Mean air temperature Celsius (°C)

Annex 1-Table 3: Human impact data (optional) Site code hChemical data Name watercourse Oxygen (mg/l or %
saturation)
XYZ co-ordinates or longitude latitude altitude
X:……………………(N) Y:……………………(E) Z :…………………….m
Conductivity (mS/cm)
Site name pH Main river region Phosphate (mg/l) Field responsible Nitrite (mg/l) GPS co-ordinates Nitrate (mg/l) Sampling hour Turbidity (NTU) Secchi depth (cm) Site characteristics Water level low / normal / high Natural shelters natural / poorly developed / absent Pools in transect number: Riffles in transect number: Meanders in transect number: Bank natural / partly artificial / overall reinforced Morphological condition Minor / slight / moderate / strong / severe / disturbance Agricultural activities range: 50 m from stream: none / along one bank / along both sides Prairies range: 50 m from stream: none / along one bank / along both sides Trees range: 20 m from stream: none / < 10 / >10 & < 50 / > 50 or forest Urbanisation (constructions)
range: 100 m from stream: none / < 5 / >5 & <10 / >10
Industrial activities Yes: describe…………………………..……………..…./ none Water flow Minor / slight / moderate / strong / severe / disturbance Impact of agriculture in river basin upstream
> 40% cultivated land, severe impact: class 5; > 40% cultivated land, strong impact: class 4;
< 40% cultivated land, moderate impact: class 3; < 40% cultivated land, low impact: class 2;
< 10% cultivated land: class 1; Urbanisation in river basin upstream
>15% urban land severe impact: class 5 >15% urban land strong impact: class 4
<15% urban land moderate impact: class 3 <15% urban land low impact: class 2
<1% urban land: class 1 Migration barriers (transect)
Yes: describe…………………………..……………..…./ none
Dam present upstream Yes / No Migration barriers in the river (total river)
Barriers present: no passage for fish possible: class 5 passage for 1 single species occasionally: class 4
passage for certain species or certain years: class 3 passage for most species most years: class 2 No barriers (or functional bypass): class 1

Annex 2 - River groups, Ecoregions and Mediterranean types
Annex 2-Table 1: Main European River Regions: 47 hydrological units (large basins and IHBS Sea areas), based on similarities between native fish fauna Adriatic Sea (continental coast) Medway Adriatic Sea (peninsular coast) Mersey Baltic Sea (continental coast) Meuse Baltic Sea (peninsular coast) Nemunas Bay of Biscay (French coast) North Atlantic Ocean Bay of Biscay (Spanish coast) North Sea (continental coast) Bristol Channel North Sea (insular coast) Danube Odra Douro Rhine Ebro Rhone Elbe Seine English Channel (continental coast) Severn English Channel (insular coast) Skagerrak Garonne Tagus Great Ouse Tees Guadalquivir Thames Guadiana Trent Gulf of Finland Tyne Gulf of Riga Tyrrhenian Sea Irish Sea Wear Kattegat Weser Loire Wisla Mediterranean Sea (French coast) Yorkshire Ouse Mediterranean Sea (Spanish coast)

Annex 2-Figure 1: Assignment of 47 river regions identified in the EFI+ project

Annex 2-Table 2: Ecoregion name and number according to Illies and the WFD*
Ecoregion according to WFD
1 Iberian Peninsula 14 Central Plains 2 Pyrenees 15 Baltic Province 3 Italy 16 Eastern Plains 4 Alps 17 Ireland 5 Dinarian Western Balkan 18 Great Britain 6 Hellenic Western Balkan 19 Iceland 7 Eastern Balkan 20 Borealic Uplands 8 Western Highlands 21 Tundra 9 Central Highlands 22 Fenno-Scandian Shield
10 The Carpathians 23 Taiga 11 Hungarian Lowlands 24 The Caucasus 12 Pontic Province 25 Caspic Depression 13 Western Plains
17
8
1
6
12
7
9
16
5
1110
15
2
4
3
14
13
18
2022
21
23
19
Annex 2-Figure 2: Ecoregions according to Illies and WFD in Europe*
* Note: Not all of the ecoregions shown above are covered by EFI+. To get the regions
covered by the project see Table 6 in the main text of the manual.

Annex 2-Figure 3: Mediterranean types in Europe: Brown is Mediterranean type 1; Yellow
is Mediterranean type 2

Annex 3: Fish species in EFI software
Annex 3 – Table 1
id Species id Species
1 Abramis ballerus 26 Ameiurus nebulosus
2 Abramis bjoerkna 27 Ameiurus punctatus
3 Abramis brama 28 Anaecypris hispanica
4 Abramis sapa 29 Anguilla anguilla
5 Achondrostoma arcasii 30 Aphanius fasciatus
6 Achondrostoma occidentale 31 Aphanius iberus
7 Achondrostoma oligolepis 32 Aristichthys nobilis
8 Acipenser baeri 33 Aspius aspius
9 Acipenser gueldenstaedtii 34 Atherina boyeri
10 Acipenser naccarii 35 Atherina presbyter
11 Acipenser nudiventris 36 Barbatula barbatula
12 Acipenser oxyrinchus 37 Barbatula bureschi
13 Acipenser ruthenus 38 Barbaus carpaticus
14 Acipenser stellatus 39 Barbus albanicus
15 Acipenser sturio 40 Barbus barbus
16 Alburnoides bipunctatus 41 Barbus bocagei
17 Alburnus albidus 42 Barbus caninus
18 Alburnus alburnus 43 Barbus comizo
19 Alburnus alburnus alborella 44 Barbus cyclolepis
20 Alosa agone 45 Barbus euboicus
21 Alosa alosa 46 Barbus graecus
22 Alosa fallax 47 Barbus graellsii
23 Alosa macedonica 48 Barbus guiraonis
24 Alosa immaculata 49 Barbus haasi
25 Ameiurus melas 50 Barbus meridionalis
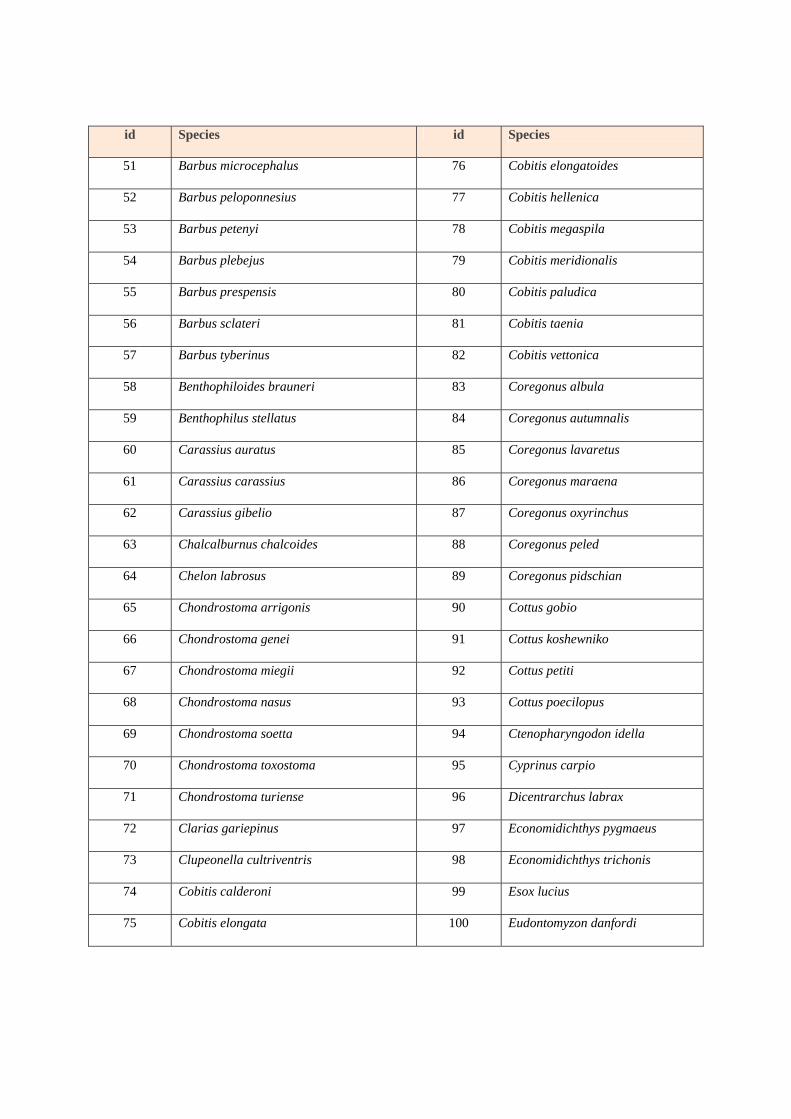
id Species id Species
51 Barbus microcephalus 76 Cobitis elongatoides
52 Barbus peloponnesius 77 Cobitis hellenica
53 Barbus petenyi 78 Cobitis megaspila
54 Barbus plebejus 79 Cobitis meridionalis
55 Barbus prespensis 80 Cobitis paludica
56 Barbus sclateri 81 Cobitis taenia
57 Barbus tyberinus 82 Cobitis vettonica
58 Benthophiloides brauneri 83 Coregonus albula
59 Benthophilus stellatus 84 Coregonus autumnalis
60 Carassius auratus 85 Coregonus lavaretus
61 Carassius carassius 86 Coregonus maraena
62 Carassius gibelio 87 Coregonus oxyrinchus
63 Chalcalburnus chalcoides 88 Coregonus peled
64 Chelon labrosus 89 Coregonus pidschian
65 Chondrostoma arrigonis 90 Cottus gobio
66 Chondrostoma genei 91 Cottus koshewniko
67 Chondrostoma miegii 92 Cottus petiti
68 Chondrostoma nasus 93 Cottus poecilopus
69 Chondrostoma soetta 94 Ctenopharyngodon idella
70 Chondrostoma toxostoma 95 Cyprinus carpio
71 Chondrostoma turiense 96 Dicentrarchus labrax
72 Clarias gariepinus 97 Economidichthys pygmaeus
73 Clupeonella cultriventris 98 Economidichthys trichonis
74 Cobitis calderoni 99 Esox lucius
75 Cobitis elongata 100 Eudontomyzon danfordi
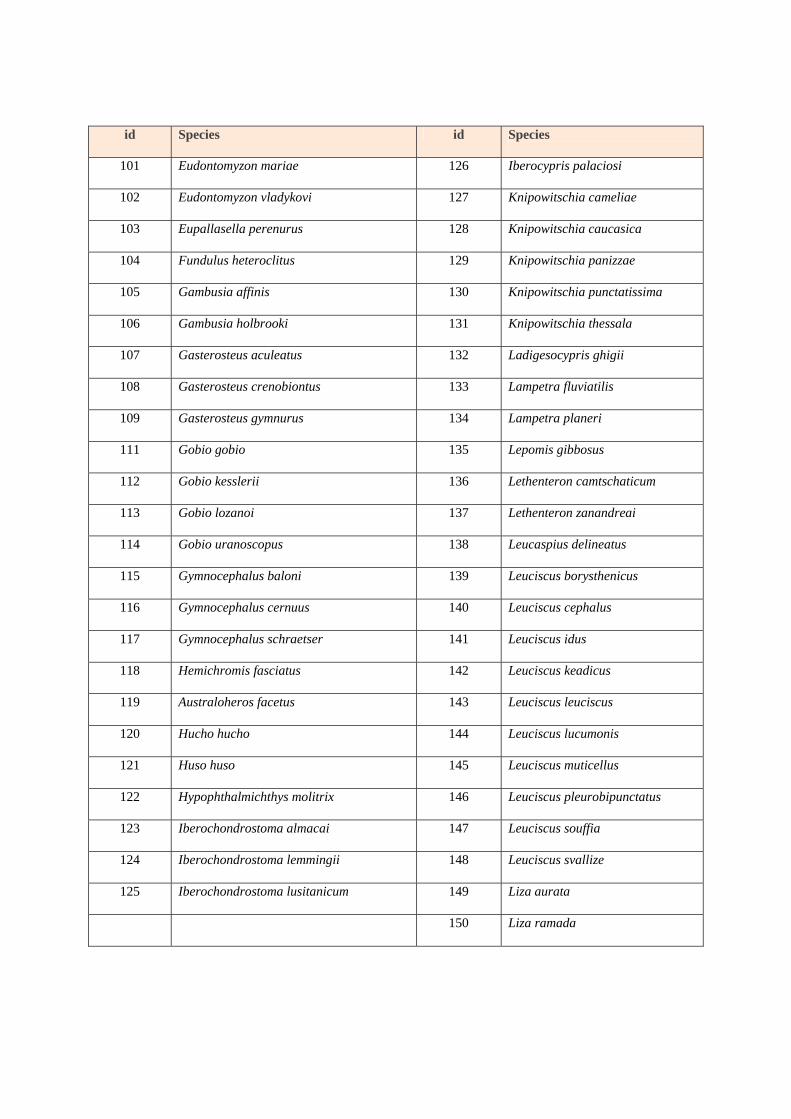
id Species id Species
101 Eudontomyzon mariae 126 Iberocypris palaciosi
102 Eudontomyzon vladykovi 127 Knipowitschia cameliae
103 Eupallasella perenurus 128 Knipowitschia caucasica
104 Fundulus heteroclitus 129 Knipowitschia panizzae
105 Gambusia affinis 130 Knipowitschia punctatissima
106 Gambusia holbrooki 131 Knipowitschia thessala
107 Gasterosteus aculeatus 132 Ladigesocypris ghigii
108 Gasterosteus crenobiontus 133 Lampetra fluviatilis
109 Gasterosteus gymnurus 134 Lampetra planeri
111 Gobio gobio 135 Lepomis gibbosus
112 Gobio kesslerii 136 Lethenteron camtschaticum
113 Gobio lozanoi 137 Lethenteron zanandreai
114 Gobio uranoscopus 138 Leucaspius delineatus
115 Gymnocephalus baloni 139 Leuciscus borysthenicus
116 Gymnocephalus cernuus 140 Leuciscus cephalus
117 Gymnocephalus schraetser 141 Leuciscus idus
118 Hemichromis fasciatus 142 Leuciscus keadicus
119 Australoheros facetus 143 Leuciscus leuciscus
120 Hucho hucho 144 Leuciscus lucumonis
121 Huso huso 145 Leuciscus muticellus
122 Hypophthalmichthys molitrix 146 Leuciscus pleurobipunctatus
123 Iberochondrostoma almacai 147 Leuciscus souffia
124 Iberochondrostoma lemmingii 148 Leuciscus svallize
125 Iberochondrostoma lusitanicum 149 Liza aurata
150 Liza ramada

id Species id Species
151 Liza saliens 176 Petromyzon marinus
152 Lota lota 177 Phoxinus phoxinus
153 Micropterus salmoides 178 Pimephales promelas
154 Misgurnus anguillicaudatus 179 Platichthys flesus
155 Misgurnus fossilis 180 Pleuronectes platessa
156 Mugil cephalus 181 Poecilia reticulata
157 Mylopharyngodon piceus 182 Polyodon spathula
158 Neogobius fluviatilis 183 Pomatoschistus microps
159 Neogobius gymnotrachelus 184 Pomatoschistus minutus
160 Neogobius kessleri 185 Proterorhinus marmoratus
161 Neogobius melanostomus 186 Pseudochondrostoma duriense
162 Neogobius syrman 187 Pseudochondrostoma polylepis
163 Oncorhynchus gorbuscha 188 Pseudochondrostoma willkommii
164 Oncorhynchus kisutch 189 Pseudophoxinus beoticus
165 Oncorhynchus mykiss 190 Pseudophoxinus stymphalicus
166 Oncorhynchus tschawytscha 191 Pseudorasbora parva
167 Oreochromis niloticus 192 Pungitius hellenicus
168 Osmerus eperlanus 193 Pungitius pungitius
169 Pachychilon pictum 194 Rhodeus amarus
170 Padogobius bonelli 195 Romanichthys valsanicola
171 Padogobius martensii 196 Romanogobio antipai
172 Padogobius nigricans 197 Romanogobio banaticus
173 Pelecus cultratus 198 Romanogobio belingi
174 Perca fluviatilis 199 Romanogobio vladykovi
175 Perccottus glenii 200 Rutilus aula
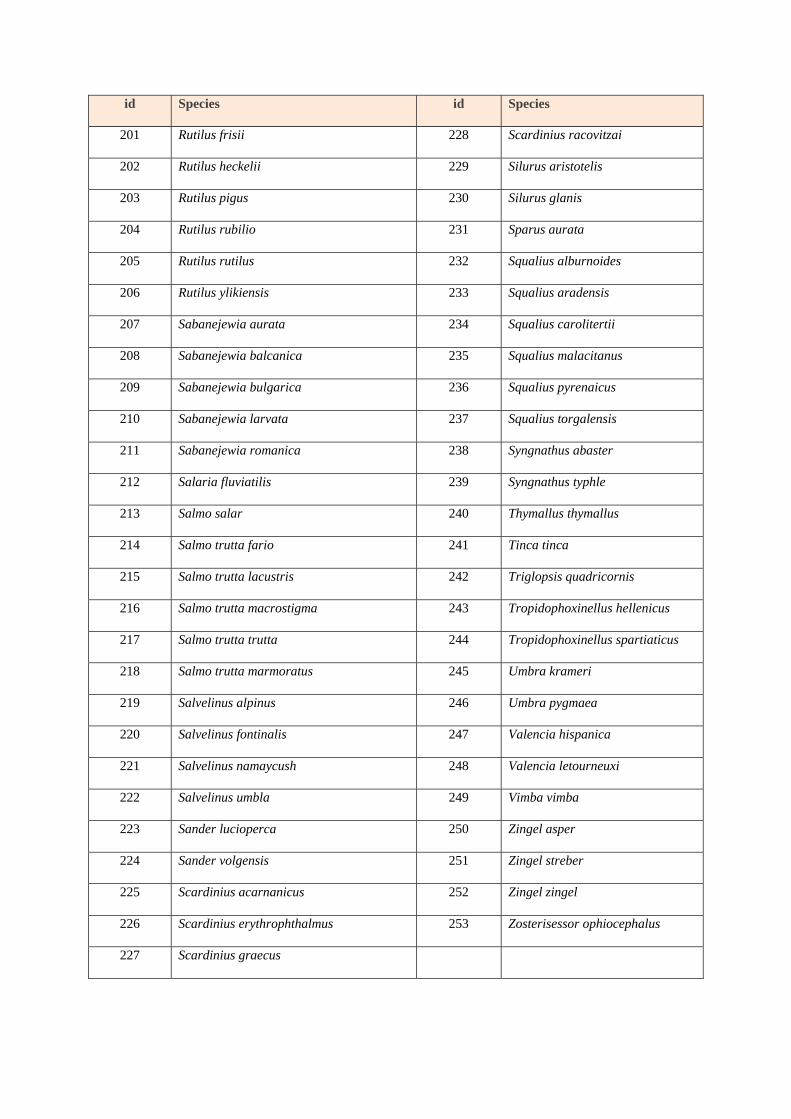
id Species id Species
201 Rutilus frisii 228 Scardinius racovitzai
202 Rutilus heckelii 229 Silurus aristotelis
203 Rutilus pigus 230 Silurus glanis
204 Rutilus rubilio 231 Sparus aurata
205 Rutilus rutilus 232 Squalius alburnoides
206 Rutilus ylikiensis 233 Squalius aradensis
207 Sabanejewia aurata 234 Squalius carolitertii
208 Sabanejewia balcanica 235 Squalius malacitanus
209 Sabanejewia bulgarica 236 Squalius pyrenaicus
210 Sabanejewia larvata 237 Squalius torgalensis
211 Sabanejewia romanica 238 Syngnathus abaster
212 Salaria fluviatilis 239 Syngnathus typhle
213 Salmo salar 240 Thymallus thymallus
214 Salmo trutta fario 241 Tinca tinca
215 Salmo trutta lacustris 242 Triglopsis quadricornis
216 Salmo trutta macrostigma 243 Tropidophoxinellus hellenicus
217 Salmo trutta trutta 244 Tropidophoxinellus spartiaticus
218 Salmo trutta marmoratus 245 Umbra krameri
219 Salvelinus alpinus 246 Umbra pygmaea
220 Salvelinus fontinalis 247 Valencia hispanica
221 Salvelinus namaycush 248 Valencia letourneuxi
222 Salvelinus umbla 249 Vimba vimba
223 Sander lucioperca 250 Zingel asper
224 Sander volgensis 251 Zingel streber
225 Scardinius acarnanicus 252 Zingel zingel
226 Scardinius erythrophthalmus 253 Zosterisessor ophiocephalus
227 Scardinius graecus
Annex 4: Guild tables
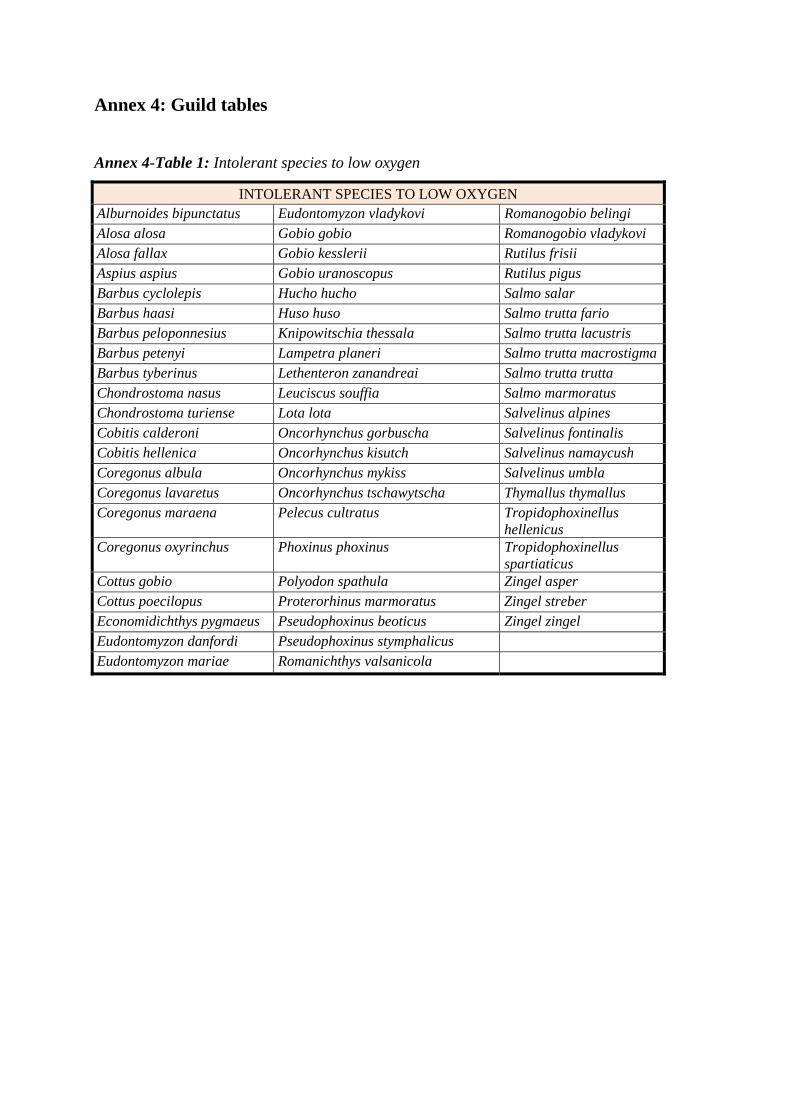
Annex 4-Table 1: Intolerant species to low oxygen
INTOLERANT SPECIES TO LOW OXYGEN Alburnoides bipunctatus Eudontomyzon vladykovi Romanogobio belingi Alosa alosa Gobio gobio Romanogobio vladykovi Alosa fallax Gobio kesslerii Rutilus frisii Aspius aspius Gobio uranoscopus Rutilus pigus Barbus cyclolepis Hucho hucho Salmo salar Barbus haasi Huso huso Salmo trutta fario Barbus peloponnesius Knipowitschia thessala Salmo trutta lacustris Barbus petenyi Lampetra planeri Salmo trutta macrostigmaBarbus tyberinus Lethenteron zanandreai Salmo trutta trutta Chondrostoma nasus Leuciscus souffia Salmo marmoratus Chondrostoma turiense Lota lota Salvelinus alpines Cobitis calderoni Oncorhynchus gorbuscha Salvelinus fontinalis Cobitis hellenica Oncorhynchus kisutch Salvelinus namaycush Coregonus albula Oncorhynchus mykiss Salvelinus umbla Coregonus lavaretus Oncorhynchus tschawytscha Thymallus thymallus Coregonus maraena Pelecus cultratus Tropidophoxinellus
hellenicus Coregonus oxyrinchus Phoxinus phoxinus Tropidophoxinellus
spartiaticus Cottus gobio Polyodon spathula Zingel asper Cottus poecilopus Proterorhinus marmoratus Zingel streber Economidichthys pygmaeus Pseudophoxinus beoticus Zingel zingel Eudontomyzon danfordi Pseudophoxinus stymphalicus Eudontomyzon mariae Romanichthys valsanicola

Annex 4-Table 2: Intolerant species to habitat degradation
INTOLERANT SPECIES TO HABITAT DEGRADATION Abramis ballerus Chondrostoma turiense Oncorhynchus kisutch Achondrostoma arcasii Cobitis calderoni Oncorhynchus tschawytscha Acipenser oxyrinchus Coregonus albula Phoxinus phoxinus Acipenser sturio Coregonus lavaretus Proterorhinus marmoratus Alburnoides bipunctatus Cottus gobio Pseudophoxinus beoticus Alosa agone Cottus petiti Rhodeus amarus Alosa alosa Cottus poecilopus Romanichthys valsanicola Alosa pontica Eudontomyzon danfordi Sabanejewia balcanica Barbus barbus Eudontomyzon mariae Sabanejewia larvata Barbus caninus Eudontomyzon vladykovi Salmo salar Barbus cyclolepis Eupallasella perenurus Salmo trutta fario Barbus haasi Gobio kesslerii Salmo trutta lacustris Barbus meridionalis Gobio uranoscopus Salmo trutta trutta Barbus peloponnesius Hucho hucho Salvelinus alpines Barbus petenyi Iberochondrostoma almacai Salvelinus fontinalis Barbus tyberinus Iberocypris palaciosi Salvelinus namaycush Benthophiloides brauneri Knipowitschia punctatissima Salvelinus umbla Benthophilus stellatus Lampetra fluviatilis Scardinius racovitzai Chalcalburnus chalcoides Lampetra planeri Thymallus thymallus Chondrostoma arrigonis Lethenteron zanandreai Tinca tinca Chondrostoma genei Leuciscus muticellus Umbra krameri Chondrostoma miegii Leuciscus souffia Vimba vimba Chondrostoma nasus Misgurnus fossilis Zingel asper Chondrostoma soetta Neogobius syrman Zingel streber Chondrostoma toxostoma Oncorhynchus gorbuscha Zingel zingel

Annex 4-Table 3: Rheopar species
RHEOPAR SPECIES Abramis sapa Chondrostoma arrigonis Leuciscus souffia Achondrostoma arcasii Chondrostoma genei Leuciscus svallize Achondrostoma occidentale Chondrostoma miegii Oncorhynchus gorbuscha Achondrostoma oligolepis Chondrostoma nasus Oncorhynchus kisutch Acipenser baeri Chondrostoma soetta Oncorhynchus mykiss Acipenser gueldenstaedtii Chondrostoma toxostoma Oncorhynchus tschawytscha Acipenser naccarii Chondrostoma turiense Padogobius martensii Acipenser nudiventris Cobitis calderoni Padogobius nigricans Acipenser oxyrinchus Coregonus maraena Petromyzon marinus Acipenser ruthenus Coregonus oxyrinchus Polyodon spathula Acipenser stellatus Cottus gobio Pseudochondrostoma duriense Acipenser sturio Cottus petiti Pseudochondrostoma polylepis Alburnoides bipunctatus Cottus poecilopus Pseudochondrostoma willkommiiAlosa alosa Ctenopharyngodon idella Pseudophoxinus beoticus Alosa fallax Dicentrarchus labrax Romanogobio belingi Alosa pontica Eudontomyzon mariae Romanogobio vladykovi Anaecypris hispanica Eudontomyzon vladykovi Rutilus frisii Aristichthys nobilis Gobio gobio Rutilus pigus Aspius aspius Gobio kesslerii Rutilus rubilio Barbus barbus Gobio uranoscopus Sabanejewia balcánica Barbus bocagei Gymnocephalus schraetser Salmo marmoratus Barbus caninus Hucho hucho Salmo salar Barbus comizo Huso huso Salmo trutta fario Barbus cyclolepis Hypophthalmichthys molitrix Salmo trutta lacustris Barbus euboicus Iberochondrostoma almacai Salmo trutta macrostigma Barbus graellsii Iberochondrostoma lemmingii Salmo trutta trutta Barbus guiraonis Iberochondrostoma lusitanicum Salvelinus alpinus Barbus haasi Knipowitschia punctatissima Salvelinus fontinalis Barbus meridionalis Lampetra fluviatilis Salvelinus umbla Barbus microcephalus Lampetra planeri Thymallus thymallus Barbus peloponnesius Lethenteron zanandreai Tropidophoxinellus spartiaticus Barbus petenyi Leuciscus cephalus Vimba vimba Barbus plebejus Leuciscus keadicus Zingel asper Barbus prespensis Leuciscus leuciscus Zingel streber Barbus sclateri Leuciscus lucumonis Zingel zingel Barbus tyberinus Leuciscus muticellus Leuciscus pleurobipunctatus

Annex 4-Table 4: Lithophilic species
LITHOPHILIC SPECIES
Abramis ballerus Chondrostoma miegii Neogobius kessleri Abramis sapa Chondrostoma nasus Neogobius melanostomus Acipenser baeri Chondrostoma soetta Oncorhynchus gorbuscha Acipenser naccarii Chondrostoma toxostoma Oncorhynchus kisutch Acipenser oxyrinchus Chondrostoma turiense Oncorhynchus mykiss Acipenser ruthenus Cobitis calderoni Oncorhynchus tschawytscha Acipenser sturio Cobitis meridionalis Osmerus eperlanus Alburnoides bipunctatus Cobitis vettonica Petromyzon marinus Alosa macedonica Coregonus albula Phoxinus phoxinus Ameiurus melas Coregonus autumnalis Polyodon spathula Aspius aspius Coregonus lavaretus Pseudochondrostoma duriense Barbatula barbatula Coregonus maraena Pseudochondrostoma polylepis Barbus albanicus Coregonus oxyrinchus Pseudochondrostoma willkommii Barbus barbus Coregonus peled Pseudophoxinus beoticus Barbus bocagei Eudontomyzon mariae Salmo marmoratus Barbus caninus Eudontomyzon vladykovi Salmo salar Barbus comizo Gobio uranoscopus Salmo trutta fario Barbus cyclolepis Gymnocephalus schraetser Salmo trutta lacustris Barbus euboicus Hucho hucho Salmo trutta macrostigma Barbus graecus Huso huso Salmo trutta trutta Barbus graellsii Iberocypris palaciosi Salvelinus alpines Barbus guiraonis Lampetra fluviatilis Salvelinus fontinalis Barbus haasi Lampetra planeri Salvelinus namaycush Barbus meridionalis Lethenteron zanandreai Salvelinus umbla Barbus microcephalus Leuciscus borysthenicus Squalius alburnoides Barbus peloponnesius Leuciscus cephalus Squalius aradensis Barbus petenyi Leuciscus keadicus Squalius carolitertii Barbus plebejus Leuciscus leuciscus Squalius pyrenaicus Barbus prespensis Leuciscus lucumonis Squalius torgalensis Barbus sclateri Leuciscus muticellus Thymallus thymallus Barbus tyberinus Leuciscus pleurobipunctatus Vimba vimba Chalcalburnus chalcoides Leuciscus souffia Zingel asper Chondrostoma arrigonis Leuciscus svallize Zingel streber Chondrostoma genei Lota lota Zingel zingel

Annex 5: Data Catalogue
Annex 5-Table 1. Variable catalogue of exchange file Input.txt
variables type Description Sample code Character Site name (unique) Day Integer e.g.: 08 Month Integer e.g.: 10 Year Integer e.g.: 2008 Longitude Float Longitude (in decimal degree)
Latitude Float Latitude (in decimal degree)
Sampling.location Character Where the sampling site is situated in relation to the river: Main channel, Backwaters, Mixed, NoData
Actual.river.slope Float Slope of the river segment (in m/km) Temp.jul Float July temperature (in °C) Temp.jan Float January temperature (in °C) Floodplain.site Character Presence or absence of floodplain (2 modalities, Yes or No) Water.source.type Character Water source type (4 modalities, more description in database
manual) Geomorph.river.type Character (5 modalities, more description in database manual) Distance.from.source Float Distance from the source (in km) Area.ctch Float Upstream drainage area (in km2) Natural.sediment Character Natural sediment (5 modalities) Ecoreg Character Illies ecoregions Fished area Float In meter squared Method Character Wading or Boating or Mixed Eft.type Character European fish type proposed in the FAME project (see FAME
documentation http://fame.boku.ac.at/ for more details). Medit Integer Variable which indicates the Mediterranean status of the site. Species Character Species names of the fish Total.number.run1 Float Fish number for a given species for the first Run (see database
manual for more details). Number.length.below.150 Float Fish number inferior or equal to 150mm for a given species for
the first Run (see database manual for more details). Number.length.over.150 Float Fish number superior to 150mm for a given species for the first
Run (see database manual for more details).

Annex 5-Table 2. Variable catalogue of the exchange file “diadromous.txt” Variables Type Description
Sample code Character Unique
Day Integer e.g.: 08
Month Integer e.g.: 10
Year Integer e.g.: 2008
Longitude Numeric Longitude (in decimal degree)
Latitude Numeric Latitude (in decimal degree)
Acipenser.naccarii.historic Character "NoData" or "No" or "Yes"
Acipenser.naccarii.present Character "No" or "Yes"
Acipenser.gueldenstädti.historic. Character "NoData" or "No" or "Yes"
Acipenser.gueldenstädti.present. Character "No" or "Yes"
Acipenser.nudiventris.historic Character "NoData" or "No" or "Yes"
Acipenser.nudiventris.present Character "No" or "Yes"
Acipenser.stellatus.historic Character "NoData" or "No" or "Yes"
Acipenser.stellatus.present Character "No" or "Yes"
Acipenser.sturio.historic Character "NoData" or "No" or "Yes"
Acipenser.sturio.present Character "No" or "Yes"
Alosa.alosa.historic Character "NoData" or "No" or "Yes"
Alosa.alosa.present Character "No" or "Yes"
Alosa.fallax.historic Character "NoData" or "No" or "Yes"
Alosa.fallax.present Character "No" or "Yes"
Alosa.pontica .historic Character "NoData" or "No" or "Yes"
Alosa.pontica .present Character "No" or "Yes"
Anguilla.anguilla.historic Character "NoData" or "No" or "Yes"
Anguilla.anguilla.present Character "No" or "Yes"
Huso.huso.historic Character "NoData" or "No" or "Yes"
Huso.huso.present Character "No" or "Yes"
Lampetra.fluviatilis.historic Character "NoData" or "No" or "Yes"
Lampetra.fluviatilis.present Character "No" or "Yes"
Petromyzon.marinus.historic Character "NoData" or "No" or "Yes"
Petromyzon.marinus.present Character "No" or "Yes"
Osmerus.eperlanus.historic Character "NoData" or "No" or "Yes"
Osmerus.eperlanus.present Character "No" or "Yes"
Salmo.salar.historic Character "NoData" or "No" or "Yes"
Salmo.salar.present Character "No" or "Yes"
Sea.Trout.historic Character "NoData" or "No" or "Yes"
Sea.Trout.present Character "No" or "Yes"
Flounder.historic Character "NoData" or "No" or "Yes"
Flounder.present Character "No" or "Yes"
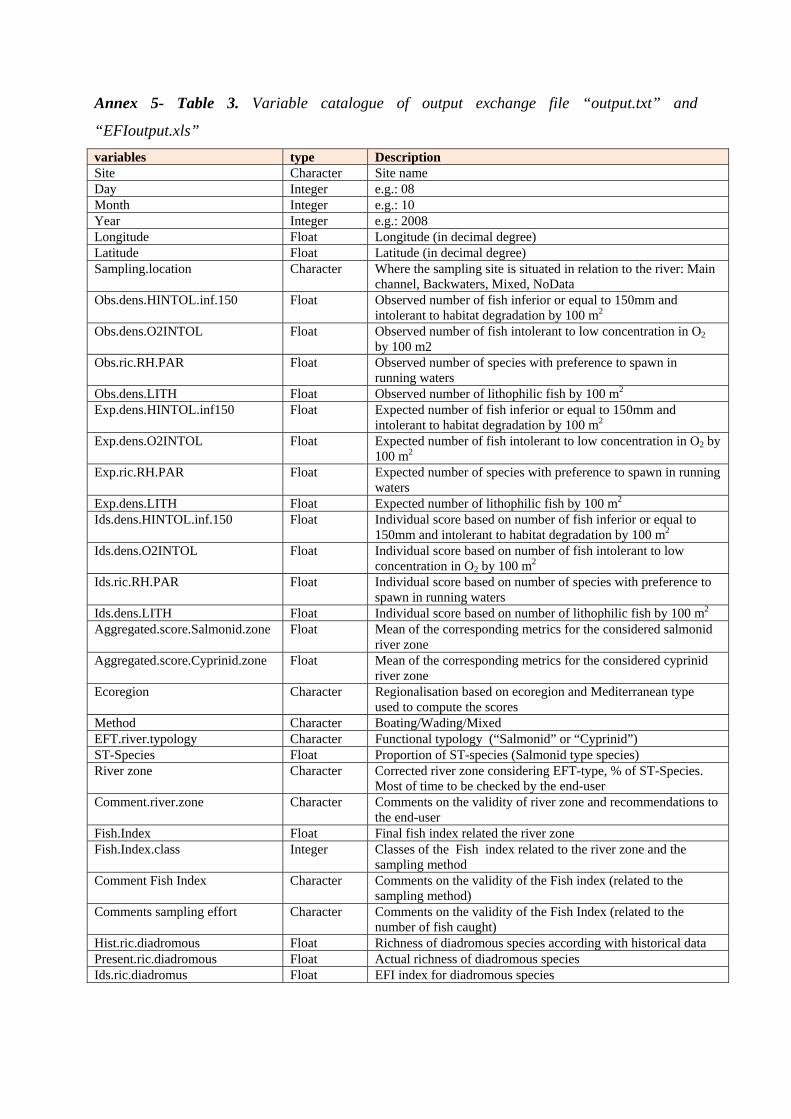
Annex 5- Table 3. Variable catalogue of output exchange file “output.txt” and
“EFIoutput.xls” variables type Description Site Character Site name Day Integer e.g.: 08 Month Integer e.g.: 10 Year Integer e.g.: 2008 Longitude Float Longitude (in decimal degree) Latitude Float Latitude (in decimal degree) Sampling.location Character Where the sampling site is situated in relation to the river: Main
channel, Backwaters, Mixed, NoData Obs.dens.HINTOL.inf.150 Float Observed number of fish inferior or equal to 150mm and
intolerant to habitat degradation by 100 m2 Obs.dens.O2INTOL Float Observed number of fish intolerant to low concentration in O2
by 100 m2 Obs.ric.RH.PAR Float Observed number of species with preference to spawn in
running waters Obs.dens.LITH Float Observed number of lithophilic fish by 100 m2 Exp.dens.HINTOL.inf150 Float Expected number of fish inferior or equal to 150mm and
intolerant to habitat degradation by 100 m2 Exp.dens.O2INTOL Float Expected number of fish intolerant to low concentration in O2 by
100 m2 Exp.ric.RH.PAR Float Expected number of species with preference to spawn in running
waters Exp.dens.LITH Float Expected number of lithophilic fish by 100 m2 Ids.dens.HINTOL.inf.150 Float Individual score based on number of fish inferior or equal to
150mm and intolerant to habitat degradation by 100 m2 Ids.dens.O2INTOL Float Individual score based on number of fish intolerant to low
concentration in O2 by 100 m2 Ids.ric.RH.PAR Float Individual score based on number of species with preference to
spawn in running waters Ids.dens.LITH Float Individual score based on number of lithophilic fish by 100 m2 Aggregated.score.Salmonid.zone Float Mean of the corresponding metrics for the considered salmonid
river zone Aggregated.score.Cyprinid.zone Float Mean of the corresponding metrics for the considered cyprinid
river zone Ecoregion Character Regionalisation based on ecoregion and Mediterranean type
used to compute the scores Method Character Boating/Wading/Mixed EFT.river.typology Character Functional typology (“Salmonid” or “Cyprinid”) ST-Species Float Proportion of ST-species (Salmonid type species) River zone Character Corrected river zone considering EFT-type, % of ST-Species.
Most of time to be checked by the end-user Comment.river.zone Character Comments on the validity of river zone and recommendations to
the end-user Fish.Index Float Final fish index related the river zone Fish.Index.class Integer Classes of the Fish index related to the river zone and the
sampling method Comment Fish Index Character Comments on the validity of the Fish index (related to the
sampling method) Comments sampling effort Character Comments on the validity of the Fish Index (related to the
number of fish caught) Hist.ric.diadromous Float Richness of diadromous species according with historical data Present.ric.diadromous Float Actual richness of diadromous species Ids.ric.diadromus Float EFI index for diadromous species

Annex 6: Software technical report
Technical background
An analysis of IT technologies identified that the best solution for the software tool was a web-based information system managed by Apache 2.0. Pages and input formats were mainly built with XHTML and were embedded using JavaScript and XML. Processing data, for entering, validating, homogenising and identification of errors was made using by PHP 5.2. Some internal checking files were managed with MySQL as guilds tables, abbreviations and codes.
Annex 6- Figure 1: Tree layers scheme of the application
The web page is adapted for the main web navigators (Firefox, Explorer 7 and 8) and the iphone, it has been made according to XHTML 1.0 Transactional W3C rules. The advantages of this software implementation are: • Users can access the EFI+ software by standard web-navigator from different platforms
and operating systems. • The Web Server holds the common files required for checking and calculating. • The system allows the use of R-project for Statistical Computing (v. 2.6.1 and v.2.7.1).
The web application is composed of two modules: an application made in PHP language for entering data and the statistical code written in R language for obtaining metrics, scores and the final EFI+ index. Once data are entered and sent to the server, a fractionated process begins. Firstly data are filtered by PHP routines where data are checked to avoid bugs, mistakes and gaps. In the case of qualitative variables, records are checked against possible categories, whereas numeric variables are checked against a confidence interval and frequently it is only to check as positive value. The software is able to handle the existence of no data. In such cases the value is recorded as a code that means “No data” (the common database item null), consequently for character type data it should be “NoData”, for numeric data (integer and floating) it

should be “-999”. The PHP application fixes some small mistakes and fills in some predictable gaps but the user has to change any records identified as wrong by the data filters.. After completing and checking all data, the PHP-code builds an ASCII comma separated value file (csv), called Input.txt, and triggers the R code.
The Input.xls is fulfilled by the user at the beginning of the procedure. The Input.xls is checked and corrected if necessary by the user. The EFT types are computed for each fishing occasions by the software and will be included in input.txt.
Input.txt is the file used for the computation of the expected values and scores values by R.
The output.txt is the file provided by the R application and used by PHP application to get the final output for user
PHP code reads output.txt and provides an available Excel file.
Annex 6- Figure 2: Simplified information flow through data files and code-scripts. Once the PHP-code triggers the R-code then input.txt and diadromous.txt are loaded and all necessary data (observed data, expected data, scores and index) are calculated by the R code. Observed data contains the sampled metrics, expected data contains the expected values of metrics according to the models made with calibration sites, in scores are written the residual values and the last section contains the final indices. Finally these four data sets are put together in the file output.txt and an incidence file (info.out). These files together with a structured file system are needed to run the EFI+ R software: repository files as fauna.txt and environ.txt, R core and routines scripts (models, lengthmodels, geomodels, guild, stdpack, lengthstdpack).

Annex 7: Index development Dataset description The initial database contained 14221 sites corresponding to 29509 sampling occasions distributed in 15 countries: Austria, Switzerland, Germany, Spain, Finland, France, Hungary, Italy, Lithuania, Netherlands, Poland, Portugal, Romania, Sweden and UK. For the index development, only one sampling occasion per site was considered and sites for which data were incomplete were excluded. The final working database contained 9948 sites, from which two specific datasets were defined:
• The first dataset corresponds to the slightly disturbed sites (SID, N= 2526) that
represent no or a slight degree of perturbation (selection based only on the pressure variables). This dataset was used to explore, and to test, the response of metrics among ecoregions in the « quasi » absence of pressure.
• The second dataset was defined as the calibration dataset (CD) (included within the SID) and was used to model the metrics. The selection process of the calibration site was relatively strict and was extended to the effects of pressure (i.e. modification of the hydrological regime).
In addition, only sampling occasions where the number of fish caught were greater than 50 individuals were retained in the analysis to reduce the potential effect of the sampling effort on the assessment of assemblage structure. Finally, site selection was completed by the exclusion of neighbouring sites to limit spatial autocorrelation and by a sub-sampling procedure to balance the representation of calibration sites located different regions of Europe (reduce the influence of the large number of calibration sites in the North of Poland, in Romania and in the North of Spain [e.g. Galicia and Asturias]). Following these selection criteria, 533 calibration sites were retained to model the metrics, representing only 5.3% of the initial dataset. Such a strict selection process was essential to obtain an unbiased calibration dataset and unbiased models.
Modelling process The metrics were modelled by generalised linear modelling (Nelder Wedderburn 1972, McCullagh & Nelder 1989) and a stepwise procedure based on Akaike Information Criteria (AIC, Venables & Ripley 1999). This approach was considered to be a good compromise between over-fitting of models and final predictive error. The metrics based on the species number were modelled by a Poisson model with logarithmic link whereas a negative binomial distribution was used for models based on fish number because fish abundance data are largely over-dispersed. An offset parameter was systematically used to impose a baseline corresponding to total richness or total number of fish (e.g. McCullagh & Nelder 1989, Cameron & Trivedi 1998). The environmental variables used to model metrics integrate several aspects of river characteristics such as morphology and climate. Six environmental variables were selected: actual river slope (log-transformed, m/km), average July temperature (°C), Thermal amplitude (Tdif=Tjul-Tjan, °C), natural sediment (coded in 3 categories) and two computed variables based on linear combination (Principle Component Analysis) of geomorphological variables. In addition, a specific weighting stratified by Strahler order and ichtyoregions (Reyjol et al. 2007) was applied to reduce the unbalanced spatial organisation of the calibration dataset.

Orthogonal polynomials (of degree 2) were calculated for river slope and average July temperature to account for the non-linear response of metrics to these environmental variables.
Model selection The model selection process was based on two main steps:
• The first selection step was based on simple criteria, such as the structure of modelling residuals, and good adjustment of the fitted value enabled the reduction of the number of models selected. This first screening was essential, as for each modality of a given ecological trait, more than 5 different metrics could be computed (e.g. binary, count proportion data based on species number and count and proportion date based on fish number).
• The second selection step involved the consideration of more complex criteria. The selected models are characterised by a satisfactory stability, satisfactory agreement between expected and observed values, low residuals structure and quasi-normal residuals distribution. The consideration of these criteria is strongly required to increase the extrapolation capacity of models and to limit the bias of predictions based on environmental conditions outside of the calibration environment.
After a few conservative and strict modelling processes, the number of candidate metrics retained was relatively low. Only 13 metrics were retained: five metrics based on species number (Ric.O2.Intol, Ric.Hab.Intol, Ric.Hab.RH, Ric.INSV and Ric.RH.Par), four metrics based on fish number (Ni.O2.Intol, Ni.hab.Intol, Ni.INSV and Ni.LITHO) and four metrics based on the number of individuals with a total length of <150 mm (Ni.O2.Intol.150, Ni.Hab.Intol.150, Ni.RH.150 and Ni.INSV.150). Metric selection Three criteria were used to select metrics:
- Correlation between metrics - Pearson coefficient < |0.70|, - Representativeness of the metric in the different ecoregions. - Sensitivity of the metric to the index of pressure
In some particular ecoregions and/or countries, species belonging to some of the candidate guilds were never abundant, even in undisturbed sites. This was particularly the case for the cyprinid river type and eastern or Mediterranean regions. Several tests and previous analysis demonstrated that in such situations, the score was always underestimated for sites belonging to the lowest pressure group: the median value of sites was not close to 0.80, as for other metrics, but was below 0.50 and the score of all sites, whatever the level of human disturbance, was always underestimated. In all cases, the metrics based on the guild of insectivorous species were insensitive to pressure. In the salmonid river type, the most sensitive metrics were based on oxygen depletion and habitat intolerant guild species, and were expressed in “relative” abundance of individuals. The two corresponding metrics considering both the size classes were highly correlated (Ni.O2.Intol and Ni.Hab.Intol.150). Among the metrics expressed in term of abundance of small-sized individuals, the two metrics based on these species guilds are also
highly correlated (Ni.O2.Intol.150 - Ni.Hab.Intol.150). In order to not use the same guilds with two different metrics, and following complementary evaluation of metrics responses, only the two following metrics are selected:
For the cyprinid river type, the metrics based on oxygen depletion and habitat intolerance could not be used due to their lack of representativeness in several ecoregions. Among the others and considering the high correlation between Ric.Hab.RH and Ric.RH.Par, only two metrics were retained. Ric.RH.PAR was preferred to Ric.Hab.RH due to its higher relative abundance in undisturbed Mediterranean sites. The metrics finally selected were:
Salmonid river type: Ni.O2.Intol and Ni.Hab.Intol.150 Cyprinid river type: Ric.RH.PAR and Ni.LITHO
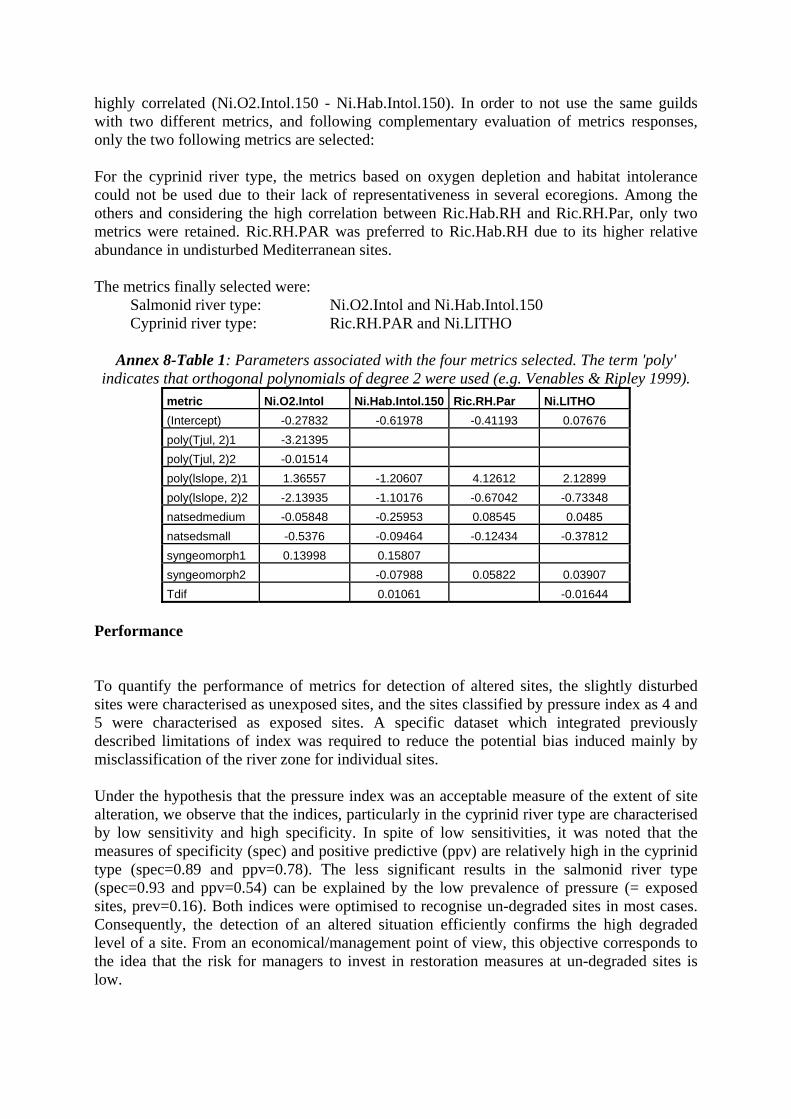
Annex 8-Table 1: Parameters associated with the four metrics selected. The term 'poly' indicates that orthogonal polynomials of degree 2 were used (e.g. Venables & Ripley 1999).
metric Ni.O2.Intol Ni.Hab.Intol.150 Ric.RH.Par Ni.LITHO (Intercept) -0.27832 -0.61978 -0.41193 0.07676 poly(Tjul, 2)1 -3.21395 poly(Tjul, 2)2 -0.01514 poly(lslope, 2)1 1.36557 -1.20607 4.12612 2.12899 poly(lslope, 2)2 -2.13935 -1.10176 -0.67042 -0.73348 natsedmedium -0.05848 -0.25953 0.08545 0.0485 natsedsmall -0.5376 -0.09464 -0.12434 -0.37812 syngeomorph1 0.13998 0.15807 syngeomorph2 -0.07988 0.05822 0.03907 Tdif 0.01061 -0.01644
Performance To quantify the performance of metrics for detection of altered sites, the slightly disturbed sites were characterised as unexposed sites, and the sites classified by pressure index as 4 and 5 were characterised as exposed sites. A specific dataset which integrated previously described limitations of index was required to reduce the potential bias induced mainly by misclassification of the river zone for individual sites. Under the hypothesis that the pressure index was an acceptable measure of the extent of site alteration, we observe that the indices, particularly in the cyprinid river type are characterised by low sensitivity and high specificity. In spite of low sensitivities, it was noted that the measures of specificity (spec) and positive predictive (ppv) are relatively high in the cyprinid type (spec=0.89 and ppv=0.78). The less significant results in the salmonid river type (spec=0.93 and ppv=0.54) can be explained by the low prevalence of pressure (= exposed sites, prev=0.16). Both indices were optimised to recognise un-degraded sites in most cases. Consequently, the detection of an altered situation efficiently confirms the high degraded level of a site. From an economical/management point of view, this objective corresponds to the idea that the risk for managers to invest in restoration measures at un-degraded sites is low.

Error estimation To estimate the predictive error associated with individual and global fish bio-indicator scores, a hybrid approach based on three elements was used: i) theoretical knowledge on generalized linear model (GLM), ii) simulation procedure and iii) principle of the error propagation. For one single metric, the model provides expected values and standard errors. By extending the classical regression propriety, a random sampling procedure based on normal, expected values and standard errors produces an empirical distribution of the expected values in the link space. After the inverse link transformation, the computation of the standardized distance between the quantile values (e.g. 0.1 and 0.9) and the observed values provides a good approximation of the predictive intervals. For the metric based on species with preference to spawn in running waters (Ric.RH.Par), we observe that the size of 80 % tolerance intervals are close to 0.39 units (+/- 0.11 units). For the metric based on lithophilic fish (Ni.LITHO), the tolerance interval appears to be larger and was close to 0.42 (+/- 0.14 units). The estimation of predictive error for both indices was more complex because it involved the addition of non-independent variables. For the cyprinid index for example, the correlation between Ric.RH.Par and Ni.LITHO was equal to 0.51. Consequently, the computation of theoretical variances is extremely complicated. To reduce these difficulties, the previous results were generalised and an adapted simulation strategy to estimate empirical distribution of aggregated scores was adopted. At each step, an empirical value from normal distribution based on expected value and expected variance for each metric was computed and the new scores were calculated. Following this step, these values were aggregated to obtain the final indices. The consideration of quantile values (e.g. 0.1 and 0.9) easily completes the construction of the tolerance interval. For the cyprinid index, the size of the 80% tolerance interval was close to 0.30 units (+/- 0.06 units, Figure 1). This corresponds more or less to one quality class. The error estimation method presented here should only be considered as an experimental approach and requires some additional tests before implementation in the software tool for calculating the new EFI+.

Annex 8 -Figure1: Simulated tolerance error associated with the cyprinid index and metrics based on species with preference to spawn in running waters (Ric.RH.Par) and based on
Lithophilic Fish (Ni.LITHO). Red, orange, green and blue lines correspond to the tolerance intervals based on percentiles (80%, blue; 90%, green; 95%, orange).
References Cameron A. C. & Trivedi P. K. (1998), Regression Analysis of Count Data, Econometric
Society Monograph No.30, Cambridge University Press, pp. 432. McCullagh P. & Nelder J. A. (1989) Generalized Linear Models, second edition edn.
Chapman & Hall/CRC, London, pp. 532. Nelder J. A. & Wedderburn R. (1972). Generalized Linear Models. Journal of the Royal
Statistical Society. Series A (General), 135, 370-384. Reyjol, Y. et al. (2007). Patterns in species richness and endemism of European freshwater
fish.. –Global Ecol. Biogeogr. 16: 65–75. Venables W. N. & Ripley B. D. (1999) Modern Apllied Statistics with S-plus, Third edition,
Statistics and computing, Springer-Verlag, New York, pp. 501.

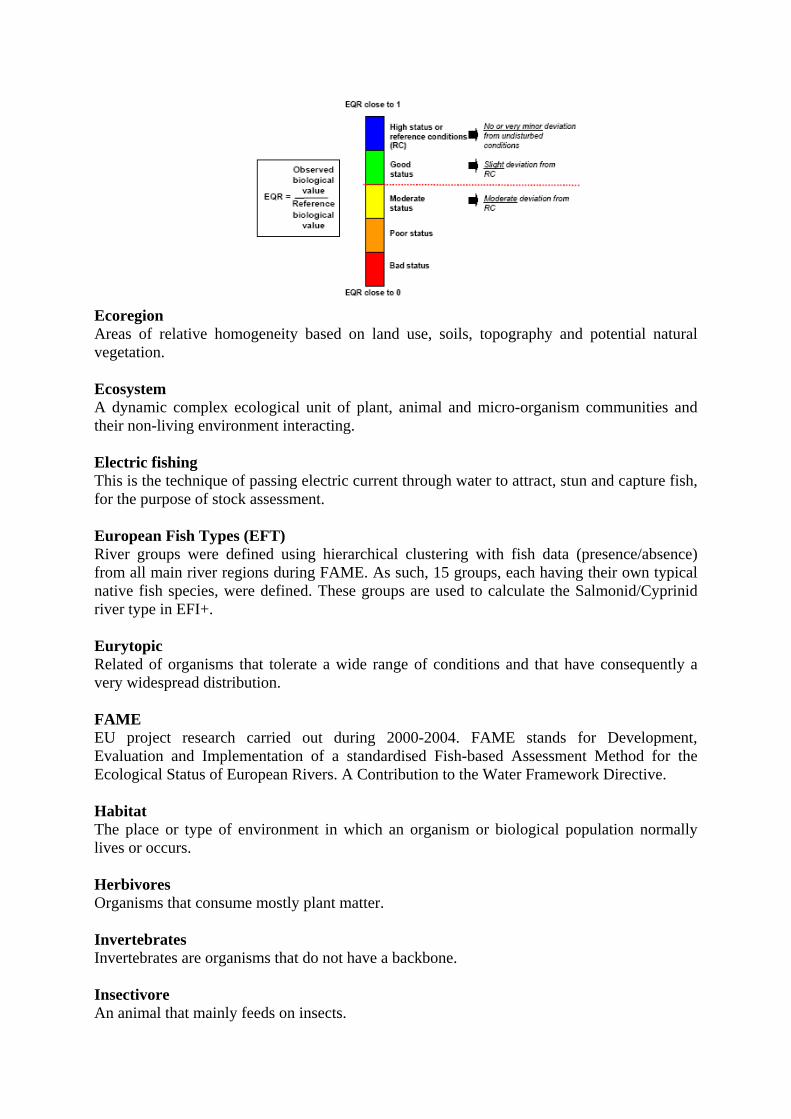
Annex 8: Glossary for EFI+ Abiotic Refers to non-living objects, substances or processes. Anthropogenic Related to man or human. Changes that people have introduced to the environment are anthropogenic changes. Aquatic ecosystem A dynamic complex of plant, animal and micro-organism communities and their non-living environment, interacting as a functional unit within water. Benthic Benthic fish are fish that live on the sediment surface. The term demersal has also been used for fish living on or near the bottom. Biodiversity Biodiversity, or biological diversity, is the number and variety of taxa in ecological systems ranging from parts of communities to ecosystems. Biotic Related to any aspect of life, especially to characteristics of entire populations or ecosystems. Biotic integrity This is the ability to support and maintain a balanced, integrated, adaptive community of organisms having a species composition, diversity and functional organization comparable to that of the natural habitat of the region. Or a river has a high biotic integrity when it is undisturbed. The more impacted a river the lower its biotic integrity will be. Calcareous Calcareous soils are composed of or contain or resemble calcium carbonate or calcite or chalk. Chalky is a synonym. Ecological guild Group of species with similar structural or functional features (e.g. functional feeding group). Ecological Quality Ratio (EQR) The ecological quality ratio represents the relationship between the values of the biological parameters observed for a given river and the values for these parameters in the reference conditions. It is expressed as a numerical value between zero and one, with high ecological status represented by values close to one and bad ecological status by values close to zero.
Ecoregion Areas of relative homogeneity based on land use, soils, topography and potential natural vegetation. Ecosystem A dynamic complex ecological unit of plant, animal and micro-organism communities and their non-living environment interacting. Electric fishing This is the technique of passing electric current through water to attract, stun and capture fish, for the purpose of stock assessment. European Fish Types (EFT) River groups were defined using hierarchical clustering with fish data (presence/absence) from all main river regions during FAME. As such, 15 groups, each having their own typical native fish species, were defined. These groups are used to calculate the Salmonid/Cyprinid river type in EFI+. Eurytopic Related of organisms that tolerate a wide range of conditions and that have consequently a very widespread distribution. FAME EU project research carried out during 2000-2004. FAME stands for Development, Evaluation and Implementation of a standardised Fish-based Assessment Method for the Ecological Status of European Rivers. A Contribution to the Water Framework Directive. Habitat The place or type of environment in which an organism or biological population normally lives or occurs. Herbivores Organisms that consume mostly plant matter. Invertebrates Invertebrates are organisms that do not have a backbone. Insectivore An animal that mainly feeds on insects.

Lake According to the WFD a lake is a body of standing inland surface water. Limnophilic This is a characteristic related to stagnant waters or the opposite of rheophilic. Lithophilic These are rock or gravel spawners with benthic larvae. Macroinvertebrates Large organism without a spinal column. Insects, crayfish, and worms are examples of macroinvertebrates. Macrophytes Macrophytes are aquatic plants, growing in or near water that are either emergent, submergent or floating. Metric A metric is a measurable factor that represents some aspect of biological assemblage structure, function or other community component. Omnivore An animal that feeds on a wide variety of animal and vegetable matter. Planktivore Organisms that consume mostly plankton. Plankton This is the aggregate of small plant and animal organisms (often microscopic) that float or drift in fresh or salt water. Pelagic This is the open water zone at a distance from the river banks. Piscivore Piscivorous fish eat mainly other fish. Phytobenthos Microscopic plants that live in the surface layers of the seabed, particularly in shallow water and intertidal areas. Phytophilic Fish that need plants to deposit their eggs. These eggs are adhesive and can be attached to a variety of plants. Potamodromous Species that migrate within the river having their entire life cycle occurring within fresh waters of a river system. They exhibit seasonal return movements to spawning areas, usually located upstream and migrate between the reproduction and feeding zones which may be separated by distances that can vary from a few metres to hundreds of kilometres.
Redundant Metrics are redundant when they provide the same information, that is, they quantify a similar or identical aspect of the fish assemblage. These redundant metrics are alternative ways of representing the same information. Rheophilic Rheophilous species are species adapted to fluvial habitats. Riparian zone Riparian zones are areas of transition between aquatic and upland ecosystems. The word riparian is derived from the Latin word ripa, which means bank. River region Each separated large European basin (over 25 000 km2) characterised by its native fauna, whereas all smaller basins flowing to the same sea coast have been grouped in ICES (IHBS) sea areas. Species composition The types of species which are present in an observed unit. Site A sampling site is defined as a stretch of river representative of the whole river reach in terms of habitat types and diversity, landscape use and intensity of human influence. It should include at least a riffle-run-pool unit, or two meanders. Siliceous Siliceous soils contain silica. Taxa The organism or species that fills a systematic category. Trophic level This is a position in a food chain e.g. herbivore, invertivore, omnivore and so on. It is related to nutrition.

Sources: Calow, P., 1998. The encyclopedia of Ecology and Environmental Management. Blackwell Science Ltd., Oxford, 805 pp. Coweeta LTER Glossary of Terms U.S. Environmental Protection Agency (USEPA), 2000. Estuarine and coastal marine waters: Bioassessment and biocriteria technical guidance. EPA-822-B-00-024. Office of Water, Washington D.C. FAME, 2004. Development, Evaluation and Implementation of a standardised Fish-based Assessment Method for the Ecological Status of European Rivers. A Contribution to the Water Framework Directive. EU Commission. Brussels.


![[MS-NFPS]: Near Field Proximity: Sharing Protocol](https://img.pdfslide.net/doc/110x75/61f93012979d9c2ac809c2ba/ms-nfps-near-field-proximity-sharing-protocol.jpg)


![[MS-NFPS-Diff]: Near Field Proximity: Sharing Protocol... · The Near Field Proximity: Sharing Protocol primarily relies on the Near Field Proximity: Bidirectional Services Protocol](https://img.pdfslide.net/doc/110x75/6049885d45e62b525d38e7fb/ms-nfps-diff-near-field-proximity-sharing-protocol-the-near-field-proximity.jpg)