Embed Size (px)
Citation preview

Annex 5 - Hydropower Model – Vakhsh
1 annex 5 - hydropower vakhsh_13oct11.docx - 6/8/2012
Annex 5 - Hydropower Model – Vakhsh
1. The Vakhsh Cascade
The construction of dams on the Vakhsh River started in the late 1950s with the construction of the
Perepadnaya diversion and power station. Until 2011 seven power stations have since been
constructed, with the main purpose of generating hydropower. Some of the dams also have
secondary purposes, such as feeding irrigation schemes.
Power station Installed Capacity (MW)
Nurek 3000
Baipaza 600
Sangtuda-1 670
Sangtuda-2 (Under Construction) 220
Golovnaya 210
Perepadnaya 29.6
Central 18.0
Rogun (Feasibility Study Ongoing) 3600
Shurob (Planned) 600
Table 1: Power Stations on the Vakhsh
Further extensions of the cascade are planned. Construction work on the Rogun dam and power
station had already started in the late 1970’s and came to a halt with the end of the Soviet Union.
Recently another feasibility study for the completion of the scheme has been commissioned.
Further possibilities to expand the scheme into the Vakhsh’s main tributaries Surhob and Obihingou,
as can be seen in Figure 1.
The power stations assessed in this report include Nurek, Baipaza, Sangtuda-1, Sangtuda-2 and
Golovnaya. Not included in the assessment are the Perepadnaya and Central Power stations, which
are on relatively small diversion weirs feeding irrigation canals and the Rogun HPP, for which no
information could be obtained.
Presently only the Nurek Reservoir provides seasonal storage for the Vakhsh cascade. The
downstream power stations either operate as run-of-river plants or provide daily regulation only.

Annex 5 - Hydropower Model – Vakhsh
2 annex 5 - hydropower vakhsh_13oct11.docx - 6/8/2012
Figure 1: Vakhsh Cascade Schematic Diagram

Annex 5 - Hydropower Model – Vakhsh
3 annex 5 - hydropower vakhsh_13oct11.docx - 6/8/2012
2. Available Data
2.1. Power station data The power station data shown in the data sheets below was obtained from public sources.
Data Sheet Nurek
Installed Capacity MW 3000
Head Water Levels
Minimum Operating Level MOL m a s l 857.00
Full Supply Level FSL m a s l 910.00
Maximum Flood Level m a s l 917.00
Dam Crest Elevation m a s l 922.00
Flood Design Criteria
Extreme Design Flood (1:10000 years) Q0.01% m3/s 5400
Spillway Capacity m3/s 4040
Max Powerhouse discharge m3/s 1360
Total maximum discharge capacity m3/s 5400
Turbine Data
Year of Commissioning 1972
Turbine Type Vertical Francis
Number of Units 9.00
Rated Head Hr m 230.00
Max Head Hmax m 267.60
Min Head Hmin m 209.75
Rated Power Pr MW 341.0
Rated Discharge Qr m3/s 158.0
Rated Efficiency % 93.92%
Turbine Speed n RPM 200.00
Runner Diameter D3 m 4.75
Assumed water to Wire Efficiency % 87.22%
Generator Data
Generator Efficiency % 97.75%
Generator Rating MVA 390.00
Power Factor 0.85
Generator Power Limit MW 333.33
Frequency Hz 50.00
Generator Voltage kV 15.8
Spillway Data
Spillway Type
No of Bays
Bay Width m
Sill Elevation m a s l

Annex 5 - Hydropower Model – Vakhsh
4 annex 5 - hydropower vakhsh_13oct11.docx - 6/8/2012
TWL Rating Curve
Q (m3/s) TWL (m)
150 642.4
450 644.2
1400 647.25
5400 649.8
Mean TWL 650 644.842
Data Sheet Baipaza
Installed Capacity MW 600
Head Water Levels
Minimum Operating Level MOL m a s l
Full Supply Level FSL m a s l 630.00
Maximum Flood Level m a s l 631.50
Dam Crest Elevation m a s l 635.00
Flood Design Criteria
Extreme Design Flood (1:10000 years) Q0.01% m3/s 5400
Spillway Capacity m3/s 3000
Max Powerhouse discharge m3/s 1236
Diversion Tunnel m3/s 1164
Total maximum discharge capacity m3/s 5400
Turbine Data
Year of Commissioning
Turbine Type Vertical Francis
Number of Units 4.00
Rated Head Hr m 54.00
Max Head Hmax m 57.50
Min Head Hmin m
Rated Power Pr MW 153.0
Rated Discharge Qr m3/s 309.0
Rated Efficiency % 93.73%
Turbine Speed n RPM 100.00
Runner Diameter D3 m 6.20
Assumed water to Wire Efficiency % 86.00%
Generator Data
Generator Efficiency %
Generator Rating MVA 176.47
Power Factor 85.00%
Generator Power Limit MW 150.00
Frequency Hz 50.00
Generator Voltage kV 15.8

Annex 5 - Hydropower Model – Vakhsh
5 annex 5 - hydropower vakhsh_13oct11.docx - 6/8/2012
TWL Rating Curve
Q (m3/s)
TWL (m)
309 570.4
1236 573
4470 579.5
5400 581.2
Storage Capacity
km3
Reservoir Volume 0.1246
Live Volume 0.087
Data Sheet Sangtuda-1
Installed Capacity MW 670
Head Water Levels
Minimum Operating Level MOL m a s l 569.90
Full Supply Level FSL m a s l 571.50
Maximum Flood Level m a s l
Dam Crest Elevation m a s l 576.50
Flood Design Criteria
Extreme Design Flood (1:10000 years) Q0.01% m3/s 5400
Spillway Capacity m3/s 4116
Max Powerhouse discharge m3/s 1284
Total maximum discharge capacity m3/s 5400
Turbine Data
Year of Commissioning 1989
Turbine Type Vertical Francis
Number of Units 4.00
Rated Head Hr m 58.00
Max Head Hmax m
Min Head Hmin m
Rated Power Pr MW 171.0
Rated Discharge Qr m3/s 324.1
Rated Efficiency % 93.00%
Turbine Speed n RPM 100.00
Runner Diameter D3 m 6.00
Assumed Water to Wire Efficiency % 88.86%
Generator Data
Generator Efficiency % 97.50%
Generator Rating MVA 186.11
Power Factor 90.00%
Generator Power Limit MW 167.50
Frequency Hz 50.00

Annex 5 - Hydropower Model – Vakhsh
6 annex 5 - hydropower vakhsh_13oct11.docx - 6/8/2012
Generator Voltage kV 15.8
TWL Rating Curve
Q (m3/s)
TWL (m)
2700 510.8
5400 512.26
Storage Capacity
km3
Reservoir Volume 0.25
Live Volume 0.012
Data Sheet Sangtuda-2
Installed Capacity MW 220
Head Water Levels
Minimum Operating Level MOL m a s l
Full Supply Level FSL m a s l 508.50
Maximum Flood Level m a s l
Dam Crest Elevation m a s l 511.00
Flood Design Criteria
Extreme Design Flood (1:10000 years) Q0.01% m3/s
Spillway Capacity m3/s
Max Powerhouse discharge m3/s
Total maximum discharge capacity m3/s
Turbine Data
Year of Commissioning
Turbine Type Vert Kaplan
Number of Units 2.00
Rated Head Hr m 22.50
Max Head Hmax m
Min Head Hmin m
Rated Power Pr MW 112.2
Rated Discharge Qr m3/s 548.3
Rated Efficiency % 93.00%
Turbine Speed n RPM
Runner Diameter D3 m
Assumed Water to Wire Efficiency % 89.32%
Generator Data
Generator Efficiency % 98.00%
Generator Rating MVA
Power Factor
Generator Power Limit MW
Frequency Hz

Annex 5 - Hydropower Model – Vakhsh
7 annex 5 - hydropower vakhsh_13oct11.docx - 6/8/2012
Generator Voltage kV
TWL Rating Curve
Q (m3/s)
TWL (m)
3380 490.4
Storage Capacity
km3
Reservoir Volume
Live Volume
Data Sheet Golovnaya
Installed Capacity MW 210
Head Water Levels
Minimum Operating Level MOL m a s l
Full Supply Level FSL m a s l 485.00
Maximum Flood Level m a s l
Dam Crest Elevation m a s l
Flood Design Criteria
Extreme Design Flood (1:10000 years) Q0.01% m3/s
Spillway Capacity m3/s
Max Powerhouse discharge m3/s
Total maximum discharge capacity m3/s
Turbine Data
Year of Commissioning
Turbine Type Kaplan
Number of Units 6.00
Rated Head Hr m 23.30
Max Head Hmax m
Min Head Hmin m 15.00
Rated Power Pr MW 36.1
Rated Discharge Qr m3/s 172.1
Rated Efficiency % 92.00%
Turbine Speed n RPM
Runner Diameter D3 m
Assumed Water to Wire Efficiency % 85.00%
Generator Data
Generator Efficiency % 97.00%
Generator Rating MVA
Power Factor
Generator Power Limit MW
Frequency Hz
Generator Voltage kV

Annex 5 - Hydropower Model – Vakhsh
8 annex 5 - hydropower vakhsh_13oct11.docx - 6/8/2012
TWL Rating Curve
Q (m3/s)
TWL (m)
Storage Capacity
km3
Reservoir Volume 0.018
Live Volume 0
2.2. Sedimentation Sedimentation rates were estimated from bathymetric survey data from 1989, 1994 and 2001. The
2001 survey showed that the reservoir volume increased between 1994 and 2001, which does not
appear plausible. Either the 2001 or 1994 survey results are probably flawed.
Figure 2: Nurek Storage Curves
The average annual loss of storage from 1972 to 2001 was approximately 70 Mm3/a. If
sedimentation progressed at this rate, the reservoir capacity would theoretically be reduced to
1.8 km3 by the end of the century. If the 2001 survey results are disregarded, the annual
sedimentation rate would be approximately 115 Mm3/a and thus the siltation would progress even
faster.
650
700
750
800
850
900
950
0,0 1,0 2,0 3,0 4,0 5,0 6,0 7,0 8,0 9,0 10,0 11,0
Ele
vati
on
(m
a s
l)
Revervoir Volume (km3)
1972
1989
1994
2001
2100
2100 with Rogun

Annex 5 - Hydropower Model – Vakhsh
9 annex 5 - hydropower vakhsh_13oct11.docx - 6/8/2012
However, siltation is unlikely to be allowed to progress unimpeded until the end of the century as
operations and possibly dam safety would be severely affected.
If sediment builds up against the dam the operation of spillway tunnel (invert at 810 masl) and
power intake (invert at 837 masl) would be compromised. Therefore sediment control measures
need to be implemented in the medium term. Although other measures, such as sediment flushing
tunnels or sediment retention dams are conceivable, the most obvious solution to the
sedimentation problem would be the construction of the Rogun Dam, which would prevent bed load
and most sediment from reaching Nurek.
For the purpose of this study it is therefore assumed that sediment control measures will be
implemented by 2020.
2.3. Evaporation An evaporation estimate was obtained from BT’s water balance for the Nurek reservoir. It was noted
that the factors are identical as those used in BT’s water balance for Kairakkum:
month 10-6
m/s mm/d
Jan 0.0037 0.3197
Feb 0.0066 0.5702
Mar 0.0157 1.3565
Apr 0.0314 2.7130
May 0.0513 4.4323
Jun 0.0736 6.3590
Jul 0.0813 7.0243
Aug 0.0782 6.7565
Sep 0.0554 4.7866
Oct 0.0283 2.4451
Nov 0.0143 1.2355
Dec 0.0066 0.5702
Table 2: Evaporation Data
The annual evaporation is roughly 1180 mm. The evaporation over the surface area of the lake
(approx 90 km2) is therefore in the order of 0.1 km3 or approximately 0.5 % of the average annual
inflow. The model is therefore not sensitive to changes in reservoir surface evaporation.
Nevertheless the 2080 predictions for Layhsh (see Annex 2) have been used for the model.
2.4. Historical Flow, Level and Energy Data Historical data was not provided, except for the 1994 water balance. Therefore the operating rules
are only based on one year of observed values. Further the model could not be calibrated (see par. 4
below)

Annex 5 - Hydropower Model – Vakhsh
10 annex 5 - hydropower vakhsh_13oct11.docx - 6/8/2012
3. Model Description
Only the Nurek Reservoir provides significant storage capacity for the Vakhsh Cascade.
A sequential stream flow model was selected as the appropriate methodology to estimate the effect
of changes in environmental parameters to energy production. The model is essentially a reservoir
water balance model, in which inflow, outflows and losses are accounted for.
The general form of the water balance algorithm governing the operation can be expressed as:
Where: V2, V1: Storage volume at end and beginning of routing interval dt: Routing interval I: Inflow QP: Power station discharge QL: Leakage and other water requirements QS: Spill E: Net evaporation losses
During each time step, the reservoir level, surface area, average power and generated energy are
calculated. The routing interval dt was chosen to be 1 month.
Several assumptions and relations between the various parameters are introduced for the numerical
model:
1) It is assumed that leakage through the dam and spillway amounts to 2 m3/s. Abstractions for
irrigation were adopted from BT’s 1994 water balance:
month Jan Feb Mar Apr May Jun Jul Aug Sep Oct Nov Dec
m3/s 3.5 3.5 3.5 3.5 6.2 10 10 10 10 3.5 3.5 4.6
Table 3: Irrigation Abstractions Nurek
2) Reservoir volume and level are related through the storage curve (Figure 2). Volume is
calculated as function of level and year so that the model takes gradual loss of storage through
siltation into account.
3) Reservoir surface area is calculated from the original design data.
4) Evaporative losses from the reservoir are estimated by multiplying the reservoir surface area
and the evaporation factor. The monthly evaporation factor (mm/day) was derived from BT’s
1994 water balance. It is assumed that this factor includes rainfall gain on the reservoir surface.
5) Maximum turbine discharge was estimated from the data presented in par. 2.1.
6) Net head is calculated as the difference between reservoir level and tailwater level. Friction loss
in the power tunnels is assumed to be in the order of 2 m.
7) Power station output is calculated from net head, turbine discharge, number of units available,
and an estimated water-to-wire efficiency.
8) The tailwater level is assumed to be approximately 645 masl.
Annex 5 - Hydropower Model – Vakhsh
11 annex 5 - hydropower vakhsh_13oct11.docx - 6/8/2012
9) Water discharged from Nurek (i.e. the sum of turbine and spillway discharges and leakage) is
assumed to pass through the downstream power stations in the same time step, i.e. live storage
of all downstream power stations is neglected. As no further information was available it had to
be assumed that lateral inflows and irrigation discharges and evaporation losses between Nurek
and Golovnaya are roughly equal.
10) For each power station, maximum turbine discharge, net head and efficiencies are estimated
from the data presented in par. 2.1.
The model as presented above is governed by a set of rules which can be modified to reflect current
and future reservoir operation. For this project the following rules are used:
1) Reservoir operation follows a rule curve, i.e. it is assumed that turbine operation aims at
controlling the reservoir level to a pre-set curve throughout the year. The level in 1994 is
assumed to be representative of the reservoir rule curve.
2) If the reservoir level exceeds the full supply level (FSL) the volume in excess of FSL is spilled and
the next time step of the simulation commences with the reservoir at FSL.
As the equations used in the model are interrelated and follow non-linear relationships. Iterations
are performed for each time step until the solution converges. As a check, the mass balance for the
reservoir is calculated for each time step.
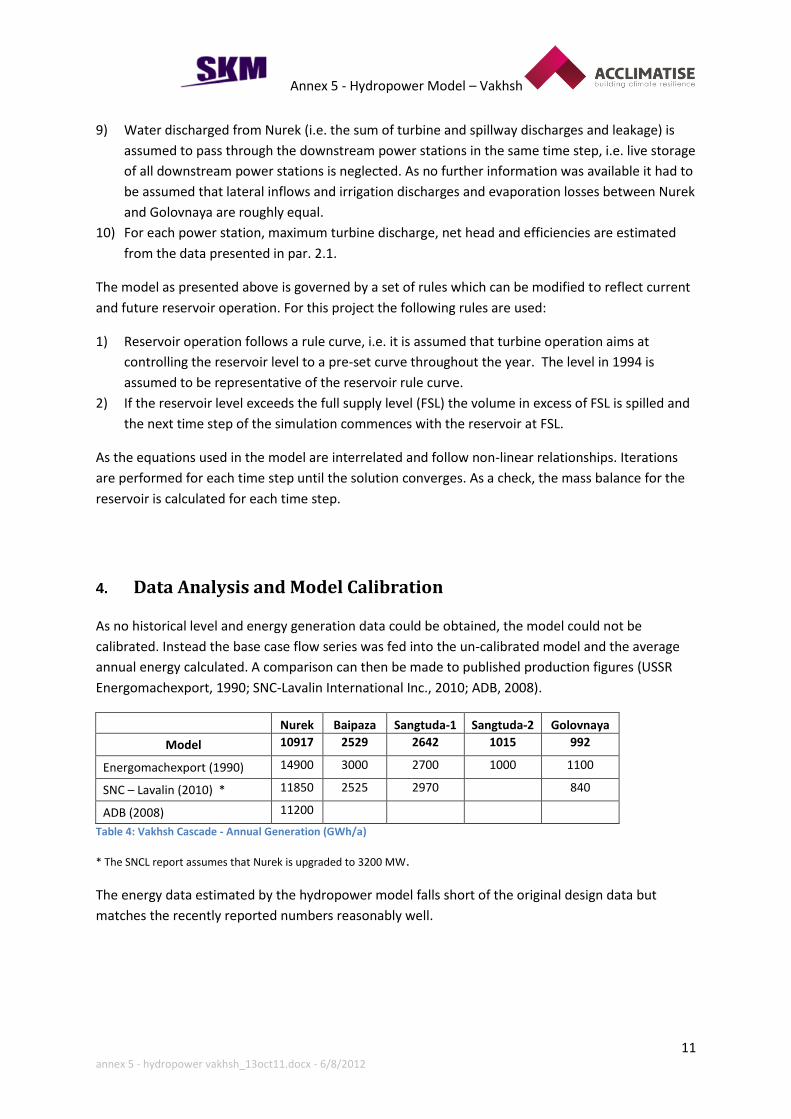
4. Data Analysis and Model Calibration
As no historical level and energy generation data could be obtained, the model could not be
calibrated. Instead the base case flow series was fed into the un-calibrated model and the average
annual energy calculated. A comparison can then be made to published production figures (USSR
Energomachexport, 1990; SNC-Lavalin International Inc., 2010; ADB, 2008).
Nurek Baipaza Sangtuda-1 Sangtuda-2 Golovnaya
Model 10917 2529 2642 1015 992
Energomachexport (1990) 14900 3000 2700 1000 1100
SNC – Lavalin (2010) * 11850 2525 2970 840
ADB (2008) 11200
Table 4: Vakhsh Cascade - Annual Generation (GWh/a)
* The SNCL report assumes that Nurek is upgraded to 3200 MW.
The energy data estimated by the hydropower model falls short of the original design data but
matches the recently reported numbers reasonably well.
Annex 5 - Hydropower Model – Vakhsh
12 annex 5 - hydropower vakhsh_13oct11.docx - 6/8/2012
5. Climate Change/Hydrology Scenario Combinations
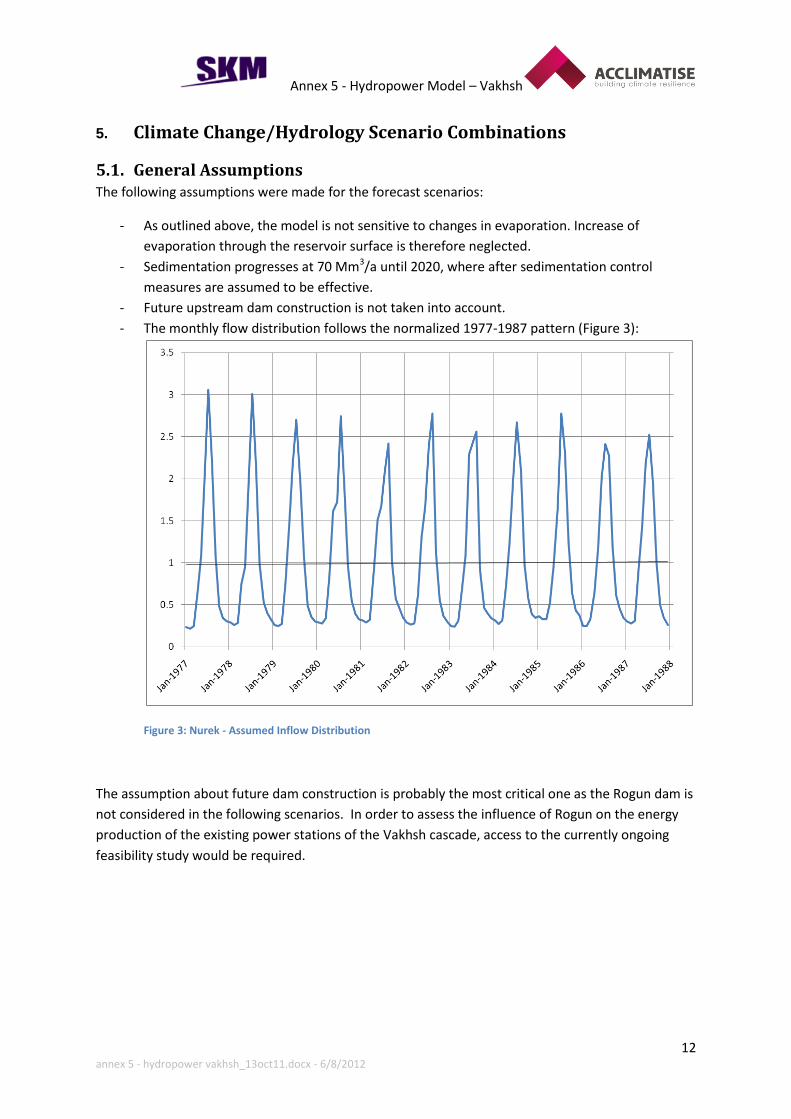
5.1. General Assumptions The following assumptions were made for the forecast scenarios:
- As outlined above, the model is not sensitive to changes in evaporation. Increase of
evaporation through the reservoir surface is therefore neglected.
- Sedimentation progresses at 70 Mm3/a until 2020, where after sedimentation control
measures are assumed to be effective.
- Future upstream dam construction is not taken into account.
- The monthly flow distribution follows the normalized 1977-1987 pattern (Figure 3):
Figure 3: Nurek - Assumed Inflow Distribution
The assumption about future dam construction is probably the most critical one as the Rogun dam is
not considered in the following scenarios. In order to assess the influence of Rogun on the energy
production of the existing power stations of the Vakhsh cascade, access to the currently ongoing
feasibility study would be required.
Annex 5 - Hydropower Model – Vakhsh
13 annex 5 - hydropower vakhsh_13oct11.docx - 6/8/2012
5.2. Scenarios
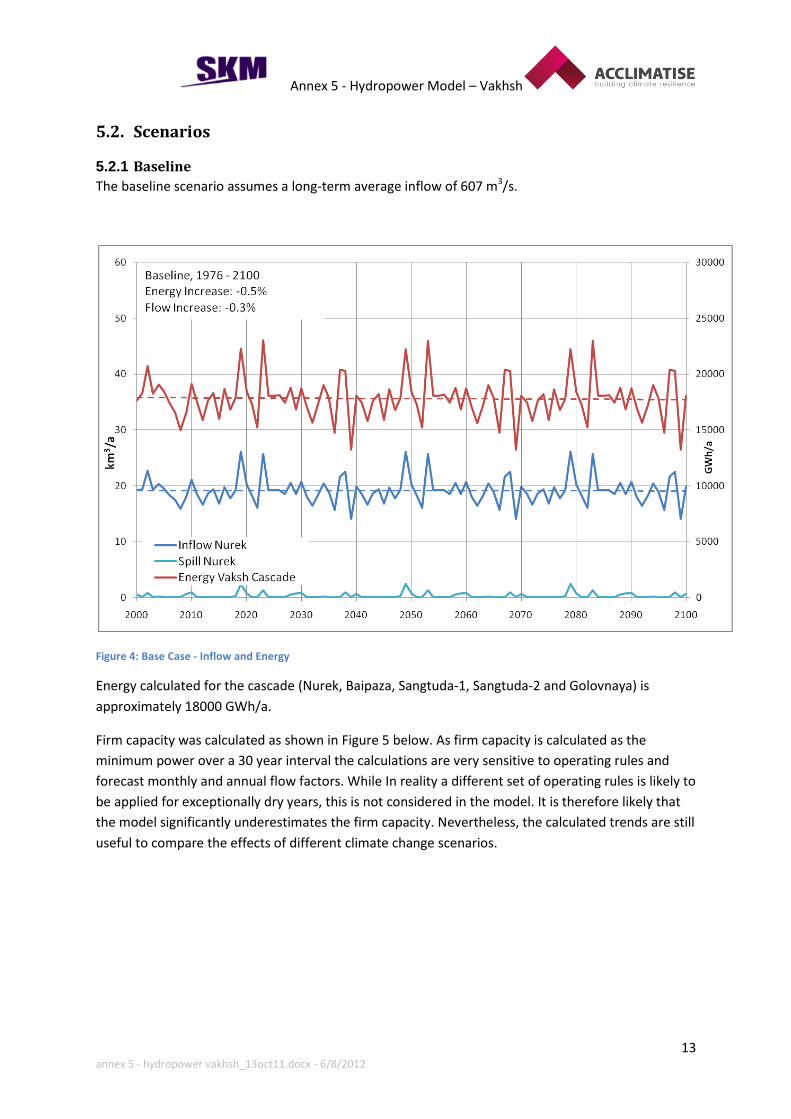
5.2.1 Baseline
The baseline scenario assumes a long-term average inflow of 607 m3/s.
Figure 4: Base Case - Inflow and Energy
Energy calculated for the cascade (Nurek, Baipaza, Sangtuda-1, Sangtuda-2 and Golovnaya) is
approximately 18000 GWh/a.
Firm capacity was calculated as shown in Figure 5 below. As firm capacity is calculated as the
minimum power over a 30 year interval the calculations are very sensitive to operating rules and
forecast monthly and annual flow factors. While In reality a different set of operating rules is likely to
be applied for exceptionally dry years, this is not considered in the model. It is therefore likely that
the model significantly underestimates the firm capacity. Nevertheless, the calculated trends are still
useful to compare the effects of different climate change scenarios.

Annex 5 - Hydropower Model – Vakhsh
14 annex 5 - hydropower vakhsh_13oct11.docx - 6/8/2012
Figure 5: Firm Capacity

Annex 5 - Hydropower Model – Vakhsh
15 annex 5 - hydropower vakhsh_13oct11.docx - 6/8/2012
5.2.2 Climate Change/Hydrology Scenario Combinations
Figure 6: WBM Hot- Dry
Figure 7: WGM Hot-Dry

Annex 5 - Hydropower Model – Vakhsh
16 annex 5 - hydropower vakhsh_13oct11.docx - 6/8/2012
Figure 8: WBM Central
Figure 9: WBM Warm Wet
Annex 5 - Hydropower Model – Vakhsh
17 annex 5 - hydropower vakhsh_13oct11.docx - 6/8/2012
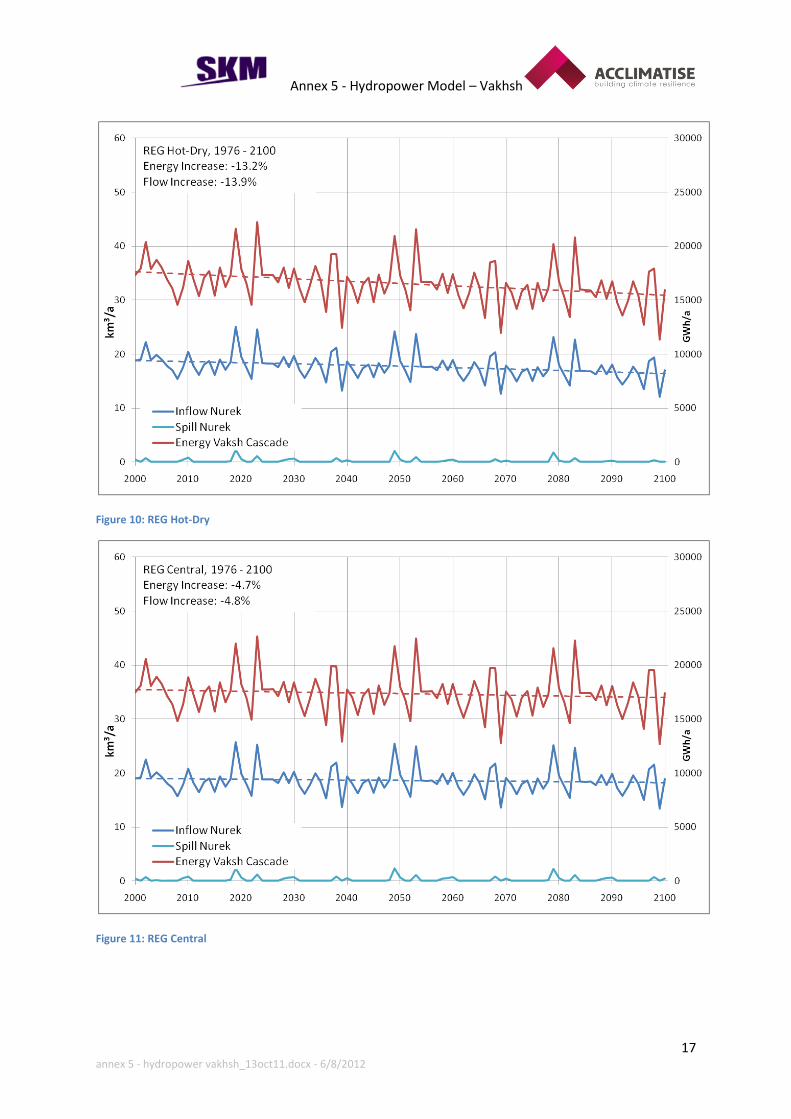
Figure 10: REG Hot-Dry
Figure 11: REG Central

Annex 5 - Hydropower Model – Vakhsh
18 annex 5 - hydropower vakhsh_13oct11.docx - 6/8/2012
Figure 12: REG Warm-Wet
Figure 13: SRM Hot Dry

Annex 5 - Hydropower Model – Vakhsh
19 annex 5 - hydropower vakhsh_13oct11.docx - 6/8/2012
Figure 14: SRM Central
Figure 15: SRM Warm Wet

Annex 5 - Hydropower Model – Vakhsh
20 annex 5 - hydropower vakhsh_13oct11.docx - 6/8/2012
Figure 16: Climate Change / Hydrology Scenario Combinations – Energy Trend Summary
Figure 17: Climate Change / Hydrology Scenario Combinations - Firm Capacity Trend

Annex 5 - Hydropower Model – Vakhsh
21 annex 5 - hydropower vakhsh_13oct11.docx - 6/8/2012
6. Optimization
6.1. Effects of Rogun on the Vakhsh Cascade As demonstrated above, the main environmental factors affecting energy production will be
sedimentation and potentially reduced inflows.
The construction of the Rogun Scheme and/or other large dams will alleviate the sedimentation for
Nurek.
Further monthly peak flows would be attenuated by the Rogun reservoir, which in turn would
reduce spillage at Nurek and the other downstream power stations. As no information about the
planned operation of Rogun could be obtained, it was assumed that the monthly flow pattern will be
damped as shown in Figure 18.
As Rogun would do most of the annual regulation, operating rules for Nurek would be changed so
that the Nurek Reservoir would not be drawn down as it seems to be the case presently.
Figure 18: Assumed Nurek Inflow after Construction of Rogun

Annex 5 - Hydropower Model – Vakhsh
22 annex 5 - hydropower vakhsh_13oct11.docx - 6/8/2012
Figure 19: Baseline Inflow, Rogun & Nurek Operation at FSL
With these measures an increase in scheme output of approximately 5% appears feasible. This
conclusion would be valid for the near-baseline scenarios (all REG scenarios and WBM central).
Installing additional units or increasing installed capacity would not significantly increase energy
productions for the base case or any of the near baseline scenarios. Other benefits of increasing
capacity may still make up-rating worthwhile, if done as part of a major refurbishment.
Figure 20: Baseline scenarios

Annex 5 - Hydropower Model – Vakhsh
23 annex 5 - hydropower vakhsh_13oct11.docx - 6/8/2012
6.2. Other optimization opportunities Apart from the construction of the Rogun Dam, other measures could be considered to increase
energy production and firm capacity.
Installing additional generating capacity could be attractive for scenarios which predict a significant
increase in discharge. Further optimization would be possible by considering the effect of the
construction of the Rogun Dam and other dams upstream.
Figure 21: SRM Central - Rogun and Uprating
Figure 22: Effects of Climate Change/Hydrology Scenario Combinations, Rogun and Upgrading Nurek on Firm Capacity

Annex 5 - Hydropower Model – Vakhsh
24 annex 5 - hydropower vakhsh_13oct11.docx - 6/8/2012
Firm capacity would significantly benefit from the construction of the Rogun dam. Increasing
installed capacity would have no effect on firm capacity
Other measures could include changing the operating rules; however the current operating rules
would have to be made available for a further assessment.
6.3. Summary As most of the requested data was not provided, the above is based on assumptions and un-
calibrated models. Results must therefore be viewed with caution. Nevertheless some general
statements can be made:
The construction of the Rogun dam would be beneficial for annual energy and firm capacity.
Should the Rogun Dam not be built, then other sedimentation controls need to be investigated
and implement towards mid-century.
Increasing the installed capacity may be beneficial for annual energy production if one of the
scenarios that predict increased runoff materializes.
7. Bibliography
ADB. (2008). Proposed Asian Development Fund Grant Republic of Tajikistan: Nurek 500 kV
Switchyard Reconstruction Project. ADB.
SNC-Lavalin International Inc. (2010). CENTRAL ASIA - SOUTH ASIA ELECTRICITY TRANSMISSION AND
TRADE (CASA-1000) PROJECT FEASIBILITY STUDY UPDATE.
USSR Energomachexport. (1990). Nurekskaya Hydroelectric Power Station. Moscow: Vneshtorgizdat.


![Workshop Hydropower and Fish.pptx [Schreibgeschützt] - Workshop Hydropower and Fish... · Workshop Hydropower and Fish Existing hydropower facilities: ... spawning grounds and shelter](https://img.pdfslide.net/doc/110x75/5a8733247f8b9afc5d8da3c5/workshop-hydropower-and-fishpptx-schreibgeschtzt-workshop-hydropower-and-fishworkshop.jpg)