Embed Size (px)
Citation preview
Environmental Statement Volume 2 – Offshore Annexes
Annex 5.1.8 Foundation Scour Assessment
PINS Document Reference: 7.5.1.8
APFP Regulation 5(2)(a)
January 2015

i
SMart Wind Limited Hornsea Offshore Wind Farm Project Two – Environmental Statement Volume 5 – Offshore Annexes Annex 5.1.8 – Foundation Scour Assessment
SMart Wind Limited 11th Floor 140 London Wall London EC2Y 5DN Tel 0207 7765500 Email [email protected]
Copyright © 2015 All pre-existing rights reserved.
Liability
This report has been prepared by RPS Group Plc (RPS), with all reasonable skill, care and diligence within the terms of their contracts with SMart Wind Ltd or their subcontractor to RPS placed under RPS’ contract with SMart Wind Ltd as the case may be.
Document release and authorisation record
PINS document reference 7.5.1.8
Report number UK06-050200-REP-0032
Date January 2015
Company name SMart Wind Limited
ii
Table of Contents
1 Introduction .......................................................................................................................... 1
1.2 Geological Context ............................................................................................... 1
1.3 Sediment Regime ................................................................................................. 1
1.4 Hydrodynamic Regime.......................................................................................... 1
2 Scour Process Overview ...................................................................................................... 2
3 Scour Assessment ............................................................................................................... 3
3.1 Introduction ........................................................................................................... 3
3.2 Local Scour ........................................................................................................... 5
3.3 Scour Estimation ................................................................................................... 6
4 Results ............................................................................................................................... 12
4.1 Introduction ......................................................................................................... 12
4.2 Monopile Foundations......................................................................................... 12
4.3 Gravity Base Foundations ................................................................................... 17
4.4 Jacket Foundations ............................................................................................. 18
5 Discussion ......................................................................................................................... 22
6 Conclusions ....................................................................................................................... 24
References ............................................................................................................................... 26
Table of Figures
Figure 2.1 Scour definition around a monopile. ...................................................................... 2
Figure 3.1 Typical monopile layout (reproduced from Volume 1, Chapter 3: Project Description). .......................................................................................................... 3
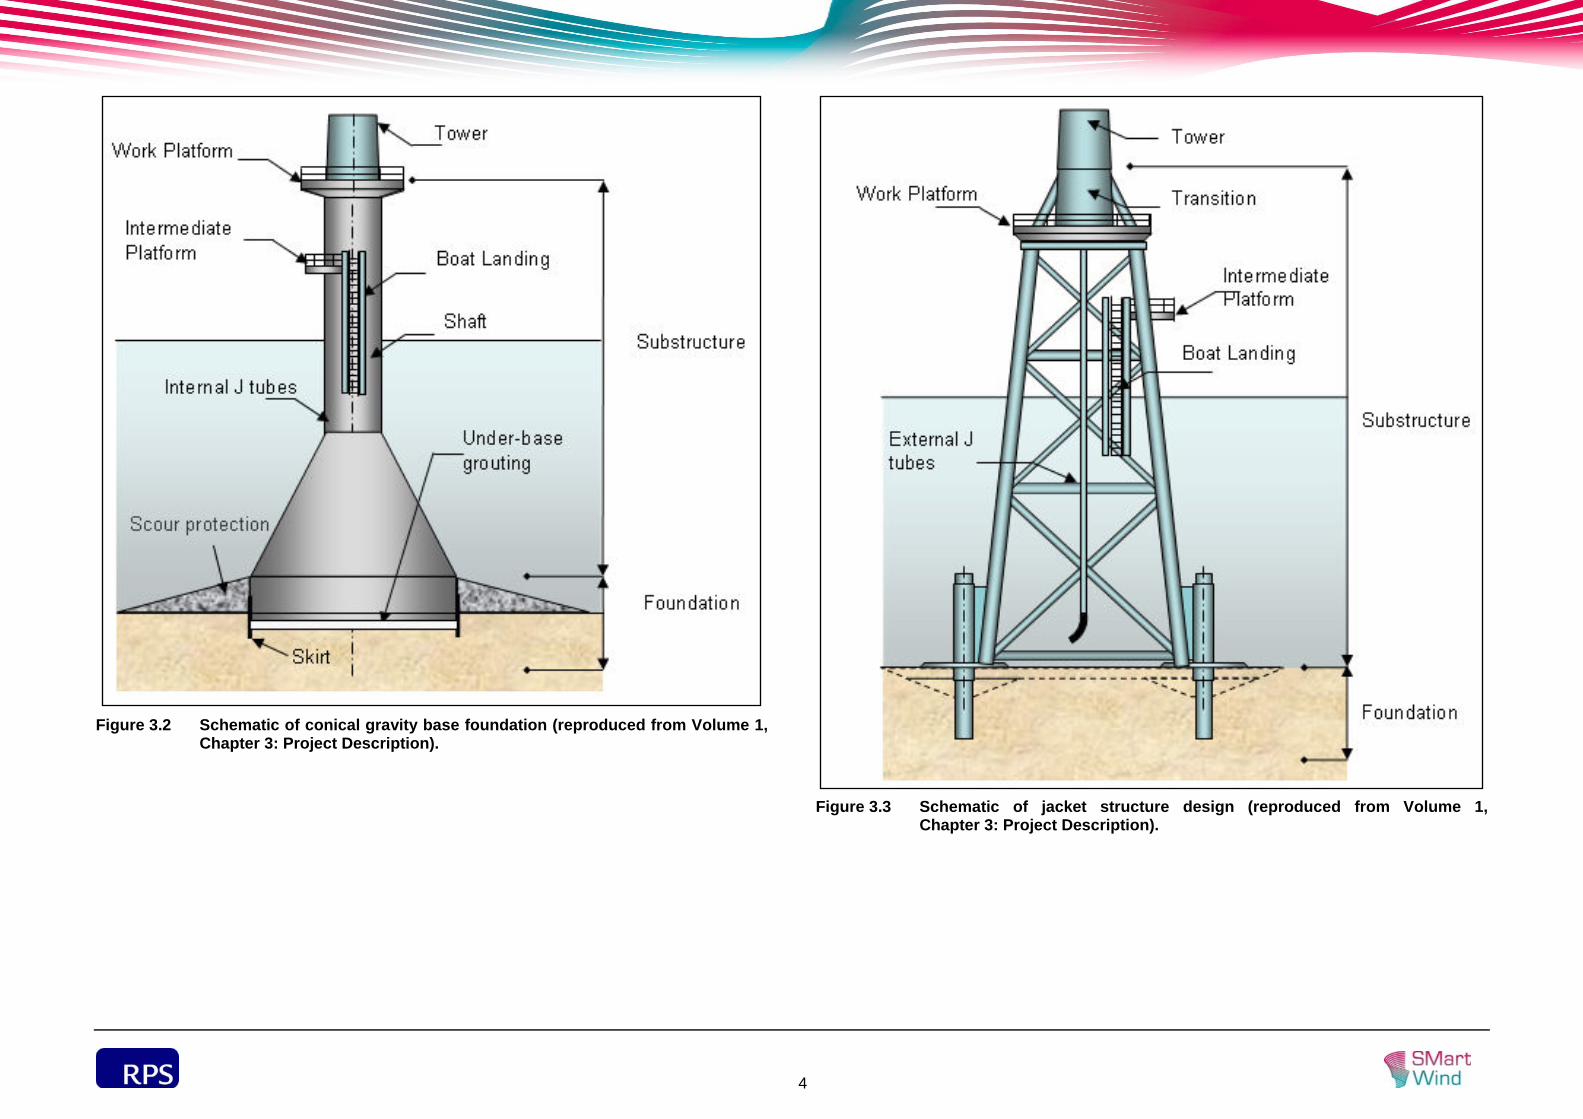
Figure 3.2 Schematic of conical gravity base foundation (reproduced from Volume 1, Chapter 3: Project Description). ............................................................................ 4
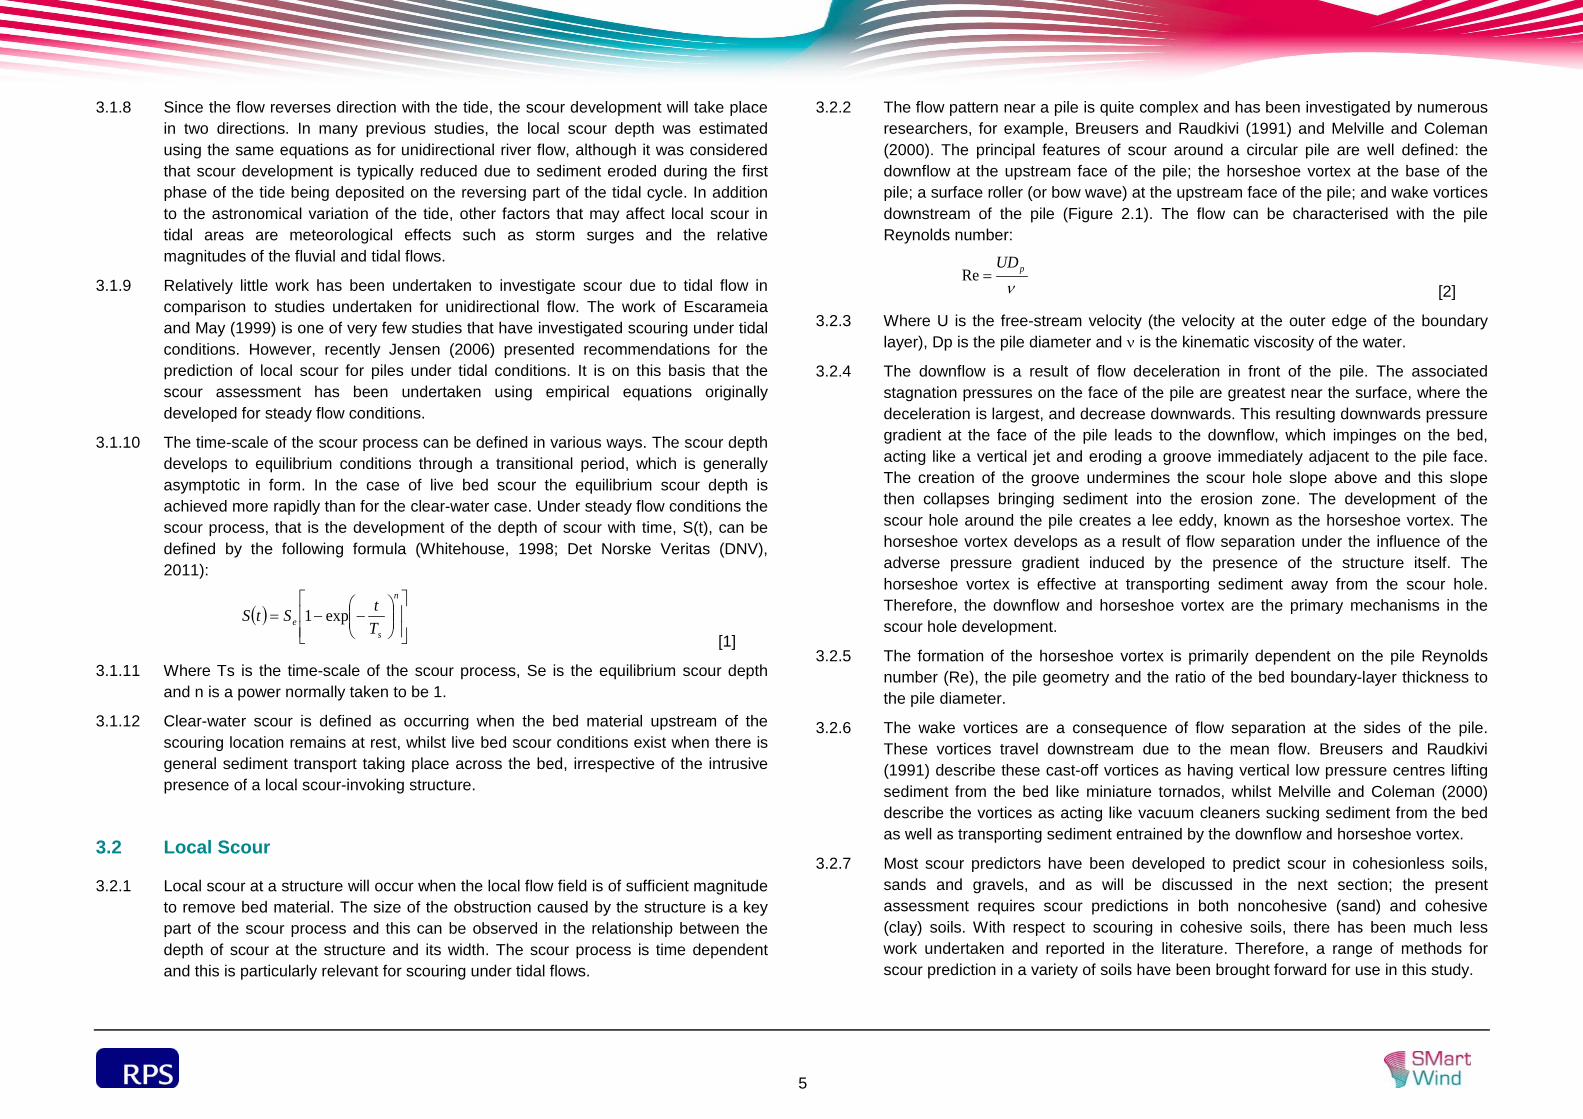
Figure 3.3 Schematic of jacket structure design (reproduced from Volume 1, Chapter 3: Project Description). .............................................................................................. 4
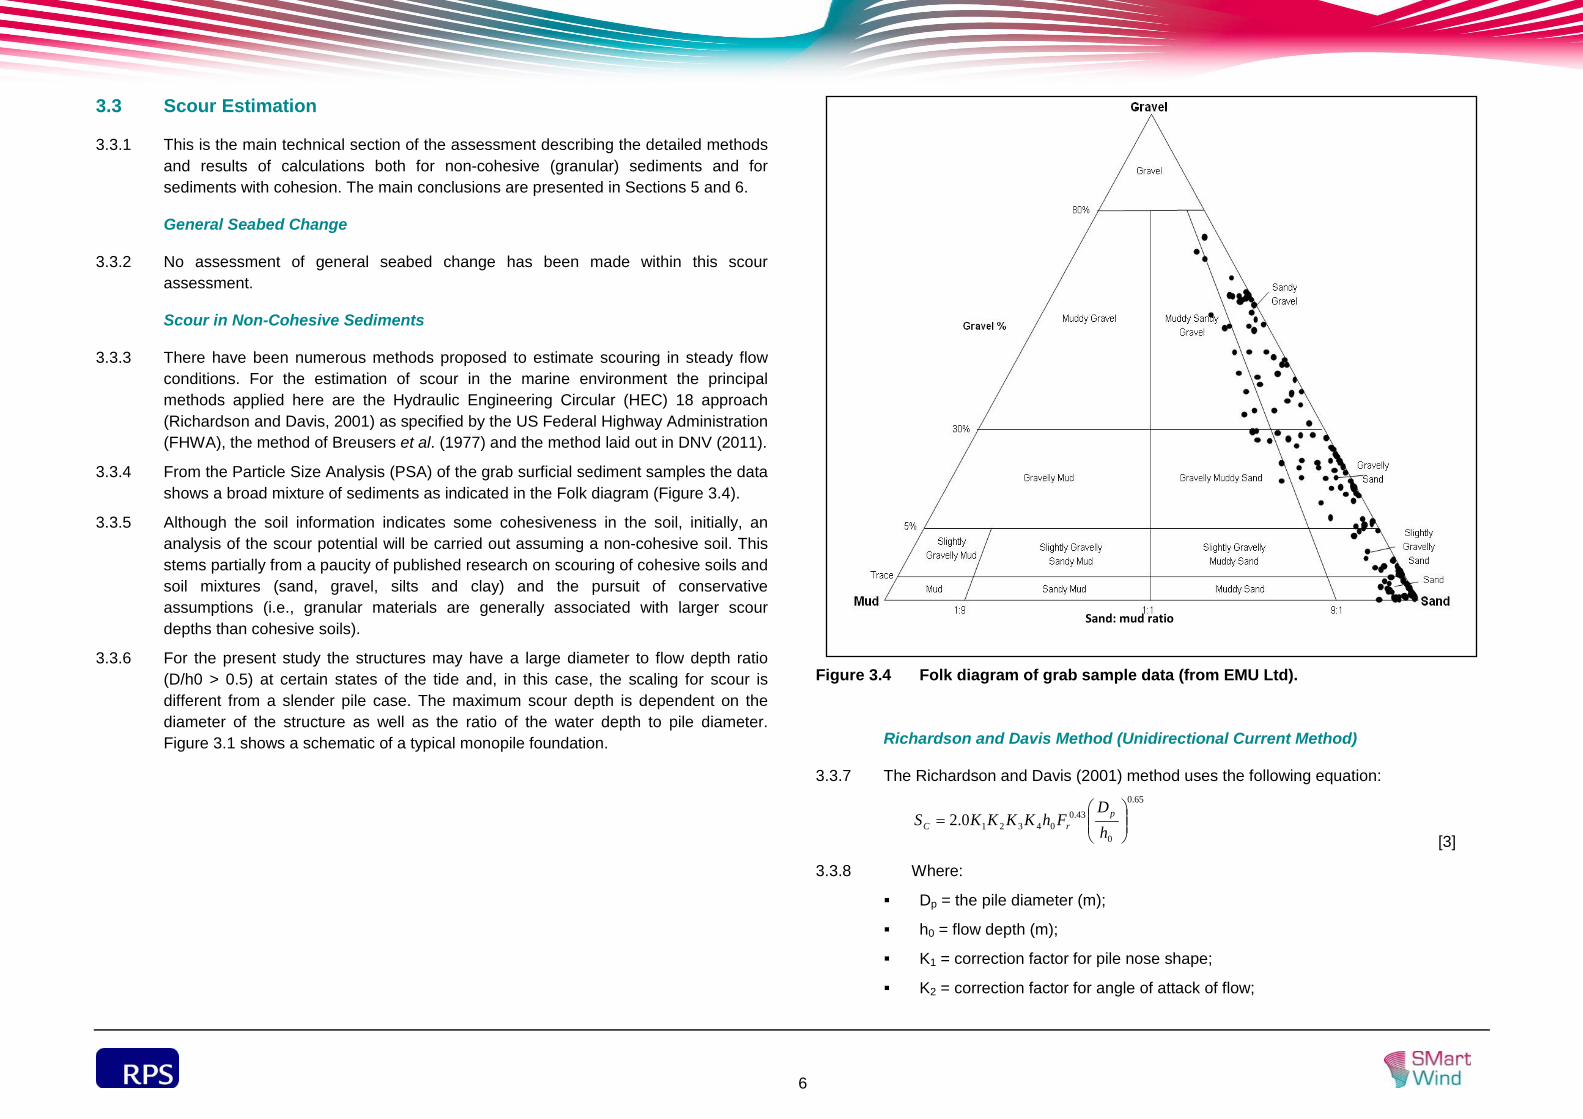
Figure 3.4 Folk diagram of grab sample data (from EMU Ltd). .............................................. 6
Figure 3.5 Configuration options for two-pile groups. ............................................................. 9
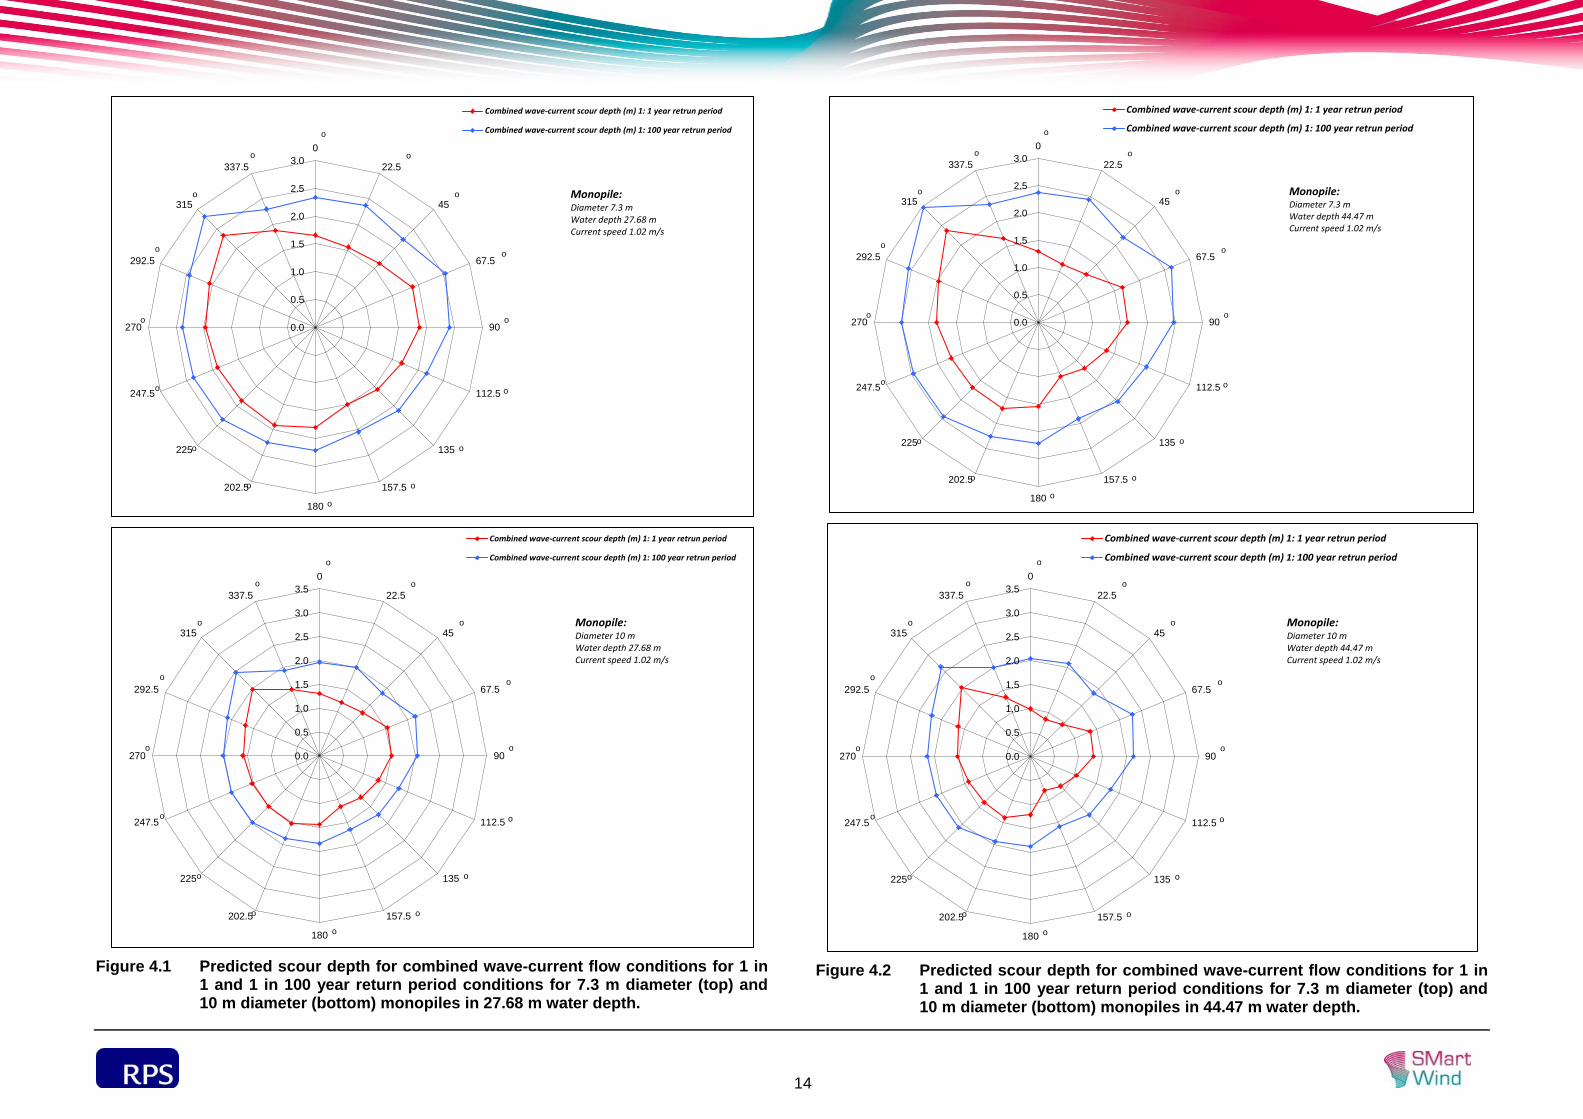
Figure 4.1 Predicted scour depth for combined wave-current flow conditions for 1 in 1 and 1 in 100 year return period conditions for 7.3 m diameter (top) and 10 m diameter (bottom) monopiles in 27.68 m water depth. ....................................................... 14
Figure 4.2 Predicted scour depth for combined wave-current flow conditions for 1 in 1 and 1 in 100 year return period conditions for 7.3 m diameter (top) and 10 m diameter (bottom) monopiles in 44.47 m water depth. ....................................................... 14
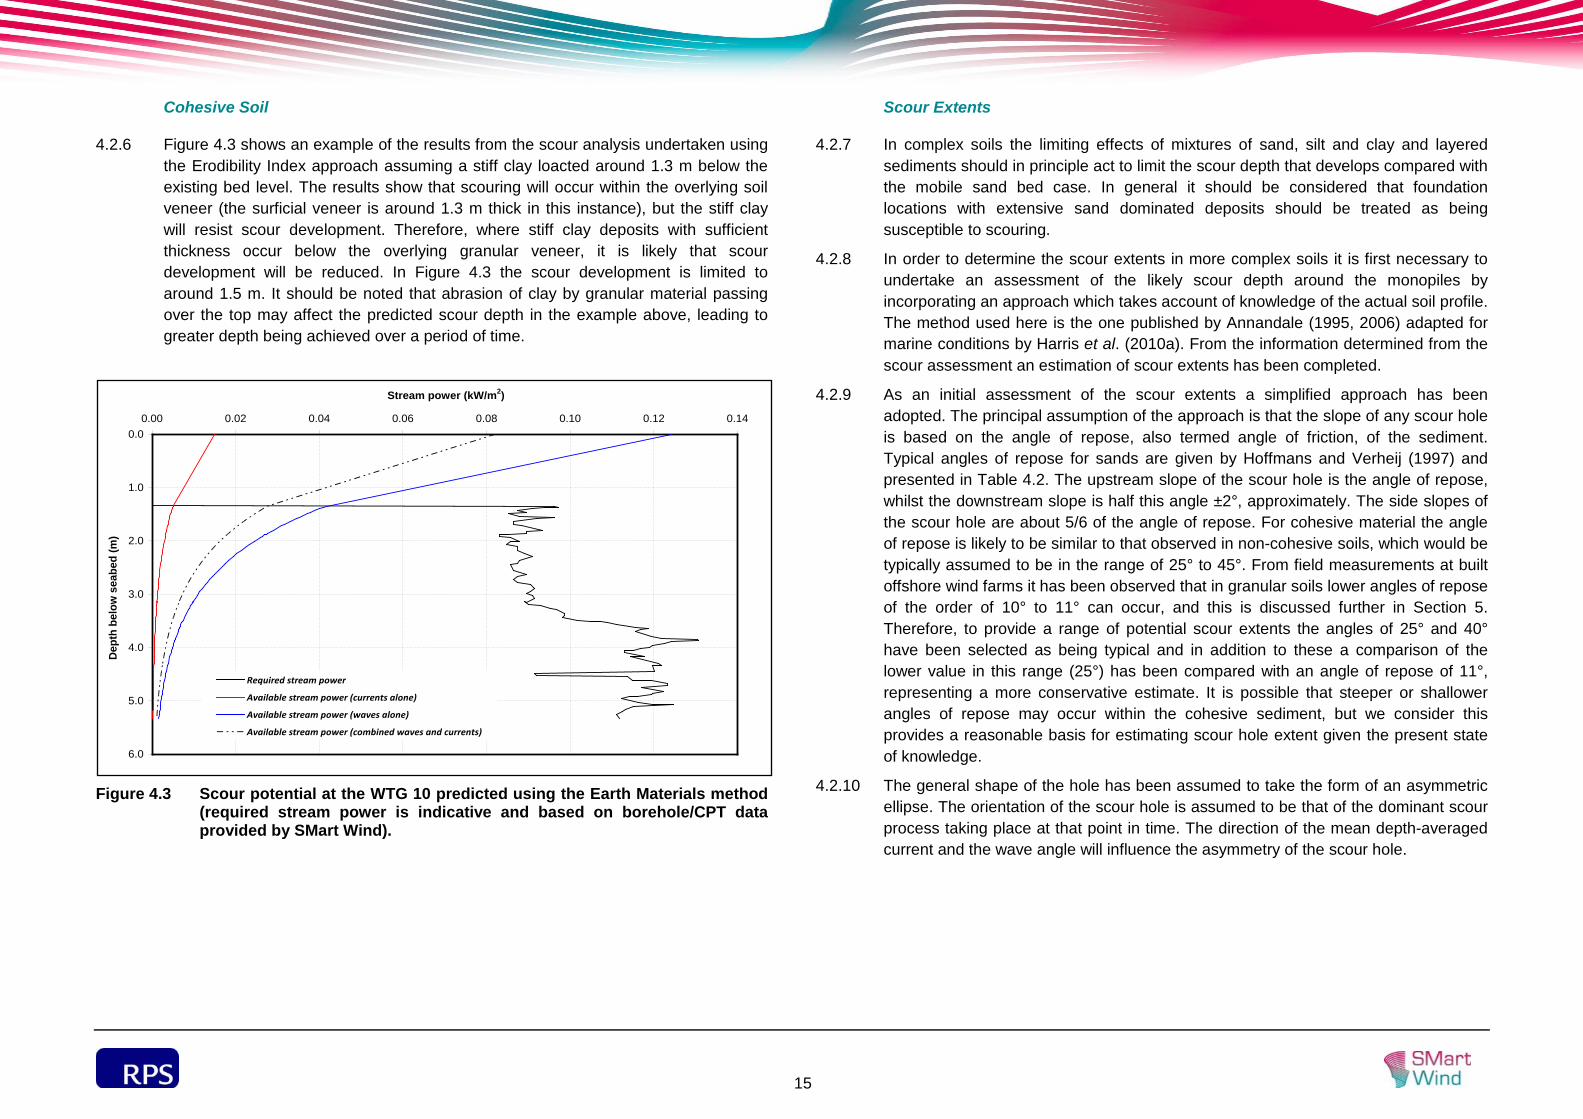
Figure 4.3 Scour potential at the WTG 10 predicted using the Earth Materials method (required stream power is indicative and based on borehole/CPT data provided by SMart Wind). ................................................................................................... 15
Figure 4.4 Estimated scour extent for 1.8 m scour hole assuming an angle of friction (repose) of both 25° and 40° and a pile diameter of 10 m. ................................... 16
Figure 4.5 Estimated scour extent for 10.1 m scour hole assuming an angle of friction (repose) of both 25° and 40° and a pile diameter of 10 m. ................................... 16
Figure 4.6 Side elevation view through centre-line of the cylinder along the line of estimated maximum scour extent for 1.8 m scour hole assuming an angle of friction (repose) of both 25° and 40°. ............................................................................................. 17
Figure 4.7 Side elevation view through centre-line of the cylinder along the line of estimated maximum scour extent for 1.8 m scour hole assuming an angle of friction (repose) of both 11° and 25°. ............................................................................................. 17
Figure 4.8 Side elevation view through centre-line of the cylinder along the line of estimated maximum scour extent for 10.1 m scour hole assuming an angle of friction (repose) of both 25° and 40°. ............................................................................... 17
Figure 4.9 Side elevation view through centre-line of the cylinder along the line of estimated maximum scour extent for 10.1 m scour hole assuming an angle of friction (repose) of both 11° and 25°. ............................................................................... 17
Figure 4.10 Schematic of estimated pattern of scour around a gravity base under currents. Note: the above schematic assumes flow in one-direction only. .......................... 18
Figure 4.11 Estimated scour extent for 1.5 m scour hole assuming an angle of friction (repose) of both 25° and 40° and a pile diameter of 1.2 m for an individual jacket leg. ....................................................................................................................... 20
Figure 4.12 Estimated scour extent for 2.6 m scour hole assuming an angle of friction (repose) of both 25° and 40° and a pile diameter of 1.2 m for an individual jacket leg. ....................................................................................................................... 20
Figure 4.13 Schematic of estimated pattern of scour around a jacket structure. ..................... 21
Table of Tables
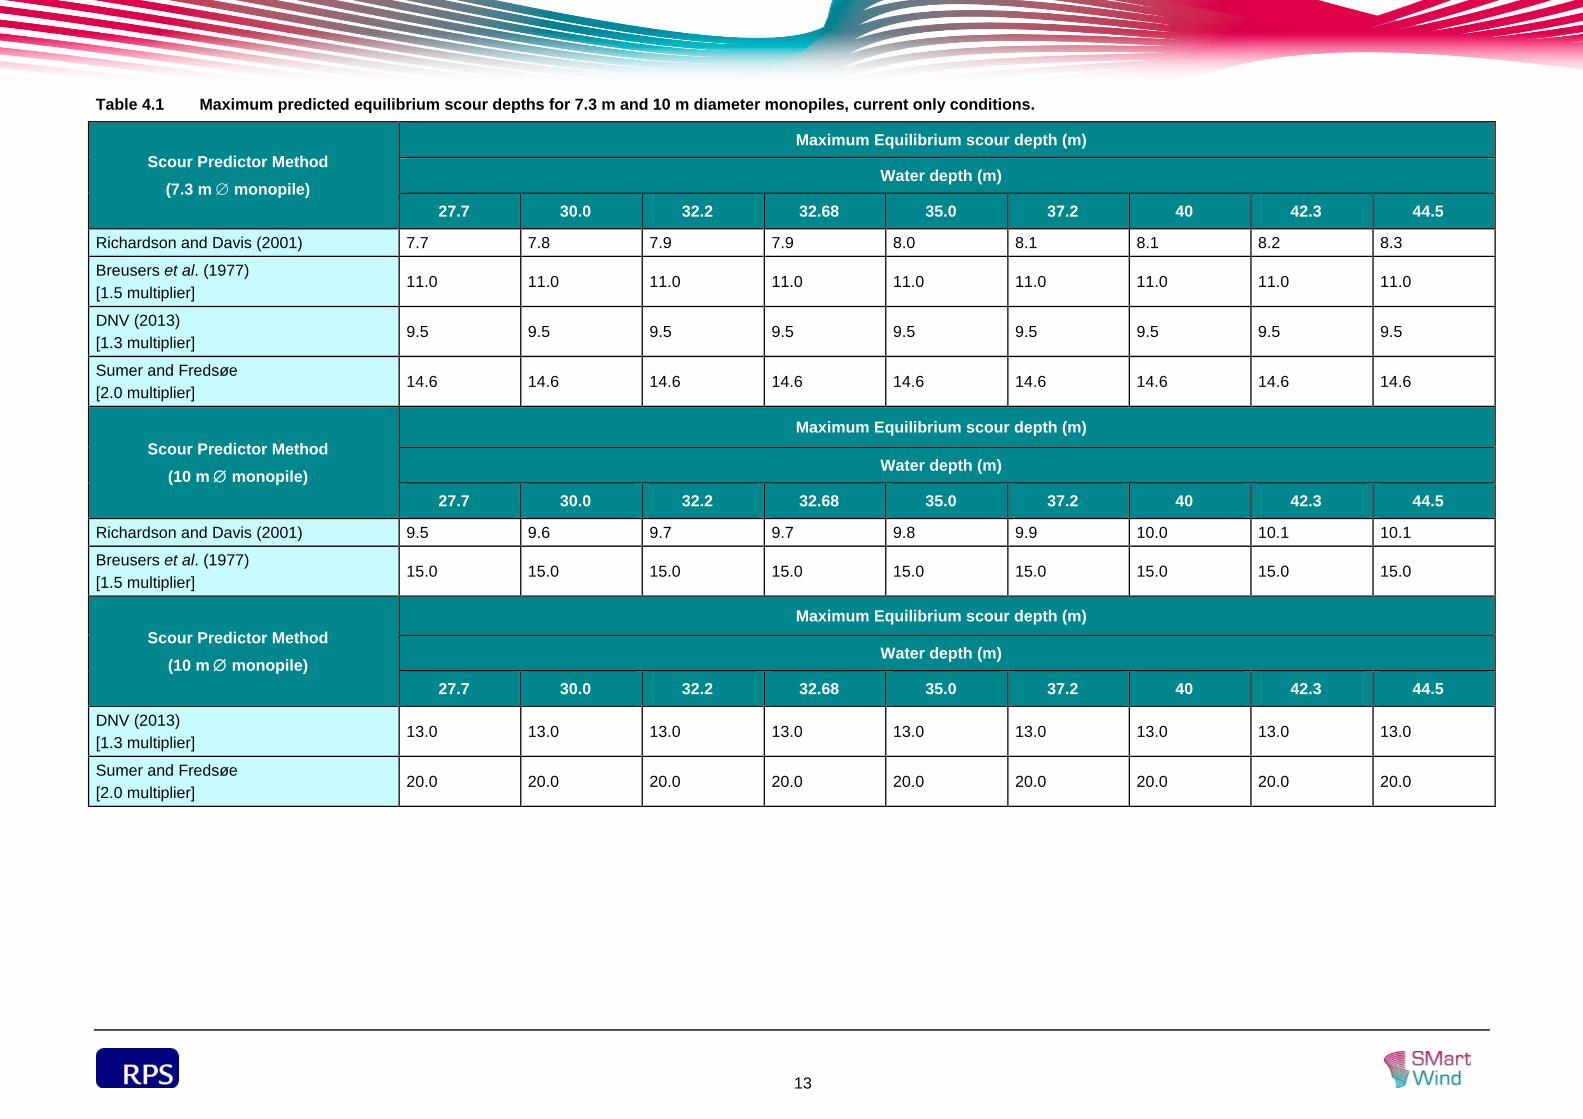
Table 4.1 Maximum predicted equilibrium scour depths for 7.3 m and 10 m diameter monopiles, current only conditions. ...................................................................... 13
Table 4.2 Angle of repose for different soils (from Hoffmans and Verheij, 1997). ................ 16
Table 4.3 Maximum predicted equilibrium scour depths for jacket structure designs, current only conditions. .................................................................................................... 19
Table 4.4 Maximum predicted equilibrium scour depth under combined wave and current conditions for jacket structures. ............................................................................ 19

iii
Acronyms
Acronym Full term
CPT Cone penetration test
DNV Det Norske Vertias
EI Erodibility Index
FHWA US Federal Highways Administration
GBF Gravity Base Foundation
HEC Hydraulic Engineering Circular
KC Keulegan-Carpenter number
PSA Particle Size Analysis
SNS2 Southern North Sea Sediment Transport Study
SRICoS Scour Rates In Cohesive Soils
WTG Wind turbine generator
1
1 INTRODUCTION
1.1.1 This Annex outlines the scour assessment for the range of possible foundation options that may be employed across Project Two, and forms part of the detailed marine processes assessment as part of the Environmental Impact Assessment (EIA) for Project Two. The assessment has been undertaken using representative water depths and sediment conditions across the Project Two site for the range of wind turbine generator (WTG) foundations being considered within the Project Description (Volume 1, Chapter 3: Project Description).
1.1.2 Whilst it is proposed to bury both the inter-array and export cables, for the purposes of the EIA it has been assumed that a worst case scenario of rock placement cable protection will be utilised along 25% of the export cable route and 26% of the inter-array cable route. If cable protection is required within the overlap of the Humber Estuary SAC and the cable route, frond mattressing will be used exclusively. Some additional comments on cable scour are given in Section 5 of this Annex.
1.2 Geological Context
1.2.1 The seabed offshore of the Holderness and North Norfolk coastline is of geologically recent origin, formed at the end of the last Ice Age (i.e., 7,500 to 10,000 years ago) and it was during that period that this part of the North Sea was formed, severing the last land bridge to the European mainland (Cooper et al., 2008). Since then, the coastline and nearshore seabed have undergone transformation by waves and tides, accompanied by the continuing increase in sea levels.
1.2.2 The breaching and immersion of the ‘land bridges’ across the North Sea, led to the progressive ingress of tides and increased wave action across and into the newly formed basin of what is now the southern North Sea. This increase in hydrodynamic energy accelerated the changes being brought about by the ever-increasing sea level, leading to rapid changes in the coastline in the period between about 7,500 and 5,000 years ago. Much of the physical character of the Holderness and North Norfolk coastal and offshore area, including the system of inshore and offshore banks, was established at that time, with subsequent changes to the coastlines and seabed occurring more gradually.
1.3 Sediment Regime
1.3.1 For the Holderness region, there have been several major studies that have included an assessment of information on sediment distribution, bedforms and sediment transport in this area. In addition, site-specific sediment sampling has been undertaken for Project Two to determine the particle size distribution within Subzone 2 and along the cable route. The Southern North Sea Sediment Transport Study (SNS2) (HR Wallingford et al., 2002) used available literature, collected new field data where necessary and used numerical models to improve understanding of the sedimentary environment and sediment transport pathways in the southern North Sea region.
1.3.2 The distribution of sediments found on the bed of the North Sea is, generally speaking, in regime with the prevailing wave and current conditions. Therefore, areas with sand experience transport under certain combination of conditions whereas stiff clay represents an erosional horizon, although it may represent a relict erosional surface which is no longer active. Despite this, under some conditions the clay will experience erosion.
1.4 Hydrodynamic Regime
1.4.1 The hydrodynamic information was derived from the modelling undertaken as part of this marine processes study. The tidal information was extracted from the hydrodynamic model at points corresponding to the WTG locations. The wave information was derived from the UK Met. Office’s European wave model. This model has been run in its present configuration since October 1986. The archive contains predictions of sea conditions (wind, wind-sea and swell) at six hourly intervals from October 1986 to June 1988, and at three hourly intervals thereafter. The data can be considered representative of wave conditions in waters around 20 km offshore or greater.
2
2 SCOUR PROCESS OVERVIEW
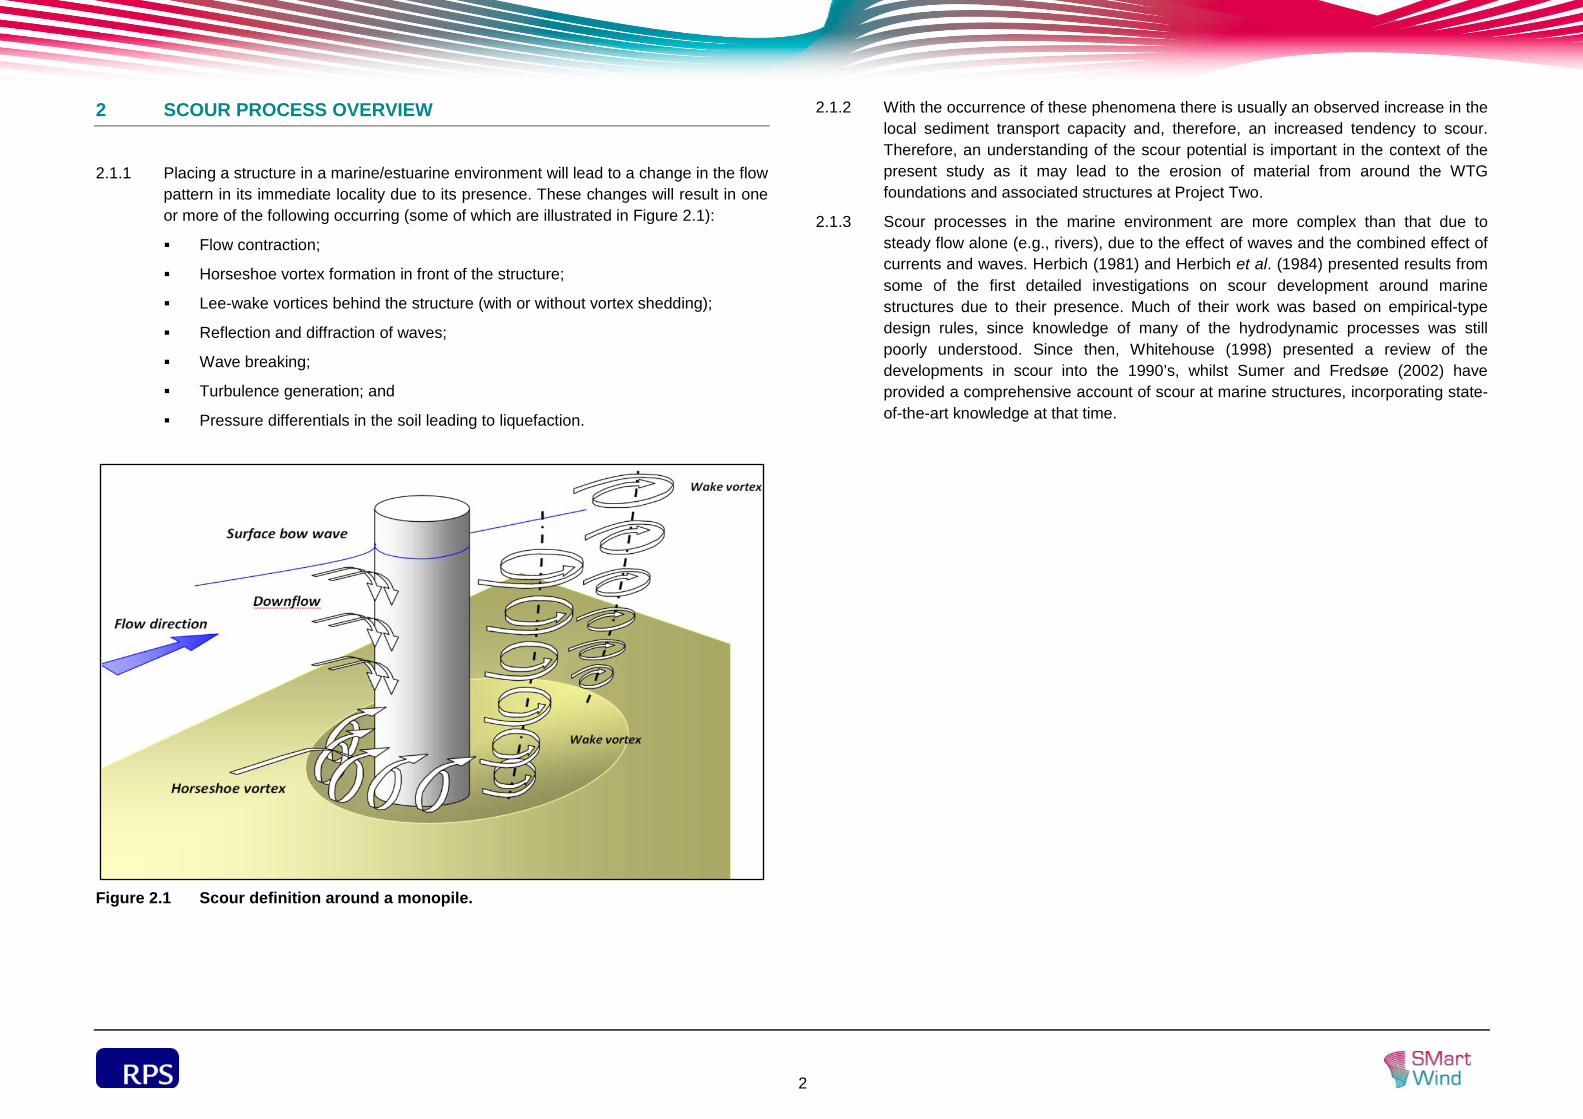
2.1.1 Placing a structure in a marine/estuarine environment will lead to a change in the flow pattern in its immediate locality due to its presence. These changes will result in one or more of the following occurring (some of which are illustrated in Figure 2.1):
Flow contraction;
Horseshoe vortex formation in front of the structure;
Lee-wake vortices behind the structure (with or without vortex shedding);
Reflection and diffraction of waves;
Wave breaking;
Turbulence generation; and
Pressure differentials in the soil leading to liquefaction.
Figure 2.1 Scour definition around a monopile.
2.1.2 With the occurrence of these phenomena there is usually an observed increase in the local sediment transport capacity and, therefore, an increased tendency to scour. Therefore, an understanding of the scour potential is important in the context of the present study as it may lead to the erosion of material from around the WTG foundations and associated structures at Project Two.
2.1.3 Scour processes in the marine environment are more complex than that due to steady flow alone (e.g., rivers), due to the effect of waves and the combined effect of currents and waves. Herbich (1981) and Herbich et al. (1984) presented results from some of the first detailed investigations on scour development around marine structures due to their presence. Much of their work was based on empirical-type design rules, since knowledge of many of the hydrodynamic processes was still poorly understood. Since then, Whitehouse (1998) presented a review of the developments in scour into the 1990’s, whilst Sumer and Fredsøe (2002) have provided a comprehensive account of scour at marine structures, incorporating state-of-the-art knowledge at that time.
3
3 SCOUR ASSESSMENT
3.1 Introduction
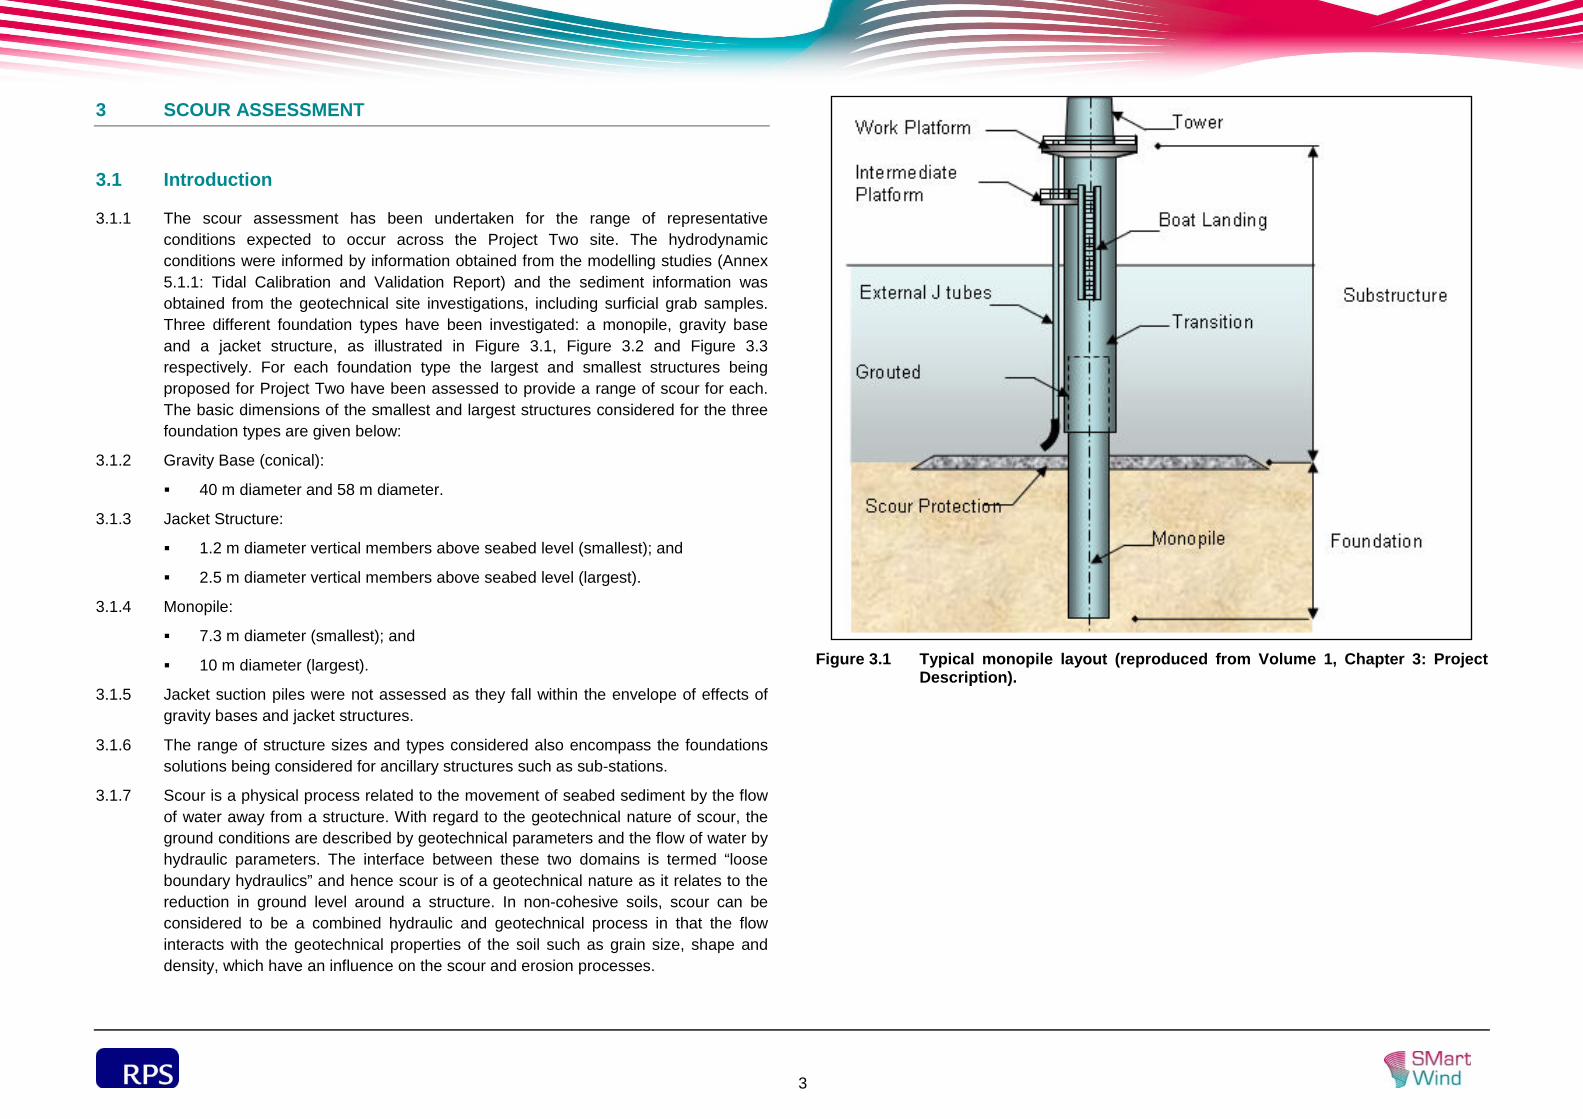
3.1.1 The scour assessment has been undertaken for the range of representative conditions expected to occur across the Project Two site. The hydrodynamic conditions were informed by information obtained from the modelling studies (Annex 5.1.1: Tidal Calibration and Validation Report) and the sediment information was obtained from the geotechnical site investigations, including surficial grab samples. Three different foundation types have been investigated: a monopile, gravity base and a jacket structure, as illustrated in Figure 3.1, Figure 3.2 and Figure 3.3 respectively. For each foundation type the largest and smallest structures being proposed for Project Two have been assessed to provide a range of scour for each. The basic dimensions of the smallest and largest structures considered for the three foundation types are given below:
3.1.2 Gravity Base (conical):
40 m diameter and 58 m diameter.
3.1.3 Jacket Structure:
1.2 m diameter vertical members above seabed level (smallest); and
2.5 m diameter vertical members above seabed level (largest).
3.1.4 Monopile:
7.3 m diameter (smallest); and
10 m diameter (largest).
3.1.5 Jacket suction piles were not assessed as they fall within the envelope of effects of gravity bases and jacket structures.
3.1.6 The range of structure sizes and types considered also encompass the foundations solutions being considered for ancillary structures such as sub-stations.
3.1.7 Scour is a physical process related to the movement of seabed sediment by the flow of water away from a structure. With regard to the geotechnical nature of scour, the ground conditions are described by geotechnical parameters and the flow of water by hydraulic parameters. The interface between these two domains is termed “loose boundary hydraulics” and hence scour is of a geotechnical nature as it relates to the reduction in ground level around a structure. In non-cohesive soils, scour can be considered to be a combined hydraulic and geotechnical process in that the flow interacts with the geotechnical properties of the soil such as grain size, shape and density, which have an influence on the scour and erosion processes.
Figure 3.1 Typical monopile layout (reproduced from Volume 1, Chapter 3: Project
Description).
4
Figure 3.2 Schematic of conical gravity base foundation (reproduced from Volume 1,
Chapter 3: Project Description).
Figure 3.3 Schematic of jacket structure design (reproduced from Volume 1,
Chapter 3: Project Description).
5
3.1.8 Since the flow reverses direction with the tide, the scour development will take place in two directions. In many previous studies, the local scour depth was estimated using the same equations as for unidirectional river flow, although it was considered that scour development is typically reduced due to sediment eroded during the first phase of the tide being deposited on the reversing part of the tidal cycle. In addition to the astronomical variation of the tide, other factors that may affect local scour in tidal areas are meteorological effects such as storm surges and the relative magnitudes of the fluvial and tidal flows.
3.1.9 Relatively little work has been undertaken to investigate scour due to tidal flow in comparison to studies undertaken for unidirectional flow. The work of Escarameia and May (1999) is one of very few studies that have investigated scouring under tidal conditions. However, recently Jensen (2006) presented recommendations for the prediction of local scour for piles under tidal conditions. It is on this basis that the scour assessment has been undertaken using empirical equations originally developed for steady flow conditions.
3.1.10 The time-scale of the scour process can be defined in various ways. The scour depth develops to equilibrium conditions through a transitional period, which is generally asymptotic in form. In the case of live bed scour the equilibrium scour depth is achieved more rapidly than for the clear-water case. Under steady flow conditions the scour process, that is the development of the depth of scour with time, S(t), can be defined by the following formula (Whitehouse, 1998; Det Norske Veritas (DNV), 2011):
( )
−−=
n
se T
tStS exp1 [1]
3.1.11 Where Ts is the time-scale of the scour process, Se is the equilibrium scour depth and n is a power normally taken to be 1.
3.1.12 Clear-water scour is defined as occurring when the bed material upstream of the scouring location remains at rest, whilst live bed scour conditions exist when there is general sediment transport taking place across the bed, irrespective of the intrusive presence of a local scour-invoking structure.
3.2 Local Scour
3.2.1 Local scour at a structure will occur when the local flow field is of sufficient magnitude to remove bed material. The size of the obstruction caused by the structure is a key part of the scour process and this can be observed in the relationship between the depth of scour at the structure and its width. The scour process is time dependent and this is particularly relevant for scouring under tidal flows.
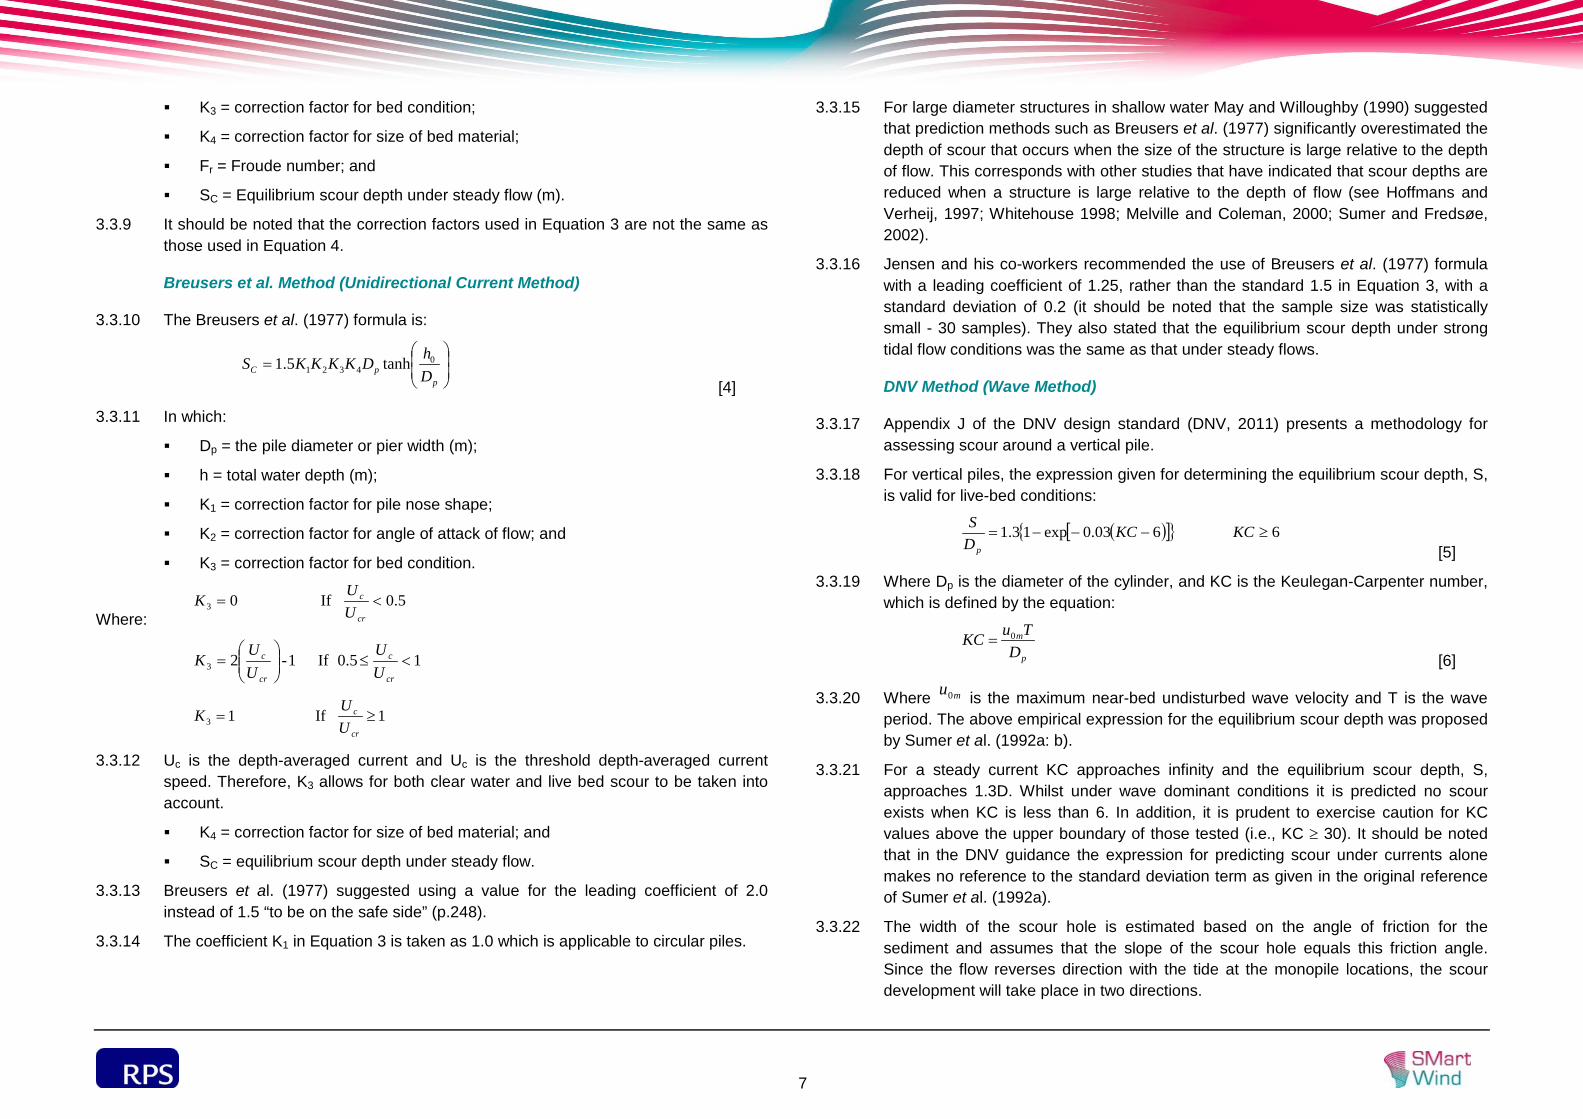
3.2.2 The flow pattern near a pile is quite complex and has been investigated by numerous researchers, for example, Breusers and Raudkivi (1991) and Melville and Coleman (2000). The principal features of scour around a circular pile are well defined: the downflow at the upstream face of the pile; the horseshoe vortex at the base of the pile; a surface roller (or bow wave) at the upstream face of the pile; and wake vortices downstream of the pile (Figure 2.1). The flow can be characterised with the pile Reynolds number:
νpUD
=Re [2]
3.2.3 Where U is the free-stream velocity (the velocity at the outer edge of the boundary layer), Dp is the pile diameter and ν is the kinematic viscosity of the water.
3.2.4 The downflow is a result of flow deceleration in front of the pile. The associated stagnation pressures on the face of the pile are greatest near the surface, where the deceleration is largest, and decrease downwards. This resulting downwards pressure gradient at the face of the pile leads to the downflow, which impinges on the bed, acting like a vertical jet and eroding a groove immediately adjacent to the pile face. The creation of the groove undermines the scour hole slope above and this slope then collapses bringing sediment into the erosion zone. The development of the scour hole around the pile creates a lee eddy, known as the horseshoe vortex. The horseshoe vortex develops as a result of flow separation under the influence of the adverse pressure gradient induced by the presence of the structure itself. The horseshoe vortex is effective at transporting sediment away from the scour hole. Therefore, the downflow and horseshoe vortex are the primary mechanisms in the scour hole development.
3.2.5 The formation of the horseshoe vortex is primarily dependent on the pile Reynolds number (Re), the pile geometry and the ratio of the bed boundary-layer thickness to the pile diameter.
3.2.6 The wake vortices are a consequence of flow separation at the sides of the pile. These vortices travel downstream due to the mean flow. Breusers and Raudkivi (1991) describe these cast-off vortices as having vertical low pressure centres lifting sediment from the bed like miniature tornados, whilst Melville and Coleman (2000) describe the vortices as acting like vacuum cleaners sucking sediment from the bed as well as transporting sediment entrained by the downflow and horseshoe vortex.
3.2.7 Most scour predictors have been developed to predict scour in cohesionless soils, sands and gravels, and as will be discussed in the next section; the present assessment requires scour predictions in both noncohesive (sand) and cohesive (clay) soils. With respect to scouring in cohesive soils, there has been much less work undertaken and reported in the literature. Therefore, a range of methods for scour prediction in a variety of soils have been brought forward for use in this study.
6
3.3 Scour Estimation
3.3.1 This is the main technical section of the assessment describing the detailed methods and results of calculations both for non-cohesive (granular) sediments and for sediments with cohesion. The main conclusions are presented in Sections 5 and 6.
General Seabed Change
3.3.2 No assessment of general seabed change has been made within this scour assessment.
Scour in Non-Cohesive Sediments
3.3.3 There have been numerous methods proposed to estimate scouring in steady flow conditions. For the estimation of scour in the marine environment the principal methods applied here are the Hydraulic Engineering Circular (HEC) 18 approach (Richardson and Davis, 2001) as specified by the US Federal Highway Administration (FHWA), the method of Breusers et al. (1977) and the method laid out in DNV (2011).
3.3.4 From the Particle Size Analysis (PSA) of the grab surficial sediment samples the data shows a broad mixture of sediments as indicated in the Folk diagram (Figure 3.4).
3.3.5 Although the soil information indicates some cohesiveness in the soil, initially, an analysis of the scour potential will be carried out assuming a non-cohesive soil. This stems partially from a paucity of published research on scouring of cohesive soils and soil mixtures (sand, gravel, silts and clay) and the pursuit of conservative assumptions (i.e., granular materials are generally associated with larger scour depths than cohesive soils).
3.3.6 For the present study the structures may have a large diameter to flow depth ratio (D/h0 > 0.5) at certain states of the tide and, in this case, the scaling for scour is different from a slender pile case. The maximum scour depth is dependent on the diameter of the structure as well as the ratio of the water depth to pile diameter. Figure 3.1 shows a schematic of a typical monopile foundation.
Figure 3.4 Folk diagram of grab sample data (from EMU Ltd).
Richardson and Davis Method (Unidirectional Current Method)
3.3.7 The Richardson and Davis (2001) method uses the following equation:
65.0
0
43.0043210.2
=
hD
FhKKKKS prC
[3]
3.3.8 Where:
Dp = the pile diameter (m);
h0 = flow depth (m);
K1 = correction factor for pile nose shape;
K2 = correction factor for angle of attack of flow;
Sand: mud ratio
7
K3 = correction factor for bed condition;
K4 = correction factor for size of bed material;
Fr = Froude number; and
SC = Equilibrium scour depth under steady flow (m).
3.3.9 It should be noted that the correction factors used in Equation 3 are not the same as those used in Equation 4.
Breusers et al. Method (Unidirectional Current Method)
3.3.10 The Breusers et al. (1977) formula is:
=
ppC D
hDKKKKS 04321 tanh5.1
[4]
3.3.11 In which:
Dp = the pile diameter or pier width (m);
h = total water depth (m);
K1 = correction factor for pile nose shape;
K2 = correction factor for angle of attack of flow; and
K3 = correction factor for bed condition.
Where: 5.0 If 03 <=
cr
c
UU
K
1 0.5 If 1-23 <≤
=
cr
c
cr
c
UU
UU
K
1 If 13 ≥=
cr
c
UU
K
3.3.12 Uc is the depth-averaged current and Uc is the threshold depth-averaged current speed. Therefore, K3 allows for both clear water and live bed scour to be taken into account.
K4 = correction factor for size of bed material; and
SC = equilibrium scour depth under steady flow.
3.3.13 Breusers et al. (1977) suggested using a value for the leading coefficient of 2.0 instead of 1.5 “to be on the safe side” (p.248).
3.3.14 The coefficient K1 in Equation 3 is taken as 1.0 which is applicable to circular piles.
3.3.15 For large diameter structures in shallow water May and Willoughby (1990) suggested that prediction methods such as Breusers et al. (1977) significantly overestimated the depth of scour that occurs when the size of the structure is large relative to the depth of flow. This corresponds with other studies that have indicated that scour depths are reduced when a structure is large relative to the depth of flow (see Hoffmans and Verheij, 1997; Whitehouse 1998; Melville and Coleman, 2000; Sumer and Fredsøe, 2002).
3.3.16 Jensen and his co-workers recommended the use of Breusers et al. (1977) formula with a leading coefficient of 1.25, rather than the standard 1.5 in Equation 3, with a standard deviation of 0.2 (it should be noted that the sample size was statistically small - 30 samples). They also stated that the equilibrium scour depth under strong tidal flow conditions was the same as that under steady flows.
DNV Method (Wave Method)
3.3.17 Appendix J of the DNV design standard (DNV, 2011) presents a methodology for assessing scour around a vertical pile.
3.3.18 For vertical piles, the expression given for determining the equilibrium scour depth, S, is valid for live-bed conditions:
( )[ ]{ } 6 603.0exp13.1 ≥−−−= KCKC
DS
p [5]
3.3.19 Where Dp is the diameter of the cylinder, and KC is the Keulegan-Carpenter number, which is defined by the equation:
[6]
3.3.20 Where is the maximum near-bed undisturbed wave velocity and T is the wave period. The above empirical expression for the equilibrium scour depth was proposed by Sumer et al. (1992a: b).
3.3.21 For a steady current KC approaches infinity and the equilibrium scour depth, S, approaches 1.3D. Whilst under wave dominant conditions it is predicted no scour exists when KC is less than 6. In addition, it is prudent to exercise caution for KC values above the upper boundary of those tested (i.e., KC ≥ 30). It should be noted that in the DNV guidance the expression for predicting scour under currents alone makes no reference to the standard deviation term as given in the original reference of Sumer et al. (1992a).
3.3.22 The width of the scour hole is estimated based on the angle of friction for the sediment and assumes that the slope of the scour hole equals this friction angle. Since the flow reverses direction with the tide at the monopile locations, the scour development will take place in two directions.
p
m
DTuKC 0=
mu0
8
3.3.23 For the purpose of undertaking scour calculations, the near-bed wave orbital velocity
is calculated using , which is assumed to be equivalent to . The period, T, is taken as the peak period Tp. The amplitude of the fluid motion relative to the pile diameter is expressed as the Keulegan-Carpenter number, KC.
Sumer and Fredsøe Method (Unidirectional Current or Wave Method)
3.3.24 Sumer et al. (1992a) reassessed the statistics of the original data of Breusers et al. (1977) and derived a simple expression for scour depth under live-bed scour:
DS
p
C
DS
σ+= 3.1 [7]
3.3.25 Where is the standard deviation of SC/Dp, with SC being the equilibrium scour
depth under steady flow and Dp the pile diameter. Based on experimental data is taken to be 0.7.
3.3.26 For the wave case, two major changes occur in respect of the near-bed flow. The horseshoe vortex and the lee-wake flow acts as a convection mechanism to transport eroded sediment away from the pile during each half-period of wave motion. These two processes are primarily governed by the Keulegan-Carpenter number, KC.
3.3.27 Therefore, it is expected that the mechanism of scour will also be governed by the Keulegan-Carpenter number (Sumer and Fredsøe, 2002). Based on their experimental results, Sumer et al. (1992b) provide the following expression for depth of scour under waves alone (see also DNV, 2011).
[8]
3.3.28 Where is the depth of scour for the steady-current only.
The Combined Wave-Current Case
3.3.29 Early studies on the scour depth due to combined waves and current have been undertaken by Wang and Herbich (1983), Herbich et al. (1984) and Eadie and Herbich (1986). More recently, Sumer and Fredsøe (2001) undertook a detailed investigation of the influence of a superimposed current on the scour depth in combination with waves. Based on Sumer and Fredsøe’s data, they derived an empirical expression for the depth of scour, S, for the combined wave and current case in live-bed conditions with data for KC in the range 4 to 26.
[9]
3.3.30 Where is the depth of scour for the steady-current only case and the parameters A and B are given by the equations:
[10]
[11]
3.3.31 And is the velocity ratio given by the equation:
[12]
3.3.32 Where is the current speed and is defined as previously in Equation [6]. This formulation is valid for the live-bed scour regime (i.e., where sediment is mobile on the seabed everywhere and not just in the vicinity of the foundation).
Gravity Base Foundations
3.3.33 Hoffmans and Verheij (1997) presented the Khalfin (1983) current-only scour predictor for a GBF with the following modified features:
The pile diameter was replaced by a characteristic length, Dc, taken as the average of the length and breadth of the GBF;
The flow depth, h, in the water depth to diameter ratio h/Dc was replaced by the GBF height, hc; and
The undisturbed depth-averaged flow velocity was multiplied by αc/2 with αc = 2 for a circular structure, and αc = 2.3 for a rectangular GBF expressing the additional turbulence generated at the corners of the structure. The coefficient αc is an influence factor that represents the flow enhancement near the structure caused by the structure.
3.3.34 The equation for scour depth, S, is given as Equation 13:
( ) N
c
c
c
cr
c
c ghU
Dh
UU
DS
−=
243.15.015.0296.8 αα
[13]
crcr UUUU ≥= for 1/with
34.0
83.0 and
=
c
c
DhN
3.3.35 Here Ucr is the value of depth-averaged flow velocity for initiation of sediment motion
(ms-1) and g is gravitational acceleration (ms-2).
3.3.36 Figure 3.2 shows a schematic of a conical gravity base design.
rmsH 2srms HH =
DSσ
DSσ
( ){ }[ ] 6 KCfor 603.0exp1 ≥−−−= KCSS C
CS
( ){ }[ ] B KCfor exp1 ≥−−−= BKCASS C
CS
6.2
4303.0 cwUA +=
( )cwUB 7.4exp6 −=
cwU
mc
ccw uu
uU0+
=
cu mu0
9
Jacket Structures
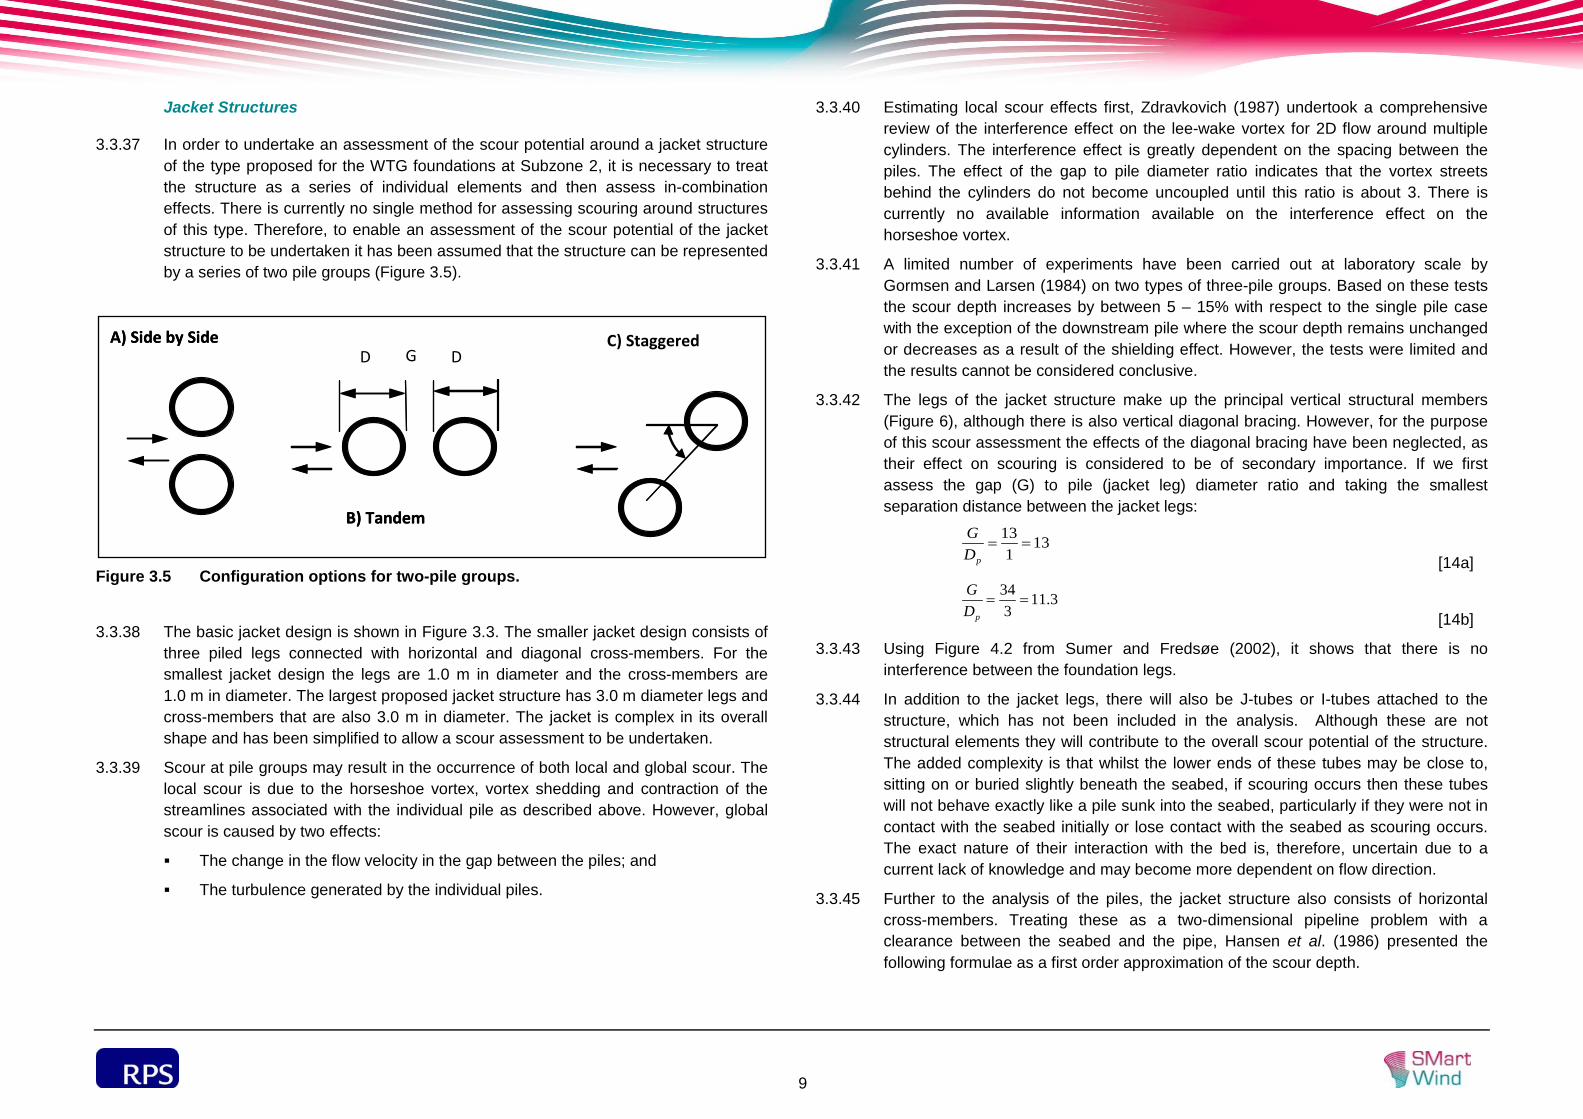
3.3.37 In order to undertake an assessment of the scour potential around a jacket structure of the type proposed for the WTG foundations at Subzone 2, it is necessary to treat the structure as a series of individual elements and then assess in-combination effects. There is currently no single method for assessing scouring around structures of this type. Therefore, to enable an assessment of the scour potential of the jacket structure to be undertaken it has been assumed that the structure can be represented by a series of two pile groups (Figure 3.5).
Figure 3.5 Configuration options for two-pile groups.
3.3.38 The basic jacket design is shown in Figure 3.3. The smaller jacket design consists of three piled legs connected with horizontal and diagonal cross-members. For the smallest jacket design the legs are 1.0 m in diameter and the cross-members are 1.0 m in diameter. The largest proposed jacket structure has 3.0 m diameter legs and cross-members that are also 3.0 m in diameter. The jacket is complex in its overall shape and has been simplified to allow a scour assessment to be undertaken.
3.3.39 Scour at pile groups may result in the occurrence of both local and global scour. The local scour is due to the horseshoe vortex, vortex shedding and contraction of the streamlines associated with the individual pile as described above. However, global scour is caused by two effects:
The change in the flow velocity in the gap between the piles; and
The turbulence generated by the individual piles.
3.3.40 Estimating local scour effects first, Zdravkovich (1987) undertook a comprehensive review of the interference effect on the lee-wake vortex for 2D flow around multiple cylinders. The interference effect is greatly dependent on the spacing between the piles. The effect of the gap to pile diameter ratio indicates that the vortex streets behind the cylinders do not become uncoupled until this ratio is about 3. There is currently no available information available on the interference effect on the horseshoe vortex.
3.3.41 A limited number of experiments have been carried out at laboratory scale by Gormsen and Larsen (1984) on two types of three-pile groups. Based on these tests the scour depth increases by between 5 – 15% with respect to the single pile case with the exception of the downstream pile where the scour depth remains unchanged or decreases as a result of the shielding effect. However, the tests were limited and the results cannot be considered conclusive.
3.3.42 The legs of the jacket structure make up the principal vertical structural members (Figure 6), although there is also vertical diagonal bracing. However, for the purpose of this scour assessment the effects of the diagonal bracing have been neglected, as their effect on scouring is considered to be of secondary importance. If we first assess the gap (G) to pile (jacket leg) diameter ratio and taking the smallest separation distance between the jacket legs:
131
13==
pDG
[14a]
11.33
34==
pDG
[14b]
3.3.43 Using Figure 4.2 from Sumer and Fredsøe (2002), it shows that there is no interference between the foundation legs.
3.3.44 In addition to the jacket legs, there will also be J-tubes or I-tubes attached to the structure, which has not been included in the analysis. Although these are not structural elements they will contribute to the overall scour potential of the structure. The added complexity is that whilst the lower ends of these tubes may be close to, sitting on or buried slightly beneath the seabed, if scouring occurs then these tubes will not behave exactly like a pile sunk into the seabed, particularly if they were not in contact with the seabed initially or lose contact with the seabed as scouring occurs. The exact nature of their interaction with the bed is, therefore, uncertain due to a current lack of knowledge and may become more dependent on flow direction.
3.3.45 Further to the analysis of the piles, the jacket structure also consists of horizontal cross-members. Treating these as a two-dimensional pipeline problem with a clearance between the seabed and the pipe, Hansen et al. (1986) presented the following formulae as a first order approximation of the scour depth.
A) Side by Side
B) Tandem
D DGC) StaggeredA) Side by Side
B) Tandem
10
3.3.46 For steady currents:
2.1 0.25- 6.0exp625.0 ≤≤
−=
pipipi De
De
DS
[15]
3.3.47 For waves:
2 0 6.0exp1.0 ≤≤
−=
pipipi De
DeKC
DS
[16]
3.3.48 Where e is the clearance between the seabed and the pipe and piD is the pipe diameter.
3.3.49 The width of the scour hole under the horizontal structural members can be approximated using the empirical expression of Sumer and Fredsøe (2002):
65.035.0 KCDW
pi
= [17]
3.3.50 In which the width, W is measured from the centre of pipe to the edge of the scour hole.
Multimodal Sediments/Bed Armouring
3.3.51 Armouring of the seabed may occur when a widely graded sediment exists on the seabed and the sediment is preferentially eroded. Raudkivi and Ettema (1977a; b) studied the effect of grain size distribution on the local depth of scour at a bridge pier under clear water scour conditions. Breusers and Raudkivi (1991) and Hoffmans and Verheij (1997) present methods for correcting scour depth for the effect of grain size distribution based on experimental data. Hoffmans and Verheij use the ratio of d84/d50 but note that little information is available and the correction should be applied with care.
3.3.52 From research carried out for the US Federal Highways Agency it has been demonstrated that when the approach velocity is less than the critical velocity of the d90 size of the bed material and there is a gradation in sediments, then the value of d90 will limit the scour depth (Richardson and Davis, 2001).
3.3.53 In the case of clear water scour a cautionary approach should be adopted when considering the effect of sediment distribution and possible bed armouring as there is no supply of potential material in this instance.
3.3.54 Melville and Coleman (2000) present a method for assessing the effect of flow intensity for uniform and non-uniform sediments. Clearwater scour conditions exist for both uniform and non-uniform sediments when the flow intensity, Uc/ Ucr is less than 1 or [Uc – (Ua – Ucr)]/Ucr is less than 1, respectively. For non-uniform sediments armouring will occur on the channel bed and within the scour hole if the geometric standard deviation, σg greater than 1.3.
3.3.55 The armour peak velocity, Ua is determined in the following manner:
8.1100
50d
da=
[18]
3.3.56 For practical purposes the d100 value can be replaced by d90 or d95. Using this corrected median sediment size, a revised critical threshold velocity can be determined.
Ua = 0.8 acrU [19]
Scour in Cohesive Sediments
3.3.57 The geotechnical information provided as input to this study provides some indication of the soil properties with depth and indicates that the soil in the locality of the various WTG support structures becomes cohesive in nature below a surface sediment veneer (for example Borehole BH_W7, SMart Wind unpublished data). Therefore, a limited assessment of the scour potential around typical monopile structures has been undertaken assuming this more complex soil composition.
3.3.58 One difficulty in predicting scour around structures is that the empirical methods are based on uniform soils, generally sand or non-cohesive material. The SRICOS method (Briaud et al., 1999) is one of the few available approaches for assessing scouring in cohesive soils.
3.3.59 Cohesive soils can erode due to:
Hydraulic forces from waves, currents and turbulence; and
Abrasion from the transport of sand and gravel particles over the surface of the clay.
3.3.60 Hoffmans and Verheij (1997) provide rough estimates of values for threshold of erosion of cohesive sediments. The minimum depth-averaged velocity to cause erosion in 3 m of water for heavy loamy clay with low density was 0.5 ms-1, for heavy loamy clay of medium density 1.0 ms-1 and for heavy loamy clay (dense) 1.5 ms-1.
11
Briaud et al. (1999) Method (Unidirectional Flow Method)
3.3.61 The SRICOS method (Briaud et al., 1999) was developed to predict the scour depth at a cylindrical pier under steady flows, uniform clay soils and a water depth greater than twice the pile diameter.
635.0Re00018.0=CS [20]
3.3.62 The formula is independent of the specific soil properties and is considered to represent the maximum possible depth of scour. Therefore, the maximum scour depth is governed primarily by the pile diameter, current speed and kinematic viscosity and it would be expected that as the current velocity increases so the erosive capacity of the flow will also increase.
Annandale Method (Unidirectional Flow Method with Wave Effects Represented)
3.3.63 The Earth Materials approach of Annandale (1995, 2006) modified by Harris et al. (2010a) takes information on the soil mass properties and structure and produces an erodibility index K. The erodibility index is compared with the stream power, P, supplied by the wave and current action to determine whether erosion is likely to occur or not. This approach has not been widely used to date and there is a certain amount of uncertainty in its application. If P exceeds the erosion threshold then scouring will occur. The approach was originally developed for predicting scouring of rock spillways, but the methodology applies equally to less strong soils.
3.3.64 The erodibility index is defined as:
SdbS JKKMK = [21]
3.3.65 Where:
MS = the mass strength number
Kb = block size number
Kd = discontinuity bond shear strength number
JS = relative ground structure number
3.3.66 Equation 21 was originally proposed by Kirsten (1982) to characterize how easily earth materials can be excavated. Annandale (1995) extended this work showing that the erodibility index could be used to predict the relative ability of earth materials to resist the erosive capability of water.
3.3.67 There is a requirement to calculate the maximum scour depth, Smax. It is assumed that the maximum scour depth can be determined by using the HEC18 methodology which applies to non-cohesive soil (Richardson and Davis, 2001). This expression is based on an envelope curve that embraces known data of scour depth around bridge piers. The approach is generally considered to be conservative. This represents the maximum possible scour depth, and any reduction in scouring due to the soil properties must, therefore, give a depth of scour that is less than this value.
3.3.68 It is then necessary to determine the relative stream power (P/Pa) for erosion, which for circular piers has been approximated based on laboratory data collected as part of studies undertaken for the US Department of Transportation, Federal Highway Administration. This indicates how the available stream power for scouring reduces as the scour hole increases in size (i.e., gets deeper).
3.3.69 For circular piers:
( )max92.195.8 SS
a
s ePP −=
[22]
3.3.70 Where Ps is the stream power at the base of the structure relative to the adjacent seabed surface and Pa is the available stream power upstream of the structure.
12
4 RESULTS
4.1 Introduction
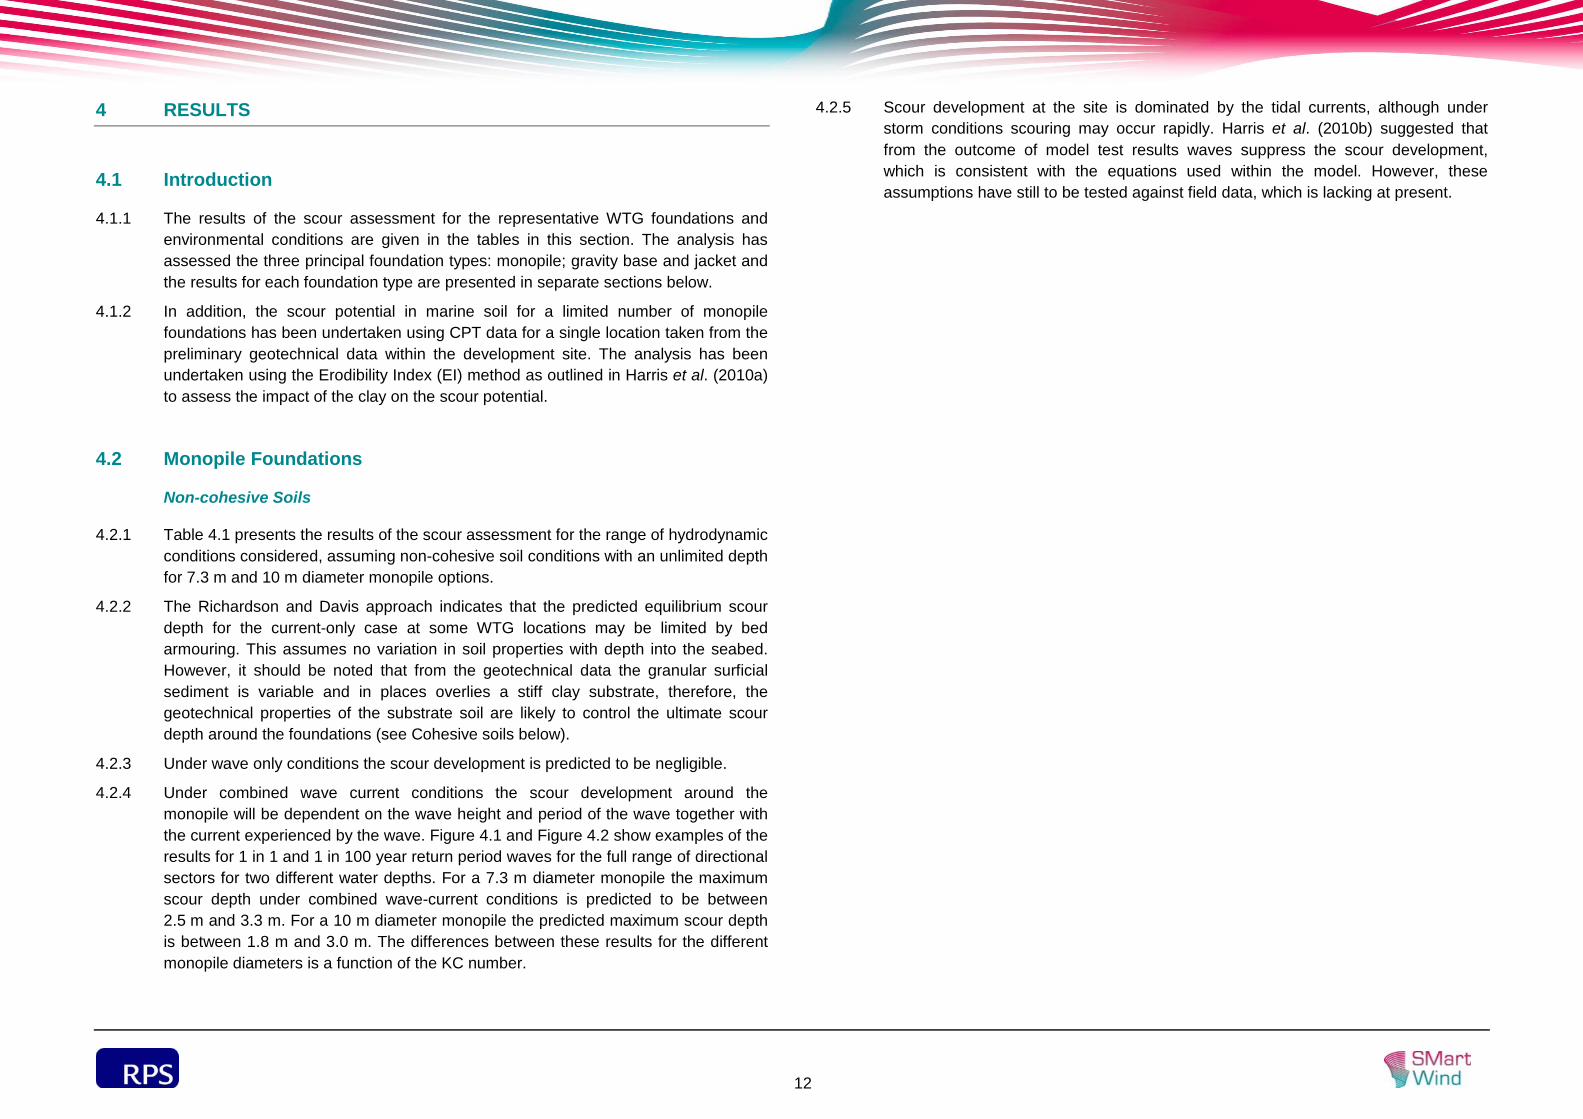
4.1.1 The results of the scour assessment for the representative WTG foundations and environmental conditions are given in the tables in this section. The analysis has assessed the three principal foundation types: monopile; gravity base and jacket and the results for each foundation type are presented in separate sections below.
4.1.2 In addition, the scour potential in marine soil for a limited number of monopile foundations has been undertaken using CPT data for a single location taken from the preliminary geotechnical data within the development site. The analysis has been undertaken using the Erodibility Index (EI) method as outlined in Harris et al. (2010a) to assess the impact of the clay on the scour potential.
4.2 Monopile Foundations
Non-cohesive Soils
4.2.1 Table 4.1 presents the results of the scour assessment for the range of hydrodynamic conditions considered, assuming non-cohesive soil conditions with an unlimited depth for 7.3 m and 10 m diameter monopile options.
4.2.2 The Richardson and Davis approach indicates that the predicted equilibrium scour depth for the current-only case at some WTG locations may be limited by bed armouring. This assumes no variation in soil properties with depth into the seabed. However, it should be noted that from the geotechnical data the granular surficial sediment is variable and in places overlies a stiff clay substrate, therefore, the geotechnical properties of the substrate soil are likely to control the ultimate scour depth around the foundations (see Cohesive soils below).
4.2.3 Under wave only conditions the scour development is predicted to be negligible.
4.2.4 Under combined wave current conditions the scour development around the monopile will be dependent on the wave height and period of the wave together with the current experienced by the wave. Figure 4.1 and Figure 4.2 show examples of the results for 1 in 1 and 1 in 100 year return period waves for the full range of directional sectors for two different water depths. For a 7.3 m diameter monopile the maximum scour depth under combined wave-current conditions is predicted to be between 2.5 m and 3.3 m. For a 10 m diameter monopile the predicted maximum scour depth is between 1.8 m and 3.0 m. The differences between these results for the different monopile diameters is a function of the KC number.
4.2.5 Scour development at the site is dominated by the tidal currents, although under storm conditions scouring may occur rapidly. Harris et al. (2010b) suggested that from the outcome of model test results waves suppress the scour development, which is consistent with the equations used within the model. However, these assumptions have still to be tested against field data, which is lacking at present.
13
Table 4.1 Maximum predicted equilibrium scour depths for 7.3 m and 10 m diameter monopiles, current only conditions.
Scour Predictor Method (7.3 m ∅ monopile)
Maximum Equilibrium scour depth (m)
Water depth (m)
27.7 30.0 32.2 32.68 35.0 37.2 40 42.3 44.5
Richardson and Davis (2001) 7.7 7.8 7.9 7.9 8.0 8.1 8.1 8.2 8.3
Breusers et al. (1977) [1.5 multiplier]
11.0 11.0 11.0 11.0 11.0 11.0 11.0 11.0 11.0
DNV (2013) [1.3 multiplier]
9.5 9.5 9.5 9.5 9.5 9.5 9.5 9.5 9.5
Sumer and Fredsøe [2.0 multiplier]
14.6 14.6 14.6 14.6 14.6 14.6 14.6 14.6 14.6
Scour Predictor Method (10 m ∅ monopile)
Maximum Equilibrium scour depth (m)
Water depth (m)
27.7 30.0 32.2 32.68 35.0 37.2 40 42.3 44.5
Richardson and Davis (2001) 9.5 9.6 9.7 9.7 9.8 9.9 10.0 10.1 10.1
Breusers et al. (1977) [1.5 multiplier]
15.0 15.0 15.0 15.0 15.0 15.0 15.0 15.0 15.0
Scour Predictor Method (10 m ∅ monopile)
Maximum Equilibrium scour depth (m)
Water depth (m)
27.7 30.0 32.2 32.68 35.0 37.2 40 42.3 44.5
DNV (2013) [1.3 multiplier]
13.0 13.0 13.0 13.0 13.0 13.0 13.0 13.0 13.0
Sumer and Fredsøe [2.0 multiplier]
20.0 20.0 20.0 20.0 20.0 20.0 20.0 20.0 20.0
14
Figure 4.1 Predicted scour depth for combined wave-current flow conditions for 1 in
1 and 1 in 100 year return period conditions for 7.3 m diameter (top) and 10 m diameter (bottom) monopiles in 27.68 m water depth.
Figure 4.2 Predicted scour depth for combined wave-current flow conditions for 1 in
1 and 1 in 100 year return period conditions for 7.3 m diameter (top) and 10 m diameter (bottom) monopiles in 44.47 m water depth.
0.0
0.5
1.0
1.5
2.0
2.5
3.00
22.5
45
67.5
90
112.5
135
157.5
180
202.5
225
247.5
270
292.5
315
337.5
Combined wave-current scour depth (m) 1: 1 year retrun period
Combined wave-current scour depth (m) 1: 100 year retrun period
o
o
o
o
o
o
o
o o
o
o
o
o
o
o
o
Monopile:Diameter 7.3 mWater depth 27.68 mCurrent speed 1.02 m/s
0.0
0.5
1.0
1.5
2.0
2.5
3.0
3.50
22.5
45
67.5
90
112.5
135
157.5
180
202.5
225
247.5
270
292.5
315
337.5
Combined wave-current scour depth (m) 1: 1 year retrun period
Combined wave-current scour depth (m) 1: 100 year retrun period
o
o
o
o
o
o
o
o o
o
o
o
o
o
o
o
Monopile:Diameter 10 mWater depth 27.68 mCurrent speed 1.02 m/s
0.0
0.5
1.0
1.5
2.0
2.5
3.00
22.5
45
67.5
90
112.5
135
157.5
180
202.5
225
247.5
270
292.5
315
337.5
Combined wave-current scour depth (m) 1: 1 year retrun period
Combined wave-current scour depth (m) 1: 100 year retrun period
o
o
o
o
o
o
o
o o
o
o
o
o
o
o
o
Monopile:Diameter 7.3 mWater depth 44.47 mCurrent speed 1.02 m/s
0.0
0.5
1.0
1.5
2.0
2.5
3.0
3.50
22.5
45
67.5
90
112.5
135
157.5
180
202.5
225
247.5
270
292.5
315
337.5
Combined wave-current scour depth (m) 1: 1 year retrun period
Combined wave-current scour depth (m) 1: 100 year retrun period
o
o
o
o
o
o
o
o o
o
o
o
o
o
o
o
Monopile:Diameter 10 mWater depth 44.47 mCurrent speed 1.02 m/s
15
Cohesive Soil
4.2.6 Figure 4.3 shows an example of the results from the scour analysis undertaken using the Erodibility Index approach assuming a stiff clay loacted around 1.3 m below the existing bed level. The results show that scouring will occur within the overlying soil veneer (the surficial veneer is around 1.3 m thick in this instance), but the stiff clay will resist scour development. Therefore, where stiff clay deposits with sufficient thickness occur below the overlying granular veneer, it is likely that scour development will be reduced. In Figure 4.3 the scour development is limited to around 1.5 m. It should be noted that abrasion of clay by granular material passing over the top may affect the predicted scour depth in the example above, leading to greater depth being achieved over a period of time.
Figure 4.3 Scour potential at the WTG 10 predicted using the Earth Materials method
(required stream power is indicative and based on borehole/CPT data provided by SMart Wind).
Scour Extents
4.2.7 In complex soils the limiting effects of mixtures of sand, silt and clay and layered sediments should in principle act to limit the scour depth that develops compared with the mobile sand bed case. In general it should be considered that foundation locations with extensive sand dominated deposits should be treated as being susceptible to scouring.
4.2.8 In order to determine the scour extents in more complex soils it is first necessary to undertake an assessment of the likely scour depth around the monopiles by incorporating an approach which takes account of knowledge of the actual soil profile. The method used here is the one published by Annandale (1995, 2006) adapted for marine conditions by Harris et al. (2010a). From the information determined from the scour assessment an estimation of scour extents has been completed.
4.2.9 As an initial assessment of the scour extents a simplified approach has been adopted. The principal assumption of the approach is that the slope of any scour hole is based on the angle of repose, also termed angle of friction, of the sediment. Typical angles of repose for sands are given by Hoffmans and Verheij (1997) and presented in Table 4.2. The upstream slope of the scour hole is the angle of repose, whilst the downstream slope is half this angle ±2°, approximately. The side slopes of the scour hole are about 5/6 of the angle of repose. For cohesive material the angle of repose is likely to be similar to that observed in non-cohesive soils, which would be typically assumed to be in the range of 25° to 45°. From field measurements at built offshore wind farms it has been observed that in granular soils lower angles of repose of the order of 10° to 11° can occur, and this is discussed further in Section 5. Therefore, to provide a range of potential scour extents the angles of 25° and 40° have been selected as being typical and in addition to these a comparison of the lower value in this range (25°) has been compared with an angle of repose of 11°, representing a more conservative estimate. It is possible that steeper or shallower angles of repose may occur within the cohesive sediment, but we consider this provides a reasonable basis for estimating scour hole extent given the present state of knowledge.
4.2.10 The general shape of the hole has been assumed to take the form of an asymmetric ellipse. The orientation of the scour hole is assumed to be that of the dominant scour process taking place at that point in time. The direction of the mean depth-averaged current and the wave angle will influence the asymmetry of the scour hole.
0.0
1.0
2.0
3.0
4.0
5.0
6.0
0.00 0.02 0.04 0.06 0.08 0.10 0.12 0.14
Stream power (kW/m2)
Dep
th b
elow
sea
bed
(m)
Required stream power
Available stream power (currents alone)
Available stream power (waves alone)
Available stream power (combined waves and currents)
16
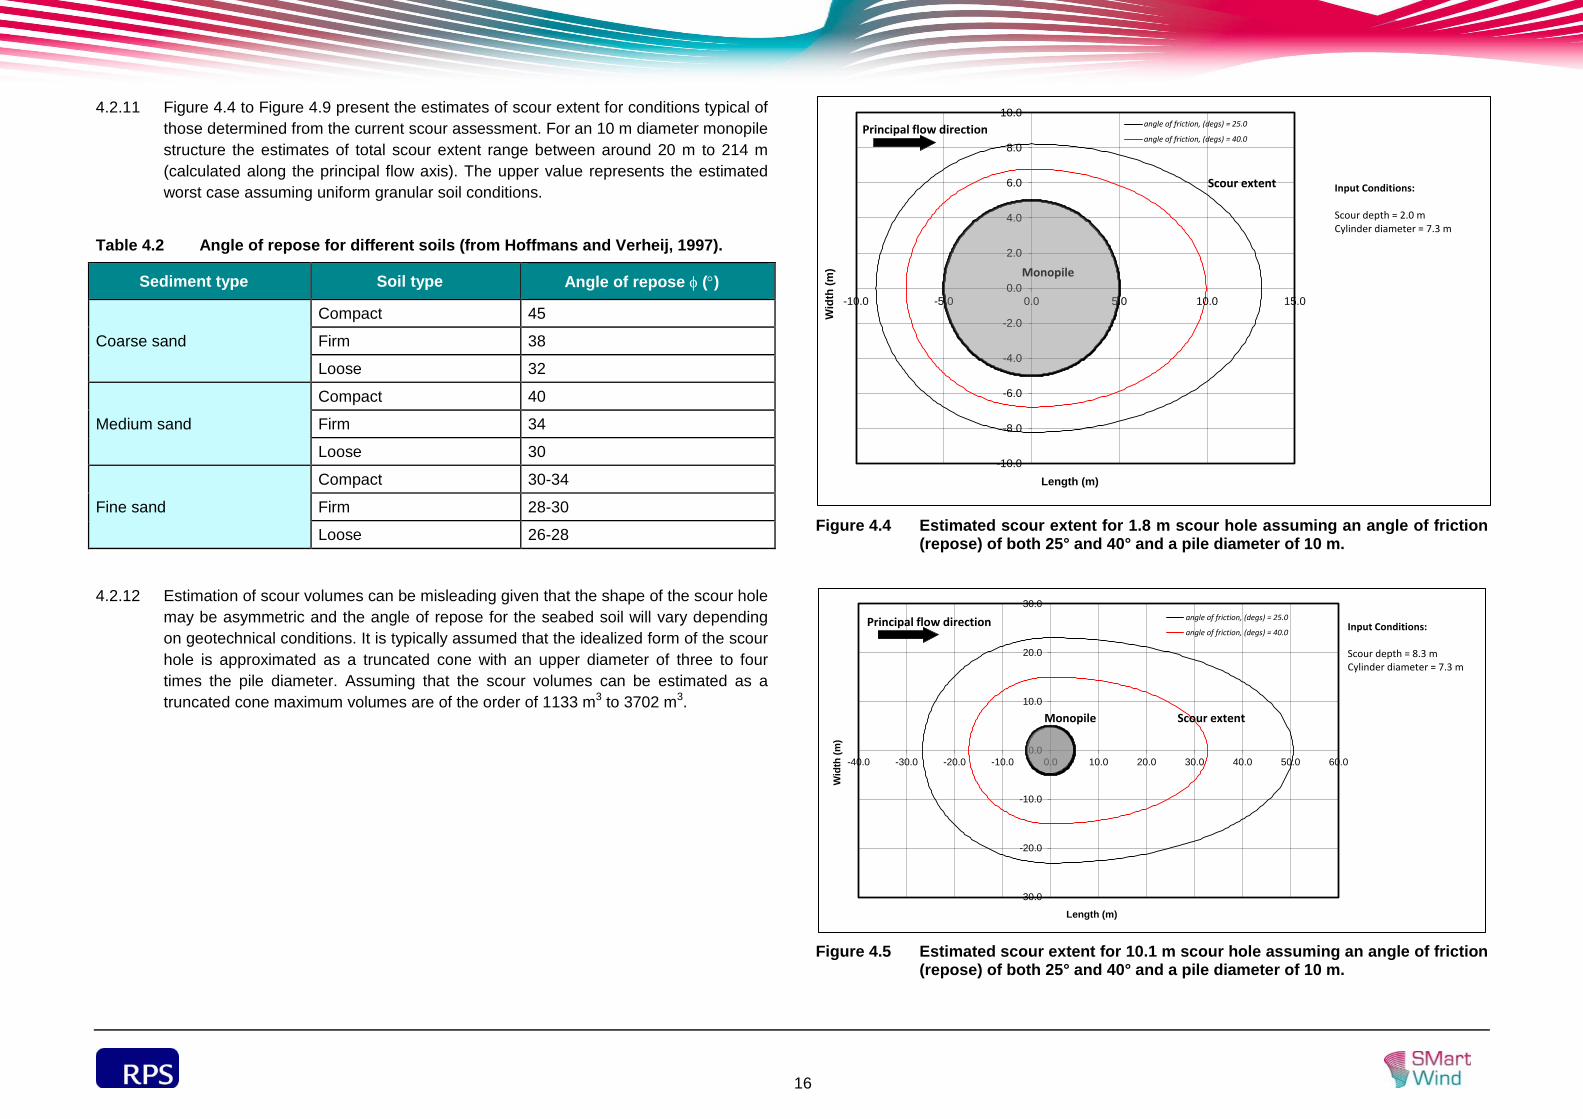
4.2.11 Figure 4.4 to Figure 4.9 present the estimates of scour extent for conditions typical of those determined from the current scour assessment. For an 10 m diameter monopile structure the estimates of total scour extent range between around 20 m to 214 m (calculated along the principal flow axis). The upper value represents the estimated worst case assuming uniform granular soil conditions.
Table 4.2 Angle of repose for different soils (from Hoffmans and Verheij, 1997).
Sediment type Soil type Angle of repose φ (°)
Coarse sand
Compact 45
Firm 38
Loose 32
Medium sand
Compact 40
Firm 34
Loose 30
Fine sand
Compact 30-34
Firm 28-30
Loose 26-28
4.2.12 Estimation of scour volumes can be misleading given that the shape of the scour hole may be asymmetric and the angle of repose for the seabed soil will vary depending on geotechnical conditions. It is typically assumed that the idealized form of the scour hole is approximated as a truncated cone with an upper diameter of three to four times the pile diameter. Assuming that the scour volumes can be estimated as a truncated cone maximum volumes are of the order of 1133 m3 to 3702 m3.
Figure 4.4 Estimated scour extent for 1.8 m scour hole assuming an angle of friction
(repose) of both 25° and 40° and a pile diameter of 10 m.
Figure 4.5 Estimated scour extent for 10.1 m scour hole assuming an angle of friction
(repose) of both 25° and 40° and a pile diameter of 10 m.
-10.0
-8.0
-6.0
-4.0
-2.0
0.0
2.0
4.0
6.0
8.0
10.0
-10.0 -5.0 0.0 5.0 10.0 15.0
Wid
th (m
)
Length (m)
angle of friction, (degs) = 25.0
angle of friction, (degs) = 40.0Principal flow direction
Monopile
Scour extent Input Conditions:
Scour depth = 2.0 mCylinder diameter = 7.3 m
-30.0
-20.0
-10.0
0.0
10.0
20.0
30.0
-40.0 -30.0 -20.0 -10.0 0.0 10.0 20.0 30.0 40.0 50.0 60.0
Wid
th (m
)
Length (m)
angle of friction, (degs) = 25.0
angle of friction, (degs) = 40.0Principal flow direction
Monopile Scour extent
Input Conditions:
Scour depth = 8.3 mCylinder diameter = 7.3 m
17
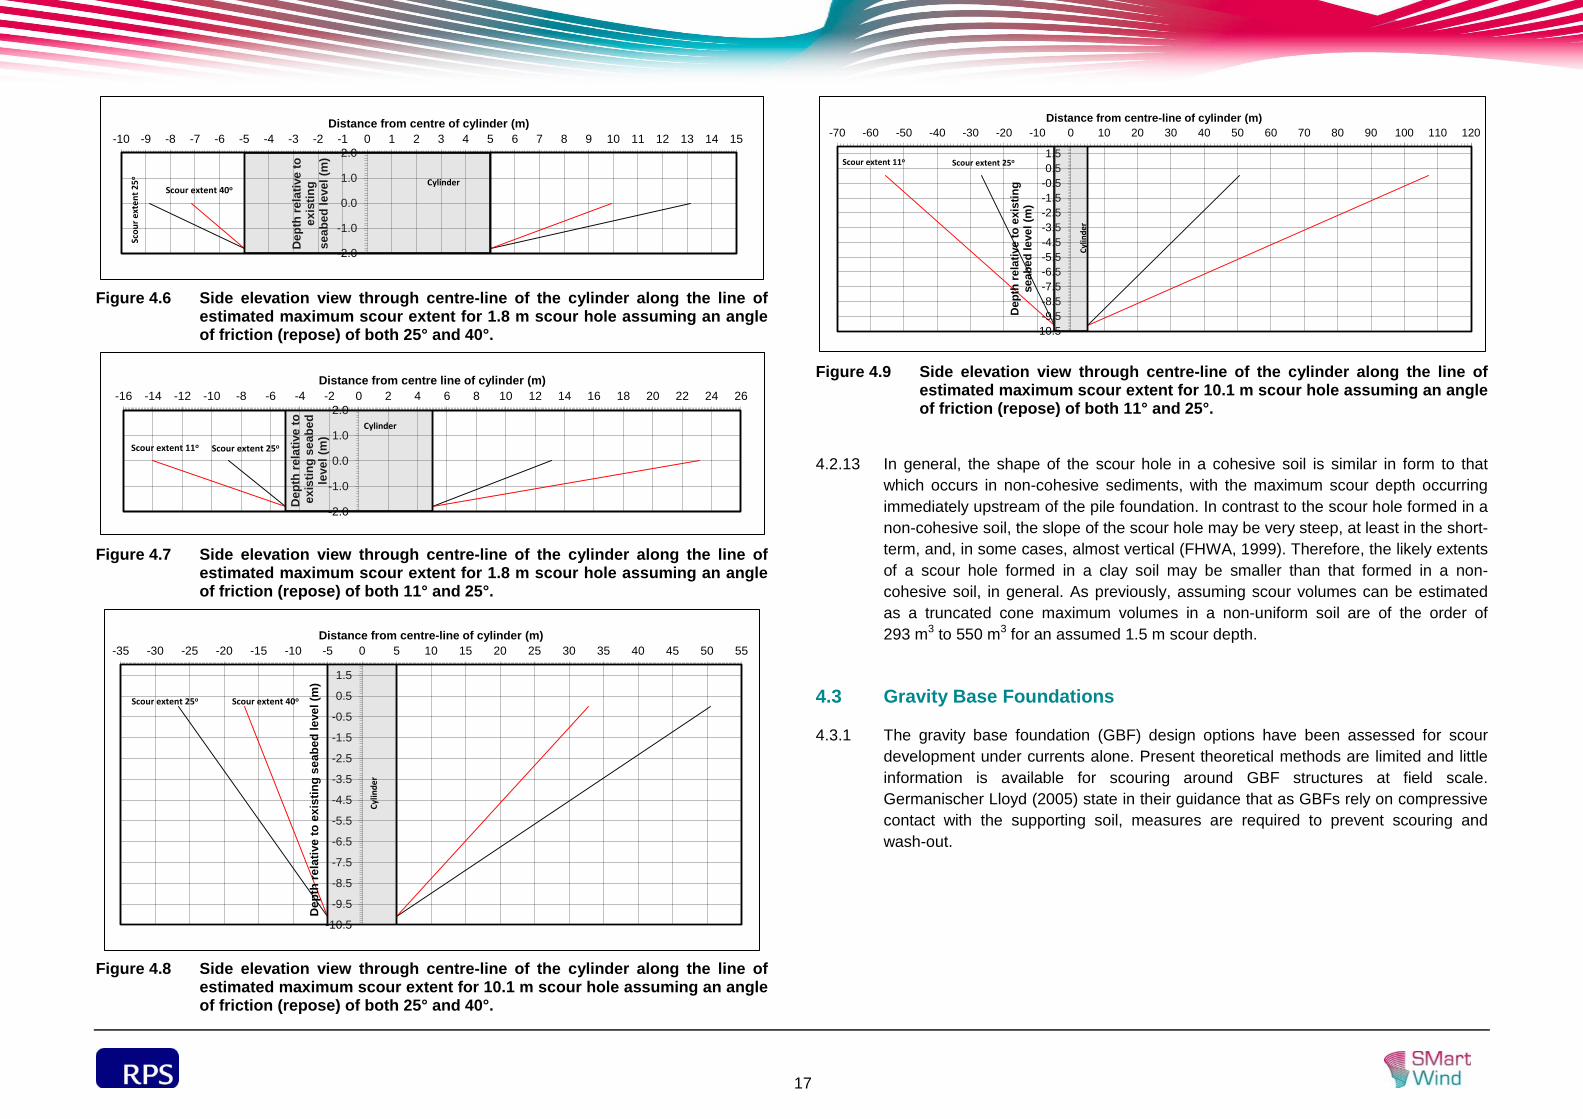
Figure 4.6 Side elevation view through centre-line of the cylinder along the line of
estimated maximum scour extent for 1.8 m scour hole assuming an angle of friction (repose) of both 25° and 40°.
Figure 4.7 Side elevation view through centre-line of the cylinder along the line of
estimated maximum scour extent for 1.8 m scour hole assuming an angle of friction (repose) of both 11° and 25°.
Figure 4.8 Side elevation view through centre-line of the cylinder along the line of
estimated maximum scour extent for 10.1 m scour hole assuming an angle of friction (repose) of both 25° and 40°.
Figure 4.9 Side elevation view through centre-line of the cylinder along the line of
estimated maximum scour extent for 10.1 m scour hole assuming an angle of friction (repose) of both 11° and 25°.
4.2.13 In general, the shape of the scour hole in a cohesive soil is similar in form to that which occurs in non-cohesive sediments, with the maximum scour depth occurring immediately upstream of the pile foundation. In contrast to the scour hole formed in a non-cohesive soil, the slope of the scour hole may be very steep, at least in the short-term, and, in some cases, almost vertical (FHWA, 1999). Therefore, the likely extents of a scour hole formed in a clay soil may be smaller than that formed in a non-cohesive soil, in general. As previously, assuming scour volumes can be estimated as a truncated cone maximum volumes in a non-uniform soil are of the order of 293 m3 to 550 m3 for an assumed 1.5 m scour depth.
4.3 Gravity Base Foundations
4.3.1 The gravity base foundation (GBF) design options have been assessed for scour development under currents alone. Present theoretical methods are limited and little information is available for scouring around GBF structures at field scale. Germanischer Lloyd (2005) state in their guidance that as GBFs rely on compressive contact with the supporting soil, measures are required to prevent scouring and wash-out.
-2.0
-1.0
0.0
1.0
2.0-10 -9 -8 -7 -6 -5 -4 -3 -2 -1 0 1 2 3 4 5 6 7 8 9 10 11 12 13 14 15
Dep
th re
lativ
e to
ex
istin
g se
abed
leve
l (m
)
Distance from centre of cylinder (m)
Cylinder
Scou
r ext
ent 2
5o
Scour extent 40o
-2.0
-1.0
0.0
1.0
2.0-16 -14 -12 -10 -8 -6 -4 -2 0 2 4 6 8 10 12 14 16 18 20 22 24 26
Dep
th re
lativ
e to
exis
ting
seab
ed
leve
l (m
)
Distance from centre line of cylinder (m)
Cylinder
Scour extent 11o Scour extent 25o
-10.5
-9.5
-8.5
-7.5
-6.5
-5.5
-4.5
-3.5
-2.5
-1.5
-0.5
0.5
1.5
-35 -30 -25 -20 -15 -10 -5 0 5 10 15 20 25 30 35 40 45 50 55
Dep
th re
lativ
e to
exi
stin
g se
abed
leve
l (m
)
Distance from centre-line of cylinder (m)
Cylin
der
Scour extent 25o Scour extent 40o
-10.5-9.5-8.5-7.5-6.5-5.5-4.5-3.5-2.5-1.5-0.50.51.5
-70 -60 -50 -40 -30 -20 -10 0 10 20 30 40 50 60 70 80 90 100 110 120
Dep
th re
lativ
e to
exi
stin
g se
abed
leve
l (m
)
Distance from centre-line of cylinder (m)
Cylin
der
Scour extent 11o Scour extent 25o
18
4.3.2 The results from the analysis for scour under currents alone for the 40 m diameter GBF and the 58 m diameter GBF have some uncertainty due to the question of what is the actual height of the structure that should be used in the equation. Therefore, the calculations have been undertaken with the height of the upstand of the base and then the full height of the structure to the mean water level. From the analysis, the maximum predicted scour depth for the 40 m diameter GBF is between 0.4 m to 1.9 m. For the 58 m GBF design the maximum predicted scour depth is 1.2 m to 2.9 m.
4.3.3 However, in reality, the GBFs are likely to be installed in clay or layered soils, for example, sand overlying clay. It is considered that the analysis undertaken can be considered conservative as the calculations assume granular soil.
4.3.4 Khalfin (1991) also proposed a relationship for local scour around gravity base foundations due to wave action. The equation proposed has a small range of validity and for the present study is outside the given range of application. However, as a possible inference of wave effect, Khalfin’s approach would result in scour depths between 1.7 m and 3.5 m for the 40 m diameter GBF under waves, whilst giving 5.4 m to 9.2 m scour for the 58 m diameter structure. This may suggest that waves may have a greater impact on scour development at the larger GBF compared to currents alone. However, as the approach is outside its given application range and also given that even if the approach was valid the results are accurate to +30% (i.e., the method may over predict) then wave and currents may induce a similar magnitude of scour development at these structure types.
Scour Extents
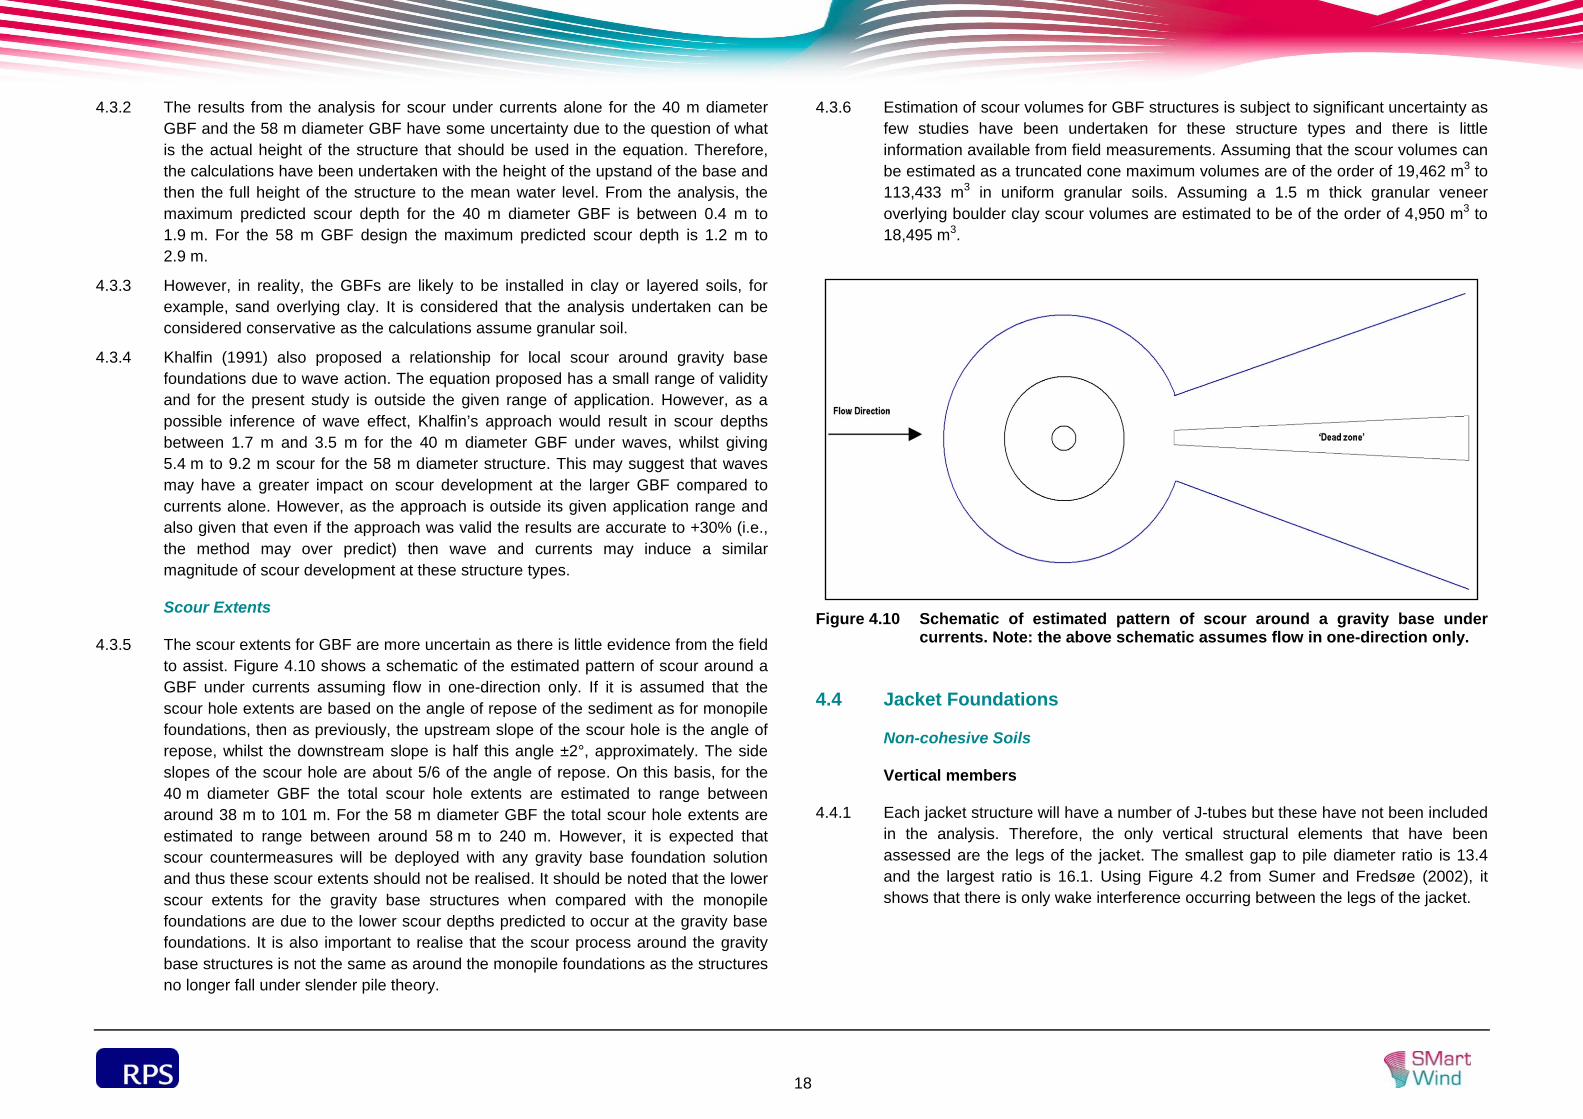
4.3.5 The scour extents for GBF are more uncertain as there is little evidence from the field to assist. Figure 4.10 shows a schematic of the estimated pattern of scour around a GBF under currents assuming flow in one-direction only. If it is assumed that the scour hole extents are based on the angle of repose of the sediment as for monopile foundations, then as previously, the upstream slope of the scour hole is the angle of repose, whilst the downstream slope is half this angle ±2°, approximately. The side slopes of the scour hole are about 5/6 of the angle of repose. On this basis, for the 40 m diameter GBF the total scour hole extents are estimated to range between around 38 m to 101 m. For the 58 m diameter GBF the total scour hole extents are estimated to range between around 58 m to 240 m. However, it is expected that scour countermeasures will be deployed with any gravity base foundation solution and thus these scour extents should not be realised. It should be noted that the lower scour extents for the gravity base structures when compared with the monopile foundations are due to the lower scour depths predicted to occur at the gravity base foundations. It is also important to realise that the scour process around the gravity base structures is not the same as around the monopile foundations as the structures no longer fall under slender pile theory.
4.3.6 Estimation of scour volumes for GBF structures is subject to significant uncertainty as few studies have been undertaken for these structure types and there is little information available from field measurements. Assuming that the scour volumes can be estimated as a truncated cone maximum volumes are of the order of 19,462 m3 to 113,433 m3 in uniform granular soils. Assuming a 1.5 m thick granular veneer overlying boulder clay scour volumes are estimated to be of the order of 4,950 m3 to 18,495 m3.
Figure 4.10 Schematic of estimated pattern of scour around a gravity base under
currents. Note: the above schematic assumes flow in one-direction only.
4.4 Jacket Foundations
Non-cohesive Soils
Vertical members
4.4.1 Each jacket structure will have a number of J-tubes but these have not been included in the analysis. Therefore, the only vertical structural elements that have been assessed are the legs of the jacket. The smallest gap to pile diameter ratio is 13.4 and the largest ratio is 16.1. Using Figure 4.2 from Sumer and Fredsøe (2002), it shows that there is only wake interference occurring between the legs of the jacket.

19
4.4.2 Table 4.3 presents the results of the scour assessment for the selected representative WTG positions assuming non-cohesive soil conditions with an unlimited depth for minimum and maximum jacket design options. There may be some minor enhancement to scouring due to wake interaction between the individual jacket legs when they are in tandem, of the order of 1.01 to 1.02 times the scour depth. There may also be a reduction in scour depth at the rear pile, although this should be viewed with caution due to the reversing nature of the tidal currents.
4.4.3 Table 4.4 presents the results of the scour assessment for combined wave current flows around an individual jacket leg. As previously, the analysis assumes non-cohesive soil conditions in an unlimited depth of soil for minimum and maximum jacket design options. The scour development due to waves is of a similar order of magnitude to that generated by the currents. In addition, scour development to equilibrium conditions under waves can occur rapidly, in the matter of minutes.
4.4.4 It should also be noted that once scouring occurs at the base of a leg, then where multiple sleeved piles have been used to fix the jacket to the seabed then scouring will become a function of both the jacket leg, the pile cap or footing and the pile group.
Table 4.3 Maximum predicted equilibrium scour depths for jacket structure designs,
current only conditions.
Scour Predictor Method
(Smallest jacket
design)
Maximum Equilibrium scour depth (m)
Water depth (m)
27.7 30.0 32.2 32.68 35.0 37.2 40 42.3 44.5
Richardson and Davis (2001)
2.4 2.4 2.5 2.5 2.5 2.5 2.5 2.5 2.6
Breusers et al. (1977) [1.5 multiplier]
1.8 1.8 1.8 1.8 1.8 1.8 1.8 1.8 1.8
DNV (2011) [1.3 multiplier]
1.6 1.6 1.6 1.6 1.6 1.6 1.6 1.6 1.6
Sumer and Fredsøe [2.0 multiplier]
2.4 2.4 2.4 2.4 2.4 2.4 2.4 2.4 2.4
Scour Predictor Method (largest jacket
design)
Maximum Equilibrium scour depth (m)
Water depth (m)
27.7 30.0 32.2 32.68 35.0 37.2 40 42.3 44.5
Richardson and Davis (2001)
3.9 3.9 3.9 4.0 4.0 4.0 4.1 4.1 4.1
Breusers et al. (1977) [1.5 multiplier]
3.8 3.8 3.8 3.8 3.8 3.8 3.8 3.8 3.8
DNV (2011) [1.3 multiplier]
3.3 3.3 3.3 3.3 3.3 3.3 3.3 3.3 3.3
Sumer and Fredsøe [2.0 multiplier]
5.0 5.0 5.0 5.0 5.0 5.0 5.0 5.0 5.0
Table 4.4 Maximum predicted equilibrium scour depth under combined wave and
current conditions for jacket structures.
(smallest jacket
design)
Maximum Equilibrium scour depth (m)
Water depth (m)
27.7 30.0 32.2 32.68 35.0 37.2 40 42.3 44.5
1 in 1 year return 1.9 1.9 1.9 1.9 1.9 1.9 1.9 1.9 1.9
1 in 100 year return 2.0 2.0 2.0 2.0 2.0 2.0 2.0 2.0 2.0
(largest jacket
design)
Maximum Equilibrium scour depth (m)
Water depth (m)
27.7 30.0 32.2 32.68 35.0 37.2 40 42.3 44.5
1 in 1 year return 2.5 2.5 2.5 2.5 2.5 2.4 2.5 2.5 2.4
1 in 100 year return 2.8 2.8 2.8 2.8 2.8 2.8 2.8 2.8 2.8
20
Scour Hole Width – Vertical Members
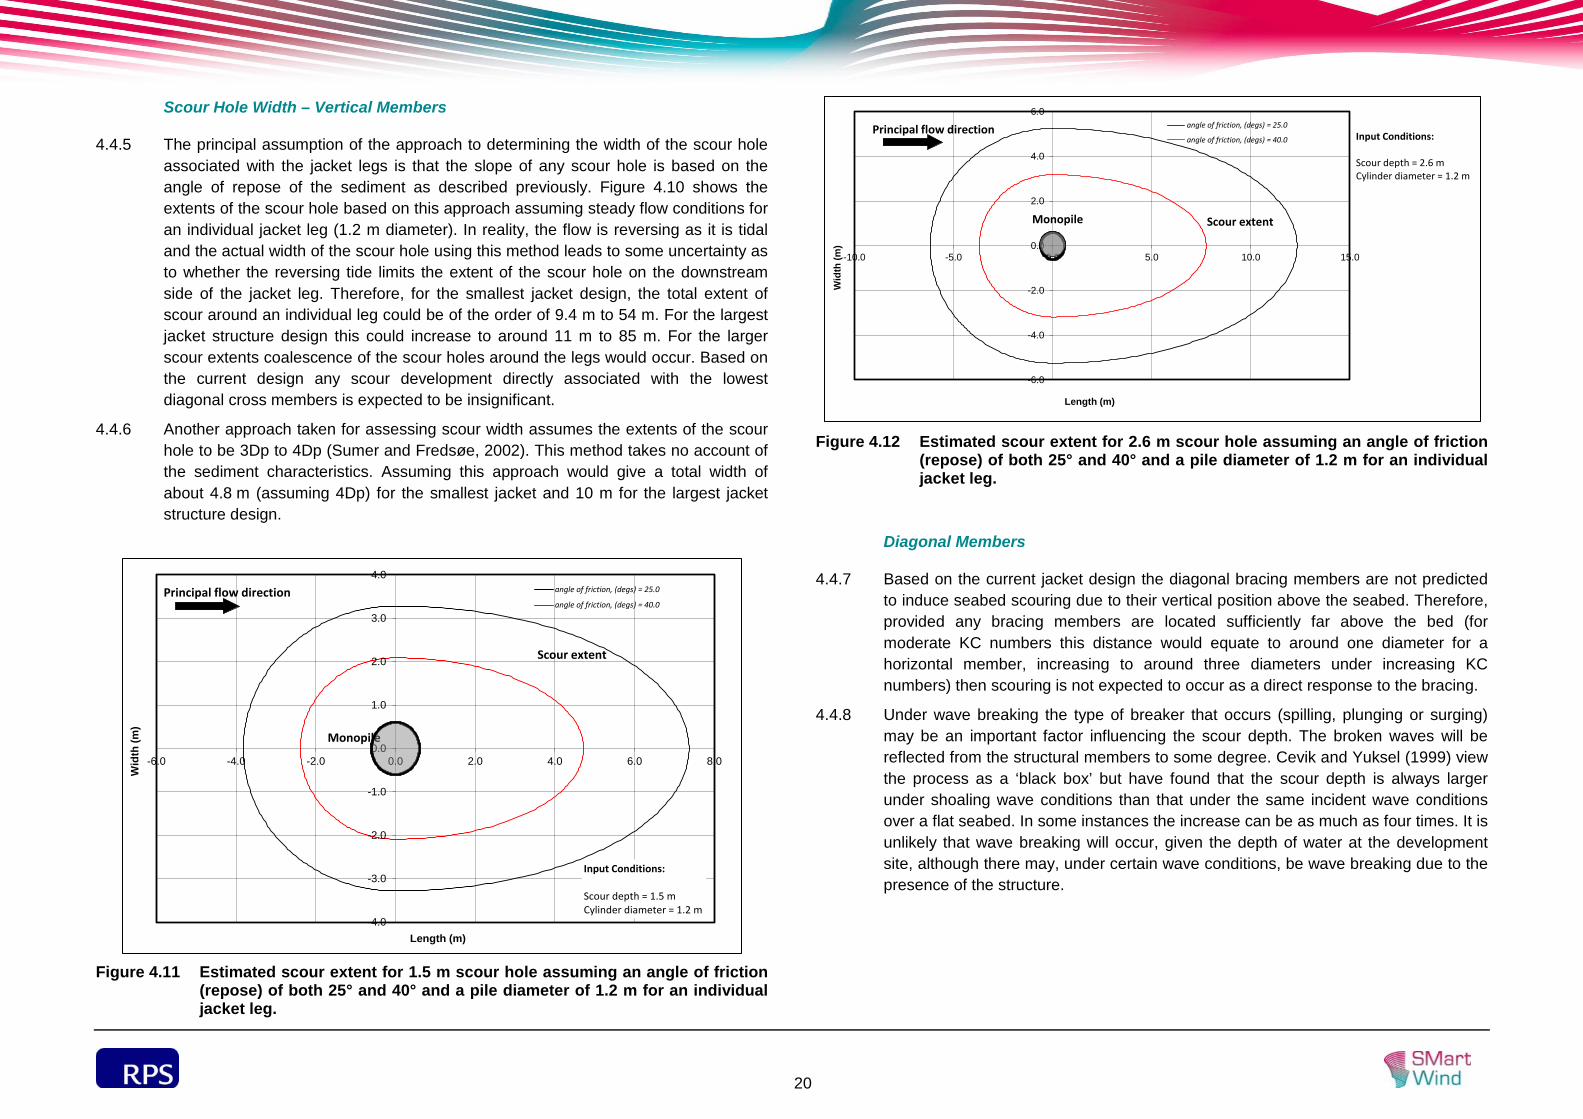
4.4.5 The principal assumption of the approach to determining the width of the scour hole associated with the jacket legs is that the slope of any scour hole is based on the angle of repose of the sediment as described previously. Figure 4.10 shows the extents of the scour hole based on this approach assuming steady flow conditions for an individual jacket leg (1.2 m diameter). In reality, the flow is reversing as it is tidal and the actual width of the scour hole using this method leads to some uncertainty as to whether the reversing tide limits the extent of the scour hole on the downstream side of the jacket leg. Therefore, for the smallest jacket design, the total extent of scour around an individual leg could be of the order of 9.4 m to 54 m. For the largest jacket structure design this could increase to around 11 m to 85 m. For the larger scour extents coalescence of the scour holes around the legs would occur. Based on the current design any scour development directly associated with the lowest diagonal cross members is expected to be insignificant.
4.4.6 Another approach taken for assessing scour width assumes the extents of the scour hole to be 3Dp to 4Dp (Sumer and Fredsøe, 2002). This method takes no account of the sediment characteristics. Assuming this approach would give a total width of about 4.8 m (assuming 4Dp) for the smallest jacket and 10 m for the largest jacket structure design.
Figure 4.11 Estimated scour extent for 1.5 m scour hole assuming an angle of friction
(repose) of both 25° and 40° and a pile diameter of 1.2 m for an individual jacket leg.
Figure 4.12 Estimated scour extent for 2.6 m scour hole assuming an angle of friction
(repose) of both 25° and 40° and a pile diameter of 1.2 m for an individual jacket leg.
Diagonal Members
4.4.7 Based on the current jacket design the diagonal bracing members are not predicted to induce seabed scouring due to their vertical position above the seabed. Therefore, provided any bracing members are located sufficiently far above the bed (for moderate KC numbers this distance would equate to around one diameter for a horizontal member, increasing to around three diameters under increasing KC numbers) then scouring is not expected to occur as a direct response to the bracing.
4.4.8 Under wave breaking the type of breaker that occurs (spilling, plunging or surging) may be an important factor influencing the scour depth. The broken waves will be reflected from the structural members to some degree. Cevik and Yuksel (1999) view the process as a ‘black box’ but have found that the scour depth is always larger under shoaling wave conditions than that under the same incident wave conditions over a flat seabed. In some instances the increase can be as much as four times. It is unlikely that wave breaking will occur, given the depth of water at the development site, although there may, under certain wave conditions, be wave breaking due to the presence of the structure.
-4.0
-3.0
-2.0
-1.0
0.0
1.0
2.0
3.0
4.0
-6.0 -4.0 -2.0 0.0 2.0 4.0 6.0 8.0
Wid
th (m
)
Length (m)
angle of friction, (degs) = 25.0
angle of friction, (degs) = 40.0Principal flow direction
Monopile
Scour extent
Input Conditions:
Scour depth = 1.5 mCylinder diameter = 1.2 m
-6.0
-4.0
-2.0
0.0
2.0
4.0
6.0
-10.0 -5.0 0.0 5.0 10.0 15.0
Wid
th (m
)
Length (m)
angle of friction, (degs) = 25.0
angle of friction, (degs) = 40.0Principal flow direction
Monopile Scour extent
Input Conditions:
Scour depth = 2.6 mCylinder diameter = 1.2 m
21
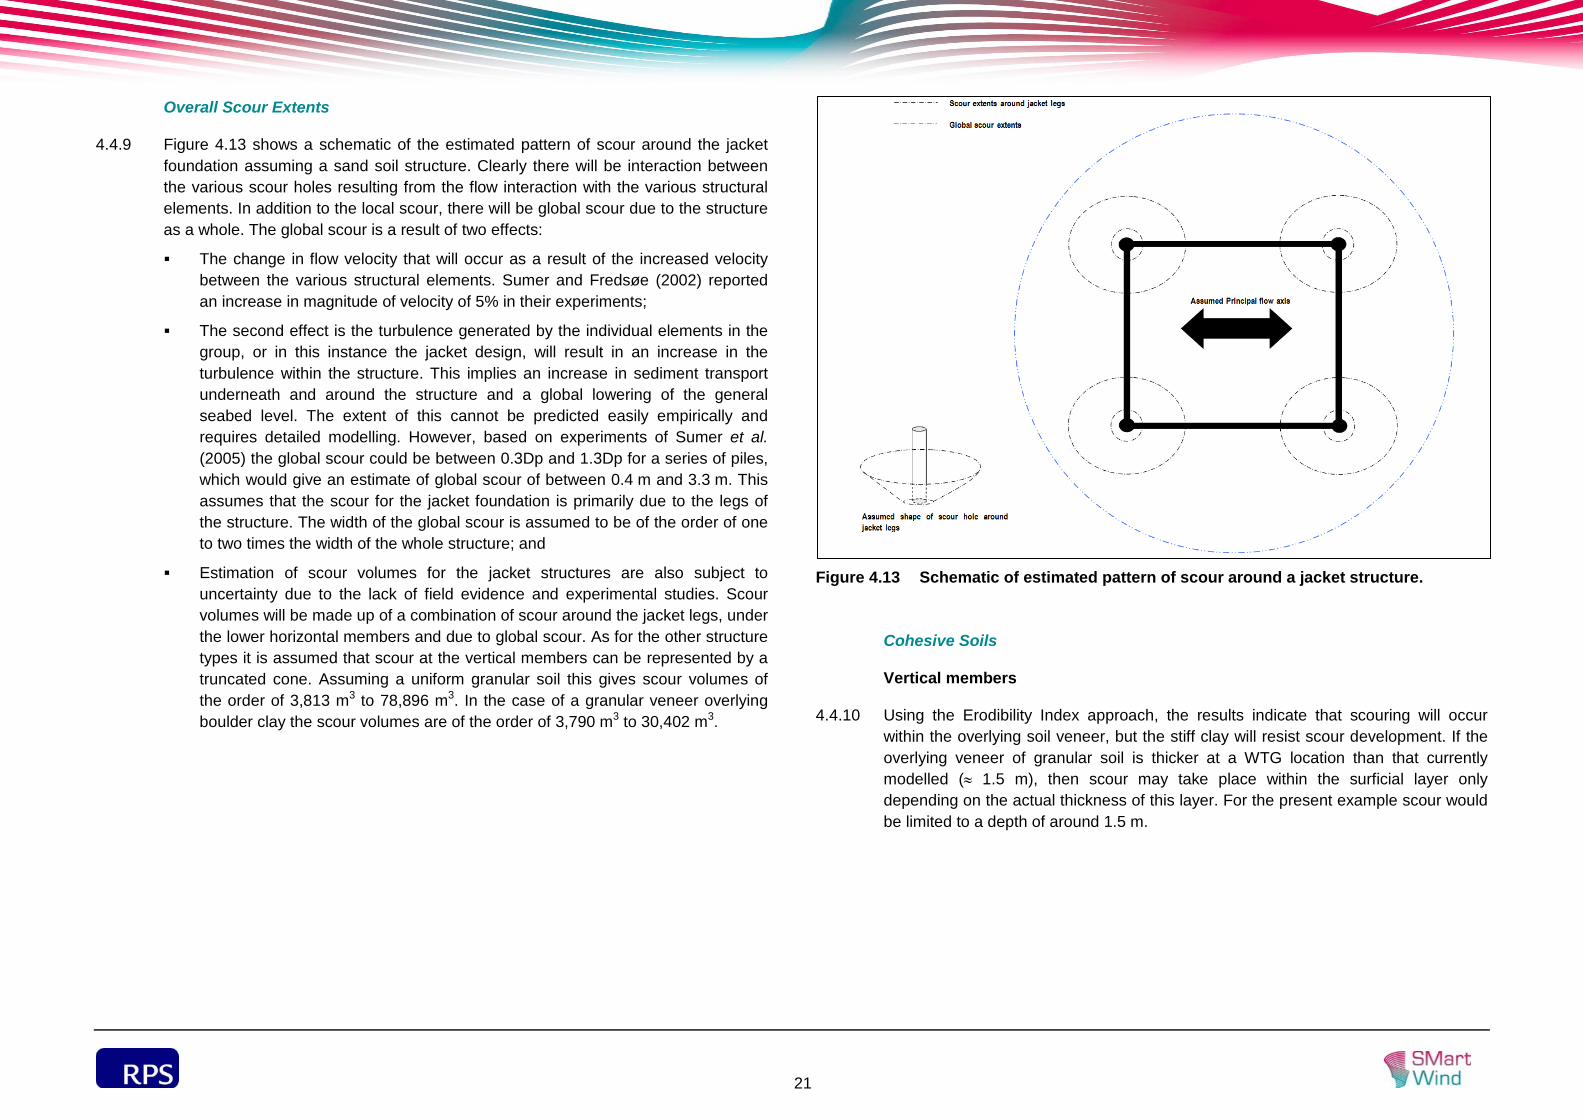
Overall Scour Extents
4.4.9 Figure 4.13 shows a schematic of the estimated pattern of scour around the jacket foundation assuming a sand soil structure. Clearly there will be interaction between the various scour holes resulting from the flow interaction with the various structural elements. In addition to the local scour, there will be global scour due to the structure as a whole. The global scour is a result of two effects:
The change in flow velocity that will occur as a result of the increased velocity between the various structural elements. Sumer and Fredsøe (2002) reported an increase in magnitude of velocity of 5% in their experiments;
The second effect is the turbulence generated by the individual elements in the group, or in this instance the jacket design, will result in an increase in the turbulence within the structure. This implies an increase in sediment transport underneath and around the structure and a global lowering of the general seabed level. The extent of this cannot be predicted easily empirically and requires detailed modelling. However, based on experiments of Sumer et al. (2005) the global scour could be between 0.3Dp and 1.3Dp for a series of piles, which would give an estimate of global scour of between 0.4 m and 3.3 m. This assumes that the scour for the jacket foundation is primarily due to the legs of the structure. The width of the global scour is assumed to be of the order of one to two times the width of the whole structure; and
Estimation of scour volumes for the jacket structures are also subject to uncertainty due to the lack of field evidence and experimental studies. Scour volumes will be made up of a combination of scour around the jacket legs, under the lower horizontal members and due to global scour. As for the other structure types it is assumed that scour at the vertical members can be represented by a truncated cone. Assuming a uniform granular soil this gives scour volumes of the order of 3,813 m3 to 78,896 m3. In the case of a granular veneer overlying boulder clay the scour volumes are of the order of 3,790 m3 to 30,402 m3.
Figure 4.13 Schematic of estimated pattern of scour around a jacket structure.
Cohesive Soils
Vertical members
4.4.10 Using the Erodibility Index approach, the results indicate that scouring will occur within the overlying soil veneer, but the stiff clay will resist scour development. If the overlying veneer of granular soil is thicker at a WTG location than that currently modelled (≈ 1.5 m), then scour may take place within the surficial layer only depending on the actual thickness of this layer. For the present example scour would be limited to a depth of around 1.5 m.
22
5 DISCUSSION
5.1.1 A first order scour assessment has been undertaken for the range of foundation options being considered for Project Two. The assessment of the gravity base and jacket structures is subject to greater uncertainty due to the general lack of proven methodologies for assessing scour for these more complex structure types.
5.1.2 For the monopile structures the assessment has been carried out using a number of suitable approaches and has considered both non-cohesive and layered soil conditions including the assessment of scour development in a cohesive sublayer.
5.1.3 The methods given in DNV (2011) are applicable to scour prediction in unlimited thickness of mobile sandy soil and do not include an allowance for the influence of complex soil properties on scour development and also assumed circular scour extents. The scour depth predictions using DNV would lie in the range of 0.1 pile diameters (lower end of wave dominated regime) to 1.3 pile diameters (current regime). Therefore, the approach as stated in DNV guidance would underpredict the scour occurring at sites with dynamic seabed conditions. However, it should be noted that the original studies upon which this guidance is based suggest that the scour depth for live-bed current scour conditions is S/D = 1.3 + σS/D where σS/D is 0.7 (Sumer and Fredsøe, 2002) and that for design purposes the maximum scour depth is S/D = 1.3 + 2σS/D at a confidence level of around 95%. This additional information has been omitted from the DNV document.
5.1.4 The estimates of scour extent are primarily based on a simplified assumption of scour hole shape and an assumed soil response. From monitoring of built offshore wind farms, the scour extents for foundation structures placed in morphologically dynamic tidal areas appear to be larger than would typically be estimated based on sediment angle of repose. Data suggests the angle of the steep inner portion of the scour hole is much lower than the angle of repose of the sediment and can be as low as about 10°. As the various sites where these elongated scour holes have been monitored have different seabed sediment characteristics such as grain size, it appears that the lower observed sediment angles are due more to the dynamic nature of the site rather than being related to a specific sediment type (Harris et al. 2011). Further research is required before a better understanding of the behaviour of scour hole extents and the lags in the scour response to a change in flow direction with reversing tides, storm surge currents and waves is achieved.
5.1.5 Existing methods given in guidance documents such as Det Norske Veritas (DNV) (2011) are applicable to scour prediction in an unlimited thickness of mobile sandy soil but do not include an allowance for the influence of complex soil properties on scour development. In soils consisting of sand, silt and clay mixtures cohesive forces may act to inhibit scour development both with respect to depth and extent compared with the mobile sand bed case. However, there are few detailed measurements from field sites where these types of soil exist on the seabed, which is hindering development of better techniques to predict scour development in these soil types.
5.1.6 Recent studies by Harris et al. (2010a) suggest that the scour depth can vary significantly under combined current and wave conditions through time. Data from monitoring programmes at offshore wind farm sites in the UK, of scour development at monopile foundations from the date of installation, suggest that the time-scale to achieve equilibrium conditions can be of the order of 60 days in environments where mobile seabeds exist (Harris et al., 2011). These values account for tidal variations as well as the effect on scour development of waves combined with the tidal flows. Under waves or combined waves and currents an equilibrium scour depth for the conditions existing at that time can be achieved in a matter of minutes, whilst typically under tidal flows alone equilibrium scour conditions may take days, weeks or months to develop. In cohesive soils it is not possible to predict time-scale without measuring the erosion rate of the soil and how it varies with depth at a given site.
5.1.7 The predicted scour potential based on the assumption that the seabed can be described by non-cohesive soil should be viewed as the worse-case scenario and, therefore, represents an upper band of scour potential. Where the seabed consists primarily of a veneer of granular material overlying a clay substrate the uniform granular soil predictions may be considered to be a conservative estimate. How conservative an estimate will be dependent on the thickness of both the veneer and the underlying clay substrate as well as the strength of the clay material. What is more difficult to estimate is the scour potential within the clay soil.
5.1.8 The modified erodibility index method (Harris et al., 2010b) uses both information on the soil mass properties and structure as well as the stream power, P, supplied by the wave and current action to determine whether erosion is likely to occur or not. If P exceeds the erosion threshold of the soil strata then scouring will occur. However, this method cannot provide information on the time-scale of the scouring process and the selection of a stream power value that is representative of the tidal and wave conditions is not a clearly defined process.
23
5.1.9 In more complex soils, predicting the scour extents is far more difficult. Existing methods given in guidance documents such as DNV (2011) are applicable to scour prediction in an unlimited thickness of mobile sandy soil but do not include an allowance for the influence of complex soil properties on scour development. In complex soils the limiting effects of mixtures of sand, silt and clay and layered sediments should in principle act to limit the scour depth that develops compared with the mobile sand bed case and, therefore, limit the extents. In addition, in clay soils it is possible to maintain steeper side slopes and this will also influence scour hole development.
5.1.10 Physical modelling experiments conducted at HR Wallingford for a structure placed in sand with a non-erodible sediment layer located at half the depth of scour depth obtained from unconstrained sediment tests showed that the scour extents upstream of the foundation were reduced by about half. However, the lateral and downstream extents of the scour remained unchanged from those obtained in the unconstrained sediment tests. Therefore, the results suggest that the lateral and downstream extents are more controlled by the flow acceleration and eddy shedding from the structure. In reversing tidal flows it could be reasonably expected that both the “upstream” and “downstream” extents show a similar response, except for cases where there is a marked asymmetry in the tidal current.
5.1.11 The gravity base foundation options have been assessed using the approach proposed by Khalfin (1983). However, it should be noted that the use of conical shaped gravity base foundations may result in increased wave – structure interaction including wave breaking. Physical modelling tests conducted at HR Wallingford in 2003 (see Whitehouse, 2004) indicated that scour may form faster around conical type GBFs. The experiments conducted also showed that during the passage of the wave troughs there was also large draw down at the front of the structure facing into the incident wave direction with vortices created at the lee of the structure. For the shallow water depths the large (58 m diameter) GBF will have part of the sloping face of the structure exposed at mean water level or lower and given the size of the structure this may induce wave breaking under certain conditions.
5.1.12 The gravity base design for Thornton Bank is similar to that being proposed at Project Two. In the case of Thornton Bank (Bolle et al., 2009; Whitehouse et al., 2011) scour test results were less severe than those reported by Whitehouse (2004). However, the foundations were different in design, with that modelled for Thornton Bank having a 17 m diameter flat bottom placed about 3 m below the seabed level, whereas Whitehouse (2004) modelled a deep skirted conical caisson. In addition, in the Thornton Bank tests the natural seabed sediment had been replaced with a filter material around the foundation and was in deeper water than in the tests undertaken by Whitehouse.
5.1.13 For the jacket structures scour development will be related to both the vertical structural members and additional elements such as J-tubes or I-tubes as well as the cross-bracing structural members. Assuming a single layer non-cohesive soil, scour development is predicted to be greatest for the largest jacket structure. However, applying the Erodibility Index method indicates that the scour development will be inhibited by the clay sublayer. It should also be noted that once scouring occurs at the base of a leg, then where multiple sleeved piles have been used to fix the jacket to the seabed then scouring will be a function of both the jacket leg, the pile cap or footing and the pile group.
5.1.14 Based on the proposed jacket design scouring directly associated with the bracing is not predicted to occur due to their vertical position above the seabed.
5.1.15 Whilst it is proposed to bury both the inter-array and export cables, for the purposes of the EIA it has been assumed that a worst case scenario of rock placement cable protection will be utilised along 25% of the export cable route and 26% of the inter-array cable route. If cable protection is required within the overlap of the Humber Estuary SAC and the cable route, frond mattressing will be used exclusively. In addition, protection may be required to provide protection to the exposed parts of the cables as they pass from being buried into the seabed, through the scour hole around the foundation and into the J- or I-tube.
5.1.16 It is assumed that any scour protection is installed correctly and thus will have an insignificant impact on marine processes. To ensure this is the case, at the time of installation the following factors need to be considered with respect to transition of the cable from being buried into the seabed to where it enters the J- or I-tube fixed to the transition piece on the foundation:
The vertical position of the end of the I-tube;
The finished level of the rock protection;
The thickness of the rock protection below the finished level, governed by the scour hole depth at time of installation;
The lateral extent of the rock protection, governed by the scour hole extent along the cable run from the I-tube at the time of installation; and
The depth of burial of the cable at the edge of the scour hole.
5.1.17 The grading of the rock needs to be considered with respect to stability against design loadings, the need for filter layers to prevent seabed material from washing through the rock, the thickness of the rock layer(s) and the horizontal dimensions.
24
6 CONCLUSIONS
6.1.1 A desk based scour assessment has been carried out for twelve representative WTG locations. The seabed soil conditions across the site are variable and their effect on inhibiting scour development remains a matter of uncertainty. This section summarises the conclusions from the scour assessment for the various foundation options. From the analysis the following key points have been made:
Monopile option:
6.1.2 From the scour assessment assuming a non-cohesive granular soil substrate (worst case – used as a comparative value) the following conclusions can be drawn:
Using the Richardson and Davis (2001) approach the predicted scour depth will vary between 7.7 m and 8.3 m for the 7.3 m diameter monopile and 9.5 m to 10.1 m for the 10 m diameter monopile;
Under wave only conditions the scour development is predicted to be negligible.
Under combined wave current conditions the scour development for a 7.3 m diameter monopile is predicted to be between 2.5 m and 3.3 m. For an 10 m diameter monopile the predicted maximum scour depth is between 1.8 m and 3.0 m; and
Estimates of scour extent suggest that for a 10 m diameter monopile the total scour extents from between around 20 m to 214 m, depending on the angle of repose of the sediment. The coalescence of individual scour holes is not considered to be an issue given the proposed separation distance between foundation structures.
6.1.3 The predicted scour potential based on the assumption that the seabed can be described by non-cohesive soil should be viewed as the worse-case scenario and, therefore, represents an upper band of scour potential. Where the seabed consists primarily of a veneer of granular material overlying a clay substrate the uniform granular soil predictions may be considered to be a conservative estimate. How conservative an estimate will be dependent on the thickness of both the veneer and the underlying clay substrate as well as the strength of the clay material. Therefore, from the scour assessment assuming a clay soil sublayer the following conclusions can be drawn:
The results obtained from applying the Erodibility Index method show that scouring will occur within the overlying soil veneer, but the stiff clay will resist scour development. For the CPT information used in the assessment the scour development is shown to be limited to around 1.5 m. However, if the surficial granular veneer is thicker, then the scour depth will increase.
Gravity base option:
6.1.4 Present theoretical methods are limited and little information is available for scouring around GBF structures at field scale. From the assessment carried out:
From the analysis, the maximum predicted scour depth under currents alone for the 40 m diameter GBF is between 0.4 m to 1.9 m. For the 58 m GBF design the maximum predicted scour depth is 1.2 m to 2.9 m;
A tentative assessment of scour due to waves has been conducted also. The approach predicts scour depths of between 1.7 m and 3.5 m for the 40 m diameter GBF under waves, whilst giving 5.4 m to 9.2 m scour for the 58 m diameter structure. However, it should be noted that the approach is outside its given application range and also even if the approach was valid the results are accurate to +30% (i.e., the method may over predict);
It should be noted that the use of conical shaped gravity base foundations may result in increased wave – structure interaction including wave breaking. Physical modelling tests conducted at HR Wallingford in 2003 (see Whitehouse, 2004) indicated that scour may form faster around conical type GBFs;
If it is assumed that the scour hole extents are based on the angle of repose of the sediment as for monopile foundations, then for the 40 m diameter GBF the total scour hole extents are estimated to range between 38 m to 101 m. For the 58 m diameter GBF the total scour hole extents are estimated to range between 58 m to 240 m. However, it is expected that scour countermeasures will be deployed with any gravity base foundation solution and thus these scour extents should not be realised; and
Scour in a veneer of granular soil overlying clay needs to be evaluated on a case-by-case basis to identify the risk. Based on the Erodibility index approach used in the analysis of the monopile foundation options scour will be limited by the clay sublayer. In addition, within the design basis it is assumed that seabed preparation will be carried out; therefore, the gravity base structures are likely to be founded within the clay sublayer.
25
Jacket foundation options:
6.1.5 For the jacket structures scour development will be related to both the vertical structural members and additional elements such as J-tubes or I-tubes as well as the horizontal structural members. There is currently no single method for assessing scouring around structures of this type. Therefore, to enable an assessment of the scour potential of the jacket structures to be undertaken it has been assumed that the structure can be modelled as individual elements and group effects included within this analysis. From the analysis undertaken for non-cohesive soil, the key results are:
Scouring will occur around the jacket structures. Scouring around the jacket legs under currents will be of the order of 2.4 m to 4.1 m in depth, whilst no scouring is predicted for the cross-bracing;
Although scouring is generally dominated by the tidal currents at the wind farm site, for the jacket foundations the scour development due to waves is of a similar order of magnitude to that generated by the currents. In addition, scour development to equilibrium conditions under waves can occur rapidly, in a matter of minutes (this is based upon the empirical formulae of Sumer and Fredsøe, 2002 derived from small scale physical model tests); and
Global scour associated with the jacket structure as a whole could be of the order of 0.3 m – 3.9 m and could extend to 1.5 to 2 times the total jacket plan footprint.
6.1.6 As for the monopile foundation options, scouring in a non-cohesive granular soil is the worst case scenario and in the present case is considered to be overly conservative. Therefore:
Using the Erodibility Index approach, the results indicate that scouring will occur within the overlying soil veneer, but the clay sublayer will resist scour development.
6.1.7 Given the general uncertainty with predicting scour around jacket foundation structures and the likelihood that scour countermeasures may not be placed initially, recommendations have been made for a series of procedures that could be adopted to manage this risk and uncertainty.
6.1.8 It should also be noted that the cable connections into the various foundation structure options represents one of the main areas of risk with respect to scour. In the case of jacket foundations, whilst the J-tubes or I-tubes attached to the jacket represent a blockage effect on the flow and thus a potential impact on scouring around the foundation, it is considered that the most significant effect on scour potential will be due to flow interaction with the cabling where it passes from the seabed to the WTG foundation.
26
REFERENCES
Annandale, G.W. (1995). Erodibility. J. of Hydraulic Research, 33 (4), 471-494.
Annandale, G.W. (2006). Scour Technology. Mechanics and Engineering Practice. McGraw-Hill.
Bolle, A., Haerens, P., Trouw, K., Smits, J. and Dewaele, G. (2009). Scour around gravity-based wind turbine foundations – prototype measurements. In: Coasts, Marine Structures and Breakwaters. Adapting to Change. Ed. Allsop, W., Thomas Telford Books, London, pp. 103-118.
Breusers, H.N.C, Nicollet, G. and Shen, H.W. (1977). Local scour around cylindrical piers. J. of Hydraulic Res., IAHR, Vol 15, No. 3, pp. 211-252.
Breusers, H.N.C. and Raudkivi, A.J. (1991). Scouring. IAHR Hydraulic structures design manual (2), A.A.Balkema, Rotterdam, 143pp.
Briaud, J-L., Ting, F., Chen, H.C., Gudavalli, S.R., Perugu, S., and Wei, G. (1999). SRICOS: Prediction of scour rate in cohesive soils at bridge piers. J. Geotechnical Engng., ASCE, Vol. 125, pp. 237-246.
Cevik, E. and Yuksel, Y. (1999). Scour under submarine pipelines in waves in shoaling conditions. J. Hydr. Engng., ASCE, Vol. 125, No. 1, pp. 1 – 11.
Cooper, W.S., Townend, I.H., and Balson, P.S. (2008). A synthesis of current knowledge on the genesis of the Great Yarmouth and Norfolk Bank Systems. The Crown Estate, 69 pp, February. ISBN: 978-0-9553427-8-3.
Det Norske Veritas (2011). Design of Offshore Wind Turbine Structures. Offshore Standard DNV-OS-J101, September, 142pp.
Eadie, R.W. and Herbich, J.B. (1986). Scour about a single, cylindrical pile due to combined random waves and currents. Proc. 20th International Conference on Coastal Engineering, ASCE, Nov 9-14, pp. 1858-1870.
Escarameia, M. and May, R.W.P. (1999). Scour around structures in tidal flow. Report SR 521, HR Wallingford, 30pp (+ tables, figures and plates).
FHWA (1999). Effects of gradation and cohesion on bridge scour, Vol. 4. Experimental study of scour around circular piers in cohesive soils. US Dept. of Transportation, Federal Highway Administration, Pub. No. FHWA-RD-99-186, December, 177pp.
FHWA (2003). Bridge scour in non-uniform sediment mixtures and in cohesive materials: Synthesis report. US Dept. of Transportation, Federal Highway Administration, Pub. No. FHWA-RD-03-083, June, 113pp.
Germanischer Lloyd (2005). Guidelines for the Certification of Offshore Wind Turbines. Edition 2005.
Gormsen, C. and Larsen, T. (1984). Time development of scour around offshore structures. ISVA, Technical University of Denmark, 139pp. (In Danish).
Hansen, E.A., Fredsøe, J. and Mao, Ye (1986). Two dimensional scour below pipelines. Proc. 5th International Symp. on Offshore Mechanics and Arctic Engng., ASME, Tokyo, Japan, Vol. 3, pp. 670 – 678.
Harris, J.M., Whitehouse, R.J.S. and Sutherland, J. (2010a). Scour assessment in complex marine soils – an evaluation through case examples. In: Proc. of the fifth International Conf. on Scour and Erosion, (eds.) Burns, S.E., Bhatia, S.K., Avila, C.M.C. and Hunt, B.E., Nov. 7 – 10, San Francisco, California, USA, Geotechnical Special Publication no. 210, ASCE, pp. 450 – 459.
Harris, J.M., Whitehouse, R.J.S. and Benson, T. (2010b). The time evolution of scour around offshore structures. Proceedings of the Institution of Civil Engineers, Maritime Engineering, 163, March, Issue MA1, pp. 3 – 17.
Harris, J.M., Whitehouse, R.J.S. and Sutherland, J. (2011). Marine scour and offshore wind - lessons learnt and future challenges. Proceedings of the ASME 2011 30th International Conference on Ocean, Offshore and Arctic Engineering, OMAE2011, June 19-24, 2011, Rotterdam, The Netherlands, OMAE2011-50117.
Herbich, J.B. (1981). Offshore Pipeline Design Elements. Marcell Dekker Inc., New York, xvi + 233pp.
Herbich, J.B., Schiller, R.E., Watanabe, R.K. and Dunlap, W.A. (1984). Seafloor Scour: Design Guidelines for Ocean-founded Structures. Marcel Dekker Inc., New York, xiv + 320pp.
Hoffmans, G.J.C.M. and Verheij, H.J. (1997). Scour Manual. Balkema.
HR Wallingford, Cefas/UEA, Posford Haskoning and D’Olier, B (2002). Southern North Sea Sediment Transport Study Phase 2, Sediment Transport Report. Report produced for Great Yarmouth Borough Council, HR Wallingford Report EX4526, August.
Jensen, M.S. (2006). Prediction of scour – recommendations. In: Offshore Wind Turbines Situated in Areas with Strong Currents, Unpublished Conf. Proc., Offshore Centre Denmark, Feb. 9.
Khalfin, I.S. (1983). Local scour around ice-resistant structures caused by wave and current effect. Proc. 7th Int. Conf. on Port and Ocean Engineering under Arctic Conditions (POAC-83). Technical Research Centre of Finland Helsinki, Vol. 2, pp. 992 – 1002.
Khalfin, I.S. (1991). Local scour depth of sand bottom around gravitational ice-resistant structures caused by waves. Proc. 1st Int. Offshore and Polar Engng. Conf., Edinburgh, UK, 11 – 16 August, pp.505 – 509.
Kirsten, H.A.D. (1982). A classification system for excavation in natural materials. The Civil Engineer in South Africa, July, pp. 292 – 308.
May, R.W.P. and Willoughby, I.R. (1990). Local scour around large obstructions. Report SR 240, HR Wallingford, 29pp (+tables and figures).
27
Melville, B.W. and Coleman, S.E. (2000). Bridge Scour. Water Resources Publications, LLC, Colorado, USA, 550 pp.
Pluim-van der Velden, E.T.J.M. and Bijker, E.W. (1992). Local scour near submarine pipelines on a cohesive bottom. Behaviour of Offshore Structures (BOSS), Proc. 6th International Conf., Supplement, 7-10 July, Imperial College of Science, Technology and Medicine London.
Raudkivi, A.J. and Ettema, R. (1977a). Effect of sediment gradation on clear-water scour and measurement of scour depth. Proc.17th Congress IAHR, Baden-Baden, 4, pp 512 – 527.
Raudkivi, A.J. and Ettema, R. (1977b). Effect of sediment gradation on clear-water scour. J of Hydr. Division, ASCE, Vol. 103, No HY10, Oct., pp 1209 – 1213.
Richardson, E.V. and Davis, S.R. (2001). Evaluating Scour at Bridges. Hydr. Engng. Circular No. 18, US Department of Transport, Federal Highway Administration, Pub. No. FHWA NHI 01-001.
Soulsby, R.L. (1997). Dynamics of marine sands. A manual for Practical Applications. Thomas Telford, London. 249 pp.
Sumer, B.M., Bundgaard, K. and Fredsøe, J. (2005). Global and local scour at pile groups. Int. J. of Offshore and Polar Engng., ISOPE, Vol. 15, No. 3, Sept., pp. 204 – 209.
Sumer, B.M. and Fredsøe, J. (2001). Scour around a pile in combined waves and currents. J. Hydraulic Engineering, ASCE, 127 (5), pp. 403-411.
Sumer, B.M. and Fredsøe, J. (2002). The mechanics of scour in the marine environment. Advanced series in Ocean Engineering – Volume 17.
Sumer, B.M., Christiansen, N. and Fredsøe, J. (1992a). Time scale of scour around a vertical pile. Proc. 2nd Int. Offshore and Polar Engng. Conf., ISOPE, San Francisco, USA, Vol. 3, pp. 308 – 315.
Sumer, B.M., Fredsøe, J. and Christiansen, N. (1992b). Scour around a vertical pile in waves. J. Waterway, Port, Coastal, and Ocean Engng. ASCE, Vol. 118, No. 1, pp. 15 – 31.
Wang, R.K. and Herbich, J. (1983). Combined current and wave-produced scour around a single pile. COE Report No. 269, Dept. of Civil Engineering Texas, Engineering Experiment Station.
Whitehouse, R.J.S (1998). Scour at Marine Structures. Thomas Telford, London.
Whitehouse, R.J.S. (2004). Marine scour at large foundations. In: Proceedings of the Second International Conference on Scour and Erosion, Singapore, November 2004, eds. Chiew Y-M., Lim, S-Y. and Cheng, N-S. Pages 455-463. Stallion Press.
Whitehouse, R.J.S., Sutherland, J. and Harris, J.M. (2011). Evaluating scour at marine gravity structures. Proceedings of the Institution of Civil Engineers, Maritime Engineering, 164, December, Issue MA4, pp. 143 – 157.
Williamson, H.J. and Ockenden, M.C. (1996). ISIS – an instrument for measuring erosion stress in-situ. Estuarine, Coastal and Shelf Science, Vol. 42, 1-18.
Zdravkovich, M. (1987). The effects of interference between circular cylinders in cross flow. J. Fluids and Structures, Vol 1., pp. 239 – 261.