Embed Size (px)
Citation preview
The international standard for determininggreenhouse gas emissions for cities, presented at theJune 2009 Urban Research Symposium in Marseilleby Kennedy et al.8 and proposed by UNEP, UN-HABITAT, World Bank, recommends thatemissions are reported from four categories: energy(including emissions from electricity consumption,heating and industrial fuel use, ground transport,and aviation and marine transport); industrialprocesses and product use; agriculture, forestry, andother land use change (known as AFOLU); andwaste. Kennedy et al. also suggest reportingemissions embodied in fuel, water, food, andbuilding materials as additional items. Researchconducted by Hillman and Ramaswami9
demonstrated that including Scope 3 emissions ineight U.S. city case studies increase urbaninventories by an average of 45 percent. Thefollowing reported items are recommended:emissions produced in the geographical boundary ofthe city (Scope 1); emissions released outside thegeographical boundary of the city that enableenergy, including electricity and district heat, to beconsumed in the city (Scope 2); and emissions fromwaste, aviation, and marine transport, and embodiedin fuel, food, building materials, and water used inthe city (Scope 3).
Although data can be difficult to obtain, thereporting of upstream emissions provides the mostcomprehensive view of the urban system for decisionmakers. Upstream emissions may be used to informsystemic consequences of climate change actions.Some actions that reduce climate change in citiesmay increase emissions in rural areas; for example,exporting cement manufacturing to rural areasremoves emissions from cities but increasesemissions associated with transportation. Describedin Kennedy et al., Ramaswami’s Scope 3 analysis ofDenver10 led to the adoption of green concretepolicies, reducing upstream emissions in newconstruction projects. As cities create strategic plansfor mitigation, it is important to consider theseupstream impacts.
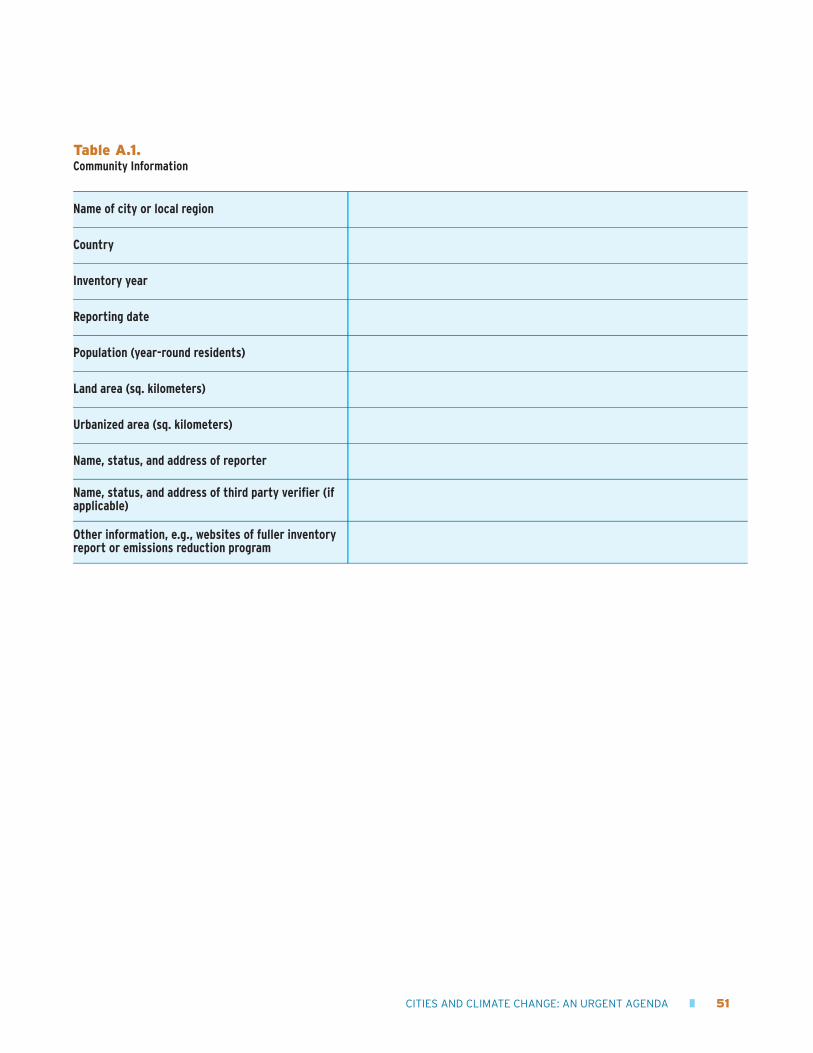
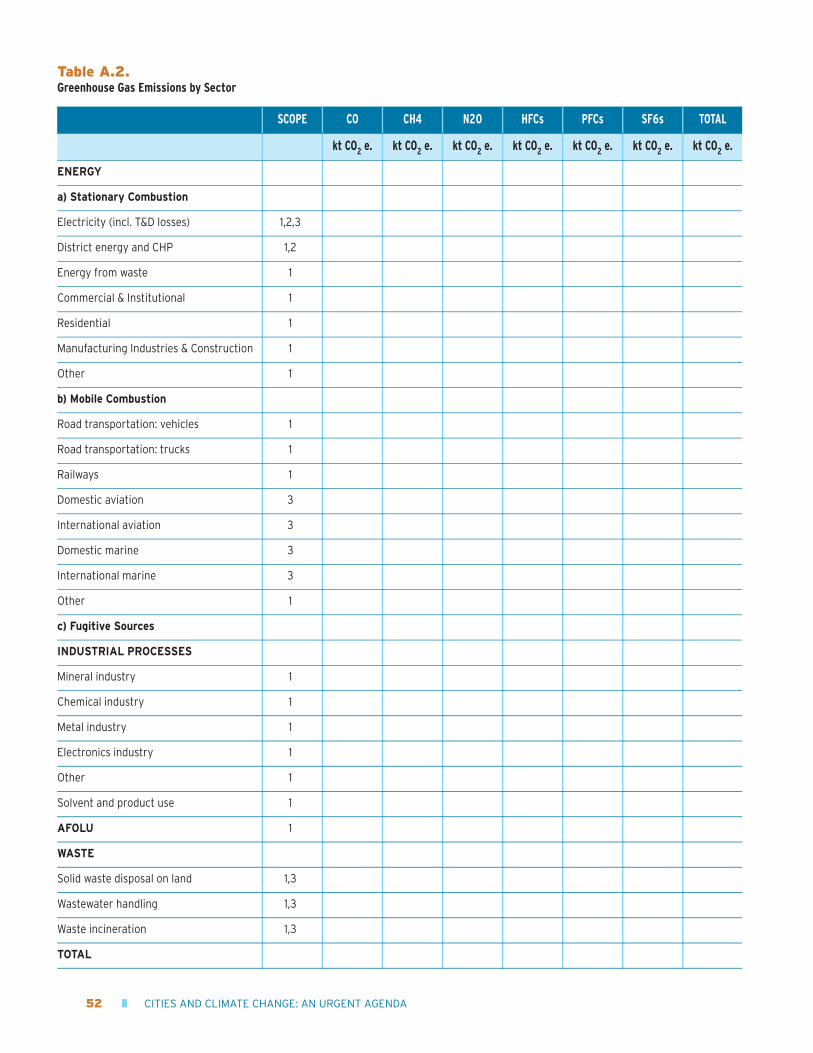
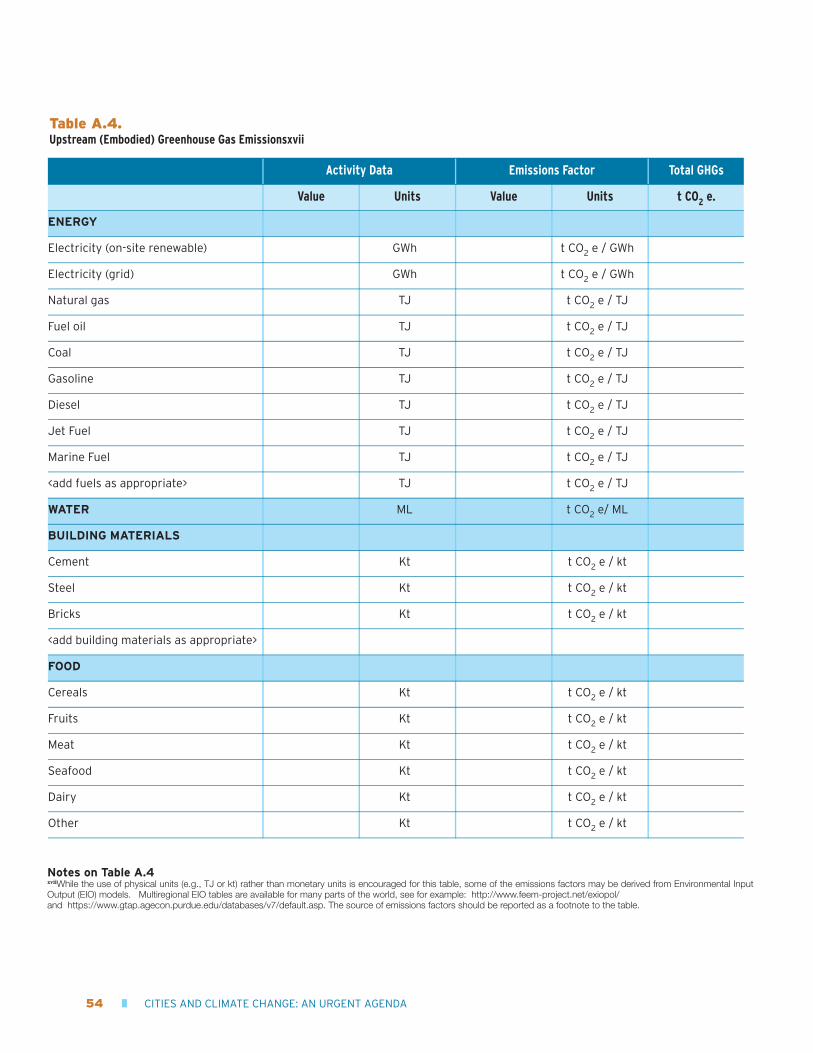
Four standardized tables provide a consistentreporting format for emissions: 1) communityinformation (Table A.1); 2) greenhouse gasemissions by sector (Table A.2); 3) greenhouse gasemissions by fuel or activity type (Table A.3); and 4)upstream (embodied) greenhouse gas emissions(Table A.4).
50 � CITIES AND CLIMATE CHANGE: AN URGENT AGENDA
ANNEX AInternational Standard for Measuring Greenhouse Gas Emissions Standard
8Kennedy C., A. Ramaswami, S. Carney, and S. Dhakal. 2009. “Greenhouse Gas Emission Baselines for Global Cities and Metropolitan Regions.”Proceedings of the 5th Urban Research Symposium Marseille, France: June 28-30, 2009.9Hillman, T. and A. Ramaswami. 2009. “Greenhouse Gas Footprints and Energy Use Benchmarks for Eight US Cities.” Env. Sci. & Tech. 44(6): 1902-10. 10Ramaswami, A., T. Hillman, B. Janson, M. Reiner, and G. Thomas. 2008. “A Demand-Centered, Hybrid Life-Cycle Methodology for City-ScaleGreenhouse Gas Inventories.” Env. Sci. & Tech. 42(17): 6455-61.
CITIES AND CLIMATE CHANGE: AN URGENT AGENDA � 51
Name of city or local region
Country
Inventory year
Reporting date
Population (year-round residents)
Land area (sq. kilometers)
Urbanized area (sq. kilometers)
Name, status, and address of reporter
Name, status, and address of third party verifier (ifapplicable)
Other information, e.g., websites of fuller inventoryreport or emissions reduction program
Table A.1.Community Information
52 � CITIES AND CLIMATE CHANGE: AN URGENT AGENDA
SCOPE CO CH4 N2O HFCs PFCs SF6s TOTAL
kt CO2 e. kt CO2 e. kt CO2 e. kt CO2 e. kt CO2 e. kt CO2 e. kt CO2 e.
ENERGY
a) Stationary Combustion
Electricity (incl. T&D losses) 1,2,3
District energy and CHP 1,2
Energy from waste 1
Commercial & Institutional 1
Residential 1
Manufacturing Industries & Construction 1
Other 1
b) Mobile Combustion
Road transportation: vehicles 1
Road transportation: trucks 1
Railways 1
Domestic aviation 3
International aviation 3
Domestic marine 3
International marine 3
Other 1
c) Fugitive Sources
INDUSTRIAL PROCESSES
Mineral industry 1
Chemical industry 1
Metal industry 1
Electronics industry 1
Other 1
Solvent and product use 1
AFOLU 1
WASTE
Solid waste disposal on land 1,3
Wastewater handling 1,3
Waste incineration 1,3
TOTAL
Table A.2.Greenhouse Gas Emissions by Sector
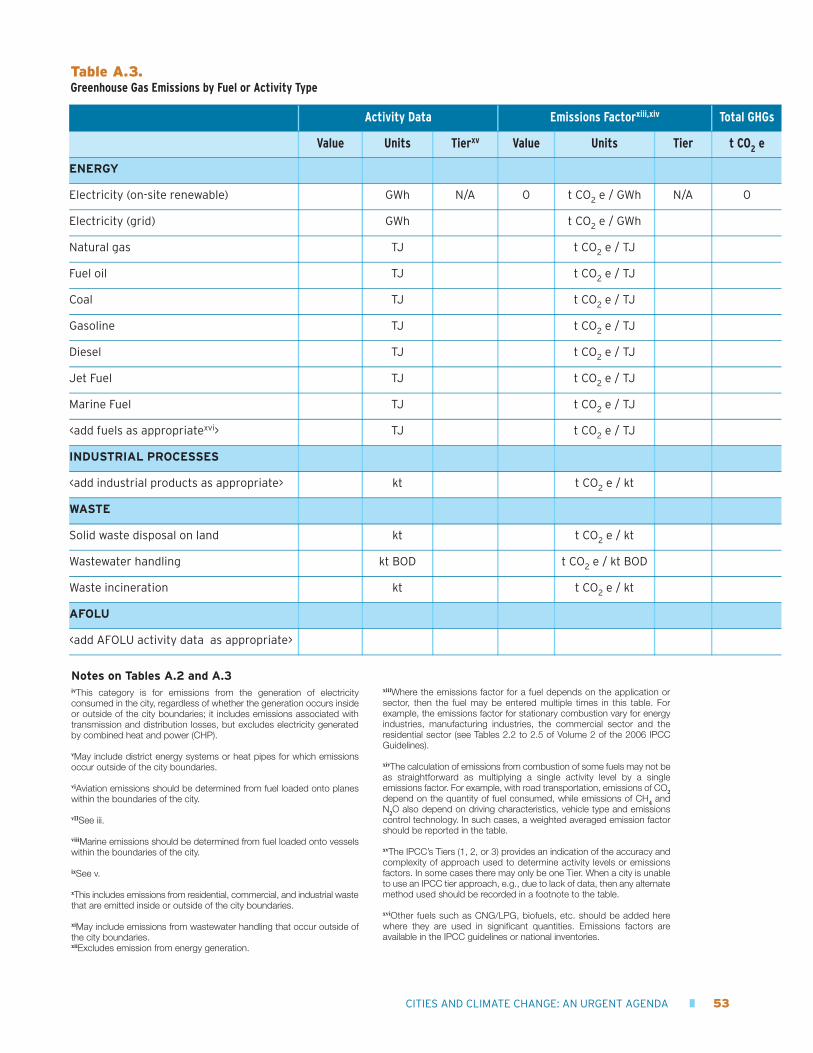
Notes on Tables A.2 and A.3ivThis category is for emissions from the generation of electricityconsumed in the city, regardless of whether the generation occurs insideor outside of the city boundaries; it includes emissions associated withtransmission and distribution losses, but excludes electricity generatedby combined heat and power (CHP).
vMay include district energy systems or heat pipes for which emissionsoccur outside of the city boundaries.
viAviation emissions should be determined from fuel loaded onto planeswithin the boundaries of the city.
vIISee iii.
viiiMarine emissions should be determined from fuel loaded onto vesselswithin the boundaries of the city.
ixSee v.
xThis includes emissions from residential, commercial, and industrial wastethat are emitted inside or outside of the city boundaries.
xiMay include emissions from wastewater handling that occur outside ofthe city boundaries.xiiExcludes emission from energy generation.
xiiiWhere the emissions factor for a fuel depends on the application orsector, then the fuel may be entered multiple times in this table. Forexample, the emissions factor for stationary combustion vary for energyindustries, manufacturing industries, the commercial sector and theresidential sector (see Tables 2.2 to 2.5 of Volume 2 of the 2006 IPCCGuidelines).
xivThe calculation of emissions from combustion of some fuels may not beas straightforward as multiplying a single activity level by a singleemissions factor. For example, with road transportation, emissions of CO2depend on the quantity of fuel consumed, while emissions of CH4 andN2O also depend on driving characteristics, vehicle type and emissionscontrol technology. In such cases, a weighted averaged emission factorshould be reported in the table.
xvThe IPCC’s Tiers (1, 2, or 3) provides an indication of the accuracy andcomplexity of approach used to determine activity levels or emissionsfactors. In some cases there may only be one Tier. When a city is unableto use an IPCC tier approach, e.g., due to lack of data, then any alternatemethod used should be recorded in a footnote to the table.
xviOther fuels such as CNG/LPG, biofuels, etc. should be added herewhere they are used in significant quantities. Emissions factors areavailable in the IPCC guidelines or national inventories.
CITIES AND CLIMATE CHANGE: AN URGENT AGENDA � 53
Table A.3.Greenhouse Gas Emissions by Fuel or Activity Type
Activity Data Emissions Factorxiii,xiv Total GHGs
Value Units Tierxv Value Units Tier t CO2 e
ENERGY
Electricity (on-site renewable) GWh N/A 0 t CO2 e / GWh N/A 0
Electricity (grid) GWh t CO2 e / GWh
Natural gas TJ t CO2 e / TJ
Fuel oil TJ t CO2 e / TJ
Coal TJ t CO2 e / TJ
Gasoline TJ t CO2 e / TJ
Diesel TJ t CO2 e / TJ
Jet Fuel TJ t CO2 e / TJ
Marine Fuel TJ t CO2 e / TJ
<add fuels as appropriatexvi> TJ t CO2 e / TJ
INDUSTRIAL PROCESSES
<add industrial products as appropriate> kt t CO2 e / kt
WASTE
Solid waste disposal on land kt t CO2 e / kt
Wastewater handling kt BOD t CO2 e / kt BOD
Waste incineration kt t CO2 e / kt
AFOLU
<add AFOLU activity data as appropriate>
54 � CITIES AND CLIMATE CHANGE: AN URGENT AGENDA
Activity Data Emissions Factor Total GHGs
Value Units Value Units t CO2 e.
ENERGY
Electricity (on-site renewable) GWh t CO2 e / GWh
Electricity (grid) GWh t CO2 e / GWh
Natural gas TJ t CO2 e / TJ
Fuel oil TJ t CO2 e / TJ
Coal TJ t CO2 e / TJ
Gasoline TJ t CO2 e / TJ
Diesel TJ t CO2 e / TJ
Jet Fuel TJ t CO2 e / TJ
Marine Fuel TJ t CO2 e / TJ
<add fuels as appropriate> TJ t CO2 e / TJ
WATER ML t CO2 e/ ML
BUILDING MATERIALS
Cement Kt t CO2 e / kt
Steel Kt t CO2 e / kt
Bricks Kt t CO2 e / kt
<add building materials as appropriate>
FOOD
Cereals Kt t CO2 e / kt
Fruits Kt t CO2 e / kt
Meat Kt t CO2 e / kt
Seafood Kt t CO2 e / kt
Dairy Kt t CO2 e / kt
Other Kt t CO2 e / kt
Table A.4. Upstream (Embodied) Greenhouse Gas Emissionsxvii
Notes on Table A.4xviiWhile the use of physical units (e.g., TJ or kt) rather than monetary units is encouraged for this table, some of the emissions factors may be derived from Environmental InputOutput (EIO) models. Multiregional EIO tables are available for many parts of the world, see for example: http://www.feem-project.net/exiopol/ and https://www.gtap.agecon.purdue.edu/databases/v7/default.asp. The source of emissions factors should be reported as a footnote to the table.
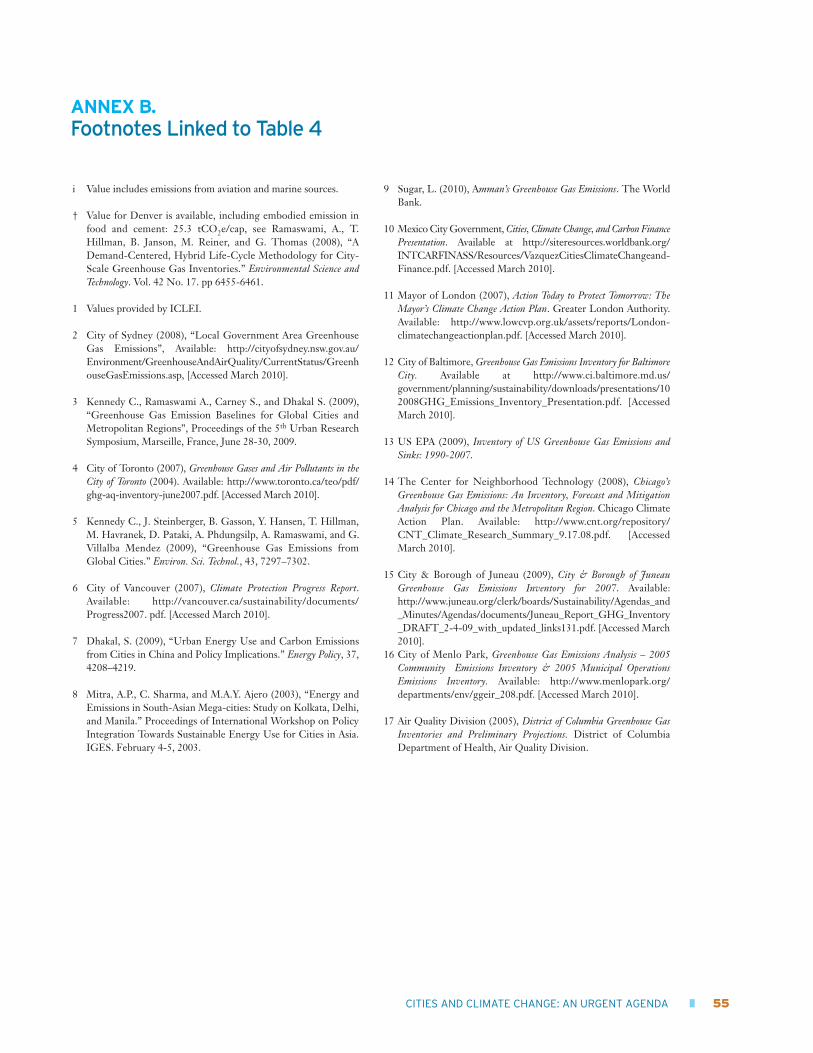
i Value includes emissions from aviation and marine sources.
† Value for Denver is available, including embodied emission infood and cement: 25.3 tCO2e/cap, see Ramaswami, A., T.Hillman, B. Janson, M. Reiner, and G. Thomas (2008), “ADemand-Centered, Hybrid Life-Cycle Methodology for City-Scale Greenhouse Gas Inventories.” Environmental Science andTechnology. Vol. 42 No. 17. pp 6455-6461.
1 Values provided by ICLEI.
2 City of Sydney (2008), “Local Government Area GreenhouseGas Emissions”, Available: http://cityofsydney.nsw.gov.au/Environment/GreenhouseAndAirQuality/CurrentStatus/GreenhouseGasEmissions.asp, [Accessed March 2010].
3 Kennedy C., Ramaswami A., Carney S., and Dhakal S. (2009),“Greenhouse Gas Emission Baselines for Global Cities andMetropolitan Regions”, Proceedings of the 5th Urban ResearchSymposium, Marseille, France, June 28-30, 2009.
4 City of Toronto (2007), Greenhouse Gases and Air Pollutants in theCity of Toronto (2004). Available: http://www.toronto.ca/teo/pdf/ghg-aq-inventory-june2007.pdf. [Accessed March 2010].
5 Kennedy C., J. Steinberger, B. Gasson, Y. Hansen, T. Hillman,M. Havranek, D. Pataki, A. Phdungsilp, A. Ramaswami, and G.Villalba Mendez (2009), “Greenhouse Gas Emissions fromGlobal Cities.” Environ. Sci. Technol., 43, 7297–7302.
6 City of Vancouver (2007), Climate Protection Progress Report.Available: http://vancouver.ca/sustainability/documents/Progress2007. pdf. [Accessed March 2010].
7 Dhakal, S. (2009), “Urban Energy Use and Carbon Emissionsfrom Cities in China and Policy Implications.” Energy Policy, 37,4208–4219.
8 Mitra, A.P., C. Sharma, and M.A.Y. Ajero (2003), “Energy andEmissions in South-Asian Mega-cities: Study on Kolkata, Delhi,and Manila.” Proceedings of International Workshop on PolicyIntegration Towards Sustainable Energy Use for Cities in Asia.IGES. February 4-5, 2003.
9 Sugar, L. (2010), Amman’s Greenhouse Gas Emissions. The WorldBank.
10 Mexico City Government, Cities, Climate Change, and Carbon FinancePresentation. Available at http://siteresources.worldbank.org/INTCARFINASS/Resources/VazquezCitiesClimateChangeand-Finance.pdf. [Accessed March 2010].
11 Mayor of London (2007), Action Today to Protect Tomorrow: TheMayor’s Climate Change Action Plan. Greater London Authority.Available: http://www.lowcvp.org.uk/assets/reports/London-climatechangeactionplan.pdf. [Accessed March 2010].
12 City of Baltimore, Greenhouse Gas Emissions Inventory for BaltimoreCity. Available at http://www.ci.baltimore.md.us/government/planning/sustainability/downloads/presentations/102008GHG_Emissions_Inventory_Presentation.pdf. [AccessedMarch 2010].
13 US EPA (2009), Inventory of US Greenhouse Gas Emissions andSinks: 1990-2007.
14 The Center for Neighborhood Technology (2008), Chicago’sGreenhouse Gas Emissions: An Inventory, Forecast and MitigationAnalysis for Chicago and the Metropolitan Region. Chicago ClimateAction Plan. Available: http://www.cnt.org/repository/CNT_Climate_Research_Summary_9.17.08.pdf. [AccessedMarch 2010].
15 City & Borough of Juneau (2009), City & Borough of JuneauGreenhouse Gas Emissions Inventory for 2007. Available:http://www.juneau.org/clerk/boards/Sustainability/Agendas_and_Minutes/Agendas/documents/Juneau_Report_GHG_Inventory_DRAFT_2-4-09_with_updated_links131.pdf. [Accessed March2010].
16 City of Menlo Park, Greenhouse Gas Emissions Analysis – 2005Community Emissions Inventory & 2005 Municipal OperationsEmissions Inventory. Available: http://www.menlopark.org/departments/env/ggeir_208.pdf. [Accessed March 2010].
17 Air Quality Division (2005), District of Columbia Greenhouse GasInventories and Preliminary Projections. District of ColumbiaDepartment of Health, Air Quality Division.
CITIES AND CLIMATE CHANGE: AN URGENT AGENDA � 55
ANNEX B. Footnotes Linked to Table 4
All information below was provided by the organizationlisted, unless otherwise indicated.
C40(Information from www.c40cities.org)C40 is involved in two primary cities and climatechange activities. 1) Carbon Finance CapacityBuilding, in partnership with the World BankCarbon Finance Unit, the Clinton Climate Initiative(CCI), and others, helps megacities in the globalsouth gain access to carbon finance opportunities. 2)The C40 Urban Life program, in partnership withCCI and Arup, uses Arup’s ‘sustainable integrateddevelopment’ approach to help cities plan carbonreduction programs. C40 also hosts events andworkshops to discuss cities and climate changeissues.
Carbon Disclosure Project(Information from www.cdproject.net)The Carbon Disclosure Project collects informationon greenhouse gas emissions and carbon reductionplans for 2,500 organizations throughout the world,including cities. When organizations voluntarilydisclose their carbon inventory, they can gainimportant baseline information and gain knowledgefor planning carbon reduction plans.
CDP issued a publication on cities and emissions in2008: “Carbon Disclosure Project: Cities PilotProject 2008”. This report was prepared inpartnership with ICLEI.
Cities Alliance Cities Alliance is supporting five primary activitiesin cities and climate change.
1) A Joint Program on Cities and Climate Changein partnership with the World Bank, UNEP, andUN-HABITAT was established to produce agreenhouse gas inventory for cities, develop acity risk assessment, a cities and climate change
clearinghouse, a handbook for mayors onclimate change, and a climate change positionpaper.
2) Cities Alliance supported the first UrbanClimate Change Research Network (UCCRN)Assessment Report on Climate Change, a reportthat informs city decision makers on climate riskreduction through adaptation and mitigation.
3) Cities Alliance supports a joint project with theWorld Bank and UN-HABITAT tostrengthening climate adaptation and disasterrisk management in Latin American &Caribbean cities. This project will increaseawareness and understanding of climate changerisks and impacts on mid-sized cities amongurban planners and/or mayors of such cities inthe region.
4) Cities Alliance and the Global Facility forDisaster Risk Reduction (GFDRR) are workingon a project to support cities and disastermanagement (focused on the Philippines,Senegal, and Burkina Faso). This projectsupports local governments in adopting moresystematic and durable mechanisms to preventand respond more effectively to disasters, risksand vulnerabilities, both climate, and nonclimaterelated. It also mobilizes and engages localgovernments and their associations to work inalignment with national governments whenaddressing the challenges posed by disasters.
5) Cities Alliance is supporting IIED in producingpublications that share knowledge and learningabout cities to ensure that city decision makersare informed about the basic concepts that linkclimate change and urban management.
56 � CITIES AND CLIMATE CHANGE: AN URGENT AGENDA
ANNEX CCities and Climate Change Activities in Key Organizations
Clinton Climate Initiative (CCI)The William J. Clinton Foundation launched theClinton Climate Initiative (CCI) to create andadvance solutions to the core issues driving climatechange. Working with governments and businessesaround the world to tailor local solutions that areeconomically and environmentally sustainable, CCIfocuses on three strategic program areas: increasingenergy efficiency in cities, catalyzing the large-scalesupply of clean energy, and working to measure andvalue the carbon absorbed by forests. In each of theseprograms, CCI uses a holistic approach to addressthe major sources of greenhouse gas emissions andthe people, policies, and practices that impact them.
As the delivery partner of the C40, CCI works withsome of the world’s largest cities to help develop large-scale, emissions reducing projects. CCI has helpedinitiate more than 250 building retrofit projects inmore than 20 different cities. Many of these projectshave begun or completed construction, including thefollowing: public buildings in Houston, London, andSeoul; commercial buildings such as the Empire StateBuilding in New York, large shopping centers in Indiaand Southeast Asia, and large department stores inKorea as well as others; universities in Mexico City andHong Kong; and housing developments in New York,Chicago, and Toronto. In Los Angeles, CCI is helpingthe city to replace 140,000 streetlights with light-emitting diode (LED) fixtures, which will cut CO2emissions in the city by 40,500 tons and save the city upto $10 million each year in energy and maintenancecosts. CCI has also helped Delhi to launch the firstintegrated waste management system in India, whichwill handle 1,200 tons of waste per day, create over1,000 jobs, and prevent the release of 96,000 tons ofcarbon dioxide into the atmosphere each year.
In collaboration with the U.S. Green BuildingCouncil, CCI is setting new standards for large-scaleproperty developments in cities around the world.Through the Climate Positive DevelopmentProgram, CCI is working with 18 urban developmentsacross 10 countries that have committed to reducetheir greenhouse gas emissions to below zero.
For more information, visit http://www.clinton-foundation.org/cci.
Energy Sector ManagementAssistance Program (ESMAP)The Energy Sector Management AssistanceProgram, a global, multi-donor technical assistanceprogram administered by the World Bank Group,launched its Energy Efficient Cities Initiative(EECI) in December 2008, following a round-tablediscussion about ongoing initiatives, barriers, andopportunities, to further scale up energy efficiencyimpacts with representatives from client countriesand partner organizations.
EECI is a flexible, cross-cutting, and demand-drivenprogram that identifies innovative ways to improveenergy efficiency in the delivery of city servicesacross six sectors—buildings, water, transport,public lighting, solid waste and heating and power—and reduce the costs and environmental impacts ofenergy use. EECI is building upon existing workthrough broad consultation and leveragingsustainable energy investments in cities throughexisting, and possibly new, financing instruments,and fostering global partnerships to successfullyrespond to the needs of cities.
EECI has a full range of available support, fromupstream market assessments to project design toprogram monitoring and dissemination. The fivemain components include the following: (i)analytical work, including tools; (ii) direct technicalassistance to cities to help influence their citydevelopment strategies; (iii) a city energy efficiencycase study database and innovation awards; (iv)mobilization of financing; and (v) outreach andpartnerships.
Global Environment Facility (GEF)Established in 1991, the Global EnvironmentFacility (GEF) unites 179 member governments and10 Implementing Agencies to address globalenvironmental issues. As an operating entity of thefinancial mechanism of the UN FrameworkConvention on Climate Change, the GEF providesgrants to developing countries and economies intransition to adapt to climate change and to mitigatetheir greenhouse gases emissions through energyefficiency, renewable energy, and low carbontransport and urban systems.
CITIES AND CLIMATE CHANGE: AN URGENT AGENDA � 57
The GEF’s portfolio on low carbon transport andurban systems now includes 75 cities all around theworld, impacting the daily life of 250 million people.An amount of $200 million was committed to theseprojects, leveraging $2.5 billion. Through thisportfolio, to date mainly focused on sustainabletransport initiatives, the GEF has helped globallyavoid the emission of nearly 60 million tons of CO2.The publication “Investing in Sustainable UrbanTransport: The GEF Experience” summarizes theGEF achievements in this area. Seehttp://www.thegef.org/gef/node/1541 for moreinformation.
During its fifth replenishment period (2010-2014),the GEF will build upon these achievements andfurther expand its scope to include integratedapproaches to promoting energy efficient, low-carbon cities. Emphasis will be placed on compre-hensive low-carbon urban planning for transport,energy efficiency, and renewable energy, coveringhousing, transport, public utilities, and commercialdevelopment. To achieve this objective, strongcommitments from the local as well as the nationalgovernments will be particularly important, andgreater attention will have to be given to measuringand quantifying global environmental benefits.
Global Facility for Disaster Risk Reduction (GFDRR)With the support of Cities Alliance, GFDRR isworking on a project on cities and disastermanagement focused on the Philippines, Senegal,and Burkina Faso. This project supports localgovernments to adopt more systematic and durablemechanisms to prevent and respond more effectivelyto disasters, risks, and vulnerabilities, both climateand nonclimate related. It also mobilizes andengages local governments and their associations towork in alignment with national governments whenaddressing the challenges posed by disasters.
Global City Indicators Facility (GCIF)The Global City Indicators Facility (GCIF) providesa credible, internationally recognized city indicatorreporting standard to enable city managers,investors, citizens, and stakeholders to measure andcompare a city’s performance, track trends, and have
a basis for sound decision-making. The GCIFcurrently has several environment related indicatorsand is in the process of developing a number ofenvironmental indices, including cooperation withcolleagues on a Greenhouse Gas Index. The GlobalCity Indicators Facility provides cities with astandardized web-based relational database thatallows cities to enter city data and draw comparabilitybetween and among cities globally. The compre-hensive web-based database enables cities tomeasure, report, and improve their own performancein the areas of city services and quality of life.
Indicators on climate change at the city level caninform city officials and support their existing, andindeed potentially far-reaching powers of planning,aimed at climate change adaptation and mitigation.For example, cities have the power to pass legislationrelated to greenhouse gas emissions; cities have thecapacity to encourage participation and engage withrelated governmental agencies and local corporateorganizations on climate change mitigation; cities canbuild more inclusive institutions for achievingenvironmental objectives; cities have the power toplan and design transportation systems that supportaccess by all citizens and rational choices on where tolive and work that is in keeping with a climate changeagenda for the city; cities have the power to ensurestrong and robust local economic developmentpatterns that build economic opportunity for allcitizens while addressing climate change; cities havethe power to address land tenure and land rights inthe city and can thereby adopt a pro-poor set ofpolicies governing access to and environmentally safeuse of land in the city; cities have important powersover building codes and zoning by-laws and can adoptflexible standards governing safer construction ofhousing, buildings, and infrastructure that are moreresilient to climate change risk and to adopt standardson greener buildings; and cities have the power todevelop creative financing tools for mobilizinginvestments that help to overcome climate-relatedthreats derived from a lack of basic infrastructure andenvironmental amenities for all, and especially thepoorest urban residents in cities.
Many of the indicators collected are highly relevantto cities and climate change: greenhouse gas
58 � CITIES AND CLIMATE CHANGE: AN URGENT AGENDA
emissions measured in tons per capita, PM10Concentration, total electrical use per capita, totalresidential electrical us per capita, percentage of thecity’s solid waste that is disposed of in an incineratoror burned openly/open dump/sanitary landfill/othermeans, Km of high capacity public transit system per100,000 population, Km of light passenger transitsystem per 100,000 population, number of personalautomobiles per capita and green area (hectares) per100,000 population.
ICLEI-Local Governments for Sustainability ICLEI is working in three main areas on cities andclimate change:
1) The Cities for Climate Protection (CCP)Campaign, started in 1993, is the first interna-tional initiative that aims to facilitate emissionsreduction of local governments through a fivemilestone process of measurement,commitment, planning, implementing, andmonitoring. The CCP Campaign assists cities toadopt policies and implement quantifiablemeasures to reduce local greenhouse gasemissions, improve air quality, and enhanceurban livability and sustainability. More than1,000 cities worldwide are participating in thisCampaign; each regional campaign is supportedby governmental and intergovernmentalinstitutions, including United States Agency forInternational Development (USAID), theEuropean Commission and the British HighCommissioner. All relevant publications can befound at www.iclei.org/index.php?id=10828 .
2) ICLEI Adaptation initiatives follow theinterpretation of the five milestone process ofthe CCP Campaign in urban climate resilienceconcept, supported by a number of guidebooksand toolkits. In 2009, ICLEI became a partnerof the UNFCCC Nairobi Work Programme onAdaptation and was recognized as the first localgovernment network in this field. ResilientCities 2010—the first World Congress on Citiesand Adaptation to Climate Change—is the firstAction Pledge of ICLEI to the UNFCCCNairobi Work Programme.
3) ICLEI Climate Advocacy: The 1st MunicipalLeadership Summit held at the UN Headquartersin New York in 1993 yielded the establishment ofCities for Climate Protection (CCP) Campaign.Based on the success of intensive efforts onmitigation projects at the local level since the firstUNFCCC Conference of Parties (COP) in 1995in Berlin, ICLEI became the focal point for localgovernment and municipality authority’sconstituency at the UNFCCC Secretariat.Through this opportunity, hundreds of mayorsand local government representatives took part inMunicipal Summits that were held in parallel toofficial COP events and necessary interventionswere delivered at high level segments. Between2007 and 2009, the Local Government ClimateRoadmap, as the coalition of local governmentnetworks, advocated for a better recognition andempowerment of cities and local governments inthe new global climate regime in the post-2012period. In 2009, ICLEI became the first localgovernment network that has been accredited asan observer organization to the Intergovern-mental Panel on Climate Change (IPCC).
Institut du développement durable etdes relations internationales (IDDRI)“Urban Fabric: Sustainable urban development” isa program of activities set up by IDDRI to addressurban development and sustainability. Specificallyrelated to cities and climate change, IDDRI isinvolved in seven main activities.
1) Transition to low-carbon buildings in Chinesecities: This research project aims to examinepossible paths to low carbon cities in emergingcountries by focusing on the buildings sector inChinese cities. It seeks to establish a dynamiclink between the energy performance of newbuildings constructed today and the financialcapacity in investing in new technologies todecarbonise the energy supply in citiestomorrow. Barriers and opportunity and policytools of managing carbon emissions in thebuilding sector in China will be investigated.
2) Climate Change Mitigation and AdaptationChallenges and Initiatives in California: (In
CITIES AND CLIMATE CHANGE: AN URGENT AGENDA � 59
partnership with Department of City andRegional Planning and the Global MetropolitanStudies program at University of California,Berkeley) The objective of this research is toexamine the challenge of finding a balancebetween mitigation and adaptation at the locallevel, to assess the policies that aim to tacklethese issues, and to determine how a territorialapproach—integrating transport and land uses—could be part of the answer.
3) A Task Force Energy Efficiency and UrbanDevelopment works on policy recommendationsto the China Council for InternationalCooperation on Environment and Development(CCICED). The general objective of the TaskForce is to address the energy dimensions ofurban development in China from theperspective of sustainability. Case studies on thedevelopment of several cities in China andabroad investigated the relations between urbandensity, urban design, lifestyles, and householdenergy consumption. Surveys on households’lifestyles and behaviors were carried out.
4) Task Force Global Climate Change Policy andthe Increasing Role of Cities: (in partnershipwith the Centre for European Policy studies[CEPS]) This Task Force constitutes a uniqueforum of representatives from the EuropeanCommission (DG Environment, DG Transport& Energy, and other DGs), Members of theEuropean Parliament, officials from memberstates, representatives from cities, localgovernment and their organizations, businessand industry (i.e., energy supply companies,energy-intensive industries, traders, equipmentsuppliers, and project developers), smallconsumer associations, NGOs, internationalorganizations and other stakeholders of energyregulators to facilitate an in-depth discussionand provide background research.
International Development ResearchCentre (IDRC)IDRC is a Canadian Crown corporation that worksin close collaboration with researchers from thedeveloping world in their search for the means to
build healthier, more equitable, and moreprosperous societies.
IDRC has two major projects with regard to climatechange research and cities.
1) Climate change and Water ProgramClimate change is having a significant effect onthe environment, especially on the quality andavailability of water resources. Changing rainfallpatterns, river hydrology and drought, and thedecline of important ecosystems are certain tohave a negative impact on the poor. The focusof this five-year Climate Change and WaterProgram is to support applied, policy-relevantresearch to help people adapt to the water-related impacts of climate change.
By providing grants and technical guidance, theprogram will encourage the development ofspecific research tools to cope with climate-related water stress and of the research capacityneeded to estimate and respond to risks createdby climate change. The program will explorecertain emerging areas, such as the links betweenclimate change, energy, and water, to identifyuseful avenues of investment. Research will alsobe carried out on how information andcommunication technologies support climatechange adaptation.
2) Climate Change Adaptation in Africa The Climate Change Adaptation in Africa(CCAA) research and capacity developmentprogram aims to improve the capacity of Africancountries to adapt to climate change in ways thatbenefit the most vulnerable. The program isjointly funded by Canada’s InternationalDevelopment Research Centre and the UKDepartment for International Development.
To better prepare Africa’s urban settlements for climatevariability and change, the Climate Change Adaptationin Africa (CCAA) program invited combined researchand capacity building proposals that addressed thevulnerabilities of Africa’s urban centres to climatechange, and helped urban stakeholders work togetherin developing adaptation options.
60 � CITIES AND CLIMATE CHANGE: AN URGENT AGENDA
Following CCAA’s call for proposals on urbanvulnerabilities to climate change in September 2008,nine project proposals have been developed andfunded. See www.idrc.ca for more information.
International Institute forEnvironment and Development (IIED)IIED’s staff and partners have been engaged withclimate change adaptation in urban areas for manyyears, including staff contributions to the Third andFourth Assessments of the Intergovernmental Panelon Climate Change (IPCC), and to setting the scopefor the planned Fifth IPCC Assessment. They haveproduced a large body of work on the scale andrange of environmental hazards and risks in urbanareas. This has been strengthened through the long-established partnership between IIED’s HumanSettlements and Climate Change Groups, and thepublication through IIED of a considerableproportion of all the published literature to date onthis topic (through IIED Briefs and working papers,over 20 papers published in IIED’s journalEnvironment and Urbanization, and a book titledAdapting Cities to Climate Change published in June2009). IIED staff have also advised many interna-tional agencies on climate change and citiesincluding the UNFCCC, OECD DevelopmentAssistance Committee, Rockefeller Foundation,UNDP, UN-Habitat, United Nations InternationalStrategy for Disaster Reduction (UN-ISDR),United Nations Population Fund (UNFPA), UnitedCities and Local Governments, ICLEI-LocalGovernments for Sustainability, the InternationalFederation of the Red Cross, and the World Bank.
Over the last two years, IIED has been engaged witha network of 15 researchers in low-income countries(12 in Africa and 3 in Asia) to produce city vulnera-bility and adaptation reports through the CLACC(Capacity Strengthening in the Least DevelopedCountries for Adaptation to Climate Change)programme. The maps and reports from this activityrepresent one of the first substantial attempts todocument climate vulnerability in urban areas inlow-income countries, to assess the potential foradaptation strategies, and to provide the necessaryinformation for communities and local governmentsto address climate change adaptation.
IIED’s current research activities involve expandingknowledge on effective interventions for climatechange adaptation that meet the needs of low-income urban residents. This is achieved throughsupporting research partners in low-incomecountries to conduct, document, and present theirresearch findings in a range of forums. IIED’s currentpractical interventions on climate change and citiesare based on strengthening linkages between climatechange NGOs and local organizations supportinglow-income residents in accessing land, shelter, andbasic infrastructure. Key locations for this activity areZimbabwe and Tanzania. IIED staff are also engagedin training and capacity strengthening of variouskinds, including the delivery of a postgraduatemodule on “Adapting Cities to Climate Change” atthe Development Planning Unit, University CollegeLondon, and supporting authors from the globalsouth in preparing peer-reviewed publications oncities and climate change that can be used assupporting documentation for the IPCC FifthAssessment Report.
International Society for IndustrialEcology (ISIE)Many members of the International Society forIndustrial Ecology (ISIE) are working on issues ofurban sustainability and in particular thedevelopment of low carbon cities. The ISIE has aworldwide membership of about 500 leadingscientists and engineers broadly concerned with thetechnical foundations of sustainable development.The membership, from academia, industry andgovernment, has expertise in the technologicaldevelopment and societal progression towardshuman and industrial systems that are compatiblewith the functioning of natural ecosystems.Members working on sustainable cities applymethods of industrial ecology, e.g., life cycleassessment, material flow analysis, complex systemstheory, and applied thermodynamics, to betterunderstand the urban metabolism and ways that itcan be managed for a low carbon future.
As an example, a recent study of greenhouse gasemissions from ten global cities (Los AngelesCounty, Denver City and County, Greater Toronto,New York City, Greater London, Geneva Canton,
CITIES AND CLIMATE CHANGE: AN URGENT AGENDA � 61
Greater Prague, Barcelona, Cape Town, andBangkok) was primarily undertaken by members ofthe ISIE (Kennedy et al., 2009a,b). The studyidentified the geophysical factors (climate, access toresources and gateway status) and technical factors(power generation, urban design, and wasteprocessing) that determine the greenhouse gasesattributable to cities. ISIE members are continuingto expand the study of urban greenhouse gasemissions to other cities (e.g., Hillman andRamaswami, 2009; Kennedy et al. 2009c).
One of the ISIE’s immediate goals is to create anetwork of developing world academics with theskills to calculate greenhouse gas (GHG) emissionsfor cities, so as to assist in their low carbondevelopment. The ISIE would welcome theopportunity to work with other agencies on thisinitiative.
Organisation for Economic Co-operationand Development (OECD)The OECD, an intergovernmental organizationrepresenting 30 member countries committed tocommon principles to support economicdevelopment including social and environmentalprotection, helps governments to improve theircollective and individual performance of climatechange policies through peer reviews, dialogue, andshared policy assessment. A number of projects atthe OECD are advancing the understanding of theroles that cities can play to respond efficiently andeffectively to climate change.
� Competitive Cities and Climate ChangeThis activity focuses on urban governance,planning, and land use, as well as intergovern-mental collaborations that link national andregional strategies to local actions. An interna-tional conference held in Milan, Italy, in October2008, and a follow-up workshop on GreeningCities: New Approaches to Local Climate ChangeActions held in June 2009, in Las Palmas, Spainbuilt on this theme. A new OECD report“Competitive Cities and Climate Change”assesses the relationship between urbanisation andCO2, and identifies key opportunities for actionto reduce cities’ contribution and vulnerability to
climate change, including complementary urbanplanning and sectoral policies, “greening” of fiscalpolicies, financing options, and opportunities toboost green innovation and jobs.
� Cities, Climate Change and Multilevel GovernanceThe OECD has also begun to identify a multilevelgovernance framework to explore linkagesbetween national, regional, and local policies, andto explore the ability to strengthen multilevel,regional, and urban governance to more effectivelyaddress the problem of climate change. A recentreport highlights progress made to advanceprincipals of good practice, including participatorygovernance; the existence of a strong analyticalfoundation for short and long-term planning; cost-effectiveness and economic efficiency; consid-eration of distributional consequences andprocedural equity; use of a long term planninghorizon; and policy coherence and feasibility.
� Cities and Green Growth Having strengthened their role as drivers ofinnovation and entrepreneurship, cities play anincreasingly important role in identifying policiesand approaches that can shift production andconsumption towards a clean, low-carbon andsustainable economy. How cities grow spatiallygreatly impacts the degree to which economicgrowth can also be considered green.
� Enhancing Local Benefits of Adaptation & Mitigation PoliciesThis activity focuses on assessment of climatepolicy benefits at local scale, in particular on howpolicy can limit or avoid climate impacts on urbaninfrastructure, people, and economies. A firstpriority is to explore the local scale economicimpacts of climate change in the face of urbandevelopment, including the impacts of projectedchanges in extreme weather events. Severalworking papers are available: a literature reviewon impacts and adaptation at city scale; aconceptual framework for impact and benefitassessment at urban scale; a ranking of the world’slarge cities most exposed to coastal flooding todayand in the future; and an in-depth case study oncoastal flood risk in Copenhagen.
62 � CITIES AND CLIMATE CHANGE: AN URGENT AGENDA
� Adaptation to Climate ChangeOn the adaptation dimension, related work isinvestigating how to better integrate adaptation atcity scale in development co-operation andplanning in developing countries.
� Transportation and Climate ChangeThe International Transport Forum (ITF) isengaged in many aspects of transport-relatedclimate research and policy-making, includingurban travel. In May 2008, the forum organizedthe world’s largest transport summit around thetheme of “Transport and Energy: the Challengeof Climate Change.” Key policy and researchfindings highlighted the need for a strategicpackage of policy measures including thefollowing: technology development, strengthenedresearch into new technology and fuels, increaseduse of information technology and integratedmobility management as well as a wide variety ofnontechnology tools with potential to improveeconomic efficiency and reduce emissions.
Rockefeller FoundationThe Asian Cities Climate Change Resilience Network(ACCCRN) aims to catalyze attention, funding, andaction on building climate change resilience for poorand vulnerable people by creating robust models andmethodologies for assessing and addressing riskthrough active engagement and analysis of variouscities. Through the actions of the Asian Cities ClimateChange Resilience Network, it is anticipated that by2012 a network of cities in Asia will have developedrobust plans to prepare for, withstand and recoverfrom the predicted impacts of climate change. Toaccomplish this, ACCCRN must test and demonstratea range of actions to build climate change resilience incities; build a replicable base of lessons learned,successes and failures; assist cities in the developmentand implementation of a climate change resiliencebuilding process; and help cities continue activitiesthat build climate change resilience.
ACCCRN is being implemented in 4 phases:Phase 1 (completed): City Scoping and Selection.Selected cities in India: Surat, Indore and Gorakphur.Selected cities in Viet Nam: Da Nang, Quy Nhonand Can Tho. Selected Cities in Thailand: Chiang Rai
and Hat Yai. Selected Cities in Indonesia: BandarLampung and Semerang.Phase 2: City-level engagement and capacitydevelopmentPhase 3: Implementation of effective urbanresilience building projectsPhase 4: Replication
This project is carried out with many partners,including Institute for Social EnvironmentalTransition (ISET), Arup International Development,ICLEI, APCO Worldwide, TARU Leading Edge,Gorakhpur Environmental Action Group (GEAG),Thailand Environment Institute (TEI), AsianDisaster Preparedness Center (ADPC), MercyCorps, Urban and Regional Development Institute(URDI), Challenge to Change (Vietnam), NationalInstitute for Science and Technology Policy andStrategy Studies (NISTPASS).
For more information see: http://www.rockefeller-foundation.org/news/publications/acccrn-responding-urban-climate.
The Climate GroupThe Climate Group has worked with cities since theorganization was founded in 2004. The ClimateGroup launched the C10 initiative in 2005, whichwas spun off to become the C40 under the ClintonGlobal Initiative.
The Climate Group is a member of the HSBCClimate Partnership, launched in 2007. Throughthis partnership The Climate Group works in HongKong, London, Mumbai, New York, and Shanghaito help citizens, business, and government to makesmarter, cleaner choices.
In 2009, The Climate Group partnered with theCity of Chicago and the Chicago 2016 Olympic BidCommittee to create a new type of public-privatepartnership that engaged leading Chicago-areabusinesses and nonprofit organizations to help thecity achieve its greenhouse-gas emissions reductiontargets, “green” the bid for the Olympic andParalympic Games, and leave an environmentallegacy for all Chicago residents.
In 2009, The Climate Group began its MarketTransformation work. Three of the focus areas aim
CITIES AND CLIMATE CHANGE: AN URGENT AGENDA � 63
to increase demonstration projects of low carbontechnologies in cities—LED Street Lighting,Information and Communications Technologies(ICT) and Electric Vehicles (EVs). These threeprogrammes will run through 2013.
The goal of The Climate Group’s ICT sector work isto facilitate proof-of-concept pilots, performancetracking, financing and policy for scaling ICT solutionsin transport, buildings and electricity grid that couldsave up to 15 percent of global emissions in 2020(according to the SMART 2020 report, June 2008). In2009, The Climate Group partnered with Cisco’sConnected Urban Development programme todevelop a set of activities to achieve programme goals,and will officially announce and call for new partnersduring the Shanghai World Expo in June 2010.
In 2009, The Climate Group launched LightSavers,an international program to transform how we lightthe world by bringing low-energy LED lighting tocommercial scale. LightSavers has launched a globaltrail to test the efficacy and cost savings of outdoorLED lights in cities, starting in New York, HongKong, London, Adelaide, Kolkata, Mumbai, Tianjin,and Toronto. By 2020, The Climate Group’s goal isfor 25 percent of all outdoor lights to be replacedwith high quality LEDs that are available on thecommercial market. Initial results show that LEDlights use half as much energy as existing lighting.
UCLG/MetropolisIn the realm of cities and climate change, Metropolisis working on a range of projects and knowledgeproducts including the following.
� Seminar on Cities and Information Technology,New Delhi, IndiaThis seminar is dedicated to local officials of majorcities in India. It is jointly organized with CISCO.
� Field study on Chicago Climate Plan and SuccessStories, Chicago, USAThis field study follows the publication releasedby Metropolis International Institute: ClimateChange: Cities in Action. It aims to demonstrateactions and innovations at the local level to reducegreenhouse gas emissions.
� Urban Design and Landscaping for SustainableTourism, Mashhad, IranThis course is dedicated to local Middle Eastofficials and aims to help them to enhance theurban environment and increase tourism in respectto the principles of sustainable development.
� Field study on City and Quality of Life for theCitizens, Songpa, South KoreaSongpa is a district of 650,000 inhabitants in theSeoul Metropolitan Government area. In 2008,Songpa has won a UNEP reward for its quality oflife and actions for the environment. This field studyis a showcase for the participants to local actions.
� Urban Transportation Policy, Seoul, SouthKoreaTransportation is an important sector for thegreenhouse gas reduction and achieving thenational and local targets. Also, Seoul MetropolitanGovernment is innovating in transportation. Thiscourse will allow officials working in thetransportation sector to learn how Seoul achievedits very good results.
� Urban Environment Policy, Seoul, South KoreaSeoul is well known as an attractive city that hasdeveloped an efficient environment policy andactions (greening, water protection, energyefficiency, etc.). This course will allow the partic-ipants to exchange with their counterparts onmechanisms of achieving good results in this field.
� Environmental Friendly Infrastructure, Cairo,EgyptThis course will be delivered to African andMiddle East local officials.
� Infrastructure and Project Management forInformal Areas, Cairo, EgyptThis course will be delivered to African andMiddle East local officials.
� African Cities and Climate Change,Ouagadougou, Burkina FasoThis seminar will be jointly organized with theUEMOA (Union of the West African States).This is under discussion and it will be offereddepending on the available funding.
64 � CITIES AND CLIMATE CHANGE: AN URGENT AGENDA
Additionally, Metropolis is updating and translatingits Climate Change: Cities in Action publication anddeveloping an online portal dedicated to knowledgeon cities and climate change. Metropolis will host aforum on cities and climate change in the frameworkof the 16th Conférence de Montréal.
UNEPIn joint partnership with UN-HABITAT and theWorld Bank, UNEP is working on several projectson cities and climate change. Joint work programoutputs include the following: an online catalogueto facilitate access to current information on citiesand climate change; integrating climate change intocity development strategies; developing a citygreenhouse gas inventory and standard; and ahandbook for mayors on climate change.
UN-HABITATThe United Nations Human Settlements Programme(UN-HABITAT) promotes the role of local leadershipin mitigating and adapting to climate change in urbanareas. The agency has adopted a Cities and ClimateChange Strategy, to focus its efforts in this importantarea. This Strategy includes thematic focus areas onthe following: urban governance, planning andmanagement; land and housing; disaster risk reduction;and environmentally sound infrastructure. Cities andClimate Change is also the theme of the next edition ofthe agency’s main flagship publication, the 2011 GlobalReport on Human Settlements.
Spearheading UN-Habitat’s response in this area is itscross-divisional Cities and Climate Change Initiative(CCCI). CCCI is working at the national and locallevel in a number of countries. To date, CCCI hascarried out detailed climate change assessments, andhas begun to support follow-on action planning, inKampala (Uganda), Maputo (Mozambique), SorsogonCity (Philippines), and Esmeraldas (Ecuador). Itrecently expanded to include several new cities inAfrica: Mombasa (Kenya), Kigali (Rwanda), WalvisBay (Namibia), St. Louis (Senegal), and BoboDioulasso (Burkina Faso). The Initiative plans furtherexpansion in the near future in Asia. CCCI is sharinglessons from those experiences via the Climate ActionMap, in partnership with Local GovernmentDenmark (see www.climateactionmap.org), as well as
by means of presentations at fora and articles inprofessional publications.
Internationally, UN-Habitat is developing severalcapacity-building tools that address cities and climatechange, including one on developing local climateaction plans and one on carbon finance for cities. TheInitiative is promoting green building practices inAfrica by encouraging the formation of green buildingcouncils and via other appropriate mechanisms. CCCIhas supported the Local Government ClimateChange Roadmap process. In partnership with theWorld Bank, the United Nations EnvironmentProgramme (UNEP) and Cities Alliance, UN-Habitat is promoting a common standard for method-ologies for city-level inventories of greenhouse gasemissions, developing a comparative vulnerabilityassessment methodology for cities, and undertakingother initiatives. For further information on CCCI,please go to www.unhabitat.org/ccci.
Veolia InstituteThe Institut Veolia Environnement is a nonprofitorganization created and sponsored by VeoliaEnvironnement. The Institute aims to nurturereflection on future environmental trends byproposing a forum for dialogue within academia,institutions, and different actors in society. Itsresearch agenda, conducted in partnership withuniversities or research organizations aims tocontribute to public debate on an international scale.
Main activities related to Cities and ClimateChange1) GHG accountability: With the College of Europe,
the Institute has conducted research on themethodological challenges of GHG monitoring atlocal level to give an overview of current practices.Questions addressed were as follows: How do themethodologies which underlie different GHGinventory tools differ? What are the criticalvariables explaining differences betweeninventories? Can different GHG inventory toolsbe compatible — and/or interoperable— andunder which conditions? This overview identifiedcritical variables and concluded that local GHGinventories differ substantially and their result canhardly be compared. This study also gave researchand policy recommendations towards greatercomparability and sketched the requirements of an
CITIES AND CLIMATE CHANGE: AN URGENT AGENDA � 65
international protocol on urban GHG inventories.
The study is available at: http://www.institut.veolia.org/ive/ressources/documents/2/491,Final-report-Comparative-Analysis-of.pdf
2) Estimating Carbon Footprint of urban energyuse in India and China: In the context of thegrowing energy demand of urban areas, thisstudy recognized the need (1) to understand theenergy consumption patterns of the urbanpopulation in developing countries, (2) developa tool to measure its impacts and (3) propose thisindicator to policy makers to conceive of energystrategies for the urban areas. In partnership withThe Energy Research Institute (TERI, Delhi),the Energy Resource Institute (ERI, Beijing) andTsinghua University (Beijing), primary surveysof households were conducted and the energyconsumption profiles of Jaipur, India, andShijiazhuang, China, were established.
3) S.A.P.I.EN.S issue on Cities and Climate Change:S.A.P.I.EN.S is a new international, peer-reviewed, open access multidisciplinary journalfocused on integrating scientific knowledge forsustainability. The special issue Cities and ClimateChange gathers critical state of the arts and sciencebased opinions, on all multidisciplinary aspects ofthis burning issue. The journal is available athttp://sapiens.revues.org/index835.html.
World BankThe World Bank is undertaking a wide variety ofwork in cities and climate change, all of which isoutlined in the above paper. Activities include thefollowing: the Mayor’s Dialogue on Urban Povertyand Climate Change; a City-wide Approach toCarbon Finance; Mayors’ Handbook on climatechange adaptation; 5th Urban Research Symposiumon Cities and Climate Change; Greenhouse GasEmissions Standard; Urban Risk Assessment; Eco2
Cities; and the Urbanization Review.
World Bank Institute Climate Change GroupThe climate change group within the World BankInstitute works to enable cities to play more activeroles in integrating climate risks, low carbon
strategies, and innovative climate finance into theirdevelopment planning. The climate group is veryactive in cities and climate change and is working onan array of activities around this theme.
1) A learning program on Carbon Finance forUrban Areas comprising courses on cities andclimate change, CDM, energy, transport, solidwaste, and water management.
2) A carbon finance capacity building program foremerging megacities.
3) A city twinning program on carbon finance tobring together cities from the north and south forstructured peer-to-peer exchange of knowledge.
4) A visioning scenario for urban leaders to enhancethe capacity of various stakeholders to integrateconsiderations of climate change risks andadaptation options into development action plansand policies in the context of urban planning inAsia with pilot experience in Hanoi, Vietnam.
5) A CTF on Urban and Carbon Finance toprovide technical advice and coordination indeveloping a CTF program.
6) A Mayor’s Task Force beginning January 2010to provide a platform to facilitate knowledgeexchange among mayors.
Urban GroupThe “Sustainable Land Use Planning” course thatThe World Bank Institute is currently developing isrelevant to cities and climate change. The courseconsiders climate change as one key environmentalchallenge and explores tools and policies that helpmainstream climate change mitigation andadaptation strategies into the land use planningprocess. For example, through 1) planning ofcompact urban form and public transport, pedestrianbased movement systems, 2) a wide spectrum of risk-reduction regulatory and economic instruments toidentify (or relocate residents from) hazard-proneareas, protect agricultural, open space and watersource, construct flood/storm managementinfrastructure, and others, 3) cross-jurisdictioncoordination in river basin management and others.
66 � CITIES AND CLIMATE CHANGE: AN URGENT AGENDA
CITIES AND CLIMATE CHANGE: AN URGENT AGENDA � 67
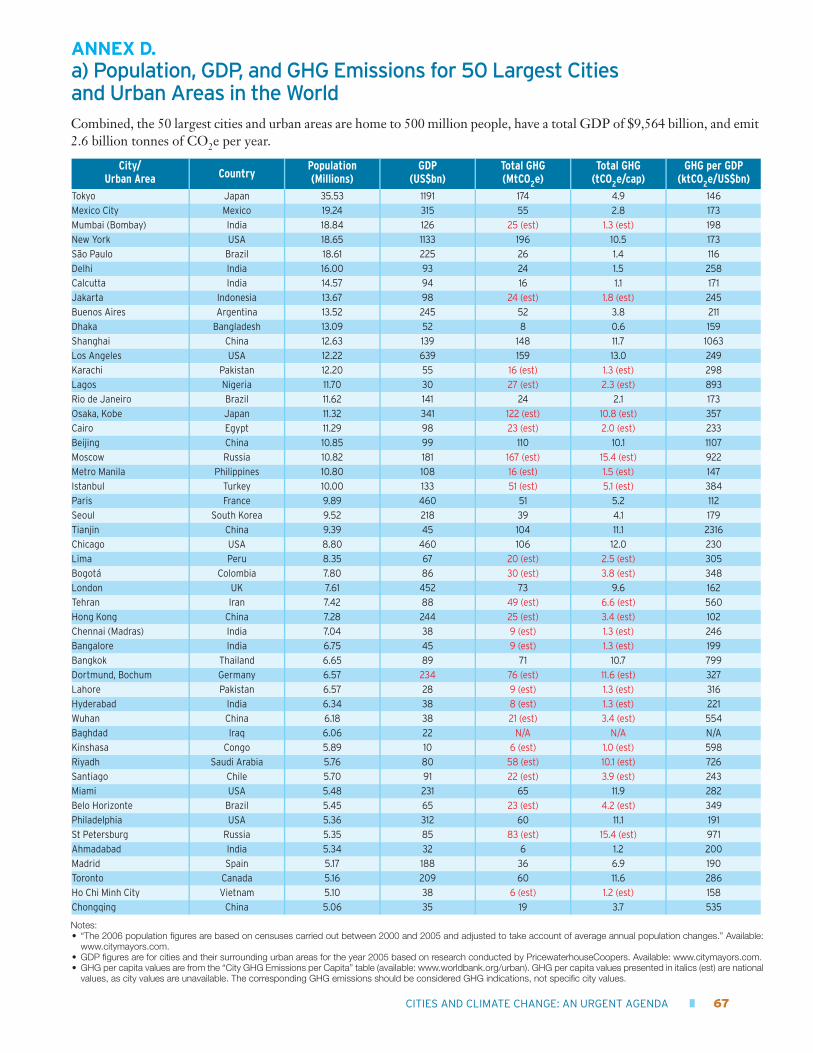
ANNEX D. a) Population, GDP, and GHG Emissions for 50 Largest Cities and Urban Areas in the WorldCombined, the 50 largest cities and urban areas are home to 500 million people, have a total GDP of $9,564 billion, and emit2.6 billion tonnes of CO2e per year.
City/Urban Area Country
Population (Millions)
GDP (US$bn)
Total GHG (MtCO2e)
Total GHG (tCO2e/cap)
GHG per GDP(ktCO2e/US$bn)
Tokyo Japan 35.53 1191 174 4.9 146
Mexico City Mexico 19.24 315 55 2.8 173
Mumbai (Bombay) India 18.84 126 25 (est) 1.3 (est) 198
New York USA 18.65 1133 196 10.5 173
São Paulo Brazil 18.61 225 26 1.4 116
Delhi India 16.00 93 24 1.5 258
Calcutta India 14.57 94 16 1.1 171
Jakarta Indonesia 13.67 98 24 (est) 1.8 (est) 245
Buenos Aires Argentina 13.52 245 52 3.8 211
Dhaka Bangladesh 13.09 52 8 0.6 159
Shanghai China 12.63 139 148 11.7 1063
Los Angeles USA 12.22 639 159 13.0 249
Karachi Pakistan 12.20 55 16 (est) 1.3 (est) 298
Lagos Nigeria 11.70 30 27 (est) 2.3 (est) 893
Rio de Janeiro Brazil 11.62 141 24 2.1 173
Osaka, Kobe Japan 11.32 341 122 (est) 10.8 (est) 357
Cairo Egypt 11.29 98 23 (est) 2.0 (est) 233
Beijing China 10.85 99 110 10.1 1107
Moscow Russia 10.82 181 167 (est) 15.4 (est) 922
Metro Manila Philippines 10.80 108 16 (est) 1.5 (est) 147
Istanbul Turkey 10.00 133 51 (est) 5.1 (est) 384
Paris France 9.89 460 51 5.2 112
Seoul South Korea 9.52 218 39 4.1 179
Tianjin China 9.39 45 104 11.1 2316
Chicago USA 8.80 460 106 12.0 230
Lima Peru 8.35 67 20 (est) 2.5 (est) 305
Bogotá Colombia 7.80 86 30 (est) 3.8 (est) 348
London UK 7.61 452 73 9.6 162
Tehran Iran 7.42 88 49 (est) 6.6 (est) 560
Hong Kong China 7.28 244 25 (est) 3.4 (est) 102
Chennai (Madras) India 7.04 38 9 (est) 1.3 (est) 246
Bangalore India 6.75 45 9 (est) 1.3 (est) 199
Bangkok Thailand 6.65 89 71 10.7 799
Dortmund, Bochum Germany 6.57 234 76 (est) 11.6 (est) 327
Lahore Pakistan 6.57 28 9 (est) 1.3 (est) 316
Hyderabad India 6.34 38 8 (est) 1.3 (est) 221
Wuhan China 6.18 38 21 (est) 3.4 (est) 554
Baghdad Iraq 6.06 22 N/A N/A N/A
Kinshasa Congo 5.89 10 6 (est) 1.0 (est) 598
Riyadh Saudi Arabia 5.76 80 58 (est) 10.1 (est) 726
Santiago Chile 5.70 91 22 (est) 3.9 (est) 243
Miami USA 5.48 231 65 11.9 282
Belo Horizonte Brazil 5.45 65 23 (est) 4.2 (est) 349
Philadelphia USA 5.36 312 60 11.1 191
St Petersburg Russia 5.35 85 83 (est) 15.4 (est) 971
Ahmadabad India 5.34 32 6 1.2 200
Madrid Spain 5.17 188 36 6.9 190
Toronto Canada 5.16 209 60 11.6 286
Ho Chi Minh City Vietnam 5.10 38 6 (est) 1.2 (est) 158
Chongqing China 5.06 35 19 3.7 535
Notes:• “The 2006 population figures are based on censuses carried out between 2000 and 2005 and adjusted to take account of average annual population changes.” Available:
www.citymayors.com.• GDP figures are for cities and their surrounding urban areas for the year 2005 based on research conducted by PricewaterhouseCoopers. Available: www.citymayors.com.• GHG per capita values are from the “City GHG Emissions per Capita” table (available: www.worldbank.org/urban). GHG per capita values presented in italics (est) are national
values, as city values are unavailable. The corresponding GHG emissions should be considered GHG indications, not specific city values.
68 � CITIES AND CLIMATE CHANGE: AN URGENT AGENDA
City/Urban Area
CountryPopulation (Millions)
GDP (US$bn)
Total GHG(MtCO2e)
Total GHG(tCO2e/cap)
GHG per GDP(ktCO2e/US$bn)
Tokyo Japan 35.53 1191 174 4.9 146
Mexico City Mexico 19.24 315 55 2.8 173
Mumbai India 18.84 126 25 (est) 1.3 (est) 198
New York USA 18.65 1133 196 10.5 173
Sao Paulo Brazil 18.61 225 26 1.4 116
Delhi NCT India 16.00 93 24 1.5 258
Jakarta Indonesia 13.67 98 24 (est) 1.8 (est) 245
Buenos Aires Argentina 13.52 245 52 3.8 211
Dhaka Bangladesh 13.09 52 8 0.6 159
Shanghai China 12.63 139 148 11.7 1063
Los Angeles USA 12.22 639 159 13.0 249
Karachi Pakistan 12.20 55 16 (est) 1.3 (est) 298
Lagos Nigeria 11.70 30 27 (est) 2.3 (est) 893
Rio de Janeiro Brazil 11.62 141 24 2.1 173
Cairo Egypt 11.29 98 23 (est) 2.0 (est) 233
Beijing China 10.85 99 110 10.1 1107
Moscow Russia 10.82 181 167 (est) 15.4 (est) 922
Istanbul Turkey 10.00 133 51 (est) 5.1 (est) 384
Paris France 9.89 460 51 5.2 112
Seoul South Korea 9.52 218 39 4.1 179
Chicago USA 8.80 460 106 12.0 230
Lima Peru 8.35 67 20 (est) 2.5 (est) 305
Bogota Colombia 7.80 86 30 (est) 3.8 (est) 348
London UK 7.61 452 73 9.6 162
Hong Kong China 7.28 244 25 (est) 3.4 (est) 102
Bangkok Thailand 6.65 89 71 10.7 799
Philadelphia USA 5.36 312 60 11.1 191
Madrid Spain 5.17 188 36 6.9 190
Toronto Canada 5.16 209 60 11.6 286
Sydney Australia 4.45 172 115 (est) 25.8 (est) 666
Houston USA 4.39 235 62 14.1 263
Hanoi Vietnam 4.22 28 5 (est) 1.2 (est) 178
Rome Italy 4.00 123 37 (est) 9.3 (est) 303
Melbourne Australia 3.71 135 96 (est) 25.8 (est) 708
Johannesburg South Africa 3.44 79 34 (est) 9.9 (est) 432
Warsaw Poland 3.35 48 35 (est) 10.5 (est) 730
Berlin Germany 3.33 75 39 (est) 11.6 (est) 516
Caracas Venezuela 3.30 28 27 (est) 8.1 (est) 949
Athens Greece 3.25 73 34 10.4 463
Addis Ababa Ethiopia 3.15 7 3 (est) 0.8 (est) 378
Notes:• “The 2006 population figures are based on censuses carried out between 2000 and 2005 and adjusted to take account of average annual population changes.”
Available: www.citymayors.com.• GDP figures are for cities and their surrounding urban areas for the year 2005 based on research conducted by PricewaterhouseCoopers. Available:
www.citymayors.com.• GHG per capita values are from the “City GHG Emissions per Capita” table (available: www.worldbank.org/urban). GHG per capita values presented in italics (est)
are national values, as city values are unavailable. The corresponding GHG emissions should be considered GHG indications, not specific city values.
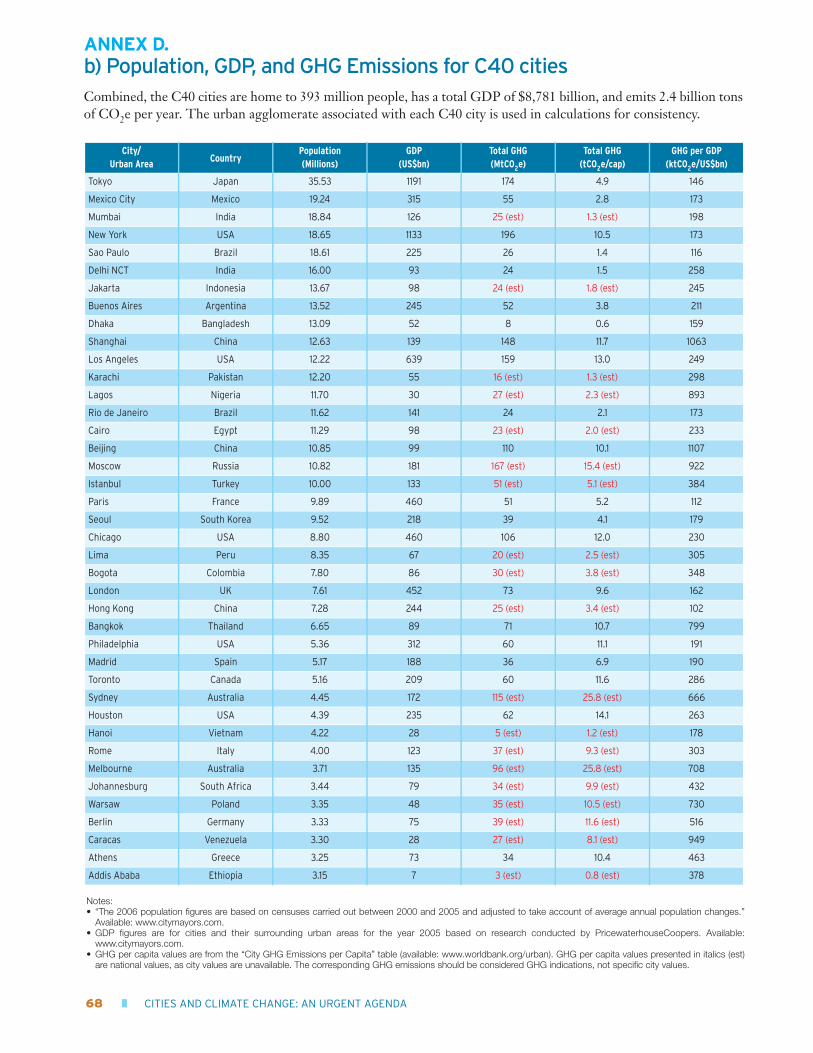
ANNEX D. b) Population, GDP, and GHG Emissions for C40 citiesCombined, the C40 cities are home to 393 million people, has a total GDP of $8,781 billion, and emits 2.4 billion tonsof CO2e per year. The urban agglomerate associated with each C40 city is used in calculations for consistency.
CITIES AND CLIMATE CHANGE: AN URGENT AGENDA � 69
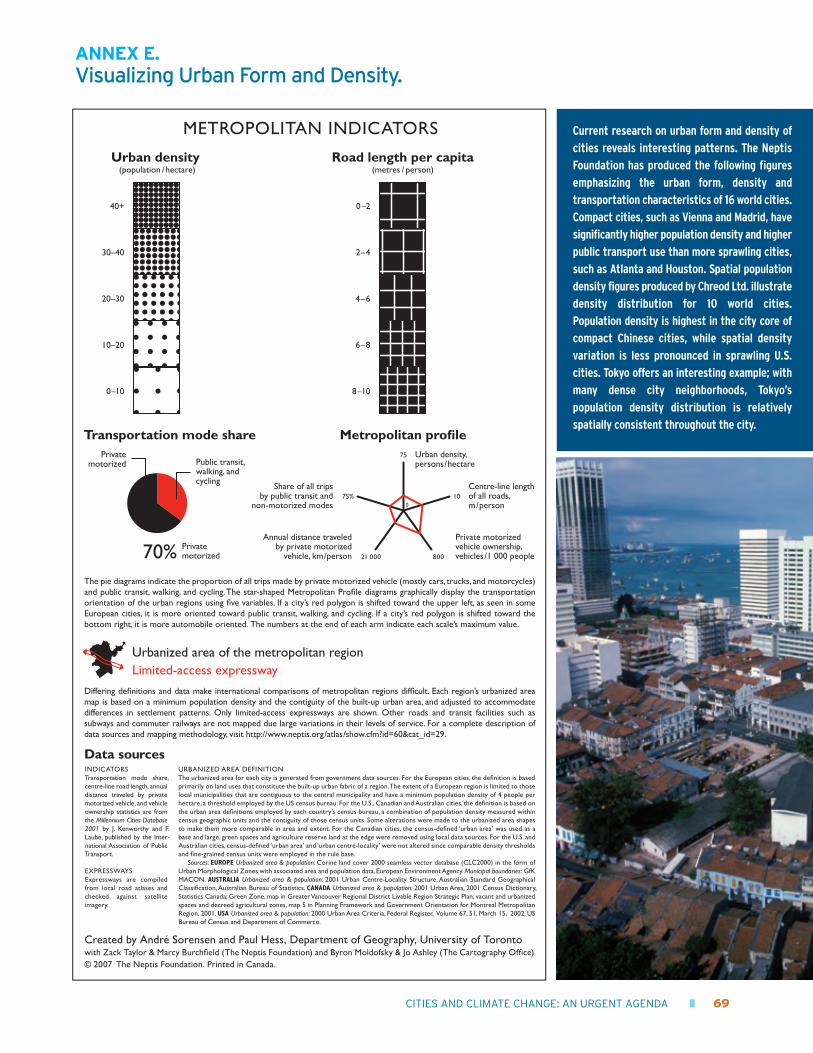
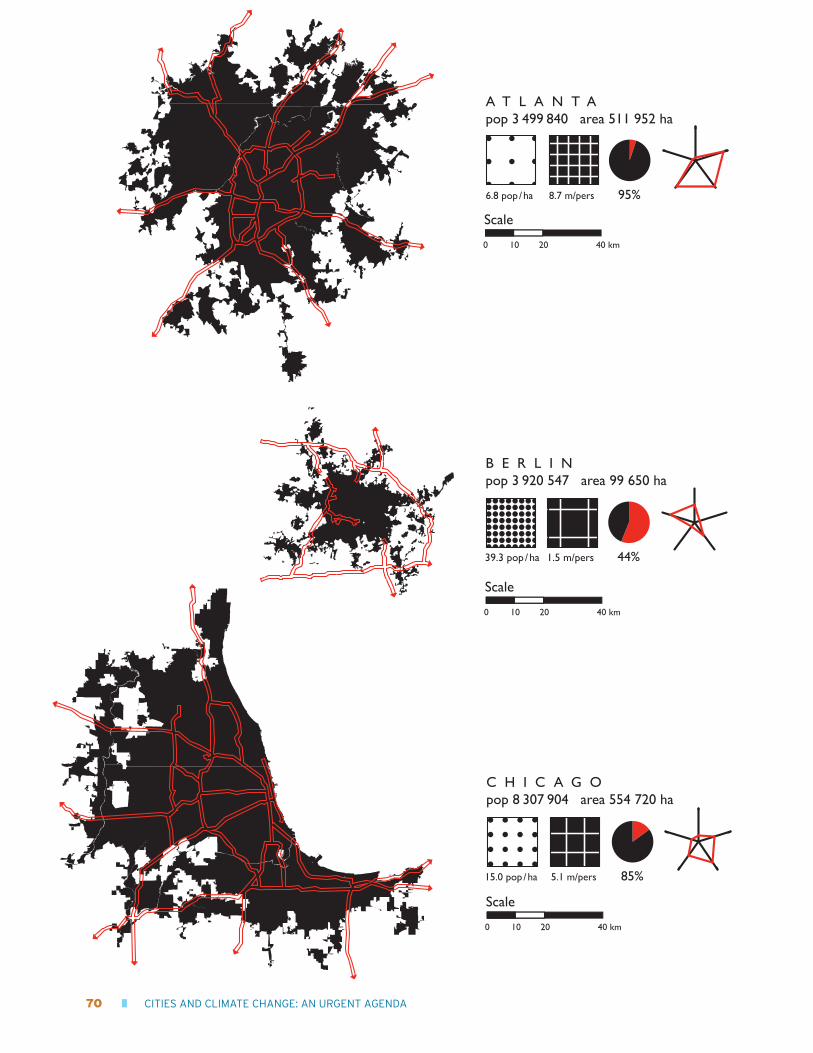
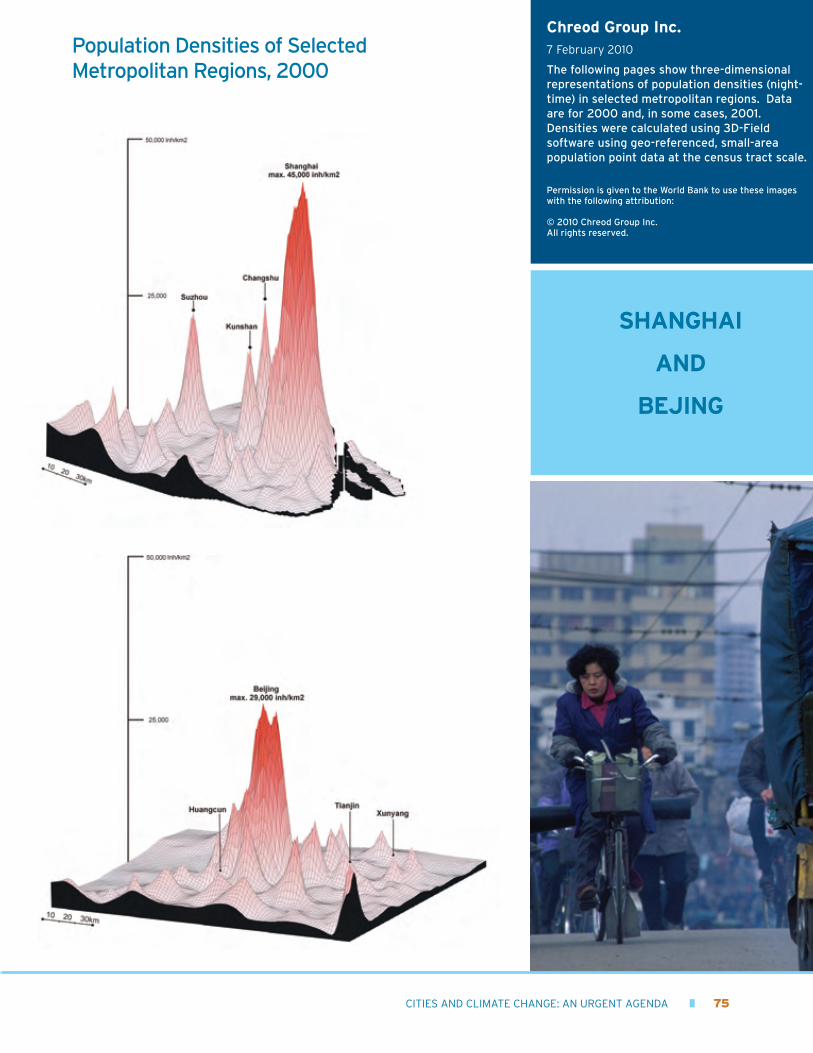
Current research on urban form and density of
cities reveals interesting patterns. The Neptis
Foundation has produced the following figures
emphasizing the urban form, density and
transportation characteristics of 16 world cities.
Compact cities, such as Vienna and Madrid, have
significantly higher population density and higher
public transport use than more sprawling cities,
such as Atlanta and Houston. Spatial population
density figures produced by Chreod Ltd. illustrate
density distribution for 10 world cities.
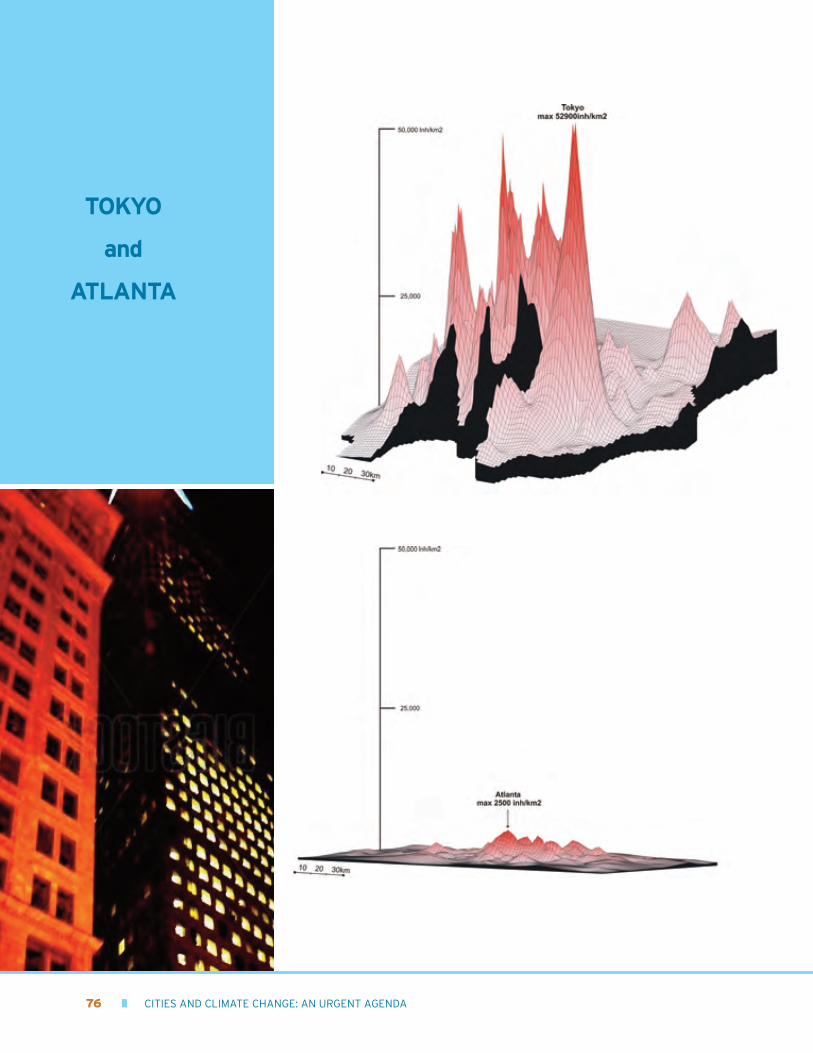
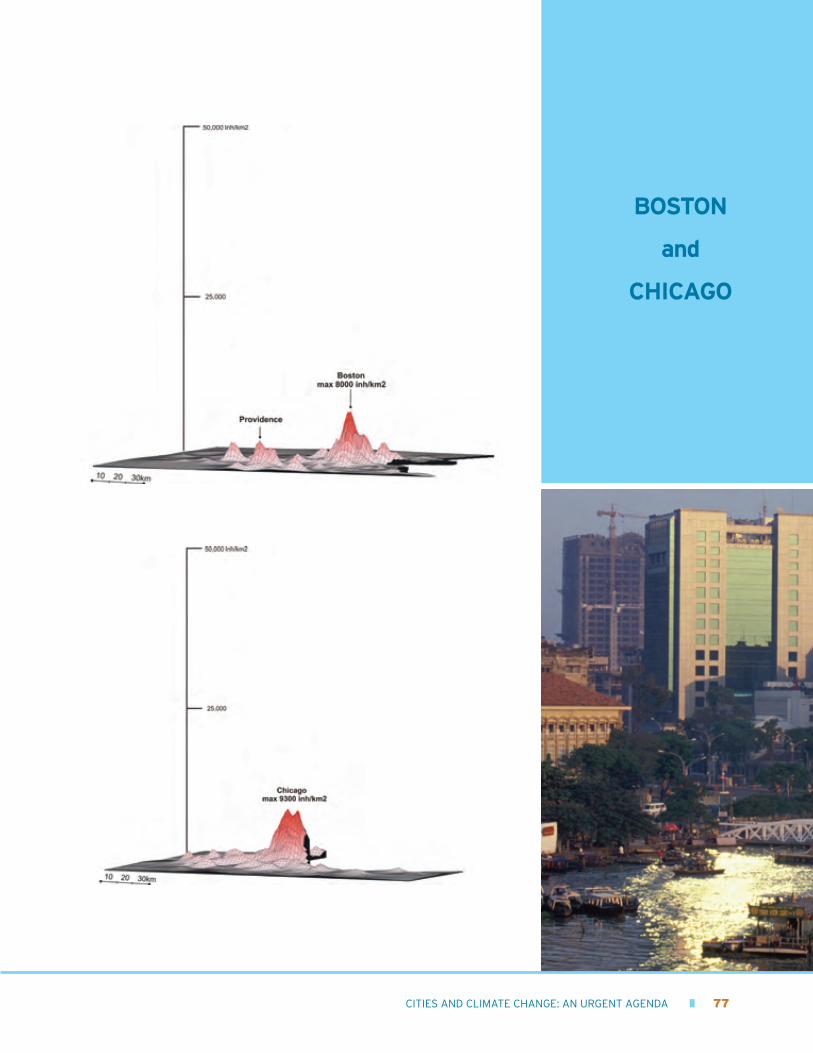
Population density is highest in the city core of
compact Chinese cities, while spatial density
variation is less pronounced in sprawling U.S.
cities. Tokyo offers an interesting example; with
many dense city neighborhoods, Tokyo’s
population density distribution is relatively
spatially consistent throughout the city.
ANNEX E. Visualizing Urban Form and Density.
Urban density (population /hectare)
Road length per capita(metres / person)
METROPOLITAN INDICATORS
Urban density,persons/hectare
Centre-line length of all roads, m/person
Private motorizedvehicle ownership, vehicles/1 000 people
Annual distance traveledby private motorized
vehicle, km/person
Transportation mode share Metropolitan profile
Share of all tripsby public transit and
non-motorized modes
70%
Privatemotorized
Privatemotorized
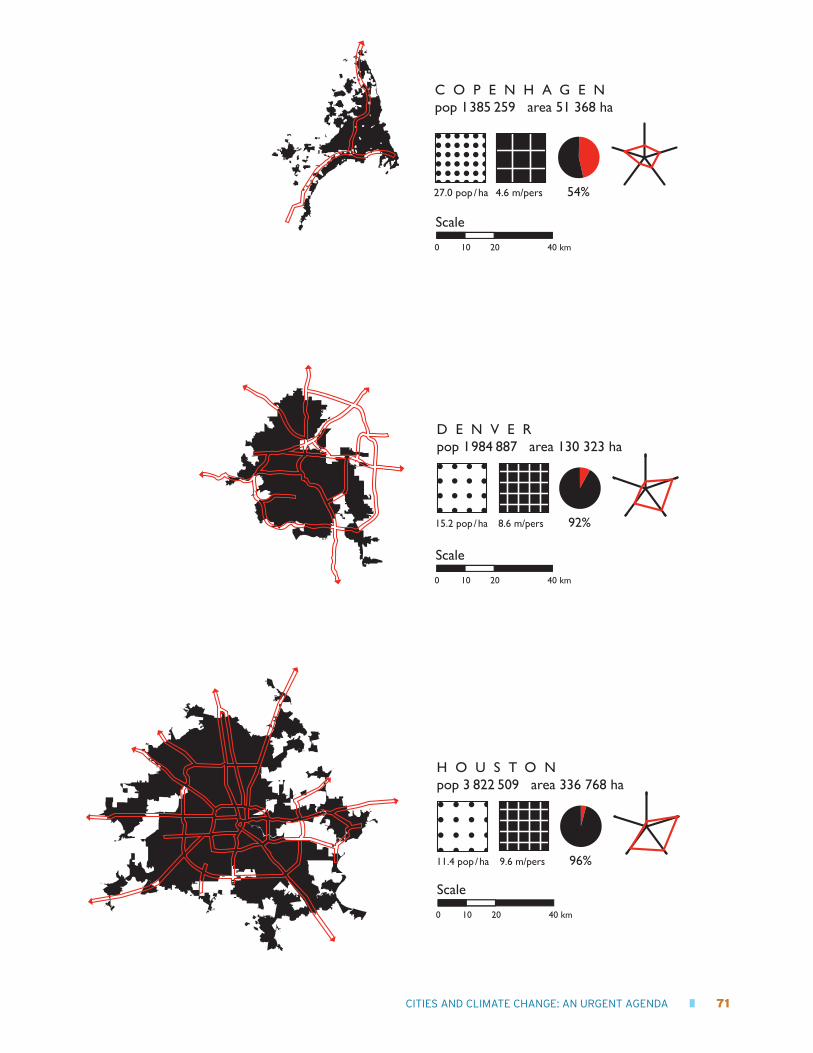
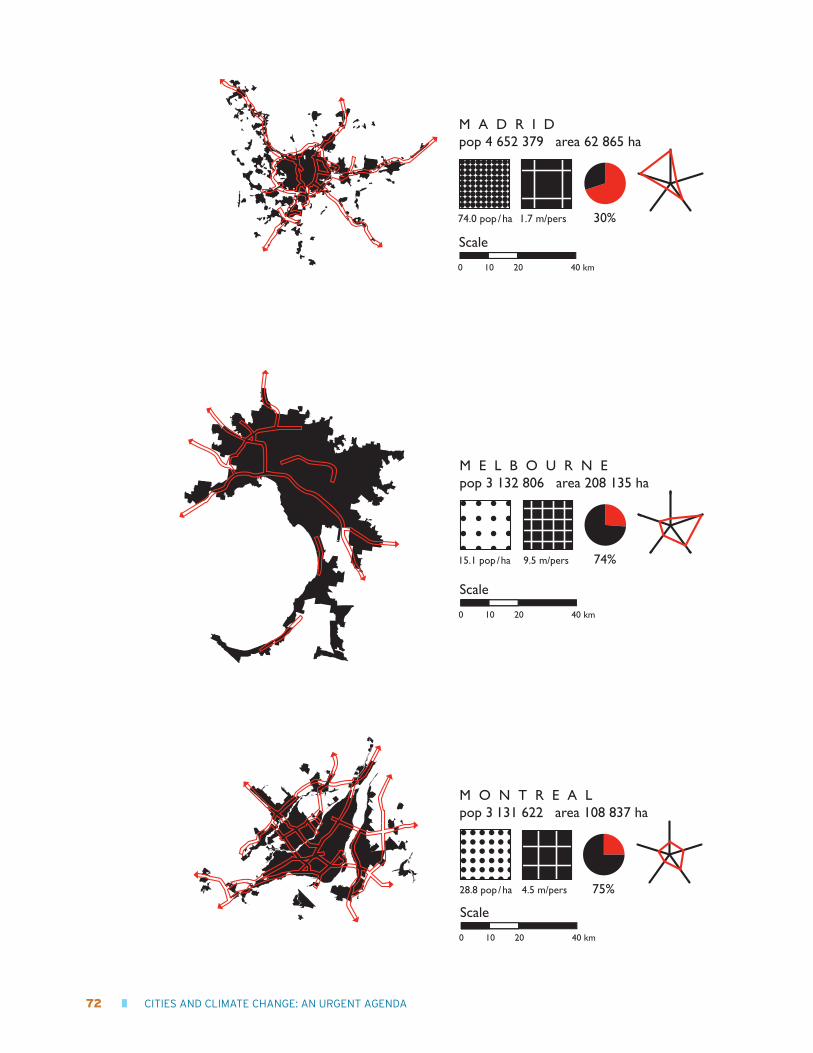
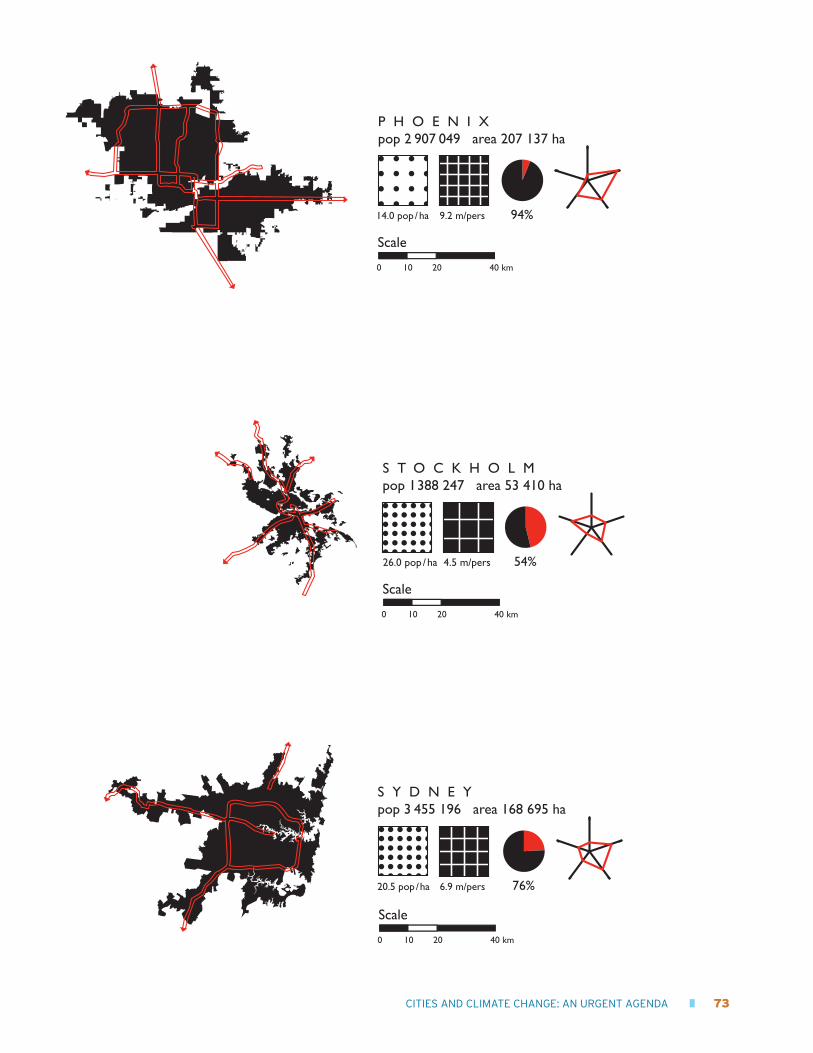
The pie diagrams indicate the proportion of all trips made by private motorized vehicle (mostly cars, trucks, and motorcycles) and public transit, walking, and cycling. The star-shaped Metropolitan Profile diagrams graphically display the transportation orientation of the urban regions using five variables. If a city’s red polygon is shifted toward the upper left, as seen in some European cities, it is more oriented toward public transit, walking, and cycling. If a city’s red polygon is shifted toward the bottom right, it is more automobile oriented. The numbers at the end of each arm indicate each scale’s maximum value.
Differing definitions and data make international comparisons of metropolitan regions difficult. Each region’s urbanized area map is based on a minimum population density and the contiguity of the built-up urban area, and adjusted to accommodate differences in settlement patterns. Only limited-access expressways are shown. Other roads and transit facilities such as subways and commuter railways are not mapped due large variations in their levels of service. For a complete description of data sources and mapping methodology, visit http://www.neptis.org/atlas/show.cfm?id=60&cat_id=29.
Data sources
Limited-access expresswayUrbanized area of the metropolitan region
0
75
75% 10
21 000 800
Public transit,walking, andcycling
Created by André Sorensen and Paul Hess, Department of Geography, University of Torontowith Zack Taylor & Marcy Burchfield (The Neptis Foundation) and Byron Moldofsky & Jo Ashley (The Cartography Office)© 2007 The Neptis Foundation. Printed in Canada.
INDICATORSTransportation mode share, centre-line road length, annual distance traveled by private motorized vehicle, and vehicle ownership statistics are from the Millennium Cities Database 2001 by J. Kenworthy and F. Laube, published by the Inter-national Association of Public Transport.
EXPRESSWAYS Expressways are compiled from local road atlases and checked against satellite imagery.
URBANIZED AREA DEFINITION The urbanized area for each city is generated from government data sources. For the European cities, the definition is based primarily on land uses that constitute the built-up urban fabric of a region. The extent of a European region is limited to those local municipalities that are contiguous to the central municipality and have a minimum population density of 4 people per hectare, a threshold employed by the US census bureau. For the U.S., Canadian and Australian cities, the definition is based on the urban area definitions employed by each country’s census bureau, a combination of population density measured within census geographic units and the contiguity of those census units. Some alterations were made to the urbanized area shapes to make them more comparable in area and extent. For the Canadian cities, the census-defined ‘urban area’ was used as a base and large, green spaces and agriculture reserve land at the edge were removed using local data sources. For the U.S. and Australian cities, census-defined ‘urban area’ and ‘urban centre-locality’ were not altered since comparable density thresholds and fine-grained census units were employed in the rule base. Sources: EUROPE Urbanized area & population: Corine land cover 2000 seamless vector database (CLC2000) in the form of Urban Morphological Zones with associated area and population data, European Environment Agency. Municipal boundaries: GfK MACON. AUSTRALIA Urbanized area & population: 2001 Urban Centre-Locality Structure, Australian Standard Geographical Classification, Australian Bureau of Statistics. CANADA Urbanized area & population: 2001 Urban Area, 2001 Census Dictionary, Statistics Canada; Green Zone, map in Greater Vancouver Regional District Livable Region Strategic Plan; vacant and urbanized spaces and decreed agricultural zones, map 5 in Planning Framework and Government Orientation for Montreal Metropolitan Region, 2001. USA Urbanized area & population: 2000 Urban Area Criteria, Federal Register, Volume 67, 51, March 15, 2002, US Bureau of Census and Department of Commerce.
0 –2
2–4
4–6
6–8
8–10
40+
30–40
20–30
10–20
0–10
70 � CITIES AND CLIMATE CHANGE: AN URGENT AGENDA
Scale
20100 40 km
A T L A N T A pop 3 499 840���area�511 952 ha
8.7 m/pers6.8 pop /ha 95%
Scale
20100 40 km
39.3 pop /ha 1.5 m/pers
B E R L I N pop 3 920 547���area�99 650 ha
44%
Scale
20100 40 km
C H I C A G O pop 8 307 904���area�554 720 ha
5.1 m/pers15.0 pop /ha 85%
CITIES AND CLIMATE CHANGE: AN URGENT AGENDA � 71
Scale
20100 40 km
27.0 pop /ha 4.6 m/pers
C O P E N H A G E N pop 1 385 259���area�51 368 ha
54%
Scale
20100 40 km
8.6 m/pers15.2 pop /ha
D E N V E Rpop 1 984 887���area�130 323 ha
92%
Scale
20100 40 km
H O U S T O Npop 3 822 509���area�336 768 ha
9.6 m/pers11.4 pop /ha 96%
72 � CITIES AND CLIMATE CHANGE: AN URGENT AGENDA
Scale
20100 40 km
74.0 pop /ha 1.7 m/pers
M A D R I Dpop 4 652 379���area�62 865 ha
30%
Scale
20100 40 km
M E L B O U R N E pop 3 132 806���area�208 135 ha
9.5 m/pers15.1 pop /ha 74%
Scale
20100 40 km
28.8 pop /ha 4.5 m/pers
M O N T R E A Lpop 3 131 622���area�108 837 ha
75%
CITIES AND CLIMATE CHANGE: AN URGENT AGENDA � 73
Scale
20100 40 km
9.2 m/pers14.0 pop /ha
P H O E N I Xpop 2 907 049���area�207 137 ha
94%
Scale
20100 40 km
26.0 pop /ha 4.5 m/pers
S T O C K H O L M pop 1 388 247���area�53 410 ha
54%
Scale
20100 40 km
S Y D N E Y pop 3 455 196���area�168 695 ha
6.9 m/pers20.5 pop /ha 76%
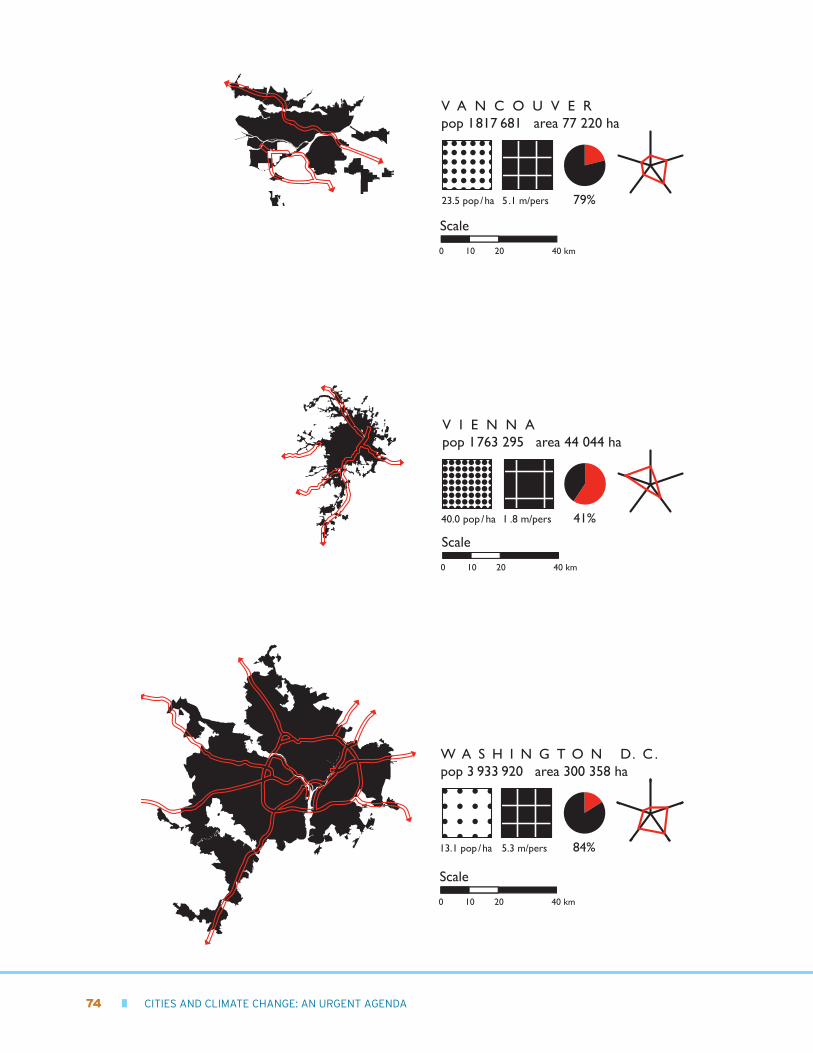
74 � CITIES AND CLIMATE CHANGE: AN URGENT AGENDA
Scale
20100 40 km
23.5 pop /ha 5 .1 m/pers
V A N C O U V E R pop 1 817 681���area�77 220 ha
79%
Scale
20100 40 km
40.0 pop /ha 1 .8 m/pers
V I E N N Apop�1 763 295���area�44 044�ha
41%
Scale
20100 40 km
5.3 m/pers13.1 pop /ha
W A S H I N G T O N D. C . pop 3 933 920���area�300 358 ha
84%
CITIES AND CLIMATE CHANGE: AN URGENT AGENDA � 75
SHANGHAI
AND
BEJING
Population Densities of Selected Metropolitan Regions, 2000
Chreod Group Inc.7 February 2010
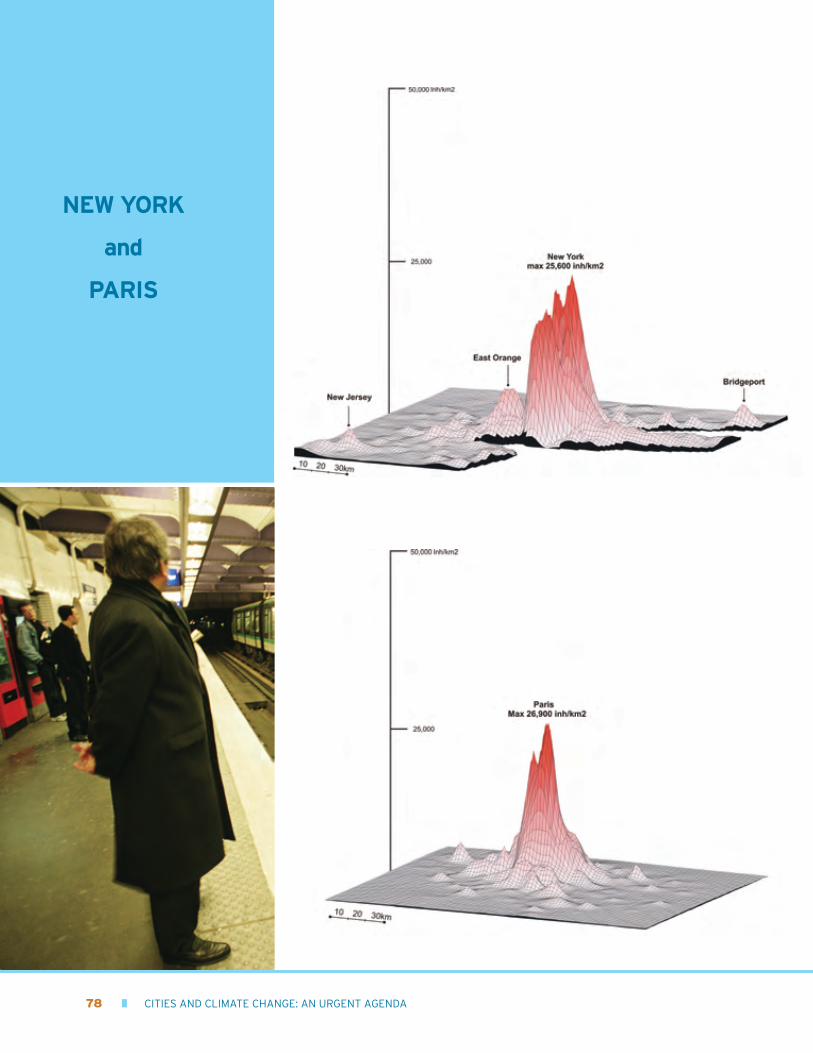
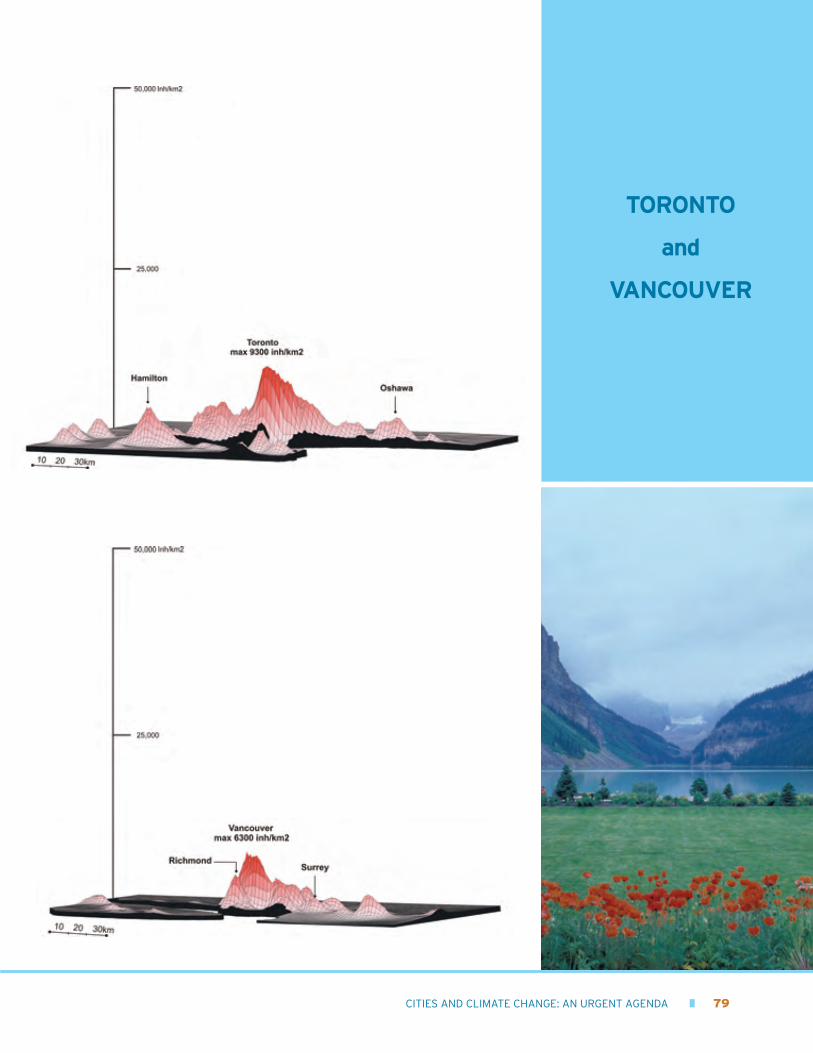
The following pages show three-dimensionalrepresentations of population densities (night-time) in selected metropolitan regions. Dataare for 2000 and, in some cases, 2001.Densities were calculated using 3D-Fieldsoftware using geo-referenced, small-areapopulation point data at the census tract scale.
Permission is given to the World Bank to use these imageswith the following attribution:
© 2010 Chreod Group Inc. All rights reserved.
76 � CITIES AND CLIMATE CHANGE: AN URGENT AGENDA
TOKYO
and
ATLANTA
CITIES AND CLIMATE CHANGE: AN URGENT AGENDA � 77
BOSTON
and
CHICAGO
78 � CITIES AND CLIMATE CHANGE: AN URGENT AGENDA
NEW YORK
and
PARIS
CITIES AND CLIMATE CHANGE: AN URGENT AGENDA � 79
TORONTO
and
VANCOUVER