Embed Size (px)
Citation preview

Annexes


In this chapter:
Annexes
Selected messages on ICT and public service delivery General Debate, 68th Session of the United Nations General Assembly (September 2013)
A key enabler to foster growth is the bold use of modern ICT solutions.
Mr. Toomas Hendrik Ilves, President of Estonia
Using the “state of the art” digital technology, the peo-ple are today getting more than 200 services from 4,582 digitalized Union Services and Information Centres. Rural women are also getting health care services from digitally inter-connected 15,500 Community Health Clinics and Un-ion Health Centres, which are reaching the health care ser-vices to the doorstep of the people. Advanced cell phone technologies are also providing services to over 100 million subscribers.
H.E. Mrs. Sheikh Hasina, Prime Minister, Bangladesh
In reforming and developing its information and commu-nication technology infrastructure, Fiji has adopted a com-prehensive approach by combining a national framework for lCT development with effective and pragmatic policies and initiatives to deliver results directly to the Fijian people.
H.E. Mr. Commodore Josaia V. Bainimarama, Prime Minis-ter, Fiji
In India, we promote inclusive development in multiple ways … Digital technology is being harnessed to improve the delivery of public services and benefits to the people.
H.E. Mr. Manmohan Singh, Prime Minister, India
We are proud to acknowledge that the Government has embarked on a new course of technological modernization to enable direct public access to government services. Our
Selected essage on ICT and public service delivery 181
Regional and subregional classification 183
Survey Methodology 185
A.1. Introduction 185
A.2. Telecommunication Infrastructure Index (TII) 187
A.3. Human Capital Index (HCI) 189
A.4. Online Service Index (OSI) 191
A.5. Challenges in reviewing a country’s online presence 193
A.6. E-Participation Index (EPI) 196
A.7. Country classifications and nomenclature in the survey 197
A.8. United Nations e-government knowledge base 198
Data Tables 199
Notes 249
References 257

182
Ann
exes
ANNEx UNITED NATIONS E-GOVERNMENT SURVEY 2014
aim is to make all such government services available electronically to all citizens by 2020 at any time, from anywhere, using modern communication technologies and devices such as computers, mobile phones and interactive payment offices. This kind of system will ensure real transparency in the relationship between citizens and public officials, combat corruption and reduce unnecessary bureaucracy.
H.E. Mr. Iurie Leanca, Prime Minister, Republic of Moldova
We are cognizant of the momentum and impact of information and communication technology as a tool that will assist in the development of the economy.
H.E. Mr. Denzil Douglas, Prime Minister, Saint Kitts and Nevis
Today, there are more than 20 million mobile phone users across Afghanistan, an increasing number of them accessing information and using various platforms on the internet.
H.E. Mr. Zalmai Rassoul, Minister of Foreign Affair, Afghanistan
One of the key elements that Azerbaijan is considering within the post-2015 agenda is information and communication technologies, which is a driving force of devel-opment and progress. To achieve the objective of ensuring improved access to lCTs, there is a need for intensified efforts towards enhancing regional synergies for promoting investment in ICT capacity building, refocusing tools and contents for addressing particular needs of the population and thus better deploying ICTs in the service of sustainable development. In this connection, Azerbaijan has put forward a proposal to establish the Eurasian Connectivity Alliance—a regional platform in support of improved connectivity and greater cooperation in the field of ICTs.
H.E. Mr. Elmar Maharram oglu Mammadyarov, Minister of Foreign Affairs, Azerbaijan,
Science and knowledge are considered as common rights for all mankind and the tremendous advances and developments that have been made over the years in applying and using modern technologies have become essential tools of everyday life for human beings within their scientific and intellectual creations. From this point of view, my country worked with steady pace to keep up with the development of knowledge in response to current needs and in anticipation of the future.
H.E. Mr. Yousef Bin Al-Alawi Bin Abdulla, Minister of Foreign Affairs, Oman
Source: http://gadebate.un.org/

183
Annexes
UNITED NATIONS E-GOVERNMENT SURVEY 2014
Regional and subregional classificationAFRICA AMERICA ASIA
Eastern Africa Caribbean Central AsiaBurundi Antigua and Barbuda Kazakhstan Comoros Bahamas Kyrgyzstan Djibouti Barbados Tajikistan Eritrea Cuba Turkmenistan Ethiopia Dominica Uzbekistan Kenya Dominican Republic Eastern AsiaMadagascar Grenada China Malawi Haiti Democratic People's Republic of Korea Mauritius Jamaica Japan Mozambique Saint Kitts and Nevis Mongolia Rwanda Saint Lucia Republic of Korea Seychelles Saint Vincent and the Grenadines South-Eastern AsiaSomalia Trinidad and Tobago Brunei Darussalam South Sudan Central America Cambodia Uganda Belize Indonesia United Republic of Tanzania Costa Rica Lao People's Democratic Republic Zambia El Salvador MalaysiaZimbabwe Guatemala Myanmar Middle Africa Honduras Philippines Angola Mexico Singapore Cameroon Nicaragua Thailand Central African Republic Panama Timor-LesteChad Northern America Viet Nam Congo Canada Southern AsiaDemocratic Republic of the Congo United States of America AfghanistanEquatorial Guinea South America Bangladesh Gabon Argentina Bhutan Sao Tome and Principe Bolivia (Plurinational State of) India Northern Africa Brazil Iran (Islamic Republic of) Algeria Chile MaldivesEgypt Colombia Nepal Libya Ecuador Pakistan Morocco Guyana Sri Lanka Sudan Paraguay Western AsiaTunisia Peru Armenia Southern Africa Suriname Azerbaijan Botswana Uruguay Bahrain Lesotho Venezuela (Bolivarian Republic of) Cyprus Namibia Georgia South Africa Iraq Swaziland Israel Western Africa Jordan Benin Kuwait Burkina Faso Lebanon Cape Verde Oman Côte d’Ivoire Qatar Gambia Saudi Arabia Ghana Syrian Arab Republic Guinea Turkey Guinea-Bissau United Arab Emirates Liberia Yemen Mali Mauritania Niger Nigeria Senegal Sierra Leone Togo
184
Ann
exes
ANNEx UNITED NATIONS E-GOVERNMENT SURVEY 2014
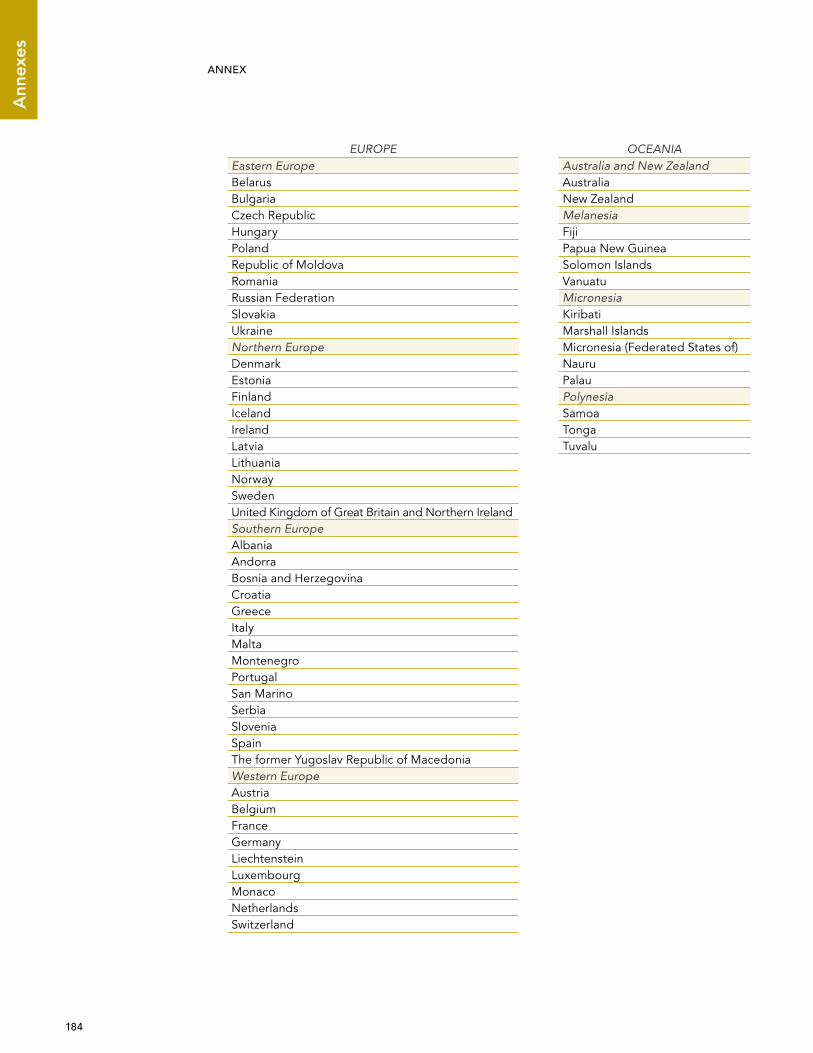
EUROPE OCEANIAEastern Europe Australia and New ZealandBelarus Australia Bulgaria New Zealand Czech Republic MelanesiaHungary Fiji Poland Papua New Guinea Republic of Moldova Solomon Islands Romania Vanuatu Russian Federation MicronesiaSlovakia Kiribati Ukraine Marshall Islands Northern Europe Micronesia (Federated States of) Denmark Nauru Estonia Palau Finland PolynesiaIceland Samoa Ireland Tonga Latvia Tuvalu Lithuania Norway Sweden United Kingdom of Great Britain and Northern IrelandSouthern EuropeAlbania Andorra Bosnia and Herzegovina Croatia Greece Italy Malta MontenegroPortugal San Marino SerbiaSlovenia Spain The former Yugoslav Republic of Macedonia Western EuropeAustriaBelgium FranceGermany LiechtensteinLuxembourgMonaco Netherlands Switzerland
185
Annexes
UNITED NATIONS E-GOVERNMENT SURVEY 2014
Survey methodology
A.1. IntroductionEvery two years, the United Nations Department of Economic and Social Af-fairs (UNDESA) through its Division for Public Administration and Development Management (DPADM) publishes the United Nations E-Government Survey. The Survey provides a snapshot with relative rankings of e-government development of all Member States of the United Nations.
By ranking the performance of countries on a relative scale, the Survey provides relevant information to support policy makers in shaping their e-government pro-grammes for development. As a composite indicator, the e-government develop-ment index (EGDI) is used to measure the willingness and capacity of national ad-ministrations to use information and communication technologies to deliver public services. This measure of the index is useful for government officials, policy mak-ers, researchers and representatives of civil society and the private sector to gain a deeper understanding of the comparative benchmarking of the relative position of a country in utilizing e-government for the delivery of inclusive, accountable and citizen-centric services.
The Survey provides insights of common themes and different strategies in de-velopment patterns among regions and across countries. By tracking the pro-gress of countries globally over time, the Survey seeks to better understand the challenges that the United Nations Member States face in developing their e-government programmes. The challenges include (a) how to promote greater use of e-government while ensuring equal access to services; (b) how to leverage resources to integrate new technologies into traditional development patterns while ensuring that such opportunities are fully utilized; (c) how to devise ap-propriate e-government strategies and policies that can help to overcome in-adequate human resources capabilities, infrastructure, as well as language and content. The Survey also highlights broad trends among countries and across re-gions. By providing better understanding of the emerging patterns of countries' performance across the world, the Survey contributes to the ongoing discussion of the critical role of ICT in development. The Survey also identifies countries and areas where the potential of ICT and e-government have not been yet fully exploited.
The EGDI is based on an expert assessment survey of the online presence of all 193 United Nations Member States, which assesses national websites and how e-government policies and strategies are applied in general and in specific sec-tors for delivery of essential services. The assessment rates the e-government performance of countries relative to one another as opposed to being an ab-solute measurement. The results are tabulated and combined with a set of in-dicators gauging a country’s capacity to participate in the information society, without which e-government development efforts are of limited immediate use.
186
Ann
exes
ANNEx UNITED NATIONS E-GOVERNMENT SURVEY 2014
Although the basic model has remained consistent, the precise meaning of these values varies from one edition of the Survey to the next as understanding of the potential of e-government changes and the underlying technology evolves. This is an important distinction because it also implies that it is a comparative frame-work that seeks to encompass various approaches that may evolve over time instead of advocating a linear path with an absolute goal.
Mathematically, the EGDI is a weighted average of three normalized scores on three most important dimensions of e-government, namely: scope and quality of online services (Online Service Index, OSI), development status of telecommuni-cation infrastructure (Telecommunication Infrastructure Index, TII) and inherent human capital (Human Capital Index, HCI). Each of these sets of indices is in itself a composite measure that can be extracted and analyzed independently.
EGDI = 13 (OSInormalized + TIInormalized + HCInormalized)
Prior to the normalization of the three component indicators, the Z-score stand-ardization procedure is implemented for each component indicator to ensure that the overall EGDI is equally decided by the three component indexes, i.e. each component index presents comparable variance subsequent to the Z-score standardization. In the absence of the Z-score standardization treatment, the EGDI would mainly depend on the component index with the greatest disper-sion. After the Z-score standardization, the arithmetic average sum becomes a good statistical indicator, where “equal weights” truly means “equal importance.”
For standard Z-score calculation of each component indicator:
xnew = x – μ
where:
x is a raw score to be standardized;
μ is the mean of the population;
σ is the standard deviation of the population.
The composite value of each component index is then normalized to fall be-tween the range of 0 to 1 and the overall EGDI is derived by taking the arithmetic average of the three component indexes.
As indicated, the EGDI is used as a benchmark to provide a numerical ranking of e-government development across United Nations Member States, yet this ap-proach has its own weaknesses.
The methodological framework for the United Nations E-Government Develop-ment Index has remained consistent across the Survey editions. At the same time, the Survey has been adjusted to reflect emerging trends of e-government strategies, evolving knowledge of best practices in e-government, changes in technology and other factors, and data collection practices have been periodi-cally refined.
σ

187
Annexes
UNITED NATIONS E-GOVERNMENT SURVEY 2014
A.2. Telecommunication Infrastructure Index (TII)Research shows that every 10 point increase in broadband penetration increases economic growth rates, on average, by 1.38 per cent in low- and middle-income countries.1 Ten years ago, there were only eight cell phones for every 100 people in the developing world while today there are almost 90,2 opening opportunities for tens of millions of people who previously felt marginalised or isolated and unable to participate fully in society and engage with others. In this context, the influence of mobile broadband in the overall telecommunication infrastructure in any one nation is important.
Given the availability of suitable data,3 a new wireless broadband subscription indicator was included in the computation of Telecommunication Infrastructure Index (TII) in the 2014 Survey. The TII is an arithmetic average composite of five indicators: estimated internet users per 100 inhabitants, number of main fixed telephone lines per 100 inhabitants, number of mobile subscribers per 100 in-habitants, number of wireless broadband subscriptions per 100 inhabitants and number of fixed broadband subscriptions per 100 inhabitants. The International Telecommunication Union is the primary source of data in each case.
The TII has remained largely unchanged since 2002, except for the replacement of online population with fixed-broadband subscription and the removal of num-ber of television sets in 2008; the replacement of personal computer (PC) users with fixed Internet subscriptions in 2012; and the replacement of fixed Internet subscriptions with wireless broadband subscriptions in 2014.
The improvement of data quality and coverage has led to reduction in some data gaps that appeared in prior Surveys. However, in the case where gaps still occurred, data was retrieved firstly from the Word Bank data base; and secondly, when all pre-vious measures proved unsuccessful, the most recent ITU data was used.
Each of these indicators was standardized via the Z-score procedure to derive the Z-score for each component indicator. The telecommunication infrastructure composite value for country “x” is the simple arithmetic mean of the five stand-ardized indicators derived this way:
Figure A.1. The three components of the E-Government Development Index (EGDI)
OSI1/3
TII1/3
HCI1/3
EGDI
OSI—Online Service Index
TII—TelecommunicationInfrastructure Index
HCI—Human Capital Index

188
Ann
exes
ANNEx UNITED NATIONS E-GOVERNMENT SURVEY 2014
Telecommunication infrastructure composite value=
Arithmetic Mean ( Internet user Z-score + Telephone line Z-score + Mobile subscription Z-score + Wireless broadband subscription Z-score + Fixed broadband Z-score)
Finally, the TII composite value is normalized by taking its value for a given coun-try, subtracting the lowest composite value in the Survey and dividing by the range of composite values for all countries. For example, if country “x” has the composite value of 1.3813, and the lowest composite value for all countries is -1.1358 and the highest is 2.3640, then the normalized value of TII for country “x” would be:
Telecommunication Infrastructure Index (Country “x”) = [1.3813–(–1.1358)]
[2.3640–(–1.1358)] = 0.7192
Table A.1. Telecommunication Infrastructure Index and changes of its components (2003–2014)
TII (2002) TII (2003) TII (2004) TII (2005) TII (2008) TII (2010) TII (2012) TII (2014)
Internet users Internet users Internet users Internet users Internet users Internet users Internet users Internet users
Online population
Online population
Online population
Online population
Fixed- broadband subscriptions
Fixed- broadband subscriptions
Fixed- broadband subscriptions
Fixed- broadband subscriptions
Personal computer (PC) users
Personal computer (PC) users
Personal computer (PC) users
Personal computer (PC) users
Personal computer (PC) users
Personal computer (PC) users
Fixed Internet subscriptions
Wireless broadband subscriptions
Fixed-telephone subscriptions
Fixed-telephone subscriptions
Fixed-telephone subscriptions
Fixed-telephone subscriptions
Fixed-telephone subscriptions
Fixed-telephone subscriptions
Fixed-telephone subscriptions
Fixed-telephone subscriptions
Mobile-cellular subscriptions
Mobile-cellular subscriptions
Mobile-cellular subscriptions
Mobile-cellular subscriptions
Mobile-cellular subscriptions
Mobile-cellular subscriptions
Mobile-cellular subscriptions
Mobile-cellular subscriptions
Television sets
Television sets
Television sets
Television sets
- - - -
TII
1/5 1/5
1/51/5
1/5
Mobile-cellularsubscriptions (per 100)
Fixed-telephonesubscriptions (per 100)
Individuals using the Internet(% population)
Fixed (wired)-broadbandsubscriptions (per 100)
Wireless broadbandsubscriptions (per 100)
Figure A.2. Telecommunication Infrastructure Index (TII) and its components
189
Annexes
UNITED NATIONS E-GOVERNMENT SURVEY 2014
A.3. Human Capital Index (HCI)The 2014 Survey introduced two new components to the Human Capital Index (HCI), namely (i) expected years of schooling; and (ii) average years of schooling. A study was conducted to analyze the behaviour of the new HCI. The effects of introducing new components, i.e. the expected years of schooling and the mean years of schooling, were investigated and the impact was evaluated with par-ticular attention on significant changes in the calculation of HCI. The preliminary statistical study commissioned by DPADM validated the use of the new HCI, ac-centuating that the two new components has strengthened the HCI and it does not introduce any error.
These were added to two existing components of adult literacy rate and the combined primary, secondary and tertiary gross enrolment ratio which had been used for the past Surveys since 2002. This addition also echoed the call of the United Nations Secretary-General’s Report4 “A life of dignity for all: accelerat-ing progress towards the Millennium Development Goals and advancing the United Nations development agenda beyond 2015, transformative and mutu-ally reinforcing actions to provide quality education and lifelong learning were highlighted, amongst others, as essential for development. It was stressed that young people should be able to receive high-quality education and learning, from early childhood development to post-primary schooling, including not only formal schooling but also life skills and vocational education and training.
The definitions of the four indicators of HCI are:
1. Adult literacy is measured as the percentage of people aged 15 years and above who can, with understanding, both read and write a short simple state-ment on their everyday life.
2. Gross enrolment ratio is measured as the combined primary, secondary and tertiary gross enrolment ratio, of the total number of students enrolled at the primary, secondary and tertiary level, regardless of age, as a percentage of the population of school age for that level.
3. Expected years of schooling is the total number of years of schooling which a child of a certain age can expect to receive in the future, assuming that the probability of his or her being in school at any particular age is equal to the cur-rent enrolment ratio age.5
4. Mean years of schooling (MYS) provides the average number of years of education completed by a a country’s adult population (25 years and older), ex-cluding the years spent repeating grades.6
The HCI is a weighted average composite of the four indicators. Similar to calcu-lating the TII, each of the four component indicators is first standardized via the Z-score procedure to derive the Z-score value for each component indicator. The human capital composite value for country “x” is the weighted arithmetic mean with one-third weight assigned to adult literacy rate and two-ninth weight as-signed to the gross enrolment ratio, estimate years of schooling and mean years of schooling derived this way:

190
Ann
exes
ANNEx UNITED NATIONS E-GOVERNMENT SURVEY 2014
Human capital composite value = 1/₃ x Adult literacy rate Z-score + 2/₉ x Gross enrolment ratio Z-score + 2/₉ x Expected years of schooling Z-score + 2/₉ x Mean years of schooling Z-score
Then, the human capital composite value is normalized by taking its composite value for a given country, subtracting the lowest composite value in the Survey and dividing by the range of composite values for all countries. For example, if coun-try “x” has the composite value at 0.8438, and the lowest composite value for all countries is –3.2354 and the highest equal to 1.2752, then the normalized value of the Human Capital Index for country “x” would be:
Human Capital Index (Country “x”) = [0.8438–(–3.2354)]
[1.2752–(–3.2354)] = 0.9044
Missing data for mean years of schoolingFor countries with missing data on the mean years of schooling (MYS) component the MYS is calculated by UNDP using UNESCO as a source and the 2010 Barro and Lee methodology.7 This methodology makes at least five assumptions in de-termining the MYS estimate and it is based on the following steps:
• The other three components of the HCI, for all the nations, have been used as an input of a linkage cluster algorithm. The components of the HCI are all connected because they all refer to education and culture.
Table A.2. Human Capital Index and changes of its components (2003–2014)
Components of HCI in past Surveys (2002, 2003, 2004, 2005, 2008, 2010, 2012) Components of HCI in 2014 Survey
Adult literacy Adult literacy
Gross enrolment ratio Gross enrolment ratio
- Expected years of schooling
- Mean years of schooling
Figure A.3. Human Capital Index (HCI) and its components
HCI
1/3
2/9
2/92/9
Adult literacy (%)
Gross enrolment ratio (%) Expected years of schooling
Mean years of schooling

191
Annexes
UNITED NATIONS E-GOVERNMENT SURVEY 2014
• It has been verified that these clusters are composed by countries with similar MYS values.
• The aim is to assign to nations with missing MYS value the average of the clus-ter they belong to.
• Tests have been applied to the results in order to verify the consistency of the results.
A.4. Online Service Index (OSI)Taking into account the new and emerging trends since 2012 the 2014 Survey questionnaire was improved to encompass the new developments with a focus on:
• the rising importance of a whole-of government approach and integrated on-line service delivery;
• the use of e-government to provide information and services to citizens on environment related issues;
• e-infrastructure and its increasing role in bridging the digital divide, with a particular emphasis on the provision of effective online services for the inclu-sion of disadvantaged and vulnerable groups, such as the poor, the disabled, women, children and youth, the elderly, minorities, etc;
• the increasing emphasis on service usage, multichannel service delivery, ’open government data’, e-procurement;
• the expansion of e-participation and mobile government.
The outcome was an enhanced Survey instrument with a wider range of point dis-tributions reflecting differences in levels of e-government development among countries.
To arrive at a set of Online Service Index values, more than 90 researchers -quali-fied graduate students and volunteers from universities in the field of public ad-ministration—assessed each country’s national website in the native language, including the national portal, e-services portal and e-participation portal, as well as the websites of the related ministries of education, labour, social services, health, finance and environment as applicable.
To ensure consistency of assessments, all the researchers were provided with a rigorous training by e-government and online service delivery experts, with years of experience in conducting the assessments. All the researchers were guided by a Data Team Coordinator who provided support and guidance throughout the assessment period. Researchers were instructed and trained to assume the mind-set of an average citizen user in assessing sites. Thus, responses were gen-erally based on whether the relevant features could be found and accessed eas-ily, not whether they in fact exist although hidden somewhere on the sites. While it is possible, although implausible, to search the sites meticulously for all content and features, this approach misses the key point that the average user needs to find information and features quickly and intuitively for a site to be “usable” with content readily discoverable by the intended beneficiaries.
192
Ann
exes
ANNEx UNITED NATIONS E-GOVERNMENT SURVEY 2014
The data collection and Survey research ran from May 2013 until the end of June 2013. Each country was assessed by at least two researchers who conducted the Survey in the country’s national language in May-June. After the initial assess-ment, the evaluations by the two researchers on each country were compared and questions with discrepancies were reviewed again by the researchers. The third phase, from July to August, was the final review by the Data Team Coor-dinators who analyzed all the answers and, where needed, carried out further review and verification processes using multiple methods and sources before the scores were sent for approval by a senior researcher. Through this multilevel ap-proach, all surveyed sites were thoroughly assessed by at least three people, one of whom has years of experience in assessing public sector online services and reviewed by one of the Data Team Coordinators.
Once the evaluation phase was completed, the statistics team produced the first draft of the OSI ranking. The data was extracted from the platform and the raw OSI scores were created. Rankings were compared with previous OSI scores, and any discrepancies were reviewed thoroughly.
The Survey questionnaire is organized in specific thematic sets of questions (subthemes) structured in four patterns corresponding to the four stages of e-government development (see Figure A.4). The patterns have been designed to provide a qualitative assessment within a rigorous quantitative methodology. Each question calls for a binary response. Every positive answer generates a new “more in depth question” inside and across the patterns. For the 2014 Survey questionnaire, the thematic subthemes identified are:
• Whole-of-government;
• Multichannel service delivery;
• Bridging the digital divide;
• Increasing usage;
• Open Government;
• E-participation.
The outcome is an enhanced quantitative Survey with a wider range of point dis-tributions reflecting differences in levels of e-government development among countries.
The total number of points scored by each country is normalized to the range of 0 to 1. The online index value for a given country is equal to the actual total score less the lowest total score divided by the range of total score values for all countries. For example, if country “x” has a score of 114, and the lowest score of any country is 0 and the highest equal to 153, then the online services value for country “x” would be:
Online Service Index (Country “x”) = (114–0)
(153–0) = 0.7451

193
Annexes
UNITED NATIONS E-GOVERNMENT SURVEY 2014
A.5. Challenges in reviewing a country’s online presence
Selecting the appropriate site/URL at the national level
The United Nations Member States are sent an invitation to provide information regarding their website addresses (URL) for different government ministries and the national portal(s). Information was also requested with regards to URLs for open government data, e-participation and the designated authority in charge of e-government policies. 80 Member States returned this information, compared to 50 in 2012. All appropriate sites are then utilized during the verification process.
One of the essential decisions for researchers when undertaking this Survey is to identify the specific site(s) to review as the national government site for each country. Regardless of the sophistication of e-government in a specific country, the priority for users is to find a clear indication as to which of the many poten-tially available government sites could be deemed as the “official” national gov-ernment site—in a sense, the gateway or starting point for national users. Not only is this fairly easy to do—a simple, clear statement at the chosen website is sufficient to start—but also an important step towards providing government information and services to the public in an integrated, usable and easy-to-find manner. Many countries have in fact engaged in the procedure of actually not-ing on their national site that it is their “official” Government site, or “Gateway to Government,” or other such statement.
Yet not all countries provided the appropriate URLs. Thus, some discretion is exerted when deciding whether to use the country-provided websites. What is noteworthy in this Survey is that the researchers not only reviewed the national portals but also undertook exhaustive research on e-participation and open gov-ernment data where applicable.
One dilemma facing researchers is that a number of countries provide more than one apparently legitimate national access point. While some have simply not yet consolidated their government entry points into a single site or portal that could be clearly distinguished, others have actually taken this approach on purpose—offering different access points to different audiences. Considering that the use of integrated portals or multi-portals is emerging as a trend in e-government strategies worldwide, researchers would select the integrated website as a Na-tional Portal or other portal if it were deemed to be the official homepage of the government. However, more than one site could be scored if they were clearly part of a tightly integrated “network” of national sites. It should be noted that for those countries for which more than one site was assessed, having more than one national entry is neither a disadvantage nor a benefit.
Some countries do not offer certain public services at the federal level, but rather at the sub-national or local level. No country is penalized for offering a service at the sub-national level as opposed to the federal level per se. In fact, when the issue arises researchers tend to be inclusive in assessing the matter as long as the information and/or service can be found from the national level.

194
Ann
exes
ANNEx UNITED NATIONS E-GOVERNMENT SURVEY 2014
A more difficult problem arises when not only a specific service is located at the local level but when the entire ministerial functions are altogether missing at the national level. If researchers are unable to locate a ministry as per the above de-scribed method, then the final step is to find out whether the country in question actually has such a ministry at the national level or whether the functions might be locally administered.
Integrated portal and multi-portal approachesSome countries have adopted a different approach to their online e-government portal, through utilizing multiple websites for different topics. Hence, instead of centralizing all the e-services, e-participation and forms in one portal, they have been made available on separate websites for a more audience-targeted ap-proach. Researchers made sure to examine all possible websites when making the assessment, through links or search engines, to cover all government web-sites where relative information can be found.
Even though the norm has been to follow a one-stop-shop type of service deliv-ery and an integrated portal approach, countries who have used a decentralized approach have not been penalized in their score, and the assessment was con-ducted as though for a single portal.
For example, Finland has a website www.valtioneuvosto.fi which is the informa-tion portal of the Finnish Government, whereas the website www.suomi.fi is the e-service and public service information portal with also open government data. Information on e-participation is centralized on the websites www.kansalaisa-loite.fi and otakantaa.fi. This approach of having several websites for different purposes (information, services, participation and open government data) is typi-cal of several European countries.
Accessing websites in national official languagesThe research team was fully equipped to handle the six official languages of the United Nations, namely Arabic, Chinese, English, French, Russian and Spanish. However, as in previous Survey cycles, the team went beyond this mandate and made an effort to review each website in the official language of the country or, where that was not possible, in another of the languages available on the site. Translators provided assistance as necessary so that possible errors based on language have been reduced to a minimum.
Data quality checksIn order to ensure the data quality, UNDESA has put Survey procedures under close monitoring including developing a standard web-based application plat-form for data collection and storage, preparing the methodological and training guidelines for researchers and instituting a training programme for either group training or individual hands-on support for researchers to resolve thorny issues. Among other tasks, team members were asked to justify the selection of URLs and indicate whether the URLs had been reviewed in past Surveys. Regular meet-ings were held to discuss concerns and ensure consistency of evaluation methods.

195
Annexes
UNITED NATIONS E-GOVERNMENT SURVEY 2014
UNDESA applied the Survey scores to generate an ordering of online service pres-ence of all United Nations Member States and compared them with the historical results in previous Surveys so as to detect possible shortcomings in the process. The new scores are then compared to scores from the previous Surveys by remov-ing the new questions and only considering the ones that remain unchanged.
The team was assisted in the research by United Nations interns and volunteers with language skills not otherwise covered by the core group.
Stage 1 Emerging information services
Government websites provide information on public policy, governance, laws, regulations, rel-evant documentation and types of government services provided. They have links to ministries, departments and other branches of government. Citizens are able to obtain updated information in the national government and ministries and can follow links to archived information.
Stage 2 Enhanced information services
Government websites deliver enhanced one-way or simple two-way e-communication between government and citizen, such as downloadable forms for government services and applications. The sites have audio and video capabilities and are multi-lingual. Some limited e-services enable citizens to submit requests for non-electronic forms or personal information.
Stage 3 Transactional services
Government websites engage in two-way communication with their citizens, including request-ing and receiving inputs on government policies, programmes, regulations, etc. Some form of electronic authentication of the citizen’s identity is required to successfully complete the ex-change. Government websites process non-financial transactions, e.g. filing taxes online or ap-plying for certificates, licences and permits. They also handle financial transactions, i.e. where money is transferred on a secure network.
Stage 4 connected services
Government websites have changed the way governments communicate with their citizens. They are proactive in requesting information and opinions from the citizens using Web 2.0 and other interactive tools. E-services and e-solutions cut across the departments and ministries in a seam-less manner, information, data and knowledge is transferred from government agencies through integrated applications. Governments have moved from a government-centric to a citizen-cen-tric approach, where e-services are targeted to citizens through life cycle events and segmented groups to provide tailor-made services. Governments create an environment that empowers citizens to be more involved with government activities to have a voice in decision-making.
Figure A.4. The four stages of online service development
Connected
Transactional
Enhanced
Emerging
196
Ann
exes
ANNEx UNITED NATIONS E-GOVERNMENT SURVEY 2014
Towards a more citizen-centric approachIn line with the global trend towards a more citizen-centric approach as driven by the demand for greater efficiency and cost-effectiveness of the public sector, the Survey questionnaire has been designed to reflect this paradigm of e-gov-ernment. As mentioned above, user take-up has been included as one special subject in the Survey, which encourages the governments to take account not only of the supply side but also the demand side of e-services. Accordingly, the research team was instructed to enforce this approach consistently throughout the whole Survey. If features could not be found easily, quickly and intuitively, then a site would score poorly.
A.6. E-Participation Index (EPI)The e-participation index (EPI) is derived as a supplementary index to the UN E-Government Survey. It extends the dimension of the Survey by focusing on the use of online services to facilitate provision of information by governments to citizens (“e-information sharing”), interaction with stakeholders (“e-consultation”) and en-gagement in decision-making processes (“e-decision making”). (see Box A.1)
A country’s EPI reflects on e-participation facilities that are deployed by the gov-ernment as compared to all other countries. The purpose of this measure is not to prescribe any particular practice, but rather to offer insight into how different countries are using online tools to promote interaction between citizen and gov-ernment, as well as among citizens, for the benefit of all. As the EPI is a qualitative assessment based on the availability and relevancy of participatory services avail-able on government websites, the comparative ranking of countries is for illustra-tive purposes and should serve only as indicative of the broad trends in promoting citizen engagement. As with the EGDI, the EPI is not intended as absolute meas-urement of e-participation, but rather, it attempts to capture the e-participation performance of counties relative to one another at a particular point in time.
In the 2014 Survey, the e-participation questions were carefully reviewed and expanded to reflect current trends and modalities in how governments engage their citizens in public policy-making, implementation and evaluation. New ques-tions were added to address data publishing and sharing by government agen-cies. Other features and updates were made included the availability of informa-tion on the citizens’ rights to access government information, providing outcome on feedback received from citizens concerning the improvement of its online services, providing the tools in order to obtain public opinion for public policy deliberation through social media, online polls, petition tools, voting tools, on-line-bulletin boards and online discussion forums. While the EPI provides a useful qualitative analytical tool when comparing the data and ranking of countries for one particular year, caution must be taken in comparing e-participation rankings with past editions of the Survey.
Mathematically, the EPI is normalized by taking the total score value for a given country subtracting the lowest total score for any country in the Survey and divid-ing by the range of total score values for all countries. For example, if country “x”

197
Annexes
UNITED NATIONS E-GOVERNMENT SURVEY 2014
has an e-participation score of 29, and the lowest value of any country is 0 and the highest equal to 38, then the normalized index value for country “x” would be:
E-Participation Index (Country “x”) = 29–0
38–0 = 0.7632
In 2014, the e-participation ranking of countries is determined by the value of EPI through the “standard competition ranking”. In standard competition ranking, countries with the same EPI receive the same ranking number and a gap is left in the ranking numbers. This ranking strategy is adopted in view that if two or more countries tie for a position in the ranking, the positions of all those ranked below them are unaffected. For example, if country A ranks ahead of B and C, both of which share the same EPI value and scores ahead of D, then A is ranked first (1st), B and C are ranked second (2nd) and D is ranked fourth (4th). In 2012, the “modified competition ranking” was used and for comparison reasons, all ranks are adjusted using the standard competition ranking.
A.7. Country classifications and nomenclature in the Survey
Regional groupings are taken from the classification of the United Nations Statistics Division. For details, see http://unstats.un.org/unsd/methods/m49/m49regin.htm.
‘There is no established convention for the designation of “developed” and “de-veloping” countries or areas in the United Nations system. In common practice, Japan in Asia, Canada and the United States in northern America, Australia and New Zealand in Oceania and Europe are considered “developed” regions or areas. In international trade statistics, the Southern African Customs Union is also treated as a developed region and Israel as a developed country; countries emerging from the former Yugoslavia are treated as developing countries; and countries of Eastern Europe and of the Commonwealth of Independent States in Europe are not included under either developed or developing regions.’
Economies are divided according to 2012 GNI per capita, calculated using the World Bank Atlas method. The groups are: low income, US $1,025 or less; lower middle income, US $1,026–US $4,035; upper middle income, US $4,036–US $12,475; and high income, US $12,476 or more.
A.1. E-Participation framework
• E-information: Enabling participation by providing citizens with public in-formation and access to information without or upon demand
• E-consultation: Engaging citizens in contributions to and deliberation on public policies and services
• E-decision-making: Empowering citizens through co-design of policy op-tions and co-production of service components and delivery modalities.

198
Ann
exes
ANNEx UNITED NATIONS E-GOVERNMENT SURVEY 2014
For details, see http://data.worldbank.org/about/country-classifications.
This report uses the terminology ‘developed’ and ‘developing’ countries in line with the United Nations practice and keeping in mind the familiarity of the aver-age reader with common usage. Wherever data and statistics are reported by in-come groups, the report classifies countries according to the World Bank income classification of high, middle and low income groups.
The lists of least developing countries, landlocked developing countries and small island developing countries were obtained from the United Nations Office of the High Representative for the Least Developed Countries, Landlocked De-veloping Countries and Small Island Developing States (UN-OHRLLS).
For details, see http://www.unohrlls.org/en/ldc/25/
A.8. United Nations e-government knowledge baseThe Division for Public Administration and Development Management of the United Nations Department of Economic and Social Affairs is maintaining the United Nations e-government knowledge base (egovkb) to provide governments and all stakeholders an easy access to data and information on e-government development.
The egovkb is an interactive tool to view, sort and download information and datasets in open data formats from the 2014 UN E-Government Survey and pre-vious editions (2003, 2004, 2005, 2008, 2010 and 2012). The egovkb also in-cludes advanced research features such as customisable regional and country comparisons, rankings and country profiles.
For more information and details, see the United Nations e-Government Knowl-edge Base at http://unpan3.un.org/egovkb/

199
Annexes
UNITED NATIONS E-GOVERNMENT SURVEY 2014
Data tables
1. E-Government Development Index
Rank Country EGDIOnline Service
ComponentTelecomm. Infra structure
ComponentHuman Capital
Component
173 Afghanistan 0.1900 0.1811 0.1472 0.2418
84 Albania 0.5046 0.4488 0.3548 0.7100
136 Algeria 0.3106 0.0787 0.1989 0.6543
43 Andorra 0.6426 0.4331 0.7671 0.7277
140 Angola 0.2970 0.2992 0.0978 0.4941
60 Antigua and Barbuda 0.5927 0.4173 0.5938 0.7669
46 Argentina 0.6306 0.5512 0.4835 0.8571
61 Armenia 0.5897 0.6142 0.3889 0.7660
2 Australia 0.9103 0.9291 0.8041 0.9978
20 Austria 0.7912 0.7480 0.7597 0.8660
68 Azerbaijan 0.5472 0.4331 0.4605 0.7480
92 Bahamas 0.4900 0.3386 0.4176 0.7138
18 Bahrain 0.8089 0.9370 0.7055 0.7840
148 Bangladesh 0.2757 0.3465 0.0941 0.3866
59 Barbados 0.5933 0.2205 0.6730 0.8865
55 Belarus 0.6053 0.3228 0.6069 0.8861
25 Belgium 0.7564 0.6772 0.6988 0.8932
120 Belize 0.3774 0.3780 0.1530 0.6012
180 Benin 0.1685 0.1102 0.1196 0.2756
143 Bhutan 0.2829 0.2441 0.1755 0.4290
103 Bolivia (Plurinational State of) 0.4562 0.3937 0.2324 0.7424
97 Bosnia and Herzegovina 0.4707 0.2835 0.3998 0.7288
112 Botswana 0.4198 0.3071 0.2969 0.6555
57 Brazil 0.6008 0.5984 0.4668 0.7372
86 Brunei Darussalam 0.5042 0.3622 0.3690 0.7815
73 Bulgaria 0.5421 0.2362 0.5941 0.7960
178 Burkina Faso 0.1804 0.2992 0.0842 0.1578
172 Burundi 0.1928 0.0157 0.0233 0.5393
139 Cambodia 0.2999 0.1732 0.2075 0.5189
144 Cameroon 0.2782 0.1969 0.0958 0.5421
11 Canada 0.8418 0.9134 0.7168 0.8952
127 Cape Verde 0.3551 0.1654 0.2966 0.6032
187 Central African Republic 0.1257 0.0394 0.0280 0.3099
189 Chad 0.1076 0.0472 0.0415 0.2341
33 Chile 0.7122 0.8189 0.4940 0.8236

200
Ann
exes
ANNEx UNITED NATIONS E-GOVERNMENT SURVEY 2014
Rank Country EGDIOnline Service
ComponentTelecomm. Infra structure
ComponentHuman Capital
Component
70 China 0.5450 0.6063 0.3554 0.6734
50 Colombia 0.6173 0.7874 0.3297 0.7348
177 Comoros 0.1808 0.0157 0.0604 0.4662
160 Congo 0.2570 0.1024 0.1453 0.5233
54 Costa Rica 0.6061 0.6142 0.4461 0.7582
171 Côte d’Ivoire 0.2039 0.1732 0.1392 0.2992
47 Croatia 0.6282 0.4646 0.6271 0.7928
116 Cuba 0.3917 0.2283 0.0969 0.8497
58 Cyprus 0.5958 0.4724 0.5320 0.7828
53 Czech Republic 0.6070 0.3701 0.5753 0.8755
149 Democratic People’s Republic of Korea 0.2753 0.0079 0.0173 0.8007
183 Democratic Republic of the Congo 0.1551 0.0472 0.0337 0.3845
16 Denmark 0.8162 0.6614 0.8740 0.9132
184 Djibouti 0.1456 0.0630 0.0556 0.3182
110 Dominica 0.4338 0.1890 0.4424 0.6701
107 Dominican Republic 0.4481 0.3858 0.2945 0.6639
83 Ecuador 0.5053 0.4803 0.3318 0.7037
80 Egypt 0.5129 0.5906 0.3571 0.5912
88 El Salvador 0.4989 0.5354 0.3198 0.6414
168 Equatorial Guinea 0.2268 0.0315 0.1200 0.5288
192 Eritrea 0.0908 0.0000 0.0000 0.2723
15 Estonia 0.8180 0.7717 0.7934 0.8889
157 Ethiopia 0.2589 0.4567 0.0266 0.2934
85 Fiji 0.5044 0.3937 0.2872 0.8322
10 Finland 0.8449 0.7717 0.8594 0.9037
4 France 0.8938 1.0000 0.8003 0.8812
131 Gabon 0.3294 0.0945 0.2260 0.6677
167 Gambia 0.2285 0.2047 0.1482 0.3326
56 Georgia 0.6047 0.5984 0.4261 0.7895
21 Germany 0.7864 0.6693 0.8038 0.8862
123 Ghana 0.3735 0.3150 0.2444 0.5613
34 Greece 0.7118 0.6063 0.6549 0.8741
78 Grenada 0.5220 0.3465 0.4029 0.8166
133 Guatemala 0.3160 0.1496 0.2713 0.5272
190 Guinea 0.0954 0.0000 0.0504 0.2359
182 Guinea-Bissau 0.1609 0.0079 0.0878 0.3869
124 Guyana 0.3695 0.2441 0.2344 0.6301
176 Haiti 0.1809 0.1102 0.0952 0.3372
114 Honduras 0.4083 0.4016 0.1951 0.6281
39 Hungary 0.6637 0.5591 0.5654 0.8668
1. E-Government Development Index (continued)

201
Annexes
UNITED NATIONS E-GOVERNMENT SURVEY 2014
Rank Country EGDIOnline Service
ComponentTelecomm. Infra structure
ComponentHuman Capital
Component
19 Iceland 0.7970 0.6142 0.8591 0.9178
118 India 0.3834 0.5433 0.1372 0.4698
106 Indonesia 0.4487 0.3622 0.3054 0.6786
105 Iran (Islamic Republic of) 0.4508 0.3701 0.2940 0.6882
134 Iraq 0.3141 0.1969 0.2173 0.5283
22 Ireland 0.7810 0.6772 0.7039 0.9619
17 Israel 0.8162 0.8740 0.7200 0.8545
23 Italy 0.7593 0.7480 0.6747 0.8552
109 Jamaica 0.4388 0.3150 0.2753 0.7262
6 Japan 0.8874 0.9449 0.8553 0.8621
79 Jordan 0.5167 0.5197 0.3104 0.7202
28 Kazakhstan 0.7283 0.7480 0.5749 0.8619
119 Kenya 0.3805 0.4252 0.1612 0.5552
132 Kiribati 0.3201 0.2126 0.0665 0.6812
49 Kuwait 0.6268 0.5748 0.5862 0.7194
101 Kyrgyzstan 0.4657 0.2756 0.3801 0.7413
152 Lao People’s Democratic Republic 0.2659 0.1417 0.1618 0.4941
31 Latvia 0.7178 0.7008 0.6237 0.8288
89 Lebanon 0.4982 0.3543 0.4030 0.7374
153 Lesotho 0.2629 0.1575 0.1179 0.5135
179 Liberia 0.1768 0.0787 0.0763 0.3754
121 Libya 0.3753 0.0157 0.3281 0.7821
35 Liechtenstein 0.6982 0.5118 0.7468 0.8361
29 Lithuania 0.7271 0.7559 0.5697 0.8557
24 Luxembourg 0.7591 0.6220 0.8723 0.7830
155 Madagascar 0.2606 0.2441 0.0488 0.4889
166 Malawi 0.2321 0.1732 0.0484 0.4746
52 Malaysia 0.6115 0.6772 0.4455 0.7119
94 Maldives 0.4813 0.3622 0.3952 0.6865
181 Mali 0.1634 0.1339 0.1350 0.2212
40 Malta 0.6518 0.4016 0.7683 0.7855
142 Marshall Islands 0.2851 0.1102 0.0448 0.7002
174 Mauritania 0.1893 0.0472 0.1626 0.3581
76 Mauritius 0.5338 0.4724 0.4406 0.6882
63 Mexico 0.5733 0.6614 0.3139 0.7445
130 Micronesia (Federated States of) 0.3337 0.1890 0.1099 0.7023
38 Monaco 0.6715 0.2205 1.0000 0.7940
65 Mongolia 0.5581 0.6142 0.2714 0.7887
45 Montenegro 0.6346 0.5276 0.5481 0.8279
82 Morocco 0.5060 0.6929 0.3350 0.4901
1. E-Government Development Index (continued)

202
Ann
exes
ANNEx UNITED NATIONS E-GOVERNMENT SURVEY 2014
Rank Country EGDIOnline Service
ComponentTelecomm. Infra structure
ComponentHuman Capital
Component
164 Mozambique 0.2384 0.3150 0.0545 0.3457
175 Myanmar 0.1869 0.0236 0.0084 0.5288
117 Namibia 0.3880 0.3228 0.2719 0.5693
145 Nauru 0.2776 0.0551 0.2159 0.5617
165 Nepal 0.2344 0.1575 0.1684 0.3774
5 Netherlands 0.8897 0.9291 0.8175 0.9224
9 New Zealand 0.8644 0.8425 0.7506 1.0000
147 Nicaragua 0.2759 0.0945 0.1692 0.5639
191 Niger 0.0946 0.1260 0.0385 0.1192
141 Nigeria 0.2929 0.3071 0.1905 0.3811
13 Norway 0.8357 0.7559 0.8133 0.9380
48 Oman 0.6273 0.7323 0.4873 0.6624
158 Pakistan 0.2580 0.3228 0.1174 0.3337
108 Palau 0.4415 0.1654 0.3592 0.7999
77 Panama 0.5242 0.3701 0.4571 0.7455
188 Papua New Guinea 0.1203 0.0079 0.0530 0.3000
122 Paraguay 0.3740 0.2283 0.2236 0.6700
72 Peru 0.5435 0.6299 0.2718 0.7289
95 Philippines 0.4768 0.4803 0.2451 0.7051
42 Poland 0.6482 0.5433 0.5618 0.8396
37 Portugal 0.6900 0.6378 0.6094 0.8227
44 Qatar 0.6362 0.6535 0.5879 0.6671
1 Republic of Korea 0.9462 0.9764 0.9350 0.9273
66 Republic of Moldova 0.5571 0.5276 0.4236 0.7201
64 Romania 0.5632 0.4409 0.4385 0.8100
27 Russian Federation 0.7296 0.7087 0.6413 0.8388
125 Rwanda 0.3589 0.5118 0.0828 0.4820
90 Saint Kitts and Nevis 0.4980 0.1339 0.6321 0.7279
104 Saint Lucia 0.4525 0.2441 0.4000 0.7133
113 Saint Vincent and the Grenadines 0.4158 0.1575 0.3810 0.7088
111 Samoa 0.4204 0.2441 0.2672 0.7499
62 San Marino 0.5823 0.2756 0.6358 0.8354
169 Sao Tome and Principe 0.2218 0.0079 0.1398 0.5177
36 Saudi Arabia 0.6900 0.7717 0.5523 0.7461
151 Senegal 0.2666 0.3071 0.1644 0.3283
69 Serbia 0.5472 0.3937 0.4681 0.7796
81 Seychelles 0.5113 0.3307 0.4721 0.7310
186 Sierra Leone 0.1329 0.0472 0.0821 0.2692
3 Singapore 0.9076 0.9921 0.8793 0.8515
51 Slovakia 0.6148 0.4882 0.5296 0.8265
1. E-Government Development Index (continued)

203
Annexes
UNITED NATIONS E-GOVERNMENT SURVEY 2014
Rank Country EGDIOnline Service
ComponentTelecomm. Infra structure
ComponentHuman Capital
Component
41 Slovenia 0.6505 0.4252 0.6193 0.9072
170 Solomon Islands 0.2087 0.0551 0.1008 0.4702
193 Somalia 0.0139 0.0157 0.0259 0.0000
93 South Africa 0.4869 0.3858 0.3466 0.7282
185 South Sudan 0.1418 0.0079 0.0141 0.4035
12 Spain 0.8410 0.9449 0.6629 0.9152
74 Sri Lanka 0.5418 0.6535 0.2341 0.7376
154 Sudan 0.2606 0.2913 0.1847 0.3059
115 Suriname 0.4045 0.1417 0.3968 0.6749
138 Swaziland 0.3056 0.1339 0.1629 0.6200
14 Sweden 0.8225 0.7008 0.8866 0.8802
30 Switzerland 0.7267 0.5039 0.8199 0.8562
135 Syrian Arab Republic 0.3134 0.1575 0.1992 0.5835
129 Tajikistan 0.3395 0.0630 0.2306 0.7249
102 Thailand 0.4631 0.4409 0.2843 0.6640
96 The former Yugoslav Republic of Macedonia
0.4720 0.2441 0.4521 0.7198
161 Timor-Leste 0.2528 0.2047 0.0704 0.4831
162 Togo 0.2446 0.1102 0.0836 0.5401
98 Tonga 0.4706 0.3465 0.2348 0.8304
91 Trinidad and Tobago 0.4932 0.3307 0.4543 0.6945
75 Tunisia 0.5390 0.6378 0.3074 0.6717
71 Turkey 0.5443 0.5591 0.3605 0.7133
128 Turkmenistan 0.3511 0.0866 0.2189 0.7478
137 Tuvalu 0.3059 0.0394 0.1761 0.7022
156 Uganda 0.2593 0.1496 0.1011 0.5271
87 Ukraine 0.5032 0.2677 0.3802 0.8616
32 United Arab Emirates 0.7136 0.8819 0.5932 0.6657
8 United Kingdom of Great Britain and Northern Ireland
0.8695 0.8976 0.8534 0.8574
146 United Republic of Tanzania 0.2764 0.2992 0.0808 0.4492
7 United States of America 0.8748 0.9449 0.7406 0.9390
26 Uruguay 0.7420 0.8504 0.5607 0.8148
100 Uzbekistan 0.4695 0.4488 0.2333 0.7264
159 Vanuatu 0.2571 0.0787 0.1188 0.5736
67 Venezuela (Bolivarian Republic of) 0.5564 0.5512 0.3495 0.7685
99 Viet Nam 0.4705 0.4173 0.3792 0.6148
150 Yemen 0.2720 0.3071 0.1249 0.3840
163 Zambia 0.2389 0.1417 0.1247 0.4504
126 Zimbabwe 0.3585 0.3071 0.2238 0.5445
1. E-Government Development Index (continued)

204
Ann
exes
ANNEx UNITED NATIONS E-GOVERNMENT SURVEY 2014
Regional and Economic Groupings
Country EGDIOnline Service
ComponentTelecomm. Infrastructure
ComponentHuman Capital
Component
Africa 0.2661 0.2011 0.1478 0.4492
Americas 0.5074 0.4216 0.3805 0.7202
Asia 0.4951 0.4652 0.3584 0.6615
Europe 0.6936 0.5695 0.6678 0.8434
Oceania 0.4086 0.2621 0.2564 0.7073
World 0.4712 0.3919 0.3650 0.6566
EGDIOnline Service
ComponentTelecomm. Infrastructure
ComponentHuman Capital
Component
Small Island Developing States 0.4069 0.2520 0.3033 0.6654
Land Locked Developing Countries 0.3368 0.2710 0.2025 0.5368
Least Developed Countries 0.2121 0.1475 0.0929 0.3960
EGDIOnline Service
ComponentTelecomm. Infrastructure
ComponentHuman Capital
Component
High Income 0.7207 0.6503 0.6845 0.8343
Upper Middle Income 0.4828 0.3709 0.3522 0.7253
Lower Middle Income 0.3523 0.3076 0.2307 0.5787
Low Income 0.2094 0.1523 0.0876 0.3884

205
Annexes
UNITED NATIONS E-GOVERNMENT SURVEY 2014
2. E-Government Development Index by region—AFRICA
Rank Country Sub-region EGDIOnline Service Component
Telecomm. Infrastructure Component
Human Capital Component
136 Algeria Northern Africa 0.3106 0.0787 0.1989 0.6543
140 Angola Middle Africa 0.2970 0.2992 0.0978 0.4941
180 Benin Western Africa 0.1685 0.1102 0.1196 0.2756
112 Botswana Southern Africa 0.4198 0.3071 0.2969 0.6555
178 Burkina Faso Western Africa 0.1804 0.2992 0.0842 0.1578
172 Burundi Eastern Africa 0.1928 0.0157 0.0233 0.5393
144 Cameroon Middle Africa 0.2782 0.1969 0.0958 0.5421
127 Cape Verde Western Africa 0.3551 0.1654 0.2966 0.6032
187 Central African Republic
Middle Africa 0.1257 0.0394 0.0280 0.3099
189 Chad Middle Africa 0.1076 0.0472 0.0415 0.2341
177 Comoros Eastern Africa 0.1808 0.0157 0.0604 0.4662
160 Congo Middle Africa 0.2570 0.1024 0.1453 0.5233
171 Côte d’Ivoire Western Africa 0.2039 0.1732 0.1392 0.2992
183 Democratic Republic of the Congo
Middle Africa 0.1551 0.0472 0.0337 0.3845
184 Djibouti Eastern Africa 0.1456 0.0630 0.0556 0.3182
80 Egypt Northern Africa 0.5129 0.5906 0.3571 0.5912
168 Equatorial Guinea Middle Africa 0.2268 0.0315 0.1200 0.5288
192 Eritrea Eastern Africa 0.0908 0.0000 0.0000 0.2723
157 Ethiopia Eastern Africa 0.2589 0.4567 0.0266 0.2934
131 Gabon Middle Africa 0.3294 0.0945 0.2260 0.6677
167 Gambia Western Africa 0.2285 0.2047 0.1482 0.3326
123 Ghana Western Africa 0.3735 0.3150 0.2444 0.5613
190 Guinea Western Africa 0.0954 0.0000 0.0504 0.2359
182 Guinea-Bissau Western Africa 0.1609 0.0079 0.0878 0.3869
119 Kenya Eastern Africa 0.3805 0.4252 0.1612 0.5552
153 Lesotho Southern Africa 0.2629 0.1575 0.1179 0.5135
179 Liberia Western Africa 0.1768 0.0787 0.0763 0.3754
121 Libya Northern Africa 0.3753 0.0157 0.3281 0.7821
155 Madagascar Eastern Africa 0.2606 0.2441 0.0488 0.4889
166 Malawi Eastern Africa 0.2321 0.1732 0.0484 0.4746
181 Mali Western Africa 0.1634 0.1339 0.1350 0.2212
174 Mauritania Western Africa 0.1893 0.0472 0.1626 0.3581
76 Mauritius Eastern Africa 0.5338 0.4724 0.4406 0.6882
82 Morocco Northern Africa 0.5060 0.6929 0.3350 0.4901
164 Mozambique Eastern Africa 0.2384 0.3150 0.0545 0.3457
117 Namibia Southern Africa 0.3880 0.3228 0.2719 0.5693
191 Niger Western Africa 0.0946 0.1260 0.0385 0.1192
141 Nigeria Western Africa 0.2929 0.3071 0.1905 0.3811

206
Ann
exes
ANNEx UNITED NATIONS E-GOVERNMENT SURVEY 2014
Rank Country Sub-region EGDIOnline Service Component
Telecomm. Infrastructure Component
Human Capital Component
125 Rwanda Eastern Africa 0.3589 0.5118 0.0828 0.4820
169 Sao Tome and Principe Middle Africa 0.2218 0.0079 0.1398 0.5177
151 Senegal Western Africa 0.2666 0.3071 0.1644 0.3283
81 Seychelles Eastern Africa 0.5113 0.3307 0.4721 0.7310
186 Sierra Leone Western Africa 0.1329 0.0472 0.0821 0.2692
193 Somalia Eastern Africa 0.0139 0.0157 0.0259 0.0000
93 South Africa Southern Africa 0.4869 0.3858 0.3466 0.7282
185 South Sudan Eastern Africa 0.1418 0.0079 0.0141 0.4035
154 Sudan Northern Africa 0.2606 0.2913 0.1847 0.3059
138 Swaziland Southern Africa 0.3056 0.1339 0.1629 0.6200
162 Togo Western Africa 0.2446 0.1102 0.0836 0.5401
75 Tunisia Northern Africa 0.5390 0.6378 0.3074 0.6717
156 Uganda Eastern Africa 0.2593 0.1496 0.1011 0.5271
146 United Republic of Tanzania
Eastern Africa 0.2764 0.2992 0.0808 0.4492
163 Zambia Eastern Africa 0.2389 0.1417 0.1247 0.4504
126 Zimbabwe Eastern Africa 0.3585 0.3071 0.2238 0.5445
2. E-Government Development Index by region—AFRICA (continued)

207
Annexes
UNITED NATIONS E-GOVERNMENT SURVEY 2014
3. E-Government Development Index by region—AMERICAS
Rank Country Sub-region EGDIOnline Service
Component
Telecomm. Infrastructure Component
Human Capital Component
60 Antigua and Barbuda Caribbean 0.5927 0.4173 0.5938 0.7669
46 Argentina South America 0.6306 0.5512 0.4835 0.8571
92 Bahamas Caribbean 0.4900 0.3386 0.4176 0.7138
59 Barbados Caribbean 0.5933 0.2205 0.6730 0.8865
120 Belize Central America 0.3774 0.3780 0.1530 0.6012
103 Bolivia (Plurinational State of) South America 0.4562 0.3937 0.2324 0.7424
57 Brazil South America 0.6008 0.5984 0.4668 0.7372
11 Canada Northern America
0.8418 0.9134 0.7168 0.8952
33 Chile South America 0.7122 0.8189 0.4940 0.8236
50 Colombia South America 0.6173 0.7874 0.3297 0.7348
54 Costa Rica Central America 0.6061 0.6142 0.4461 0.7582
116 Cuba Caribbean 0.3917 0.2283 0.0969 0.8497
110 Dominica Caribbean 0.4338 0.1890 0.4424 0.6701
107 Dominican Republic Caribbean 0.4481 0.3858 0.2945 0.6639
83 Ecuador South America 0.5053 0.4803 0.3318 0.7037
88 El Salvador Central America 0.4989 0.5354 0.3198 0.6414
78 Grenada Caribbean 0.5220 0.3465 0.4029 0.8166
133 Guatemala Central America 0.3160 0.1496 0.2713 0.5272
124 Guyana South America 0.3695 0.2441 0.2344 0.6301
176 Haiti Caribbean 0.1809 0.1102 0.0952 0.3372
114 Honduras Central America 0.4083 0.4016 0.1951 0.6281
109 Jamaica Caribbean 0.4388 0.3150 0.2753 0.7262
63 Mexico Central America 0.5733 0.6614 0.3139 0.7445
147 Nicaragua Central America 0.2759 0.0945 0.1692 0.5639
77 Panama Central America 0.5242 0.3701 0.4571 0.7455
122 Paraguay South America 0.3740 0.2283 0.2236 0.6700
72 Peru South America 0.5435 0.6299 0.2718 0.7289
90 Saint Kitts and Nevis Caribbean 0.4980 0.1339 0.6321 0.7279
104 Saint Lucia Caribbean 0.4525 0.2441 0.4000 0.7133
113 Saint Vincent and the Grenadines Caribbean 0.4158 0.1575 0.3810 0.7088
115 Suriname South America 0.4045 0.1417 0.3968 0.6749
91 Trinidad and Tobago Caribbean 0.4932 0.3307 0.4543 0.6945
7 United States of America Northern America
0.8748 0.9449 0.7406 0.9390
26 Uruguay South America 0.7420 0.8504 0.5607 0.8148
67 Venezuela (Bolivarian Republic of) South America 0.5564 0.5512 0.3495 0.7685

208
Ann
exes
ANNEx UNITED NATIONS E-GOVERNMENT SURVEY 2014
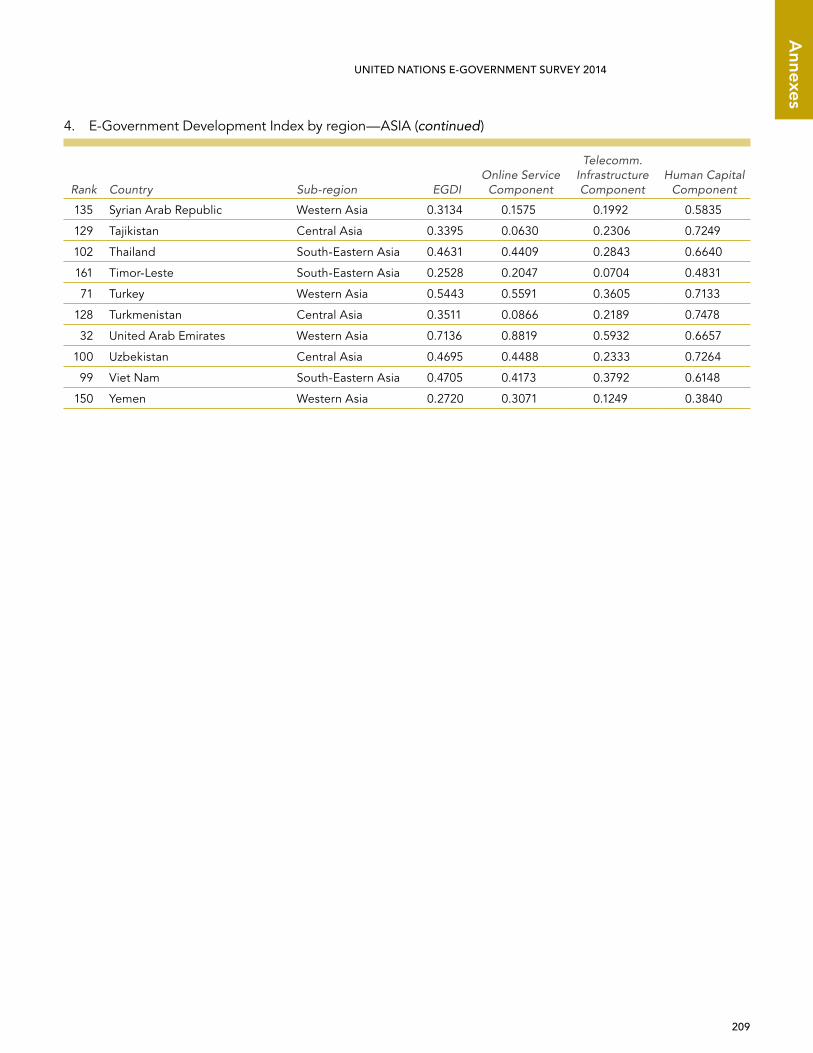
4. E-Government Development Index by region—ASIA
Rank Country Sub-region EGDIOnline Service
Component
Telecomm. Infrastructure Component
Human Capital Component
173 Afghanistan Southern Asia 0.1900 0.1811 0.1472 0.2418
61 Armenia Western Asia 0.5897 0.6142 0.3889 0.7660
68 Azerbaijan Western Asia 0.5472 0.4331 0.4605 0.7480
18 Bahrain Western Asia 0.8089 0.9370 0.7055 0.7840
148 Bangladesh Southern Asia 0.2757 0.3465 0.0941 0.3866
143 Bhutan Southern Asia 0.2829 0.2441 0.1755 0.4290
86 Brunei Darussalam South-Eastern Asia 0.5042 0.3622 0.3690 0.7815
139 Cambodia South-Eastern Asia 0.2999 0.1732 0.2075 0.5189
70 China Eastern Asia 0.5450 0.6063 0.3554 0.6734
58 Cyprus Western Asia 0.5958 0.4724 0.5320 0.7828
149 Democratic People’s Republic of Korea
Eastern Asia 0.2753 0.0079 0.0173 0.8007
56 Georgia Western Asia 0.6047 0.5984 0.4261 0.7895
118 India Southern Asia 0.3834 0.5433 0.1372 0.4698
106 Indonesia South-Eastern Asia 0.4487 0.3622 0.3054 0.6786
105 Iran (Islamic Republic of) Southern Asia 0.4508 0.3701 0.2940 0.6882
134 Iraq Western Asia 0.3141 0.1969 0.2173 0.5283
17 Israel Western Asia 0.8162 0.8740 0.7200 0.8545
6 Japan Eastern Asia 0.8874 0.9449 0.8553 0.8621
79 Jordan Western Asia 0.5167 0.5197 0.3104 0.7202
28 Kazakhstan Central Asia 0.7283 0.7480 0.5749 0.8619
49 Kuwait Western Asia 0.6268 0.5748 0.5862 0.7194
101 Kyrgyzstan Central Asia 0.4657 0.2756 0.3801 0.7413
152 Lao People’s Democratic Re-public
South-Eastern Asia 0.2659 0.1417 0.1618 0.4941
89 Lebanon Western Asia 0.4982 0.3543 0.4030 0.7374
52 Malaysia South-Eastern Asia 0.6115 0.6772 0.4455 0.7119
94 Maldives Southern Asia 0.4813 0.3622 0.3952 0.6865
65 Mongolia Eastern Asia 0.5581 0.6142 0.2714 0.7887
175 Myanmar South-Eastern Asia 0.1869 0.0236 0.0084 0.5288
165 Nepal Southern Asia 0.2344 0.1575 0.1684 0.3774
48 Oman Western Asia 0.6273 0.7323 0.4873 0.6624
158 Pakistan Southern Asia 0.2580 0.3228 0.1174 0.3337
95 Philippines South-Eastern Asia 0.4768 0.4803 0.2451 0.7051
44 Qatar Western Asia 0.6362 0.6535 0.5879 0.6671
1 Republic of Korea Eastern Asia 0.9462 0.9764 0.9350 0.9273
36 Saudi Arabia Western Asia 0.6900 0.7717 0.5523 0.7461
3 Singapore South-Eastern Asia 0.9076 0.9921 0.8793 0.8515
74 Sri Lanka Southern Asia 0.5418 0.6535 0.2341 0.7376
209
Annexes
UNITED NATIONS E-GOVERNMENT SURVEY 2014
Rank Country Sub-region EGDIOnline Service
Component
Telecomm. Infrastructure Component
Human Capital Component
135 Syrian Arab Republic Western Asia 0.3134 0.1575 0.1992 0.5835
129 Tajikistan Central Asia 0.3395 0.0630 0.2306 0.7249
102 Thailand South-Eastern Asia 0.4631 0.4409 0.2843 0.6640
161 Timor-Leste South-Eastern Asia 0.2528 0.2047 0.0704 0.4831
71 Turkey Western Asia 0.5443 0.5591 0.3605 0.7133
128 Turkmenistan Central Asia 0.3511 0.0866 0.2189 0.7478
32 United Arab Emirates Western Asia 0.7136 0.8819 0.5932 0.6657
100 Uzbekistan Central Asia 0.4695 0.4488 0.2333 0.7264
99 Viet Nam South-Eastern Asia 0.4705 0.4173 0.3792 0.6148
150 Yemen Western Asia 0.2720 0.3071 0.1249 0.3840
4. E-Government Development Index by region—ASIA (continued)

210
Ann
exes
ANNEx UNITED NATIONS E-GOVERNMENT SURVEY 2014
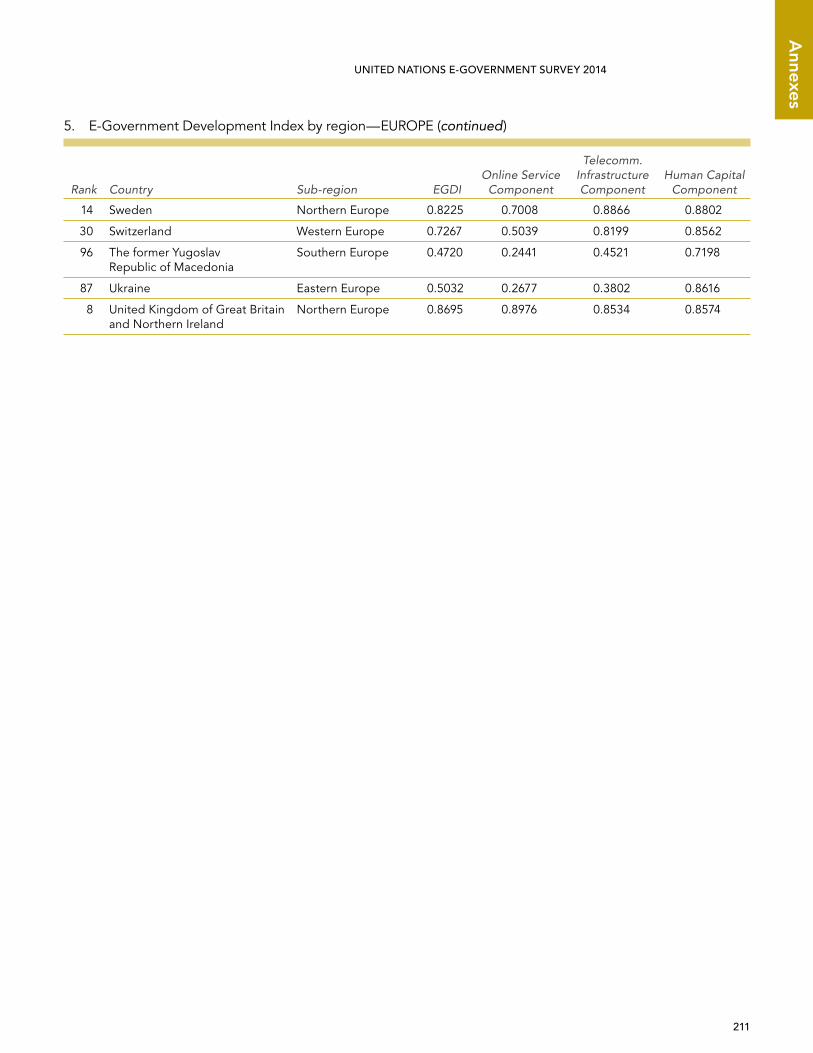
5. E-Government Development Index by region—EUROPE
Rank Country Sub-region EGDIOnline Service
Component
Telecomm. Infrastructure Component
Human Capital Component
84 Albania Southern Europe 0.5046 0.4488 0.3548 0.7100
43 Andorra Southern Europe 0.6426 0.4331 0.7671 0.7277
20 Austria Western Europe 0.7912 0.7480 0.7597 0.8660
55 Belarus Eastern Europe 0.6053 0.3228 0.6069 0.8861
25 Belgium Western Europe 0.7564 0.6772 0.6988 0.8932
97 Bosnia and Herzegovina Southern Europe 0.4707 0.2835 0.3998 0.7288
73 Bulgaria Eastern Europe 0.5421 0.2362 0.5941 0.7960
47 Croatia Southern Europe 0.6282 0.4646 0.6271 0.7928
53 Czech Republic Eastern Europe 0.6070 0.3701 0.5753 0.8755
16 Denmark Northern Europe 0.8162 0.6614 0.8740 0.9132
15 Estonia Northern Europe 0.8180 0.7717 0.7934 0.8889
10 Finland Northern Europe 0.8449 0.7717 0.8594 0.9037
4 France Western Europe 0.8938 1.0000 0.8003 0.8812
21 Germany Western Europe 0.7864 0.6693 0.8038 0.8862
34 Greece Southern Europe 0.7118 0.6063 0.6549 0.8741
39 Hungary Eastern Europe 0.6637 0.5591 0.5654 0.8668
19 Iceland Northern Europe 0.7970 0.6142 0.8591 0.9178
22 Ireland Northern Europe 0.7810 0.6772 0.7039 0.9619
23 Italy Southern Europe 0.7593 0.7480 0.6747 0.8552
31 Latvia Northern Europe 0.7178 0.7008 0.6237 0.8288
35 Liechtenstein Western Europe 0.6982 0.5118 0.7468 0.8361
29 Lithuania Northern Europe 0.7271 0.7559 0.5697 0.8557
24 Luxembourg Western Europe 0.7591 0.6220 0.8723 0.7830
40 Malta Southern Europe 0.6518 0.4016 0.7683 0.7855
38 Monaco Western Europe 0.6715 0.2205 1.0000 0.7940
45 Montenegro Southern Europe 0.6346 0.5276 0.5481 0.8279
5 Netherlands Western Europe 0.8897 0.9291 0.8175 0.9224
13 Norway Northern Europe 0.8357 0.7559 0.8133 0.9380
42 Poland Eastern Europe 0.6482 0.5433 0.5618 0.8396
37 Portugal Southern Europe 0.6900 0.6378 0.6094 0.8227
66 Republic of Moldova Eastern Europe 0.5571 0.5276 0.4236 0.7201
64 Romania Eastern Europe 0.5632 0.4409 0.4385 0.8100
27 Russian Federation Eastern Europe 0.7296 0.7087 0.6413 0.8388
62 San Marino Southern Europe 0.5823 0.2756 0.6358 0.8354
69 Serbia Southern Europe 0.5472 0.3937 0.4681 0.7796
51 Slovakia Eastern Europe 0.6148 0.4882 0.5296 0.8265
41 Slovenia Southern Europe 0.6505 0.4252 0.6193 0.9072
12 Spain Southern Europe 0.8410 0.9449 0.6629 0.9152
211
Annexes
UNITED NATIONS E-GOVERNMENT SURVEY 2014
Rank Country Sub-region EGDIOnline Service
Component
Telecomm. Infrastructure Component
Human Capital Component
14 Sweden Northern Europe 0.8225 0.7008 0.8866 0.8802
30 Switzerland Western Europe 0.7267 0.5039 0.8199 0.8562
96 The former Yugoslav Republic of Macedonia
Southern Europe 0.4720 0.2441 0.4521 0.7198
87 Ukraine Eastern Europe 0.5032 0.2677 0.3802 0.8616
8 United Kingdom of Great Britain and Northern Ireland
Northern Europe 0.8695 0.8976 0.8534 0.8574
5. E-Government Development Index by region—EUROPE (continued)

212
Ann
exes
ANNEx UNITED NATIONS E-GOVERNMENT SURVEY 2014
6. E-Government Development Index by region—OCEANIA
Rank Country Sub-region EGDIOnline Service
Component
Telecomm. Infrastructure Component
Human Capital Component
2 Australia Australia and New Zealand
0.9103 0.9291 0.8041 0.9978
85 Fiji Melanesia 0.5044 0.3937 0.2872 0.8322
132 Kiribati Micronesia 0.3201 0.2126 0.0665 0.6812
142 Marshall Islands Micronesia 0.2851 0.1102 0.0448 0.7002
130 Micronesia (Federated States of)
Micronesia 0.3337 0.1890 0.1099 0.7023
145 Nauru Micronesia 0.2776 0.0551 0.2159 0.5617
9 New Zealand Australia and New Zealand
0.8644 0.8425 0.7506 1.0000
108 Palau Micronesia 0.4415 0.1654 0.3592 0.7999
188 Papua New Guinea Melanesia 0.1203 0.0079 0.0530 0.3000
111 Samoa Polynesia 0.4204 0.2441 0.2672 0.7499
170 Solomon Islands Melanesia 0.2087 0.0551 0.1008 0.4702
98 Tonga Polynesia 0.4706 0.3465 0.2348 0.8304
137 Tuvalu Polynesia 0.3059 0.0394 0.1761 0.7022
159 Vanuatu Melanesia 0.2571 0.0787 0.1188 0.5736

213
Annexes
UNITED NATIONS E-GOVERNMENT SURVEY 2014
7. E-Government Development Index of Small Island Developing States
Rank Country Sub-region EGDIOnline Service
Component
Telecomm. Infrastructure Component
Human Capital Component
60 Antigua and Barbuda Caribbean 0.5927 0.4173 0.5938 0.7669
92 Bahamas Caribbean 0.4900 0.3386 0.4176 0.7138
18 Bahrain Western Asia 0.8089 0.9370 0.7055 0.7840
59 Barbados Caribbean 0.5933 0.2205 0.6730 0.8865
120 Belize Central America 0.3774 0.3780 0.1530 0.6012
127 Cape Verde West Africa 0.3551 0.1654 0.2966 0.6032
177 Comoros Eastern Africa 0.1808 0.0157 0.0604 0.4662
116 Cuba Caribbean 0.3917 0.2283 0.0969 0.8497
110 Dominica Caribbean 0.4338 0.1890 0.4424 0.6701
107 Dominican Republic Caribbean 0.4481 0.3858 0.2945 0.6639
85 Fiji Melanesia 0.5044 0.3937 0.2872 0.8322
78 Grenada Caribbean 0.5220 0.3465 0.4029 0.8166
182 Guinea-Bissau West Africa 0.1609 0.0079 0.0878 0.3869
124 Guyana South America 0.3695 0.2441 0.2344 0.6301
176 Haiti Caribbean 0.1809 0.1102 0.0952 0.3372
109 Jamaica Caribbean 0.4388 0.3150 0.2753 0.7262
132 Kiribati Micronesia 0.3201 0.2126 0.0665 0.6812
94 Maldives Southern Asia 0.4813 0.3622 0.3952 0.6865
142 Marshall Islands Micronesia 0.2851 0.1102 0.0448 0.7002
76 Mauritius Eastern Africa 0.5338 0.4724 0.4406 0.6882
130 Micronesia (Federated States of)
Micronesia 0.3337 0.1890 0.1099 0.7023
145 Nauru Micronesia 0.2776 0.0551 0.2159 0.5617
108 Palau Micronesia 0.4415 0.1654 0.3592 0.7999
188 Papua New Guinea Melanesia 0.1203 0.0079 0.0530 0.3000
90 Saint Kitts and Nevis Caribbean 0.4980 0.1339 0.6321 0.7279
104 Saint Lucia Caribbean 0.4525 0.2441 0.4000 0.7133
113 Saint Vincent and the Grenadines
Caribbean 0.4158 0.1575 0.3810 0.7088
111 Samoa Polynesia 0.4204 0.2441 0.2672 0.7499
169 Sao Tome and Principe Middle Africa 0.2218 0.0079 0.1398 0.5177
81 Seychelles Eastern Africa 0.5113 0.3307 0.4721 0.7310
3 Singapore South-Eastern Asia 0.9076 0.9921 0.8793 0.8515
170 Solomon Islands Melanesia 0.2087 0.0551 0.1008 0.4702
115 Suriname South America 0.4045 0.1417 0.3968 0.6749
161 Timor-Leste South-Eastern Asia 0.2528 0.2047 0.0704 0.4831
98 Tonga Polynesia 0.4706 0.3465 0.2348 0.8304
91 Trinidad and Tobago Caribbean 0.4932 0.3307 0.4543 0.6945
137 Tuvalu Polynesia 0.3059 0.0394 0.1761 0.7022
159 Vanuatu Melanesia 0.2571 0.0787 0.1188 0.5736
214
Ann
exes
ANNEx UNITED NATIONS E-GOVERNMENT SURVEY 2014
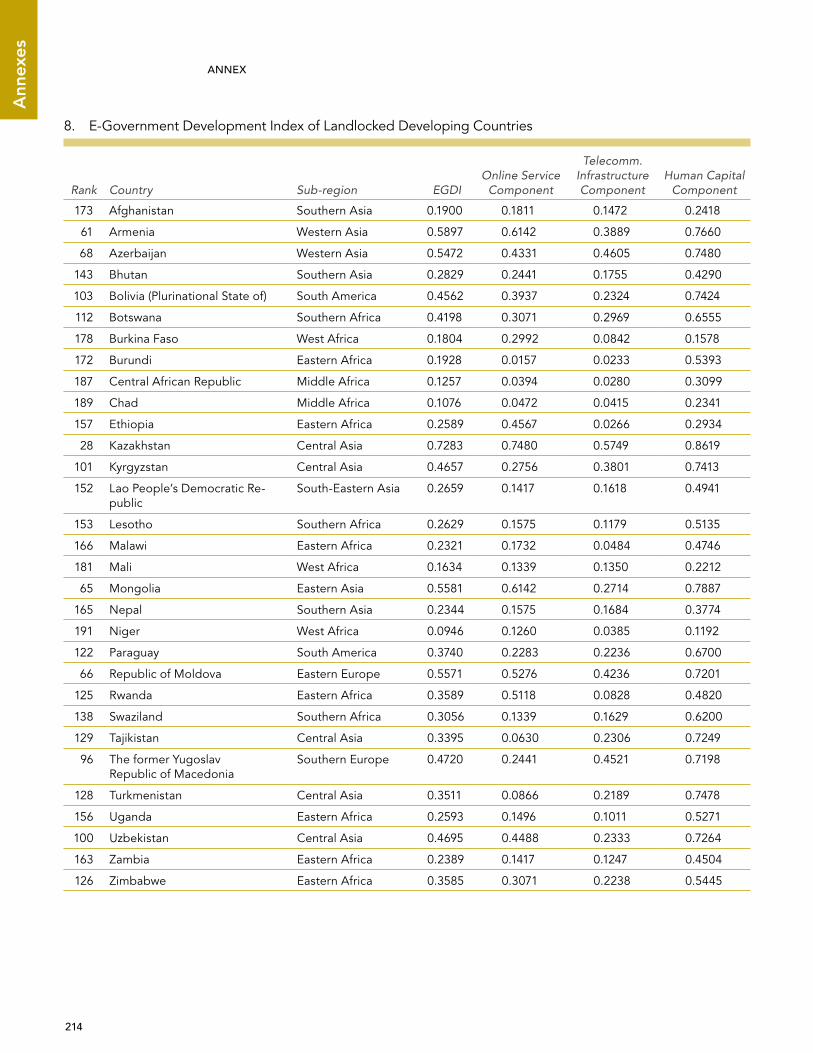
8. E-Government Development Index of Landlocked Developing Countries
Rank Country Sub-region EGDIOnline Service
Component
Telecomm. Infrastructure Component
Human Capital Component
173 Afghanistan Southern Asia 0.1900 0.1811 0.1472 0.2418
61 Armenia Western Asia 0.5897 0.6142 0.3889 0.7660
68 Azerbaijan Western Asia 0.5472 0.4331 0.4605 0.7480
143 Bhutan Southern Asia 0.2829 0.2441 0.1755 0.4290
103 Bolivia (Plurinational State of) South America 0.4562 0.3937 0.2324 0.7424
112 Botswana Southern Africa 0.4198 0.3071 0.2969 0.6555
178 Burkina Faso West Africa 0.1804 0.2992 0.0842 0.1578
172 Burundi Eastern Africa 0.1928 0.0157 0.0233 0.5393
187 Central African Republic Middle Africa 0.1257 0.0394 0.0280 0.3099
189 Chad Middle Africa 0.1076 0.0472 0.0415 0.2341
157 Ethiopia Eastern Africa 0.2589 0.4567 0.0266 0.2934
28 Kazakhstan Central Asia 0.7283 0.7480 0.5749 0.8619
101 Kyrgyzstan Central Asia 0.4657 0.2756 0.3801 0.7413
152 Lao People’s Democratic Re-public
South-Eastern Asia 0.2659 0.1417 0.1618 0.4941
153 Lesotho Southern Africa 0.2629 0.1575 0.1179 0.5135
166 Malawi Eastern Africa 0.2321 0.1732 0.0484 0.4746
181 Mali West Africa 0.1634 0.1339 0.1350 0.2212
65 Mongolia Eastern Asia 0.5581 0.6142 0.2714 0.7887
165 Nepal Southern Asia 0.2344 0.1575 0.1684 0.3774
191 Niger West Africa 0.0946 0.1260 0.0385 0.1192
122 Paraguay South America 0.3740 0.2283 0.2236 0.6700
66 Republic of Moldova Eastern Europe 0.5571 0.5276 0.4236 0.7201
125 Rwanda Eastern Africa 0.3589 0.5118 0.0828 0.4820
138 Swaziland Southern Africa 0.3056 0.1339 0.1629 0.6200
129 Tajikistan Central Asia 0.3395 0.0630 0.2306 0.7249
96 The former Yugoslav Republic of Macedonia
Southern Europe 0.4720 0.2441 0.4521 0.7198
128 Turkmenistan Central Asia 0.3511 0.0866 0.2189 0.7478
156 Uganda Eastern Africa 0.2593 0.1496 0.1011 0.5271
100 Uzbekistan Central Asia 0.4695 0.4488 0.2333 0.7264
163 Zambia Eastern Africa 0.2389 0.1417 0.1247 0.4504
126 Zimbabwe Eastern Africa 0.3585 0.3071 0.2238 0.5445

215
Annexes
UNITED NATIONS E-GOVERNMENT SURVEY 2014
9. E-Government Development Index of Least Developed Countries
Rank Country Sub-region EGDIOnline Service
Component
Telecomm. Infrastructure Component
Human Capital Component
173 Afghanistan Southern Asia 0.1900 0.1811 0.1472 0.2418
140 Angola Middle Africa 0.2970 0.2992 0.0978 0.4941
148 Bangladesh Southern Asia 0.2757 0.3465 0.0941 0.3866
180 Benin West Africa 0.1685 0.1102 0.1196 0.2756
143 Bhutan Southern Asia 0.2829 0.2441 0.1755 0.4290
178 Burkina Faso West Africa 0.1804 0.2992 0.0842 0.1578
172 Burundi Eastern Africa 0.1928 0.0157 0.0233 0.5393
139 Cambodia South-Eastern Asia 0.2999 0.1732 0.2075 0.5189
187 Central African Republic Middle Africa 0.1257 0.0394 0.0280 0.3099
189 Chad Middle Africa 0.1076 0.0472 0.0415 0.2341
177 Comoros Eastern Africa 0.1808 0.0157 0.0604 0.4662
183 Djibouti Middle Africa 0.1456 0.0630 0.0556 0.3182
184 DR Congo Eastern Africa 0.1551 0.0472 0.0337 0.3845
168 Equatorial Guinea Middle Africa 0.2268 0.0315 0.1200 0.5288
192 Eritrea Eastern Africa 0.0908 0.0000 0.0000 0.2723
157 Ethiopia Eastern Africa 0.2589 0.4567 0.0266 0.2934
167 Gambia West Africa 0.2285 0.2047 0.1482 0.3326
190 Guinea West Africa 0.0954 0.0000 0.0504 0.2359
182 Guinea-Bissau West Africa 0.1609 0.0079 0.0878 0.3869
176 Haiti Caribbean 0.1809 0.1102 0.0952 0.3372
132 Kiribati Micronesia 0.3201 0.2126 0.0665 0.6812
152 Lao People’s Democratic Republic
South-Eastern Asia 0.2659 0.1417 0.1618 0.4941
153 Lesotho Southern Africa 0.2629 0.1575 0.1179 0.5135
179 Liberia West Africa 0.1768 0.0787 0.0763 0.3754
155 Madagascar Eastern Africa 0.2606 0.2441 0.0488 0.4889
166 Malawi Eastern Africa 0.2321 0.1732 0.0484 0.4746
181 Mali West Africa 0.1634 0.1339 0.1350 0.2212
174 Mauritania West Africa 0.1893 0.0472 0.1626 0.3581
164 Mozambique Eastern Africa 0.2384 0.3150 0.0545 0.3457
175 Myanmar South-Eastern Asia 0.1869 0.0236 0.0084 0.5288
165 Nepal Southern Asia 0.2344 0.1575 0.1684 0.3774
191 Niger West Africa 0.0946 0.1260 0.0385 0.1192
125 Rwanda Eastern Africa 0.3589 0.5118 0.0828 0.4820
169 Sao Tome and Principe Middle Africa 0.2218 0.0079 0.1398 0.5177
151 Senegal West Africa 0.2666 0.3071 0.1644 0.3283
186 Sierra Leone West Africa 0.1329 0.0472 0.0821 0.2692
170 Solomon Islands Melanesia 0.2087 0.0551 0.1008 0.4702

216
Ann
exes
ANNEx UNITED NATIONS E-GOVERNMENT SURVEY 2014
Rank Country Sub-region EGDIOnline Service
Component
Telecomm. Infrastructure Component
Human Capital Component
193 Somalia Eastern Africa 0.0139 0.0157 0.0259 0.0000
185 South Sudan Eastern Africa 0.1418 0.0079 0.0141 0.4035
154 Sudan Northern Africa 0.2606 0.2913 0.1847 0.3059
161 Timor-Leste South-Eastern Asia 0.2528 0.2047 0.0704 0.4831
162 Togo West Africa 0.2446 0.1102 0.0836 0.5401
137 Tuvalu Polynesia 0.3059 0.0394 0.1761 0.7022
156 Uganda Eastern Africa 0.2593 0.1496 0.1011 0.5271
146 United Republic of Tanzania Eastern Africa 0.2764 0.2992 0.0808 0.4492
159 Vanuatu Melanesia 0.2571 0.0787 0.1188 0.5736
150 Yemen Western Asia 0.2720 0.3071 0.1249 0.3840
163 Zambia Eastern Africa 0.2389 0.1417 0.1247 0.4504
9. E-Government Development Index of Least Developed Countries (continued)

217
Annexes
UNITED NATIONS E-GOVERNMENT SURVEY 2014
10. Online Service Index and its components
Country OSI
Stage 1 Stage 2 Stage 3 Stage 4 Total
percentage
Afghanistan 0.1811 38 23 5 18 20
Albania 0.4488 88 27 21 44 42
Algeria 0.0787 16 18 2 9 11
Andorra 0.4331 78 57 9 24 41
Angola 0.2992 59 50 0 12 29
Antigua and Barbuda 0.4173 78 41 16 29 39
Argentina 0.5512 91 66 26 24 50
Armenia 0.6142 94 61 33 41 56
Australia 0.9291 100 75 88 65 82
Austria 0.7480 100 75 51 44 67
Azerbaijan 0.4331 81 36 28 24 41
Bahamas 0.3386 53 34 14 35 33
Bahrain 0.9370 94 80 84 74 82
Bangladesh 0.3465 75 34 14 18 33
Barbados 0.2205 41 20 12 24 23
Belarus 0.3228 81 16 14 26 31
Belgium 0.6772 94 64 42 50 61
Belize 0.3780 66 50 16 15 36
Benin 0.1102 47 7 2 6 14
Bhutan 0.2441 69 23 2 15 25
Bolivia (Plurinational State of) 0.3937 69 39 16 32 37
Bosnia and Herzegovina 0.2835 56 41 7 12 28
Botswana 0.3071 72 36 5 15 30
Brazil 0.5984 100 68 28 26 54
Brunei Darussalam 0.3622 34 39 28 38 35
Bulgaria 0.2362 59 30 0 15 24
Burkina Faso 0.2992 38 41 9 32 29
Burundi 0.0157 19 7 0 0 6
Cambodia 0.1732 50 18 5 9 19
Cameroon 0.1969 47 25 7 9 21
Canada 0.9134 100 73 84 68 80
Cape Verde 0.1654 34 16 12 15 18
Central African Republic 0.0394 13 11 5 3 8
Chad 0.0472 19 11 5 0 8
Chile 0.8189 100 57 70 71 73
China 0.6063 100 57 37 32 55
Colombia 0.7874 88 75 56 65 70
Comoros 0.0157 19 7 0 0 6
Congo 0.1024 22 16 9 6 13
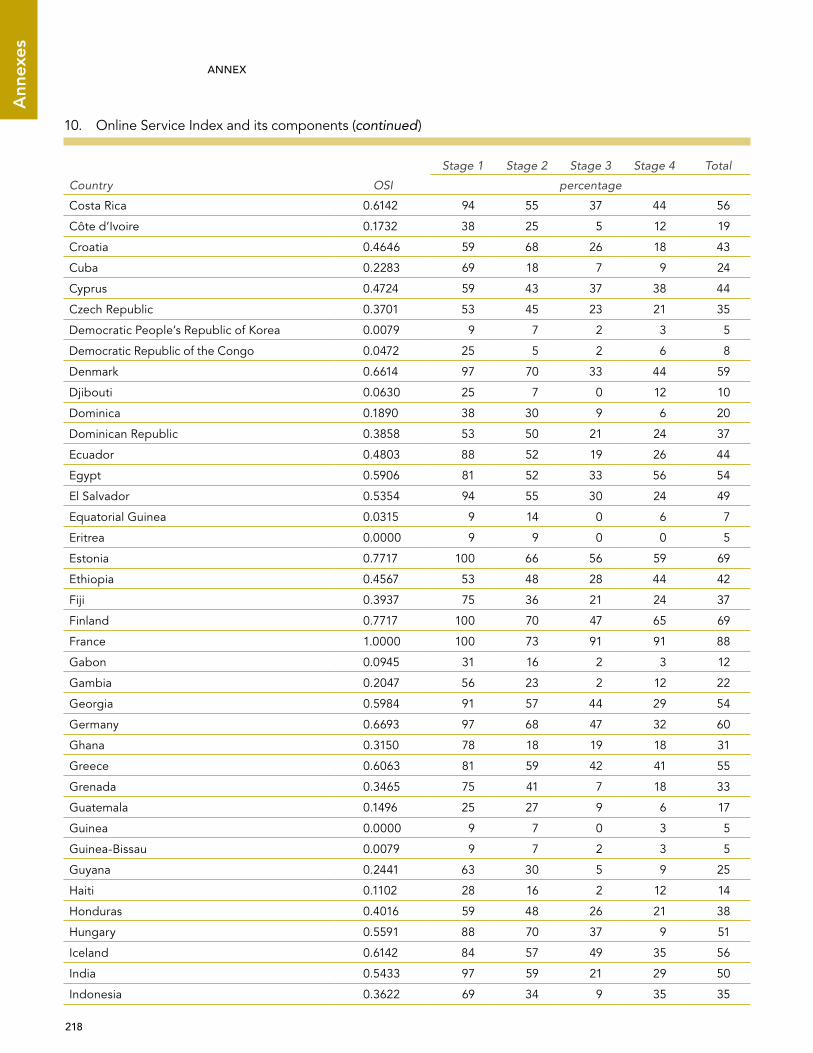
218
Ann
exes
ANNEx UNITED NATIONS E-GOVERNMENT SURVEY 2014
Country OSI
Stage 1 Stage 2 Stage 3 Stage 4 Total
percentage
Costa Rica 0.6142 94 55 37 44 56
Côte d’Ivoire 0.1732 38 25 5 12 19
Croatia 0.4646 59 68 26 18 43
Cuba 0.2283 69 18 7 9 24
Cyprus 0.4724 59 43 37 38 44
Czech Republic 0.3701 53 45 23 21 35
Democratic People’s Republic of Korea 0.0079 9 7 2 3 5
Democratic Republic of the Congo 0.0472 25 5 2 6 8
Denmark 0.6614 97 70 33 44 59
Djibouti 0.0630 25 7 0 12 10
Dominica 0.1890 38 30 9 6 20
Dominican Republic 0.3858 53 50 21 24 37
Ecuador 0.4803 88 52 19 26 44
Egypt 0.5906 81 52 33 56 54
El Salvador 0.5354 94 55 30 24 49
Equatorial Guinea 0.0315 9 14 0 6 7
Eritrea 0.0000 9 9 0 0 5
Estonia 0.7717 100 66 56 59 69
Ethiopia 0.4567 53 48 28 44 42
Fiji 0.3937 75 36 21 24 37
Finland 0.7717 100 70 47 65 69
France 1.0000 100 73 91 91 88
Gabon 0.0945 31 16 2 3 12
Gambia 0.2047 56 23 2 12 22
Georgia 0.5984 91 57 44 29 54
Germany 0.6693 97 68 47 32 60
Ghana 0.3150 78 18 19 18 31
Greece 0.6063 81 59 42 41 55
Grenada 0.3465 75 41 7 18 33
Guatemala 0.1496 25 27 9 6 17
Guinea 0.0000 9 7 0 3 5
Guinea-Bissau 0.0079 9 7 2 3 5
Guyana 0.2441 63 30 5 9 25
Haiti 0.1102 28 16 2 12 14
Honduras 0.4016 59 48 26 21 38
Hungary 0.5591 88 70 37 9 51
Iceland 0.6142 84 57 49 35 56
India 0.5433 97 59 21 29 50
Indonesia 0.3622 69 34 9 35 35
10. Online Service Index and its components (continued)
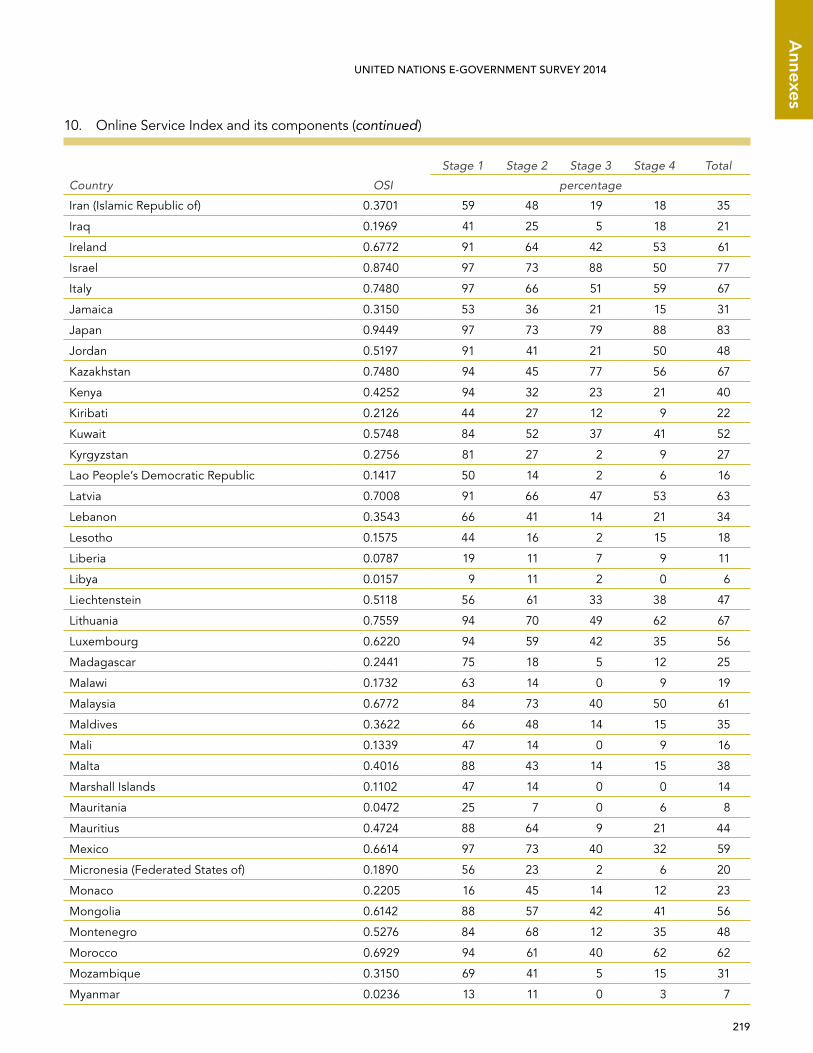
219
Annexes
UNITED NATIONS E-GOVERNMENT SURVEY 2014
Country OSI
Stage 1 Stage 2 Stage 3 Stage 4 Total
percentage
Iran (Islamic Republic of) 0.3701 59 48 19 18 35
Iraq 0.1969 41 25 5 18 21
Ireland 0.6772 91 64 42 53 61
Israel 0.8740 97 73 88 50 77
Italy 0.7480 97 66 51 59 67
Jamaica 0.3150 53 36 21 15 31
Japan 0.9449 97 73 79 88 83
Jordan 0.5197 91 41 21 50 48
Kazakhstan 0.7480 94 45 77 56 67
Kenya 0.4252 94 32 23 21 40
Kiribati 0.2126 44 27 12 9 22
Kuwait 0.5748 84 52 37 41 52
Kyrgyzstan 0.2756 81 27 2 9 27
Lao People’s Democratic Republic 0.1417 50 14 2 6 16
Latvia 0.7008 91 66 47 53 63
Lebanon 0.3543 66 41 14 21 34
Lesotho 0.1575 44 16 2 15 18
Liberia 0.0787 19 11 7 9 11
Libya 0.0157 9 11 2 0 6
Liechtenstein 0.5118 56 61 33 38 47
Lithuania 0.7559 94 70 49 62 67
Luxembourg 0.6220 94 59 42 35 56
Madagascar 0.2441 75 18 5 12 25
Malawi 0.1732 63 14 0 9 19
Malaysia 0.6772 84 73 40 50 61
Maldives 0.3622 66 48 14 15 35
Mali 0.1339 47 14 0 9 16
Malta 0.4016 88 43 14 15 38
Marshall Islands 0.1102 47 14 0 0 14
Mauritania 0.0472 25 7 0 6 8
Mauritius 0.4724 88 64 9 21 44
Mexico 0.6614 97 73 40 32 59
Micronesia (Federated States of) 0.1890 56 23 2 6 20
Monaco 0.2205 16 45 14 12 23
Mongolia 0.6142 88 57 42 41 56
Montenegro 0.5276 84 68 12 35 48
Morocco 0.6929 94 61 40 62 62
Mozambique 0.3150 69 41 5 15 31
Myanmar 0.0236 13 11 0 3 7
10. Online Service Index and its components (continued)

220
Ann
exes
ANNEx UNITED NATIONS E-GOVERNMENT SURVEY 2014
Country OSI
Stage 1 Stage 2 Stage 3 Stage 4 Total
percentage
Namibia 0.3228 69 32 14 18 31
Nauru 0.0551 22 11 2 3 9
Nepal 0.1575 59 11 2 6 18
Netherlands 0.9291 100 75 70 88 82
New Zealand 0.8425 97 66 84 53 75
Nicaragua 0.0945 16 14 16 3 12
Niger 0.1260 47 14 0 6 15
Nigeria 0.3071 56 36 14 18 30
Norway 0.7559 97 77 44 56 67
Oman 0.7323 97 64 60 44 65
Pakistan 0.3228 78 25 14 18 31
Palau 0.1654 53 16 2 9 18
Panama 0.3701 84 36 12 18 35
Papua New Guinea 0.0079 9 11 0 0 5
Paraguay 0.2283 59 25 2 15 24
Peru 0.6299 88 55 51 38 57
Philippines 0.4803 84 57 19 24 44
Poland 0.5433 72 59 42 26 50
Portugal 0.6378 100 55 40 44 58
Qatar 0.6535 91 61 42 47 59
Republic of Korea 0.9764 100 82 77 88 86
Republic of Moldova 0.5276 88 55 26 32 48
Romania 0.4409 78 45 19 29 41
Russian Federation 0.7087 91 77 51 35 63
Rwanda 0.5118 78 64 19 32 47
Saint Kitts and Nevis 0.1339 34 18 2 12 16
Saint Lucia 0.2441 44 32 14 12 25
Saint Vincent and the Grenadines 0.1575 50 16 2 9 18
Samoa 0.2441 75 20 0 15 25
San Marino 0.2756 56 39 5 15 27
Sao Tome and Principe 0.0079 6 14 0 0 5
Saudi Arabia 0.7717 94 68 63 53 69
Senegal 0.3071 78 32 5 15 30
Serbia 0.3937 72 52 12 18 37
Seychelles 0.3307 53 30 7 47 32
Sierra Leone 0.0472 13 16 5 0 8
Singapore 0.9921 100 89 88 71 87
Slovakia 0.4882 84 50 16 38 45
Slovenia 0.4252 63 64 7 29 40
10. Online Service Index and its components (continued)

221
Annexes
UNITED NATIONS E-GOVERNMENT SURVEY 2014
Country OSI
Stage 1 Stage 2 Stage 3 Stage 4 Total
percentage
Solomon Islands 0.0551 19 14 2 3 9
Somalia 0.0157 6 16 0 0 6
South Africa 0.3858 75 43 12 24 37
South Sudan 0.0079 16 5 2 0 5
Spain 0.9449 100 93 70 71 83
Sri Lanka 0.6535 88 73 28 53 59
Sudan 0.2913 66 20 2 38 29
Suriname 0.1417 50 14 0 9 16
Swaziland 0.1339 50 16 0 3 16
Sweden 0.7008 91 70 44 50 63
Switzerland 0.5039 56 66 21 44 46
Syrian Arab Republic 0.1575 19 7 12 38 18
Tajikistan 0.0630 31 7 2 3 10
Thailand 0.4409 94 34 14 35 41
The former Yugoslav Republic of Macedonia 0.2441 50 34 5 15 25
Timor-Leste 0.2047 47 25 7 12 22
Togo 0.1102 41 16 2 0 14
Tonga 0.3465 69 41 12 18 33
Trinidad and Tobago 0.3307 63 41 7 24 32
Tunisia 0.6378 91 61 33 53 58
Turkey 0.5591 81 57 23 50 51
Turkmenistan 0.0866 34 11 0 6 12
Tuvalu 0.0394 25 9 0 0 8
Uganda 0.1496 25 25 5 15 17
Ukraine 0.2677 75 20 5 18 27
United Arab Emirates 0.8819 100 77 67 71 78
United Kingdom of Great Britain and Northern Ireland
0.8976 100 73 63 88 79
United Republic of Tanzania 0.2992 81 32 2 12 29
United States of America 0.9449 100 68 77 94 83
Uruguay 0.8504 94 70 72 68 75
Uzbekistan 0.4488 88 41 23 24 42
Vanuatu 0.0787 34 5 5 6 11
Venezuela (Bolivarian Republic of) 0.5512 88 55 33 32 50
Viet Nam 0.4173 78 50 16 18 39
Yemen 0.3071 66 18 12 35 30
Zambia 0.1417 47 16 0 9 16
Zimbabwe 0.3071 88 25 5 15 30
10. Online Service Index and its components (continued)
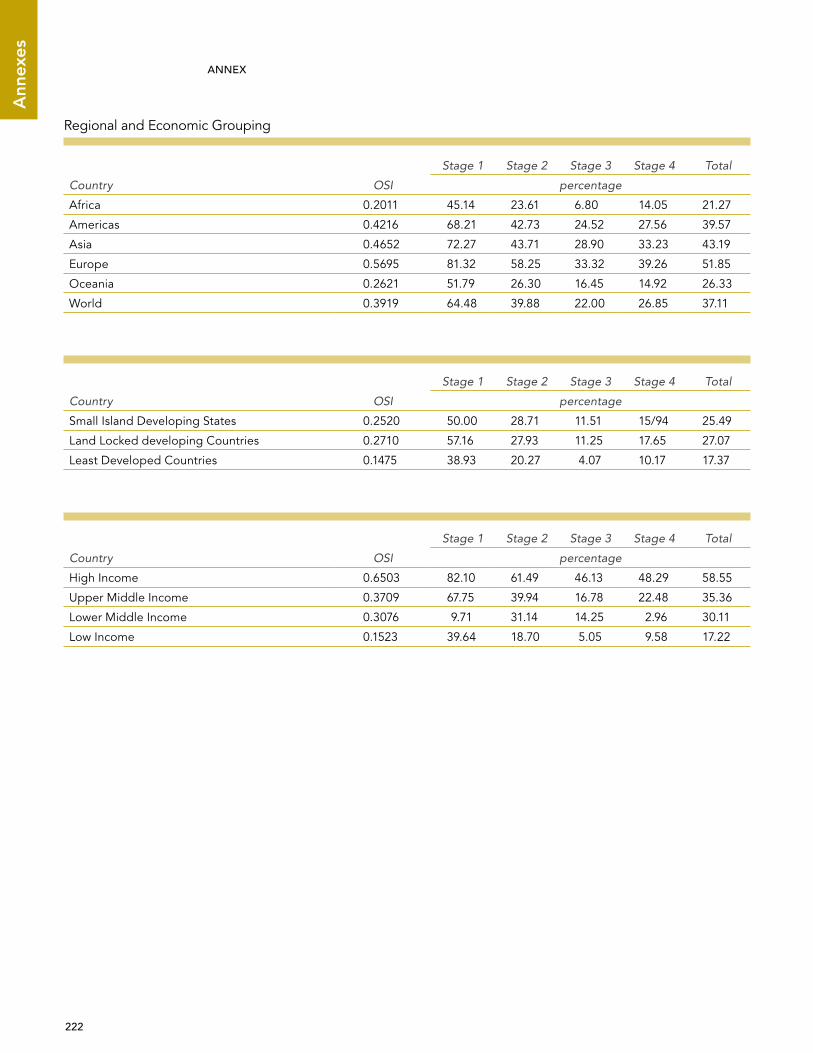
222
Ann
exes
ANNEx UNITED NATIONS E-GOVERNMENT SURVEY 2014
Regional and Economic Grouping
Country OSI
Stage 1 Stage 2 Stage 3 Stage 4 Total
percentage
Africa 0.2011 45.14 23.61 6.80 14.05 21.27
Americas 0.4216 68.21 42.73 24.52 27.56 39.57
Asia 0.4652 72.27 43.71 28.90 33.23 43.19
Europe 0.5695 81.32 58.25 33.32 39.26 51.85
Oceania 0.2621 51.79 26.30 16.45 14.92 26.33
World 0.3919 64.48 39.88 22.00 26.85 37.11
Country OSI
Stage 1 Stage 2 Stage 3 Stage 4 Total
percentage
Small Island Developing States 0.2520 50.00 28.71 11.51 15/94 25.49
Land Locked developing Countries 0.2710 57.16 27.93 11.25 17.65 27.07
Least Developed Countries 0.1475 38.93 20.27 4.07 10.17 17.37
Country OSI
Stage 1 Stage 2 Stage 3 Stage 4 Total
percentage
High Income 0.6503 82.10 61.49 46.13 48.29 58.55
Upper Middle Income 0.3709 67.75 39.94 16.78 22.48 35.36
Lower Middle Income 0.3076 9.71 31.14 14.25 2.96 30.11
Low Income 0.1523 39.64 18.70 5.05 9.58 17.22

223
Annexes
UNITED NATIONS E-GOVERNMENT SURVEY 2014
11. Telecommunication Infrastructure Index and its components
Country TII
Percentage of Individuals
using the Internet
Fixed-telephone
subscriptions per 100
inhabitants
Mobile-cellular telephone
subscriptions per 100
inhabitants
Fixed (wired)-broadband
subscriptions per 100
inhabitants
Wireless broadband
subscriptions per 100
inhabitants
Afghanistan 0.1472 5.45 0.05 60.35 0.00* 28.73
Albania 0.3548 54.66 9.87 110.69 5.06 18.79
Algeria 0.1989 15.23 8.32 97.95 2.89 0.00
Andorra 0.7671 86.43 49.77 82.95 34.58 66.75
Angola 0.0978 16.94 1.46 47.07 0.15 1.50
Antigua & Barbuda 0.5938 59.00 39.30 201.83 5.73 20.21
Argentina 0.4835 55.80 24.33 142.62 10.89 20.86
Armenia 0.3889 39.16 19.68 111.91 6.95 29.09
Australia 0.8041 82.35 45.43 105.59 24.91 102.07
Austria 0.7597 81.00 39.49 160.54 25.13 56.10
Azerbaijan 0.4605 54.20 18.62 108.77 13.97 34.84
Bahamas 0.4176 71.75 36.83 68.29 2.61 24.52
Bahrain 0.7055 88.00 22.01 161.17 13.14 78.42
Bangladesh 0.0941 6.30 0.62 62.82 0.33 0.47
Barbados 0.6730 73.33 50.84 122.52 23.09 36.01
Belarus 0.6069 46.91 46.86 113.52 26.91 33.28
Belgium 0.6988 82.00 41.87 116.45 33.27 33.01
Belize 0.1530 25.00 7.84 50.65 3.08 0.52
Benin 0.1196 3.80 1.56 83.65 0.05 0.37
Bhutan 0.1755 25.43 3.64 75.61 2.26 2.52
Bolivia (Plurinational State of) 0.2324 34.19 8.39 90.45 1.05 6.62
Bosnia and Herzegovina 0.3998 65.36 22.91 87.44 10.54 12.07
Botswana 0.2969 11.50 8.01 153.79 0.80 17.80
Brazil 0.4668 49.85 22.30 125.00 9.15 37.22
Brunei Darussalam 0.3690 60.27 17.21 113.95 4.81 7.62
Bulgaria 0.5941 55.15 30.95 148.13 17.94 42.11
Burkina Faso 0.0842 3.73 0.86 60.61 0.09 0.00
Burundi 0.0233 1.22 0.18 22.81 0.00 0.00
Cambodia 0.2075 4.94 3.93 128.53 0.20 6.73
Cameroon 0.0958 5.70 3.40 60.41 0.01 0.00
Canada 0.7168 86.77 51.70 75.39 32.74 49.80
Cape Verde 0.2966 34.74 14.20 86.03 3.86 23.03
Central African Republic 0.0280 3.00 0.12 23.65 0.00 0.01
Chad 0.0415 2.10 0.24 33.73 0.16 0.00
Chile 0.4940 61.42 18.76 138.17 12.41 27.96
China 0.3554 42.30 20.25 79.88 12.75 16.95
Colombia 0.3297 48.98 13.19 102.85 8.33 5.05
Comoros 0.0604 5.98 3.34 34.84 0.03 0.00
Congo 0.1453 6.11 0.34 98.76 0.01 2.11
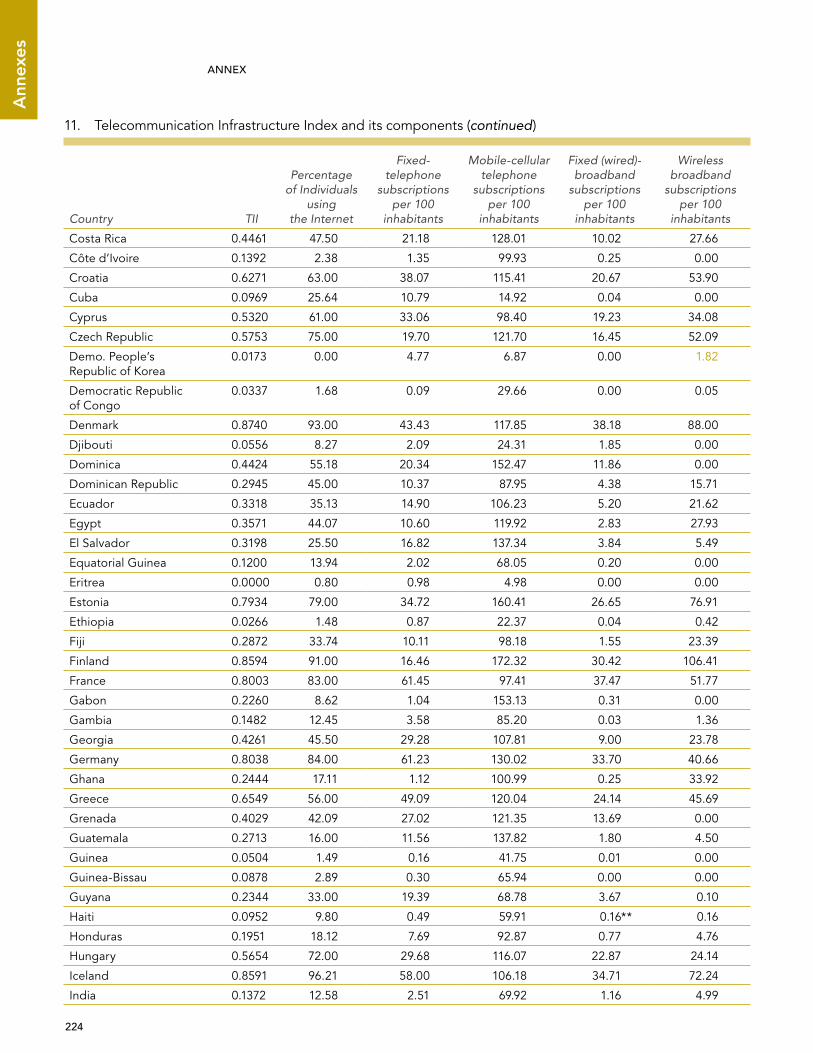
224
Ann
exes
ANNEx UNITED NATIONS E-GOVERNMENT SURVEY 2014
Country TII
Percentage of Individuals
using the Internet
Fixed-telephone
subscriptions per 100
inhabitants
Mobile-cellular telephone
subscriptions per 100
inhabitants
Fixed (wired)-broadband
subscriptions per 100
inhabitants
Wireless broadband
subscriptions per 100
inhabitants
Costa Rica 0.4461 47.50 21.18 128.01 10.02 27.66
Côte d’Ivoire 0.1392 2.38 1.35 99.93 0.25 0.00
Croatia 0.6271 63.00 38.07 115.41 20.67 53.90
Cuba 0.0969 25.64 10.79 14.92 0.04 0.00
Cyprus 0.5320 61.00 33.06 98.40 19.23 34.08
Czech Republic 0.5753 75.00 19.70 121.70 16.45 52.09
Demo. People’s Republic of Korea
0.0173 0.00 4.77 6.87 0.00 1.82
Democratic Republic of Congo
0.0337 1.68 0.09 29.66 0.00 0.05
Denmark 0.8740 93.00 43.43 117.85 38.18 88.00
Djibouti 0.0556 8.27 2.09 24.31 1.85 0.00
Dominica 0.4424 55.18 20.34 152.47 11.86 0.00
Dominican Republic 0.2945 45.00 10.37 87.95 4.38 15.71
Ecuador 0.3318 35.13 14.90 106.23 5.20 21.62
Egypt 0.3571 44.07 10.60 119.92 2.83 27.93
El Salvador 0.3198 25.50 16.82 137.34 3.84 5.49
Equatorial Guinea 0.1200 13.94 2.02 68.05 0.20 0.00
Eritrea 0.0000 0.80 0.98 4.98 0.00 0.00
Estonia 0.7934 79.00 34.72 160.41 26.65 76.91
Ethiopia 0.0266 1.48 0.87 22.37 0.04 0.42
Fiji 0.2872 33.74 10.11 98.18 1.55 23.39
Finland 0.8594 91.00 16.46 172.32 30.42 106.41
France 0.8003 83.00 61.45 97.41 37.47 51.77
Gabon 0.2260 8.62 1.04 153.13 0.31 0.00
Gambia 0.1482 12.45 3.58 85.20 0.03 1.36
Georgia 0.4261 45.50 29.28 107.81 9.00 23.78
Germany 0.8038 84.00 61.23 130.02 33.70 40.66
Ghana 0.2444 17.11 1.12 100.99 0.25 33.92
Greece 0.6549 56.00 49.09 120.04 24.14 45.69
Grenada 0.4029 42.09 27.02 121.35 13.69 0.00
Guatemala 0.2713 16.00 11.56 137.82 1.80 4.50
Guinea 0.0504 1.49 0.16 41.75 0.01 0.00
Guinea-Bissau 0.0878 2.89 0.30 65.94 0.00 0.00
Guyana 0.2344 33.00 19.39 68.78 3.67 0.10
Haiti 0.0952 9.80 0.49 59.91 0.16** 0.16
Honduras 0.1951 18.12 7.69 92.87 0.77 4.76
Hungary 0.5654 72.00 29.68 116.07 22.87 24.14
Iceland 0.8591 96.21 58.00 106.18 34.71 72.24
India 0.1372 12.58 2.51 69.92 1.16 4.99
11. Telecommunication Infrastructure Index and its components (continued)

225
Annexes
UNITED NATIONS E-GOVERNMENT SURVEY 2014
Country TII
Percentage of Individuals
using the Internet
Fixed-telephone
subscriptions per 100
inhabitants
Mobile-cellular telephone
subscriptions per 100
inhabitants
Fixed (wired)-broadband
subscriptions per 100
inhabitants
Wireless broadband
subscriptions per 100
inhabitants
Indonesia 0.3054 15.36 15.39 114.22 1.21 31.59
Iran (Islamic Republic of) 0.2940 26.00 37.63 76.10 4.03 1.34
Iraq 0.2173 7.10 5.71 81.63 0.00 37.14
Ireland 0.7039 79.00 43.88 107.21 22.72 65.87
Israel 0.7200 73.37 47.02 120.68 22.38 65.97
Italy 0.6747 58.00 35.57 159.69 22.15 52.15
Jamaica 0.2753 46.50 9.55 96.27 4.32 1.57
Japan 0.8553 79.05 50.51 108.73 27.74 112.40
Jordan 0.3104 41.00 6.20 128.17 2.76 10.86
Kazakhstan 0.5749 53.32 26.67 176.58 9.78 42.27
Kenya 0.1612 32.10 0.58 71.17 0.10 2.22
Kiribati 0.0665 10.75 8.93 15.88 0.99 0.00
Kuwait 0.5862 79.18 15.69 156.90 1.45 71.73
Kyrgyzstan 0.3801 21.72 8.93 124.18 2.61 59.63
Lao People’s Democratic Republic
0.1618 10.75 1.69 97.69 1.40 0.74
Latvia 0.6237 74.00 24.32 112.11 23.35 58.24
Lebanon 0.4030 61.25 18.90 86.08 10.76 23.67
Lesotho 0.1179 4.59 2.10 63.94 0.14 10.45
Liberia 0.0763 3.79 0.00 57.12 0.00 0.03
Libya 0.3281 19.86 13.23 155.77 1.09 14.52
Liechtenstein 0.7468 89.41 50.39 97.35 32.95 48.40
Lithuania 0.5697 68.00 22.04 165.06 21.23 13.54
Luxembourg 0.8723 92.00 50.92 145.36 32.58 72.52
Madagascar 0.0488 2.05 0.64 38.41 0.04 0.06
Malawi 0.0484 4.35 1.43 27.78 0.01 3.46
Malaysia 0.4455 65.80 15.69 141.33 8.41 13.59
Maldives 0.3952 38.93 6.84 165.63 5.28 20.64
Mali 0.1350 2.17 0.75 98.38 0.01 0.73
Malta 0.7683 70.00 53.71 126.11 31.05 57.47
Marshall Islands 0.0448 10.00 10.60***** 1.27***** 0.00** 0.00
Mauritania 0.1626 5.37 1.71 106.00 0.17 3.64
Mauritius 0.4406 41.39 28.16 119.87 11.21 22.94
Mexico 0.3139 38.42 16.73 83.40 10.52 9.83
Micronesia 0.1099 25.97 8.12 26.69 0.90* 0.00
Monaco 1.0000 87.00 118.40 88.33 42.94 47.90
Mongolia 0.2714 16.40 6.32 120.69 3.75 18.37
Montenegro 0.5481 56.84 26.24 181.30 8.44 27.53
Morocco 0.3350 55.00 10.08 119.97 2.10 10.09
Mozambique 0.0545 4.85 0.35 36.24 0.08 1.78
11. Telecommunication Infrastructure Index and its components (continued)

226
Ann
exes
ANNEx UNITED NATIONS E-GOVERNMENT SURVEY 2014
Country TII
Percentage of Individuals
using the Internet
Fixed-telephone
subscriptions per 100
inhabitants
Mobile-cellular telephone
subscriptions per 100
inhabitants
Fixed (wired)-broadband
subscriptions per 100
inhabitants
Wireless broadband
subscriptions per 100
inhabitants
Myanmar 0.0084 1.07 1.05 10.30 0.01 0.03
Namibia 0.2719 12.94 7.58 107.79 2.91 30.22
Nauru 0.2159 54.00 0.00 67.78 0.00 9.97
Nepal 0.1684 11.15 3.08 59.62 0.45 28.01
Netherlands 0.8175 93.00 42.40 117.52 39.44 60.98
New Zealand 0.7506 89.51 42.15 110.36 27.80 65.94
Nicaragua 0.1692 13.50 5.34 89.22 1.65 1.01
Niger 0.0385 1.41 0.59 31.45 0.02 0.57
Nigeria 0.1905 32.88 0.25 66.80 0.01 18.37
Norway 0.8133 95.00 29.35 114.78 36.64 84.85
Oman 0.4873 60.00 9.19 159.25 2.15 50.94
Pakistan 0.1174 9.96 3.24 67.06 0.52 0.66
Palau 0.3592 26.97***** 35.08 82.64 2.95 32.31
Panama 0.4571 45.20 16.83 178.03 7.83 14.31
Papua New Guinea 0.0530 2.30 1.94 37.80 0.13 0.00
Paraguay 0.2236 27.08 5.62 101.59 1.11 6.06
Peru 0.2718 38.20 11.42 98.00 4.74 2.86
Philippines 0.2451 36.24 4.07 106.51 2.22 3.83
Poland 0.5618 65.00 16.03 133.05 16.68 52.90
Portugal 0.6094 64.00 42.98 116.11 22.55 32.76
Qatar 0.5879 88.10 15.95 126.80 7.75 68.28
Republic of Korea 0.9350 84.10 61.42 109.43 37.25 105.14
Republic of Moldova 0.4236 43.37 34.31 116.10 11.87 5.08
Romania 0.4385 50.00 21.51 104.35 15.63 23.40
Russian Federation 0.6413 53.27 29.97 182.92 14.43 52.80
Rwanda 0.0828 8.02 0.39 49.67 0.03 3.22
Saint Kitts and Nevis 0.6321 79.35 37.32 156.76 27.25 0.00
Saint Lucia 0.4000 48.63 20.37 125.50 13.59 0.00
Saint Vincent and the Grenadines
0.3810 47.52 17.72 123.87 12.45 0.00
Samoa 0.2672 12.92 10.82*** 91.43*** 0.11* 40.39
San Marino 0.6358 50.88 59.85 115.21 31.69 11.20
Sao Tomé & Principe 0.1398 21.57 4.25 64.86 0.48 0.00
Saudi Arabia 0.5523 54.00 16.97 187.40 6.95 45.38
Senegal 0.1644 19.20 2.46 83.57 0.70 3.58
Serbia 0.4681 48.10 31.16 95.66 10.49 42.05
Seychelles 0.4721 47.08 31.26 149.74 11.06 8.59
Sierra Leone 0.0821 1.30 0.30 36.96 0.00*** 17.51
Singapore 0.8793 74.18 37.51 152.04 25.85 123.76
Slovakia 0.5296 80.00 17.90 111.91 14.66 39.71
11. Telecommunication Infrastructure Index and its components (continued)

227
Annexes
UNITED NATIONS E-GOVERNMENT SURVEY 2014
Country TII
Percentage of Individuals
using the Internet
Fixed-telephone
subscriptions per 100
inhabitants
Mobile-cellular telephone
subscriptions per 100
inhabitants
Fixed (wired)-broadband
subscriptions per 100
inhabitants
Wireless broadband
subscriptions per 100
inhabitants
Slovenia 0.6193 70.00 39.89 108.61 24.29 36.95
Solomon Islands 0.1008 7.00 1.47 54.98 0.39 6.54
Somalia 0.0259 1.38 0.98 22.56 0.00** 0.00
South Africa 0.3466 41.00 7.69 130.56 2.11 25.20
South Sudan 0.0141 0.00 0.00 18.45 0.00 0.00
Spain 0.6629 72.00 41.11 108.36 24.26 53.42
Sri Lanka 0.2341 18.29 16.35 96.33 2.01 4.47
Sudan 0.1847 21.00 1.14 74.36 0.07 20.52
Suriname 0.3968 34.68 15.53 182.77 5.74 0.37
Swaziland 0.1629 20.78 3.95 65.39 0.27 11.90
Sweden 0.8866 94.00 45.43 122.41 32.13 101.10
Switzerland 0.8199 85.20 54.79 130.79 40.48 40.06
Syrian Arab Republic 0.1992 24.30 20.21 59.06 1.73 1.78
Tajikistan 0.2306 14.51 4.91 81.51 0.07 37.41
Thailand 0.2843 26.50 9.57 125.89 6.52 0.15
The Former Yugoslav Republic of Macedonia
0.4521 63.15 19.37 106.17 14.36 22.27
Timor-Leste 0.0704 0.91 0.27 55.74 0.05 0.40
Togo 0.0836 4.00 3.39 52.96 0.08 0.65
Tonga 0.2348 34.86 28.59 53.36 1.43 0.10
Trinidad & Tobago 0.4543 59.52 21.43 140.84 13.75 2.79
Tunisia 0.3074 41.44 10.17 118.08 4.71 5.13
Turkey 0.3605 45.13 18.73 91.46 10.62 16.45
Turkmenistan 0.2189 7.20 11.12 76.42 0.03 33.05
Tuvalu 0.1761 35.00 14.71 28.40 5.58 0.00
Uganda 0.1011 14.69 0.87 45.00 0.11 7.41
Ukraine 0.3802 33.70 26.76 130.34 8.00 5.43
United Arab Emirates 0.5932 85.00 21.37 149.64 10.34 44.85
United Kingdom of Great Britain and Northern Island
0.8534 87.02 52.58 130.78 34.04 72.06
United Republic of Tanzania 0.0808 3.95 0.37 56.96 0.01 1.49
United States of America 0.7406 81.03 43.78 97.64 27.88 74.90
Uruguay 0.5607 55.11 29.78 147.13 16.59 32.46
Uzbekistan 0.2333 36.52 6.88 71.03 0.71 20.36
Vanuatu 0.1188 10.60 2.35 55.41 1.05 8.25
Venezuela (Bolivarian Republic of)
0.3495 44.05 25.53 101.88 6.72 4.83
Viet Nam 0.3792 39.49 11.22 147.66 4.90 18.77
Yemen 0.1249 17.45 4.63 58.28 0.70 0.20
Zambia 0.1247 13.47 0.59 74.78 0.11 0.65
Zimbabwe 0.2238 17.09 2.20 91.91 0.52 28.14
11. Telecommunication Infrastructure Index and its components (continued)

228
Ann
exes
ANNEx UNITED NATIONS E-GOVERNMENT SURVEY 2014
Regional and Economic Grouping
Country TII
Percentage of Individuals
using the Internet
Fixed-telephone
subscriptions per 100
inhabitants
Mobile-cellular telephone
subscriptions per 100
inhabitants
Fixed (wired)-broadband
subscriptions per 100
inhabitants
Wireless broadband
subscriptions per 100
inhabitants
Africa 0.1478 13.41 3.77 71.41 1.00 6.70
Americas 0.3805 45.08 20.31 112.81 9.37 13.14
Asia 0.3584 37.63 15.25 103.75 6.66 29.44
Europe 0.6678 71.76 39.17 123.37 24.83 47.78
Oceania 0.2564 31.46 16.57 61.42 6.07 20.64
World 0.3650 39.40 18.40 98.02 9.74 23.57
TII
Percentage of Individuals
using the Internet
Fixed-telephone
subscriptions per 100
inhabitants
Mobile-cellular telephone
subscriptions per 100
inhabitants
Fixed (wired)-broadband
subscriptions per 100
inhabitants
Wireless broadband
subscriptions per 100
inhabitants
Small Island Developing States
0.3033 36.20 16.47 90.64 6.09 13.18
Land Locked Developing Countries
0.2025 18.49 6.53 78.84 2.34 14.83
Least Developed Countries
0.0929 7.89 1.81 52.32 0.37 3.38
TII
Percentage of Individuals
using the Internet
Fixed-telephone
subscriptions per 100
inhabitants
Mobile-cellular telephone
subscriptions per 100
inhabitants
Fixed (wired)-broadband
subscriptions per 100
inhabitants
Wireless broadband
subscriptions per 100
inhabitants
High Income 0.6845 75.21 38.41 124.91 23.71 54.97
Upper Middle Income 0.3522 39.99 17.36 111.12 7.47 16.26
Lower Middle Income 0.2307 24.17 9.56 89.58 2.61 11.75
Low Income 0.0876 5.72 1.24 51.50 0.08 5.00
Sources: International Telecommunications Union (ITU). International Telecommunications Union (ITU) Country profiles indicated in yellow.
Year: 2012 or most recent data available. * 2010 ** 2008 *** 2007 **** 2005 ***** 2004

229
Annexes
UNITED NATIONS E-GOVERNMENT SURVEY 201412
. H
uman
Cap
ital I
ndex
and
its
com
pon
ents
Cou
ntry
HC
I
Ad
ult
liter
acy
(%)
Gro
ss e
nrol
men
t ra
tio (%
)E
xpec
ted
yea
rs
of s
cho
olin
gM
ean
year
s of
sch
oo
ling
Ind
ex
valu
eYe
arSo
urce
Ind
ex
Valu
eYe
arSo
urce
Ind
ex
valu
eYe
arSo
urce
Ind
ex
Valu
eYe
arSo
urce
Afg
hani
stan
0.24
1828
.00
2005
UN
ESC
O54
.18
2009
UN
ESC
O8.
1520
09U
NES
CO
3.10
2010
UN
ESC
O
Alb
ania
0.
7100
96.8
520
11U
NES
CO
67.6
920
03U
NES
CO
11.3
420
03U
NES
CO
10.4
020
10U
NES
CO
Alg
eria
0.
6543
72.6
520
06U
NES
CO
80.8
220
11U
NES
CO
14.0
620
11U
NES
CO
7.60
2010
UN
ESC
O
And
orra
0.
7277
99.0
020
05U
NES
CO
69.0
020
08U
NES
CO
11.7
020
08U
NES
CO
10.4
020
10U
NES
CO
Ang
ola
0.49
4170
.36
2011
UN
ESC
O65
.40
2010
UN
ESC
O10
.24
2010
UN
ESC
O4.
7020
10U
NES
CO
Ant
igua
and
Bar
bud
a 0.
7669
98.9
520
11U
NES
CO
80.6
020
11U
NES
CO
13.5
820
11U
NES
CO
8.90
2010
UN
ESC
O
Arg
entin
a 0.
8571
97.8
620
11U
NES
CO
95.4
320
10U
NES
CO
16.4
320
10U
NES
CO
9.30
2010
UN
ESC
O
Arm
enia
0.
7660
99.5
720
11U
NES
CO
76.7
920
10U
NES
CO
12.1
620
10U
NES
CO
10.8
020
10U
NES
CO
Aus
tral
ia
0.99
7899
.00
2005
UN
ESC
O11
0.21
2010
UN
ESC
O19
.62
2010
UN
ESC
O12
.00
2010
UN
ESC
O
Aus
tria
0.86
6099
.00
2005
UN
ESC
O93
.30
2011
UN
ESC
O15
.59
2011
UN
ESC
O10
.80
2010
UN
ESC
O
Aze
rbai
jan
0.74
8099
.76
2009
UN
ESC
O70
.27
2011
UN
ESC
O11
.76
2011
UN
ESC
O11
.20
2010
UN
ESC
O
Bah
amas
0.
7138
95.8
020
05U
NES
CO
74.0
020
07U
NES
CO
12.6
020
07U
NES
CO
8.50
2010
UN
ESC
O
Bah
rain
0.
7840
94.5
620
10U
NES
CO
85.3
020
06U
NES
CO
14.3
620
06U
NES
CO
9.40
2010
UN
ESC
O
Ban
gla
des
h 0.
3866
57.7
320
11U
NES
CO
56.0
020
05U
NES
CO
8.10
2006
UN
ESC
O4.
8020
10U
NES
CO
Bar
bad
os
0.88
6599
.70
2005
UN
ESC
O10
2.21
2011
UN
ESC
O16
.60
2011
UN
ESC
O9.
3020
10U
NES
CO
Bel
arus
0.
8861
99.6
220
09U
NES
CO
97.2
020
11U
NES
CO
15.2
920
11U
NES
CO
11.5
020
10U
NES
CO
Bel
giu
m
0.89
3299
.00
2005
UN
ESC
O97
.28
2010
UN
ESC
O16
.48
2010
UN
ESC
O10
.90
2010
UN
ESC
O
Bel
ize
0.60
1270
.30
1991
UN
ESC
O74
.12
2003
UN
ESC
O12
.10
2003
UN
ESC
O8.
0020
10U
NES
CO
Ben
in
0.27
5628
.70
2006
UN
ESC
O57
.79
2005
UN
ESC
O9.
3620
05U
NES
CO
3.20
2010
UN
ESC
O
Bhu
tan
0.42
9052
.81
2005
UN
ESC
O67
.60
2011
UN
ESC
O12
.37
2011
UN
ESC
O2.
3020
10U
NES
CO
Bol
ivia
(Plu
rinat
iona
l Sta
te o
f)0.
7424
91.1
720
09U
NES
CO
81.2
520
07U
NES
CO
13.4
820
07U
NES
CO
9.20
2010
UN
ESC
O
Bo
snia
and
Her
zeg
ovin
a 0.
7288
98.0
020
11U
NES
CO
72.0
420
11U
NES
CO
13.5
820
11U
NES
CO
8.30
2010
UN
ESC
O
Bot
swan
a 0.
6555
85.0
920
11U
NES
CO
69.8
420
06U
NES
CO
11.8
420
06U
NES
CO
8.90
2010
UN
ESC
O
Bra
zil
0.73
7290
.38
2010
UN
ESC
O87
.47
2005
UN
ESC
O14
.23
2005
UN
ESC
O7.
2020
10U
NES
CO
Bru
nei D
arus
sala
m
0.78
1595
.45
2011
UN
ESC
O83
.56
2011
UN
ESC
O15
.11
2011
UN
ESC
O8.
6020
10U
NES
CO
Bul
gar
ia
0.79
6098
.35
2011
UN
ESC
O79
.87
2010
UN
ESC
O13
.98
2010
UN
ESC
O10
.60
2010
UN
ESC
O
Bur
kina
Fas
o 0.
1578
28.7
320
07U
NES
CO
41.0
920
11U
NES
CO
6.88
2011
UN
ESC
O1.
3020
10U
NES
CO
Bur
und
i 0.
5393
86.9
520
08U
NES
CO
64.3
120
10U
NES
CO
11.3
320
10U
NES
CO
2.70
2010
UN
ESC
O

230
Ann
exes
ANNEx UNITED NATIONS E-GOVERNMENT SURVEY 2014
Cam
bo
dia
0.
5189
73.9
020
09U
NES
CO
61.7
020
08U
NES
CO
10.5
320
08U
NES
CO
5.80
2010
UN
ESC
O
Cam
ero
on
0.54
2171
.29
2010
UN
ESC
O67
.26
2011
UN
ESC
O11
.50
2011
UN
ESC
O5.
9020
10U
NES
CO
Can
ada
0.89
5299
.00
2005
UN
ESC
O93
.47
2000
UN
ESC
O15
.89
2000
UN
ESC
O12
.30
2010
UN
ESC
O
Cap
e Ve
rde
0.60
3284
.94
2011
UN
ESC
O75
.55
2011
UN
ESC
O12
.99
2011
UN
ESC
O3.
5020
10W
B-I
IDD
Cen
tral
Afr
ican
Rep
ublic
0.
3099
56.6
120
11U
NES
CO
43.0
220
11U
NES
CO
7.21
2011
UN
ESC
O3.
5020
10U
NES
CO
Cha
d
0.23
4135
.39
2011
UN
ESC
O50
.66
2011
UN
ESC
O8.
1520
11U
NES
CO
1.50
2010
WB
-IID
D
Chi
le
0.82
3698
.55
2009
UN
ESC
O87
.61
2011
UN
ESC
O15
.17
2011
UN
ESC
O9.
7020
10U
NES
CO
Chi
na
0.67
3495
.12
2010
UN
ESC
O70
.39
2011
UN
ESC
O11
.88
2011
UN
ESC
O7.
5020
10U
NES
CO
Col
om
bia
0.
7348
93.5
820
11U
NES
CO
85.1
120
11U
NES
CO
13.6
420
11U
NES
CO
7.30
2010
UN
ESC
O
Co
mor
os
0.46
6275
.54
2011
UN
ESC
O59
.66
2005
UN
ESC
O10
.21
2005
UN
ESC
O2.
8020
10W
B-I
IDD
Co
ngo
0.52
3384
.70
2011
UN
DP
54.4
420
03U
NES
CO
9.43
2003
UN
ESC
O5.
9020
10U
NES
CO
Co
sta
Rica
0.
7582
96.2
620
11U
NES
CO
84.2
320
11U
NES
CO
13.5
220
11U
NES
CO
8.40
2010
UN
ESC
O
Côt
e d
’Ivoi
re0.
2992
56.8
720
11U
NES
CO
39.0
819
99U
NES
CO
6.49
1999
UN
ESC
O4.
2020
10U
NES
CO
Cro
atia
0.
7928
98.8
820
11U
NES
CO
81.8
020
10U
NES
CO
14.1
120
10U
NES
CO
9.80
2010
UN
ESC
O
Cub
a 0.
8497
99.8
320
11U
NES
CO
90.7
120
11U
NES
CO
15.4
420
11U
NES
CO
10.2
020
10U
NES
CO
Cyp
rus
0.78
2898
.68
2011
UN
ESC
O79
.20
2010
UN
ESC
O14
.00
2010
UN
ESC
O9.
8020
10U
NES
CO
Cze
ch R
epub
lic
0.87
5599
.00
2005
UN
ESC
O86
.03
2011
UN
ESC
O16
.00
2011
UN
ESC
O12
.30
2010
UN
ESC
O
Dem
ocr
atic
Peo
ple
’s R
epub
lic o
f K
orea
0.
8007
100.
0020
08U
NES
CO
100.
0020
12U
NES
CO
10.0
020
11U
NES
CO
10.8
0A
vera
ge
MYS
cl
uste
r*
Dem
ocr
atic
Rep
ublic
of
the
Co
ngo
0.38
4561
.21
2007
UN
ESC
O55
.63
2011
UN
ESC
O8.
5220
11U
NES
CO
3.50
2010
UN
ESC
O
Den
mar
k 0.
9132
99.0
020
05U
NES
CO
99.2
420
11U
NES
CO
16.8
820
10U
NES
CO
11.4
020
10U
NES
CO
Djib
out
i 0.
3182
70.3
020
05U
NES
CO
34.2
620
11U
NES
CO
5.75
2011
UN
ESC
O3.
8020
10U
NES
CO
Do
min
ica
0.67
0188
.00
2005
UN
ESC
O73
.00
2008
UN
ESC
O12
.70
2008
UN
ESC
O7.
7020
10U
NES
CO
Do
min
ican
Rep
ublic
0.
6639
90.1
120
11U
NES
CO
73.2
020
04U
NES
CO
12.2
820
04U
NES
CO
7.20
2010
UN
ESC
O
Ecua
dor
0.
7037
91.5
920
11U
NES
CO
75.0
020
05U
NES
CO
13.7
020
08U
NES
CO
7.60
2010
UN
ESC
O
Egyp
t 0.
5912
73.8
720
12U
NES
CO
73.1
020
10U
NES
CO
12.4
120
10U
NES
CO
6.40
2010
UN
ESC
O
El S
alva
dor
0.
6414
84.4
920
10U
NES
CO
71.4
020
11U
NES
CO
12.2
220
11U
NES
CO
7.50
2010
UN
ESC
O
Equa
toria
l Gui
nea
0.52
8894
.23
2011
UN
ESC
O55
.06
2002
UN
ESC
O7.
8920
02U
NES
CO
5.40
2010
UN
ESC
O
12.
Hum
an C
apita
l Ind
ex a
nd it
s co
mp
onen
ts (c
ontin
ued
)
Cou
ntry
HC
I
Ad
ult
liter
acy
(%)
Gro
ss e
nrol
men
t ra
tio (%
)E
xpec
ted
yea
rs
of s
cho
olin
gM
ean
year
s of
sch
oo
ling
Ind
ex
valu
eYe
arSo
urce
Ind
ex
Valu
eYe
arSo
urce
Ind
ex
valu
eYe
arSo
urce
Ind
ex
Valu
eYe
arSo
urce

231
Annexes
UNITED NATIONS E-GOVERNMENT SURVEY 2014Er
itrea
0.
2723
68.9
420
11U
NES
CO
28.4
720
10U
NES
CO
4.64
2010
UN
ESC
O3.
4020
10U
NES
CO
Est
oni
a 0.
8889
99.8
020
11U
NES
CO
91.2
220
10U
NES
CO
16.0
120
10U
NES
CO
12.0
020
10U
NES
CO
Eth
iop
ia
0.29
3439
.00
2005
UN
ESC
O57
.43
2011
UN
ESC
O9.
0820
11U
NES
CO
2.20
2010
WB
-IID
D
Fiji
0.83
2294
.40
2005
UN
ESC
O87
.50
2011
UN
ESC
O15
.72
2011
UN
ESC
O10
.70
2010
UN
ESC
O
Finl
and
0.
9037
99.0
020
05U
NES
CO
101.
1820
11U
NES
CO
17.0
420
11U
NES
CO
10.3
020
10U
NES
CO
Fran
ce0.
8812
99.0
020
05U
NES
CO
95.7
320
11U
NES
CO
16.3
120
11U
NES
CO
10.6
020
10U
NES
CO
Gab
on
0.66
7788
.99
2011
UN
ESC
O75
.37
1999
UN
ESC
O12
.08
1999
UN
ESC
O7.
5020
10U
NES
CO
Gam
bia
0.
3326
51.1
120
11U
NES
CO
54.1
320
08U
NES
CO
8.65
2008
UN
ESC
O2.
8020
10U
NES
CO
Geo
rgia
0.
7895
99.7
320
11U
NES
CO
71.8
920
09U
NES
CO
13.1
820
09U
NES
CO
12.1
020
10U
NES
CO
Ger
man
y 0.
8862
99.0
020
05U
NES
CO
88.1
020
11U
NES
CO
16.4
020
09U
NES
CO
12.2
020
10U
NES
CO
Gha
na
0.56
1371
.50
2010
UN
ESC
O66
.87
2012
UN
ESC
O11
.62
2012
UN
ESC
O7.
0020
10U
NES
CO
Gre
ece
0.87
4197
.30
2011
UN
ESC
O98
.60
2007
UN
ESC
O16
.25
2007
UN
ESC
O10
.10
2010
UN
ESC
O
Gre
nad
a 0.
8166
96.0
020
05U
NES
CO
91.1
120
09U
NES
CO
15.8
120
09U
NES
CO
8.60
2010
UN
ESC
O
Gua
tem
ala
0.52
7275
.86
2011
UN
ESC
O70
.65
2007
UN
ESC
O10
.66
2007
UN
ESC
O4.
1020
10U
NES
CO
Gui
nea
0.23
5925
.31
2010
UN
ESC
O56
.74
2011
UN
ESC
O9.
4720
11U
NES
CO
1.60
2010
UN
ESC
O
Gui
nea-
Bis
sau
0.38
6955
.28
2011
UN
ESC
O65
.40
2006
UN
ESC
O9.
5220
06U
NES
CO
2.30
2010
UN
ESC
O
Guy
ana
0.63
0184
.99
2009
UN
ESC
O70
.44
2011
UN
ESC
O10
.56
2011
UN
ESC
O8.
5020
10U
NES
CO
Hai
ti 0.
3372
48.6
920
06U
NES
CO
53.0
020
05U
NES
CO
7.60
2009
UN
ESC
O4.
9020
10U
NES
CO
Ho
ndur
as
0.62
8185
.12
2011
UN
ESC
O74
.54
2010
UN
ESC
O11
.67
2010
UN
ESC
O6.
5020
10U
NES
CO
Hun
gar
y 0.
8668
99.0
520
11U
NES
CO
89.8
020
11U
NES
CO
15.3
620
11U
NES
CO
11.7
020
10U
NES
CO
Icel
and
0.
9178
99.0
020
05U
NES
CO
97.2
520
10U
NES
CO
18.5
420
10U
NES
CO
10.4
020
10U
NES
CO
Ind
ia
0.46
9862
.75
2006
UN
ESC
O65
.07
2010
UN
ESC
O10
.90
2010
UN
ESC
O4.
4020
10U
NES
CO
Ind
one
sia
0.67
8692
.81
2011
UN
ESC
O77
.61
2011
UN
ESC
O13
.16
2011
UN
ESC
O5.
8020
10U
NES
CO
Iran
(Isl
amic
Rep
ublic
of)
0.68
8285
.02
2008
UN
ESC
O76
.71
2011
UN
ESC
O13
.78
2011
UN
ESC
O7.
8020
10U
NES
CO
Iraq
0.
5283
78.4
820
11U
NES
CO
62.6
820
04U
NES
CO
10.0
420
04U
NES
CO
5.60
2010
UN
ESC
O
Irel
and
0.
9619
99.0
020
05U
NES
CO
105.
3220
11U
NES
CO
18.6
520
11U
NES
CO
11.6
020
10U
NES
CO
Isra
el
0.85
4591
.75
1983
UN
ESC
O92
.15
2009
UN
ESC
O15
.70
2009
UN
ESC
O11
.90
2010
UN
ESC
O
Ital
y 0.
8552
98.9
820
11U
NES
CO
90.4
120
10U
NES
CO
16.1
520
10U
NES
CO
10.1
020
10U
NES
CO
Jam
aica
0.
7262
87.0
420
11U
NES
CO
81.8
420
10U
NES
CO
12.9
42 0
10U
NES
CO
9.60
2010
UN
ESC
O
Jap
an
0.86
2199
.00
2005
UN
ESC
O89
.16
2010
UN
ESC
O15
.30
2010
UN
ESC
O11
.60
2010
UN
ESC
O
Jord
an
0.72
0295
.90
2011
UN
ESC
O75
.21
2010
UN
ESC
O12
.65
2010
UN
ESC
O8.
6020
10U
NES
CO
Kaz
akhs
tan
0.86
1999
.73
2009
UN
ESC
O93
.95
2012
UN
ESC
O15
.44
2012
UN
ESC
O10
.40
2010
UN
ESC
O
Ken
ya
0.55
5272
.16
2007
UN
ESC
O67
.03
2009
UN
ESC
O11
.05
2009
UN
ESC
O7.
0020
10U
NES
CO
Kiri
bat
i 0.
6812
93.0
020
12U
N E
-Gov
Su
rvey
73.3
420
08U
NES
CO
12.0
420
08U
NES
CO
7.80
2010
UN
ESC
O

232
Ann
exes
ANNEx UNITED NATIONS E-GOVERNMENT SURVEY 2014
Kuw
ait
0.71
9493
.91
2008
UN
ESC
O83
.09
2004
UN
ESC
O14
.17
2004
UN
ESC
O6.
1020
10U
NES
CO
Kyrg
yzst
an
0.74
1399
.24
2009
UN
ESC
O75
.04
2011
UN
ESC
O12
.51
2011
UN
ESC
O9.
3020
10U
NES
CO
Lao
Peop
le’s
Dem
ocra
tic R
epub
lic
0.49
4172
.70
2005
UN
ESC
O61
.48
2011
UN
ESC
O10
.50
2011
UN
ESC
O4.
6020
10U
NES
CO
Latv
ia
0.82
8899
.78
2011
UN
ESC
O81
.32
2011
UN
ESC
O14
.54
2011
UN
ESC
O11
.50
2010
UN
ESC
O
Leb
ano
n 0.
7374
89.6
120
07U
NES
CO
83.8
920
11U
NES
CO
14.3
720
11U
NES
CO
7.90
2010
UN
ESC
O
Leso
tho
0.51
3575
.80
2009
UN
ESC
O59
.73
2006
UN
ESC
O9.
9820
06U
NES
CO
5.90
2010
UN
ESC
O
Lib
eria
0.
3754
42.9
420
07U
NES
CO
63.1
920
00U
NES
CO
10.5
520
00U
NES
CO
3.90
2010
UN
ESC
O
Lib
ya0.
7821
89.5
420
11U
NES
CO
92.7
520
03U
NES
CO
16.2
020
03U
NES
CO
7.30
2010
UN
ESC
O
Liec
hten
stei
n0.
8361
99.0
020
12U
N E
-Gov
Su
rvey
88.2
920
11U
NES
CO
15.1
220
11U
NES
CO
10.3
020
10U
NES
CO
Lith
uani
a 0.
8557
99.7
020
11U
NES
CO
88.9
520
11U
NES
CO
15.4
720
11U
NES
CO
10.9
020
10U
NES
CO
Luxe
mb
our
g0.
7830
99.0
020
05U
NES
CO
77.8
720
10U
NES
CO
13.8
820
10U
NES
CO
10.1
020
10U
NES
CO
Mad
agas
car
0.48
8964
.48
2009
UN
ESC
O67
.49
2009
UN
ESC
O10
.44
2009
UN
ESC
O5.
2020
10W
B-I
IDD
Mal
awi
0.47
4661
.31
2010
UN
ESC
O70
.03
2011
UN
ESC
O10
.85
2011
UN
ESC
O4.
2020
10U
NES
CO
Mal
aysi
a0.
7119
93.1
220
10U
NES
CO
71.3
320
05U
NES
CO
12.6
020
05U
NES
CO
9.50
2010
UN
ESC
O
Mal
div
es0.
6865
98.4
020
06U
NES
CO
76.1
120
03U
NES
CO
12.5
920
03U
NES
CO
5.80
2010
UN
ESC
O
Mal
i 0.
2212
33.4
420
11U
NES
CO
49.5
120
11U
NES
CO
7.51
2011
UN
ESC
O2.
0020
10U
NES
CO
Mal
ta
0.78
5592
.36
2005
UN
ESC
O81
.89
2010
UN
ESC
O15
.10
2010
UN
ESC
O9.
9020
10U
NES
CO
Mar
shal
l Isl
and
s 0.
7002
94.0
020
12U
N E
-Gov
Su
rvey
69.1
620
03U
NES
CO
11.6
920
03U
NES
CO
9.85
2010
WB
-IID
D
Mau
ritan
ia
0.35
8158
.61
2011
UN
ESC
O50
.69
2011
UN
ESC
O8.
1720
11U
NES
CO
3.70
2010
UN
ESC
O
Mau
ritiu
s 0.
6882
88.8
520
11U
NES
CO
76.0
020
08U
NES
CO
13.6
020
08U
NES
CO
7.20
2010
UN
ESC
O
Mex
ico
0.74
4593
.52
2011
UN
ESC
O81
.24
2011
UN
ESC
O13
.76
2011
UN
ESC
O8.
5020
10U
NES
CO
Mic
rone
sia
(Fed
erat
ed S
tate
s of
) 0.
7023
95.4
020
10U
NES
CO
75
.45
2004
UN
ESC
O11
.40
2009
UN
ESC
O8.
8020
10W
B-I
IDD
Mo
naco
0.
7940
99.0
020
12U
N E
-Gov
Su
rvey
99.0
020
12U
N E
-Gov
Su
rvey
10.0
0N
atio
nal
Sour
ce10
.80
Ave
rag
e
MYS
cl
uste
r*
Mo
ngol
ia
0.78
8797
.36
2011
UN
ESC
O88
.70
2011
UN
ESC
O14
.47
2011
UN
ESC
O8.
3020
10U
NES
CO
Mo
nten
egro
0.82
7998
.46
2011
UN
ESC
O85
.81
2010
UN
ESC
O14
.99
2010
UN
ESC
O10
.50
2010
UN
ESC
O
12.
Hum
an C
apita
l Ind
ex a
nd it
s co
mp
onen
ts (c
ontin
ued
)
Cou
ntry
HC
I
Ad
ult
liter
acy
(%)
Gro
ss e
nrol
men
t ra
tio (%
)E
xpec
ted
yea
rs
of s
cho
olin
gM
ean
year
s of
sch
oo
ling
Ind
ex
valu
eYe
arSo
urce
Ind
ex
Valu
eYe
arSo
urce
Ind
ex
valu
eYe
arSo
urce
Ind
ex
Valu
eYe
arSo
urce
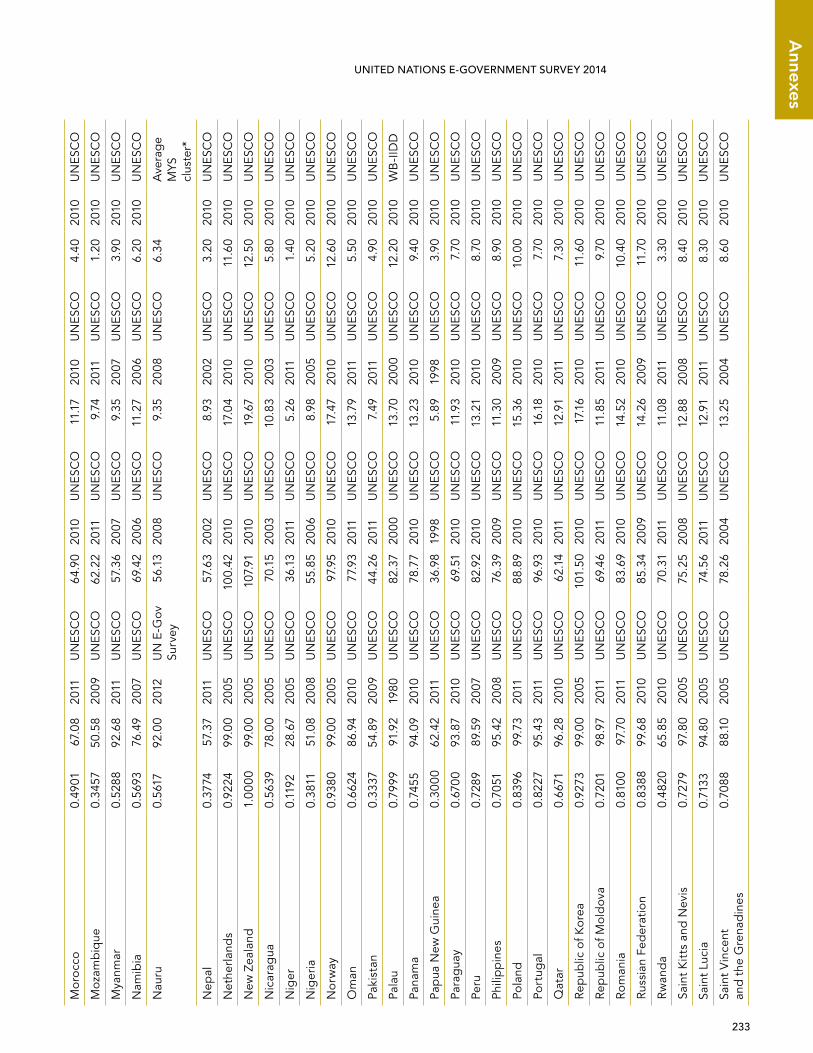
233
Annexes
UNITED NATIONS E-GOVERNMENT SURVEY 2014M
oro
cco
0.49
0167
.08
2011
UN
ESC
O64
.90
2010
UN
ESC
O11
.17
2010
UN
ESC
O4.
4020
10U
NES
CO
Moz
amb
ique
0.
3457
50.5
820
09U
NES
CO
62.2
220
11U
NES
CO
9.74
2011
UN
ESC
O1.
2020
10U
NES
CO
Mya
nmar
0.
5288
92.6
820
11U
NES
CO
57.3
620
07U
NES
CO
9.35
2007
UN
ESC
O3.
9020
10U
NES
CO
Nam
ibia
0.
5693
76.4
920
07U
NES
CO
69.4
220
06U
NES
CO
11.2
720
06U
NES
CO
6.20
2010
UN
ESC
O
Nau
ru
0.56
1792
.00
2012
UN
E-G
ov
Surv
ey56
.13
2008
UN
ESC
O9.
3520
08U
NES
CO
6.34
Ave
rag
e M
YS
clus
ter*
Nep
al
0.37
7457
.37
2011
UN
ESC
O57
.63
2002
UN
ESC
O8.
9320
02U
NES
CO
3.20
2010
UN
ESC
O
Net
herla
nds
0.92
2499
.00
2005
UN
ESC
O10
0.42
2010
UN
ESC
O17
.04
2010
UN
ESC
O11
.60
2010
UN
ESC
O
New
Zea
land
1.
0000
99.0
020
05U
NES
CO
107.
9120
10U
NES
CO
19.6
720
10U
NES
CO
12.5
020
10U
NES
CO
Nic
arag
ua
0.56
3978
.00
2005
UN
ESC
O70
.15
2003
UN
ESC
O10
.83
2003
UN
ESC
O5.
8020
10U
NES
CO
Nig
er
0.11
9228
.67
2005
UN
ESC
O36
.13
2011
UN
ESC
O5.
2620
11U
NES
CO
1.40
2010
UN
ESC
O
Nig
eria
0.
3811
51.0
820
08U
NES
CO
55.8
520
06U
NES
CO
8.98
2005
UN
ESC
O5.
2020
10U
NES
CO
Nor
way
0.
9380
99.0
020
05U
NES
CO
97.9
520
10U
NES
CO
17.4
720
10U
NES
CO
12.6
020
10U
NES
CO
Om
an
0.66
2486
.94
2010
UN
ESC
O77
.93
2011
UN
ESC
O13
.79
2011
UN
ESC
O5.
5020
10U
NES
CO
Paki
stan
0.
3337
54.8
920
09U
NES
CO
44.2
620
11U
NES
CO
7.49
2011
UN
ESC
O4.
9020
10U
NES
CO
Pala
u 0.
7999
91.9
219
80U
NES
CO
82.3
720
00U
NES
CO
13.7
020
00U
NES
CO
12.2
020
10W
B-I
IDD
Pana
ma
0.74
5594
.09
2010
UN
ESC
O78
.77
2010
UN
ESC
O13
.23
2010
UN
ESC
O9.
4020
10U
NES
CO
Pap
ua N
ew G
uine
a 0.
3000
62.4
220
11U
NES
CO
36.9
819
98U
NES
CO
5.89
1998
UN
ESC
O3.
9020
10U
NES
CO
Para
gua
y 0.
6700
93.8
720
10U
NES
CO
69.5
120
10U
NES
CO
11.9
320
10U
NES
CO
7.70
2010
UN
ESC
O
Peru
0.
7289
89.5
920
07U
NES
CO
82.9
220
10U
NES
CO
13.2
120
10U
NES
CO
8.70
2010
UN
ESC
O
Phili
pp
ines
0.
7051
95.4
220
08U
NES
CO
76.3
920
09U
NES
CO
11.3
020
09U
NES
CO
8.90
2010
UN
ESC
O
Pola
nd
0.83
9699
.73
2011
UN
ESC
O88
.89
2010
UN
ESC
O15
.36
2010
UN
ESC
O10
.00
2010
UN
ESC
O
Port
ugal
0.
8227
95.4
320
11U
NES
CO
96.9
320
10U
NES
CO
16.1
820
10U
NES
CO
7.70
2010
UN
ESC
O
Qat
ar
0.66
7196
.28
2010
UN
ESC
O62
.14
2011
UN
ESC
O12
.91
2011
UN
ESC
O7.
3020
10U
NES
CO
Rep
ublic
of K
orea
0.
9273
99.0
020
05U
NES
CO
101.
5020
10U
NES
CO
17.1
620
10U
NES
CO
11.6
020
10U
NES
CO
Rep
ublic
of M
old
ova
0.72
0198
.97
2011
UN
ESC
O69
.46
2011
UN
ESC
O11
.85
2011
UN
ESC
O9.
7020
10U
NES
CO
Rom
ania
0.
8100
97.7
020
11U
NES
CO
83.6
920
10U
NES
CO
14.5
220
10U
NES
CO
10.4
020
10U
NES
CO
Russ
ian
Fed
erat
ion
0.83
8899
.68
2010
UN
ESC
O85
.34
2009
UN
ESC
O14
.26
2009
UN
ESC
O11
.70
2010
UN
ESC
O
Rw
and
a 0.
4820
65.8
520
10U
NES
CO
70.3
120
11U
NES
CO
11.0
820
11U
NES
CO
3.30
2010
UN
ESC
O
Sain
t K
itts
and
Nev
is
0.72
7997
.80
2005
UN
ESC
O75
.25
2008
UN
ESC
O12
.88
2008
UN
ESC
O8.
4020
10U
NES
CO
Sain
t Lu
cia
0.71
3394
.80
2005
UN
ESC
O74
.56
2011
UN
ESC
O12
.91
2011
UN
ESC
O8.
3020
10U
NES
CO
Sain
t V
ince
nt
and
the
Gre
nad
ines
0.
7088
88.1
020
05U
NES
CO
78.2
620
04U
NES
CO
13.2
520
04U
NES
CO
8.60
2010
UN
ESC
O
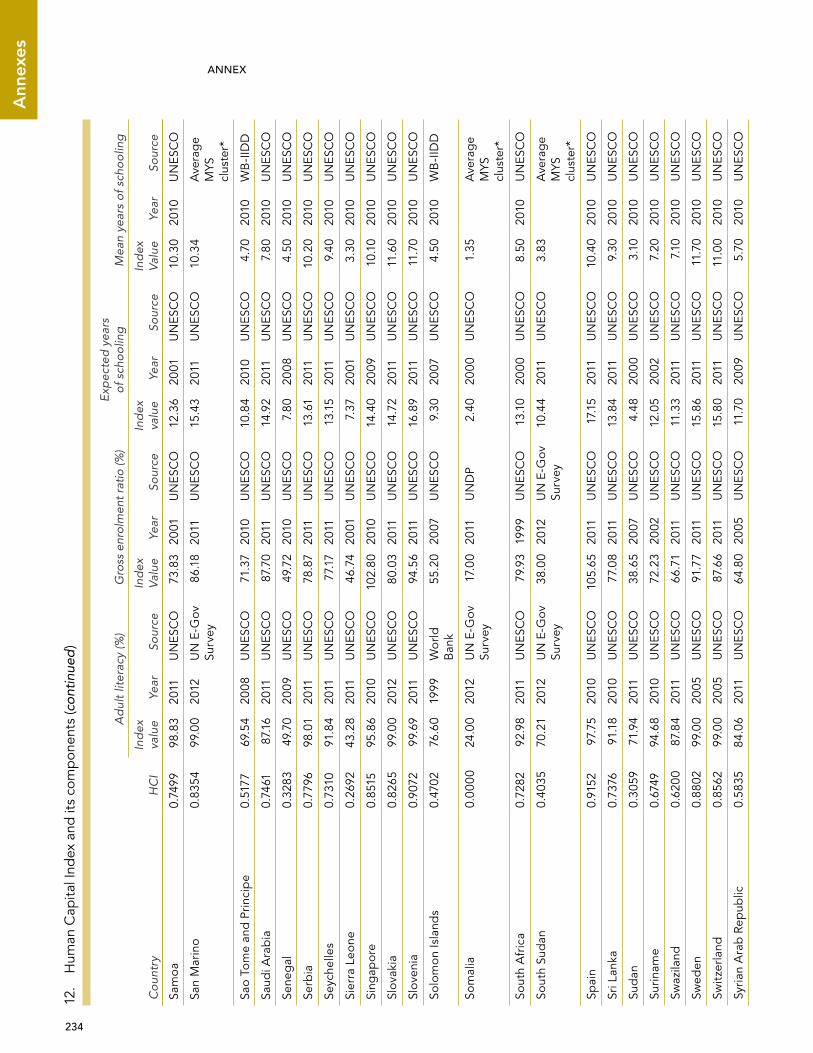
234
Ann
exes
ANNEx UNITED NATIONS E-GOVERNMENT SURVEY 2014
Sam
oa
0.74
9998
.83
2011
UN
ESC
O73
.83
2001
UN
ESC
O12
.36
2001
UN
ESC
O10
.30
2010
UN
ESC
O
San
Mar
ino
0.83
5499
.00
2012
UN
E-G
ov
Surv
ey86
.18
2011
UN
ESC
O15
.43
2011
UN
ESC
O10
.34
Ave
rag
e M
YS
clus
ter*
Sao
Tom
e an
d P
rinci
pe
0.51
7769
.54
2008
UN
ESC
O71
.37
2010
UN
ESC
O10
.84
2010
UN
ESC
O4.
7020
10W
B-I
IDD
Saud
i Ara
bia
0.
7461
87.1
620
11U
NES
CO
87.7
020
11U
NES
CO
14.9
220
11U
NES
CO
7.80
2010
UN
ESC
O
Sene
gal
0.
3283
49.7
020
09U
NES
CO
49.7
220
10U
NES
CO
7.80
2008
UN
ESC
O4.
5020
10U
NES
CO
Serb
ia0.
7796
98.0
120
11U
NES
CO
78.8
720
11U
NES
CO
13.6
120
11U
NES
CO
10.2
020
10U
NES
CO
Seyc
helle
s 0.
7310
91.8
420
11U
NES
CO
77.1
720
11U
NES
CO
13.1
520
11U
NES
CO
9.40
2010
UN
ESC
O
Sier
ra L
eone
0.
2692
43.2
820
11U
NES
CO
46.7
420
01U
NES
CO
7.37
2001
UN
ESC
O3.
3020
10U
NES
CO
Sing
apor
e 0.
8515
95.8
620
10U
NES
CO
102.
8020
10U
NES
CO
14.4
020
09U
NES
CO
10.1
020
10U
NES
CO
Slov
akia
0.
8265
99.0
020
12U
NES
CO
80.0
320
11U
NES
CO
14.7
220
11U
NES
CO
11.6
020
10U
NES
CO
Slov
enia
0.
9072
99.6
920
11U
NES
CO
94.5
620
11U
NES
CO
16.8
920
11U
NES
CO
11.7
020
10U
NES
CO
Solo
mo
n Is
land
s 0.
4702
76.6
019
99W
orld
B
ank
55.2
020
07U
NES
CO
9.30
2007
UN
ESC
O4.
5020
10W
B-I
IDD
Som
alia
0.
0000
24.0
020
12U
N E
-Gov
Su
rvey
17.0
020
11U
ND
P2.
4020
00U
NES
CO
1.35
Ave
rag
e M
YS
clus
ter*
Sout
h A
fric
a 0.
7282
92.9
820
11U
NES
CO
79.9
319
99U
NES
CO
13.1
020
00U
NES
CO
8.50
2010
UN
ESC
O
Sout
h Su
dan
0.40
3570
.21
2012
UN
E-G
ov
Surv
ey38
.00
2012
UN
E-G
ov
Surv
ey10
.44
2011
UN
ESC
O3.
83A
vera
ge
MYS
cl
uste
r*
Spai
n 0.
9152
97.7
520
10U
NES
CO
105.
6520
11U
NES
CO
17.1
520
11U
NES
CO
10.4
020
10U
NES
CO
Sri L
anka
0.
7376
91.1
820
10U
NES
CO
77.0
820
11U
NES
CO
13.8
420
11U
NES
CO
9.30
2010
UN
ESC
O
Sud
an
0.30
5971
.94
2011
UN
ESC
O38
.65
2007
UN
ESC
O4.
4820
00U
NES
CO
3.10
2010
UN
ESC
O
Surin
ame
0.67
4994
.68
2010
UN
ESC
O72
.23
2002
UN
ESC
O12
.05
2002
UN
ESC
O7.
2020
10U
NES
CO
Swaz
iland
0.
6200
87.8
420
11U
NES
CO
66.7
120
11U
NES
CO
11.3
320
11U
NES
CO
7.10
2010
UN
ESC
O
Swed
en
0.88
0299
.00
2005
UN
ESC
O91
.77
2011
UN
ESC
O15
.86
2011
UN
ESC
O11
.70
2010
UN
ESC
O
Swit
zerla
nd
0.85
6299
.00
2005
UN
ESC
O87
.66
2011
UN
ESC
O15
.80
2011
UN
ESC
O11
.00
2010
UN
ESC
O
Syria
n A
rab
Rep
ublic
0.
5835
84.0
620
11U
NES
CO
64.8
020
05U
NES
CO
11.7
020
09U
NES
CO
5.70
2010
UN
ESC
O
12.
Hum
an C
apita
l Ind
ex a
nd it
s co
mp
onen
ts (c
ontin
ued
)
Cou
ntry
HC
I
Ad
ult
liter
acy
(%)
Gro
ss e
nrol
men
t ra
tio (%
)E
xpec
ted
yea
rs
of s
cho
olin
gM
ean
year
s of
sch
oo
ling
Ind
ex
valu
eYe
arSo
urce
Ind
ex
Valu
eYe
arSo
urce
Ind
ex
valu
eYe
arSo
urce
Ind
ex
Valu
eYe
arSo
urce

235
Annexes
UNITED NATIONS E-GOVERNMENT SURVEY 2014Ta
jikis
tan
0.72
4999
.71
2011
UN
ESC
O71
.50
2011
UN
ESC
O11
.51
2011
UN
ESC
O9.
8020
10U
NES
CO
Thai
land
0.
6640
93.5
120
05U
NES
CO
71.9
220
09U
NES
CO
12.3
020
09U
NES
CO
6.60
2010
UN
ESC
O
The
form
er Y
ugo
slav
Rep
ublic
of
Mac
edo
nia
0.71
9897
.38
2011
UN
ESC
O71
.29
2010
UN
ESC
O13
.40
2010
UN
ESC
O8.
2020
10U
NES
CO
Tim
or-L
este
0.48
3158
.31
2010
UN
ESC
O71
.04
2009
UN
ESC
O11
.72
2009
UN
ESC
O4.
4020
10W
B-I
IDD
Tog
o 0.
5401
60.4
120
11U
NES
CO
76.2
720
11U
NES
CO
12.9
420
11U
NES
CO
5.30
2010
UN
ESC
O
Tong
a 0.
8304
99.0
220
06U
NES
CO
88.5
320
03U
NES
CO
14.7
220
03U
NES
CO
10.3
020
10U
NES
CO
Trin
idad
and
To
bag
o 0.
6945
98.8
320
11U
NES
CO
64.1
020
04U
NES
CO
11.7
520
04U
NES
CO
9.20
2010
UN
ESC
O
Tuni
sia
0.67
1779
.13
2010
UN
ESC
O79
.74
2011
UN
ESC
O14
.91
2011
UN
ESC
O6.
5020
10U
NES
CO
Turk
ey
0.71
3394
.11
2011
UN
ESC
O80
.79
2010
UN
ESC
O13
.75
2010
UN
ESC
O6.
5020
10U
NES
CO
Turk
men
ista
n 0.
7478
99.6
120
11U
NES
CO
73.0
020
05U
NES
CO
12.6
020
09U
NES
CO
9.90
2010
WB
-IID
D
Tuva
lu
0.70
2298
.00
2012
UN
E-G
ov
Surv
ey72
.33
2001
UN
ESC
O10
.80
2001
UN
ESC
O9.
33A
vera
ge
MYS
cl
uste
r*
Ug
and
a 0.
5271
73.2
120
10U
NES
CO
68.5
420
09U
NES
CO
11.0
720
09U
NES
CO
4.70
2010
UN
ESC
O
Ukr
aine
0.86
1699
.72
2011
UN
ESC
O92
.46
2011
UN
ESC
O14
.79
2011
UN
ESC
O11
.30
2010
UN
ESC
O
Uni
ted
Ara
b E
mira
tes
0.66
5790
.03
2005
UN
ESC
O66
.00
2000
UN
ESC
O12
.00
2005
UN
ESC
O8.
9020
10U
NES
CO
Uni
ted
Kin
gd
om
of G
reat
B
ritai
n an
d N
orth
ern
Irel
and
0.85
7499
.00
2005
UN
ESC
O91
.88
2010
UN
ESC
O16
.72
2010
UN
ESC
O9.
4020
10U
NES
CO
Uni
ted
Rep
ublic
of T
anza
nia
0.44
9267
.80
2010
UN
ESC
O56
.64
2012
UN
ESC
O9.
2220
12U
NES
CO
5.10
2010
UN
ESC
O
Uni
ted
Sta
tes
of A
mer
ica
0.93
9099
.00
2005
UN
ESC
O98
.31
2010
UN
ESC
O16
.76
2010
UN
ESC
O13
.30
2010
UN
ESC
O
Uru
gua
y 0.
8148
98.0
720
10U
NES
CO
89.9
520
10U
NES
CO
15.5
120
10U
NES
CO
8.50
2010
UN
ESC
O
Uzb
ekis
tan
0.72
6499
.43
2011
UN
ESC
O70
.75
2011
UN
ESC
O11
.60
2011
UN
ESC
O10
.00
2010
UN
ESC
O
Vanu
atu
0.57
3683
.22
2011
UN
ESC
O63
.13
2004
UN
ESC
O10
.57
2004
UN
ESC
O6.
7020
10U
NES
CO
Vene
zuel
a (B
oliv
aria
n Re
pub
lic o
f)0.
7685
95.5
120
05U
NES
CO
89.1
820
09U
NES
CO
14.2
620
09U
NES
CO
7.60
2010
UN
ESC
O
Vie
t N
am
0.61
4893
.36
2011
UN
ESC
O63
.40
1998
UN
ESC
O11
.90
2010
UN
ESC
O5.
5020
10U
NES
CO
Yem
en
0.38
4065
.26
2011
UN
ESC
O54
.67
2005
UN
ESC
O8.
7020
05U
NES
CO
2.50
2010
UN
ESC
O
Zam
bia
0.
4504
61.4
320
07U
NES
CO
60.5
020
05U
NES
CO
8.50
2009
UN
ESC
O6.
7020
10U
NES
CO
Zim
bab
we
0.54
4583
.58
2011
UN
ESC
O52
.40
2005
UN
ESC
O10
.119
90U
NES
CO
7.2
2010
UN
ESC
O
* Re
fer
to s
ectio
n A
.3 H
uman
Cap
ital
Ind
ex:
Mis
sing
dat
a fo
r m
ean
year
s of
sch
oo
ling
.

236
Ann
exes
ANNEx UNITED NATIONS E-GOVERNMENT SURVEY 2014
Regional and economic groupings
HCIAdult
literacy (%)
Gross enrolment ratio (%)
Expected years of schooling
Mean years of schooling
Africa 0.4492 64.65 59.74 9.87 4.65
Americas 0.7202 90.83 79.85 13.29 8.33
Asia 0.6615 86.79 74.08 12.38 7.58
Europe 0.8434 98.63 88.54 15.25 10.67
Oceania 0.7073 91.20 75.15 12.63 8.94
World 0.6566 84.29 74.41 12.50 7.68
HCIAdult
literacy (%)
Gross enrolment ratio (%)
Expected years of schooling
Mean years of schooling
Small island developing States 0.6654 87.51 74.29 12.26 7.72
Land Locked Developing Countries 0.5368 73.86 64.92 10.74 6.14
Least Developed Countries 0.3960 59.98 56.26 9.04 3.87
HCIAdult
literacy (%)
Gross enrolment ratio (%)
Expected years of schooling
Mean years of schooling
High Income 0.8343 97.58 88.87 15.30 10.25
Upper Middle Income 0.7253 92.17 78.54 13.29 8.58
Lower Middle Income 0.5787 80.19 66.84 11.08 6.56
Low Income 0.3884 57.28 56.69 9.06 3.95

237
Annexes
UNITED NATIONS E-GOVERNMENT SURVEY 2014
13. E-Participation Index and its utilisation by stages
Rank 2014* Country EPI Total (%) Stage 1 (%) Stage 2 (%) Stage 3 (%)
152 Afghanistan 0.1373 13.79 22.22 9.09 0.00
59 Albania 0.5294 48.28 85.19 22.73 0.00
172 Algeria 0.0784 8.62 18.52 0.00 0.00
77 Andorra 0.4314 39.66 74.07 13.64 0.00
129 Angola 0.2353 22.41 40.74 9.09 0.00
63 Antigua and Barbuda 0.5098 46.55 66.67 36.36 11.11
54 Argentina 0.5490 50.00 85.19 27.27 0.00
59 Armenia 0.5294 48.28 85.19 22.73 0.00
7 Australia 0.9412 84.48 92.59 77.27 77.78
40 Austria 0.6275 56.90 96.30 31.82 0.00
77 Azerbaijan 0.4314 39.66 81.48 4.55 0.00
137 Bahamas 0.1961 18.97 33.33 9.09 0.00
14 Bahrain 0.8235 74.14 85.19 81.82 22.22
84 Bangladesh 0.3922 36.21 62.96 18.18 0.00
164 Barbados 0.0980 10.34 18.52 4.55 0.00
92 Belarus 0.3529 32.76 70.37 0.00 0.00
40 Belgium 0.6275 56.90 92.59 36.36 0.00
110 Belize 0.2941 27.59 51.85 9.09 0.00
143 Benin 0.1765 17.24 29.63 9.09 0.00
92 Bhutan 0.3529 32.76 62.96 9.09 0.00
81 Bolivia 0.4118 37.93 66.67 18.18 0.00
129 Bosnia and Herzegovina 0.2353 22.41 37.04 13.64 0.00
107 Botswana 0.3137 29.31 51.85 13.64 0.00
24 Brazil 0.7059 63.79 92.59 54.55 0.00
179 Brunei 0.0588 6.90 7.41 9.09 0.00
122 Bulgaria 0.2549 24.14 44.44 9.09 0.00
152 Burkina Faso 0.1373 13.79 18.52 13.64 0.00
179 Burundi 0.0588 6.90 14.81 0.00 0.00
137 Cambodia 0.1961 18.97 37.04 4.55 0.00
148 Cameroon 0.1569 15.52 33.33 0.00 0.00
14 Canada 0.8235 74.14 96.30 77.27 0.00
164 Cape Verde 0.0980 10.34 22.22 0.00 0.00
183 Central African Republic 0.0392 5.17 7.41 4.55 0.00
172 Chad 0.0784 8.62 14.81 4.55 0.00
7 Chile 0.9412 84.48 92.59 95.45 33.33
33 China 0.6471 58.62 85.19 50.00 0.00
11 Colombia 0.8824 79.31 74.07 81.82 88.89
183 Comoros 0.0392 5.17 11.11 0.00 0.00
164 Congo, Republic of 0.0980 10.34 14.81 9.09 0.00
14 Costa Rica 0.8235 74.14 92.59 77.27 11.11

238
Ann
exes
ANNEx UNITED NATIONS E-GOVERNMENT SURVEY 2014
Rank 2014* Country EPI Total (%) Stage 1 (%) Stage 2 (%) Stage 3 (%)
143 Côte d’Ivoire 0.1765 17.24 22.22 18.18 0.00
97 Croatia 0.3333 31.03 44.44 27.27 0.00
92 Cuba 0.3529 32.76 62.96 9.09 0.00
107 Cyprus 0.3137 29.31 40.74 22.73 11.11
122 Czech Republic 0.2549 24.14 40.74 13.64 0.00
186 Democratic People’s Republic of Korea 0.0196 3.45 7.41 0.00 0.00
186 Democratic Republic of the Congo 0.0196 3.45 3.70 4.55 0.00
54 Denmark 0.5490 50.00 92.59 18.18 0.00
172 Djibouti 0.0784 8.62 18.52 0.00 0.00
158 Dominica 0.1176 12.07 25.93 0.00 0.00
97 Dominican Republic 0.3333 31.03 48.15 22.73 0.00
65 Ecuador 0.4902 44.83 77.78 22.73 0.00
54 Egypt 0.5490 50.00 70.37 40.91 11.11
45 El Salvador 0.6078 55.17 85.19 40.91 0.00
186 Equatorial Guinea 0.0196 3.45 7.41 0.00 0.00
192 Eritrea 0.0000 1.72 3.70 0.00 0.00
22 Estonia 0.7647 68.97 88.89 68.18 11.11
122 Ethiopia 0.2549 24.14 29.63 27.27 0.00
84 Fiji 0.3922 36.21 59.26 18.18 11.11
24 Finland 0.7059 63.79 92.59 45.45 22.22
4 France 0.9608 86.21 96.30 77.27 77.78
134 Gabon 0.2157 20.69 37.04 9.09 0.00
134 Gambia 0.2157 20.69 40.74 4.55 0.00
49 Georgia 0.5882 53.45 88.89 27.27 11.11
24 Germany 0.7059 63.79 96.30 45.45 11.11
84 Ghana 0.3922 36.21 66.67 13.64 0.00
17 Greece 0.8039 72.41 77.78 86.36 22.22
84 Grenada 0.3922 36.21 59.26 22.73 0.00
137 Guatemala 0.1961 18.97 22.22 22.73 0.00
186 Guinea 0.0196 3.45 7.41 0.00 0.00
186 Guinea-Bissau 0.0196 3.45 3.70 4.55 0.00
97 Guyana 0.3333 31.03 51.85 18.18 0.00
143 Haiti 0.1765 17.24 25.93 13.64 0.00
97 Honduras 0.3333 31.03 40.74 31.82 0.00
75 Hungary 0.4510 41.38 81.48 9.09 0.00
65 Iceland 0.4902 44.83 77.78 22.73 0.00
40 India 0.6275 56.90 92.59 36.36 0.00
110 Indonesia 0.2941 27.59 55.56 4.55 0.00
110 Iran (Islamic Republic of) 0.2941 27.59 55.56 4.55 0.00
152 Iraq 0.1373 13.79 22.22 9.09 0.00
13. E-Participation Index and its utilisation by stages (continued)

239
Annexes
UNITED NATIONS E-GOVERNMENT SURVEY 2014
Rank 2014* Country EPI Total (%) Stage 1 (%) Stage 2 (%) Stage 3 (%)
33 Ireland 0.6471 58.62 88.89 45.45 0.00
12 Israel 0.8627 77.59 96.30 86.36 0.00
19 Italy 0.7843 70.69 100.00 63.64 0.00
137 Jamaica 0.1961 18.97 29.63 13.64 0.00
4 Japan 0.9608 86.21 85.19 86.36 88.89
71 Jordan 0.4706 43.10 74.07 18.18 11.11
22 Kazakhstan 0.7647 68.97 88.89 68.18 11.11
33 Kenya 0.6471 58.62 92.59 40.91 0.00
110 Kiribati 0.2941 27.59 40.74 22.73 0.00
77 Kuwait 0.4314 39.66 70.37 18.18 0.00
81 Kyrgyzstan 0.4118 37.93 74.07 9.09 0.00
137 Lao 0.1961 18.97 40.74 0.00 0.00
24 Latvia 0.7059 63.79 81.48 59.09 22.22
110 Lebanon 0.2941 27.59 44.44 18.18 0.00
152 Lesotho 0.1373 13.79 25.93 4.55 0.00
158 Liberia 0.1176 12.07 14.81 13.64 0.00
179 Libya 0.0588 6.90 7.41 9.09 0.00
117 Liechtenstein 0.2745 25.86 40.74 18.18 0.00
33 Lithuania 0.6471 58.62 81.48 54.55 0.00
54 Luxembourg 0.5490 50.00 85.19 27.27 0.00
92 Madagascar 0.3529 32.76 62.96 9.09 0.00
129 Malawi 0.2353 22.41 44.44 4.55 0.00
59 Malaysia 0.5294 48.28 77.78 31.82 0.00
117 Maldives 0.2745 25.86 48.15 9.09 0.00
148 Mali 0.1569 15.52 33.33 0.00 0.00
71 Malta 0.4706 43.10 77.78 18.18 0.00
122 Marshall Islands 0.2549 24.14 51.85 0.00 0.00
172 Mauritania 0.0784 8.62 18.52 0.00 0.00
59 Mauritus 0.5294 48.28 81.48 27.27 0.00
45 Mexico 0.6078 55.17 100.00 22.73 0.00
122 Micronesia (Federated States of) 0.2549 24.14 51.85 0.00 0.00
164 Monaco 0.0980 10.34 14.81 9.09 0.00
30 Mongolia 0.6863 62.07 77.78 68.18 0.00
49 Montenegro 0.5882 53.45 74.07 40.91 22.22
17 Morocco 0.8039 72.41 85.19 72.73 33.33
97 Mozambique 0.3333 31.03 51.85 18.18 0.00
172 Myanmar (ex-Birma) 0.0784 8.62 14.81 4.55 0.00
97 Namibia 0.3333 31.03 55.56 9.09 11.11
172 Nauru 0.0784 8.62 14.81 4.55 0.00
110 Nepal 0.2941 27.59 48.15 13.64 0.00
13. E-Participation Index and its utilisation by stages (continued)

240
Ann
exes
ANNEx UNITED NATIONS E-GOVERNMENT SURVEY 2014
Rank 2014* Country EPI Total (%) Stage 1 (%) Stage 2 (%) Stage 3 (%)
1 Netherlands 1.0000 89.66 96.30 86.36 77.78
19 New Zealand 0.7843 70.69 92.59 72.73 0.00
164 Nicaragua 0.0980 10.34 11.11 13.64 0.00
129 Niger 0.2353 22.41 48.15 0.00 0.00
97 Nigeria 0.3333 31.03 48.15 18.18 11.11
30 Norway 0.6863 62.07 92.59 45.45 11.11
24 Oman 0.7059 63.79 88.89 54.55 11.11
97 Pakistan 0.3333 31.03 62.96 4.55 0.00
129 Palau 0.2353 22.41 44.44 4.55 0.00
65 Panama 0.4902 44.83 81.48 18.18 0.00
192 Papau New Guinea 0.0000 1.72 3.70 0.00 0.00
122 Paraguay 0.2549 24.14 44.44 9.09 0.00
24 Peru 0.7059 63.79 85.19 45.45 44.44
51 Philippines 0.5686 51.72 81.48 36.36 0.00
65 Poland 0.4902 44.83 66.67 31.82 11.11
33 Portugal 0.6471 58.62 92.59 40.91 0.00
45 Qatar 0.6078 55.17 88.89 27.27 22.22
1 Republic of Korea 1.0000 89.66 96.30 81.82 88.89
40 Republic of Moldova 0.6275 56.90 81.48 36.36 33.33
71 Romania 0.4706 43.10 66.67 31.82 0.00
30 Russian Federation 0.6863 62.07 81.48 36.36 66.67
63 Rwanda 0.5098 46.55 77.78 27.27 0.00
158 Saint Kitts and Nevis 0.1176 12.07 22.22 4.55 0.00
117 Saint Lucia 0.2745 25.86 33.33 27.27 0.00
148 Saint Vincent and the Grenadines 0.1569 15.52 29.63 4.55 0.00
84 Samoa 0.3922 36.21 74.07 4.55 0.00
137 San Marino 0.1961 18.97 37.04 4.55 0.00
186 São Tomé and Príncipe 0.0196 3.45 7.41 0.00 0.00
51 Saudi Arabia 0.5686 51.72 85.19 27.27 11.11
92 Senegal 0.3529 32.76 70.37 0.00 0.00
81 Serbia 0.4118 37.93 62.96 22.73 0.00
122 Seychelles 0.2549 24.14 40.74 9.09 11.11
164 Sierra Leone 0.0980 10.34 11.11 13.64 0.00
10 Singapore 0.9020 81.03 96.30 90.91 11.11
40 Slovakia 0.6275 56.90 74.07 50.00 22.22
84 Slovenia 0.3922 36.21 48.15 31.82 11.11
172 Solomon Islands 0.0784 8.62 14.81 4.55 0.00
183 Somalia 0.0392 5.17 7.41 4.55 0.00
97 South Africa 0.3333 31.03 55.56 13.64 0.00
13. E-Participation Index and its utilisation by stages (continued)

241
Annexes
UNITED NATIONS E-GOVERNMENT SURVEY 2014
Rank 2014* Country EPI Total (%) Stage 1 (%) Stage 2 (%) Stage 3 (%)
179 South Sudan 0.0588 6.90 11.11 4.55 0.00
19 Spain 0.7843 70.69 100.00 63.64 0.00
33 Sri Lanka 0.6471 58.62 85.19 50.00 0.00
117 Sudan 0.2745 25.86 51.85 4.55 0.00
152 Suriname 0.1373 13.79 29.63 0.00 0.00
148 Swaziland 0.1569 15.52 29.63 0.00 11.11
45 Sweden 0.6078 55.17 85.19 40.91 0.00
91 Switzerland 0.3725 34.48 37.04 27.27 44.44
164 Syria 0.0980 10.34 14.81 9.09 0.00
158 Tajikistan 0.1176 12.07 22.22 4.55 0.00
54 Thailand 0.5490 50.00 85.19 27.27 0.00
134 The former Yugoslav Republic of Macedonia 0.2157 20.69 33.33 13.64 0.00
110 Timor-Leste 0.2941 27.59 48.15 13.64 0.00
164 Togo 0.0980 10.34 22.22 0.00 0.00
97 Tonga 0.3333 31.03 55.56 13.64 0.00
107 Trinidad and Tobago 0.3137 29.31 51.85 13.64 0.00
33 Tunisia 0.6471 58.62 81.48 54.55 0.00
65 Turkey 0.4902 44.83 70.37 27.27 11.11
158 Turkmenistan 0.1176 12.07 25.93 0.00 0.00
158 Tuvalu 0.1176 12.07 25.93 0.00 0.00
152 Uganda 0.1373 13.79 14.81 18.18 0.00
77 Ukraine 0.4314 39.66 62.96 27.27 0.00
13 United Arab Emirates 0.8431 75.86 92.59 72.73 33.33
4 United Kingdom 0.9608 86.21 96.30 77.27 77.78
84 United Republic of Tanzania
0.3922 36.21 74.07 4.55 0.00
9 United States 0.9216 82.76 96.30 63.64 88.89
3 Uruguay 0.9804 87.93 88.89 95.45 66.67
71 Uzbekistan 0.4706 43.10 77.78 18.18 0.00
143 Vanuatu 0.1765 17.24 33.33 4.55 0.00
51 Venezuela 0.5686 51.72 81.48 36.36 0.00
65 Vietnam 0.4902 44.83 70.37 31.82 0.00
117 Yemen 0.2745 25.86 51.85 4.55 0.00
143 Zambia 0.1765 17.24 33.33 4.55 0.00
75 Zimbabwe 0.4510 41.38 70.37 22.73 0.00
* In 2014, the E-Participation ranking used was the “Standard Competition Ranking” (1224), as opposed to the “Dense Ranking” (1223). Refer to section A.6 The e-Participation Index.
13. E-Participation Index and its utilisation by stages (continued)

242
Ann
exes
ANNEx UNITED NATIONS E-GOVERNMENT SURVEY 2014
Regional and Economic Groupings
Country EPI Total (%)Stage 1
(%)Stage 2
(%)Stage 3
(%)
Africa 0.2190 20.98 35.53 11.03 1.65
Americas 0.4398 40.39 58.73 30.39 9.84
Asia 0.4506 41.34 63.36 28.24 7.33
Europe 0.5454 49.68 73.21 35.94 12.66
Oceania 0.3095 28.94 46.83 16.23 6.35
World 0.3947 36.43 55.73 24.66 7.31
EPI Total (%)Stage 1
(%)Stage 2
(%)Stage 3
(%)
Small Island Developing States 0.2595 24.55 40.94 13.76 1.75
Land Locked Developing Countries 0.2935 27.53 46.71 14.52 1.79
Least Developed Countries 0.1720 16.85 30.48 7.00 0.00
EPI Total (%)Stage 1
(%)Stage 2
(%)Stage 3
(%)
High Income 0.6001 54.64 74.07 45.29 19.19
Upper Middle Income 0.3824 35.34 58.07 20.21 4.17
Lower Middle Income 0.3218 31.73 51.69 18.47 4.26
Low Income 0.1815 17.68 30.37 9.35 0.00

243
Annexes
UNITED NATIONS E-GOVERNMENT SURVEY 2014
14. Regional and Economic Grouping
Country Region Sub-Region EGDI Level Level of Income GNI
Afghanistan Asia Southern Asia Low Low 690
Albania Europe Southern Europe High Upper Middle 4520
Algeria Africa Northern Africa Middle Upper Middle 4970
Andorra Europe Southern Europe High High 41122***
Angola Africa Middle Africa Middle Upper Middle 4510
Antigua and Barbuda Americas Caribbean High High 12720
Argentina Americas South America High Upper Middle 11363
Armenia Asia Western Asia High Lower Middle 3770
Australia Oceania Australia and New Zealand
Very High High 59790
Austria Europe Western Europe Very High High 47960
Azerbaijan Asia Western Asia High Upper Middle 6290
Bahamas Americas Caribbean Middle High 20600
Bahrain Asia Western Asia Very High High 19560
Bangladesh Asia Southern Asia Middle Low 830
Barbados Americas Caribbean High High 15080
Belarus Europe Eastern Europe High Upper Middle 6400
Belgium Europe Western Europe Very High High 44810
Belize Americas Central America Middle Upper Middle 4620
Benin Africa Western Africa Low Low 750
Bhutan Asia Southern Asia Middle Lower Middle 2420
Bolivia (Plurinational State of) Americas South America Middle Lower Middle 2220
Bosnia and Herzegovina Europe Southern Europe Middle Upper Middle 4600
Botswana Africa Southern Africa Middle Upper Middle 7650
Brazil Americas South America High Upper Middle 11640
Brunei Darussalam Asia South-Eastern Asia High High 31590**
Bulgaria Europe Eastern Europe High Upper Middle 6850
Burkina Faso Africa Western Africa Low Low 670
Burundi Africa Eastern Africa Low Low 240
Cambodia Asia South-Eastern Asia Middle Low 880
Cameroon Africa Middle Africa Middle Lower Middle 1190
Canada Americas North America Very High High 50650
Cape Verde Africa Western Africa Middle Lower Middle 3610
Central African Republic Africa Middle Africa Low Low 490
Chad Africa Middle Africa Low Low 970
Chile Americas South America High High 14290
China Asia Eastern Asia High Upper Middle 5720
Colombia Americas South America High Upper Middle 7010
Comoros Africa Eastern Africa Low Low 840
Congo Africa Middle Africa Middle Lower Middle 2550
Costa Rica Americas Central America High Upper Middle 8850

244
Ann
exes
ANNEX UNITED NATIONS E-GOVERNMENT SURVEY 2014
Country Region Sub-Region EGDI Level Level of Income GNI
Côte d’Ivoire Africa Western Africa Low Lower Middle 1220
Croatia Europe Southern Europe High High 13260
Cuba Americas Caribbean Middle Upper Middle 5890*
Cyprus Asia Western Asia High High 26410
Czech Republic Europe Eastern Europe High High 18130
Democratic People's Republic of Korea Asia Eastern Asia Middle Low 583
Democratic Republic of the Congo Africa Middle Africa Low Low 370
Denmark Europe Northern Europe Very High High 59860
Djibouti Africa Eastern Africa Low Lower Middle 1690
Dominica Americas Caribbean Middle Upper Middle 6590
Dominican Republic Americas Caribbean Middle Upper Middle 5430
Ecuador Americas South America High Upper Middle 5170
Egypt Africa Northern Africa High Lower Middle 2980
El Salvador Americas Central America Middle Lower Middle 3600
Equatorial Guinea Africa Middle Africa Low High 14040
Eritrea Africa Eastern Africa Low Low 450
Estonia Europe Northern Europe Very High High 16360
Ethiopia Africa Eastern Africa Middle Low 410
Fiji Oceania Melanesia High Lower Middle 4010
Finland Europe Northern Europe Very High High 46820
France Europe Western Europe Very High High 41860
Gabon Africa Middle Africa Middle Upper Middle 10020
Gambia Africa Western Africa Low Low 520
Georgia Asia Western Asia High Lower Middle 3290
Germany Europe Western Europe Very High High 45170
Ghana Africa Western Africa Middle Lower Middle 1580
Greece Europe Southern Europe High High 23670
Grenada Americas Caribbean High Upper Middle 7140
Guatemala Americas Central America Middle Lower Middle 3130
Guinea Africa Western Africa Low Low 440
Guinea-Bissau Africa Western Africa Low Low 530
Guyana Americas South America Middle Lower Middle 3410
Haiti Americas Caribbean Low Low 760
Honduras Americas Central America Middle Lower Middle 2140
Hungary Europe Eastern Europe High Upper Middle 12450
Iceland Europe Northern Europe Very High High 38370
India Asia Southern Asia Middle Lower Middle 1550
Indonesia Asia South-Eastern Asia Middle Lower Middle 3420
Iran (Islamic Republic of) Asia Southern Asia Middle Upper Middle 6570
Iraq Asia Western Asia Middle Upper Middle 6130
Ireland Europe Northern Europe Very High High 39110
Israel Asia Western Asia Very High High 32030
14. Regional and Economic Grouping (continued)

245
Annexes
UNITED NATIONS E-GOVERNMENT SURVEY 2014
Country Region Sub-Region EGDI Level Level of Income GNI
Italy Europe Southern Europe Very High High 34810
Jamaica Americas Caribbean Middle Upper Middle 5190
Japan Asia Eastern Asia Very High High 47690
Jordan Asia Western Asia High Upper Middle 4660
Kazakhstan Asia Central Asia High Upper Middle 9780
Kenya Africa Eastern Africa Middle Low 870
Kiribati Oceania Micronesia Middle Lower Middle 2520
Kuwait Asia Western Asia High High 44940*
Kyrgyzstan Asia Central Asia Middle Lower Middle 1040
Lao People's Democratic Republic Asia South-Eastern Asia Middle Lower Middle 1270
Latvia Europe Northern Europe High High 14030
Lebanon Asia Western Asia Middle Upper Middle 9250
Lesotho Africa Southern Africa Middle Lower Middle 1480
Liberia Africa Western Africa Low Low 370
Libya Africa Northern Africa Middle High 12930**
Liechtenstein Europe Western Europe High High 136770**
Lithuania Europe Northern Europe High High 13910
Luxembourg Europe Western Europe Very High High 71810
Madagascar Africa Eastern Africa Middle Low 420
Malawi Africa Eastern Africa Low Low 320
Malaysia Asia South-Eastern Asia High Upper Middle 9820
Maldives Asia Southern Asia Middle Upper Middle 5430
Mali Africa Western Africa Low Low 660
Malta Europe Southern Europe High High 19990
Marshall Islands Oceania Micronesia Middle Upper Middle 4130
Mauritania Africa Western Africa Low Lower Middle 1040
Mauritius Africa Eastern Africa High Upper Middle 8770
Mexico Americas Central America High Upper Middle 9720
Micronesia (Federated States of) Oceania Micronesia Middle Lower Middle 3230
Monaco Europe Western Europe High High 186950***
Mongolia Asia Eastern Asia High Lower Middle 3080
Montenegro Europe Southern Europe High Upper Middle 6950
Morocco Africa Northern Africa High Lower Middle 2910
Mozambique Africa Eastern Africa Low Low 510
Myanmar Asia South-Eastern Asia Low Lower Middle 1126
Namibia Africa Southern Africa Middle Upper Middle 5700
Nauru Oceania Micronesia Middle High 12577
Nepal Asia Southern Asia Low Low 700
Netherlands Europe Western Europe Very High High 48110
New Zealand Oceania Australia and New Zealand
Very High High 35550
14. Regional and Economic Grouping (continued)

246
Ann
exes
ANNEX UNITED NATIONS E-GOVERNMENT SURVEY 2014
Country Region Sub-Region EGDI Level Level of Income GNI
Nicaragua Americas Central America Middle Lower Middle 1690
Niger Africa Western Africa Low Low 390
Nigeria Africa Western Africa Middle Lower Middle 2460
Norway Europe Northern Europe Very High High 98880
Oman Asia Western Asia High High 25250
Pakistan Asia Southern Asia Middle Lower Middle 1250
Palau Oceania Micronesia Middle Upper Middle 10550
Panama Americas Central America High Upper Middle 9030
Papua New Guinea Oceania Melanesia Low Lower Middle 1790
Paraguay Americas South America Middle Lower Middle 3320
Peru Americas South America High Upper Middle 5890
Philippines Asia South-Eastern Asia Middle Lower Middle 2950
Poland Europe Eastern Europe High High 12660
Portugal Europe Southern Europe High High 20620
Qatar Asia Western Asia High High 78060
Republic of Korea Asia Eastern Asia Very High High 24640
Republic of Moldova Europe Eastern Europe High Lower Middle 2150
Romania Europe Eastern Europe High Upper Middle 8560
Russian Federation Europe Eastern Europe High High 12740
Rwanda Africa Eastern Africa Middle Low 600
Saint Kitts and Nevis Americas Caribbean Middle High 13090
Saint Lucia Americas Caribbean Middle Upper Middle 7000
Saint Vincent and the Grenadines Americas Caribbean Middle Upper Middle 6360
Samoa Oceania Polynesia Middle Lower Middle 3260
San Marino Europe Southern Europe High High 51470***
Sao Tome and Principe Africa Middle Africa Low Lower Middle 1310
Saudi Arabia Asia Western Asia High High 24660
Senegal Africa Western Africa Middle Lower Middle 1030
Serbia Europe Southern Europe High Upper Middle 5350
Seychelles Africa Eastern Africa High Upper Middle 11590
Sierra Leone Africa Western Africa Low Low 530
Singapore Asia South-Eastern Asia Very High High 51090
Slovakia Europe Eastern Europe High High 17070
Slovenia Europe Southern Europe High High 22780
Solomon Islands Oceania Melanesia Low Lower Middle 1480
Somalia Africa Eastern Africa Low Low 123
South Africa Africa Southern Africa Middle Upper Middle 7460
South Sudan Africa Eastern Africa Low Low 840
Spain Europe Southern Europe Very High High 29340
Sri Lanka Asia Southern Asia High Lower Middle 2910
Sudan Africa Northern Africa Middle Lower Middle 1460
14. Regional and Economic Grouping (continued)

247
Annexes
UNITED NATIONS E-GOVERNMENT SURVEY 2014
Country Region Sub-Region EGDI Level Level of Income GNI
Suriname Americas South America Middle Upper Middle 8680
Swaziland Africa Southern Africa Middle Lower Middle 3100
Sweden Europe Northern Europe Very High High 56120
Switzerland Europe Western Europe High High 80950
Syrian Arab Republic Asia Western Asia Middle Lower Middle 2084
Tajikistan Asia Central Asia Middle Low 880
Thailand Asia South-Eastern Asia Middle Upper Middle 5250
The former Yugoslav Republic of Macedonia
Europe Southern Europe Middle Upper Middle 4710
Timor-Leste Asia South-Eastern Asia Middle Lower Middle 3980
Togo Africa Western Africa Low Low 490
Tonga Oceania Polynesia Middle Upper Middle 4220
Trinidad and Tobago Americas Caribbean Middle High 14780
Tunisia Africa Northern Africa High Upper Middle 4240
Turkey Asia Western Asia High Upper Middle 10810
Turkmenistan Asia Central Asia Middle Upper Middle 5410
Tuvalu Oceania Polynesia Middle Upper Middle 5650
Uganda Africa Eastern Africa Middle Low 480
Ukraine Europe Eastern Europe High Lower Middle 3640
United Arab Emirates Asia Western Asia High High 38620
United Kingdom of Great Britain and Northern Ireland
Europe Northern Europe Very High High 38300
United Republic of Tanzania Africa Eastern Africa Middle Low 570
United States of America Americas North America Very High High 52350
Uruguay Americas South America High High 13670
Uzbekistan Asia Central Asia Middle Lower Middle 1700
Vanuatu Oceania Melanesia Middle Lower Middle 2990
Venezuela (Bolivarian Republic of) Americas South America High Upper Middle 12460
Viet Nam Asia South-Eastern Asia Middle Lower Middle 1550
Yemen Asia Western Asia Middle Lower Middle 1220
Zambia Africa Eastern Africa Low Lower Middle 1410
Zimbabwe Africa Eastern Africa Middle Low 800
Source for Level of Income and GNI: World Bank (2012), available at http://data.worldbank.org/ GNI in yellow: UNdata (2012), available at http://data.un.org/ * Most recent year available on World Bank website (2011) ** Most recent year available on World Bank website (2009) *** Most recent year available on World Bank website (2008)
14. Regional and Economic Grouping (continued)

UNITED NATIONS E-GOVERNMENT SURVEY 2014
249
Annexes
UNITED NATIONS E-GOVERNMENT SURVEY 2014
Notes
Chapter 1 1 A joint project of the United Nations Division for Public Economics and Public Administration (UNDPEPA) and
the American Society for Public Administration (ASPA).
2 This was referred as e-government readiness index in past editions of the Survey (2003, 2004, 2005, 2008).
3 An important caveat about EGDI is that the absolute values of different years are not comparable given the methodology employed (see section on Survey Methodology). For instance, it is not statistically correct to compare the absolute values of EGDI 2014 and EGDI 2012 for any one region. However, the EGDI’s rate of growth does present useful information.
4 Roelofsen, Occo and Sheng, Paul (2010).
5 Hosman, Laura and Elizabeth Fife (2012).
6 World Bank, African Development Bank and African Union, 2012.
7 Agency for the Development of Electronic Government and Information Society and Knowledge of Uruguay (AGESIC). Available from: (http://www.agesic.gub.uy/innovaportal/v/127/1/agesic/si_en_uruguay.html).
8 The productive structure refers to Latin America and the Caribbean economical idiosyncrasies such as the high transportation costs, the lower than average tax revenues, the excessive concentration of their exports based on its natural resources, the emergence of “middle class” and the substitution of local goods for imports. (OECD/ECLAC/Development Bank of Latin America (CAF) (2013), Latin American Economic Out-look 2014: Logistics and Competitiveness for Development, OECD Publishing. Available from: (http://dx.doi.org/10.1787/leo-2014-5-en).
9 United Nations Conference on Trade and Development, 2014.
10 TTBizLink platform. Available from: (https://www.ttbizlink.gov.tt/).
11 OECD, Newsroom article. Available from: (http://goo.gl/gheJ9j).
12 World Bank. World Development Indicators database, 2013.
13 Japan’s e-Government Initiatives. Available from: (http://www.e-gov.go.jp/doc/e-government.html).
14 United Nations “Human Development Report”, 2013.
15 GNI per capita, PPP (current international $), World Development Indicators database, World Bank.
16 E-government Strategy Baharain. Available from: (http://goo.gl/x6iF8c).
17 Bahrain International e-Government Forum 2013. Available from: (http://www.egovforum.bh/topics&agenda.php).
18 The Official Portal of the 3rd GCC. Available from: (www.gccegov.com).
19 Government of the United Kingdom, Cabinet Office, 2012, Government Digital Strategy. Available from: (http://www.publications.cabinetoffice.gov.uk/digital/strategy/).
20 Government of Spain, Ministry of Industry, Energy and Tourism, Avanza 2 Plan. Available from: (http://www.ontsi.red.es/ontsi/en/informacion-y-recursos/plan-avanza-2).
21 Government of Ireland, Department of Public Expenditure and Reform, Supporting Public Service Reform: eGovernment 2012-2015. Available from: (http://egovstrategy.gov.ie/).
22 The UN Member SIDS are: Antigua and Barbuda, Bahamas, Bahrain, Barbados, Belize, Cape Verde, Comoros, Cuba, Dominica, Dominican Republic, Fiji, Grenada, Guinea-Bissau, Guyana, Haiti, Jamaica, Kiribati, Maldives, Marshall Islands, Federal States of Micronesia, Mauritius, Nauru, Palau, Papua New Guinea, Samoa, São Tomé and Príncipe, Singapore, St. Kitts and Nevis, St. Lucia, St. Vincent and Grenadines, Seychelles, Solomon Is-lands, Suriname, Timor-Leste, Tonga, Trinidad and Tobago, Tuvalu and Vanuatu. Source: UN office of High Representative for Least Developed Countries, Landlocked Developing Countries and Small Island Develop-ing States (UN-OHRLLS). Available from: (http://www.unohrlls.org/en/sids/44/).
23 UN Conference on Small Island Developing States, Samoa 2014. Available from: (http://sids2014.org).
24 DRR consists of four phases—Mitigation, Preparedness, Response and Recovery.
25 Asian and Pacific Training Centre for Information and Communication Technology for Development (APCICT), 2010, ICT for Disaster Risk Reduction, ICTD Case Study 2. Available from: (http://www.preventionweb.net/files/14338_14338ICTDCaseStudy21.pdf).
26 Ibid.
27 Government of Trinidad and Tobago, Office of Disaster Preparedness and Management, Situation Report, 2010, Vol. 1, Issue 2. Available from: (http://www.odpm.gov.tt/pdf/SITuation%20REPort%20Vol%201%20Issue%202.pdf).
28 Prutsalis, Mark et al, (2010) / De Silva, Chamindra and Prustalis, Mark (2010).
29 United Nations Sustainable Development Platform, Small Island Developing States. Available from: (http://sustainabledevelopment.un.org/index.php?menu=203).

250
Ann
exes
ANNEx UNITED NATIONS E-GOVERNMENT SURVEY 2014
30 The LLDCs are: in Africa: Botswana, Burkina Faso, Burundi, Central African Republic, Chad, Ethiopia, Lesotho, Malawi, Mali, Niger, Rwanda, Swaziland, Uganda, Zambia, Zimbabwe; in Asia: Afghanistan, Bhutan, Kazakh-stan, Kyrgystan, Lao People’s Democratic Republic, Mongolia, Nepal, Tajikistan, Turkmenistan, Uzbekistan; in Europe: Armenia, Azerbaijan, Republic of Moldova, FYR Macedonia and in South America: Bolivia and Para-guay. Available from: (http://unctad.org/).
31 The LDCs are: in Africa: Angola, Benin, Burkina Faso, Burundi, Central African Republic, Chad, Comoros, Dem-ocratic Republic of Congo, Djibouti, Equatorial Guinea, Eritrea, Ethiopia, Gambia, Guinea, Guinea-Bissau, Lesotho, Liberia, Madagascar, Malawi, Mali, Mauritania, Mozambique, Niger, Rwanda, Sao Tome and Principe, Senegal, Sierra Leone, Somalia, South Sudan, Sudan, Togo, Uganda, Tanzania, Zambia; in Asia: Afghanistan, Bangladesh, Bhutan, Cambodia, Kiribati, Lao, Myanmar, Nepal, Samoa, Solomon Islands, Timor-Leste, Tuvalu, Vanuatu, Yemen; in South America and the Caribbean: Haiti. Source: UN Office of the High Representative for the Least Developed Countries, Landlocked Developing Countries and Small Island Developing States (UNOHRLLS). Available from: (http://www.unohrlls.org/en/ldc/25/).
32 United Nations Office of the High Representative for the Least Developed Countries, Landlocked Develop-ing Countries and Small Island Developing States (UN-OHRLLS). Available from: (http://www.unohrlls.org/en/ldc/25/).
33 UN-OHRLLS, Factsheet, Least Developed Countries. Available from: (http://www.unohrlls.org/docs/ohrlls/ldcs/UN_LDC_Factsheet_130517.pdf).
34 The Committee for Development Policy, subsidiary body of the UN Economic and Social Council, uses the criteria of low national income, weak human assets (health, nutrition and education) and high economic vul-nerability, for identifying LDCs. These factors combined lead to a lack of infrastructure and skills, such as ICT literacy and go a long way in explaining the challenges of the LDC’s with regard to e-government.
35 Al-Wazir, Ali & Zheng, Zhao (2012) / Al-Hashmi, Asma & Suresha (2013).
Chapter 2 1 France. Secretariat général du gouvernement. Direction interministerielle des systèmes d’information et de
communication. September 2012. Official circular entitled Usage du logiciel libre dans l’administration.
2 The connection with telecommunication infrastructure is drawn from a comparison of UN Survey data and the ICT development index.
3 Rwanda (2011). National ICT Policy and Action Plan III, 2011–2015.
4 PriceWaterhouseCoopers (2010). E-government strategy and implementation plan report: January 2011. Pre-pared for the Ministry of Communications and Information Technology of the Government of Ethiopia.
5 The online creativity component of WIPO’s global innovation index includes number of generic and country code top-level domains, wikipedia monthly edits and video uploads on YouTube. WIPO (2013). Global In-novation Index: The Local Dynamics of Innovation. Available from: (http://www.wipo.int/export/sites/www/freepublications/en/economics/gii/gii_2013.pdf).
Chapter 3 1 The United Nations Public Administration Studies (UNPACS) is internal research undertaken by the United Na-
tions Department of Economic and Social Affairs, Division for Public Administration and Development Man-agement, forthcoming at: www.unpan.org/unpacs. The constitutions of United Nations Member States were reviewed for key words, serving as indicators of citizen engagement and freedom of information provisions.
2 See the UN’s 3-level model of e-participation presented in this chapter and the 5-stage model of the Inter-national Association of Public Participation, cited in People Matter, Civic Engagement in Public Governance, World Public Sector Report 2008, United Nations. The latter defines participation into five categories of re-lationships: inform, consult, involve, collaborate and empower (see p.71). The effectiveness of each of these participation relationships hinges upon governance enablers (i.e. full political rights, civil liberties, freedom of expression etc.).
3 Most questions related to open government data also fall under e-information stage of e-participation. See related chapter for more detailed analysis on open government data and its role on e-participation.
4 These are Cuba, Madagascar, Malaysia, Mozambique and Zimbabwe.
5 The process of participatory budgeting initially started in Porte Alegre, Brazil in 1989. The practice consisted in series of neighbourhood, regional and citywide assemblies, where residents and elected budget delegates would identify spending priorities and vote on which priorities to implement. The form of participatory budg-eting has changed over time and the practice is now spreading more online.
6 Thurlow, James (2012). “Climate Change and Development Policy”. World Institute for Development Econom-ics Research. Available from: (http://wider.unu.edu/publications/newsletter/articles-2012/en_GB/11-2012-JT/).
7 It is noteworthy that the rank order of sectors differs from the order for information provision, as shown in Figure.3.3.

251
Annexes
UNITED NATIONS E-GOVERNMENT SURVEY 2014
8 Among these 20 countries, 6 are from the Americas, 5 from Europe, 5 from Asia, 3 from Africa and 1 from Oce-ania. From an income perspective, 11 are high income countries, 5 upper middle income countries, 3 lower middle income countries and 1 low income country.
9 Of the 10 countries committed to all five of the decision-making features of e-participation: three are from Europe, three from Asia, three from the Americas and one from Oceania. Seven are high income and three upper middle income countries.
10 United Nations (2013a).
Chapter 4 1 World Health Organization, Technical Brief, n.1, May 2008.
2 Australia Government Portal and United Kingdom Government portal respectively. Available from: (http://australia.gov.au/services/service-task/contact/contact-my-local-council) and (https://www.gov.uk/).
3 The Swedish Business Link. Available from: (http://www.verksamt.se/portal/en_GB/web/international/home).
4 Denmark citizen portal. Available from: (https://www.borger.dk).
5 Official site for the New Zealand Government ICT Functional Leader, the Government Chief Information Of-ficer. Available from: (http://ict.govt.nz/).
6 Singapore Government Cloud (G-Cloud). Available from: (http://goo.gl/EqsVYo).
7 Pardo, Theresa A., Nam, Taewoo., & Burke, G Brian. (2012).
Chapter 5 1 Vulnerable groups include older persons, the illiterate, persons with disabilities, immigrants, people living in
poverty, women and youth.
2 ITU Data, 2013.
3 Ibid.
4 Definition of smart phone: A cellular phone that is able to perform many of the functions of a computer, typically having a relatively large touchscreen and an operating system capable of running general-purpose computer applications.
5 Definition of feature phones: A cellular phone that contains a fixed set of functions beyond voice calling and text messaging, but is not as extensive as a smartphone.
6 Gartner (2013). Available from: (http://www.gartner.com/newsroom/id/2544115).
7 Ibid.
8 ITU Data, 2013.
9 United Nations Department of Economic and Social Affairs (UNDESA) (2012).
10 PricewaterhouseCoopers (PwC) (2009).
11 Government of Denmark, 2013. eGovernment strategy 2011–2015. Available from: (http://www.digst.dk/Ser-vicemenu/English/Policy-and-Strategy/eGOV-strategy).
12 United Kingdom Cabinet Office, 2013. Available from: (http://publications.cabinetoffice.gov.uk/digital/).
13 Greater Amman Municipality, Jordan, 2013. Available from: (http://www.ammancity.gov.jo/en/gam/index.asp).
14 South Africa Government, 2013. Available from: (http://www.home-affairs.gov.za/index.php/identity-docu-ments2).
15 Singapore Police Force, 2013. Available from: (http://www.spf.gov.sg/sms70999/).
16 Meeker, Mary., Wu, Liang (2013). “Internet Trends D11 Conference”. Kleiner Perkins Caufield Byers (KPCB), p41 , (5/29/2013).
17 Communications Commission of Kenya (CCK), 2013.
18 Deloitte (2013).
19 IDA, Singapore, 2013. Available from: (http://www.egov.gov.sg/egov-programmes/programmes-by-citizens/citizen-connect).
20 World Bank (2009). Public-private partnerships in e-government: Knowledge map.
21 Philippines Government Portal. Available from: (http://ppp.gov.ph).
22 Tode, Chantal (2013). “Federal government boosts digital strategy with mobile apps, security programs” Mo-bile Marketer News, 2013. Available from: (http://www.mobilemarketer.com/cms/news/content/15449.html)
23 Fu, Yaqin and Ke Xiao, (2012).
24 Reddick, Christopher G. and Michael Turner (2012).
25 Information and Communication Technology Agency of Sri Lanka, 2013. Available from: (http://goo.gl/5p4Ln6)
26 United Nations Public Service Award, 2012.

252
Ann
exes
ANNEx UNITED NATIONS E-GOVERNMENT SURVEY 2014
27 European Union, 2013.
28 There were 5 stages in the first model (2003–2008) and it was changed to a 4-stage model starting from the 2010 Survey.
29 Channel optimization is assessed through the accumulated score of Survey questions with an influence of anyone channel (as stated in earlier section) in accordance with the 2014 Survey.
30 United Nations E-Government Survey 2012.
31 European Commission (2004).
32 Ibid.
33 Big data is a collection of data sets that is large and complex that it becomes difficult to process using normal database management tools or traditional data processing applications.
34 “Mohammed renames Dubai e-Government as m-Government”. The Gulf Today June 21 2013. Available from: (http://www.gulftoday.ae/portal/c3950ab6-1201-44b5-a161-75d01130b376.aspx).
35 OECD/International Telecommunication Union (2011).
36 Figure for 2016 is estimated using the least square fitting methodology.
37 Kevin Werbach (2012), Wharton School of Business. Gamification is described as “the use of game elements and game design techniques in non-game contexts”.
38 Opower website. Available from: (http://opower.com).
39 m.Paani initiative. Available from: (http://mpaani.com/).
40 IDA Singapore, 2013. Available from: (http://www.egov.gov.sg/egov-programmes/programmes-by-citizens/oneinbox).
41 Department of Human Services, Australia, 2013. Available from: (http://www.humanservices.gov.au/customer/services/centrelink/mobile-service-centres).
Chapter 6 1 United Nations (2013b).
2 Ibid.
3 G20 economies including the following 19 countries : Argentina, Australia, Brazil, Canada, China, France, Ger-many, India, Indonesia, Italy, Japan, the Republic of Korea, Mexico, Russia, Saudi Arabia, South Africa, Turkey, the United Kingdom, the United States of America plus the European Union. Available from: (http://www.g20.org/docs/about/about_G20.html).
4 World Internet Project International report. 4th Edition. USC Annenberg School Center for the Digital Future. 2012. Available from: (http://www.worldinternetproject.net/_files/_Published/_oldis/770_2012wip_report4th_ed.pdf).
5 Digital Differences. Pew Internet & American Life Project, Pew research Center. 13 April 2012. Available from: (http://goo.gl/r2GeIQ.).
6 UN Convention on the Rights of Persons with Disabilities. Available from: (http://www.un.org/disabilities/con-vention/conventionfull.shtml).
7 A person is functionally literate who can engage in all those activities in which literacy is required for effective functioning of his group and community and also for enabling him to continue to use reading, writing and calculation for his own and the community’s development.’ (UNESCO, EFA Global Monitoring Report 2006) Available from: (http://goo.gl/1pvfTH).
8 Internet World Statistics. Available from: (http://www.internetworldstats.com/stats3.htm#asia).
9 Census of India. 2011. Available from: (http://www.censusindia.gov.in/2011-prov-results/indiaatglance.html).
Chapter 7 1 E-government uptake, defined as “the percentage of individuals (aged 16–74) who have used the Internet to
interact with public authorities” (e.g. as per OECD’s definition). It is important to note that the usage rate of countries in EU and beyond does not necessarily reflect the actual level of usage, as seen in the case of the UK, of which e-government uptake is lower than expected. This is due to availability of services such as citizen self-service in some countries like Belgium, Denmark and Ireland. Services like automatic payment of child al-lowance (triggered by birth registration or automatic start) and payment of pension (triggered by age, or many other cross-silo services) reduces frequency of citizens’ interactions with public authorities both via offline and online. It thereby reduces citizens’ (active) use of such public services, with countries showing lower usage rate than the actual rate of usage. At the most fundamental level sometimes, lack of and/or a reduction in “use” can result in increased benefits to the stakeholders, depending on the types of service, etc.
2 European Commission (2013).
3 European Commission/Capgemini Group (2013).
253
Annexes
UNITED NATIONS E-GOVERNMENT SURVEY 2014
4 Statistics Norway CT (2013), Usage in households, 2013, 2nd quarter. Available from: (http://www.ssb.no/en/ikthus/).
5 OECD (2013a).
6 Turkish statistical institute (2013), News Release: ICT usage survey on households and individuals, 22 August 2013. Available from: (http://www.turkstat.gov.tr/PreHaberBultenleri.do?id=13569).
7 OECD (2013b).
8 Nasr, J. (2013), Implementing electronic tax filing and payments in Malaysia.
9 New York Times (2013), “Most of U.S. Is Wired, but Millions Aren’t Plugged In”, August 18, 2013.
10 Nielsen Norman-Group (2013), Seniors as web users. Available from: (http://www.nngroup.com/articles/usa-bility-for-senior-citizens/).
11 United Kingdom Government Digital Services: Design Principles. Available from: (https://www.gov.uk/design-principles).
12 Copenhagen city: E-government change agent, in: Asia Pacific futuregov, 10 January 2013.
13 The subdivisions are based on one or more user characteristics. The segments are then “targeted” in the most suitable way over the most appropriate channels.
14 It is also important to know what types of devices are being used by their citizens, see: ITU and OECD (2011), M-government: Mobile technologies for responsive governments and connected societies.
15 United States General Services Administration (2013), Mobile ubiquity. Available from (http://www.gsa.gov/portal/content/289089).
16 Global marketing: Georgetown university (2011), Chilean Business + Social Media = An economic purpose.
17 Inter-American dialogue (2013), Can Technology Help Quell Citizens’ Anger at Their Governments?
18 Digital Communities (2009), San Francisco Mayor Gavin Newsom Announces 311 Twitter Service, June 4, 2009.
19 Press release, May 28, 2013, The European Commission eGovernment Benchmark: Further Uptake Required To Meet Growing Citizens’ Expectations For Public Services.
20 Broadband Commission working group on education (2013), Advancing the education for all agenda—A report by the Broadband Commission.
21 Pakistan gender news (2013), SMS-based literacy programme: Education may be just a text message away. Available from: (http://goo.gl/eq1P1t).
22 OECD (2012).
23 Federal communications commission (2010), Connecting America: the national broadband plan.
24 Sci, Dev (2012), “African e-health ‘moving in direction”, Net 02/12/11.
25 Ministry of Health, Uganda (2013), mTrac is Changing the Face of Health Operations in Uganda. Available from: (http://www.unicef.org/uganda/mTrac_article(1).pdf).
26 UNICEF (2012).
27 Hearing before the Subcommittee on oversight, investigation and management of the Committee on Home-land Security, House of Representatives (2012), “America is under cyber-attack: why urgent action is needed“, One hundred twelfth congress second session, April 24, 2012. Available from: (http://www.gpo.gov/fdsys/pkg/CHRG-112hhrg77380/html/CHRG-112hhrg77380.htm).
28 R. Craig Lefebvre and Bornkessel, A.S. (2013).
29 Lauren Dawes, Revital Marom (2013).
30 GSMA (2012), Shaping the Future—Realizing the potential of informal learning through mobile, 2012.
31 Copenhagen city: E-government change agent, in: Future Gov (10 January, 2013).
32 European Digital Competitiveness Report 2010/secondary ref.
33 National Telecommunications and Information Administration and Economics and Statistics Administration in the Department of Commerce (2013), Exploring the digital nation—America’s emerging online experience.
34 Ehrbeck, Tilman. Lochan. Rajiv. Sinha, Supriyo. Zainulbhai, Adil (2010).
35 Using Technology to Track How Citizens Experience Water Service Delivery in India. Available from: (http://goo.gl/3qP8jv).
36 Around the world, a number of countries provide online user feedback opportunities to enhance the govern-ments’ ability to receive and take on board feedback from citizens, so as to better tailor their services to meet the actual needs and priorities of users. For example, a few countries’ national portals provide web statistics on citizen usage (in 47 countries), features on seeking comments from citizens to improve its online services (in 68 countries) and section for “hot topics” or mostly used features (in 80 countries) and a much smaller number of countries (20 countries) provide outcome on feedback received from citizens concerning the improvement of its online services.
37 O’Reilly (2009).
254
Ann
exes
ANNEx UNITED NATIONS E-GOVERNMENT SURVEY 2014
Chapter 8 1 Open Government Data Working Group, 8 Open Government Data Principles, 2008, Sebastopol, USA.
2 National statistics portals are not considered as dedicated data portals during the assessment. Instead, re-searchers checked the existence of a data catalogue, usually called open government data portal, such as data.gov or data.gov.uk.
3 Refer to OpenSpending.org.
4 International Budget Partnership (2012). Open Budget Survey 2012. Available from (http://internationalbudg-et.org/what-we-do/open-budget-Survey/).
5 United Nations Public Administration Country Studies (UNPACS) (2014). “Research and Analysis on Regulatory Frameworks”, DPADM.
6 New Zealand (2011). “New Zealand Data and information Management Principles”. Government ICT Strategy and Action Plan to 2017.
7 Tauberer, Joshua (2012).
8 Republic of Korea (2013). Act on Provision and Active Use of Public Data. Available from: (http://www.law.go.kr/lsEfInfoP.do?lsiSeq=142444#0000).
9 White House, the (2013). Executive Order—Making Open and Machines Readable the New Default for Gov-ernment Information. Office of the Press Secretary (9 May 2013). Available from: (http://goo.gl/U7PxAb).
10 Open Data in Russia (2013). Implementing Russian Open Data Conception: Public and Local Government Bod-ies Progress Report 2013. Available from: (http://goo.gl/emIdeC).
11 Creative Commons Attribution 3.0 Unported (CC by 3.0). Available from: (http://creativecommons.org/licens-es/by/3.0/).
12 Australia Official Data Portal.Available from: (http://data-au.govspace.gov.au/about).
13 Austria Open Data Portal. Available from: (http://data.gv.at/kontakt).
14 Isreal Government Portal. Available from: (http://www.gov.il/FirstGov/BottomNavEng/abouteng/about-goveng).
15 Colombia Data Portal. Available from: (http://datosabiertoscolombia.cloudapp.net/frm/Acerca/frmAcercaDe.aspx).
16 Ghana Open Data Initiative.Available from: (http://data.gov.gh/about-us).
17 Singapore Data Portal. Available from: (http://data.gov.sg).
18 Spain Open Data Portal. Available from: (http://datos.gob.es).
19 France Official Data Portal. Available from: (http://www.data.gouv.fr/A-propos).
20 Woodie, Alex (2013).
21 Chong, Rachelle (2013).
22 The Gazette of India (2012). New Delhi, India (17-23 March 2012). Available from: http://www.dst.gov.in/nsdi_gazette.pdf.
23 White House (2013). Memorandum for the Heads of Executive Department and Agencies: Open Data Policy—Managing Information as an Asset. Executive Office of the President, Office of Management and Budget (9 May 2013).
24 All Africa (2013). Liberia: Finance, UNDP Launch (27 September 2013). Available from: http://allafrica.com/stories/201309271088.html.
25 Cambodia Open Development. Available from: (http://www.opendevelopmentcambodia.net/).
26 Sarpam. Southern African Regional Programme on Access to Medicines and Diagnostics. Available from: (http://www.sarpam.net/).
27 Kenya Open Data Portal. Available from (http://opendata.go.ke).
28 Banisar, David (2011).
29 Internews in Kenya. Available from: (http://www.internewskenya.org/dataportal/content?page=about).
30 Kronrnburg, Tom (2011).
31 Jalote, Sumedha (2013).
32 Deloitte (2012).
33 Capgemini Consulting. The Open Data Economy: Unlocking Economic Value by Opening Government and Public Data. Available from: (http://www.capgemini-consulting.com/the-open-data-economy-0).
34 Koski, Heli (2011).
35 Howard, Alexander B. (2011).

255
Annexes
UNITED NATIONS E-GOVERNMENT SURVEY 2014
Annex1 ITU (2012b).
2 Ibid.
3 The International Telecommunication Union is the primary source of data for computation of TII.
4 United Nations (2013c).
5 Expected years of education is also known as “School life expectancy”. Available from: (http://www.uis.un-esco.org/Library/Documents/eiguide09-en.pdf).
6 Mean years of schooling (MYS) methodology. Available from: (http://www.uis.unesco.org/Education/Pages/mean-years-of-schooling.aspx).
7 Barro Lee methodology. Available from: (http://www.uis.unesco.org/Education/Pages/mean-years-of-school-ing.aspx and http://www.barrolee.com/).

UNITED NATIONS E-GOVERNMENT SURVEY 2014
257
Annexes
UNITED NATIONS E-GOVERNMENT SURVEY 2014
ReferencesAdamson, Claire (2013). “Building lasting bridges: Good and bad eGovernment strategies in Af-
rica.” eLearning Africa News, April 12, 2013. Available from: (http://goo.gl/nESnT8).
Al-Hashmi, Asma & Suresha, (2013). “Evaluating the Awareness of EGovernment in the Republic of Yemen”. International Journal of Computer Applications Vo. 67 No. 16, Available from: (http://research.ijcaonline.org/volume67/number16/pxc3887185.pdf).
Al-Wazir, Ali & Zheng, Zhao, (2012). “EGovernment Development in Yemen: Assessments and Solutions”. Journal of Emerging Trends in Computing and Information Sciences Vol.3 No.4 Available from: (http://cisjournal.org/journalofcomputing/archive/vol3no4/vol3no4_7.pdf).
Banisar, David (2011). “The Right to Information and Privacy: Balancing Rights and Managing Con-flicts”. World Bank Institute Governance Working Paper (10 March, 2011).
Biztech Africa (2012) “Bandwidth a constraint to e-learning”. BiztechAfrica—May 27, 2012. Avail-able from: (http://goo.gl/gBIry3).
Bourgon, Jocelyne (2001). “Technology broadband and education: Advancing education for all agenda.”A New Synthesis of Public Administration, Broadband Commission Working Group on Education (2013). Broadband Commission.
Capgemini (2013). “The European Commission eGovernment Benchmark: Further Uptake Re-quired To Meet Growing Citizens” Expectations For Public Services,” May 28, 2013, Press release.
Centro Latinoamericano y Caribeño de Demografía (CELADE) (2013). “DEPUALC: Distribución Es-pacial De La Población Y Urbanización En América Latina Y El Caribe.” División de población CELADE de la Comisión Económica para América Latina y el Caribe. Available from: (http://www.eclac.cl/celade/depualc/).
CGAP and DFID (2009). “Banking the Poor via G2P Payments.” Focus Note, December 2009.
Chong, Rachelle (2013). “SF Mayor Signs Landmark Open Data Policy and Procedures Legisla-tion”. Government Technology: Solution for State and Local Government (1 May 2013).
Comisión Económica para América Latina y el Caribe (CEPAL) (2013). “Estrategias de TLC ante el desafío del cambio estructural en América Latina y el Caribe.” CEPAL—Colección Documen-tos de proyectos; Naciones Unidas; marzo 2013.
De Silva, Chamindra and Prustalis, Mark, The Sahana (2010). “Free and Open Source Disaster Management System in Haiti in Asian and Pacific Training”.Centre for Information and Com-munication Technology for Development (APCICT), ICT for Disaster Risk Reduction, ICTD Case Study 2. Available from: (http://unapcict.org/ecohub/ict-for-disaster-riskreduction-1).
Deloitte (2012). “Open Data: Driving Grown, Ingenuity and Innovation”. Deloitte Analytics (June 2012).
- (2013). “Enterprise Social Networks: Useful Tool, Not a Panacea”. Deloitte Touche Tohmatsu Limited.
Dunta Times (2013), “Report says FATÍH Project effective, but content needs revision.” Dunta Times Available from: (http://goo.gl/BX5rgy)
Ehrbeck, Tilman. Lochan. Rajiv. Sinha, Supriyo. Zainulbhai, Adil (2010). “Inclusive growth and fi-nancial security—the benefits of e-payments to Indian society”. McKinsey & Company, Inc. October 2010.
eMarketer (2013). “Worldwide Social Network Users: 2013 Forecast and Comparative Estimates.” News 2013.
Eszter Hargittai (2002). “Second-Level Digital Divide: Differences in People’s Online Skills.” First Monday 7, n. 4 (April 2002). Available from: (http://firstmonday.org/issues/issue7_4/hargittai/index.html).
258
Ann
exes
ANNEx UNITED NATIONS E-GOVERNMENT SURVEY 2014
European Commission (2004). “Multi-channel delivery of eGovernment services”. European Commission and Interchange of Data between Administrations (IDA). Available from: (http://ec.europa.eu/idabc/servlets/Doc282e.pdf?id=16867).
- (2006). “Communication from the Commission to the Council, the European Parliament, the European Economic and Social Committee and the Committee of the Regions: i2010 eGov-ernment Action Plan: Accelerating eGovernment in Europe for the Benefit of All”.
- (2010). “Communication from the Commission to the Council, the European Parliament, the European Economic and Social Committee and the Committee of the Regions: i2010 eGov-ernment Action Plan 2011–2015: Harnessing ICT to promote smart, sustainable & innovative Government.” Available from: (http://eur-lex.europa.eu/LexUriServ/LexUriServ.do?uri=COM:2010:0743:FIN:EN:PDF).
- (2011). “Digital Agenda For Europe and European eGovernment Action Plan 2011–2014.” Available from: (http://ec.europa.eu/digital-agenda/digital-agenda-europe).
- (2012a). “eHealth Action Plan 2012–2020: Frequently Asked Questions, European Commis-sion—MEMO/12/959 07/12/2012”.
- (2012b), Public Services Online. “‘Digital by Default or by Detour?’ Assessing User Centric eGovernment performance in Europe—eGovernment Benchmark 2012”.
- (2013) “Digital Agenda Scoreboard 2013”, Staff Working Document, Brussels.
European Commission/Capgemini Group (2013). “Public Services Online—‘Digital by Default or by Detour?’, Assessing User Centric eGovernment performance in Europe—eGovernment Benchmark 2012.” Press Release Database, eGovernment improving but citizens ask for more, European Commission- IP/13/466 28/05/2013.
European Commission Directorate General (2013). “Communications Networks, Content and Technology (2013), Public services: eGovernment Action Plan.” Available from: (http://ec.europa.eu/dgs/connect/en/content/public-services-egovernment-action-plan).
EUROSTAT (2013). “Individuals using Internet for interaction with public authorities Individuals us-ing Internet for interaction with public authorities.” Last update: 18-12-2013. Available from: (http://appsso.eurostat.ec.europa.eu/nui/show.do?wai=true&dataset=isoc_pibi_igov).
Fox, S. and Duggan, M. (2012). “Mobile Health 2012, Half of smartphone owners use their devices to get health information.” Pew Internet Project Pew Research, November 8, 2012.
Fu, Yaqin and Ke Xiao, (2012). “Promoting sustainable e-government with multichannel service delivery: A case study.” Software Engineering and Service Science (ICSESS), 2012 IEEE 3rd International Conference. Available from: (http://goo.gl/7ZdDG9).
GSMA (2012), “Shaping the Future—Realizing the potential of informal learning through mobile” GSM Association,2012.
Haiyan Qian, (2012). “Commonwealth Finance Ministers Report 2012”. Commonwealth & Global Affairs, Economic Affairs: Trade, Economic Development.
Hesbon O. Nyagowa, Dennis N. Ocholla and Stephen M. Mutula (2012). “Evaluation of Success of NEPAD’s Pilot e-Schools in Kenya: An overview.” Information Studies Programme, University of Kwa-Zulu Natal South Africa. Available from: (http://goo.gl/mLiSsZ).
Hosman, Laura and Elizabeth Fife (2012). “The Use of Mobile Phones for Development in Af-rica: Top-Down-Meets-Bottom-Up Partnering.” The Journal of Community Informatics 8, n. 3 (2012).
Howard, Alexander B. (2011). “Congress Weighs Deep Cuts to Funding for Federal Open Govern-ment Data Platforms”. Govfresh (1 April 2011).
ICT works (2012). “We need affordable broadband for mLearning.” May 04 2012 by Guest Writer. Available from: (http://goo.gl/9xeAlJ).
Informatics (2013). “The Promise of Mobile: Connecting to Underserved Populations.” July 29, 2013.
IRIN (2013). “Analysis: Sending the right message on mHealth”, 8 May 2013.
259
Annexes
UNITED NATIONS E-GOVERNMENT SURVEY 2014
International Telecommunication Union (ITU) (2011), “The Role of ICT in Advancing Growth in Least Developed Countries—Trends, Challenges and Opportunities 2011”.
- (2012a). “Measuring the Information Society. ICT development index 2011”. Available from: (http://www.itu.int/ITU-D/ict/publications/idi/).
- (2012b). “Impact of Broadband in the Economy”. Broadband Series. Telecommunication De-velopment Sector (April 2012).
Jalote, Sumedha (2013). “Moldova Builds E-Government: Open Data”. Asia Pacific FutureGov (26 July 2013). Available from: (http://goo.gl/Mf7EoA).
Koski, Heli (2011). “Does Marginal Cost Pricing of Public Sector Information Spur Firm Growth”. EILA, Elinkeinoelaman Tutkimuslaitos, the Research Institute of the Finnish Economy. Kes-kusteluaiheita Discussion Papers (28 September 2011). no. 1260. Available from: (http://www.etla.fi/wp-content/uploads/2012/09/dp1260.pdf).
Kronrnburg, Tom (2011). “Data Journalism Fuelling PSI Re-use”. European Public Sector Informa-tion Platform, Topic Report No. 2011/2 (October 2011). Available from: (http://epsiplatform.eu/sites/default/files/Topic%20Report%20Data%20Journalism.pdf).
Lauren Dawes, Revital Marom (2013), “Mobile Services for Youth Employment”, GSM Association, Alcatel-Lucent.
Millard, J (2013) “ICT-enabled public sector innovation: trends and prospects”. Proceedings of the 7th International Conference on Theory and Practice of Electronic Governance (ICE-GOV2012), Seoul, Republic of Korea, 22 – 25 October 2013, the ACM Press.
Montagnier, P. and A. Wirthmann (2011), “Digital Divide:From Computer Access to Online Ac-tivities— A Micro Data Analysis”, OECD Digital Economy Papers, No. 189, OECD. Available from: (http://dx.doi.org/10.1787/5kg0lk60rr30-en).
Morgan Stanley (2011). “Tablet Demand and Disruption”. Morgan Stanley Research, February 2011.
New York Times (2013). “Most of U.S. Is Wired, but Millions Aren’t Plugged In,” August 18, 2013.
O’Reilly, Tim (2009). “Gov 2.0: It is all about platform.” September 4, 2009, Techcrunch. Available from: (http://techcrunch.com/2009/09/04/gov-20-its-all-about-the-platform/).
OECD (2012), OECD Internet Economy Outlook 2012—Highlights.
- (2013a). “OECD Public Governance Reviews Colombia: Implementing Good Governance”. Paris.
- (2013b). “e-Government Studies: Egypt 2012”. Paris.
- (2013c). “Government at a Glance 2013—Preliminary Version.”
OECD/International Telecommunication Union (2011), “M-Government: Mobile Technologies for Responsive Governments and Connected Societies”, OECD Publishing. Available from: (http://dx.doi.org/10.1787/9789264118706-en).
OECD Newsroom (2012). “New SME policies needed to boost Latin America’s growth, say OECD and ECLAC. OECD Development Center Newsroom”. November 16 2012. Available from: (http://goo.gl/zSjdT0).
Ozburn, M. (2011). “Reaping the Trust Dividend: Federal Agencies Can Move Services Online now with an Identity Button (Like Facebook)—and Save Billions.”Booz,Allen,Hamilton Ink 2011 Available from: (http://www.boozallen.com/media/file/Trust-Dividend-Booklet.pdf).
Pardo, Theresa A., Nam, Taewoo., & Burke, G Brian. (2012).“E-Government Interoperability: In-teraction of Policy, Management, and Technology Dimensions”. Social Science Computer Review, February 2012 30: 7-23, first published on January 12, 2011.
Porrua, Miguel A (2013). “E-Government in Latin America: A Review of the Success in Colombia, Uruguay and Panama”, Organization for American States (2013), in the Global Information Technology Report 2013. World Economic Forum.

260
Ann
exes
ANNEx
PricewaterhouseCoopers (PwC) (2009). “Champion for Digital Inclusion: The Economic Case for Digital Inclusion”. 2009 PricewaterhouseCoopers LLP. Available from: (http://www.parliamen-tandinternet.org.uk/uploads/Final_report.pdf).
Prutsalis, Mark et al, (2010). “The Sahana Software Foundation Response to the 2010 Haiti Earth-quake: A New Standard for Free and Open Source Disaster Management Systems”. Pro-ceedings of the 7 International ISCRAM Conference, Seattle, USA Available from: (http://wiki.sahanafoundation.org/lib/exe/fetch.php/iscram_2010_sahana_haiti.pdf).
R. Craig Lefebvre and Bornkessel, A.S. (2013). “Social Media as a Tool in Medicine - Digital Social Networks and Health”.
Reddick, Christopher G. and Michael Turner (2012). “Channel choice and public service delivery in Canada: Comparing e-government to traditional service delivery” Government Informa-tion Quarterly, Volume 29, Issue 1, January 2012, Pages 1–11. Available from: (http://www.sciencedirect.com/science/article/pii/S0740624X11001080).
Regional School of Public Administration (ReSPA) (2013). “ReSPA Regional Comparative eGov-ernment Study and East Management.” ReSPAAvailable from: (http://www.respaweb.eu/11/ library#respa-publications-and-research-18).
Roelofsen, Occo and Sheng, Paul (2010). “Oil and gas: New sources of growth”. Africa’s path to growth: Sector by sector. McKinsey and Company Publications, June 2010.Available from: (http://goo.gl/1IhT3y).
Shkabatur, Jennifer (2012). “Towards Open Government for Enhanced Social Accountability.” A collaboration of Open Development Technology Alliance, GAC in Projects and Social Devel-opment. World Bank 2012.
Smith, Craig Warren (2013). “Nine Digital Divide Truths.” Digital Divide Institute. Available from: (http://www.digitaldivide.org/digital-divide-topics/nine-digital-divide-truths.html).
Stanford Social Innovation (2013). “Scale Can Happen: The MOTECH Experience.” February 20, 2013.
Tauberer, Joshua (2012). “Open Government Data Definition: The 8 Principles of Open Govern-ment Data”. Open Government Data (2012).
The Centre for International Governance Innovation and the Korea Development Institute (2012). “Post-2015 Development Agenda: Goals, Targets And Indicators—Special Report.” The Cen-tre for International Governance Innovation and the Korea Development Institute 2012. Avail-able from: (https://www.cigionline.org/sites/default/files/MDG_Post_2015v3.pdf).
Turkish statistical institute (2013). “News Release: ICT usage Survey on households and indi-viduals.” 22 August 2013. Available from: (http://www.turkstat.gov.tr/PreHaberBultenleri.do?id=13569).
Ubaldi, Barbara (2011). “E-Government for the Economic Crisis.” European Journal of ePractice 11.
United Nations (2013a). “Global Thematic Consultation on Governance and the Post-2015 Devel-opment Framework”, p. 24. Available from: (http://www.beyond2015.org/sites/default/files/Governance.pdf).
- (2013b). “A new global partnership: The Report of the High-Level Panel of Eminent Persons on the Post-2015 Development Agenda”. Available from: (http://www.post2015hlp.org/wp-content/uploads/2013/05/UN-Report.pdf).
- (2013c) “A life of dignity for all: accelerating progress towards the Millennium Development Goals and advancing the United Nations development agenda beyond 2015”. Report of the Secretary-General. 26 July 2013. A/68/202. Page 13. Para 84.
- (2013d). “Committee for Development Policy, Report of the 15th Session E/2013/33.” Eco-nomic and Social Council Official Records. Available from: (http://daccess-dds-ny.un.org/doc/UNDOC/GEN/N13/290/69/PDF/N1329069.pdf?OpenElement).

261
Annexes
United Nations, 4th United Nations Conference on Least Developed Countries (2011). “Pro-gramme of Action for the Least Developed Countries for the Decade 2011–2020.” Available from: (http://www.un.org/wcm/webdav/site/ldc/shared/documents/IPoA.pdf).
United Nations Children’s Fund (UNICEF) (2012), “Project Mwana: Using mobile technology to improve early infant diagnosis of HIV”, Zambia.
United Nations Department of Economic and Social Affairs (UNDESA) and ASPA (2001). “Bench-marking E-government: A Global Perspective”. UNDESA/ASPA.
United Nations Department of Economic and Social Affairs (UNDESA) (2008) . “People Matter, Civic Engagement in Public Governance”, World Public Sector Report 2008, United Nations.
- (2012) “United Nations E-Government Survey 2012.” UNDESA 2012.
United Nations Development Group (UNDG) (2010a).”Thematic paper on MDG 3: Promote gen-der equality and empower women,” March 2010. Available from: (http://www.oecd.org/so-cial/gender-development/45341361.pdf).
- (2010b). “Thematic paper on MDG 7: Environment sustainability,” 2010. Available from: (http://www.undg.org/docs/11421/MDG7_1954-UNDGMDG7-LR.pdf).
- (2013). “The global conversation begins: Emerging views for a new development agenda.” 2013. Available from: (http://goo.gl/SMNVFy).
United Nations Economic and Social Commission for Asia and the Pacific (UN ESCAP) (2010). E/ESCAP/CICT(2)/L.2.
United Nations Economic and Social Commission for Latin America and the Caribbean (ECLAC) (2012). “Estrategias de TLC ante el desafío del cambio estructural en América Latina y el Car-ibe; Comisión Económica para América Latina y el Caribe (CEPAL).” Colección Documentos de proyectos; Naciones Unidas; Marzo 2013.
United Nations Economic and Social Commission for Western Asia (2013). “Citizen Engagement and the Post-2015 Development Agenda”. Report of the Expert Group Meeting. ST/ESA/PAD/SER.E/191, E/ESCWA/ECRI/2013/WG.1/Report, p. 1.
United Nations Economic and Social Council (ECOSOC) Resolutions: E/RES/2005/3; E/RES/2006/47; E/RES/2007/38; E/RES/2008/32; E/RES/2009/18; E/RES/2011/2; E/RES/2011/22; E/RES/2012/28; E/RES/2013/2.
United Nations, General Assembly (1966). “International Covenant on Civil and Political Rights”. 16 December 1966, United Nations, Treaty Series, vol. 999, p. 171. Available from: (http://www.unhcr.org/refworld/docid/3ae6b3aa0.html).
- (2000). “United Nations Millennium Declaration”. 8 September 2000, United Nations, 55/2. Available from: (http://www.un.org/millennium/declaration/ares552e.htm).
- (2010). A/RES/65/2. Outcome Document of the High-Level Review Meeting on the Imple-mentation of the Mauritius Strategy for the Further Implementation of the Programme of Action for the Sustainable Development of Small Island Developing States. Available from: (http://goo.gl/inlHYF).
- (2012). “The Future We Want”. A/RES/66/288. Available from: (http://www.un.org/ga/search/view_doc.asp?symbol=A/RES/66/288&Lang=E).
The Universal Declaration of Human Rights (1948). Available from: (http://www.un.org/en/docu-ments/udhr/).
WIPO (2013). “Global Innovation Index: The Local Dynamics of Innovation.” Johnson Cornell University, INSEAD,WIPO 2013. Available from: (http://www.wipo.int/export/sites/www/freepublications/en/economics/gii/gii_2013.pdf).
Woodie, Alex (2013). “The Chief Data Officer’s Time Has Come”. Datanami (2 September 2013).
World Bank (2012). “Governments Can Save Up to 75% with Electronic Payment Program.” August 2, 2012. Washington, D.C.
- (2012). “Information and Communication for Development: Extending Reach and Increasing Impact.” Washington, D.C.

262
Ann
exes
ANNEx UNITED NATIONS E-GOVERNMENT SURVEY 2014
World Bank, African Development Bank and African Union (2012). “The Transformational Use of Information and Communication Technologies in Africa”. Information and Communication Technologies, World Bank Group Available from: (http://go.worldbank.org/CXS4GFJDE0).
World Health Organization (2011). “New horizons for health through mobile technologies.” Global Observatory for eHealth series 3. Geneva.
World Internet Project (2012). “International Report Fourth Edition”. USC Annenberg School Center for the Digital Future. 2012. Available from: (http://goo.gl/9bgaUr).

Map 9.1 Regional groupings
CaribbeanAntigua and BarbudaBahamasBarbadosCubaDominicaDominican RepublicGrenadaHaitiJamaicaSaint Kitts and NevisSaint LuciaSaint Vincent and the GrenadinesTrinidad and Tobago
Central AmericaBelizeCosta RicaEl SalvadorGuatemalaHondurasMexicoNicaraguaPanama
Northern AmericaCanadaUnited States of America
South AmericaArgentinaBolivia (Plurinational State of )BrazilChileColombiaEcuadorGuyanaParaguayPeruSurinameUruguayVenezuela (Bolivarian Republic of )
Eastern AfricaBurundiComorosDjiboutiEritreaEthiopiaKenyaMadagascarMalawiMauritiusMozambiqueRwandaSeychellesSomaliaSouth SudanUgandaUnited Republic of TanzaniaZambiaZimbabwe
Middle AfricaAngolaCameroonCentral African RepublicChadCongoDemocratic Republic of the CongoEquatorial GuineaGabonSão Tomé and Príncipe
Northern AfricaAlgeriaEgyptLibyaMoroccoSudanTunisia
Southern AfricaBotswanaLesothoNamibiaSouth AfricaSwaziland
Western AfricaBeninBurkina FasoCape VerdeCôte d’IvoireGambiaGhanaGuineaGuinea-BissauLiberiaMaliMauritaniaNigerNigeriaSenegalSierra LeoneTogo
Central AsiaKazakhstanKyrgyzstanTajikistanTurkmenistanUzbekistan
Eastern AsiaChinaDemocratic People’s Republic of KoreaJapanMongoliaRepublic of Korea
Southern AsiaAfghanistanBangladeshBhutanIndiaIran (Islamic Republic of )MaldivesNepalPakistanSri Lanka
South-Eastern AsiaBrunei DarussalamCambodiaIndonesiaLao People’s Democratic RepublicMalaysiaMyanmarPhilippinesSingaporeThailandTimor-LesteViet Nam
Western AsiaArmeniaAzerbaijanBahrainCyprusGeorgiaIraqIsraelJordanKuwaitLebanonOmanQatarSaudi ArabiaSyrian Arab RepublicTurkeyUnited Arab EmiratesYemen
Australia and New ZealandAustraliaNew Zealand
MelanesiaFijiPapua New GuineaSolomon IslandsVanuatu
MicronesiaKiribatiMarshall IslandsMicronesia (Federated States of )NauruPalau
PolynesiaSamoaTongaTuvalu
Eastern EuropeBelarusBulgariaCzech RepublicHungaryPolandRepublic of MoldovaRomaniaRussian FederationSlovakiaUkraine
Northern EuropeDenmarkEstoniaFinlandIcelandIrelandLatviaLithuaniaNorwaySwedenUnited Kingdom of Great Britain and Northern Ireland
Southern EuropeAlbaniaAndorraBosnia and HerzegovinaCroatiaGreeceItalyMaltaMontenegroPortugalSan MarinoSerbiaSloveniaSpainTFYRO Macedonia
Western EuropeAustriaBelgiumFranceGermanyLiechtensteinLuxembourgMonacoNetherlandsSwitzerland
AfricaAmericas Asia OceaniaEurope
Disclaimer: The designations nations employed and the presentation of material on this map do not imply the expression of any opinion whatsoever on the part of the Secretariat of the United Nations concerning the legal status of any country, territory, city or area or of its authorities, or concerning the delimitation of its frontiers or boundaries.
ISBN 978-92-1-123198-4
13-4
7418
The United Nations E-Government Survey pres-ents a systematic assessment of the use and potential of information and communication
technologies (ICTs) to transform the public sector by enhancing its efficiency, effectiveness, transparency, accountability, as well as access to public services and citizen participation. By studying broad patterns of e-government around the world, the Survey assesses the e-government development status of the 193 United Nations Member States. It serves as a tool for decision-makers to identify their areas of strength and challeng-es in e-government to inform policies and strategies.
The 2014 Survey entitled “E-Government for the Future We Want” examines the global trends and emerging issues in e-government development. It also highlights the global progress in online service delivery and focuses on how to empower citizens through e-participation. In addition, it makes a case for the need of collaborative governance at all levels to promote sustainable development and underlines the importance of reaching out to citizens through mo-bile, social media and inclusive multichannel service
strategies. The Survey also dwells on the challenge of the digital divide; posits that usage is central to deliv-ering development impacts and suggests that open government data is a new development resource. The Report argues that Governments across the globe need to undertake a process of transformative change for the future we want. This, in turn, requires a transformation of government’s role, functions, in-stitutional frameworks and processes supported by the adoption of innovation and ICTs. E-government can thus contribute to a holistic transformation of the public sector in support of the post-2015 develop-ment agenda.
The United Nations E-Government Survey is produced by the United Nations Department of Economic and Social Affairs. The Department, through its Division for Public Administration and Development Manage-ment, has published this global report on e-govern-ment since 2003 and is regularly called upon to advise national administrations in all regions of the world on how to expand the use of ICTs in government to ad-vance the internationally agreed development goals.
UNITED NATIONSE-GOVERNMENT SURVEY 2014E-GOVERNMENT FOR THE FUTURE WE WANT