Embed Size (px)
Citation preview

AnnouncementsAnnouncements
• Check your syllabus with the one Check your syllabus with the one online to make sure it is the right online to make sure it is the right one! one!
• No reading assignment for section No reading assignment for section this week this week
• Focus on your textbookFocus on your textbook
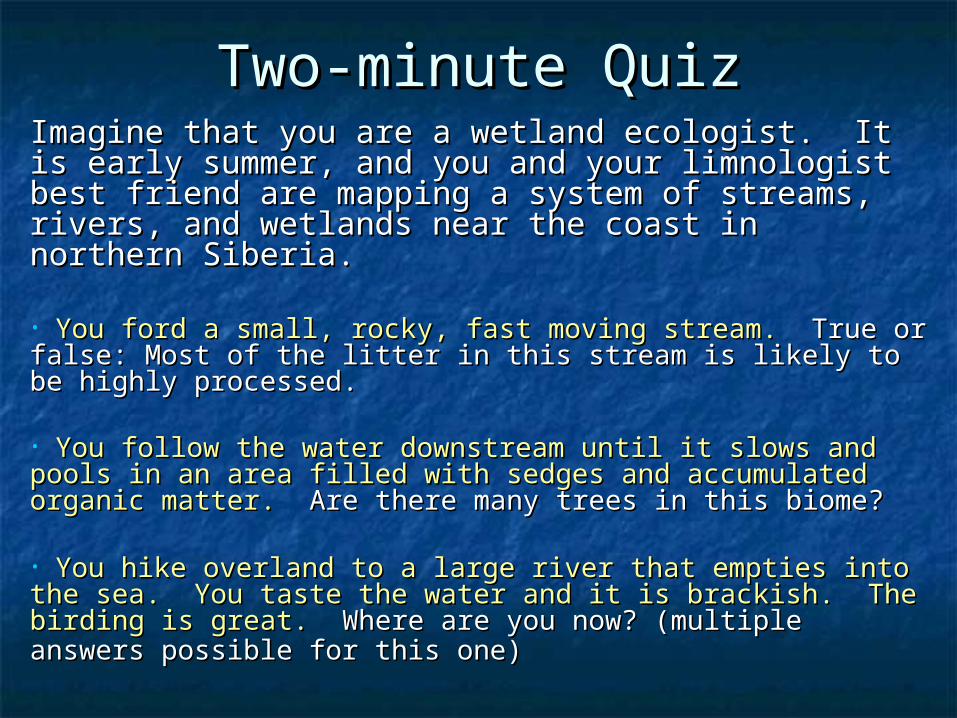
Two-minute QuizTwo-minute QuizImagine that you are a wetland ecologist. It is Imagine that you are a wetland ecologist. It is early summer, and you and your limnologist best early summer, and you and your limnologist best friend are mapping a system of streams, rivers, friend are mapping a system of streams, rivers, and wetlands near the coast in northern Siberia. and wetlands near the coast in northern Siberia.
• You ford a small, rocky, fast moving stream. You ford a small, rocky, fast moving stream. True or false: True or false: Most of the litter in this stream is likely to be highly Most of the litter in this stream is likely to be highly processed.processed.
• You follow the water downstream until it slows and pools You follow the water downstream until it slows and pools in an area filled with sedges and accumulated organic in an area filled with sedges and accumulated organic matter. matter. Are there many trees in this biome?Are there many trees in this biome?
• You hike overland to a large river that empties into the You hike overland to a large river that empties into the sea. You taste the water and it is brackish. The birding is sea. You taste the water and it is brackish. The birding is great. great. Where are you now? (multiple answers possible for Where are you now? (multiple answers possible for this one)this one)
Summary from WednesdaySummary from Wednesday• aquatic ecosystemsaquatic ecosystems• differences between low & high order streamsdifferences between low & high order streams• production vs. biomass pyramidsproduction vs. biomass pyramids• lakeslakes
• light penetrationlight penetration• thermal stratification and Othermal stratification and O22 content content• phytoplankton and abiotic factors over the yearphytoplankton and abiotic factors over the year• oligotrophic vs. eutrophicoligotrophic vs. eutrophic
• wetlandswetlands• biogeochemistrybiogeochemistry
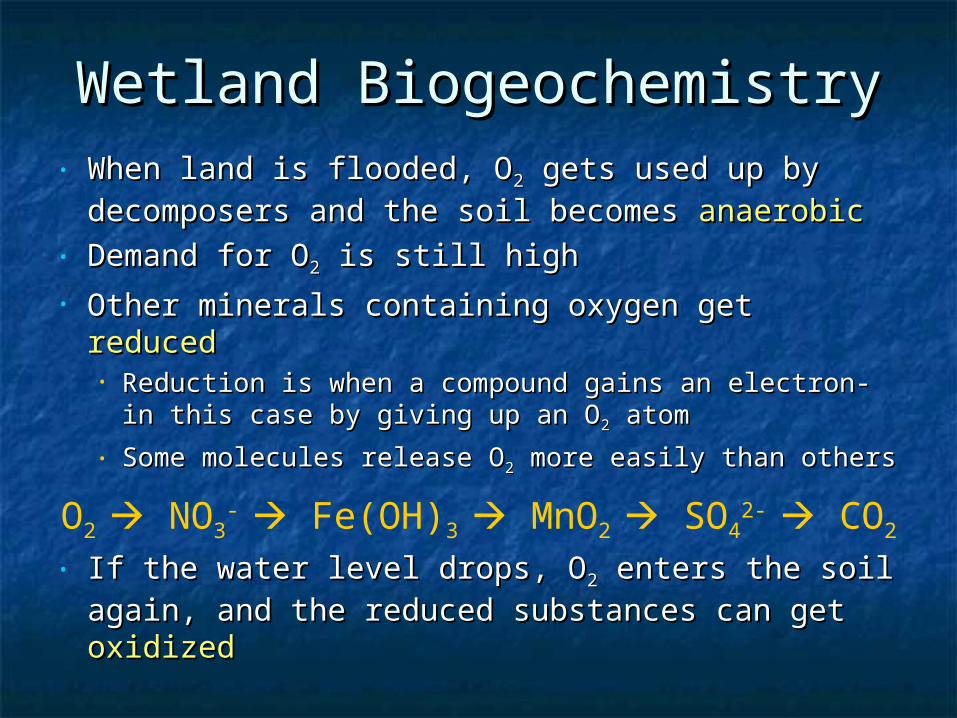
• When land is flooded, OWhen land is flooded, O22 gets used up by gets used up by decomposers and the soil becomes decomposers and the soil becomes anaerobicanaerobic
• Demand for ODemand for O22 is still high is still high• Other minerals containing oxygen get Other minerals containing oxygen get reducedreduced
• Reduction is when a compound gains an electron- in Reduction is when a compound gains an electron- in this case by giving up an Othis case by giving up an O22 atom atom
• Some molecules release OSome molecules release O22 more easily than others more easily than others
• If the water level drops, OIf the water level drops, O22 enters the soil again, enters the soil again, and the reduced substances can get and the reduced substances can get oxidizedoxidized
Wetland BiogeochemistryWetland Biogeochemistry
O2 NO3- Fe(OH)3 MnO2 SO4
2- CO2
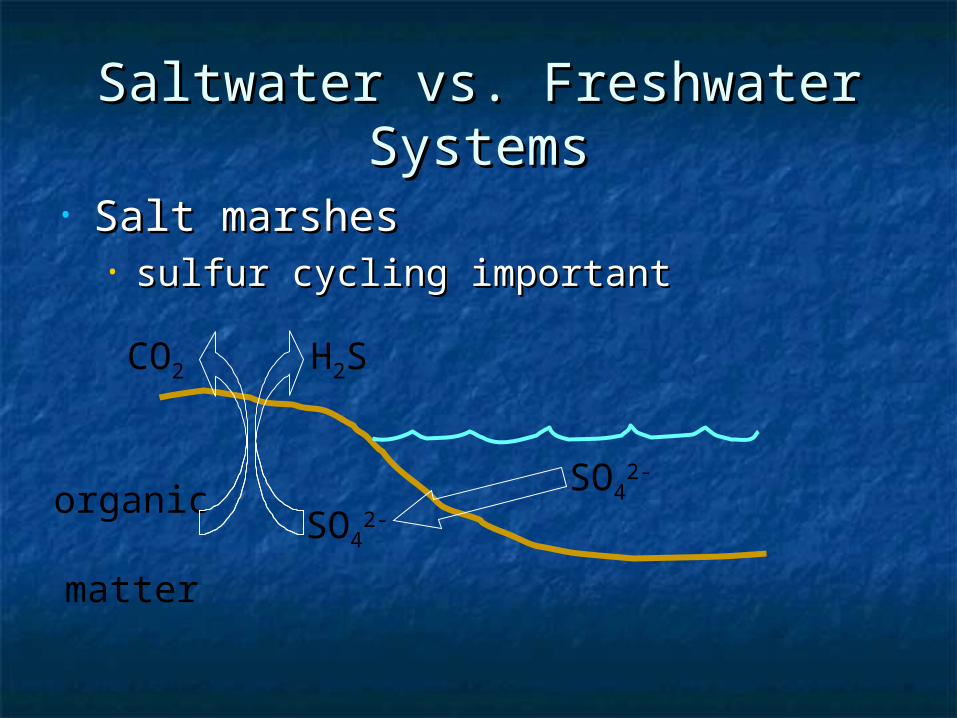
Saltwater vs. Freshwater Saltwater vs. Freshwater SystemsSystems
• Salt marshesSalt marshes• sulfur cycling importantsulfur cycling important
organic matter
SO42-
SO42-
H2SCO2
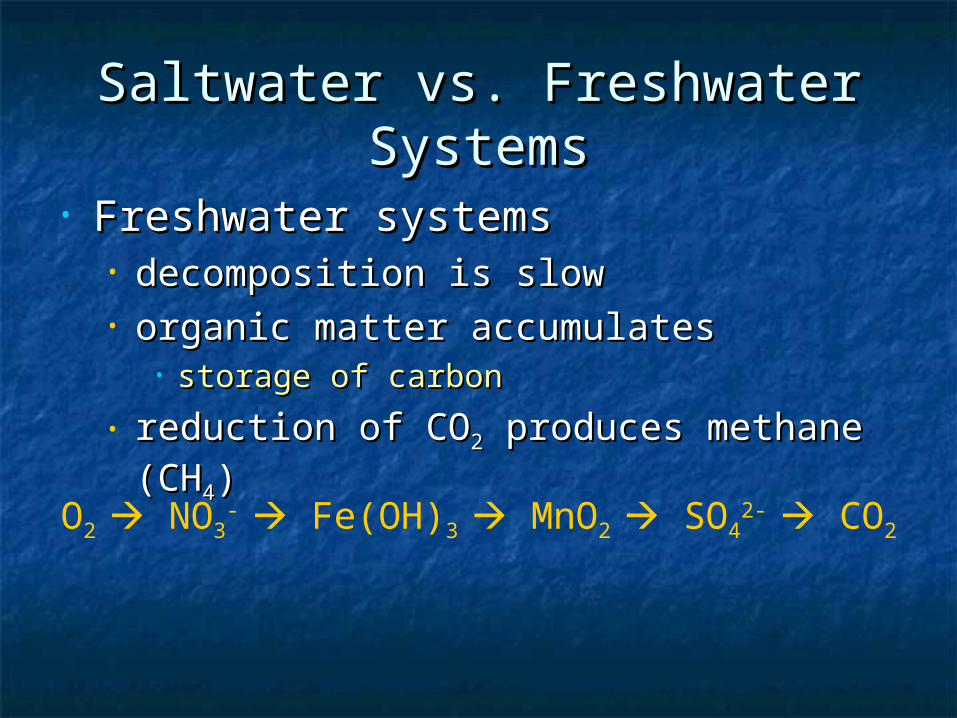
Saltwater vs. Freshwater Saltwater vs. Freshwater SystemsSystems
• Freshwater systems Freshwater systems • decomposition is slowdecomposition is slow• organic matter accumulatesorganic matter accumulates
• storage of carbonstorage of carbon
• reduction of COreduction of CO22 produces methane produces methane (CH(CH44))
O2 NO3- Fe(OH)3 MnO2 SO4
2- CO2
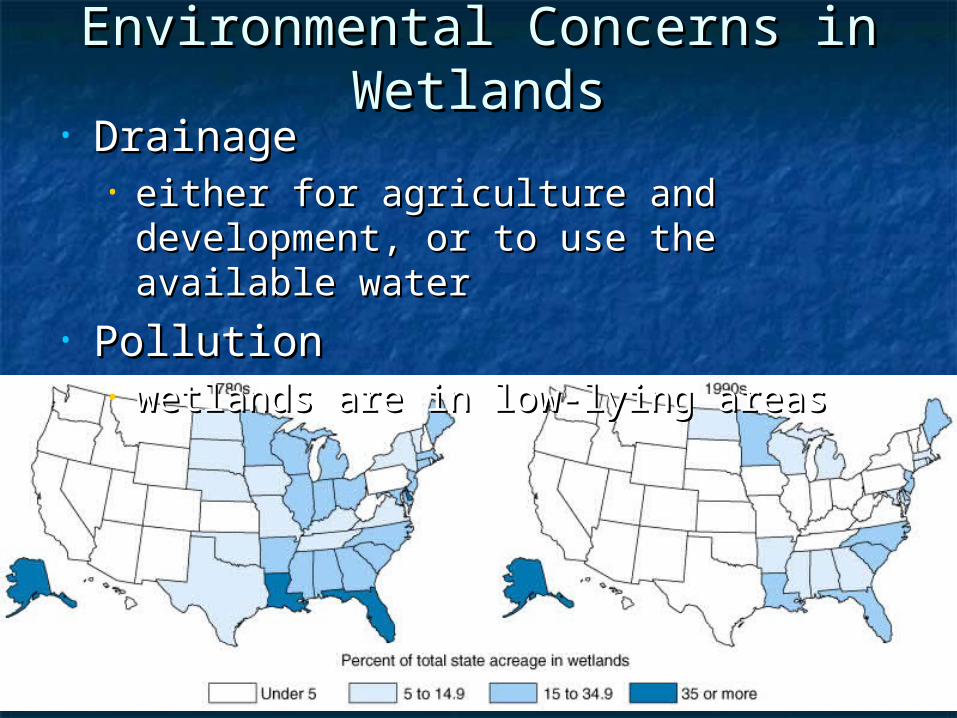
Environmental Concerns in Environmental Concerns in WetlandsWetlands
• Drainage Drainage • either for agriculture and development, either for agriculture and development,
or to use the available wateror to use the available water• Pollution Pollution
• wetlands are in low-lying areaswetlands are in low-lying areas
The open ocean is most The open ocean is most like…like…
A)A) a temperate rain foresta temperate rain forest
B)B) the chaparralthe chaparral
C)C) the desertthe desert
D)D)a Mediterranean grasslanda Mediterranean grassland
……with regard to with regard to productivity.productivity.
Where is the ocean most Where is the ocean most productive?productive?
Where nutrients Where nutrients are available: are available:
• near the coastnear the coast• rivers bring rivers bring
nutrientsnutrients
• in upwelling in upwelling zoneszones
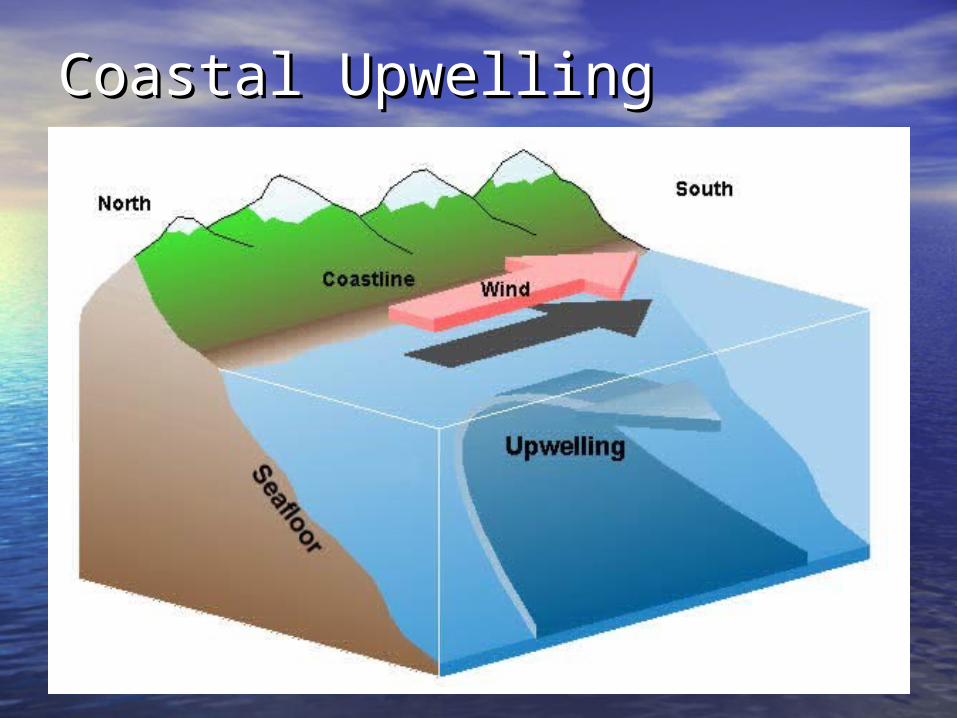
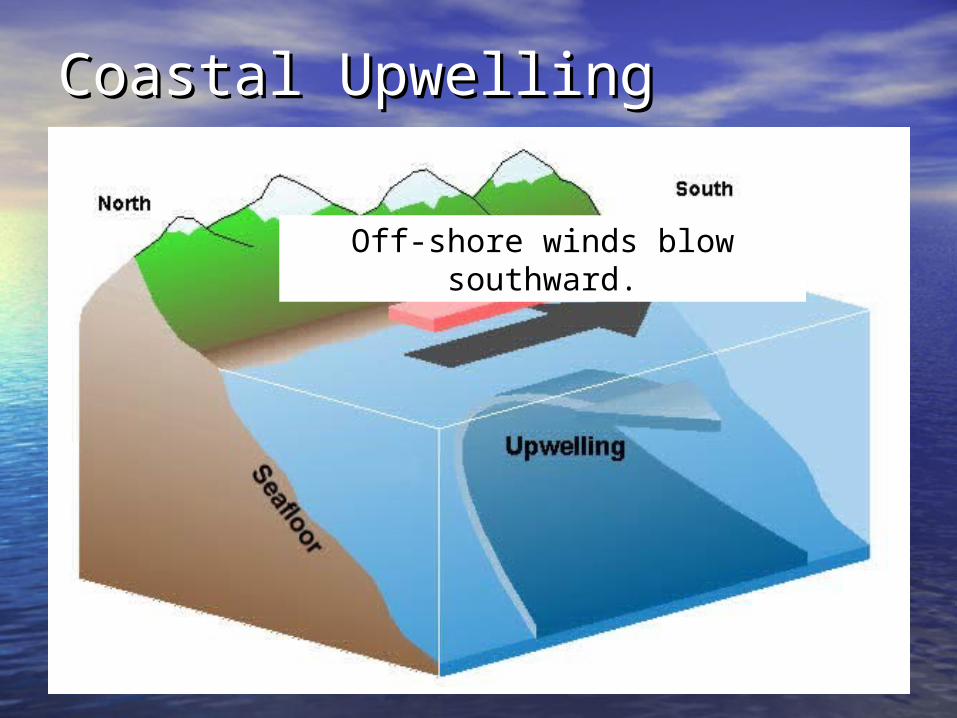
Coastal UpwellingCoastal Upwelling
Coastal UpwellingCoastal Upwelling
Off-shore winds blow southward.
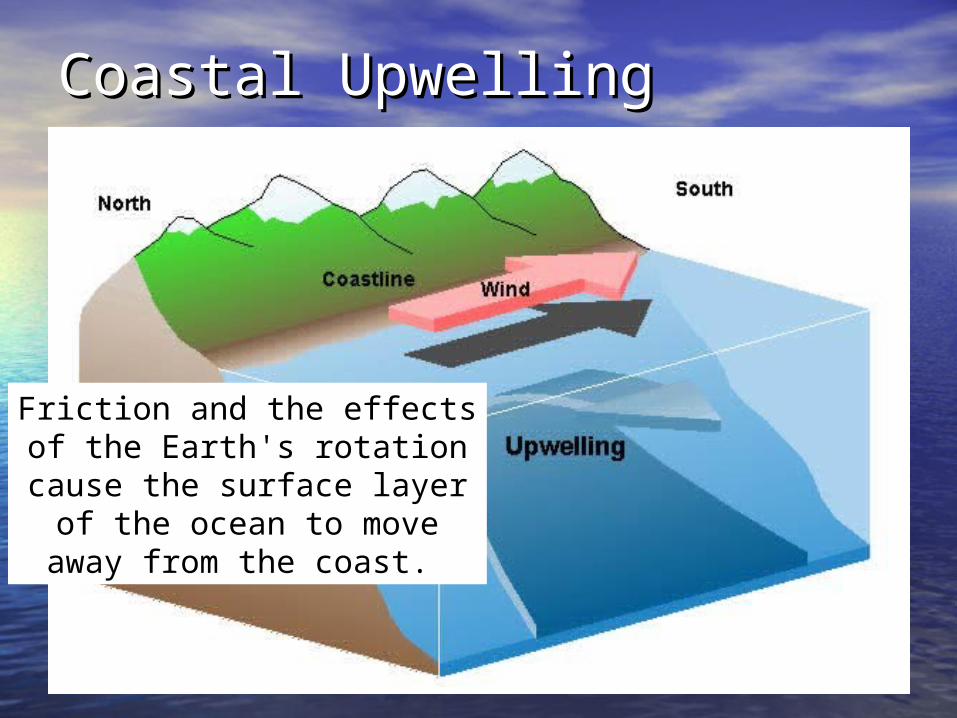
Coastal UpwellingCoastal Upwelling
Friction and the effects of the Earth's rotation cause the surface layer of the
ocean to move away from the coast.
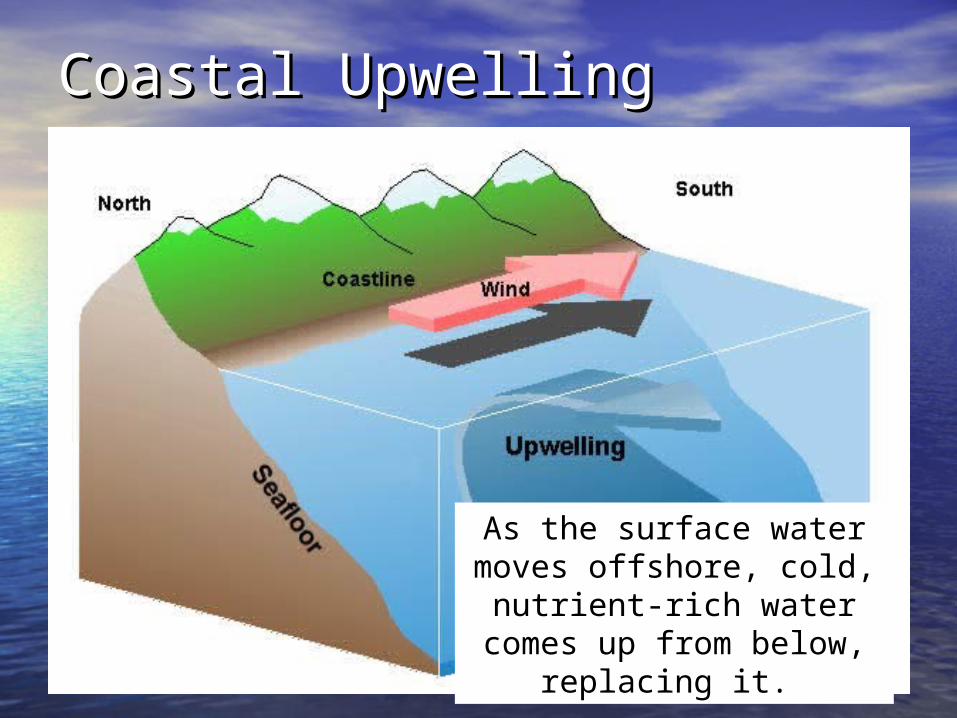
Coastal UpwellingCoastal Upwelling
As the surface water moves offshore, cold,
nutrient-rich water comes up from below, replacing
it.
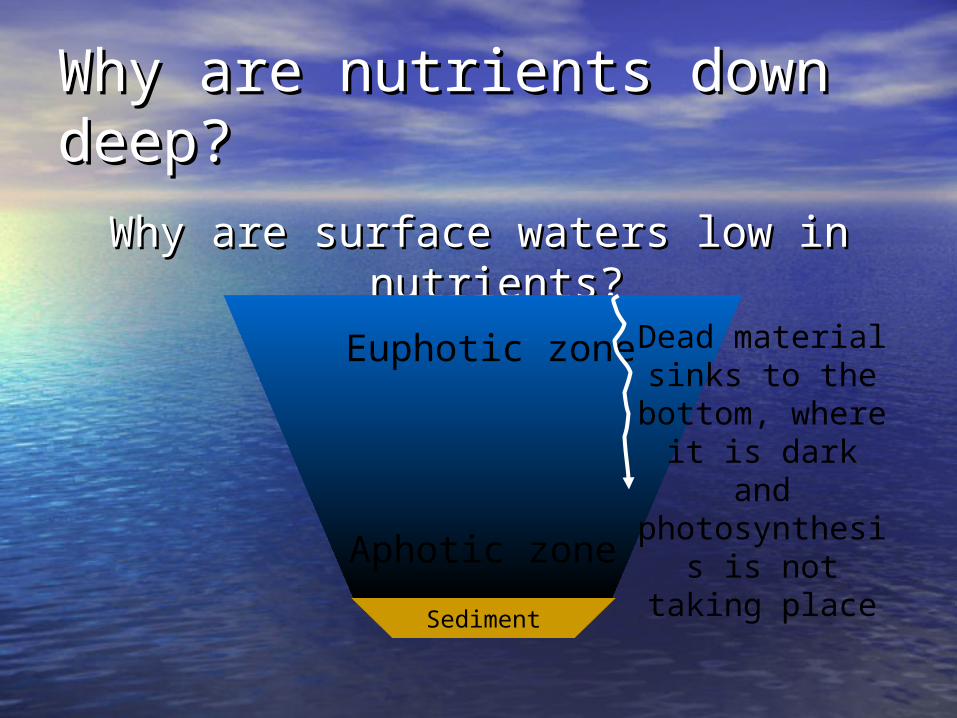
Why are nutrients down Why are nutrients down deep?deep?
Why are surface waters low in Why are surface waters low in nutrients?nutrients?
Euphotic zone
Aphotic zone
Sediment
Dead material sinks to the
bottom, where it is dark and
photosynthesis is not taking
place
Coral reefsCoral reefs
• Coral reefs are Coral reefs are extremely productiveextremely productive
• Visibility is great!Visibility is great!• But we know that But we know that
nutrient-rich water is nutrient-rich water is murky murky
How is this possible?How is this possible?Where are the nutrients?Where are the nutrients?
Coral reefsCoral reefs
• Efficient cycling of Efficient cycling of nutrientsnutrients
• Complex relationships Complex relationships between organismsbetween organisms• zooxanthellae in coralzooxanthellae in coral• intricate food websintricate food webs
Ecology subfields:Ecology subfields:
• Population Ecology:Population Ecology:• the study of individuals of a certain species the study of individuals of a certain species
occupying a defined area during a specific occupying a defined area during a specific timetime
Population EcologyPopulation Ecology
• Population densityPopulation density • # of individuals of a certain species in a given # of individuals of a certain species in a given
areaarea
• Population demographyPopulation demography• a way of assessing well-being a way of assessing well-being
• proportion of males to femalesproportion of males to females• birth ratesbirth rates• death ratesdeath rates• replacement of parents by next generation (fitness)replacement of parents by next generation (fitness)• life expectancylife expectancy
The Tools of Population The Tools of Population EcologyEcology
• ModelingModeling• Creation of Life TablesCreation of Life Tables
Why are models powerful?Why are models powerful?
You can use them to:You can use them to:• synthesize informationsynthesize information• look at a system quantitativelylook at a system quantitatively• test your understandingtest your understanding• predict system dynamicspredict system dynamics• make management decisionsmake management decisions
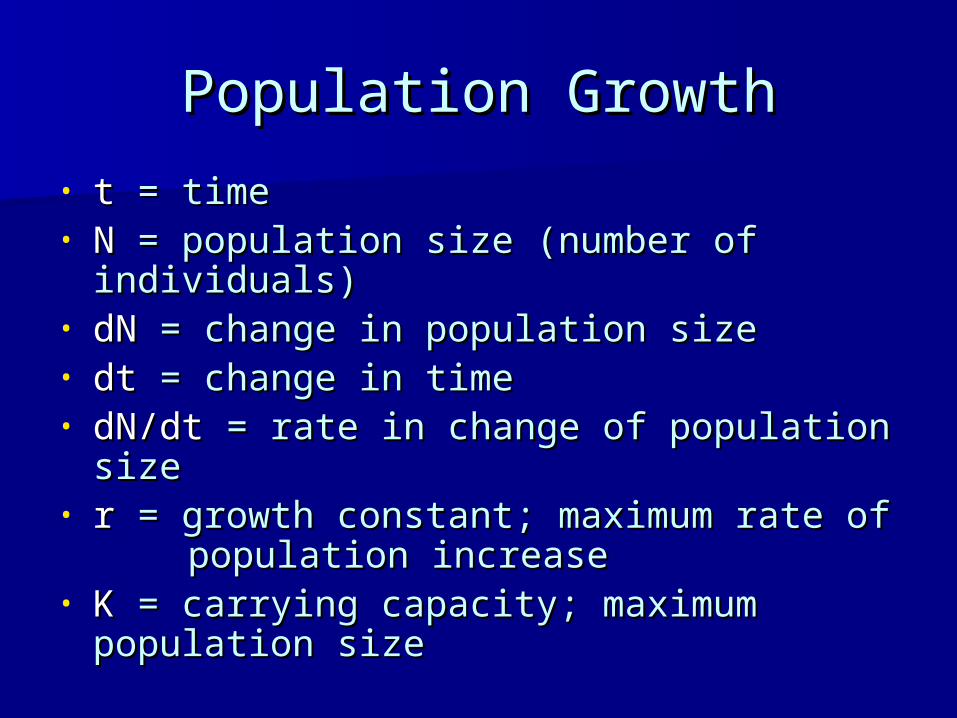
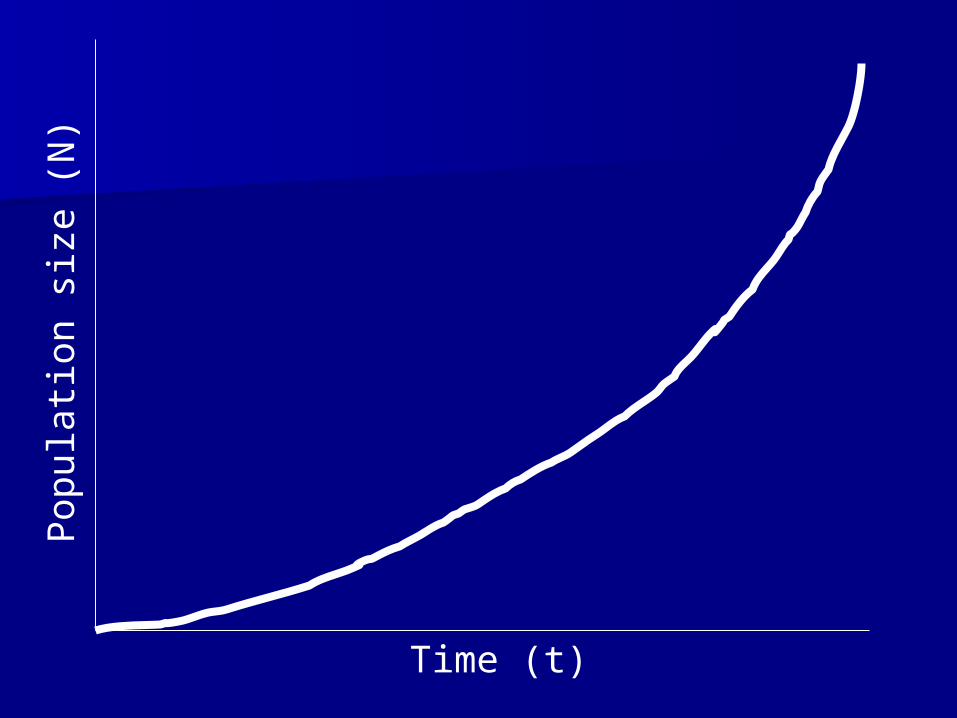
Population GrowthPopulation Growth
• tt = time= time• NN = population size (number of = population size (number of
individuals)individuals)• dNdN = change in population size = change in population size • dtdt = change in time = change in time • dN/dtdN/dt = rate in change of population size= rate in change of population size• rr = growth constant; maximum rate of = growth constant; maximum rate of
population increasepopulation increase• KK = carrying capacity; maximum = carrying capacity; maximum
population sizepopulation size
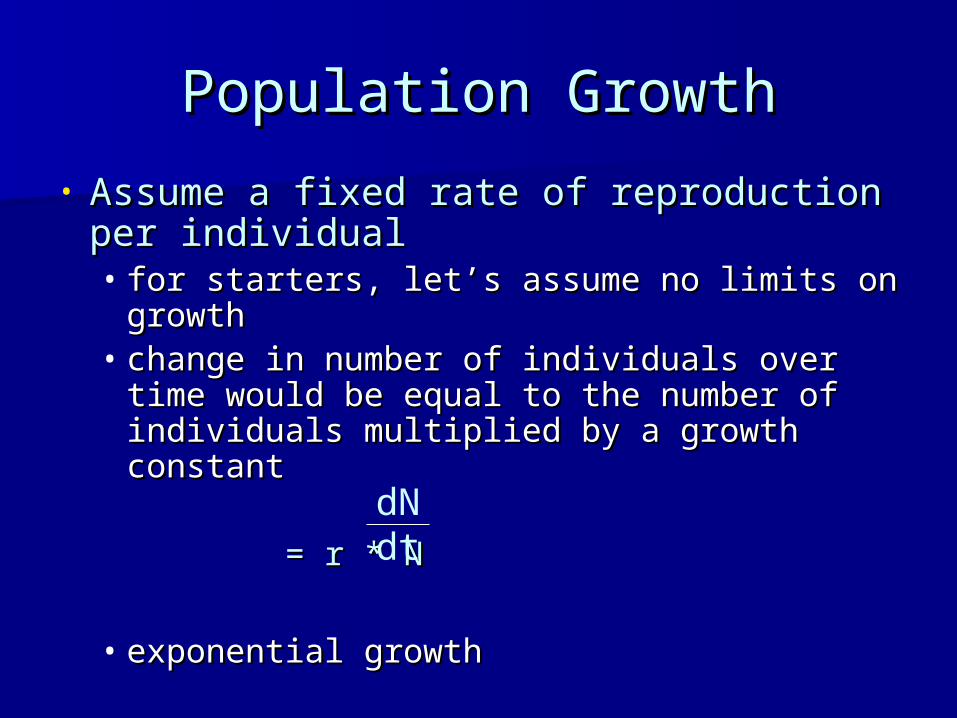
Population GrowthPopulation Growth
• Assume a fixed rate of reproduction per Assume a fixed rate of reproduction per individualindividual• for starters, let’s assume no limits on for starters, let’s assume no limits on
growthgrowth• change in number of individuals over time change in number of individuals over time
would be equal to the number of would be equal to the number of individuals multiplied by a growth constantindividuals multiplied by a growth constant
= r * N= r * N
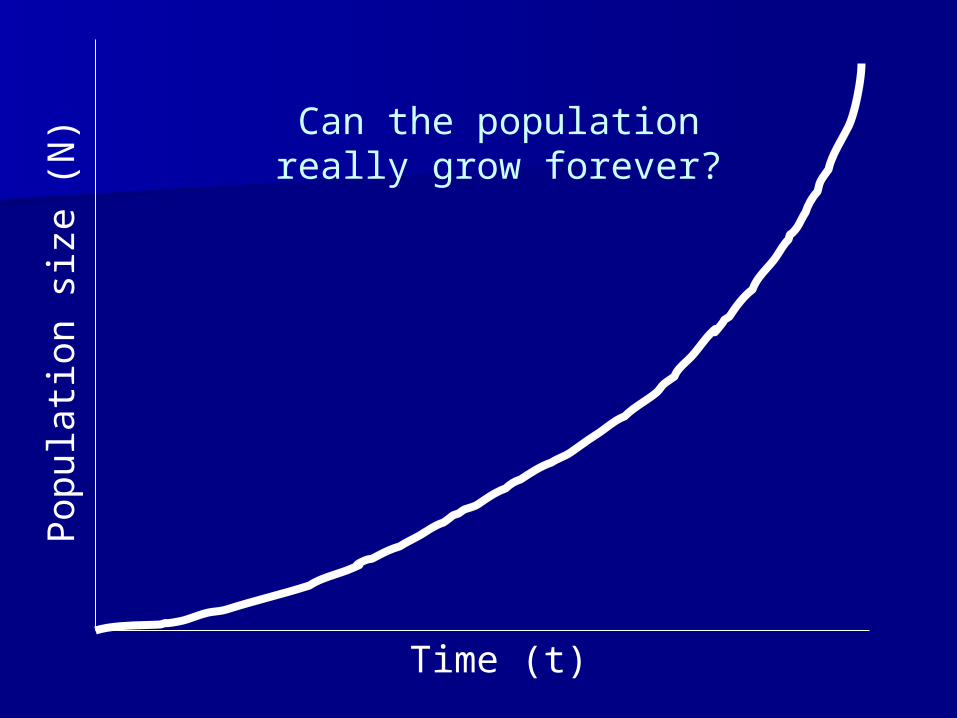
• exponential growthexponential growth
dN dt
Time (t)
Pop
ula
tion s
ize (
N)
Time (t)
Pop
ula
tion s
ize (
N)
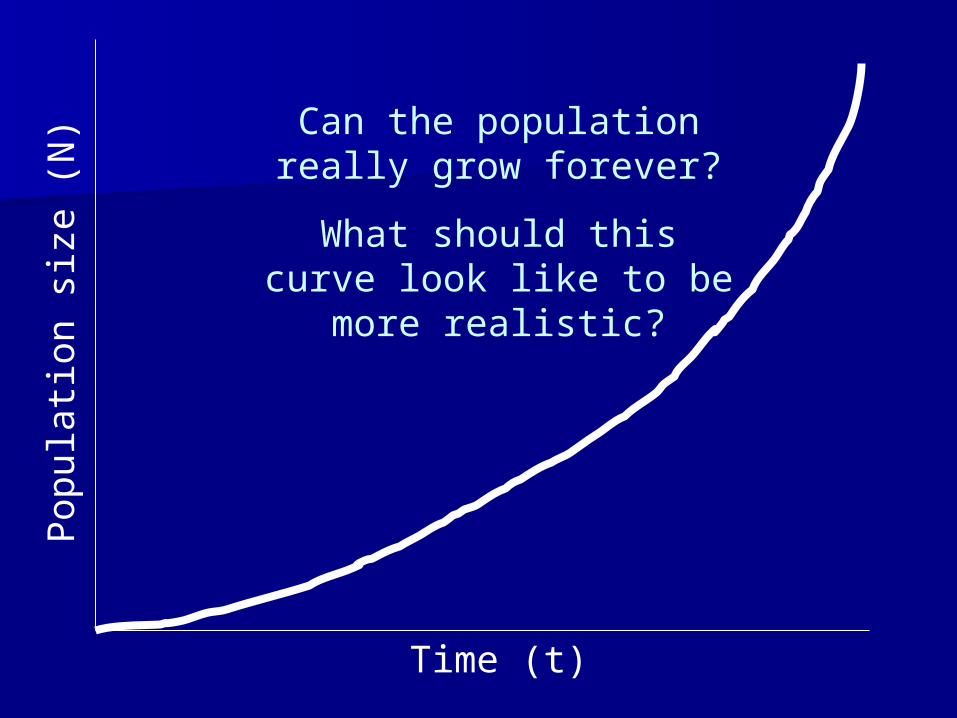
Can the population really grow forever?
Time (t)
Pop
ula
tion s
ize (
N)
Can the population really grow forever?
What should this curve look like to be more
realistic?
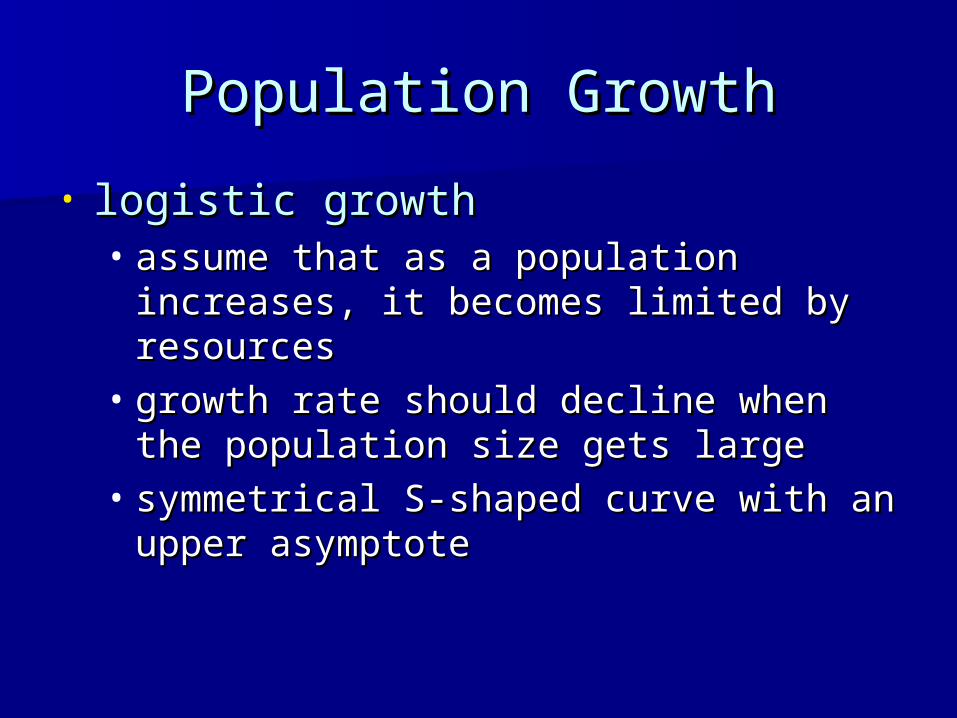
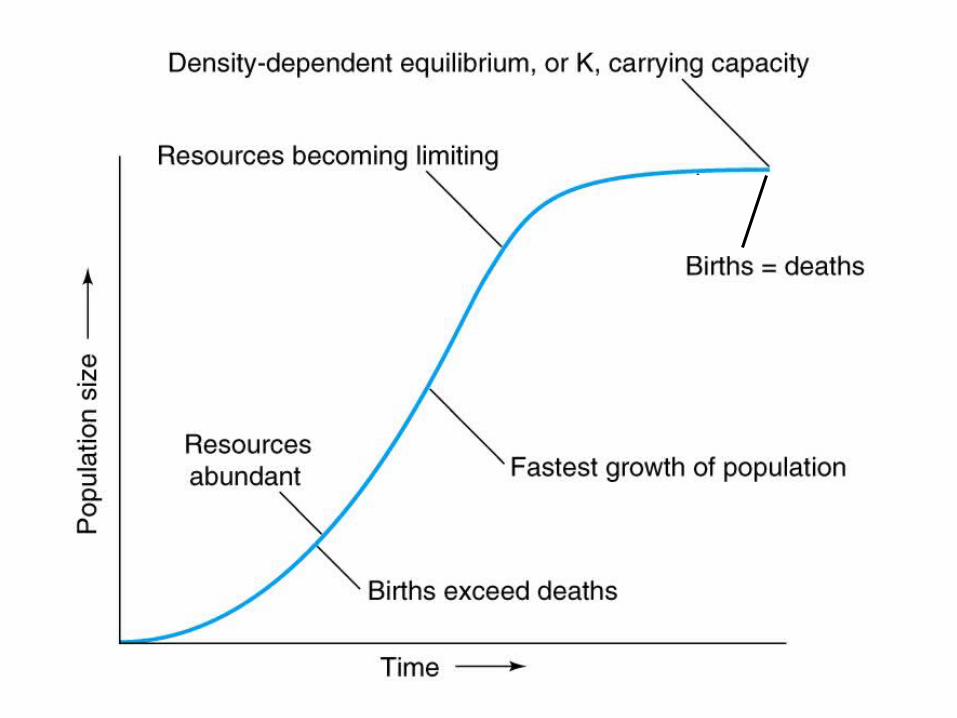
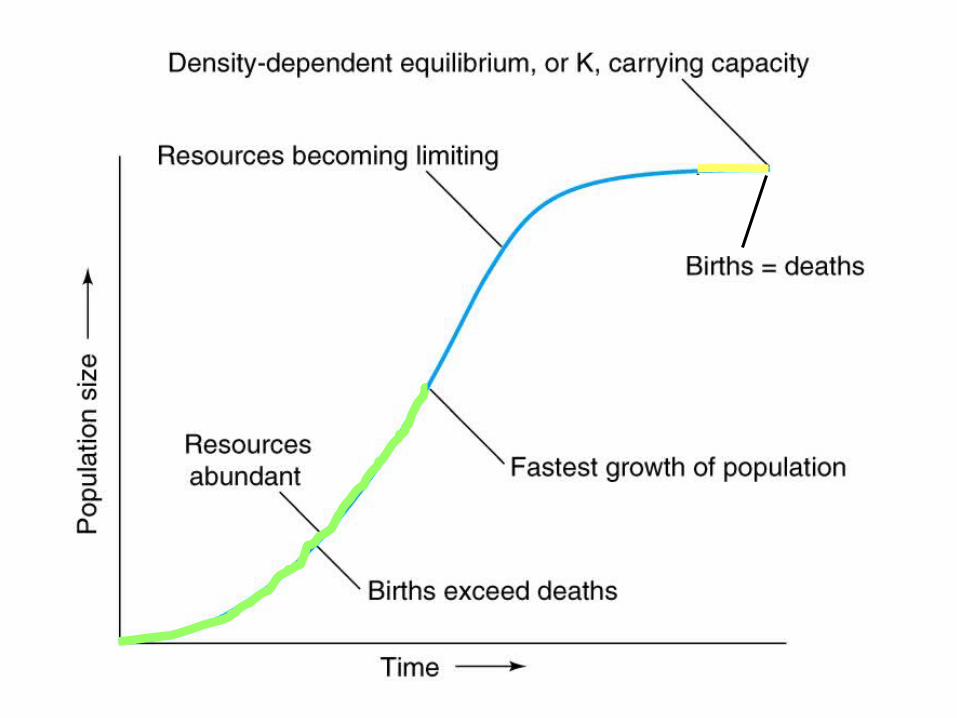
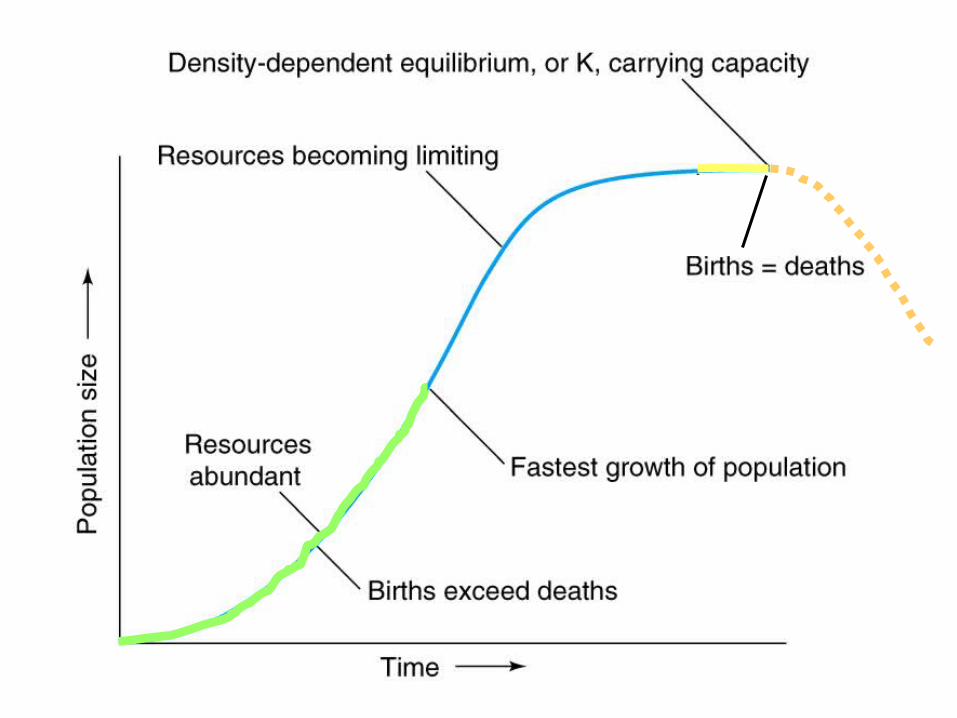
Population GrowthPopulation Growth
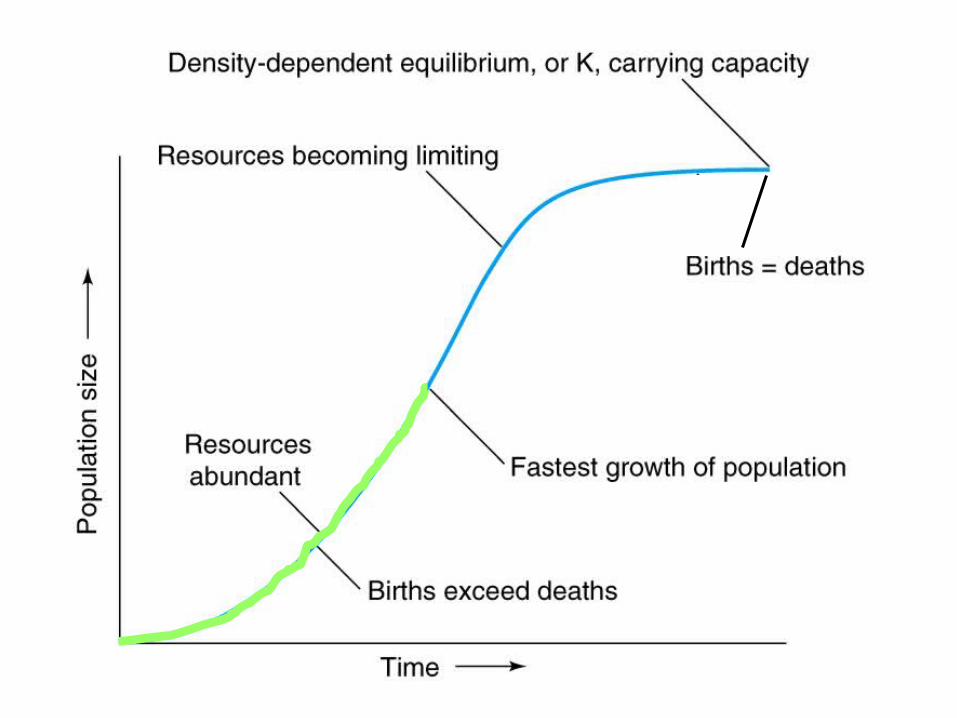
• logistic growthlogistic growth• assume that as a population increases, assume that as a population increases,
it becomes limited by resourcesit becomes limited by resources• growth rate should decline when the growth rate should decline when the
population size gets largepopulation size gets large• symmetrical S-shaped curve with an symmetrical S-shaped curve with an
upper asymptoteupper asymptote

AnnouncementsAnnouncements
• Women in Science and EngineeringWomen in Science and Engineering• ““Applying to Graduate School in Applying to Graduate School in
Sciences” workshop and lunch Oct. 27thSciences” workshop and lunch Oct. 27th• Check your syllabus with the one Check your syllabus with the one
online to make sure it is the right one! online to make sure it is the right one! • No additional reading assignment for No additional reading assignment for
section this week section this week • Focus on your textbook readingFocus on your textbook reading• Bring your calculator to sectionBring your calculator to section
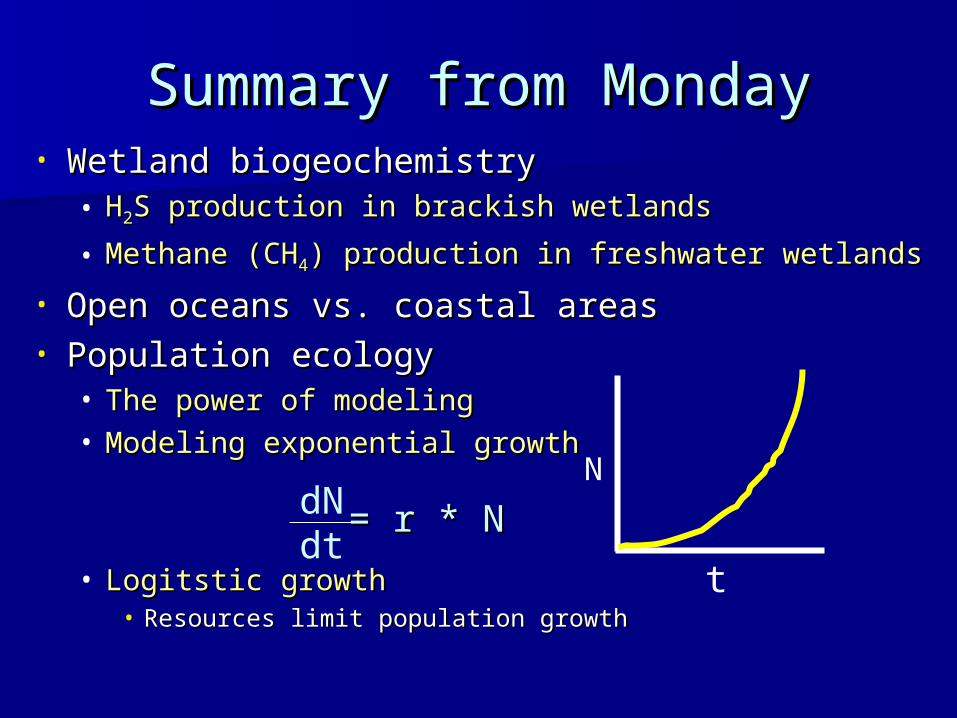
Summary from MondaySummary from Monday• Wetland biogeochemistryWetland biogeochemistry
• HH22S production in brackish wetlandsS production in brackish wetlands
• Methane (CHMethane (CH44) production in freshwater wetlands) production in freshwater wetlands
• Open oceans vs. coastal areasOpen oceans vs. coastal areas• Population ecologyPopulation ecology
• The power of modelingThe power of modeling• Modeling exponential growthModeling exponential growth
• Logitstic growthLogitstic growth• Resources limit population growthResources limit population growth
= r * N= r * NdN dt
t
N

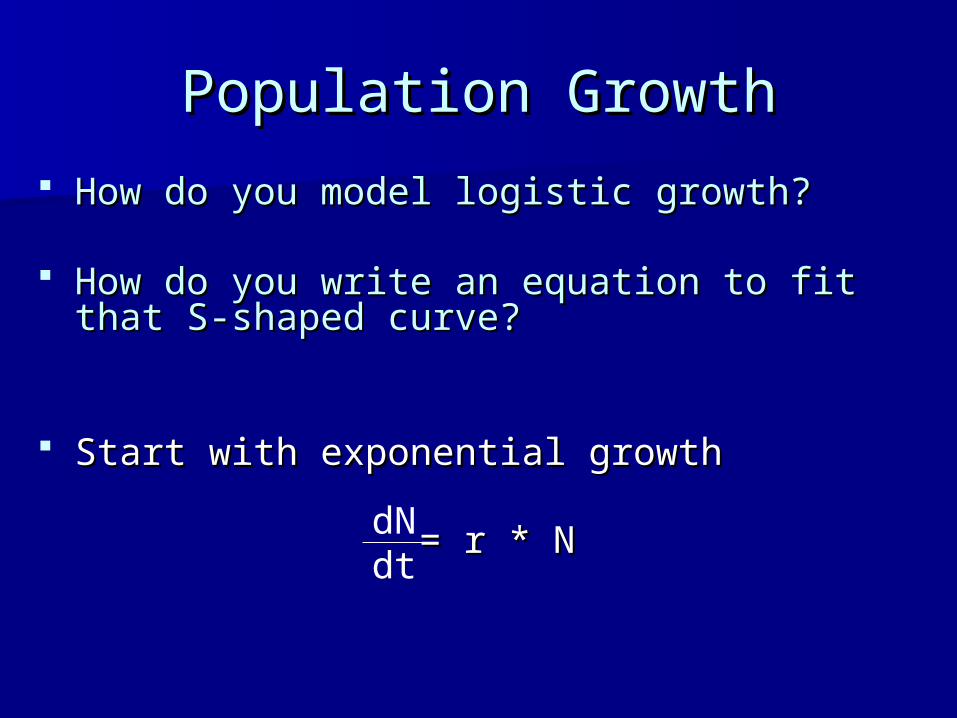
Population GrowthPopulation Growth
How do you model logistic growth?How do you model logistic growth?
How do you write an equation to fit that S-How do you write an equation to fit that S-shaped curve?shaped curve?
Start with exponential growthStart with exponential growth
= r * N= r * NdN dt
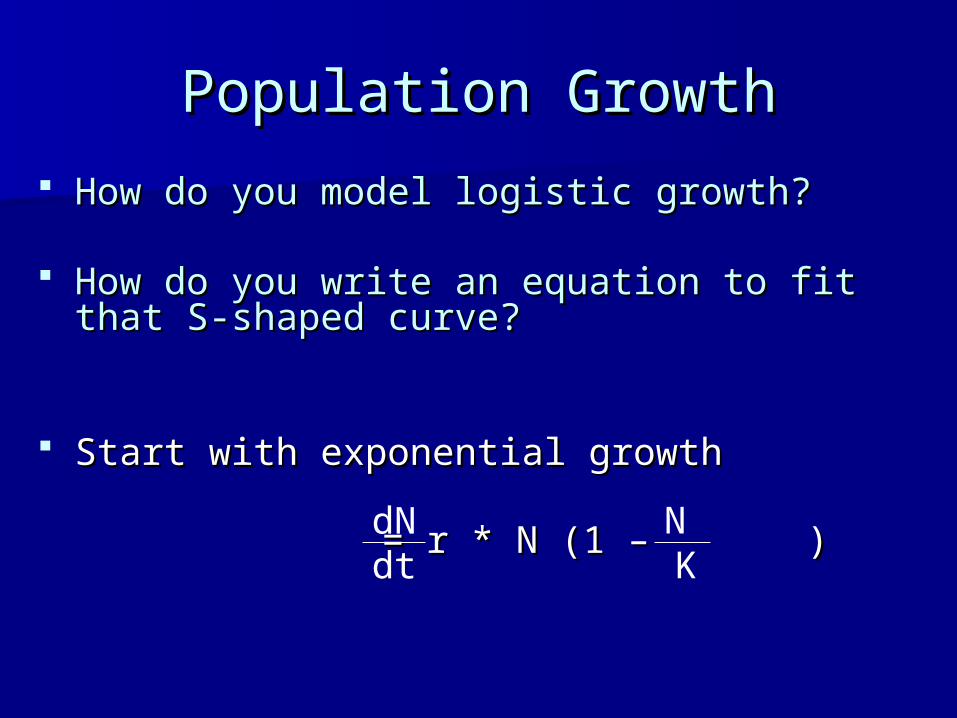
Population GrowthPopulation Growth
How do you model logistic growth?How do you model logistic growth?
How do you write an equation to fit that S-How do you write an equation to fit that S-shaped curve?shaped curve?
Start with exponential growthStart with exponential growth
dN dt = r * N (1 – )= r * N (1 – )N
K
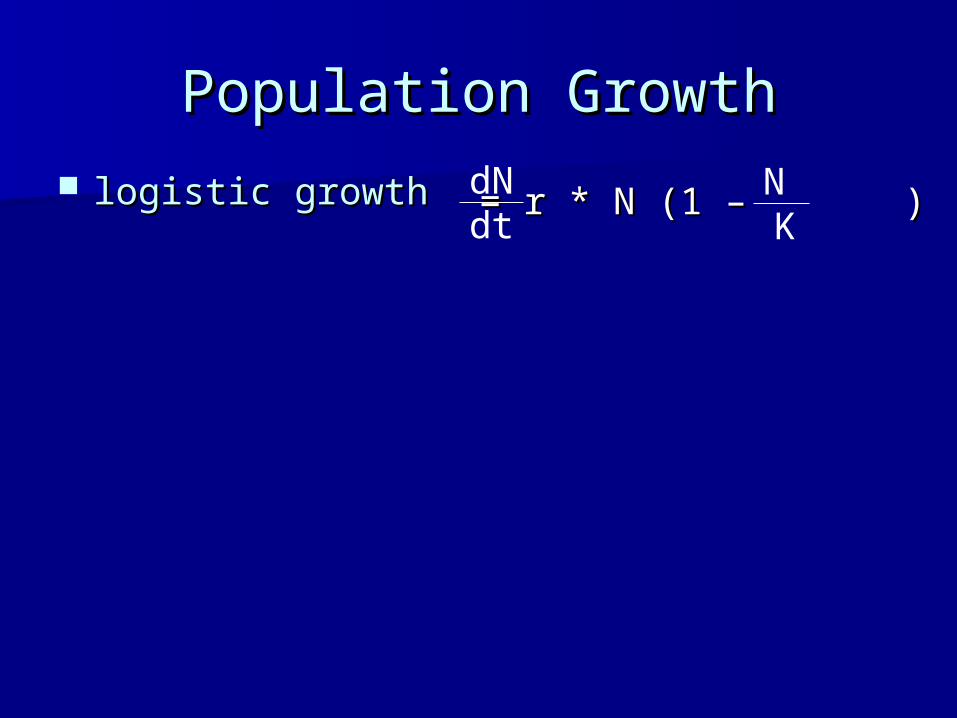
Population GrowthPopulation Growth logistic growthlogistic growth = r * N (1 – )= r * N (1 – )N
KdN dt
Population GrowthPopulation Growth
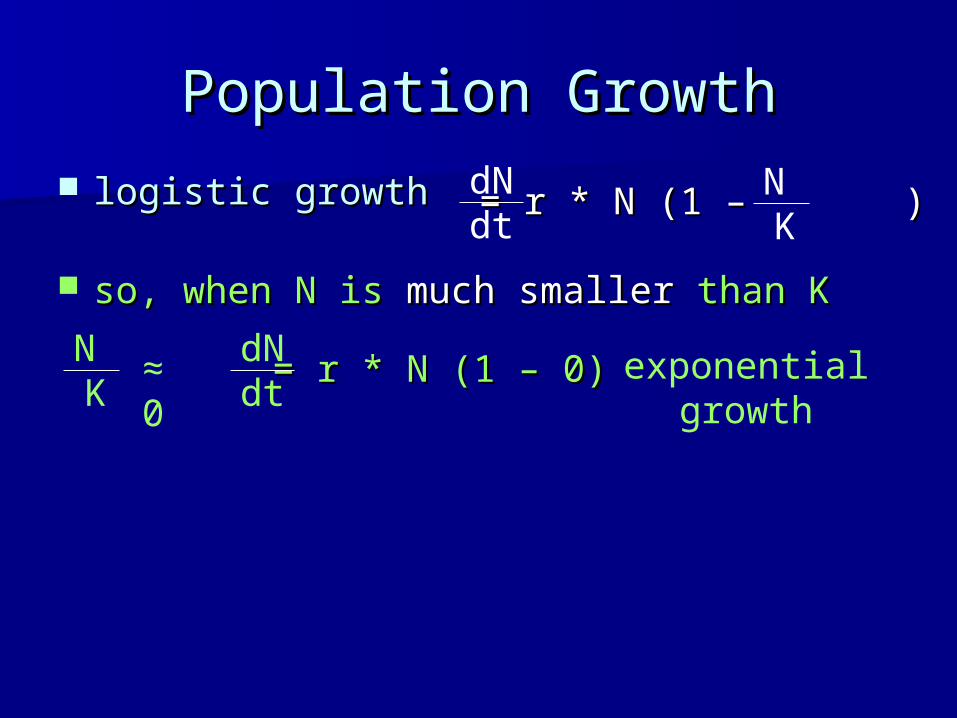
logistic growthlogistic growth
so, when N is so, when N is much smallermuch smaller than K than K
= r * N (1 – )= r * N (1 – )N K
dN dt
= r * N (1 – 0)= r * N (1 – 0)dN dt
exponential growth
N K
≈ 0
Population GrowthPopulation Growth
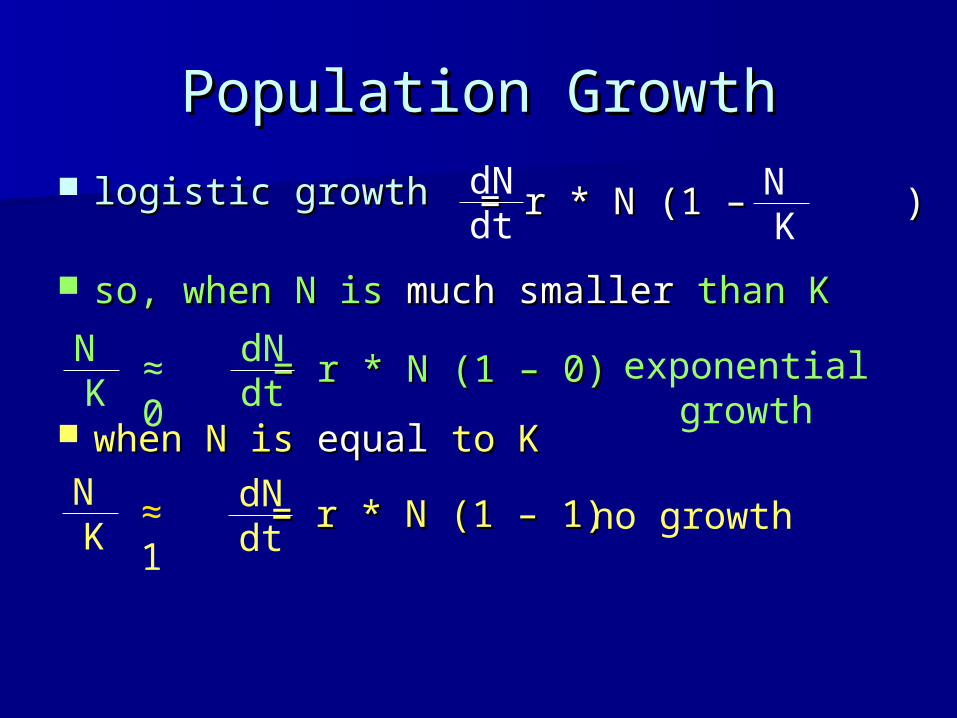
logistic growthlogistic growth
so, when N is so, when N is much smallermuch smaller than K than K
when N is when N is equalequal to K to K
= r * N (1 – )= r * N (1 – )N K
dN dt
= r * N (1 – 0)= r * N (1 – 0)dN dt
exponential growth
= r * N (1 – 1)= r * N (1 – 1)dN dt
no growth
N K
≈ 0
N K
≈ 1
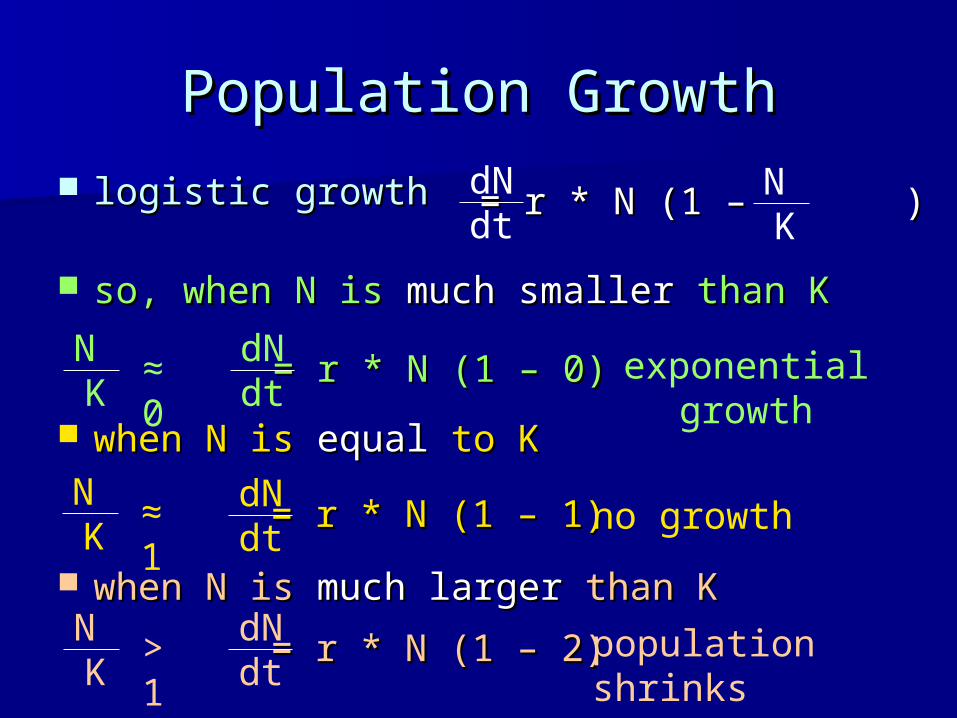
Population GrowthPopulation Growth
logistic growthlogistic growth
so, when N is so, when N is much smallermuch smaller than K than K
when N is when N is equalequal to K to K
when N is when N is much largermuch larger than K than K
= r * N (1 – )= r * N (1 – )N K
dN dt
= r * N (1 – 0)= r * N (1 – 0)dN dt
exponential growth
= r * N (1 – 1)= r * N (1 – 1)dN dt
no growth
= r * N (1 – 2)= r * N (1 – 2)dN dt
population shrinks
N K
≈ 0
N K
≈ 1
N K
> 1
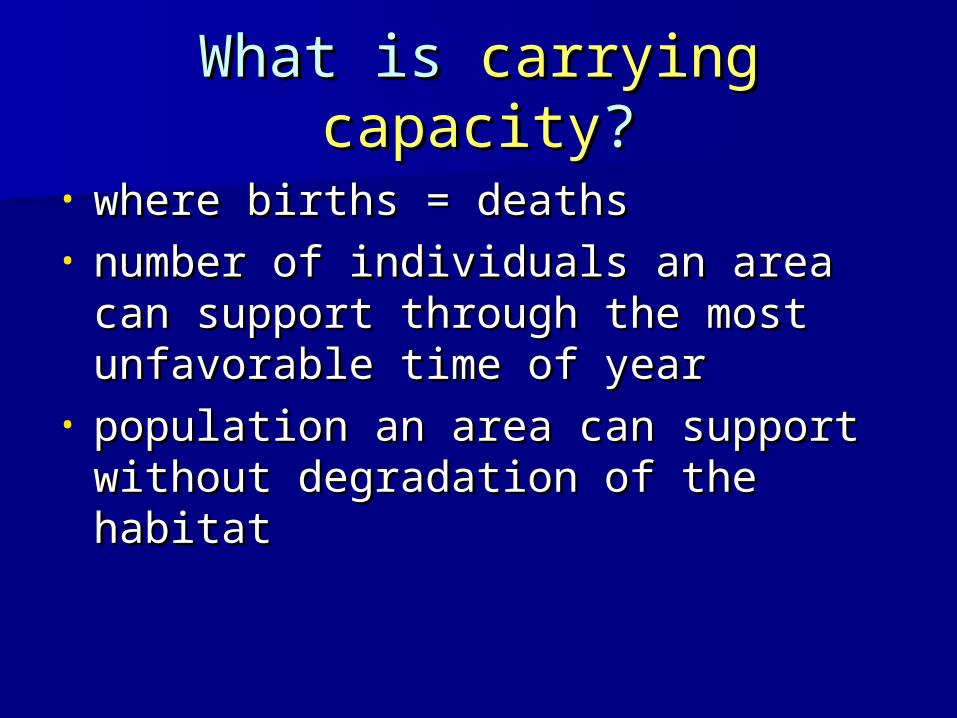
What is What is carrying capacitycarrying capacity??
• where births = deathswhere births = deaths• number of individuals an area can number of individuals an area can
support through the most support through the most unfavorable time of yearunfavorable time of year
• population an area can support population an area can support without degradation of the habitatwithout degradation of the habitat
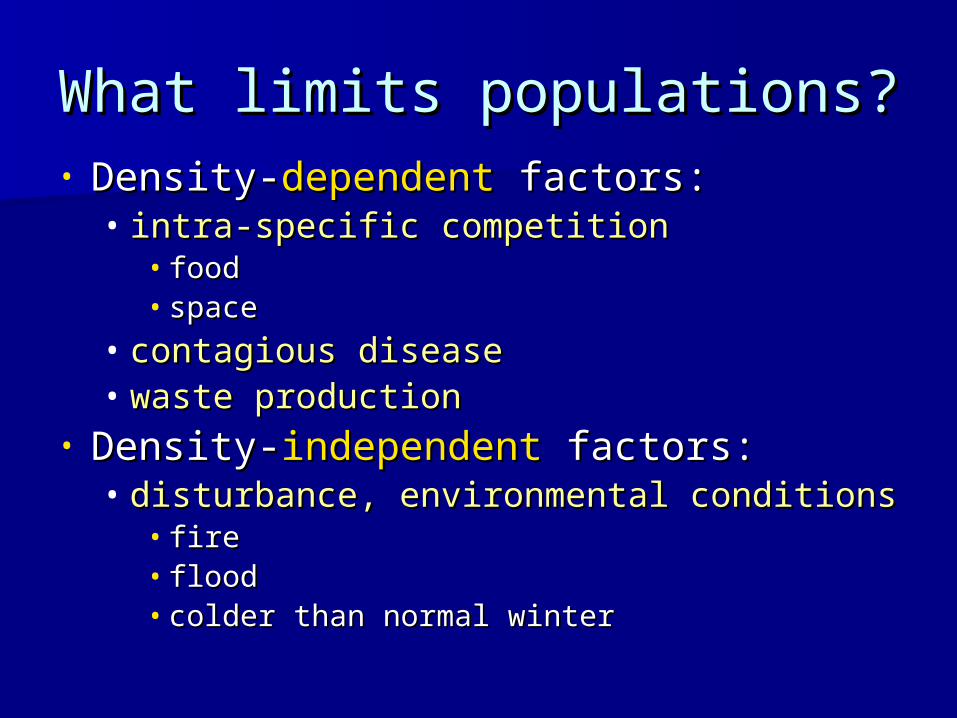
What limits populations?What limits populations?• Density-Density-dependentdependent factors: factors:
• intra-specific competitionintra-specific competition• foodfood• spacespace
• contagious diseasecontagious disease• waste productionwaste production
• Density-Density-independentindependent factors: factors:• disturbance, environmental conditionsdisturbance, environmental conditions
• firefire• floodflood• colder than normal wintercolder than normal winter
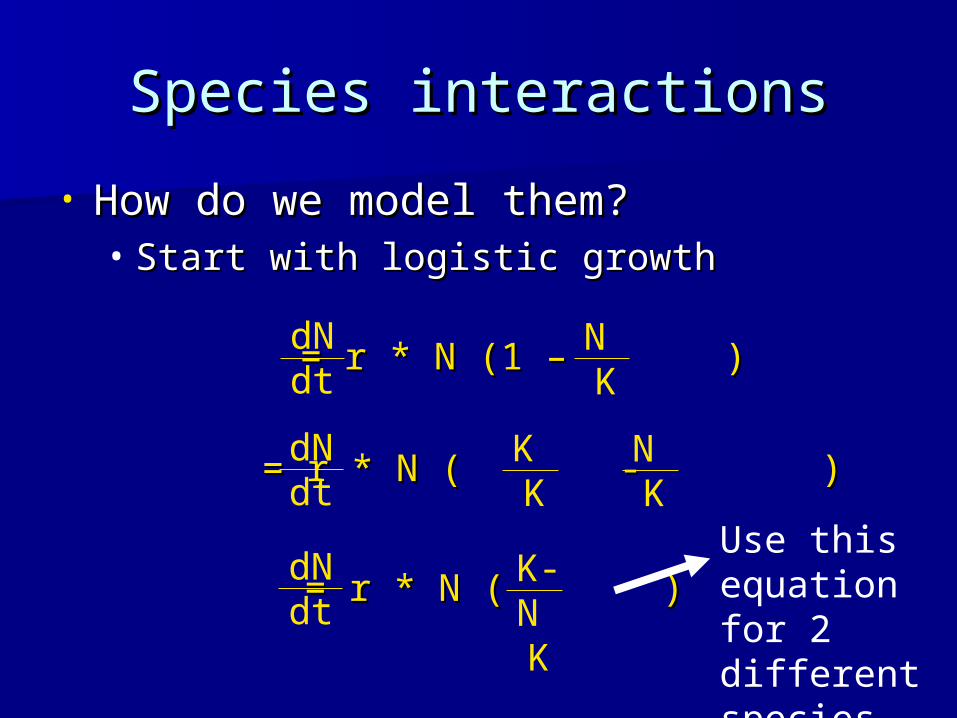
Species interactionsSpecies interactions
• How do we model them?How do we model them?• Start with logistic growthStart with logistic growth
= r * N (1 – )= r * N (1 – )N K
dN dt
= r * N ( - )= r * N ( - )N K
dN dt
K K
= r * N ( )= r * N ( )dN dt
K-N K
Use this equation for 2 different species
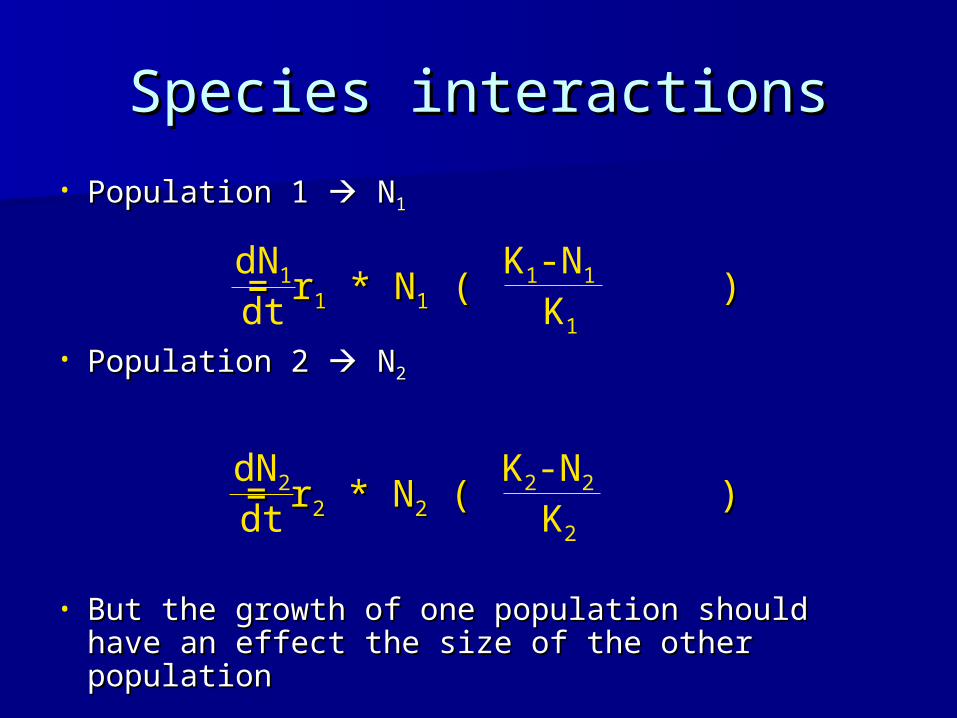
Species interactionsSpecies interactions
• Population 1 Population 1 N N11
• Population 2 Population 2 N N22
• But the growth of one population should have But the growth of one population should have an effect the size of the other populationan effect the size of the other population
= r= r11 * N * N11 ( ) ( )dN
1 dt
K1-N1 K1
= r= r22 * N * N22 ( ) ( )dN
2 dt
K2-N2 K2
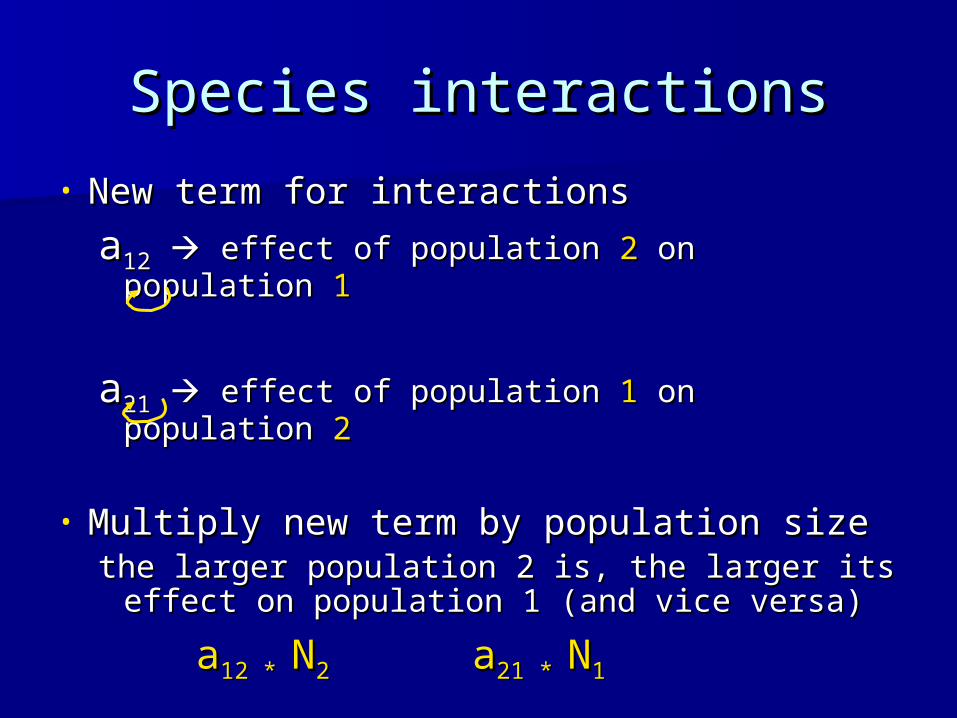
Species interactionsSpecies interactions
• New term for interactionsNew term for interactions
aa1212 effect of population effect of population 22 on population on population 11
aa2121 effect of population effect of population 11 on population on population 22
• Multiply new term by population sizeMultiply new term by population sizethe larger population 2 is, the larger its effect the larger population 2 is, the larger its effect
on population 1 (and vice versa)on population 1 (and vice versa)
aa12 * 12 * NN2 2 aa21 * 21 * NN11
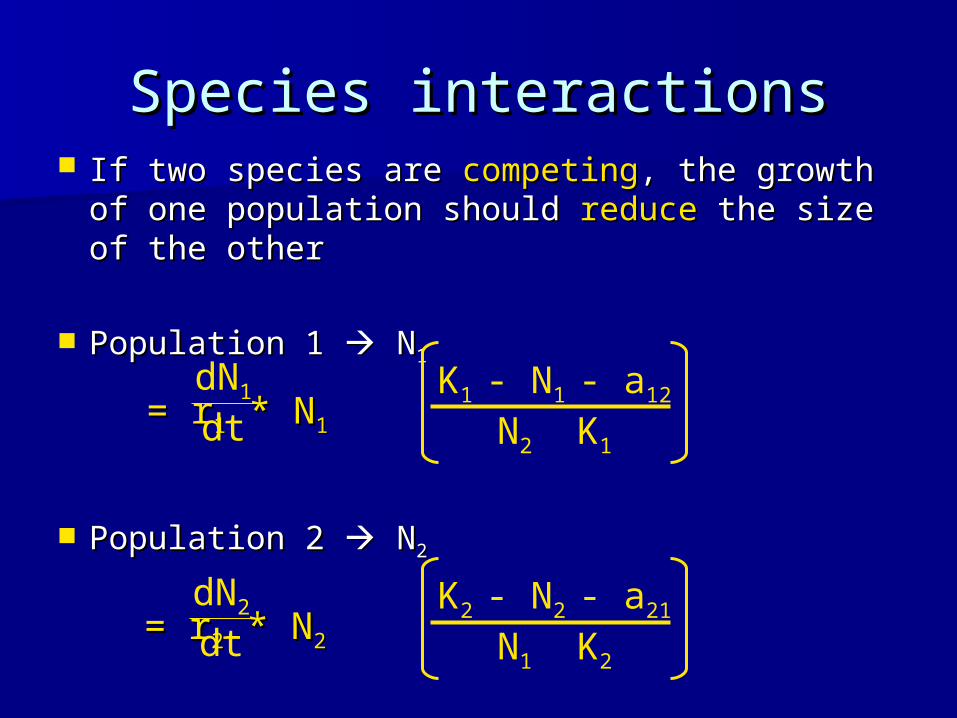
Species interactionsSpecies interactions If two species are If two species are competingcompeting, the growth of one , the growth of one
population should population should reducereduce the size of the other the size of the other
Population 1 Population 1 N N11
Population 2 Population 2 N N22
= r= r11 * N * N11 dN
1 dt
K1 - N1 - a12 N2 K1
= r= r22 * N * N22 dN
2 dt
K2 - N2 - a21 N1 K2
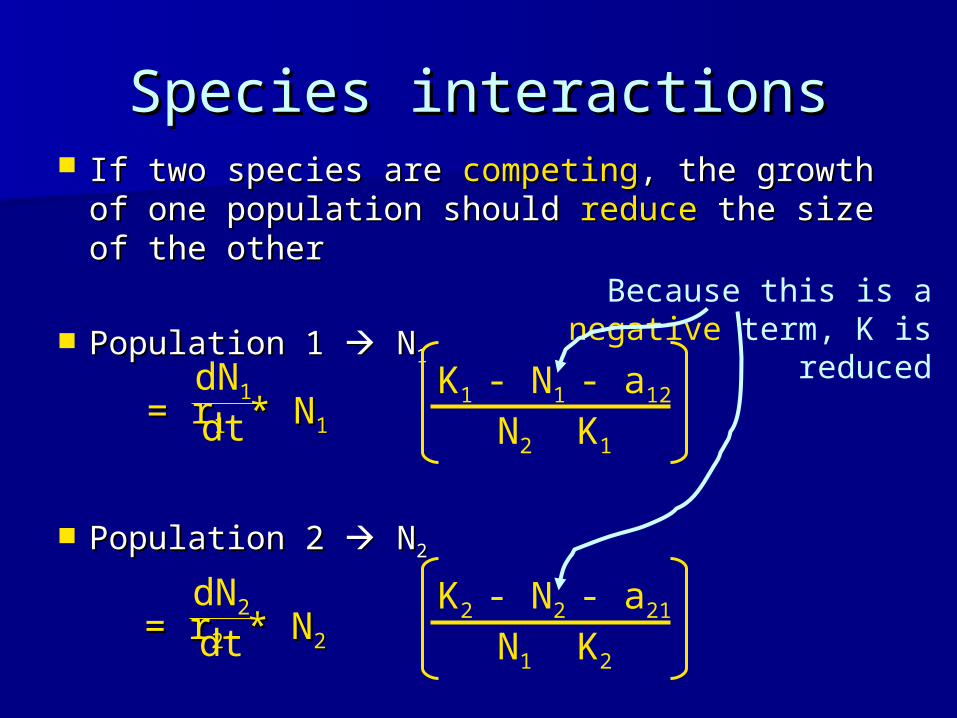
Because this is a negative term, K is reduced
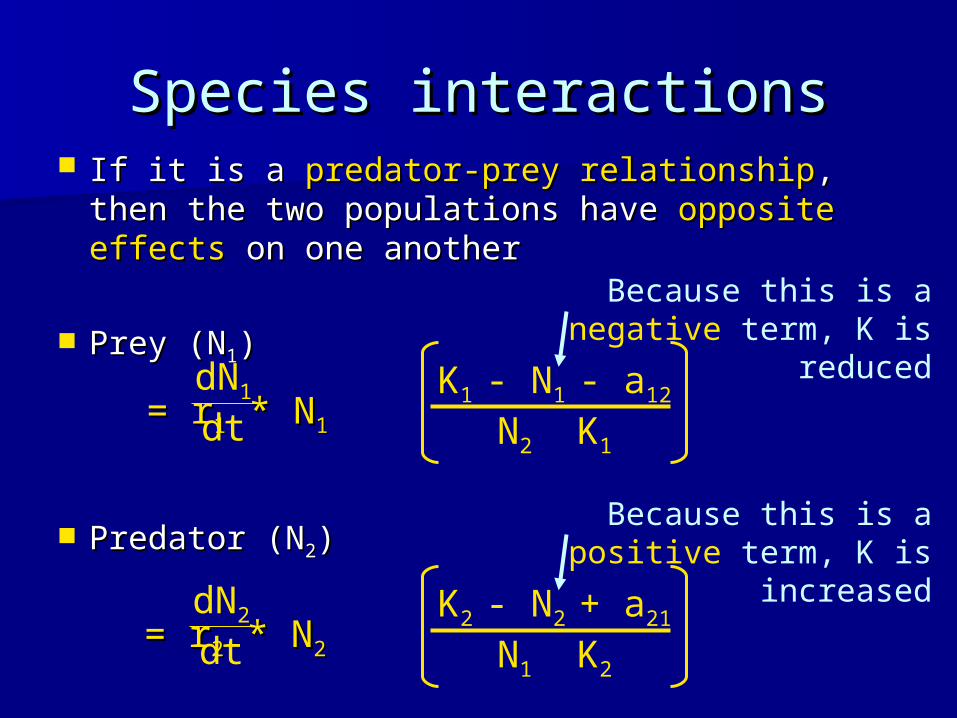
Species interactionsSpecies interactions If it is a If it is a predator-prey relationshippredator-prey relationship, then the two , then the two
populations have populations have opposite effectsopposite effects on one another on one another
Prey (NPrey (N11))
Predator (NPredator (N22))
= r= r11 * N * N11 dN
1 dt
K1 - N1 - a12 N2 K1
= r= r22 * N * N22 dN
2 dt
K2 - N2 + a21 N1 K2
Because this is a negative term, K is reduced
Because this is a positive term, K is increased
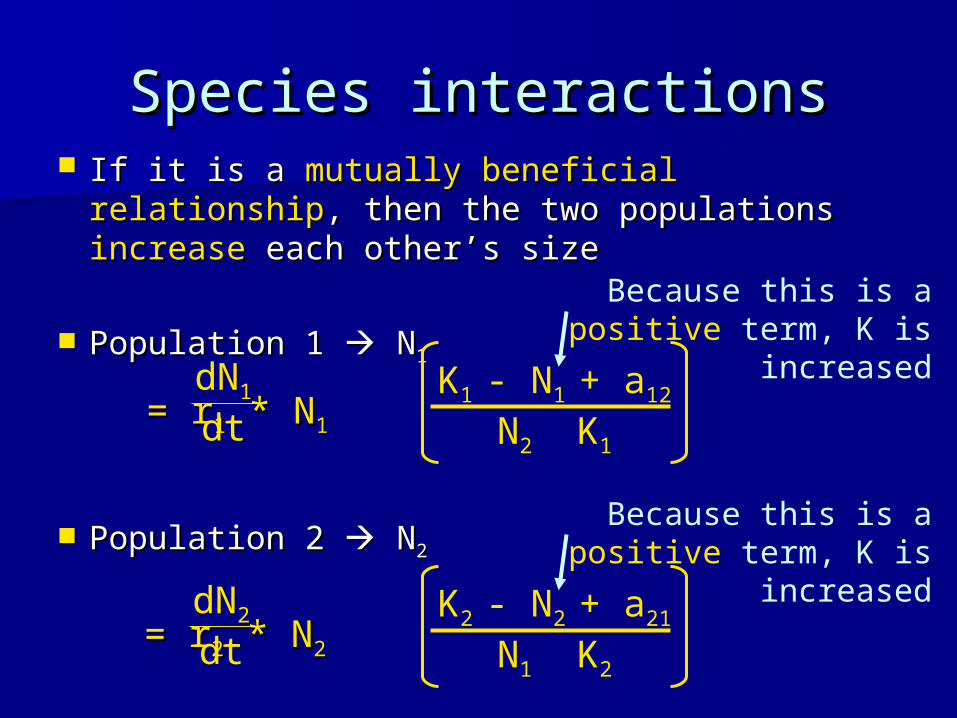
Species interactionsSpecies interactions If it is a If it is a mutually beneficial relationshipmutually beneficial relationship, then , then
the two populations the two populations increaseincrease each other’s size each other’s size
Population 1 Population 1 N N11
Population 2 Population 2 N N22
= r= r11 * N * N11 dN
1 dt
K1 - N1 + a12 N2 K1
= r= r22 * N * N22 dN
2 dt
K2 - N2 + a21 N1 K2
Because this is a positive term, K is increased
Because this is a positive term, K is increased
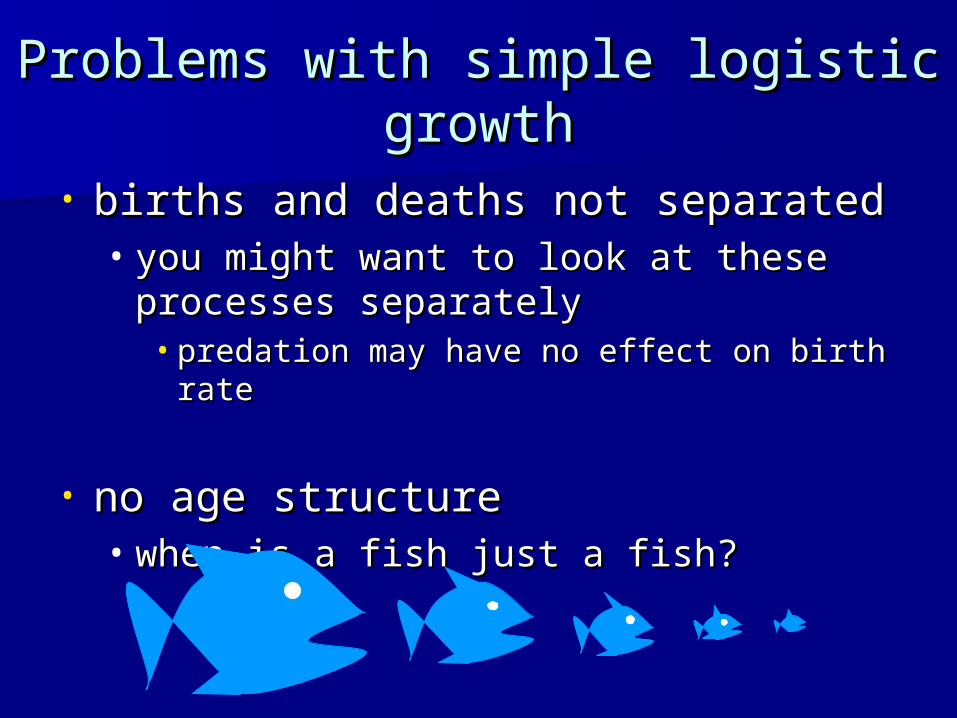
Problems with simple logistic Problems with simple logistic growthgrowth
• births and deaths not separatedbirths and deaths not separated• you might want to look at these you might want to look at these
processes separatelyprocesses separately• predation may have no effect on birth ratepredation may have no effect on birth rate
• no age structureno age structure• when is a fish just a fish?when is a fish just a fish?
AnnouncementsAnnouncements
• Check your syllabus with the one Check your syllabus with the one online to make sure it is the right online to make sure it is the right one! one!
• Bring your calculator to sectionBring your calculator to section
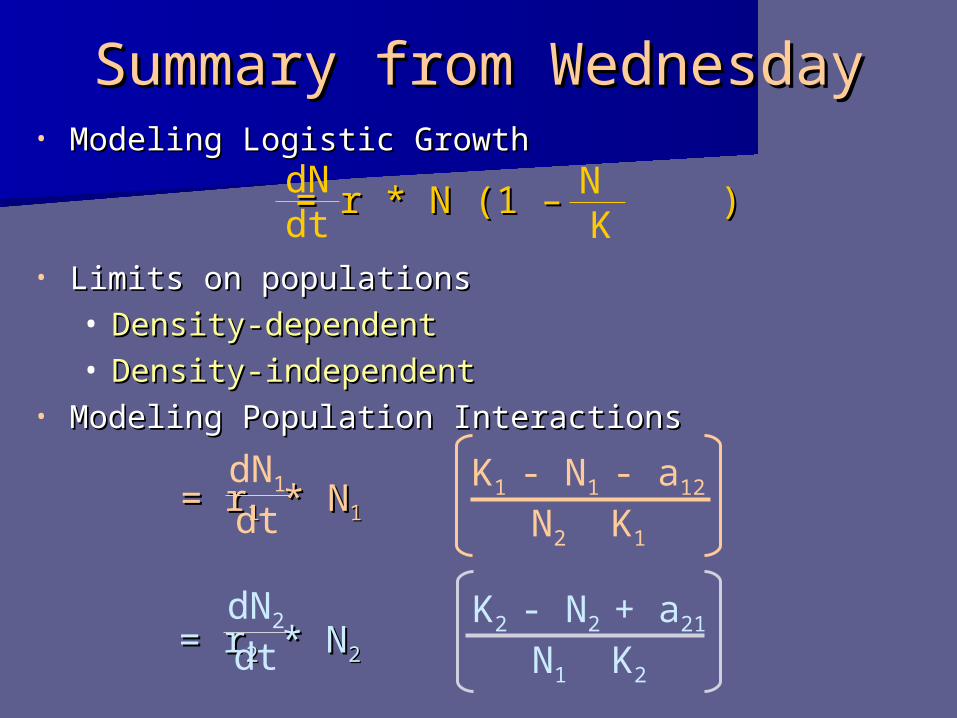
Summary from WednesdaySummary from Wednesday• Modeling Logistic GrowthModeling Logistic Growth
• Limits on populationsLimits on populations• Density-dependentDensity-dependent• Density-independentDensity-independent
• Modeling Population InteractionsModeling Population Interactions
= r * N (1 – )= r * N (1 – )N K
dN dt
= r= r22 * N * N22 dN
2 dt
K2 - N2 + a21 N1 K2
= r= r11 * N * N11 dN
1 dt
K1 - N1 - a12 N2 K1
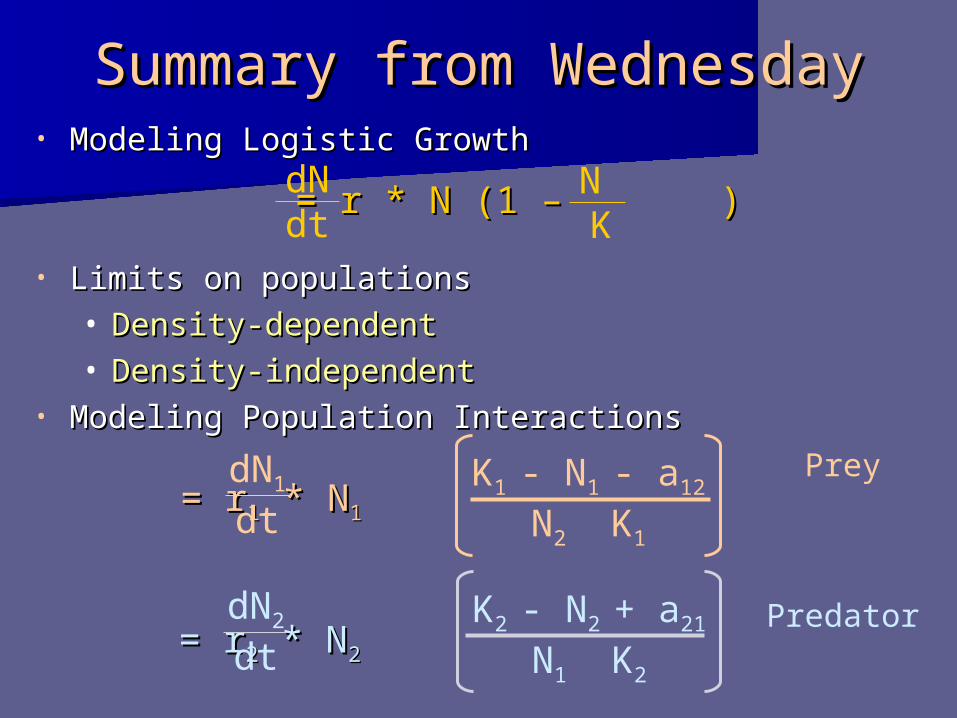
Prey
Predator
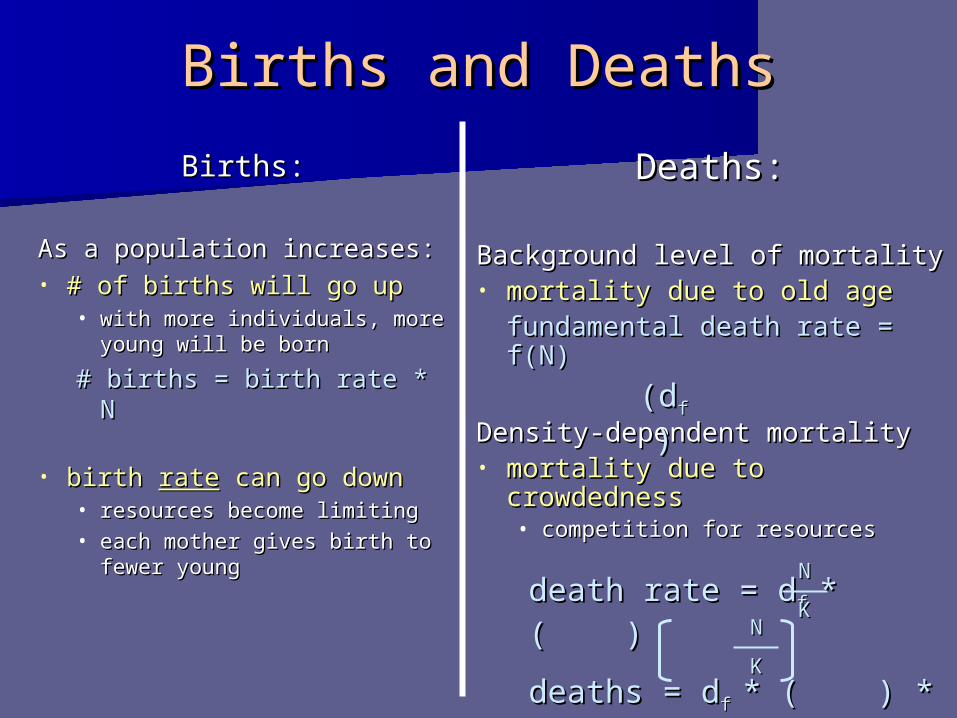
Births and DeathsBirths and Deaths
Deaths:Deaths:
Background level of mortality Background level of mortality • mortality due to old agemortality due to old age
fundamental death rate = fundamental death rate = f(N)f(N)
Density-dependent mortalityDensity-dependent mortality• mortality due to mortality due to
crowdednesscrowdedness• competition for resourcescompetition for resources
Births:Births:
As a population increases:As a population increases:• # of births will go up# of births will go up
• with more individuals, more with more individuals, more young will be born young will be born
# births = birth rate * N# births = birth rate * N
• birth birth raterate can go down can go down• resources become limitingresources become limiting• each mother gives birth to each mother gives birth to
fewer youngfewer young death rate = ddeath rate = df f * ( )* ( )
deaths = ddeaths = df f * ( ) * N* ( ) * N
NN
KKNN
KK
(d(dff))
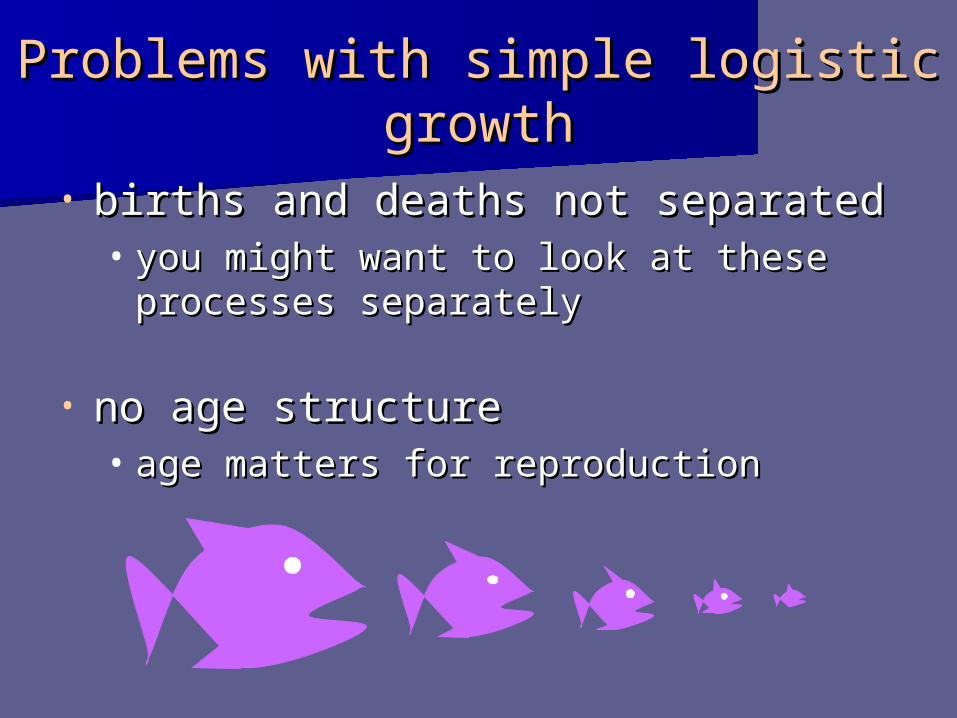
Problems with simple logistic Problems with simple logistic growthgrowth
• births and deaths not separatedbirths and deaths not separated• you might want to look at these you might want to look at these
processes separatelyprocesses separately
• no age structureno age structure• age matters for reproductionage matters for reproduction
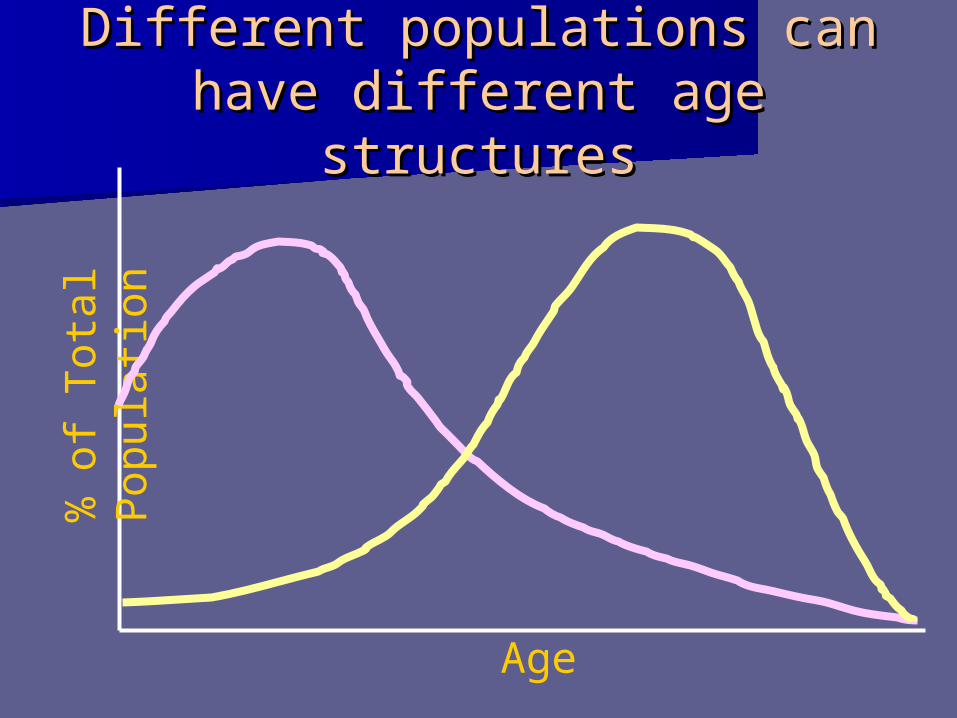
Different populations can have Different populations can have different age structuresdifferent age structures
Age
% o
f Tota
l Popula
tion
Age
% o
f Tota
l Popula
tion
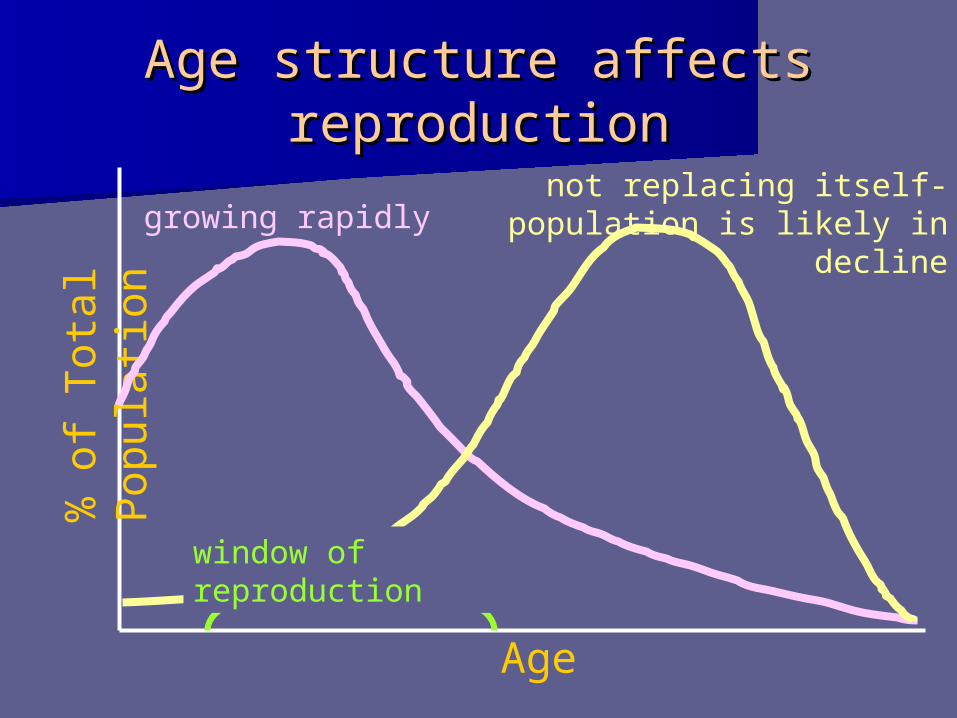
growing rapidlynot replacing itself-
population is likely in decline
window of reproduction
Age structure affects Age structure affects reproductionreproduction
The Tools of Population The Tools of Population EcologyEcology
• ModelingModeling• Creation of Life TablesCreation of Life Tables
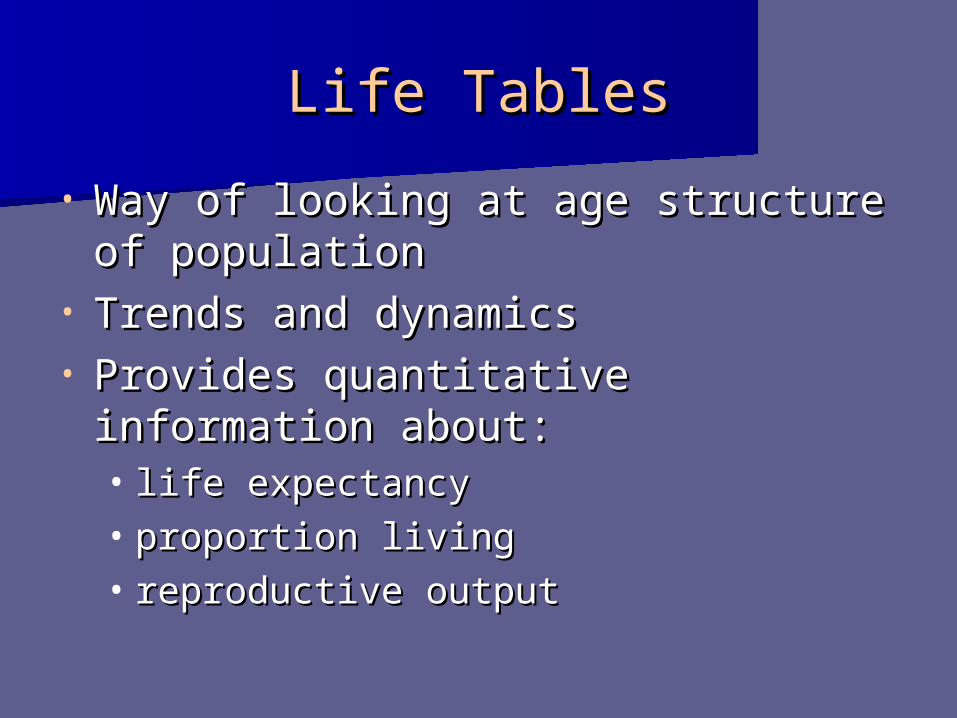
Life TablesLife Tables
• Way of looking at age structure of Way of looking at age structure of populationpopulation
• Trends and dynamicsTrends and dynamics• Provides quantitative information Provides quantitative information
about:about:• life expectancylife expectancy• proportion livingproportion living• reproductive outputreproductive output
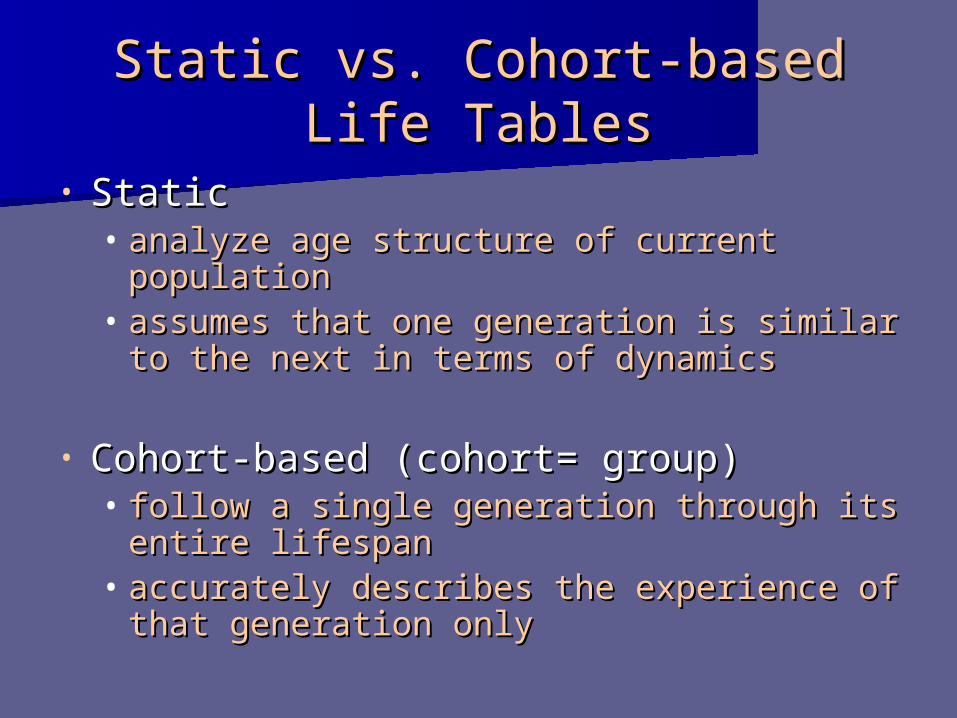
Static vs. Cohort-based Life Static vs. Cohort-based Life TablesTables
• StaticStatic• analyze age structure of current analyze age structure of current
populationpopulation• assumes that one generation is similar assumes that one generation is similar
to the next in terms of dynamicsto the next in terms of dynamics
• Cohort-based (cohort= group)Cohort-based (cohort= group)• follow a single generation through its follow a single generation through its
entire lifespanentire lifespan• accurately describes the experience of accurately describes the experience of
that generation onlythat generation only
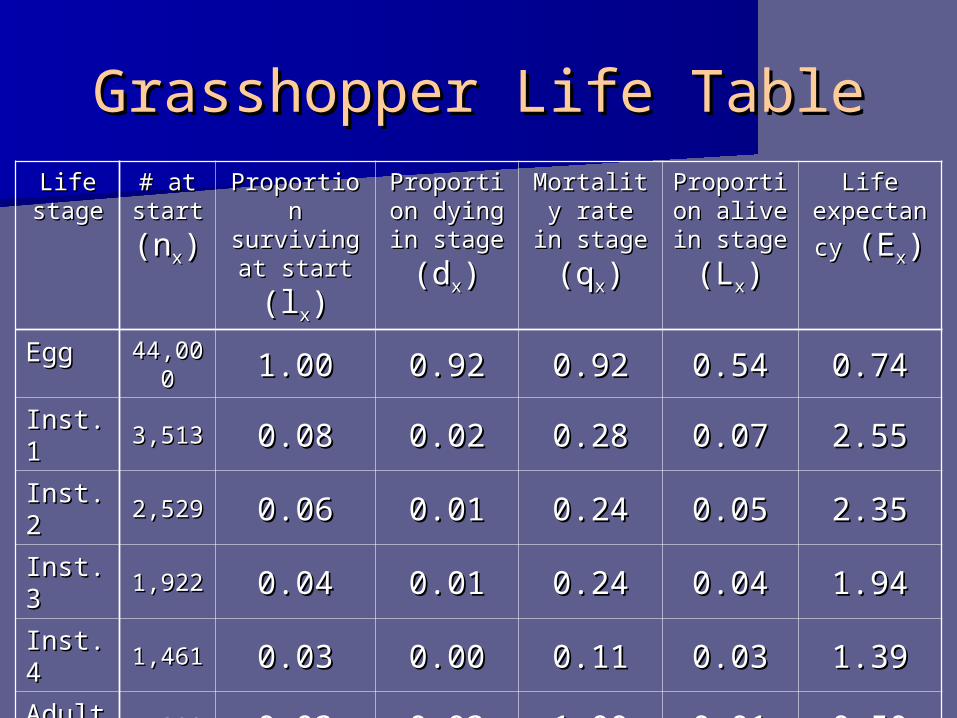
Grasshopper Life TableGrasshopper Life TableLife Life
stagestage# at # at start start
(n(nxx))
Proportion Proportion surviving surviving
at start at start (l(lxx))
Proportion Proportion dying in dying in stage stage
(d(dxx))
Mortality Mortality rate in rate in stage stage
(q(qxx))
ProportioProportion alive in n alive in
stage stage
(L(Lxx))
Life Life expectancexpectanc
y y (E(Exx))
EggEgg 44,0044,0000 1.001.00 0.920.92 0.920.92 0.540.54 0.740.74
Inst. 1Inst. 1 3,5133,513 0.080.08 0.020.02 0.280.28 0.070.07 2.552.55
Inst. 2Inst. 2 2,5292,529 0.060.06 0.010.01 0.240.24 0.050.05 2.352.35
Inst. 3Inst. 3 1,9221,922 0.040.04 0.010.01 0.240.24 0.040.04 1.941.94
Inst. 4Inst. 4 1,4611,461 0.030.03 0.000.00 0.110.11 0.030.03 1.391.39
AdultAdult 1,3001,300 0.030.03 0.030.03 1.001.00 0.010.01 0.500.50
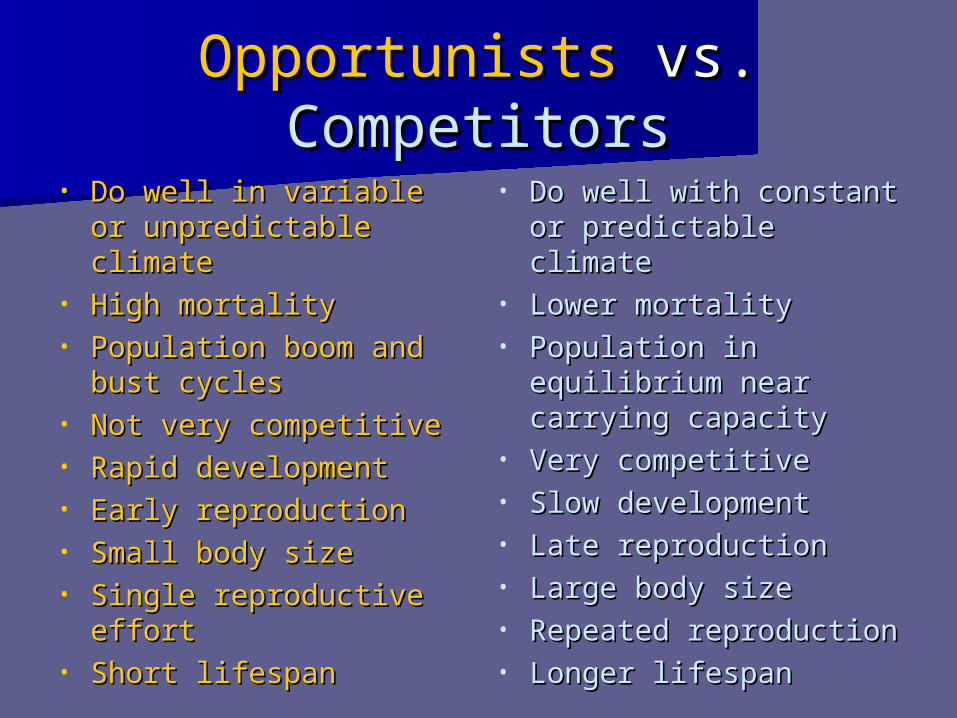
OpportunistsOpportunists vs.vs. CompetitorsCompetitors
• Do well in variable or Do well in variable or unpredictable climateunpredictable climate
• High mortalityHigh mortality• Population boom and Population boom and
bust cyclesbust cycles• Not very competitiveNot very competitive• Rapid developmentRapid development• Early reproductionEarly reproduction• Small body sizeSmall body size• Single reproductive Single reproductive
efforteffort• Short lifespanShort lifespan
• Do well with constant Do well with constant or predictable climateor predictable climate
• Lower mortalityLower mortality• Population in Population in
equilibrium near equilibrium near carrying capacitycarrying capacity
• Very competitiveVery competitive• Slow developmentSlow development• Late reproductionLate reproduction• Large body sizeLarge body size• Repeated reproductionRepeated reproduction• Longer lifespanLonger lifespan
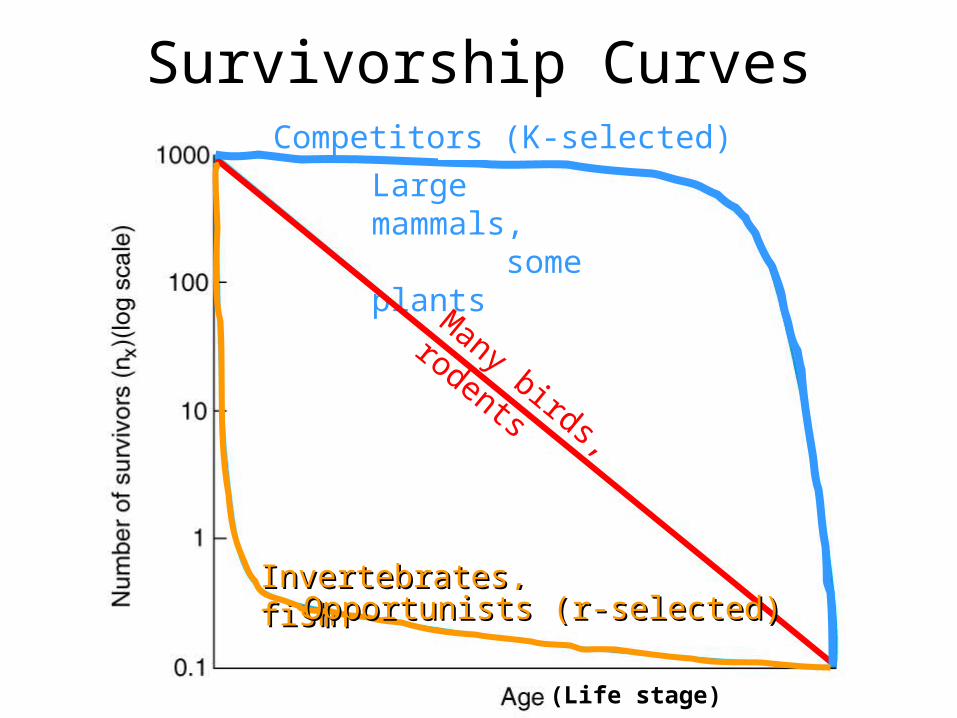
Survivorship Curves
Large mammals, some plants
Invertebrates, fishInvertebrates, fishOpportunists (r-selected)Opportunists (r-selected)
Competitors (K-selected)
Many birds,
rodents
(Life stage)
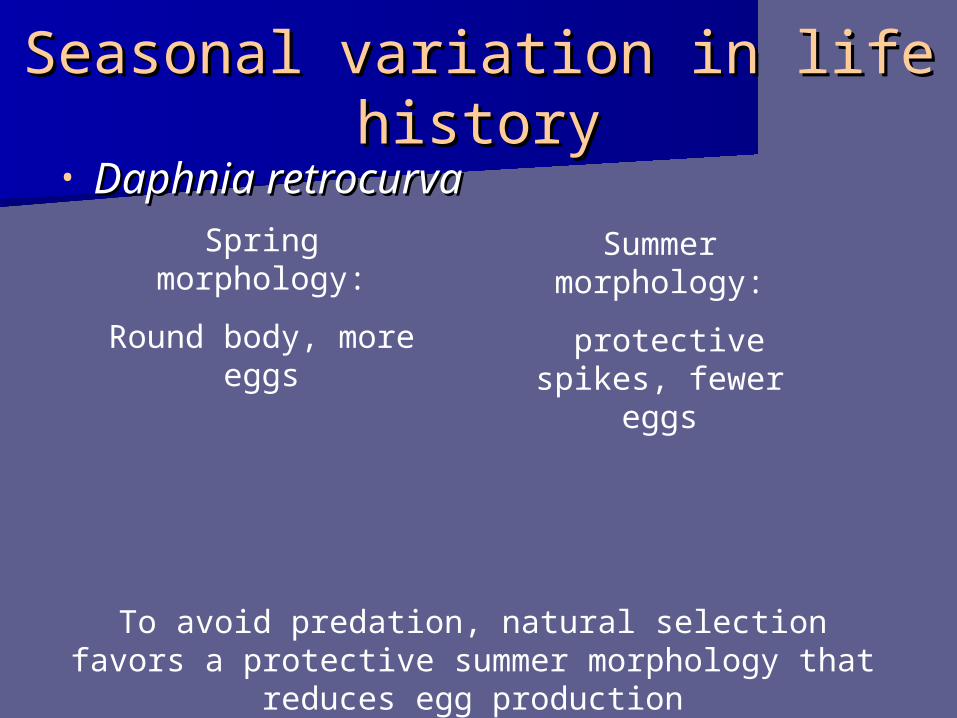
• Daphnia retrocurvaDaphnia retrocurva
Seasonal variation in life Seasonal variation in life historyhistory
Spring morphology:
Round body, more eggs
Summer morphology:
protective spikes, fewer eggs
To avoid predation, natural selection favors a protective summer morphology that reduces egg
production
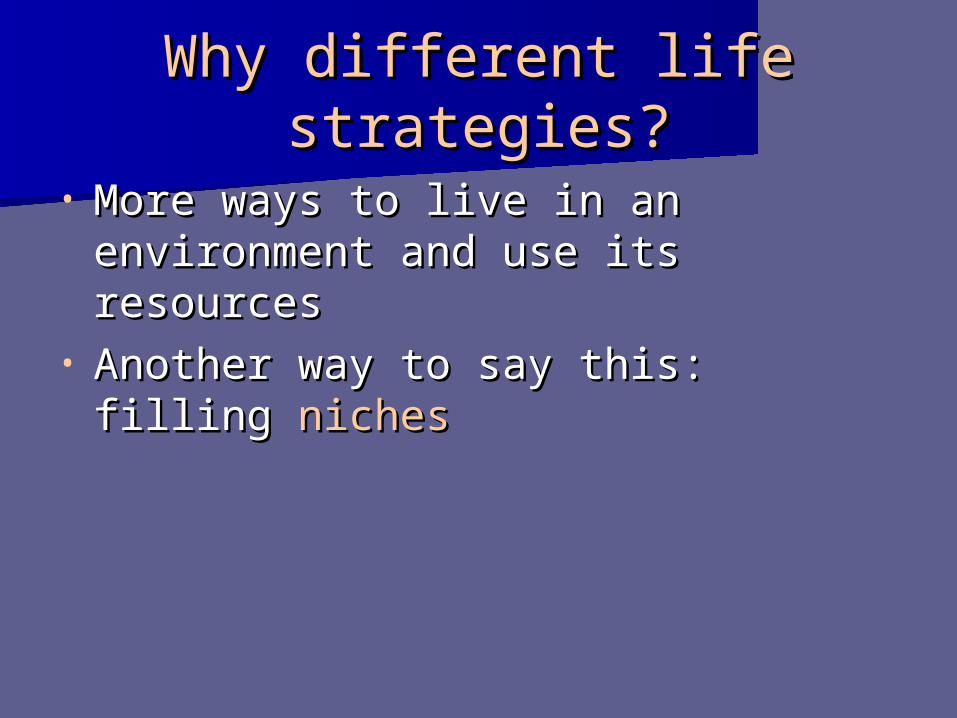
Why different life Why different life strategies?strategies?
• More ways to live in an environment More ways to live in an environment and use its resourcesand use its resources
• Another way to say this: filling Another way to say this: filling nichesniches
What is a What is a nicheniche??
• A A nicheniche is the total of all biotic and is the total of all biotic and abiotic factors that determine how an abiotic factors that determine how an organism fits into its environment.organism fits into its environment.
• Where and how does an organism Where and how does an organism live and function?live and function?• habitathabitat• role in communityrole in community