Embed Size (px)
Citation preview
1
Announcements
• Will return Temp labs when they are all done.• 9-noon March 6, 2015
field trip to NIST for pressure laboratory World’s best manometer.
• Friday we will do the RH lab. Think about how to calibrate the Davis RH probe; the Vaisala T & RH probes are on the Cessna for now.
• You should be working or the precip lab – esp the part with variability with height and distance.

2
AOSC 634Air Sampling and Analysis
Lecture 4Measurement Theory
Dynamic Performance of Sensor Systems Response of a first order instrument to
Sinusoidal inputSee Brock et al. Chapter 2.
Copyright Brock et al. 1984; Dickerson 2015
3
Goal
Geophysical fluid phenomena often occur in waves. • Weather depends on the flux of heat, momentum, and
moisture from or into the surface.• The soil flux of trace gases such as CO2, CH4, NO, N2O, is critical
to understanding air quality and climate.• What is required to measure those fluxes?

4
Objective
We need to analyze geophysical wave processes. In a useful instrument, the steady state response to sinusoidal input should be predictable. The amplitude will be diminished and the phase shifted, but we want all spectral components to have the same relative amp. and phase angle as the input. We are looking for:• A flat amplitude response (independent of frequency).• A linear phase response (change in phase proportional to
input freq. and lag independent of frequency).• A Fourier transform of the output should return the input freq
distribution.

5
Dynamic ResponseSensor output in response to changing input.

6
Dynamic Response

7
Response to input with wI ≈ wb
Phase shift
Nor
mal
ized
inpu
t and
out
put

8
Dynamic ResponseAfter a few time constants, the transient part goes to zero and the response is characterized by:
Output angular frequency A(a)Phase shift f(a) in radians.
• When the response (output) angular freq >> input ang freq the amplitude is nearly the same and there is no discernable phase lag.
• When the response (output) angular freq << input ang freq the amplitude is zero.
• When wb = wI then ( ) = 1/√2A a• Output lags input by 0 to p/2 radians, and this
increases with increasing a.• When a = 1 (or wb = wI) then = /4.f p

9
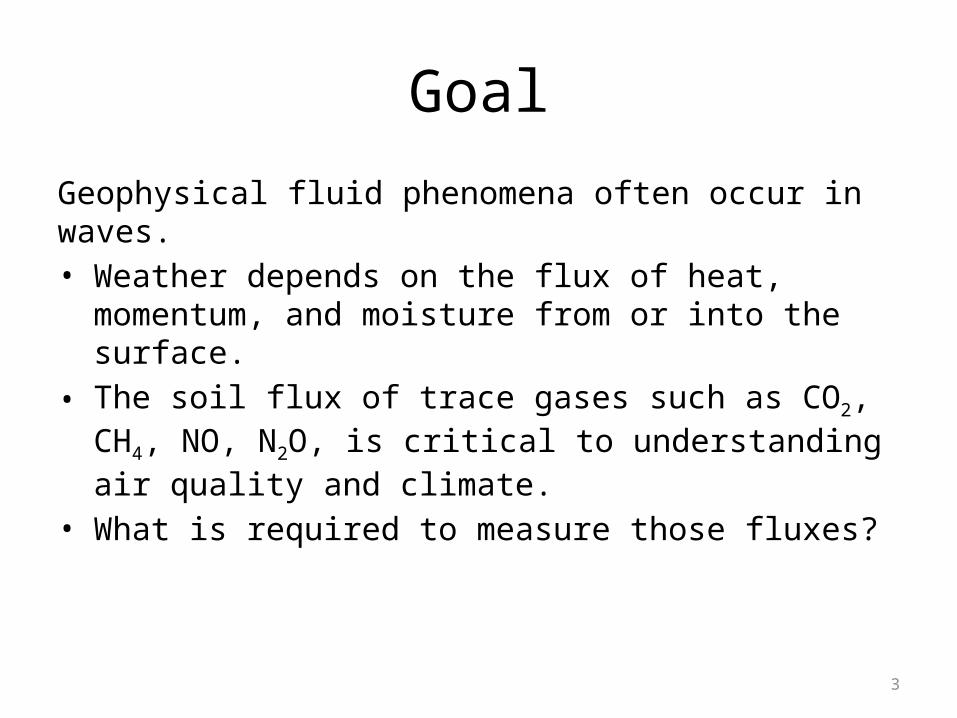
Dynamic ResponseWhen a = 1 (or wb = wI) then = /4.f pRemember the argument of a trig fnx is always in degrees or radians.And that power is proportional to amplitude squared. Therefore the output power is ½ input power when a = 1.The next diagrams show that the output amplitude is always less than the input amplitude.
10
a = ratio input/output freq = wI/wb)
A(a
) = O
utpu
t Am
plitu
de (n
orm
alize
d)

11
Phas
e la
g (r
adia
n)
a = wI/wb)

12
Applications
• Anderson et al. CH4 flux from melting Arctic Tundra. http://www.arp.harvard.edu/publication/
• NO and N2O emissions form fertilized corn fields.

13
Real world exampleCiverolo et al., 1999.
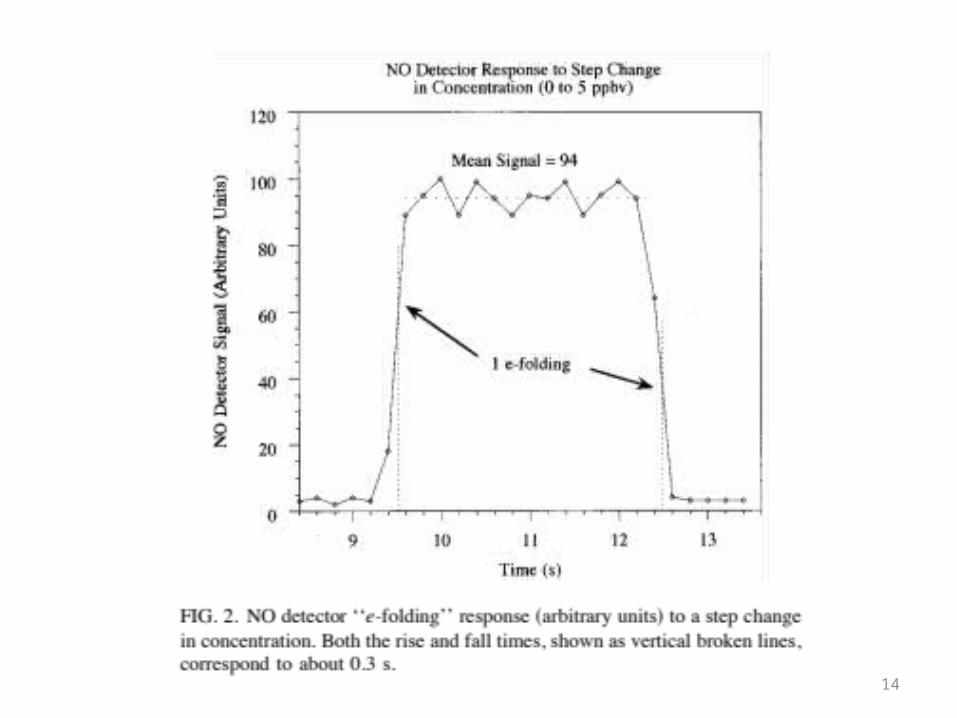
14

15

16

17
18
Summary• Because all real measurement systems have a finite response time,
response to sinusoidal input will be, at best, sinusoidal output with reduced amplitude and a phase shift.
• If the input frequency in the same as the response freq of the system
the amplitude will be reduced to 1/√2 (~70%) of the input.
• The phase shift will be in the desirable range only for input frequencies of a few times the instrument response freq.
• For input frequencies > about 10 times the response frequency the output will be barely discernable as a sine wave. Peak power in vertical flux of water, momentum, heat, CO2, O3 etc. is about 5Hz. Good instruments can measure these fluxes!