Embed Size (px)
Citation preview
MAKE SMILEYO
UAnnual Report2016
For
per
sona
l use
onl
y
| PACIFIC SMILES GROUP
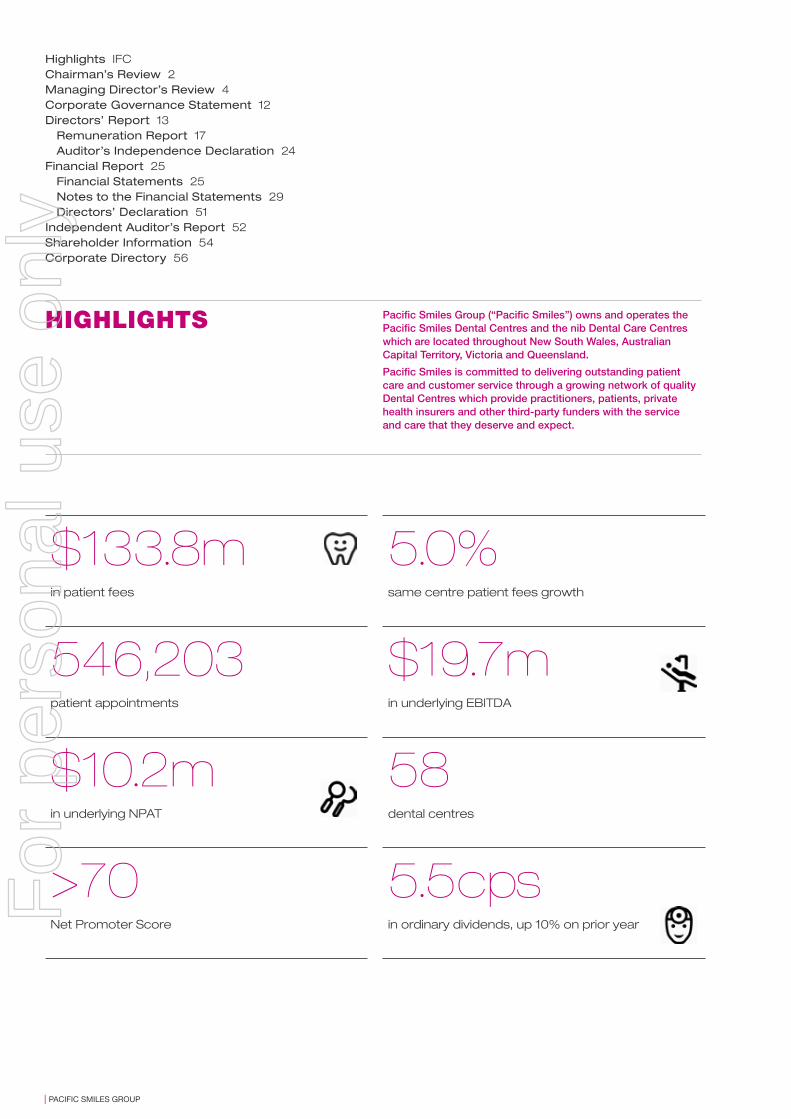
$133·8min patient fees
5·0%same centre patient fees growth
546,203patient appointments
$19·7min underlying EBITDA
$10·2min underlying NPAT
58dental centres
>70Net Promoter Score
5·5cpsin ordinary dividends, up 10% on prior year
Highlights IFC Chairman’s Review 2 Managing Director’s Review 4 Corporate Governance Statement 12 Directors’ Report 13
Remuneration Report 17 Auditor’s Independence Declaration 24
Financial Report 25Financial Statements 25Notes to the Financial Statements 29 Directors’ Declaration 51
Independent Auditor’s Report 52 Shareholder Information 54Corporate Directory 56
Pacific Smiles Group (“Pacific Smiles”) owns and operates the Pacific Smiles Dental Centres and the nib Dental Care Centres which are located throughout New South Wales, Australian Capital Territory, Victoria and Queensland.
Pacific Smiles is committed to delivering outstanding patient care and customer service through a growing network of quality Dental Centres which provide practitioners, patients, private health insurers and other third-party funders with the service and care that they deserve and expect.
HIGHLIGHTS
MAKE SMILEF
or p
erso
nal u
se o
nly

MAKE SMILEYO
U
ANNUAL REPORT 2016 | 1
For
per
sona
l use
onl
y
CHAIRMAN’SREVIEW
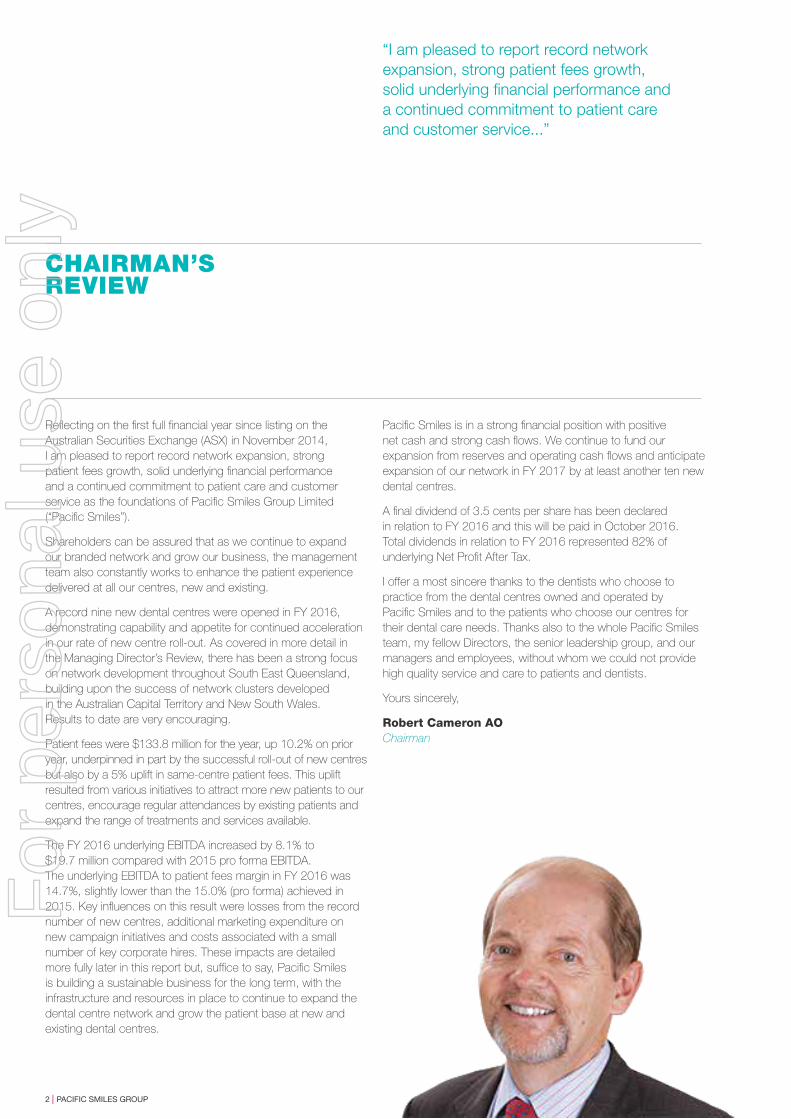
Reflecting on the first full financial year since listing on the Australian Securities Exchange (ASX) in November 2014, I am pleased to report record network expansion, strong patient fees growth, solid underlying financial performance and a continued commitment to patient care and customer service as the foundations of Pacific Smiles Group Limited (“Pacific Smiles”).
Shareholders can be assured that as we continue to expand our branded network and grow our business, the management team also constantly works to enhance the patient experience delivered at all our centres, new and existing.
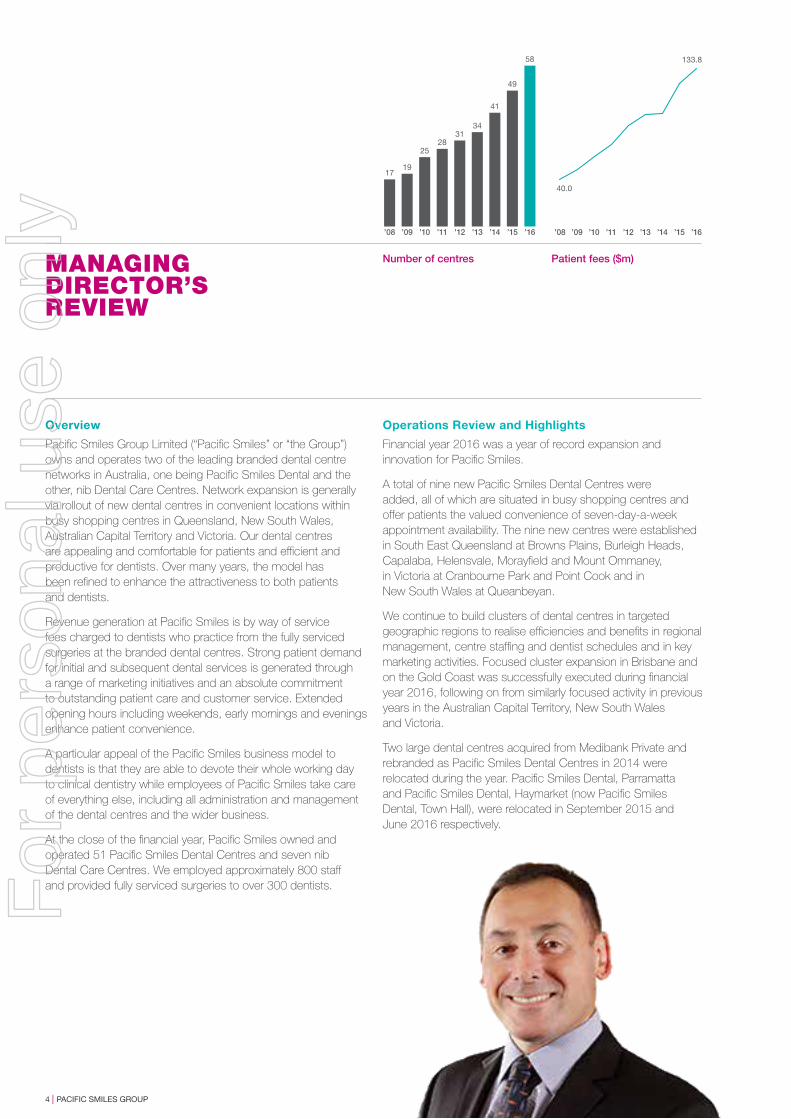
A record nine new dental centres were opened in FY 2016, demonstrating capability and appetite for continued acceleration in our rate of new centre roll-out. As covered in more detail in the Managing Director’s Review, there has been a strong focus on network development throughout South East Queensland, building upon the success of network clusters developed in the Australian Capital Territory and New South Wales. Results to date are very encouraging.
Patient fees were $133.8 million for the year, up 10.2% on prior year, underpinned in part by the successful roll-out of new centres but also by a 5% uplift in same-centre patient fees. This uplift resulted from various initiatives to attract more new patients to our centres, encourage regular attendances by existing patients and expand the range of treatments and services available.
The FY 2016 underlying EBITDA increased by 8.1% to $19.7 million compared with 2015 pro forma EBITDA. The underlying EBITDA to patient fees margin in FY 2016 was 14.7%, slightly lower than the 15.0% (pro forma) achieved in 2015. Key influences on this result were losses from the record number of new centres, additional marketing expenditure on new campaign initiatives and costs associated with a small number of key corporate hires. These impacts are detailed more fully later in this report but, suffice to say, Pacific Smiles is building a sustainable business for the long term, with the infrastructure and resources in place to continue to expand the dental centre network and grow the patient base at new and existing dental centres.
Pacific Smiles is in a strong financial position with positive net cash and strong cash flows. We continue to fund our expansion from reserves and operating cash flows and anticipate expansion of our network in FY 2017 by at least another ten new dental centres.
A final dividend of 3.5 cents per share has been declared in relation to FY 2016 and this will be paid in October 2016. Total dividends in relation to FY 2016 represented 82% of underlying Net Profit After Tax.
I offer a most sincere thanks to the dentists who choose to practice from the dental centres owned and operated by Pacific Smiles and to the patients who choose our centres for their dental care needs. Thanks also to the whole Pacific Smiles team, my fellow Directors, the senior leadership group, and our managers and employees, without whom we could not provide high quality service and care to patients and dentists.
Yours sincerely,
Robert Cameron AO Chairman
“I am pleased to report record network expansion, strong patient fees growth, solid underlying financial performance and a continued commitment to patient care and customer service...”
MAKE SMILE
2 | PACIFIC SMILES GROUP
For
per
sona
l use
onl
y

ANNUAL REPORT 2016 | 3
MAKE SMILEYO
U
ANNUAL REPORT 2016 | 3
For
per
sona
l use
onl
y
MANAGING DIRECTOR’S REVIEW
Overview
Pacific Smiles Group Limited (“Pacific Smiles” or “the Group”) owns and operates two of the leading branded dental centre networks in Australia, one being Pacific Smiles Dental and the other, nib Dental Care Centres. Network expansion is generally via rollout of new dental centres in convenient locations within busy shopping centres in Queensland, New South Wales, Australian Capital Territory and Victoria. Our dental centres are appealing and comfortable for patients and efficient and productive for dentists. Over many years, the model has been refined to enhance the attractiveness to both patients and dentists.
Revenue generation at Pacific Smiles is by way of service fees charged to dentists who practice from the fully serviced surgeries at the branded dental centres. Strong patient demand for initial and subsequent dental services is generated through a range of marketing initiatives and an absolute commitment to outstanding patient care and customer service. Extended opening hours including weekends, early mornings and evenings enhance patient convenience.
A particular appeal of the Pacific Smiles business model to dentists is that they are able to devote their whole working day to clinical dentistry while employees of Pacific Smiles take care of everything else, including all administration and management of the dental centres and the wider business.
At the close of the financial year, Pacific Smiles owned and operated 51 Pacific Smiles Dental Centres and seven nib Dental Care Centres. We employed approximately 800 staff and provided fully serviced surgeries to over 300 dentists.
Operations Review and Highlights
Financial year 2016 was a year of record expansion and innovation for Pacific Smiles.
A total of nine new Pacific Smiles Dental Centres were added, all of which are situated in busy shopping centres and offer patients the valued convenience of seven-day-a-week appointment availability. The nine new centres were established in South East Queensland at Browns Plains, Burleigh Heads, Capalaba, Helensvale, Morayfield and Mount Ommaney, in Victoria at Cranbourne Park and Point Cook and in New South Wales at Queanbeyan.
We continue to build clusters of dental centres in targeted geographic regions to realise efficiencies and benefits in regional management, centre staffing and dentist schedules and in key marketing activities. Focused cluster expansion in Brisbane and on the Gold Coast was successfully executed during financial year 2016, following on from similarly focused activity in previous years in the Australian Capital Territory, New South Wales and Victoria.
Two large dental centres acquired from Medibank Private and rebranded as Pacific Smiles Dental Centres in 2014 were relocated during the year. Pacific Smiles Dental, Parramatta and Pacific Smiles Dental, Haymarket (now Pacific Smiles Dental, Town Hall), were relocated in September 2015 and June 2016 respectively.
Number of centres Patient fees ($m)
MAKE SMILE
’16’15’14’13’12’11’10’09’08
1719
2528
3134
41
49
58
0
20
40
60
80
100
120
140
160
’16’15’14’13’12’11’10’09’08
133.8
40.0
4 | PACIFIC SMILES GROUP
For
per
sona
l use
onl
y
MAKE SMILEYO
U
ANNUAL REPORT 2016 | 5
For
per
sona
l use
onl
y
The relocations were important in the ongoing program of performance improvement of these centres, a multi-year undertaking that commenced in June 2014. While these two centres have not performed to expectations, the wider benefit of the acquisition arrangements, being the exclusive provision of no-gap check-up services to eligible ahm members across the whole Pacific Smiles Dental network, has helped to underpin patient volume growth.
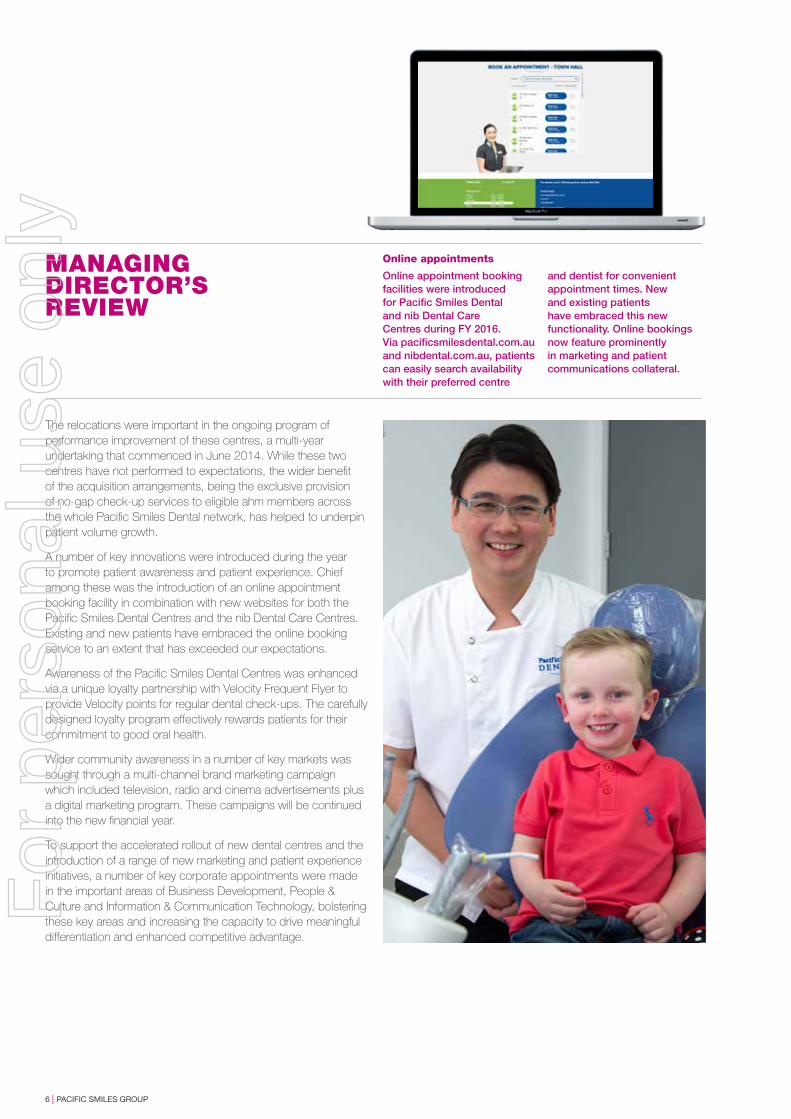
A number of key innovations were introduced during the year to promote patient awareness and patient experience. Chief among these was the introduction of an online appointment booking facility in combination with new websites for both the Pacific Smiles Dental Centres and the nib Dental Care Centres. Existing and new patients have embraced the online booking service to an extent that has exceeded our expectations.
Awareness of the Pacific Smiles Dental Centres was enhanced via a unique loyalty partnership with Velocity Frequent Flyer to provide Velocity points for regular dental check-ups. The carefully designed loyalty program effectively rewards patients for their commitment to good oral health.
Wider community awareness in a number of key markets was sought through a multi-channel brand marketing campaign which included television, radio and cinema advertisements plus a digital marketing program. These campaigns will be continued into the new financial year.
To support the accelerated rollout of new dental centres and the introduction of a range of new marketing and patient experience initiatives, a number of key corporate appointments were made in the important areas of Business Development, People & Culture and Information & Communication Technology, bolstering these key areas and increasing the capacity to drive meaningful differentiation and enhanced competitive advantage.
MANAGING DIRECTOR’S REVIEW
Online appointments
Online appointment booking facilities were introduced for Pacific Smiles Dental and nib Dental Care Centres during FY 2016. Via pacificsmilesdental.com.au and nibdental.com.au, patients can easily search availability with their preferred centre
and dentist for convenient appointment times. New and existing patients have embraced this new functionality. Online bookings now feature prominently in marketing and patient communications collateral.
6 | PACIFIC SMILES GROUP
For
per
sona
l use
onl
y
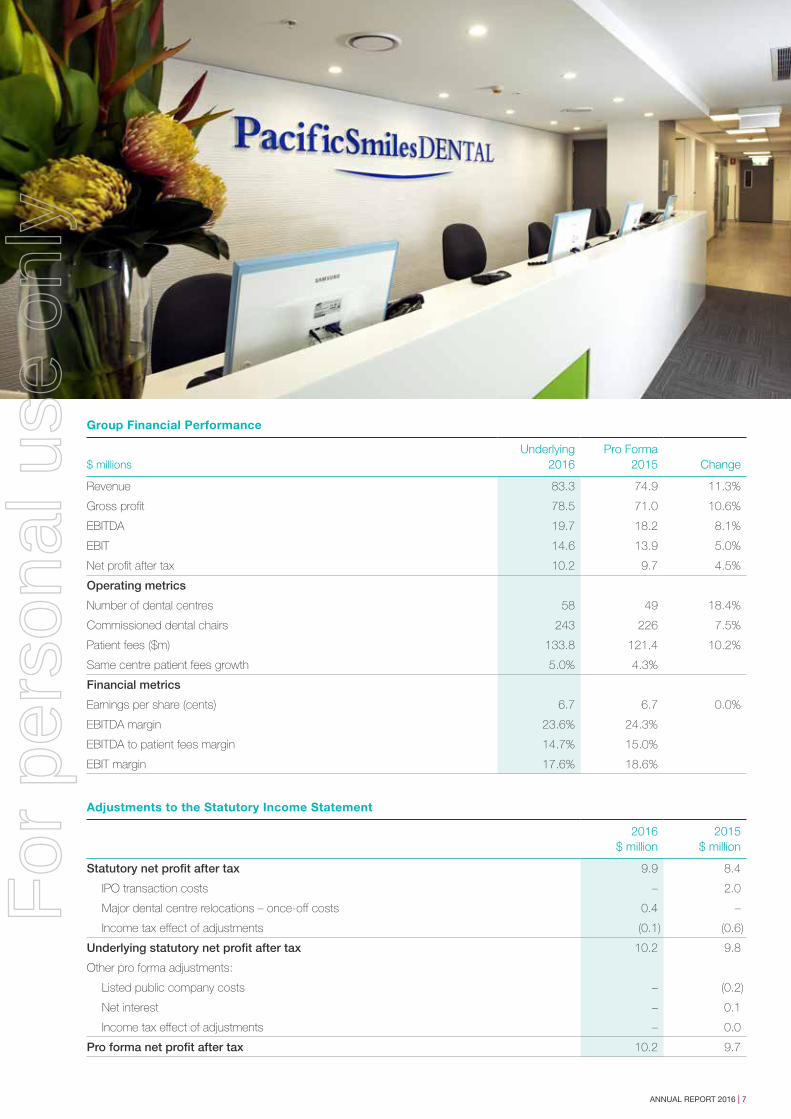
Group Financial Performance
$ millionsUnderlying
2016Pro Forma
2015 Change
Revenue 83.3 74.9 11.3%
Gross profit 78.5 71.0 10.6%
EBITDA 19.7 18.2 8.1%
EBIT 14.6 13.9 5.0%
Net profit after tax 10.2 9.7 4.5%
Operating metrics
Number of dental centres 58 49 18.4%
Commissioned dental chairs 243 226 7.5%
Patient fees ($m) 133.8 121.4 10.2%
Same centre patient fees growth 5.0% 4.3%
Financial metrics
Earnings per share (cents) 6.7 6.7 0.0%
EBITDA margin 23.6% 24.3%
EBITDA to patient fees margin 14.7% 15.0%
EBIT margin 17.6% 18.6%
Adjustments to the Statutory Income Statement
2016$ million
2015$ million
Statutory net profit after tax 9.9 8.4
IPO transaction costs – 2.0
Major dental centre relocations – once-off costs 0.4 –
Income tax effect of adjustments (0.1) (0.6)
Underlying statutory net profit after tax 10.2 9.8
Other pro forma adjustments:
Listed public company costs – (0.2)
Net interest – 0.1
Income tax effect of adjustments – 0.0
Pro forma net profit after tax 10.2 9.7
ANNUAL REPORT 2016 | 7
For
per
sona
l use
onl
y
Statutory Results
The Group achieved statutory Net Profit After Tax of $9.9 million, up by 18.5% from $8.4 million in 2015.
During 2016, the statutory results were impacted by significant once-off costs associated with two major Dental Centre relocations. The 2015 statutory results were impacted by the $1.4 million after-tax effect of once-off transaction costs associated with the IPO. Further, the 2015 results included the additional costs to conduct the business as an ASX-listed company from 21 November 2014 onwards. The previous table sets out these adjustments between statutory, underlying and pro forma net profit in 2016 and 2015. These significant events and changes during each reporting period make comparisons to the previous year more difficult. Therefore, further discussion of the results in this Managing Director’s Review focuses on the underlying and pro forma results for 2016 and the comparative period.
Underlying and Pro Forma Results
Underlying EBITDA increased by 8.1% to $19.7 million compared with 2015 pro forma EBITDA. Underlying Net Profit After Tax of $10.2 million was 4.5% higher than the previous year.
Group revenue was $83.3 million, up by 11.3% over the previous financial year. This revenue consists mainly of the service fees charged to the dentists who practice from our dental centres, and is calculated with reference to the patient fees they generate.
Patient fees generated by dentists at the Group’s dental centres were $133.8 million, up 10.2% over the previous year. This increase in patient fees comprised same centre growth of 5.0%, plus a full year effect from new centres opened in 2015 and part-year impact of new centre openings in 2016, although several of those opened late in the financial year.
Pacific Smiles remains committed to building a platform for long term sustainable growth, which is expected to support improving profit margins over time. The Group’s underlying EBITDA to patient fees margin in 2016 of 14.7% was slightly lower than the 15.0% (pro forma) achieved in 2015. Very strong growth
in revenues and profitability was recorded in the majority of the Group’s dental centres. Offsetting the many outstanding dental centre performances, the key drivers of the lower margin included:
– Start up losses from new centres – Pacific Smiles’ dental centres are typically not profitable in the first year of operation. Pacific Smiles accelerated the rate at which it opens new dental centres from 2015, opening eight new centres in FY 2015 and a further nine new centres in FY 2016. Centres opened in 2015 showed improved trading results in the second half of FY 2016, and the 2016 new openings have performed above expectations. However, this higher concentration of new centres has been dilutive to Group profitability in the short term.
– Marketing expenses – Expenditure on marketing increased by $0.5 million compared with the previous year, partly reflecting the increased number of new centre launch and support marketing activities, as well as innovative new marketing initiatives such as the Velocity Frequent Flyer arrangements and a multi-channel brand campaign. Each of these new initiatives involved some costs in production and launch which are expected to benefit future periods.
– Corporate resources – Several key senior appointments were made to lead Group functions including Business Development, People & Culture and Information & Communication Technology, deepening the Group’s management expertise in these areas which are critical to the growth plans.
Financial Position
Pacific Smiles ended the financial year in a strong financial position, with a net cash balance of $6.0 million.
The cash reserves established by the Group’s IPO in FY 2015, combined with healthy operating cash flows, were applied to expand the dental centre network and in renewing and upgrading existing facilities, equipment and systems. Total capital expenditure was $14.2 million, which included $7.5 million for new dental centres and a total of $4.6 million to complete the new facilities for the two major dental centre relocations.
MANAGING DIRECTOR’S REVIEW
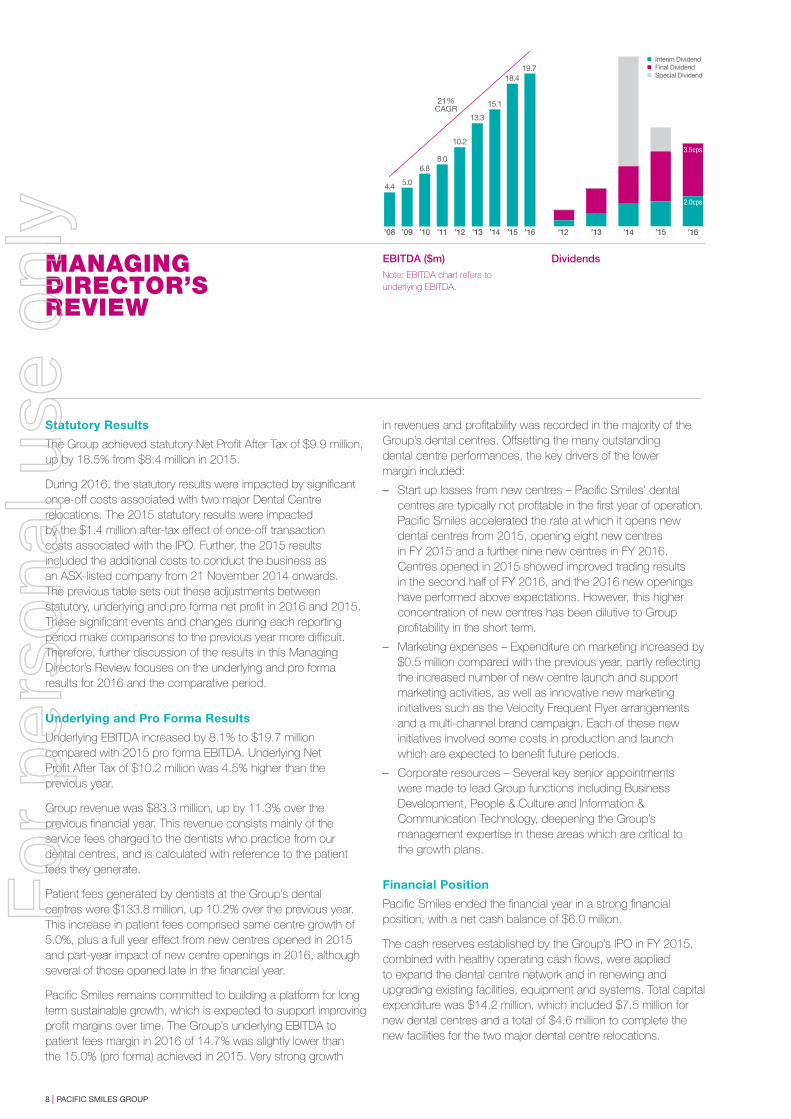
EBITDA ($m)
Note: EBITDA chart refers to underlying EBITDA.
Dividends
’16’15’14’13’12’11’10’09’08
4.4 5.0
6.88.0
10.2
13.3
15.1
18.419.7
21%CAGR
’16’15’14’13’12
Interim Dividend Final Dividend Special Dividend
3.5cps
2.0cps
8 | PACIFIC SMILES GROUP
For
per
sona
l use
onl
y
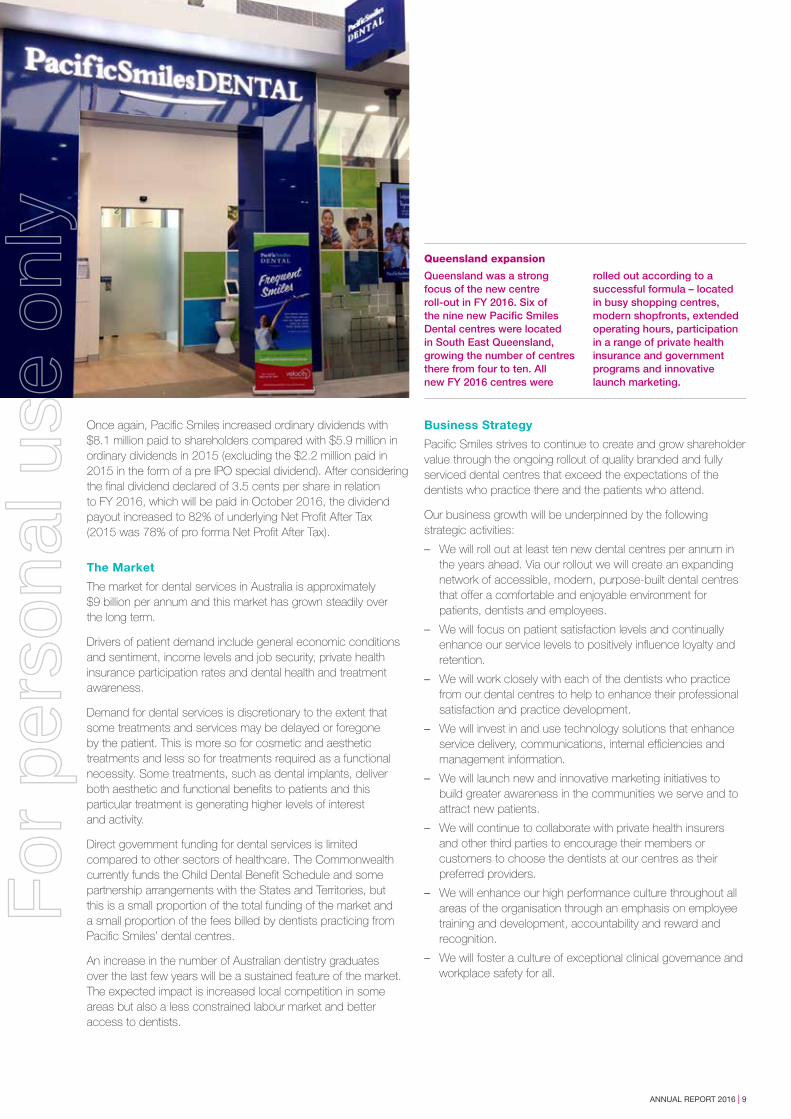
Queensland expansion
Queensland was a strong focus of the new centre roll-out in FY 2016. Six of the nine new Pacific Smiles Dental centres were located in South East Queensland, growing the number of centres there from four to ten. All new FY 2016 centres were
rolled out according to a successful formula – located in busy shopping centres, modern shopfronts, extended operating hours, participation in a range of private health insurance and government programs and innovative launch marketing.
Once again, Pacific Smiles increased ordinary dividends with $8.1 million paid to shareholders compared with $5.9 million in ordinary dividends in 2015 (excluding the $2.2 million paid in 2015 in the form of a pre IPO special dividend). After considering the final dividend declared of 3.5 cents per share in relation to FY 2016, which will be paid in October 2016, the dividend payout increased to 82% of underlying Net Profit After Tax (2015 was 78% of pro forma Net Profit After Tax).
The Market
The market for dental services in Australia is approximately $9 billion per annum and this market has grown steadily over the long term.
Drivers of patient demand include general economic conditions and sentiment, income levels and job security, private health insurance participation rates and dental health and treatment awareness.
Demand for dental services is discretionary to the extent that some treatments and services may be delayed or foregone by the patient. This is more so for cosmetic and aesthetic treatments and less so for treatments required as a functional necessity. Some treatments, such as dental implants, deliver both aesthetic and functional benefits to patients and this particular treatment is generating higher levels of interest and activity.
Direct government funding for dental services is limited compared to other sectors of healthcare. The Commonwealth currently funds the Child Dental Benefit Schedule and some partnership arrangements with the States and Territories, but this is a small proportion of the total funding of the market and a small proportion of the fees billed by dentists practicing from Pacific Smiles’ dental centres.
An increase in the number of Australian dentistry graduates over the last few years will be a sustained feature of the market. The expected impact is increased local competition in some areas but also a less constrained labour market and better access to dentists.
Business Strategy
Pacific Smiles strives to continue to create and grow shareholder value through the ongoing rollout of quality branded and fully serviced dental centres that exceed the expectations of the dentists who practice there and the patients who attend.
Our business growth will be underpinned by the following strategic activities:
– We will roll out at least ten new dental centres per annum in the years ahead. Via our rollout we will create an expanding network of accessible, modern, purpose-built dental centres that offer a comfortable and enjoyable environment for patients, dentists and employees.
– We will focus on patient satisfaction levels and continually enhance our service levels to positively influence loyalty and retention.
– We will work closely with each of the dentists who practice from our dental centres to help to enhance their professional satisfaction and practice development.
– We will invest in and use technology solutions that enhance service delivery, communications, internal efficiencies and management information.
– We will launch new and innovative marketing initiatives to build greater awareness in the communities we serve and to attract new patients.
– We will continue to collaborate with private health insurers and other third parties to encourage their members or customers to choose the dentists at our centres as their preferred providers.
– We will enhance our high performance culture throughout all areas of the organisation through an emphasis on employee training and development, accountability and reward and recognition.
– We will foster a culture of exceptional clinical governance and workplace safety for all.
ANNUAL REPORT 2016 | 9
For
per
sona
l use
onl
y
MANAGING DIRECTOR’S REVIEW
Risk Management
Pacific Smiles is subject to various risk factors, with some of these specific to its business activities and others of a more general nature. Pacific Smiles has not identified any specific, material exposure to its economic, social or environmental sustainability over the long term.
Pacific Smiles has established policies and structures for oversight and management of material business risks. Further information regarding how Pacific Smiles recognises and manages risks is detailed in our Corporate Governance Statement and related governance policies on our website.
The following risk areas and mitigating factors have been identified by Pacific Smiles:
General economic conditions – downturns in general economic conditions could adversely impact demand for dental services, given the discretionary nature of some of those services. Dentists at Pacific Smiles’ dental centres provide a range of treatments to patients in a number of different geographic zones throughout the eastern states of Australia.
Reduction in private health insurance coverage – changes to the nature or extent of private health insurance coverage could impact upon the attendance frequency of patients. Patients at Pacific Smiles’ dental centres are a mix of privately insured and non-insured individuals and there are payment options available to assist patients to pay for the treatments they require.
Competition-induced fee pressure – an increase in the number of practicing dentists could increase competition for patients and the degree to which dentists compete on the basis of fee levels. Pacific Smiles’ dental centres are usually differentiated from other local providers and compete on the basis of convenience, value, access and overall patient experience.
Reputational damage – Actions by employees or dentists could give rise to reputational damage to Pacific Smiles and its brands. There is a close focus on internal procedures and clinical governance by management and the Board.
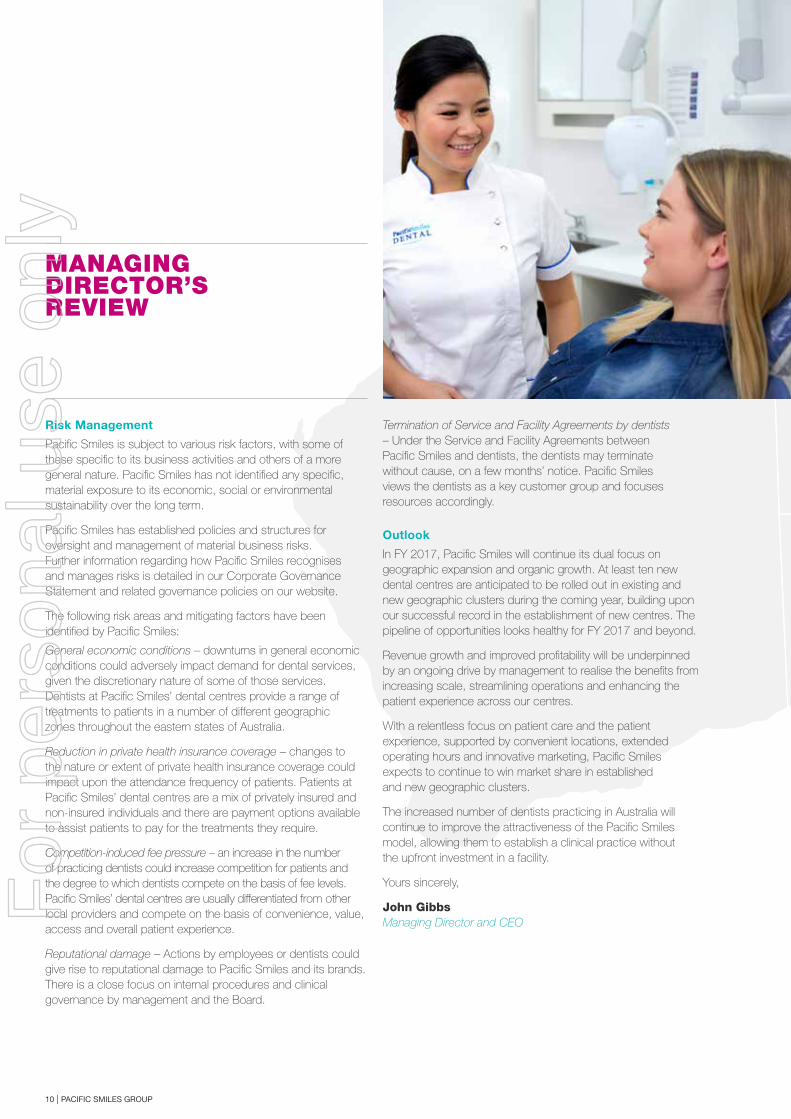
Termination of Service and Facility Agreements by dentists – Under the Service and Facility Agreements between Pacific Smiles and dentists, the dentists may terminate without cause, on a few months’ notice. Pacific Smiles views the dentists as a key customer group and focuses resources accordingly.
Outlook
In FY 2017, Pacific Smiles will continue its dual focus on geographic expansion and organic growth. At least ten new dental centres are anticipated to be rolled out in existing and new geographic clusters during the coming year, building upon our successful record in the establishment of new centres. The pipeline of opportunities looks healthy for FY 2017 and beyond.
Revenue growth and improved profitability will be underpinned by an ongoing drive by management to realise the benefits from increasing scale, streamlining operations and enhancing the patient experience across our centres.
With a relentless focus on patient care and the patient experience, supported by convenient locations, extended operating hours and innovative marketing, Pacific Smiles expects to continue to win market share in established and new geographic clusters.
The increased number of dentists practicing in Australia will continue to improve the attractiveness of the Pacific Smiles model, allowing them to establish a clinical practice without the upfront investment in a facility.
Yours sincerely,
John Gibbs Managing Director and CEO
10 | PACIFIC SMILES GROUP
For
per
sona
l use
onl
y
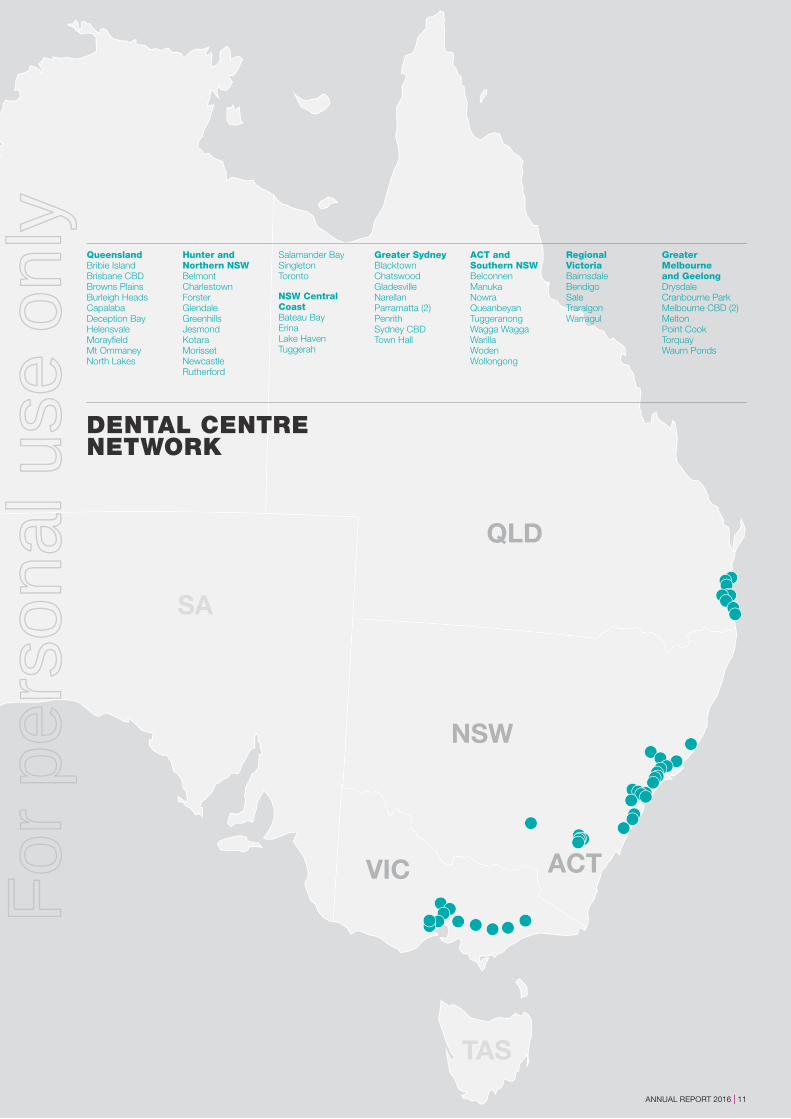
QueenslandBribie Island Brisbane CBDBrowns PlainsBurleigh Heads Capalaba Deception Bay Helensvale MorayfieldMt OmmaneyNorth Lakes
Hunter andNorthern NSWBelmontCharlestownForsterGlendaleGreenhillsJesmondKotaraMorissetNewcastleRutherford
Salamander BaySingletonToronto
NSW Central CoastBateau BayErinaLake HavenTuggerah
Greater SydneyBlacktownChatswoodGladesvilleNarellanParramatta (2)PenrithSydney CBDTown Hall
ACT and Southern NSWBelconnenManuka NowraQueanbeyanTuggeranongWagga WaggaWarillaWodenWollongong
Regional VictoriaBairnsdaleBendigo SaleTraralgonWarragul
Greater Melbourne and GeelongDrysdaleCranbourne Park Melbourne CBD (2)MeltonPoint CookTorquayWaurn Ponds
NSW
ACT
QLD
VIC
DENTAL CENTRENETWORK
TAS
SA
ANNUAL REPORT 2016 | 11
For
per
sona
l use
onl
y
12 | PACIFIC SMILES GROUP
CORPORATE GOVERNANCE STATEMENTFor the year ended 30 June 2016
Pacific Smiles Group Limited and the Board of Directors are committed to achieving and demonstrating the highest standards of corporate governance. Pacific Smiles Group Limited has reviewed its corporate governance practices against the Corporate Governance Principles and Recommendations (3rd edition) published by the ASX Corporate Governance Council.
The 2016 Corporate Governance Statement is dated as at 30 June 2016 and reflects the corporate governance practices in place for the 2016 financial year. The 2016 Corporate Governance Statement was approved by the Board on 18 August 2016. The Group’s Corporate Governance Statement can be viewed at www.pacificsmilesgroup.com.au/Investors/CorporateGovernance.
Each year Pacific Smiles Group reports to the federal government on its Equal Employment Opportunity (EEO) policies and initiatives. This report is a requirement under the Workplace Gender Equality Act 2012 (Act).
As part of its ambition to achieve Employer of Choice status, Pacific Smiles Group is committed to supporting gender equity in the workplace and to achieving goals with regard to career advancement, earnings and access to family-friendly policies and flexible work. To access a copy of the report, please contact Pacific Smiles Group’s People and Culture division.
In accordance with the requirements of the Act, Pacific Smiles Group confirms that on 31 May 2016, its annual public report was lodged with the Workplace Gender Equality Agency.
For
per
sona
l use
onl
y

ANNUAL REPORT 2016 | 13
DIRECTORS’ REPORTFor the year ended 30 June 2016
Your directors present their report on the consolidated entity (referred to hereafter as “the Group”) consisting of Pacific Smiles Group Limited (“the Company”) and the entities it controlled at the end of, or during the year ended 30 June 2016.
Directors
The following persons were directors of Pacific Smiles Group Limited during the whole of the financial year and up to the date of this report:
Mr Robert Cameron AO
Mr John Gibbs
Dr Alex Abrahams
Mr Grant Bourke
Mr Ben Gisz
Mr Simon Rutherford
Principal Activities
Pacific Smiles Group principally operates dental centres at which independent dentists practice and provide clinical treatments and services to patients. Revenues and profits are primarily derived from fees charged to dentists for the provision of these fully serviced dental facilities.
Review of Operations
Information on the operations and financial position of the Group and its business strategies and prospects is set out in the Managing Director’s Review accompanying this report.
Dividends
Dividends paid to members during the financial year were as follows:
2016$’000
2015$’000
Interim dividend for the year ended 30 June 2016 of 2.00 cents (2015 – 1.67 cents) per share 3,040 2,538
Final dividend for the year ended 30 June 2015 of 3.33 cents per share (2015 – 2.50 cents*) 5,061 3,410
Pre IPO special dividend of 1.60 cents per share – 2,182
8,101 8,130
* A subdivision of capital on 9 October 2014 resulted in the conversion of each one ordinary share into three ordinary shares. Where applicable, dividends per share paid during the prior comparative period have been restated and presented on a post share-split basis.
Subsequent to the end of the financial year, the Directors declared a final dividend of 3.50 cents per share in relation to the financial year ended 30 June 2016. The dividend, which totals $5.320 million, will be paid on 4 October 2016.
For
per
sona
l use
onl
y
BOARD OF DIRECTORS
Robert Cameron AO Non-executive Chairman
BE Min (Hons) MBA Grad. Dip. Geoscience, FAICD, FAIM, FAusIMM
Non-executive Chairman, appointed in 2003
Member of the Nomination and Remuneration Committee.
Bob is the founder and Chairman (Non-executive) of Centennial Coal Company Limited and was its Managing Director and Chief Executive Officer until 30 June 2011. He is currently Chairman of County International Limited, Chairman of Hunter Valley Training Company, a Trustee of the University of NSW Foundation and the Museum of Applied Arts and Sciences. In addition to his extensive business career, he has served on many community, educational, industry and government bodies.
John Gibbs Managing Director and CEO
B.Bus, M.Bus. (Int. Mkg.), AFAIM, GAICD
Managing Director and Chief Executive Officer, appointed in 2008
John commenced as General Manager in 2004. His background experience includes the development and management of private health facilities, and the marketing and business development of medical and surgical devices. He established new private hospitals for Mayne Health and local joint-venture partners in the Asia-Pacific region, following his participation in private hospital expansion and upgrade projects for Mayne Health in Australia. John has undergraduate and postgraduate business and marketing degrees.
Dr Alex Abrahams Founder and Executive Director
BDS (Syd Uni), AIMM
Founder and Executive Director, appointed in 2002
Alex has overseen the development of the business from a group of partnerships to an incorporated entity on 1 January 2003. Alex is a dentist with a special interest in dental implants. Alex is a member of the Australian Dental Association and a member of the Australian Osseointegration Society (Implants). He is a director of Group Homes Australia Pty Limited and a Director of the Trustees of Canyon Property Trust and Key Health Unit Trust.
14 | PACIFIC SMILES GROUP
For
per
sona
l use
onl
y
Grant Bourke Non-executive Director
BSc (Hons), MBA, MAICD
Non-executive Director, appointed in 2014
Member of the Audit and Risk Management Committee
Member of the Nomination and Remuneration Committee
Grant is an entrepreneur and investor, with a background in retailing and the food service industry. He is a Non-executive Director of Domino’s Pizza Enterprises Ltd and Domino’s Pizza Japan. Grant was deeply involved in the listing of Domino’s on the ASX in 2005. Grant’s involvement with Domino’s started as a successful franchisee. He sold his stores to Domino’s in exchange for a substantial shareholding, and then moved into senior executive positions within the Domino’s organisation. Prior to joining Domino’s, Grant worked in various technical, sales, and marketing roles in Australia, New Zealand and Japan.
Ben Gisz Non-executive Director
B.Comm., CA, FFin, CFA
Non-executive Director, appointed in 2012
Chairman of the Nomination and Remuneration Committee
Member of the Audit and Risk Management Committee
Ben is a partner at TDM Asset Management, a Sydney based private investment firm. Ben has extensive financial markets experience, including roles in investment banking and private equity/principal investments with Investec Group in Sydney and London. Prior to this, Ben was an equities analyst with Credit Suisse. Ben holds a Bachelor of Commerce degree from the University of Sydney and is a fellow of the Financial Services Institute of Australasia. Ben is also a chartered accountant and a CFA charter holder.
Simon Rutherford Non-executive Director
B. Comm., CA, FAICD
Non-executive Director, appointed in 2003
Chairman of the Audit and Risk Management Committee
Simon is a chartered accountant and partner with PKF working in business advisory services. He is a director and responsible manager with PKF Corporate Finance Pty Limited and specialises in strategy, governance, structuring, business sales, mergers and acquisitions. In this role Simon has assisted various companies with capital raising, listing requirements and transactions. Simon is a director of Haemokinesis Pty Limited and the Trustee of Canyon Property Trust and is involved with other syndicated investments. He has also served on a number of boards including National Brokers Group and Vow Financial Group.
ANNUAL REPORT 2016 | 15
For
per
sona
l use
onl
y
16 | PACIFIC SMILES GROUP
DIRECTORS’ REPORT CONTINUEDFor the year ended 30 June 2016
Company Secretary
The Company Secretary is Jane Coleman B.Comm., MBA, CA, GAICD. Jane was appointed to the position of Company Secretary during 2006, and also holds the position of Chief Financial Officer within the Group. Jane is a chartered accountant. Before joining the Group, Jane held senior accounting roles at nib Health Funds and Credit Suisse, following a chartered accounting career as a manager at PricewaterhouseCoopers. Jane has also held external board positions within the finance and health sectors.
Meetings of Directors
The number of meetings of the Company’s Board of Directors held during the year ended 30 June 2016, and the attendances by each director were:
Meetings of Committees
Full Meetings of Directors
Audit andRisk Management
Nomination and Remuneration
Held Attended Held Attended Held Attended
Robert Cameron AO 11 11 – – 2 2
John Gibbs 11 11 – – – –
Alex Abrahams 11 11 – – – –
Grant Bourke 11 11 3 3 2 2
Ben Gisz 11 11 3 3 2 2
Simon Rutherford 11 11 3 3 – –
– Not a member of the relevant committee.
Matters Subsequent to the End of the Financial Year
Other than the declaration of a final dividend subsequent to the end of the financial year, no other matter or circumstance has arisen since 30 June 2016 that has significantly affected, or may significantly affect:
a. the Group’s operations in future financial years, or
b. the results of those operations in future financial years, or
c. the Group’s state of affairs in future financial years.
Likely Developments and Expected Results of Operations
The Group will continue to pursue opportunities to enhance the growth and prosperity of its business. The Managing Director’s Review accompanying this report provides further detail. Further information on likely developments in the operations of the Group and the expected results of operations have not been included in this annual financial report because the directors believe it would be likely to result in unreasonable prejudice to the Group.
Environmental Regulation
The Group’s operations are not regulated by any significant environmental regulation.
Insurance of Officers and Auditors
During the financial year, the Group paid a premium in respect of a contract insuring the directors and officers of the Group against liability incurred as such a director or officer, other than conduct involving a wilful breach of duty in relation to the Group, to the extent permitted by the Corporations Act 2001. The contract of insurance prohibits disclosure of the nature of the liability and the amount of the premium. No such insurance contracts entered into by the Group apply to insure auditors of the Group.
For
per
sona
l use
onl
y
ANNUAL REPORT 2016 | 17
DIRECTORS’ REPORT CONTINUEDFor the year ended 30 June 2016
Remuneration Report (Audited)
This 2016 Remuneration Report sets out remuneration information for Pacific Smiles Group Limited’s non-executive directors, executive directors and other key management personnel for the year ended 30 June 2016.
The Remuneration Report is set out under the following headings:
a. Key management personnel disclosed in this report
b. Remuneration governance
c. Executive remuneration policy and framework
d. Relationship between remuneration and Pacific Smiles Group’s performance
e. Non-executive director remuneration policy
f. Details of remuneration
g. Employment contracts
h. Details of share based compensation
i. Equity instruments held by key management personnel
The information provided in this remuneration report has been audited as required by section 308(3C) of the Corporations Act 2001.
a. Key management personnel disclosed in this report
The key management personnel are all the directors of the Group and the executive managers within the Group who report directly to the Board or Chief Executive Officer, and have prime responsibility for significant functional areas within the Group. These directors and executives have been identified as having the greatest authority for the strategic direction and management of the Group.
Non-executive Directors
Robert Cameron AO Non-executive Chairman
Grant Bourke Non-executive Director
Ben Gisz Non-executive Director
Simon Rutherford Non-executive Director
Executive Directors
John Gibbs Managing Director and Chief Executive Officer
Dr Alex Abrahams Executive Director
Other Executives
Jane Coleman Chief Financial Officer and Company Secretary
Paul Robertson Chief Operating Officer
Dr Alison Hughes Principal Dental Officer
Emma McKenny Executive Manager – People and Culture (appointed 1 June 2015)
Peter McKinney Executive Manager – Business Development (appointed 19 October 2015)
Where relevant, executive directors and other executives may hereafter be referred to collectively as executives within this remuneration report.
b. Remuneration governance
The Nomination and Remuneration Committee is a committee of the Board. It is primarily responsible for making recommendations to the Board on:
– the over-arching executive remuneration framework;
– operation of the incentive plans which apply to the senior management team, including key performance indicators and performance hurdles;
– remuneration packages for the chief executive officer, executive director and senior management; and
– remuneration arrangements for non-executive directors.
For
per
sona
l use
onl
y
18 | PACIFIC SMILES GROUP
DIRECTORS’ REPORT CONTINUEDFor the year ended 30 June 2016
The Committee’s objective is to ensure that remuneration policies and structures are fair and competitive and aligned with the long-term interests of the Group.
The Nomination and Remuneration Committee Charter, included on the Company’s website at www.pacificsmilesgroup.com.au provides further information on the role of this committee.
c. Executive remuneration policy and framework
In determining executive remuneration, the Board aims to ensure that remuneration practices are:
– competitive and reasonable, enabling the Group to attract and retain key talent;
– aligned to the Group’s strategic and business objectives and the creation of shareholder value;
– transparent; and
– acceptable to shareholders.
The executive remuneration framework has three components:
– base salary and benefits, including superannuation;
– short-term performance incentives (‘STI’) plan; and
– a long-term equity incentive (‘LTI’) plan.
Base salary and benefits
Base salaries are reviewed annually or upon any substantial changes to positions. There are no guaranteed pay increases included in any key management personnel contracts. Base salary includes any elected salary sacrifice arrangements as individually nominated.
Base salary is inclusive of required superannuation contributions.
Short-term performance incentives
Executives have the opportunity to earn an annual short-term incentive (STI) linked to the achievement of performance hurdles. The actual level of STI paid to each executive is determined at the end of the financial year based on the executives’ achievement of specific KPIs and an annual performance review. Targets are reviewed annually.
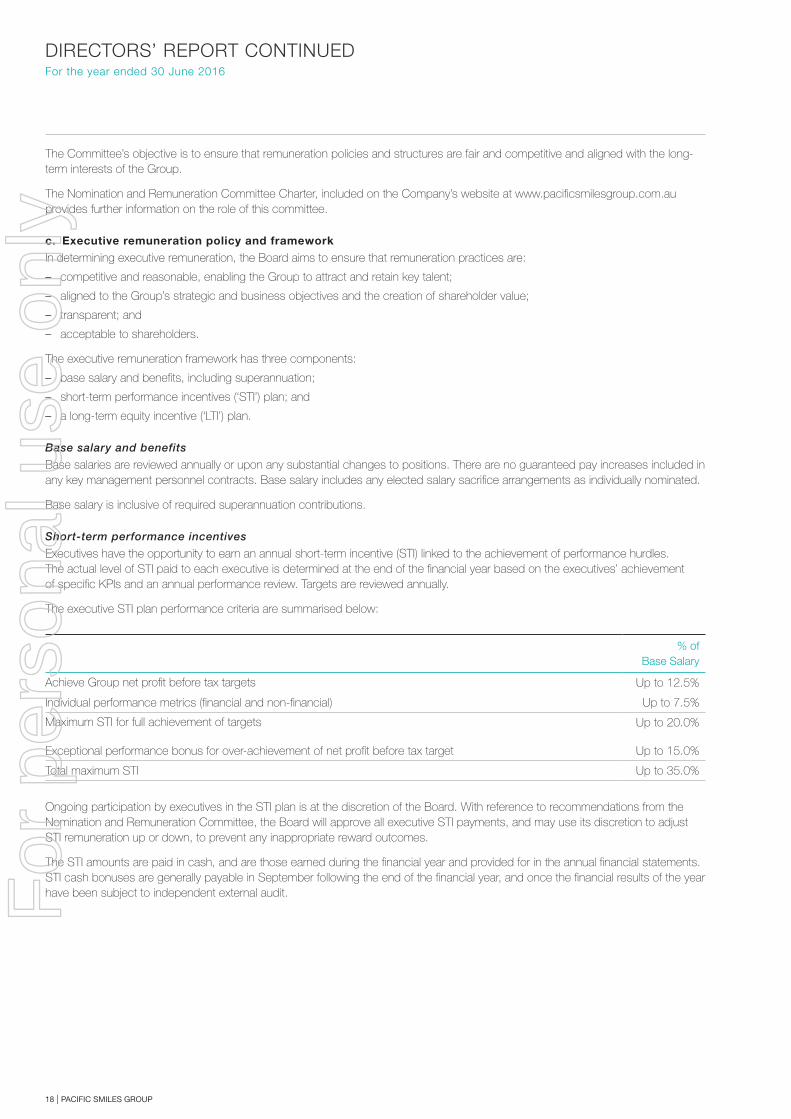
The executive STI plan performance criteria are summarised below:
% of Base Salary
Achieve Group net profit before tax targets Up to 12.5%
Individual performance metrics (financial and non-financial) Up to 7.5%
Maximum STI for full achievement of targets Up to 20.0%
Exceptional performance bonus for over-achievement of net profit before tax target Up to 15.0%
Total maximum STI Up to 35.0%
Ongoing participation by executives in the STI plan is at the discretion of the Board. With reference to recommendations from the Nomination and Remuneration Committee, the Board will approve all executive STI payments, and may use its discretion to adjust STI remuneration up or down, to prevent any inappropriate reward outcomes.
The STI amounts are paid in cash, and are those earned during the financial year and provided for in the annual financial statements. STI cash bonuses are generally payable in September following the end of the financial year, and once the financial results of the year have been subject to independent external audit.F
or p
erso
nal u
se o
nly
ANNUAL REPORT 2016 | 19
DIRECTORS’ REPORT CONTINUEDFor the year ended 30 June 2016
Long-term equity incentives
The Group has a LTI plan to assist in the motivation, retention and reward of executives. The LTI plan is designed to align the interests of senior management more closely with the interests of shareholders by providing an opportunity for senior management to receive an equity interest in the Company through the granting of performance rights.
Performance rights have been issued to selected senior managers pursuant to the LTI plan in financial years 2016 and 2015.
Vesting of the performance rights on issue are subject to:
– satisfaction of earnings per share (EPS) performance hurdles for a four year performance period. The number of performance rights vesting will be determined on a sliding scale from nil vesting for an EPS compound annual growth rate (CAGR) of 15.0% per annum or less and 100% vesting for an EPS CAGR of 25.0% per annum; and
– the participant remaining employed by Pacific Smiles Group (or its subsidiaries) on the vesting date, subject to certain “good leaver” exemptions.
Performance rights that do not vest on the relevant vesting date will lapse. Performance rights will also lapse if total shareholder return (TSR) does not reach a minimum of 10.0% per annum over the relevant performance period.
In the event of serious misconduct or a material misstatement in the Group’s financial statements, the Board may determine that certain performance-based remuneration (including STIs and/or LTIs) should not have been paid and may claw back performance-based remuneration paid in the preceding three financial years.
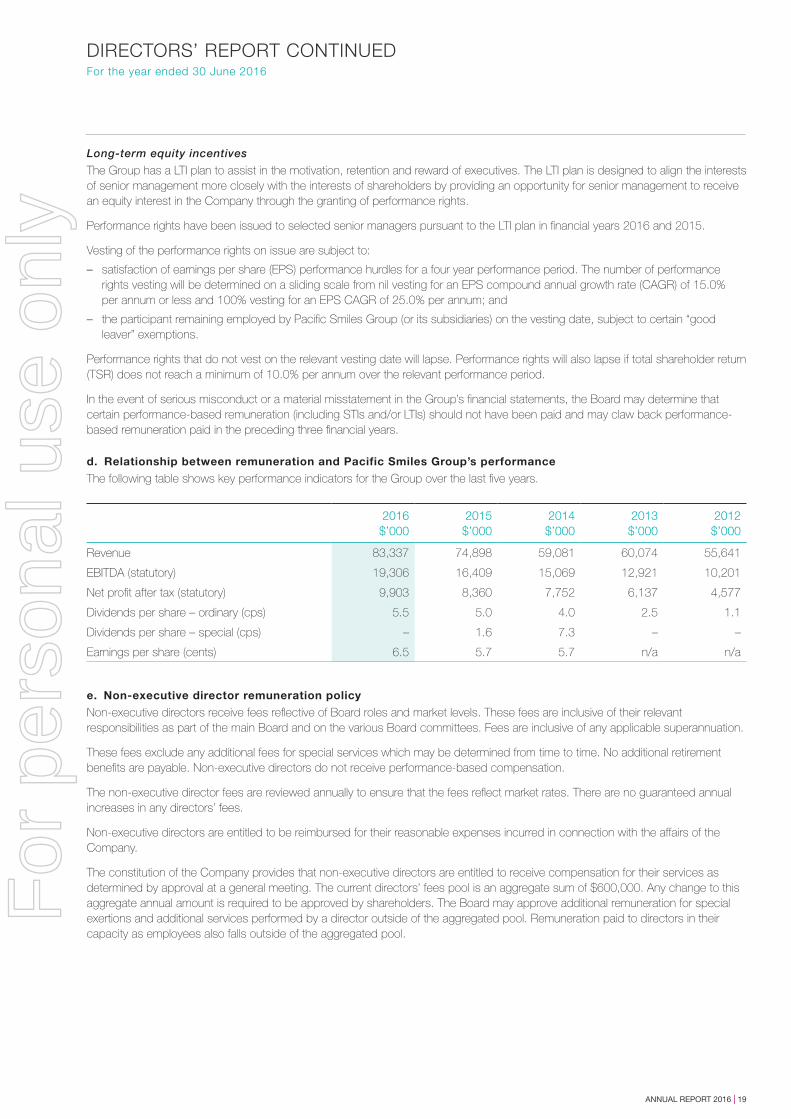
d. Relationship between remuneration and Pacific Smiles Group’s performance
The following table shows key performance indicators for the Group over the last five years.
2016$’000
2015$’000
2014$’000
2013$’000
2012$’000
Revenue 83,337 74,898 59,081 60,074 55,641
EBITDA (statutory) 19,306 16,409 15,069 12,921 10,201
Net profit after tax (statutory) 9,903 8,360 7,752 6,137 4,577
Dividends per share – ordinary (cps) 5.5 5.0 4.0 2.5 1.1
Dividends per share – special (cps) – 1.6 7.3 – –
Earnings per share (cents) 6.5 5.7 5.7 n/a n/a
e. Non-executive director remuneration policy
Non-executive directors receive fees reflective of Board roles and market levels. These fees are inclusive of their relevant responsibilities as part of the main Board and on the various Board committees. Fees are inclusive of any applicable superannuation.
These fees exclude any additional fees for special services which may be determined from time to time. No additional retirement benefits are payable. Non-executive directors do not receive performance-based compensation.
The non-executive director fees are reviewed annually to ensure that the fees reflect market rates. There are no guaranteed annual increases in any directors’ fees.
Non-executive directors are entitled to be reimbursed for their reasonable expenses incurred in connection with the affairs of the Company.
The constitution of the Company provides that non-executive directors are entitled to receive compensation for their services as determined by approval at a general meeting. The current directors’ fees pool is an aggregate sum of $600,000. Any change to this aggregate annual amount is required to be approved by shareholders. The Board may approve additional remuneration for special exertions and additional services performed by a director outside of the aggregated pool. Remuneration paid to directors in their capacity as employees also falls outside of the aggregated pool.
For
per
sona
l use
onl
y
20 | PACIFIC SMILES GROUP
DIRECTORS’ REPORT CONTINUEDFor the year ended 30 June 2016
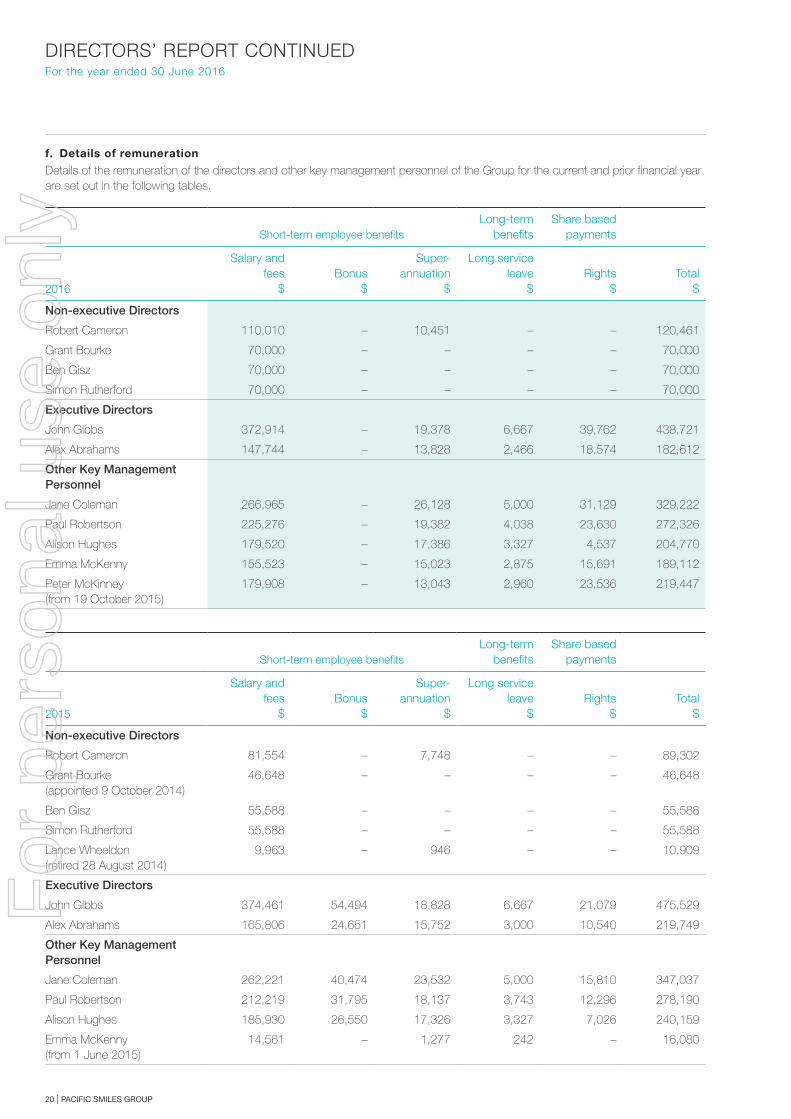
f. Details of remuneration
Details of the remuneration of the directors and other key management personnel of the Group for the current and prior financial year are set out in the following tables.
Short-term employee benefitsLong-term
benefitsShare based
payments
2016
Salary and fees
$Bonus
$
Super-annuation
$
Long service leave
$Rights
$Total
$
Non-executive Directors
Robert Cameron 110,010 – 10,451 – – 120,461
Grant Bourke 70,000 – – – – 70,000
Ben Gisz 70,000 – – – – 70,000
Simon Rutherford 70,000 – – – – 70,000
Executive Directors
John Gibbs 372,914 – 19,378 6,667 39,762 438,721
Alex Abrahams 147,744 – 13,828 2,466 18,574 182,612
Other Key Management Personnel
Jane Coleman 266,965 – 26,128 5,000 31,129 329,222
Paul Robertson 225,276 – 19,382 4,038 23,630 272,326
Alison Hughes 179,520 – 17,386 3,327 4,537 204,770
Emma McKenny 155,523 – 15,023 2,875 15,691 189,112
Peter McKinney (from 19 October 2015)
179,908 – 13,043 2,960 23,536 219,447
Short-term employee benefitsLong-term
benefitsShare based
payments
2015
Salary and fees
$Bonus
$
Super-annuation
$
Long service leave
$Rights
$Total
$
Non-executive Directors
Robert Cameron 81,554 – 7,748 – – 89,302
Grant Bourke (appointed 9 October 2014)
46,648 – – – – 46,648
Ben Gisz 55,588 – – – – 55,588
Simon Rutherford 55,588 – – – – 55,588
Lance Wheeldon (retired 28 August 2014)
9,963 – 946 – – 10,909
Executive Directors
John Gibbs 374,461 54,494 18,828 6,667 21,079 475,529
Alex Abrahams 165,806 24,651 15,752 3,000 10,540 219,749
Other Key Management Personnel
Jane Coleman 262,221 40,474 23,532 5,000 15,810 347,037
Paul Robertson 212,219 31,795 18,137 3,743 12,296 278,190
Alison Hughes 185,930 26,550 17,326 3,327 7,026 240,159
Emma McKenny (from 1 June 2015)
14,561 – 1,277 242 – 16,080
For
per
sona
l use
onl
y
ANNUAL REPORT 2016 | 21
DIRECTORS’ REPORT CONTINUEDFor the year ended 30 June 2016
There were no termination benefits paid or payable to key management personnel during the current or previous financial years.
STI awarded
The CEO and key management made the decision to forfeit 100% of their STIs for 2016 given internal financial targets were not met. The Board commended the Executive for their commitment to aligning their personal interests with those of shareholders.
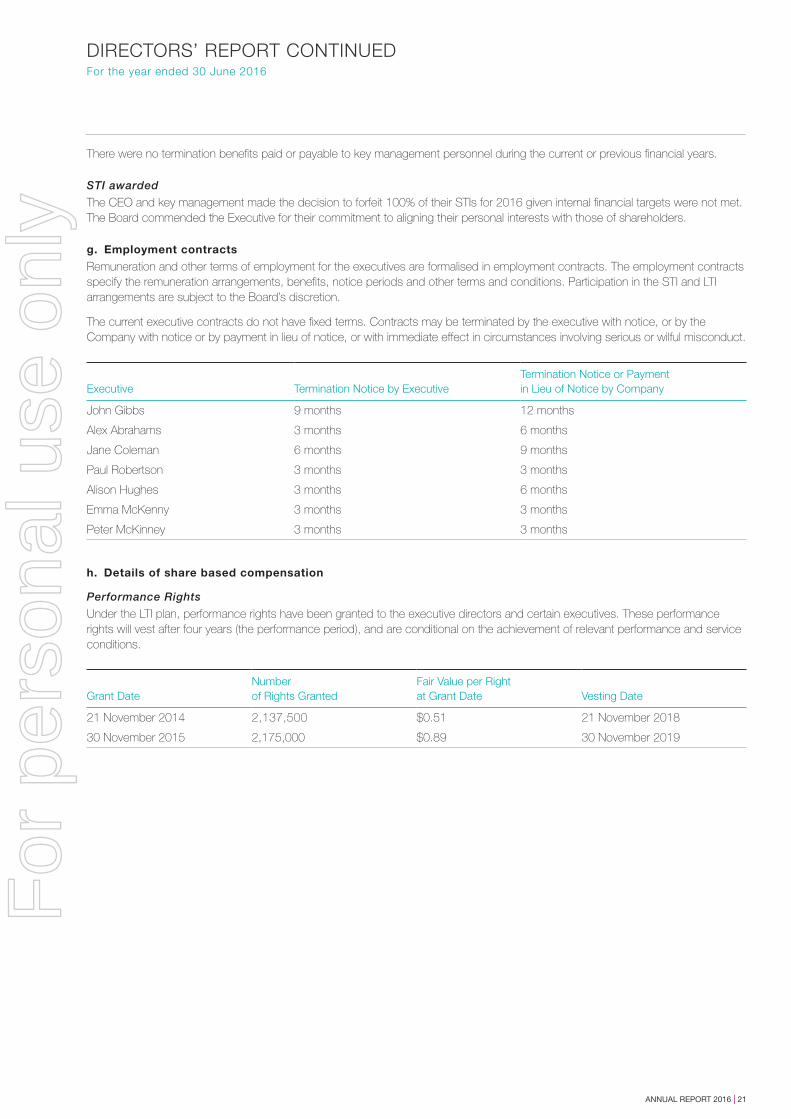
g. Employment contracts
Remuneration and other terms of employment for the executives are formalised in employment contracts. The employment contracts specify the remuneration arrangements, benefits, notice periods and other terms and conditions. Participation in the STI and LTI arrangements are subject to the Board’s discretion.
The current executive contracts do not have fixed terms. Contracts may be terminated by the executive with notice, or by the Company with notice or by payment in lieu of notice, or with immediate effect in circumstances involving serious or wilful misconduct.
Executive Termination Notice by ExecutiveTermination Notice or Payment in Lieu of Notice by Company
John Gibbs 9 months 12 months
Alex Abrahams 3 months 6 months
Jane Coleman 6 months 9 months
Paul Robertson 3 months 3 months
Alison Hughes 3 months 6 months
Emma McKenny 3 months 3 months
Peter McKinney 3 months 3 months
h. Details of share based compensation
Performance Rights
Under the LTI plan, performance rights have been granted to the executive directors and certain executives. These performance rights will vest after four years (the performance period), and are conditional on the achievement of relevant performance and service conditions.
Grant DateNumber of Rights Granted
Fair Value per Rightat Grant Date Vesting Date
21 November 2014 2,137,500 $0.51 21 November 2018
30 November 2015 2,175,000 $0.89 30 November 2019
For
per
sona
l use
onl
y
22 | PACIFIC SMILES GROUP
DIRECTORS’ REPORT CONTINUEDFor the year ended 30 June 2016
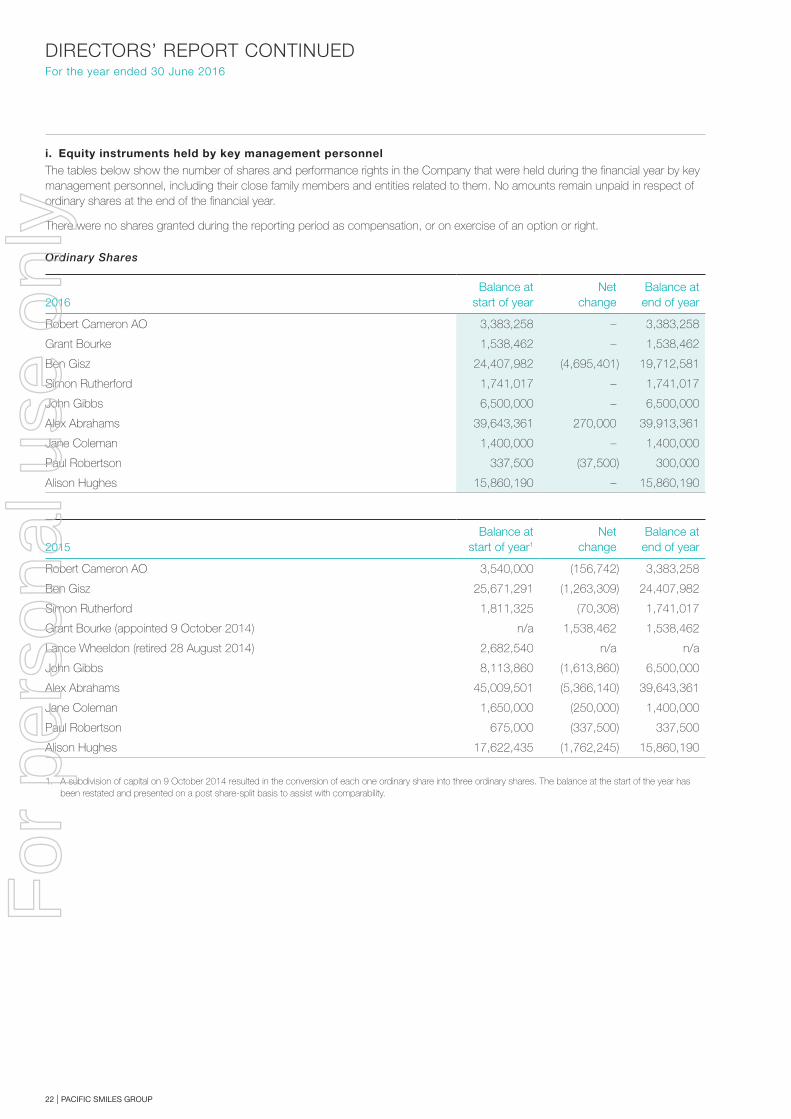
i. Equity instruments held by key management personnel
The tables below show the number of shares and performance rights in the Company that were held during the financial year by key management personnel, including their close family members and entities related to them. No amounts remain unpaid in respect of ordinary shares at the end of the financial year.
There were no shares granted during the reporting period as compensation, or on exercise of an option or right.
Ordinary Shares
2016Balance at
start of year Net
changeBalance at end of year
Robert Cameron AO 3,383,258 – 3,383,258
Grant Bourke 1,538,462 – 1,538,462
Ben Gisz 24,407,982 (4,695,401) 19,712,581
Simon Rutherford 1,741,017 – 1,741,017
John Gibbs 6,500,000 – 6,500,000
Alex Abrahams 39,643,361 270,000 39,913,361
Jane Coleman 1,400,000 – 1,400,000
Paul Robertson 337,500 (37,500) 300,000
Alison Hughes 15,860,190 – 15,860,190
2015Balance at
start of year1
Netchange
Balance at end of year
Robert Cameron AO 3,540,000 (156,742) 3,383,258
Ben Gisz 25,671,291 (1,263,309) 24,407,982
Simon Rutherford 1,811,325 (70,308) 1,741,017
Grant Bourke (appointed 9 October 2014) n/a 1,538,462 1,538,462
Lance Wheeldon (retired 28 August 2014) 2,682,540 n/a n/a
John Gibbs 8,113,860 (1,613,860) 6,500,000
Alex Abrahams 45,009,501 (5,366,140) 39,643,361
Jane Coleman 1,650,000 (250,000) 1,400,000
Paul Robertson 675,000 (337,500) 337,500
Alison Hughes 17,622,435 (1,762,245) 15,860,190
1. A subdivision of capital on 9 October 2014 resulted in the conversion of each one ordinary share into three ordinary shares. The balance at the start of the year has been restated and presented on a post share-split basis to assist with comparability.
For
per
sona
l use
onl
y
ANNUAL REPORT 2016 | 23
DIRECTORS’ REPORT CONTINUEDFor the year ended 30 June 2016
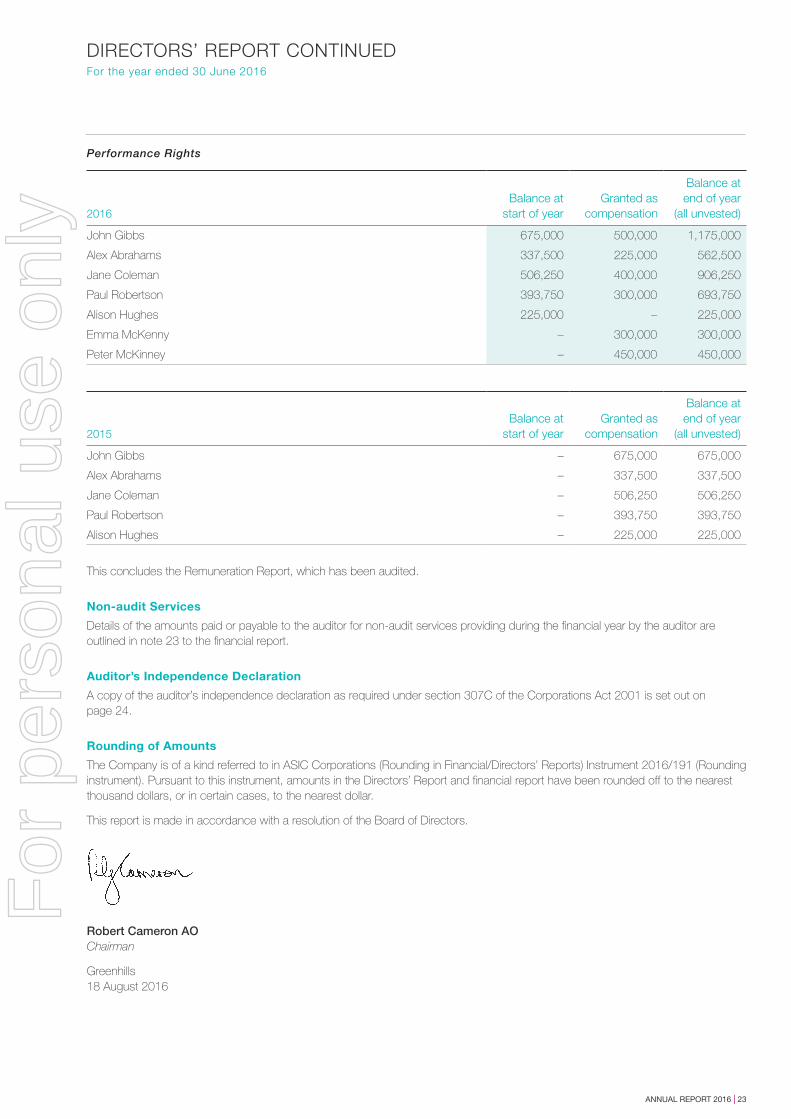
Performance Rights
2016Balance at
start of yearGranted as
compensation
Balance at end of year
(all unvested)
John Gibbs 675,000 500,000 1,175,000
Alex Abrahams 337,500 225,000 562,500
Jane Coleman 506,250 400,000 906,250
Paul Robertson 393,750 300,000 693,750
Alison Hughes 225,000 – 225,000
Emma McKenny – 300,000 300,000
Peter McKinney – 450,000 450,000
2015Balance at
start of yearGranted as
compensation
Balance at end of year
(all unvested)
John Gibbs – 675,000 675,000
Alex Abrahams – 337,500 337,500
Jane Coleman – 506,250 506,250
Paul Robertson – 393,750 393,750
Alison Hughes – 225,000 225,000
This concludes the Remuneration Report, which has been audited.
Non-audit Services
Details of the amounts paid or payable to the auditor for non-audit services providing during the financial year by the auditor are outlined in note 23 to the financial report.
Auditor’s Independence Declaration
A copy of the auditor’s independence declaration as required under section 307C of the Corporations Act 2001 is set out on page 24.
Rounding of Amounts
The Company is of a kind referred to in ASIC Corporations (Rounding in Financial/Directors’ Reports) Instrument 2016/191 (Rounding instrument). Pursuant to this instrument, amounts in the Directors’ Report and financial report have been rounded off to the nearest thousand dollars, or in certain cases, to the nearest dollar.
This report is made in accordance with a resolution of the Board of Directors.
Robert Cameron AOChairman
Greenhills18 August 2016
For
per
sona
l use
onl
y
24 | PACIFIC SMILES GROUP
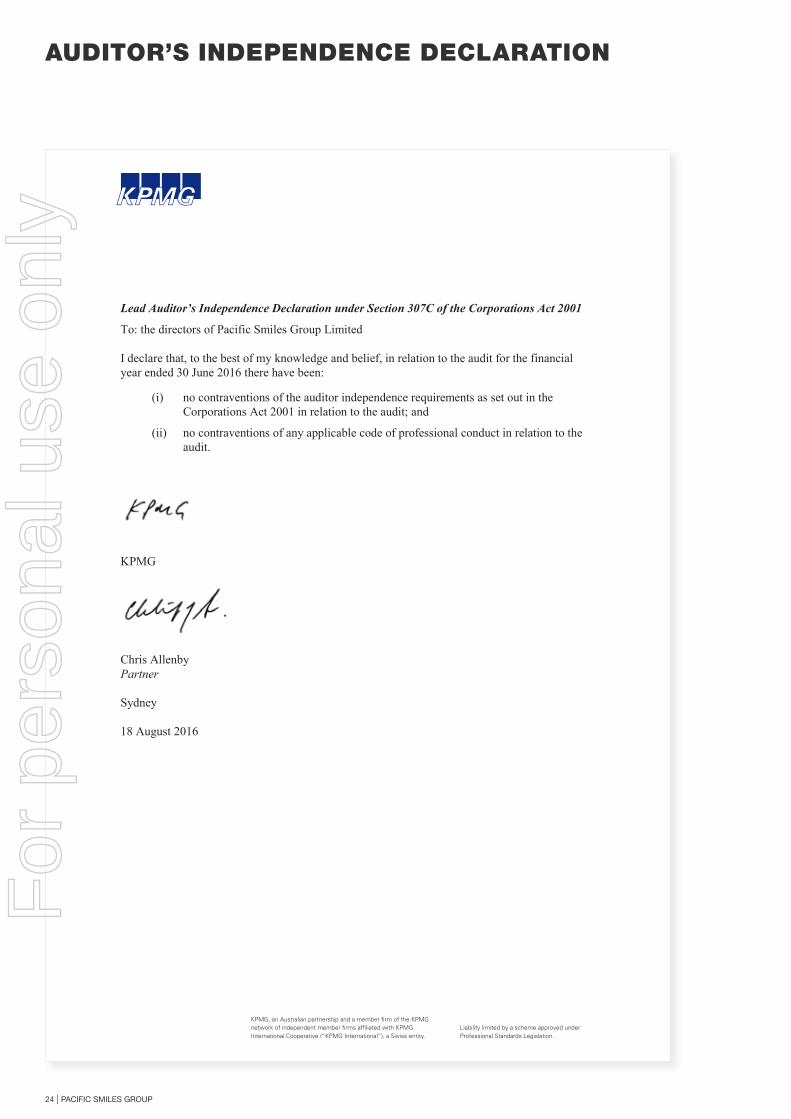
AUDITOR’S INDEPENDENCE DECLARATION
KPMG, an Australian partnership and a member firm of the KPMG network of independent member firms affiliated with KPMG International Cooperative (“KPMG International”), a Swiss entity.
Liability limited by a scheme approved under Professional Standards Legislation.
Lead Auditor’s Independence Declaration under Section 307C of the Corporations Act 2001
To: the directors of Pacific Smiles Group Limited
I declare that, to the best of my knowledge and belief, in relation to the audit for the financial year ended 30 June 2016 there have been:
(i) no contraventions of the auditor independence requirements as set out in the Corporations Act 2001 in relation to the audit; and
(ii) no contraventions of any applicable code of professional conduct in relation to the audit.
KPMG
Chris Allenby Partner
Sydney
18 August 2016
ABCD
For
per
sona
l use
onl
y
ANNUAL REPORT 2016 | 25
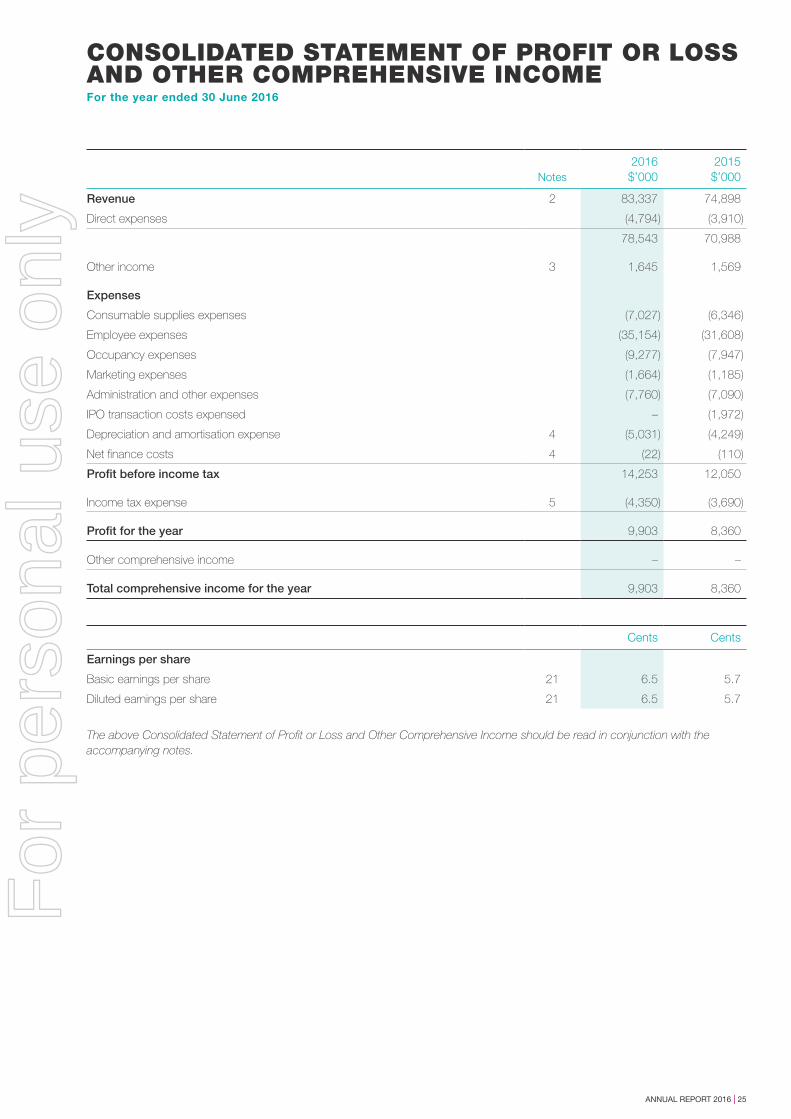
CONSOLIDATED STATEMENT OF PROFIT OR LOSS AND OTHER COMPREHENSIVE INCOMEFor the year ended 30 June 2016
Notes2016
$’0002015$’000
Revenue 2 83,337 74,898
Direct expenses (4,794) (3,910)
78,543 70,988
Other income 3 1,645 1,569
Expenses
Consumable supplies expenses (7,027) (6,346)
Employee expenses (35,154) (31,608)
Occupancy expenses (9,277) (7,947)
Marketing expenses (1,664) (1,185)
Administration and other expenses (7,760) (7,090)
IPO transaction costs expensed – (1,972)
Depreciation and amortisation expense 4 (5,031) (4,249)
Net finance costs 4 (22) (110)
Profit before income tax 14,253 12,050
Income tax expense 5 (4,350) (3,690)
Profit for the year 9,903 8,360
Other comprehensive income – –
Total comprehensive income for the year 9,903 8,360
Cents Cents
Earnings per share
Basic earnings per share 21 6.5 5.7
Diluted earnings per share 21 6.5 5.7
The above Consolidated Statement of Profit or Loss and Other Comprehensive Income should be read in conjunction with the accompanying notes.
For
per
sona
l use
onl
y
26 | PACIFIC SMILES GROUP
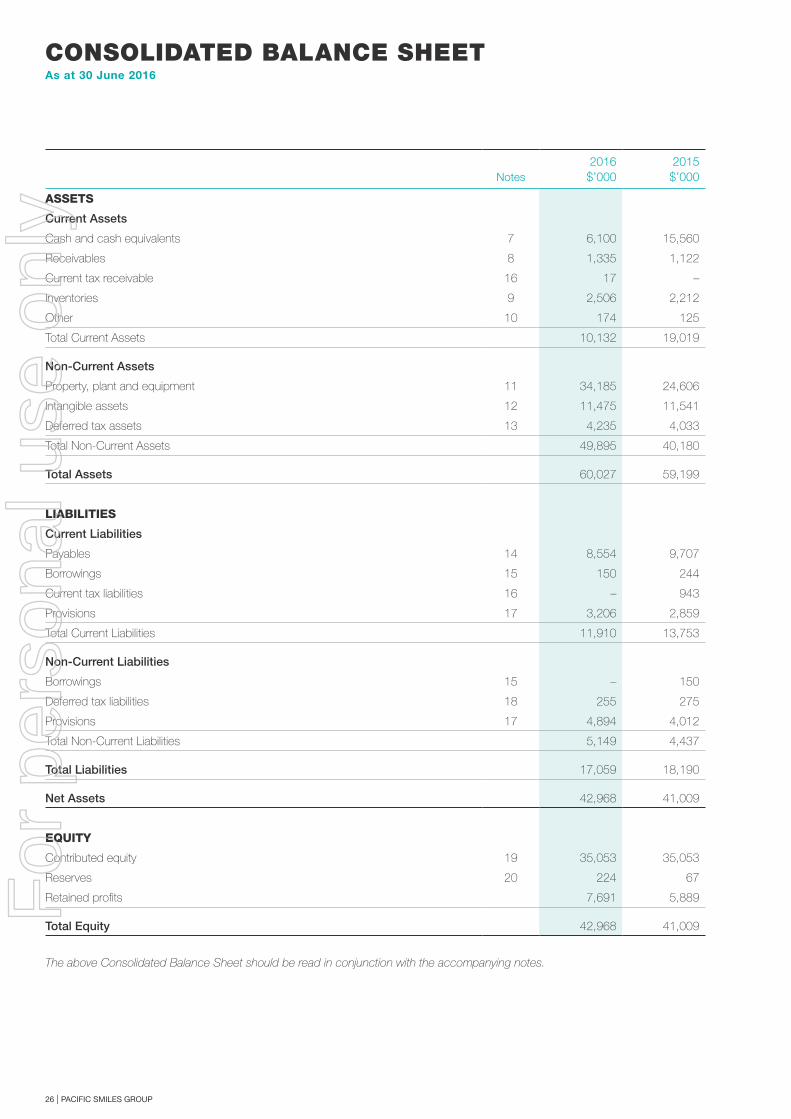
CONSOLIDATED BALANCE SHEETAs at 30 June 2016
Notes2016
$’0002015$’000
ASSETS
Current Assets
Cash and cash equivalents 7 6,100 15,560
Receivables 8 1,335 1,122
Current tax receivable 16 17 –
Inventories 9 2,506 2,212
Other 10 174 125
Total Current Assets 10,132 19,019
Non-Current Assets
Property, plant and equipment 11 34,185 24,606
Intangible assets 12 11,475 11,541
Deferred tax assets 13 4,235 4,033
Total Non-Current Assets 49,895 40,180
Total Assets 60,027 59,199
LIABILITIES
Current Liabilities
Payables 14 8,554 9,707
Borrowings 15 150 244
Current tax liabilities 16 – 943
Provisions 17 3,206 2,859
Total Current Liabilities 11,910 13,753
Non-Current Liabilities
Borrowings 15 – 150
Deferred tax liabilities 18 255 275
Provisions 17 4,894 4,012
Total Non-Current Liabilities 5,149 4,437
Total Liabilities 17,059 18,190
Net Assets 42,968 41,009
EQUITY
Contributed equity 19 35,053 35,053
Reserves 20 224 67
Retained profits 7,691 5,889
Total Equity 42,968 41,009
The above Consolidated Balance Sheet should be read in conjunction with the accompanying notes.
For
per
sona
l use
onl
y
ANNUAL REPORT 2016 | 27
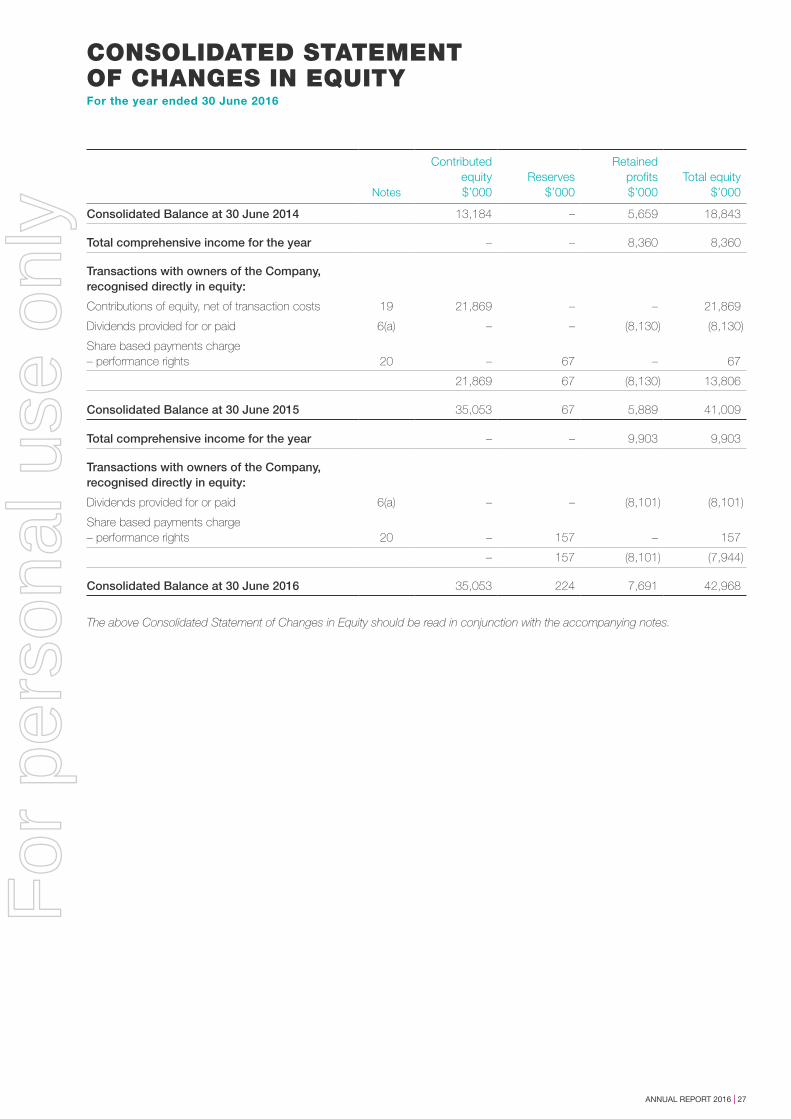
CONSOLIDATED STATEMENT OF CHANGES IN EQUITYFor the year ended 30 June 2016
Notes
Contributed equity$’000
Reserves$’000
Retained profits$’000
Total equity$’000
Consolidated Balance at 30 June 2014 13,184 – 5,659 18,843
Total comprehensive income for the year – – 8,360 8,360
Transactions with owners of the Company, recognised directly in equity:
Contributions of equity, net of transaction costs 19 21,869 – – 21,869
Dividends provided for or paid 6(a) – – (8,130) (8,130)
Share based payments charge – performance rights 20 – 67 – 67
21,869 67 (8,130) 13,806
Consolidated Balance at 30 June 2015 35,053 67 5,889 41,009
Total comprehensive income for the year – – 9,903 9,903
Transactions with owners of the Company, recognised directly in equity:
Dividends provided for or paid 6(a) – – (8,101) (8,101)
Share based payments charge – performance rights 20 – 157 – 157
– 157 (8,101) (7,944)
Consolidated Balance at 30 June 2016 35,053 224 7,691 42,968
The above Consolidated Statement of Changes in Equity should be read in conjunction with the accompanying notes.
For
per
sona
l use
onl
y
28 | PACIFIC SMILES GROUP
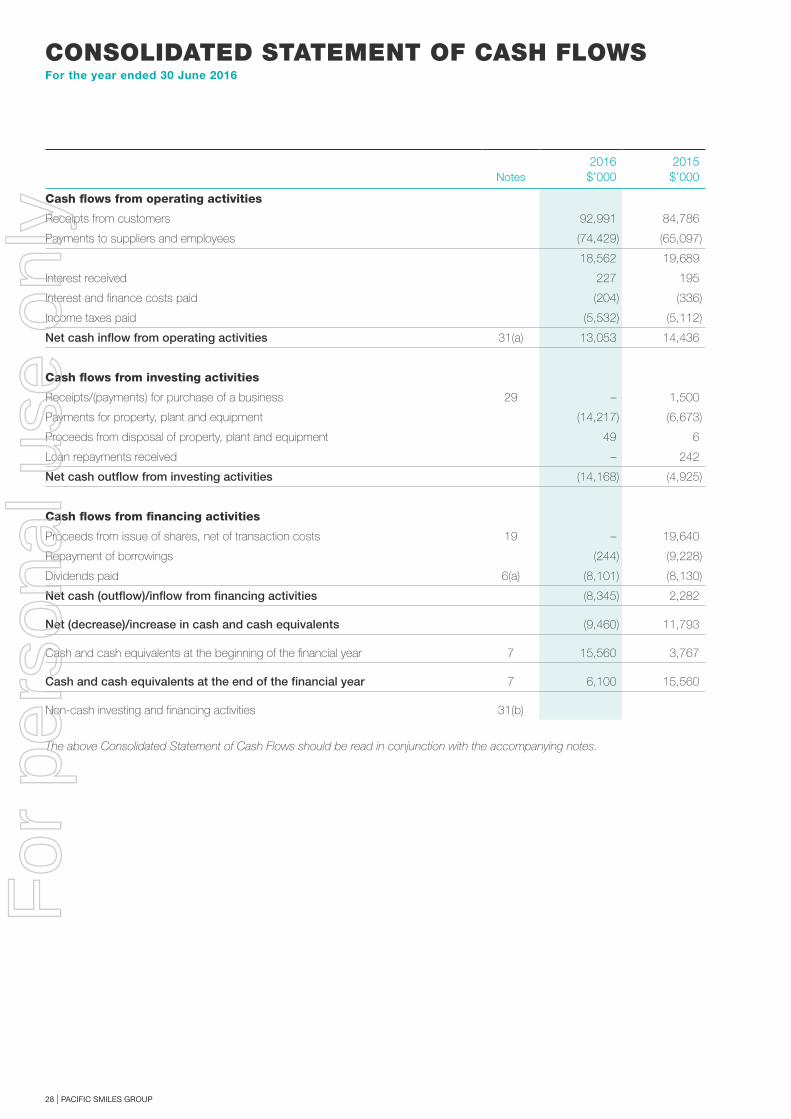
CONSOLIDATED STATEMENT OF CASH FLOWS For the year ended 30 June 2016
Notes2016
$’0002015$’000
Cash flows from operating activities
Receipts from customers 92,991 84,786
Payments to suppliers and employees (74,429) (65,097)
18,562 19,689
Interest received 227 195
Interest and finance costs paid (204) (336)
Income taxes paid (5,532) (5,112)
Net cash inflow from operating activities 31(a) 13,053 14,436
Cash flows from investing activities
Receipts/(payments) for purchase of a business 29 – 1,500
Payments for property, plant and equipment (14,217) (6,673)
Proceeds from disposal of property, plant and equipment 49 6
Loan repayments received – 242
Net cash outflow from investing activities (14,168) (4,925)
Cash flows from financing activities
Proceeds from issue of shares, net of transaction costs 19 – 19,640
Repayment of borrowings (244) (9,228)
Dividends paid 6(a) (8,101) (8,130)
Net cash (outflow)/inflow from financing activities (8,345) 2,282
Net (decrease)/increase in cash and cash equivalents (9,460) 11,793
Cash and cash equivalents at the beginning of the financial year 7 15,560 3,767
Cash and cash equivalents at the end of the financial year 7 6,100 15,560
Non-cash investing and financing activities 31(b)
The above Consolidated Statement of Cash Flows should be read in conjunction with the accompanying notes.
For
per
sona
l use
onl
y
ANNUAL REPORT 2016 | 29
NOTES TO THE FINANCIAL STATEMENTSFor the year ended 30 June 2016
1. Summary of Significant Accounting Policies
a. Corporate Information
The financial statements are for the consolidated entity consisting of Pacific Smiles Group Limited (“the Company”) and its subsidiaries (“the Group”).
Pacific Smiles Group Limited is a public company limited by shares, incorporated and domiciled in Australia. On 21 November 2014 the Company was listed on the ASX. Its registered office and its principal place of business are located at Level 1, 6 Molly Morgan Drive, Greenhills, New South Wales.
A description of the nature of the consolidated entity’s operations and its principal activities is included in the Directors’ Report on pages 13 to 23, which is not part of this financial report.
The financial report is presented in Australian Dollars, which is the Company’s functional currency.
The financial report was authorised for issue by the Directors on 18 August 2016. The Company has the power to amend and reissue the financial report.
b. Basis of Preparation
Statement of Compliance
The principal accounting policies adopted in preparation of these consolidated financial statements are set out below. These policies have been consistently applied to all the years presented, unless otherwise stated.
These general purpose financial statements have been prepared in accordance with Australian Accounting Standards (AASBs) adopted by the Australian Accounting Standards Board (AASB) and the Corporations Act 2001. Pacific Smiles Group Limited is a for-profit entity for the purpose of preparing the financial statements.
The financial statements also comply with International Financial Reporting Standards (IFRS) adopted by the International Accounting Standards Board (IASB).
Historical Cost Convention
These financial statements have been prepared on an accruals basis and are based on historical costs, modified where applicable, by the measurement at fair value of selected non-current assets, financial assets and financial liabilities.
Critical Accounting Estimates and Judgements
The preparation of financial statements requires the use of certain critical accounting estimates. It also requires management to exercise its judgement in the process of applying the Group’s accounting policies. The areas involving a higher degree of judgement or complexity, or areas where assumptions and estimates are significant to the financial statements include asset impairment testing.
New Accounting Standards and Accounting Interpretations
The Group has adopted all of the new and revised standards issued by the Australian Accounting Standards Board that are relevant to its operations and effective for the reporting period. Details of the impact of the adoption of these new accounting standards, where applicable, are set out in the individual accounting policy notes.
Certain new accounting standards and interpretations have been published by the Australian Accounting Standards Board that are not mandatory for 30 June 2016 reporting periods and have not been adopted early by the Group. The Group’s assessment of the impact of these new standards and interpretations is set out below.
AASB 115 Revenue from Contracts with Customers is effective for annual reporting periods beginning on or after 1 January 2018. The Group is not required to adopt this new standard until the annual reporting period ending 30 June 2019 and currently has no intention of adopting this standard earlier. The potential impact of the standard has been assessed at this stage as minimal.
AASB 16 Leases is effective for annual reporting periods beginning on or after 1 January 2019. The Group is not required to adopt this new standard until the annual reporting period ending 30 June 2020 and currently has no intention of adopting this standard earlier. The Group is assessing the potential impact of the application of AASB 16 on its financial statements, including the potential impact of the various transition provisions available to the Group. On a high level basis, if the Group was to adopt AASB 16 as at 30 June 2016, the present value of the future minimum lease payments for non-cancellable operating leases as noted in note 25(b) would be recognised as a financial liability in the consolidated balance sheet, and under one of the transition provisions available to the Group, it would recognise a corresponding amount as a right-of-use asset.
For
per
sona
l use
onl
y
30 | PACIFIC SMILES GROUP
NOTES TO THE FINANCIAL STATEMENTS CONTINUEDFor the year ended 30 June 2016
1. Summary of Significant Accounting Policies (continued)
b. Basis of Preparation (continued)
AASB 9 Financial Instruments is effective for annual reporting periods beginning on or after 1 January 2018. The Group is not required to adopt this new standard until the annual reporting period ending 30 June 2019 and currently has no intention of adopting this standard earlier. It includes revised guidance on the classification and measurement of financial instruments, a new expected credit loss model for calculating impairment on financial assets, and new general hedge accounting requirements. The potential impact of the standard has yet to be assessed, but the impact is expected to be minimal.
There are no other such standards that are not yet effective and that are expected to have a material impact on the Group in the current or future reporting periods and on foreseeable future transactions.
c. Basis of Consolidation
The consolidated financial statements incorporate the assets and liabilities of all subsidiaries of Pacific Smiles Group Limited (“Company” or “parent entity”) as at 30 June 2016 and the results of all subsidiaries for the year then ended. Pacific Smiles Group Limited and its subsidiaries together are referred to in this financial report as the “Group” or the “consolidated entity”.
Subsidiaries are entities controlled by the Group. The Group controls an entity when it is exposed to, or has rights to, variable returns from its involvement with the entity and has the ability to affect those returns through its power over the entity. The financial statements of subsidiaries are included in the consolidated financial statements from the date on which control commences until the date on which control ceases.
Subsidiaries are fully consolidated from the date on which control is transferred to the Group. The acquisition method of accounting is used to account for business combinations by the Group (refer to note 1(h)).
Intercompany transactions, balances and unrealised gains on transactions between Group companies are eliminated. Unrealised losses are also eliminated unless the transaction provides evidence of the impairment of the asset transferred. Accounting policies of subsidiaries are consistent with the policies adopted by the Group.
Investments in subsidiaries are accounted for at cost in the individual financial statements of the parent entity.
d. Segment Reporting
Operating segments are reported in a manner consistent with the internal reporting provided to the chief operating decision maker. The chief operating decision maker is responsible for allocating resources and assessing performance of the operating segments.
e. Revenue Recognition
Revenue is recognised at the fair value of consideration received or receivable.
Revenue from the rendering of services is recognised once the services have been provided and is measured in accordance with contractual calculation methods and rates.
Revenue from the sale of goods is net of returns, discounts and other allowances, and is recognised when the significant risks and rewards of ownership of the goods have passed to the buyer. Risks and rewards of ownership are considered to pass to the buyer at the time when control of the goods passes to the customer in the case of the supply of non-customised products, or at the time a significant monetary deposit is taken in the case of customised products.
Government subsidies are recognised at their fair value where there is reasonable assurance that the subsidy will be received and the Group will comply with all attached conditions.
Interest income is recognised as it accrues in profit and loss.
f. Income Tax
The income tax expense for the period is the tax payable on the current period’s taxable income based on the applicable income tax rate for each jurisdiction adjusted by changes in deferred tax assets and liabilities attributable to temporary differences between the tax bases of assets and liabilities and their carrying amounts in the financial statements.
The current income tax charge is calculated on the basis of the tax laws enacted or substantively enacted at the end of the reporting period in the jurisdictions where the Company and its subsidiaries operate and generate taxable income. Management periodically evaluates positions taken in tax returns with respect to situations in which applicable tax regulation is subject to interpretations. It establishes provisions where appropriate on the basis of amounts expected to be paid to the tax authorities.
For
per
sona
l use
onl
y
ANNUAL REPORT 2016 | 31
NOTES TO THE FINANCIAL STATEMENTS CONTINUEDFor the year ended 30 June 2016
Deferred income tax is provided in full, using the liability method, on temporary differences arising between the tax bases of assets and liabilities and their carrying amounts in the consolidated financial statements. However, the deferred income tax is not accounted for if it arises from initial recognition of an asset or liability in a transaction other than a business combination that at the time of the transactions affects neither accounting nor taxable profit or loss. Deferred income tax is determined using tax rates and laws that have been enacted or substantially enacted by the end of the reporting period and are expected to apply when the related deferred income tax asset is realised or the deferred income tax liability is settled.
Deferred tax assets are recognised for deductible temporary differences and unused tax losses only if it is probable that future taxable amounts will be available to utilise those temporary differences and losses.
Deferred tax liabilities and assets are not recognised for temporary differences between the carrying amount and tax bases of investments in controlled entities where the parent entity is able to control the timing of the reversal of the temporary differences and it is probable that the differences will not reverse in the foreseeable future.
Deferred tax assets and liabilities are offset when there is a legally enforceable right to offset current tax assets and liabilities and when the deferred tax balances relate to the same taxation authority. Current tax assets and tax liabilities are offset where the entity has a legally enforceable right to offset and intends to either settle on a net basis, or to realise the asset and settle the liability simultaneously.
Current and deferred tax is recognised in profit or loss, except to the extent that it relates to items recognised in other comprehensive income or directly in equity. In this case, the tax is also recognised in other comprehensive income or directly in equity, respectively.
g. Leases
Leases of property, plant and equipment where the Group, as lessee, has substantially all the risks and rewards of ownership are classified as finance leases. Finance leases are capitalised at the lease inception at the lower of the fair value of the lease asset and the present value of the minimum lease payments. The corresponding rental obligations, net of finance charges, are included in borrowings. Each lease payment is allocated between the liability and finance charges so as to achieve a constant rate of the finance balance outstanding.
The interest element of the finance cost is charged to the profit and loss over the lease period so as to produce a constant periodic rate of interest on the remaining balance of the liability for each period. The property, plant and equipment acquired under finance leases are depreciated over the shorter of the asset’s useful life and the lease term.
Leases in which a significant portion of the risks and rewards of ownership are not transferred to the Group as lessee are classified as operating leases. Payments made under operating leases, net of incentives received from the lessor, are charged to profit and loss on a straight-line basis over the period of the lease.
Lease income from operating leases where the Group is a lessor is recognised in income on a straight-line basis over the lease term.
h. Business Combinations
The acquisition method of accounting is used to account for all business combinations. Cost is measured as the fair value of the assets given, equity instruments issued or liabilities incurred or assumed. The consideration also includes the fair value of any asset or liability resulting from a contingent consideration arrangement. Acquisition-related costs are expensed as incurred.
Identifiable assets acquired and liabilities and contingent liabilities assumed in a business combination are measured initially at their fair values at the acquisition date. The excess of the cost of acquisition over the fair value of the Group’s share of the identifiable net assets acquired is recorded as goodwill (refer to note 1(n)).
Where contingent consideration is classified as a financial liability and amounts are subsequently re-measured to fair value, changes in fair value are recognised in profit and loss.
i. Impairment of Assets
Goodwill and intangible assets that have an indefinite useful life are not subject to amortisation and are tested at least annually for impairment. Other assets, including those that are subject to depreciation or amortisation are reviewed for impairment whenever events or changes in circumstances indicate that the carrying amount may not be recoverable. An impairment loss is recognised for the amount by which the asset’s carrying amount exceeds its recoverable amount. The recoverable amount is the higher of an asset’s fair value less costs to sell and value in use.
For the purposes of assessing impairment, assets are grouped at the lowest levels for which there are separately identifiable cash flows which are largely independent of the cash flows from other assets or groups of assets (cash generating units). Non-financial assets other than goodwill that suffered an impairment are reviewed for possible reversal of the impairment at each reporting date. Cash inflows considered for the purposes of impairment testing are discounted to present value.
For
per
sona
l use
onl
y
32 | PACIFIC SMILES GROUP
NOTES TO THE FINANCIAL STATEMENTS CONTINUEDFor the year ended 30 June 2016
1. Summary of Significant Accounting Policies (continued)
i. Impairment of Assets (continued)
Significant judgment has been used in testing assets for impairment and in determining the amounts recognised as impairment losses at reporting date. Further details of any material impairment losses recognised in the financial statements are provided in the notes dealing with the relevant asset category.
j. Cash and Cash Equivalents
Cash and cash equivalents includes cash on hand, deposits held at call with financial institutions, other short-term, highly liquid investments with original maturities of three months or less that are readily convertible to known amounts of cash and which are subject to an insignificant risk of changes in value.
k. Receivables
Receivables are recognised initially at fair value and subsequently measured at amortised cost, less provision for impairment if applicable.
The amount of the impairment loss is recognised in profit and loss with other expenses. When a receivable for which an impairment allowance had been recognised becomes uncollectible in a subsequent period, it is written off against the allowance account. Subsequent recoveries of amounts previously written off are credited against other expenses in profit and loss.
l. Inventories
Inventories held for sale and stores of consumable supplies are stated at the lower of cost and net realisable value. Costs are assigned to individual items of inventory on the basis of actual costs. Net realisable value is the estimated selling price less estimated costs associated with the sale.
m. Property, Plant and Equipment
All property, plant and equipment are stated at historical cost less depreciation, amortisation and accumulated impairment losses.
Subsequent costs are included in the asset’s carrying amount or recognised as a separate asset, as appropriate, only when it is probable that future economic benefits associated with the item will flow to the Group and the cost of the item can be measured reliably. All other repairs and maintenance are charged to profit and loss during the reporting period in which they are incurred.
Depreciation is calculated using the straight line method to allocate the cost of assets, net of their residual values, over their estimated useful lives, as follows:
Leasehold improvements 10 to 20 years
Plant and equipment 3 to 10 years
The assets’ residual values and useful lives are reviewed, and adjusted if appropriate, at the end of each reporting period.
An asset’s carrying amount is written down immediately to its recoverable amount if the asset’s carrying amount is greater than its estimated recoverable amount (refer to note 1(i)).
n. Intangible Assets
Goodwill
Goodwill represents the excess of the cost of an acquisition over the fair value of the Group’s share of the net identifiable assets of the acquired business at the date of acquisition. Goodwill on acquisitions of businesses is included in intangible assets.
Goodwill acquired in business combinations is not amortised. Instead, goodwill is tested for impairment annually or more frequently if events or changes in circumstances indicate that it might be impaired, and is carried at cost less accumulated impairment losses.
Goodwill is allocated to relevant groups of cash-generating units for the purpose of impairment testing.
Rights and Licences
Contractual rights and licences have a finite useful life and are carried at cost less accumulated amortisation and impairment losses. Amortisation is calculated using the straight line method to allocate the cost of the rights and licences over their estimated useful lives, being 15 years.
o. Payables
These amounts represent liabilities for goods and services provided to the Group prior to the end of the financial year which are unpaid.
For
per
sona
l use
onl
y
ANNUAL REPORT 2016 | 33
NOTES TO THE FINANCIAL STATEMENTS CONTINUEDFor the year ended 30 June 2016
p. Borrowings
Borrowings are measured at amortised cost. Borrowing costs are expensed as incurred.
Borrowings are classified as current liabilities unless the Group has an unconditional right to defer settlement of the liabilities for at least 12 months after the reporting period.
q. Employee Benefits
The employee benefits provisions cover the Group’s liability for employees’ annual leave and long service leave entitlements.
Short-term Obligations
Short-term employee benefit obligations are measured on an undiscounted basis and are expensed as the related service is provided. The liabilities are measured at the amounts expected to be paid when the liabilities are settled. The liability for annual leave is recognised in the provision for employee benefits. All other short-term employee benefit obligations are presented as payables.
Long-term Obligations
The Group’s net obligation in respect of long-term employee benefits is the amount of future benefit that employees have earned in return for their service in the current and prior periods. Consideration is given to expected future wage and salary levels, experience of employee departures and periods of service. The benefit is discounted to determine its present value. Re-measurements are recognised in profit or loss in the period in which they arise.
The obligations are presented as a current liability in the balance sheet if the Group does not have an unconditional right to defer settlement for at least twelve months after the reporting date, regardless of when the actual settlement is expected to occur.
Share Based Payments
Share-based compensation benefits are provided to selected employees via a Long Term Incentive plan (LTI plan) which was established during the previous financial year, with effect from the Company’s listing on the ASX. Further information on the LTI plan is set out in note 22.
The fair value of performance rights granted under the LTI plan is recognised as an employee benefits expense with a corresponding increase in equity. The total amount to be expensed is determined by reference to the fair value of the performance rights granted, which includes any market performance conditions and the impact of any non-vesting conditions but excludes the impact of any service and non-market performance vesting conditions.
Non-market vesting conditions are included in assumptions about the number of performance rights that are expected to vest. The total expense is recognised over the vesting period, which is the period over which all of the specified vesting conditions are satisfied. At the end of each period, the Company revises its estimates of the number of performance rights that are expected to vest based on the non-market vesting conditions. It recognises the impact of the revision to original estimates, if any, in profit or loss, with a corresponding adjustment to equity.
r. Provisions
A provision is recognised if, as a result of a past event, the Group has a present legal or constructive obligation that can be estimated reliably, and it is probable that an outflow of economic benefits will be required to settle the obligation. Provisions are determined by discounting the expected future cash flows at a pre-tax rate that reflects current market assessments of the time value of money and the risks specific to the liability.
Make Good Provision
The Group is required to restore most leased premises to their original condition at the end of their respective lease terms. A provision has been recognised for the present value of the estimated expenditure required to remove any leasehold improvements and repair any associated damage. These costs have been capitalised as part of the cost of leasehold improvements and are amortised over the shorter of the term of the lease or the useful life of the assets.
Onerous Contracts
A provision for onerous contracts is recognised when the expected benefits to be derived by the Group from a contract are lower than the unavoidable cost of meeting its obligations under the contract. The provision is measured at the present value of the lower of the expected cost of terminating the contract and the expected net cost of continuing with the contract. Before a provision is established, the Group recognises any impairment loss on the assets associated with that contract.
Restructuring
A provision for restructuring is recognised when the Group has approved a detailed and formal restructuring plan, and the restructuring has either commenced or has been announced. Future operating losses are not provided for.
For
per
sona
l use
onl
y
34 | PACIFIC SMILES GROUP
NOTES TO THE FINANCIAL STATEMENTS CONTINUEDFor the year ended 30 June 2016
1. Summary of Significant Accounting Policies (continued)
s. Dividends
Provision is made for the amount of any dividend declared on or before the end of the financial year but not distributed at balance date.
t. Earnings Per Share
Basic earnings per share
Basic earnings per share is calculated by dividing:
– the profit attributable to owners of the Company, excluding any costs of servicing equity other than ordinary shares
– by the weighted average number of ordinary shares outstanding during the financial year, adjusted for bonus elements in ordinary shares issued during the year.
Diluted earnings per share
Diluted earnings per share adjusts the figures used in the determination of basic earnings per share to take into account:
– the after income tax effect of interest and other financial costs associated with dilutive potential ordinary shares, and
– the weighted average number of additional ordinary shares that would have been outstanding assuming the conversion of all dilutive potential ordinary shares.
u. Goods and Services Tax (GST)
Revenues, expenses and assets are recognised net of the amount of GST, except where the amount of GST incurred is not recoverable from the taxation authority. In these circumstances, the GST is recognised as part of the cost of acquisition of the asset or as part of an item of expense. Receivables and payables in the balance sheet are shown inclusive of GST.
Cash flows are presented in the cash flow statement on a gross basis, except for the GST component of investing and financing activities, which are disclosed as operating cash flows.
v. Rounding of Amounts
The Company is of a kind referred to ASIC Corporations (Rounding in Financial/Directors’ Reports) Instrument 2016/191 (Rounding instrument). Pursuant to this instrument, amounts in the Directors’ Report and financial report have been rounded off to the nearest thousand dollars, or in certain cases, to the nearest dollar.
w. Parent Entity Financial Information
The financial information for the parent entity, Pacific Smiles Group Limited, disclosed in note 32 has been prepared on the same basis as the consolidated financial statements, except as set out below.
Investments in subsidiaries
Investments in subsidiaries are accounted for at cost in the financial statements of Pacific Smiles Group Limited.
Tax consolidation legislation
Pacific Smiles Group Limited and its wholly-owned Australian controlled entities have implemented the tax consolidation legislation.
The head entity, Pacific Smiles Group Limited, and the controlled entities in the tax consolidated group account for their own current and deferred tax amounts. These tax amounts are measured as if each entity in the tax consolidated group continues to be a stand-alone taxpayer in its own right.
In addition to its own current and deferred tax amounts, Pacific Smiles Group Limited also recognises the current tax liabilities (or assets) and the deferred tax assets arising from unused tax losses and unused tax credits assumed from controlled entities in the tax consolidated group.
The entities have also entered into a tax funding agreement under which the wholly–owned entities fully compensate Pacific Smiles Group Limited for any current tax payable assumed and are compensated by Pacific Smiles Group Limited for any current tax receivable and deferred tax assets relating to unused tax losses or unused tax credits that are transferred to Pacific Smiles Group Limited under the tax consolidation legislation. The funding amounts are determined by reference to the amounts recognised in the wholly-owned entities’ financial statements.
Assets or liabilities arising under tax funding agreements with the tax consolidated entities are recognised as current amounts receivable from or payable to other entities in the Group.
Any difference between the amounts assumed and amounts receivable or payable under the tax funding agreement are recognised as a contribution to (or distribution from) wholly-owned tax consolidated entities.
For
per
sona
l use
onl
y
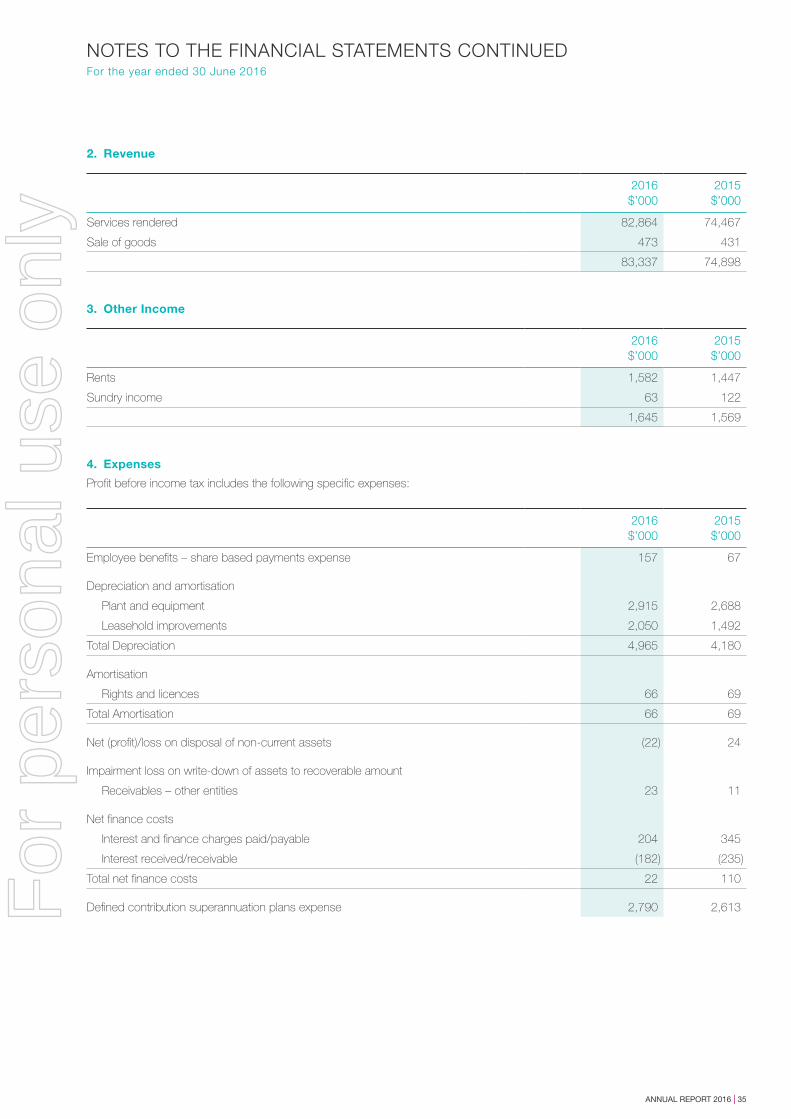
ANNUAL REPORT 2016 | 35
NOTES TO THE FINANCIAL STATEMENTS CONTINUEDFor the year ended 30 June 2016
2. Revenue
2016$’000
2015$’000
Services rendered 82,864 74,467
Sale of goods 473 431
83,337 74,898
3. Other Income
2016$’000
2015$’000
Rents 1,582 1,447
Sundry income 63 122
1,645 1,569
4. Expenses
Profit before income tax includes the following specific expenses:
2016$’000
2015$’000
Employee benefits – share based payments expense 157 67
Depreciation and amortisation
Plant and equipment 2,915 2,688
Leasehold improvements 2,050 1,492
Total Depreciation 4,965 4,180
Amortisation
Rights and licences 66 69
Total Amortisation 66 69
Net (profit)/loss on disposal of non-current assets (22) 24
Impairment loss on write-down of assets to recoverable amount
Receivables – other entities 23 11
Net finance costs
Interest and finance charges paid/payable 204 345
Interest received/receivable (182) (235)
Total net finance costs 22 110
Defined contribution superannuation plans expense 2,790 2,613For
per
sona
l use
onl
y
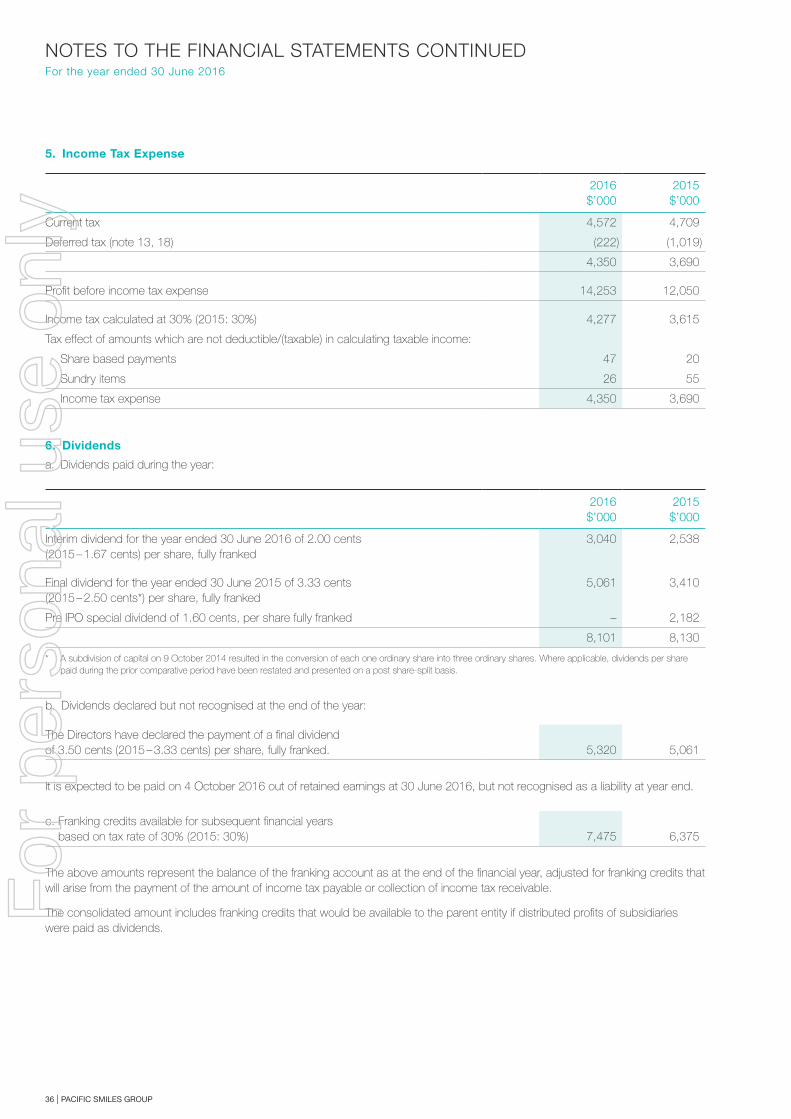
36 | PACIFIC SMILES GROUP
NOTES TO THE FINANCIAL STATEMENTS CONTINUEDFor the year ended 30 June 2016
5. Income Tax Expense
2016$’000
2015$’000
Current tax 4,572 4,709
Deferred tax (note 13, 18) (222) (1,019)
4,350 3,690
Profit before income tax expense 14,253 12,050
Income tax calculated at 30% (2015: 30%) 4,277 3,615
Tax effect of amounts which are not deductible/(taxable) in calculating taxable income:
Share based payments 47 20
Sundry items 26 55
Income tax expense 4,350 3,690
6. Dividends
a. Dividends paid during the year:
2016$’000
2015$’000
Interim dividend for the year ended 30 June 2016 of 2.00 cents (2015 – 1.67 cents) per share, fully franked
3,040 2,538
Final dividend for the year ended 30 June 2015 of 3.33 cents (2015 – 2.50 cents*) per share, fully franked
5,061 3,410
Pre IPO special dividend of 1.60 cents, per share fully franked – 2,182
8,101 8,130
* A subdivision of capital on 9 October 2014 resulted in the conversion of each one ordinary share into three ordinary shares. Where applicable, dividends per share paid during the prior comparative period have been restated and presented on a post share-split basis.
b. Dividends declared but not recognised at the end of the year:
The Directors have declared the payment of a final dividendof 3.50 cents (2015 – 3.33 cents) per share, fully franked. 5,320 5,061
It is expected to be paid on 4 October 2016 out of retained earnings at 30 June 2016, but not recognised as a liability at year end.
c. Franking credits available for subsequent financial years based on tax rate of 30% (2015: 30%) 7,475 6,375
The above amounts represent the balance of the franking account as at the end of the financial year, adjusted for franking credits that will arise from the payment of the amount of income tax payable or collection of income tax receivable.
The consolidated amount includes franking credits that would be available to the parent entity if distributed profits of subsidiaries were paid as dividends.
For
per
sona
l use
onl
y
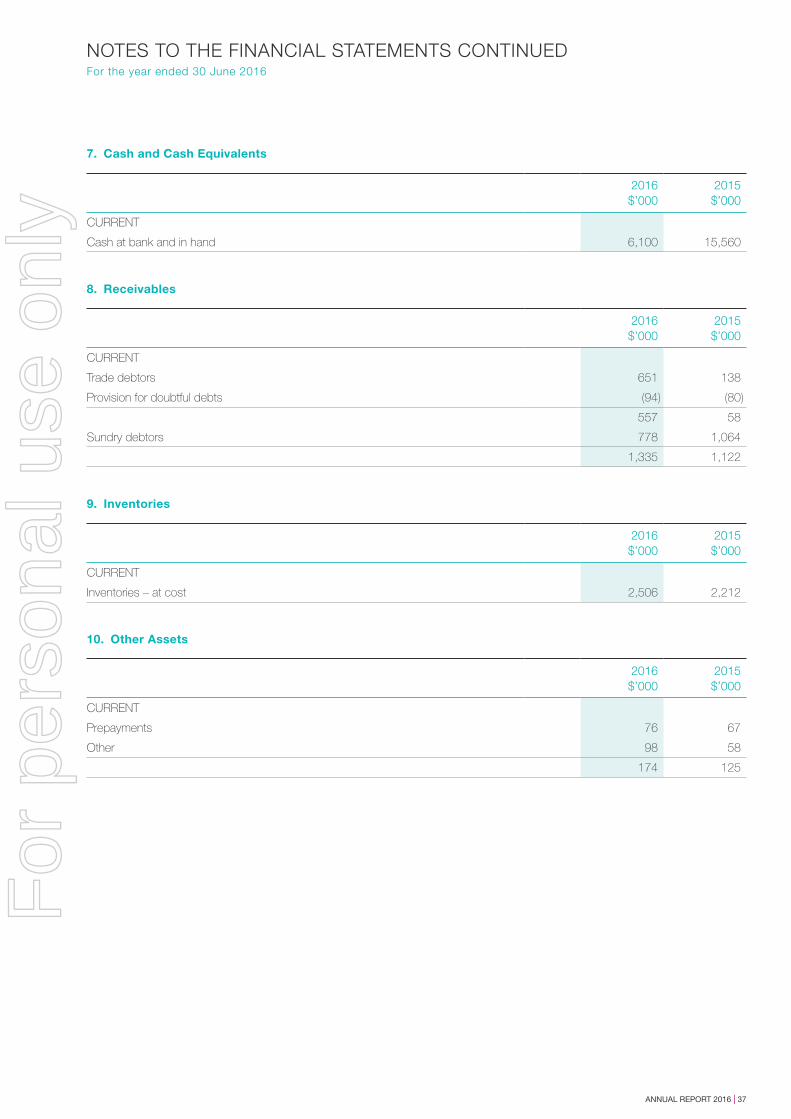
ANNUAL REPORT 2016 | 37
NOTES TO THE FINANCIAL STATEMENTS CONTINUEDFor the year ended 30 June 2016
7. Cash and Cash Equivalents
2016$’000
2015$’000
CURRENT
Cash at bank and in hand 6,100 15,560
8. Receivables
2016$’000
2015$’000
CURRENT
Trade debtors 651 138
Provision for doubtful debts (94) (80)
557 58
Sundry debtors 778 1,064
1,335 1,122
9. Inventories
2016$’000
2015$’000
CURRENT
Inventories – at cost 2,506 2,212
10. Other Assets
2016$’000
2015$’000
CURRENT
Prepayments 76 67
Other 98 58
174 125
For
per
sona
l use
onl
y
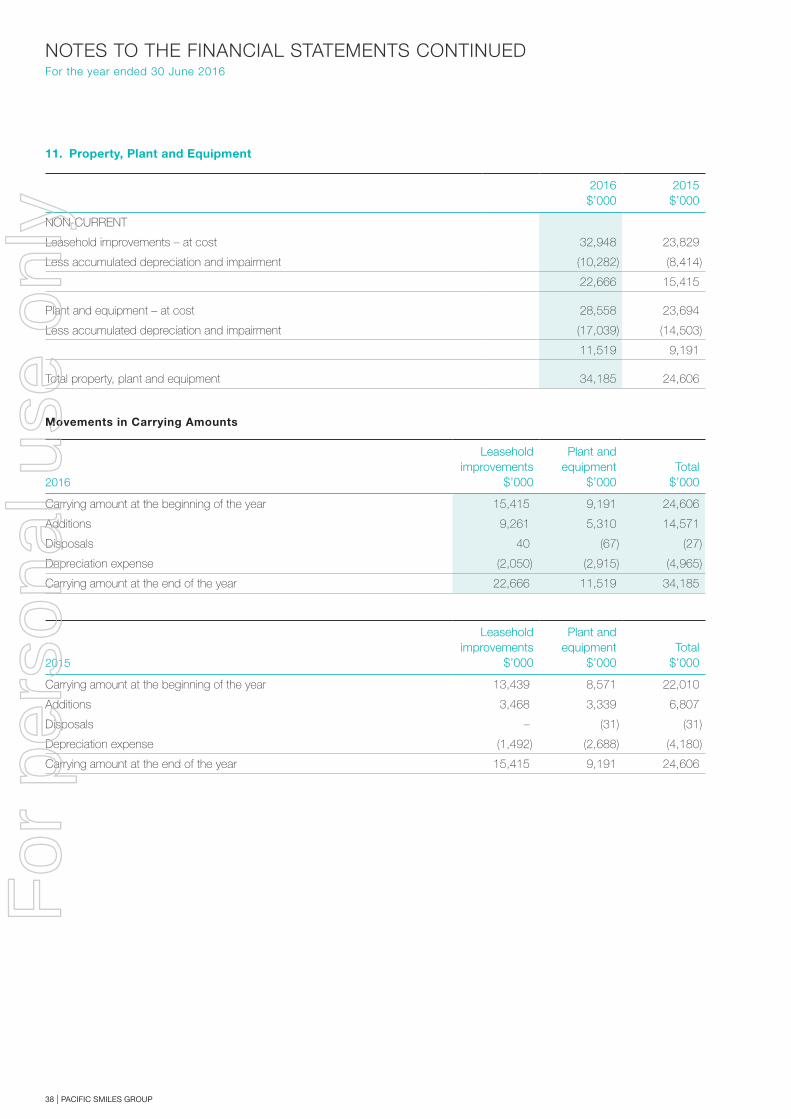
38 | PACIFIC SMILES GROUP
NOTES TO THE FINANCIAL STATEMENTS CONTINUEDFor the year ended 30 June 2016
11. Property, Plant and Equipment
2016
$’0002015$’000
NON-CURRENT
Leasehold improvements – at cost 32,948 23,829
Less accumulated depreciation and impairment (10,282) (8,414)
22,666 15,415
Plant and equipment – at cost 28,558 23,694
Less accumulated depreciation and impairment (17,039) (14,503)
11,519 9,191
Total property, plant and equipment 34,185 24,606
Movements in Carrying Amounts
2016
Leaseholdimprovements
$’000
Plant and equipment
$’000Total
$’000
Carrying amount at the beginning of the year 15,415 9,191 24,606
Additions 9,261 5,310 14,571
Disposals 40 (67) (27)
Depreciation expense (2,050) (2,915) (4,965)
Carrying amount at the end of the year 22,666 11,519 34,185
2015
Leaseholdimprovements
$’000
Plant and equipment
$’000Total
$’000
Carrying amount at the beginning of the year 13,439 8,571 22,010
Additions 3,468 3,339 6,807
Disposals – (31) (31)
Depreciation expense (1,492) (2,688) (4,180)
Carrying amount at the end of the year 15,415 9,191 24,606
For
per
sona
l use
onl
y
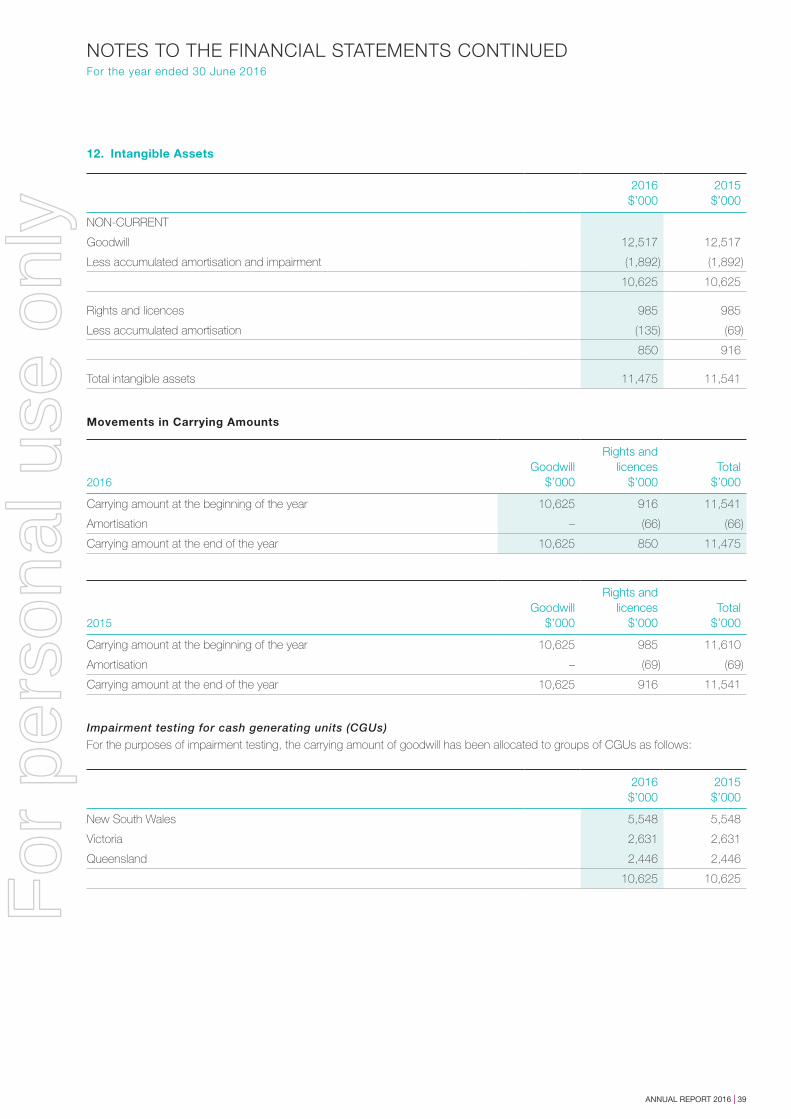
ANNUAL REPORT 2016 | 39
NOTES TO THE FINANCIAL STATEMENTS CONTINUEDFor the year ended 30 June 2016
12. Intangible Assets
2016$’000
2015$’000
NON-CURRENT
Goodwill 12,517 12,517
Less accumulated amortisation and impairment (1,892) (1,892)
10,625 10,625
Rights and licences 985 985
Less accumulated amortisation (135) (69)
850 916
Total intangible assets 11,475 11,541
Movements in Carrying Amounts
2016Goodwill
$’000
Rights and licences
$’000Total
$’000
Carrying amount at the beginning of the year 10,625 916 11,541
Amortisation – (66) (66)
Carrying amount at the end of the year 10,625 850 11,475
2015Goodwill
$’000
Rights and licences
$’000Total
$’000
Carrying amount at the beginning of the year 10,625 985 11,610
Amortisation – (69) (69)
Carrying amount at the end of the year 10,625 916 11,541
Impairment testing for cash generating units (CGUs)
For the purposes of impairment testing, the carrying amount of goodwill has been allocated to groups of CGUs as follows:
2016$’000
2015$’000
New South Wales 5,548 5,548
Victoria 2,631 2,631
Queensland 2,446 2,446
10,625 10,625For
per
sona
l use
onl
y
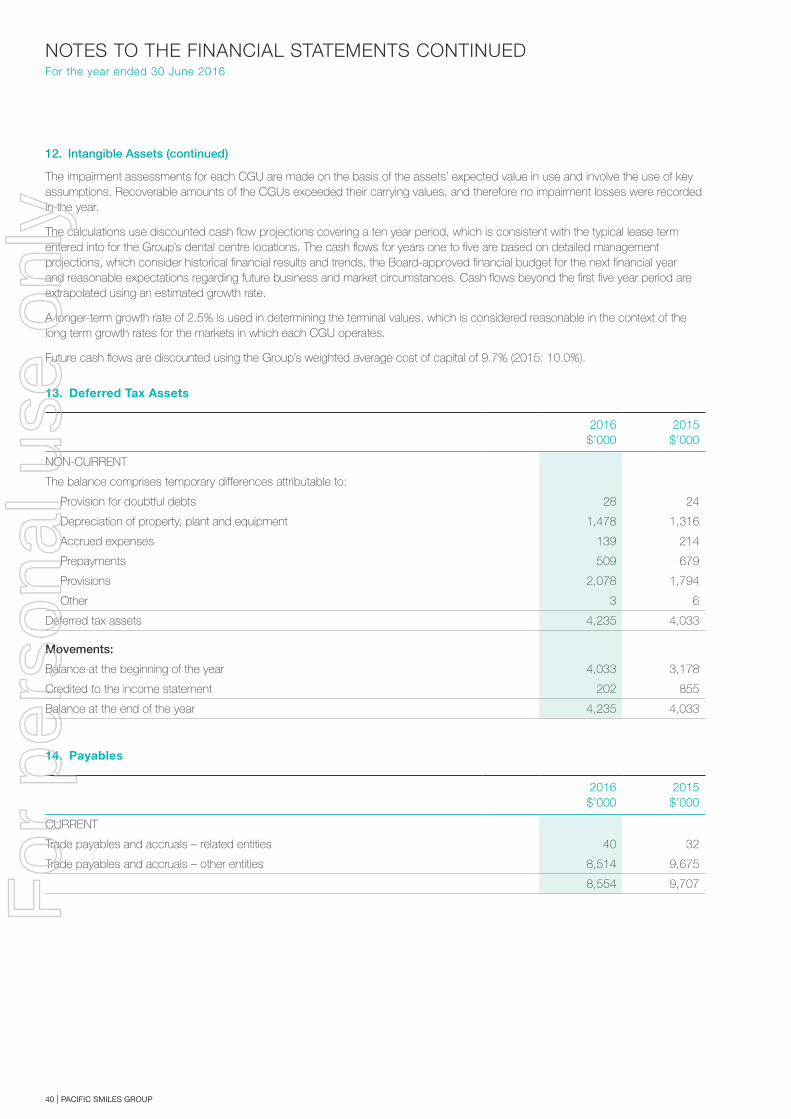
40 | PACIFIC SMILES GROUP
NOTES TO THE FINANCIAL STATEMENTS CONTINUEDFor the year ended 30 June 2016
12. Intangible Assets (continued)
The impairment assessments for each CGU are made on the basis of the assets’ expected value in use and involve the use of key assumptions. Recoverable amounts of the CGUs exceeded their carrying values, and therefore no impairment losses were recorded in the year.
The calculations use discounted cash flow projections covering a ten year period, which is consistent with the typical lease term entered into for the Group’s dental centre locations. The cash flows for years one to five are based on detailed management projections, which consider historical financial results and trends, the Board-approved financial budget for the next financial year and reasonable expectations regarding future business and market circumstances. Cash flows beyond the first five year period are extrapolated using an estimated growth rate.
A longer-term growth rate of 2.5% is used in determining the terminal values, which is considered reasonable in the context of the long term growth rates for the markets in which each CGU operates.
Future cash flows are discounted using the Group’s weighted average cost of capital of 9.7% (2015: 10.0%).
13. Deferred Tax Assets
2016$’000
2015$’000
NON-CURRENT
The balance comprises temporary differences attributable to:
Provision for doubtful debts 28 24
Depreciation of property, plant and equipment 1,478 1,316
Accrued expenses 139 214
Prepayments 509 679
Provisions 2,078 1,794
Other 3 6
Deferred tax assets 4,235 4,033
Movements:
Balance at the beginning of the year 4,033 3,178
Credited to the income statement 202 855
Balance at the end of the year 4,235 4,033
14. Payables
2016$’000
2015$’000
CURRENT
Trade payables and accruals – related entities 40 32
Trade payables and accruals – other entities 8,514 9,675
8,554 9,707For
per
sona
l use
onl
y
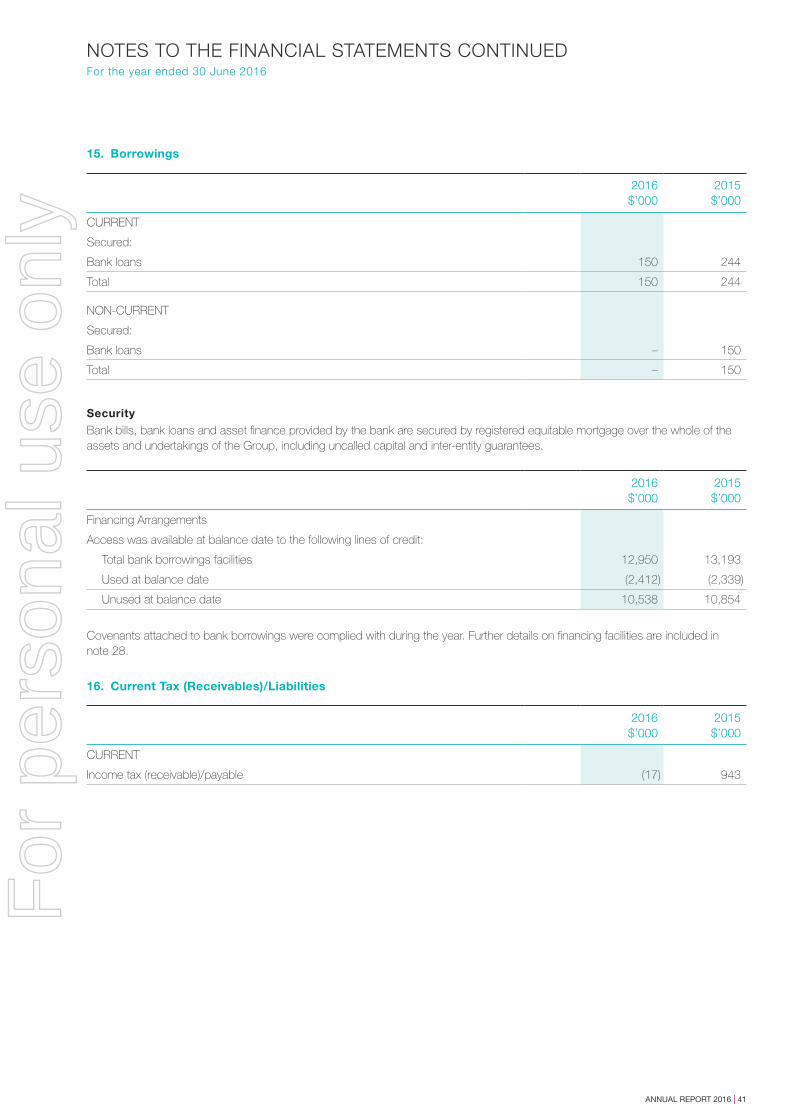
ANNUAL REPORT 2016 | 41
NOTES TO THE FINANCIAL STATEMENTS CONTINUEDFor the year ended 30 June 2016
15. Borrowings
2016$’000
2015$’000
CURRENT
Secured:
Bank loans 150 244
Total 150 244
NON-CURRENT
Secured:
Bank loans – 150
Total – 150
Security
Bank bills, bank loans and asset finance provided by the bank are secured by registered equitable mortgage over the whole of the assets and undertakings of the Group, including uncalled capital and inter-entity guarantees.
2016$’000
2015$’000
Financing Arrangements
Access was available at balance date to the following lines of credit:
Total bank borrowings facilities 12,950 13,193
Used at balance date (2,412) (2,339)
Unused at balance date 10,538 10,854
Covenants attached to bank borrowings were complied with during the year. Further details on financing facilities are included in note 28.
16. Current Tax (Receivables)/Liabilities
2016$’000
2015$’000
CURRENT
Income tax (receivable)/payable (17) 943
For
per
sona
l use
onl
y
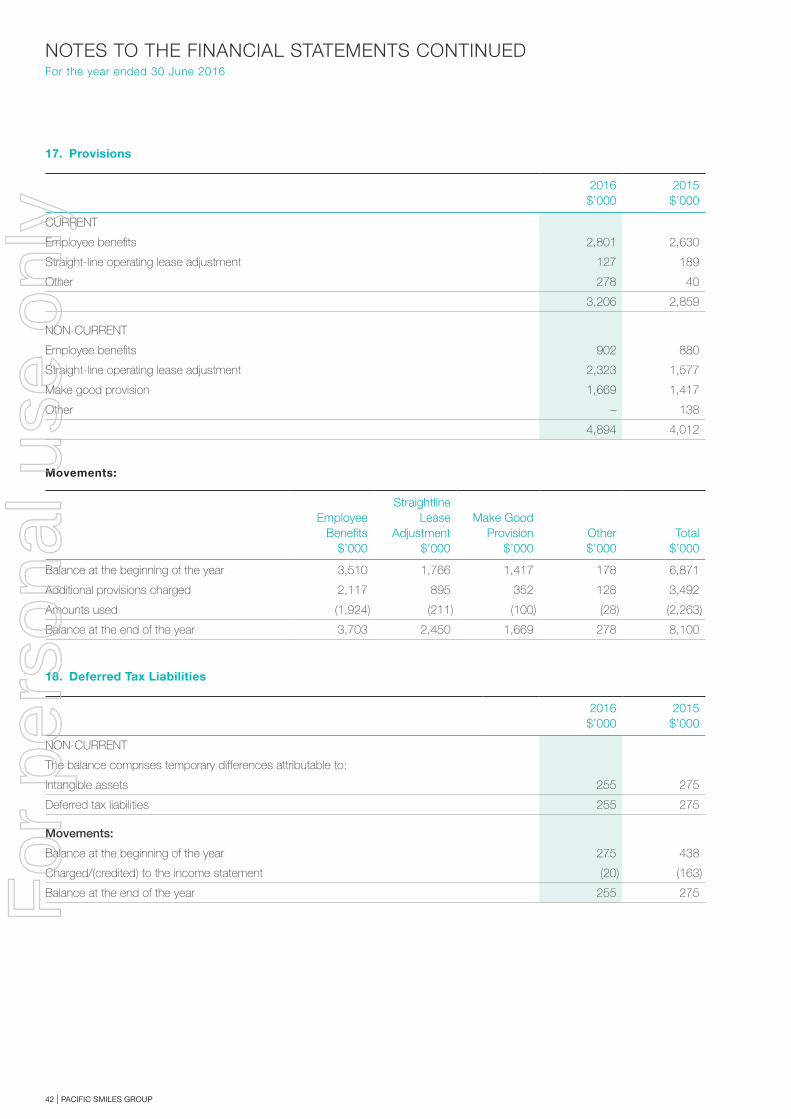
42 | PACIFIC SMILES GROUP
NOTES TO THE FINANCIAL STATEMENTS CONTINUEDFor the year ended 30 June 2016
17. Provisions
2016$’000
2015$’000
CURRENT
Employee benefits 2,801 2,630
Straight-line operating lease adjustment 127 189
Other 278 40
3,206 2,859
NON-CURRENT
Employee benefits 902 880
Straight-line operating lease adjustment 2,323 1,577
Make good provision 1,669 1,417
Other – 138
4,894 4,012
Movements:
Employee Benefits
$’000
Straightline Lease
Adjustment$’000
Make Good Provision
$’000Other$’000
Total$’000
Balance at the beginning of the year 3,510 1,766 1,417 178 6,871
Additional provisions charged 2,117 895 352 128 3,492
Amounts used (1,924) (211) (100) (28) (2,263)
Balance at the end of the year 3,703 2,450 1,669 278 8,100
18. Deferred Tax Liabilities
2016$’000
2015$’000
NON-CURRENT
The balance comprises temporary differences attributable to:
Intangible assets 255 275
Deferred tax liabilities 255 275
Movements:
Balance at the beginning of the year 275 438
Charged/(credited) to the income statement (20) (163)
Balance at the end of the year 255 275For
per
sona
l use
onl
y
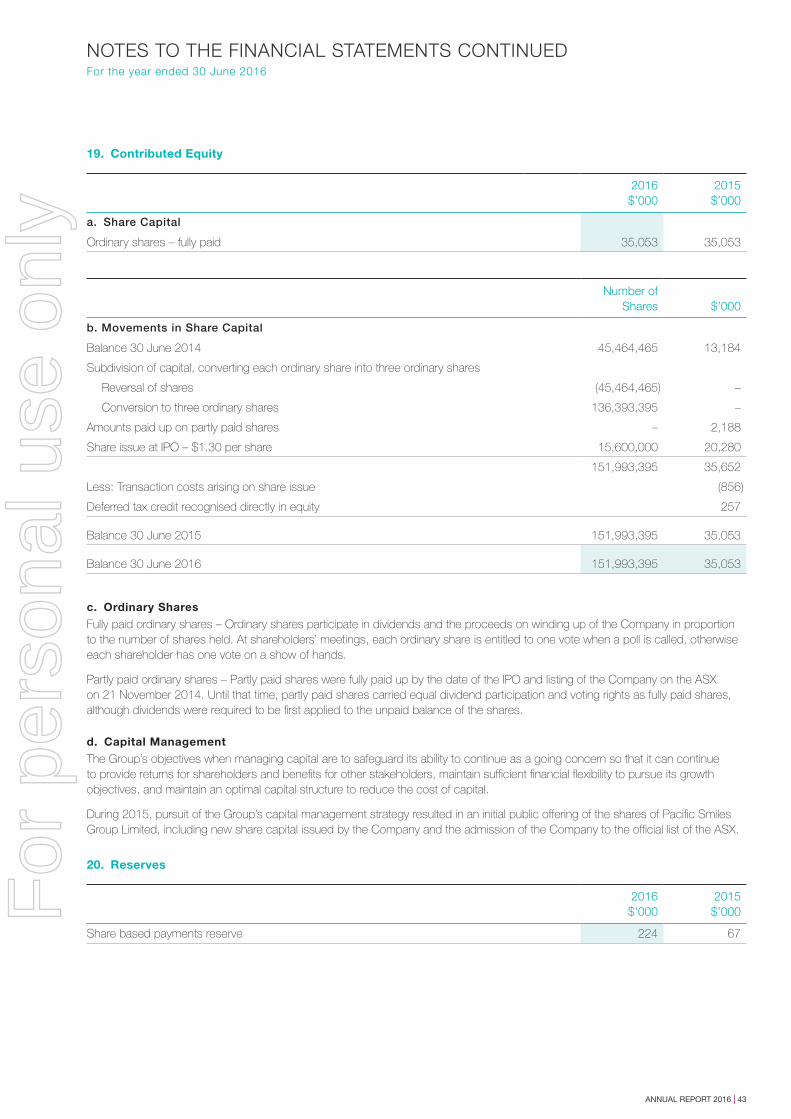
ANNUAL REPORT 2016 | 43
NOTES TO THE FINANCIAL STATEMENTS CONTINUEDFor the year ended 30 June 2016
19. Contributed Equity
2016$’000
2015$’000
a. Share Capital
Ordinary shares – fully paid 35,053 35,053
Number of Shares $’000
b. Movements in Share Capital
Balance 30 June 2014 45,464,465 13,184
Subdivision of capital, converting each ordinary share into three ordinary shares
Reversal of shares (45,464,465) –
Conversion to three ordinary shares 136,393,395 –
Amounts paid up on partly paid shares – 2,188
Share issue at IPO – $1.30 per share 15,600,000 20,280
151,993,395 35,652
Less: Transaction costs arising on share issue (856)
Deferred tax credit recognised directly in equity 257
Balance 30 June 2015 151,993,395 35,053
Balance 30 June 2016 151,993,395 35,053
c. Ordinary Shares
Fully paid ordinary shares – Ordinary shares participate in dividends and the proceeds on winding up of the Company in proportion to the number of shares held. At shareholders’ meetings, each ordinary share is entitled to one vote when a poll is called, otherwise each shareholder has one vote on a show of hands.
Partly paid ordinary shares – Partly paid shares were fully paid up by the date of the IPO and listing of the Company on the ASX on 21 November 2014. Until that time, partly paid shares carried equal dividend participation and voting rights as fully paid shares, although dividends were required to be first applied to the unpaid balance of the shares.
d. Capital Management
The Group’s objectives when managing capital are to safeguard its ability to continue as a going concern so that it can continue to provide returns for shareholders and benefits for other stakeholders, maintain sufficient financial flexibility to pursue its growth objectives, and maintain an optimal capital structure to reduce the cost of capital.
During 2015, pursuit of the Group’s capital management strategy resulted in an initial public offering of the shares of Pacific Smiles Group Limited, including new share capital issued by the Company and the admission of the Company to the official list of the ASX.
20. Reserves
2016$’000
2015$’000
Share based payments reserve 224 67
For
per
sona
l use
onl
y
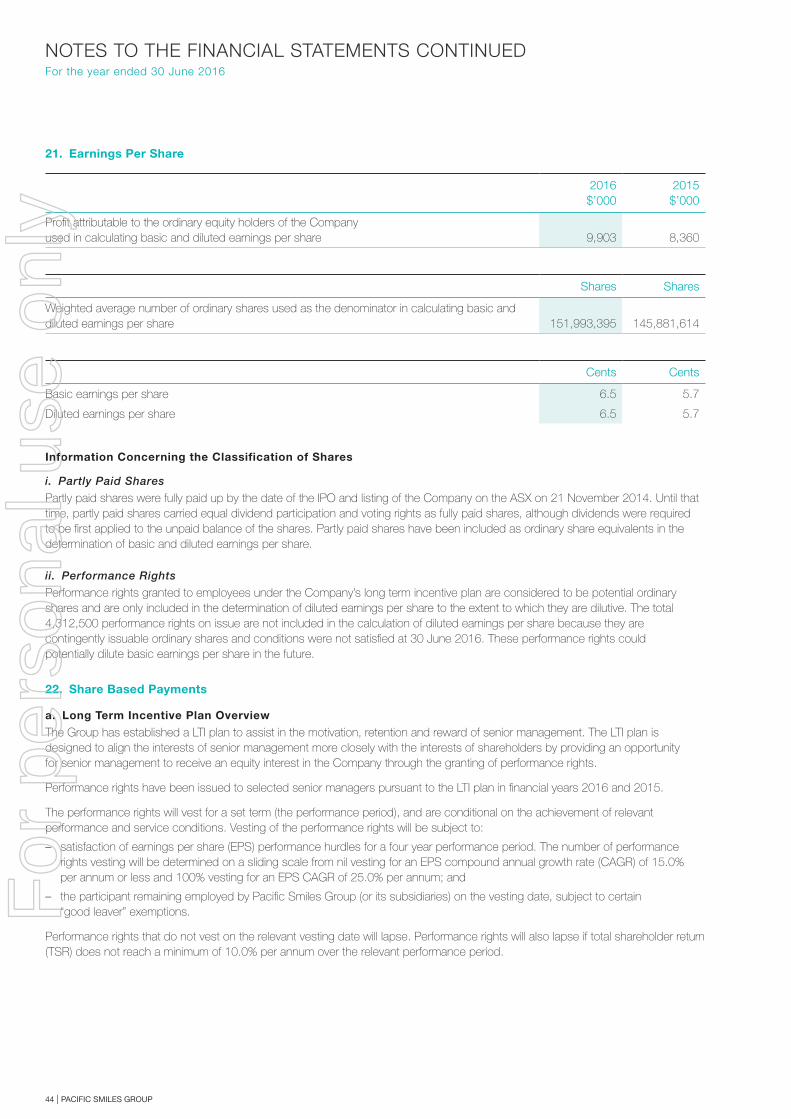
44 | PACIFIC SMILES GROUP
NOTES TO THE FINANCIAL STATEMENTS CONTINUEDFor the year ended 30 June 2016
21. Earnings Per Share
2016$’000
2015$’000
Profit attributable to the ordinary equity holders of the Companyused in calculating basic and diluted earnings per share 9,903 8,360
Shares Shares
Weighted average number of ordinary shares used as the denominator in calculating basic and diluted earnings per share 151,993,395 145,881,614
Cents Cents
Basic earnings per share 6.5 5.7
Diluted earnings per share 6.5 5.7
Information Concerning the Classification of Shares
i. Partly Paid Shares
Partly paid shares were fully paid up by the date of the IPO and listing of the Company on the ASX on 21 November 2014. Until that time, partly paid shares carried equal dividend participation and voting rights as fully paid shares, although dividends were required to be first applied to the unpaid balance of the shares. Partly paid shares have been included as ordinary share equivalents in the determination of basic and diluted earnings per share.
ii. Performance Rights
Performance rights granted to employees under the Company’s long term incentive plan are considered to be potential ordinary shares and are only included in the determination of diluted earnings per share to the extent to which they are dilutive. The total 4,312,500 performance rights on issue are not included in the calculation of diluted earnings per share because they are contingently issuable ordinary shares and conditions were not satisfied at 30 June 2016. These performance rights could potentially dilute basic earnings per share in the future.
22. Share Based Payments
a. Long Term Incentive Plan Overview
The Group has established a LTI plan to assist in the motivation, retention and reward of senior management. The LTI plan is designed to align the interests of senior management more closely with the interests of shareholders by providing an opportunity for senior management to receive an equity interest in the Company through the granting of performance rights.
Performance rights have been issued to selected senior managers pursuant to the LTI plan in financial years 2016 and 2015.
The performance rights will vest for a set term (the performance period), and are conditional on the achievement of relevant performance and service conditions. Vesting of the performance rights will be subject to:
– satisfaction of earnings per share (EPS) performance hurdles for a four year performance period. The number of performance rights vesting will be determined on a sliding scale from nil vesting for an EPS compound annual growth rate (CAGR) of 15.0% per annum or less and 100% vesting for an EPS CAGR of 25.0% per annum; and
– the participant remaining employed by Pacific Smiles Group (or its subsidiaries) on the vesting date, subject to certain “good leaver” exemptions.
Performance rights that do not vest on the relevant vesting date will lapse. Performance rights will also lapse if total shareholder return (TSR) does not reach a minimum of 10.0% per annum over the relevant performance period.
For
per
sona
l use
onl
y
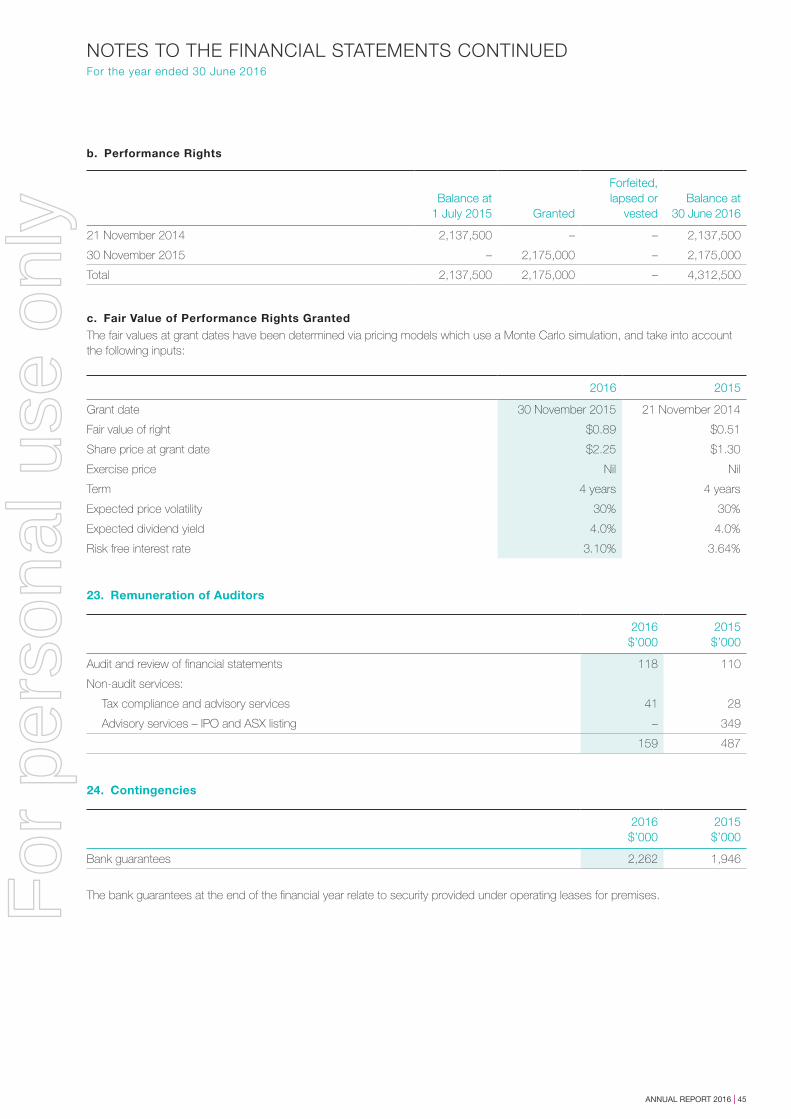
ANNUAL REPORT 2016 | 45
NOTES TO THE FINANCIAL STATEMENTS CONTINUEDFor the year ended 30 June 2016
b. Performance Rights
Balance at 1 July 2015 Granted
Forfeited, lapsed or
vestedBalance at
30 June 2016
21 November 2014 2,137,500 – – 2,137,500
30 November 2015 – 2,175,000 – 2,175,000
Total 2,137,500 2,175,000 – 4,312,500
c. Fair Value of Performance Rights Granted
The fair values at grant dates have been determined via pricing models which use a Monte Carlo simulation, and take into account the following inputs:
2016 2015
Grant date 30 November 2015 21 November 2014
Fair value of right $0.89 $0.51
Share price at grant date $2.25 $1.30
Exercise price Nil Nil
Term 4 years 4 years
Expected price volatility 30% 30%
Expected dividend yield 4.0% 4.0%
Risk free interest rate 3.10% 3.64%
23. Remuneration of Auditors
2016$’000
2015$’000
Audit and review of financial statements 118 110
Non-audit services:
Tax compliance and advisory services 41 28
Advisory services – IPO and ASX listing – 349
159 487
24. Contingencies
2016$’000
2015$’000
Bank guarantees 2,262 1,946
The bank guarantees at the end of the financial year relate to security provided under operating leases for premises.For
per
sona
l use
onl
y
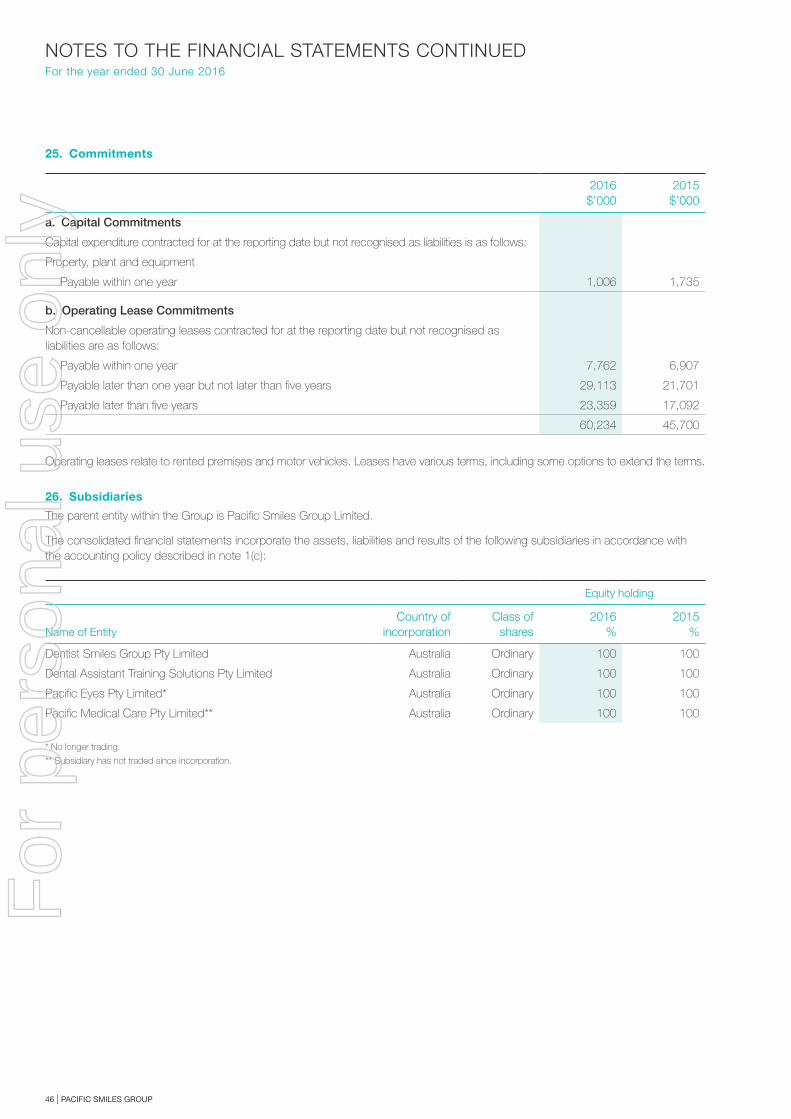
46 | PACIFIC SMILES GROUP
NOTES TO THE FINANCIAL STATEMENTS CONTINUEDFor the year ended 30 June 2016
25. Commitments
2016$’000
2015$’000
a. Capital Commitments
Capital expenditure contracted for at the reporting date but not recognised as liabilities is as follows:
Property, plant and equipment
Payable within one year 1,006 1,735
b. Operating Lease Commitments
Non-cancellable operating leases contracted for at the reporting date but not recognised as liabilities are as follows:
Payable within one year 7,762 6,907
Payable later than one year but not later than five years 29,113 21,701
Payable later than five years 23,359 17,092
60,234 45,700
Operating leases relate to rented premises and motor vehicles. Leases have various terms, including some options to extend the terms.
26. Subsidiaries
The parent entity within the Group is Pacific Smiles Group Limited.
The consolidated financial statements incorporate the assets, liabilities and results of the following subsidiaries in accordance with the accounting policy described in note 1(c):
Equity holding
Name of EntityCountry of
incorporationClass of
shares2016
%2015
%
Dentist Smiles Group Pty Limited Australia Ordinary 100 100
Dental Assistant Training Solutions Pty Limited Australia Ordinary 100 100
Pacific Eyes Pty Limited* Australia Ordinary 100 100
Pacific Medical Care Pty Limited** Australia Ordinary 100 100
* No longer trading.
** Subsidiary has not traded since incorporation.
For
per
sona
l use
onl
y
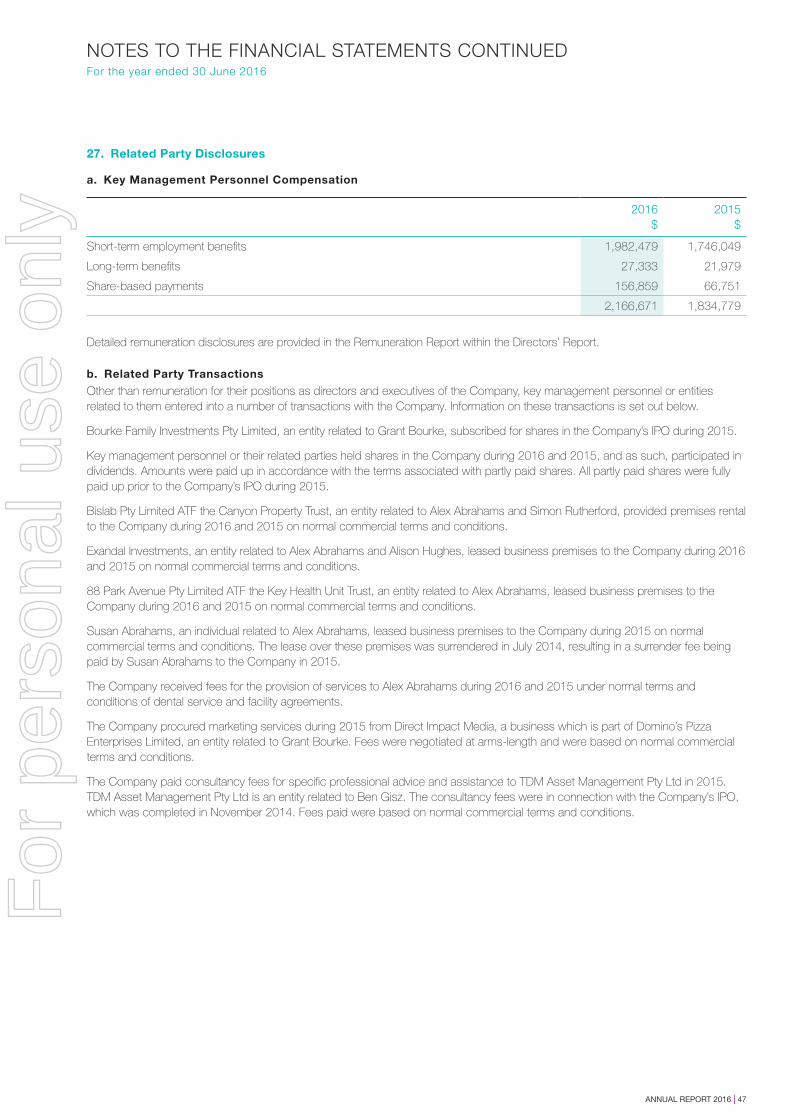
ANNUAL REPORT 2016 | 47
NOTES TO THE FINANCIAL STATEMENTS CONTINUEDFor the year ended 30 June 2016
27. Related Party Disclosures
a. Key Management Personnel Compensation
2016$
2015$
Short-term employment benefits 1,982,479 1,746,049
Long-term benefits 27,333 21,979
Share-based payments 156,859 66,751
2,166,671 1,834,779
Detailed remuneration disclosures are provided in the Remuneration Report within the Directors’ Report.
b. Related Party Transactions
Other than remuneration for their positions as directors and executives of the Company, key management personnel or entities related to them entered into a number of transactions with the Company. Information on these transactions is set out below.
Bourke Family Investments Pty Limited, an entity related to Grant Bourke, subscribed for shares in the Company’s IPO during 2015.
Key management personnel or their related parties held shares in the Company during 2016 and 2015, and as such, participated in dividends. Amounts were paid up in accordance with the terms associated with partly paid shares. All partly paid shares were fully paid up prior to the Company’s IPO during 2015.
Bislab Pty Limited ATF the Canyon Property Trust, an entity related to Alex Abrahams and Simon Rutherford, provided premises rental to the Company during 2016 and 2015 on normal commercial terms and conditions.
Exandal Investments, an entity related to Alex Abrahams and Alison Hughes, leased business premises to the Company during 2016 and 2015 on normal commercial terms and conditions.
88 Park Avenue Pty Limited ATF the Key Health Unit Trust, an entity related to Alex Abrahams, leased business premises to the Company during 2016 and 2015 on normal commercial terms and conditions.
Susan Abrahams, an individual related to Alex Abrahams, leased business premises to the Company during 2015 on normal commercial terms and conditions. The lease over these premises was surrendered in July 2014, resulting in a surrender fee being paid by Susan Abrahams to the Company in 2015.
The Company received fees for the provision of services to Alex Abrahams during 2016 and 2015 under normal terms and conditions of dental service and facility agreements.
The Company procured marketing services during 2015 from Direct Impact Media, a business which is part of Domino’s Pizza Enterprises Limited, an entity related to Grant Bourke. Fees were negotiated at arms-length and were based on normal commercial terms and conditions.
The Company paid consultancy fees for specific professional advice and assistance to TDM Asset Management Pty Ltd in 2015. TDM Asset Management Pty Ltd is an entity related to Ben Gisz. The consultancy fees were in connection with the Company’s IPO, which was completed in November 2014. Fees paid were based on normal commercial terms and conditions.
For
per
sona
l use
onl
y
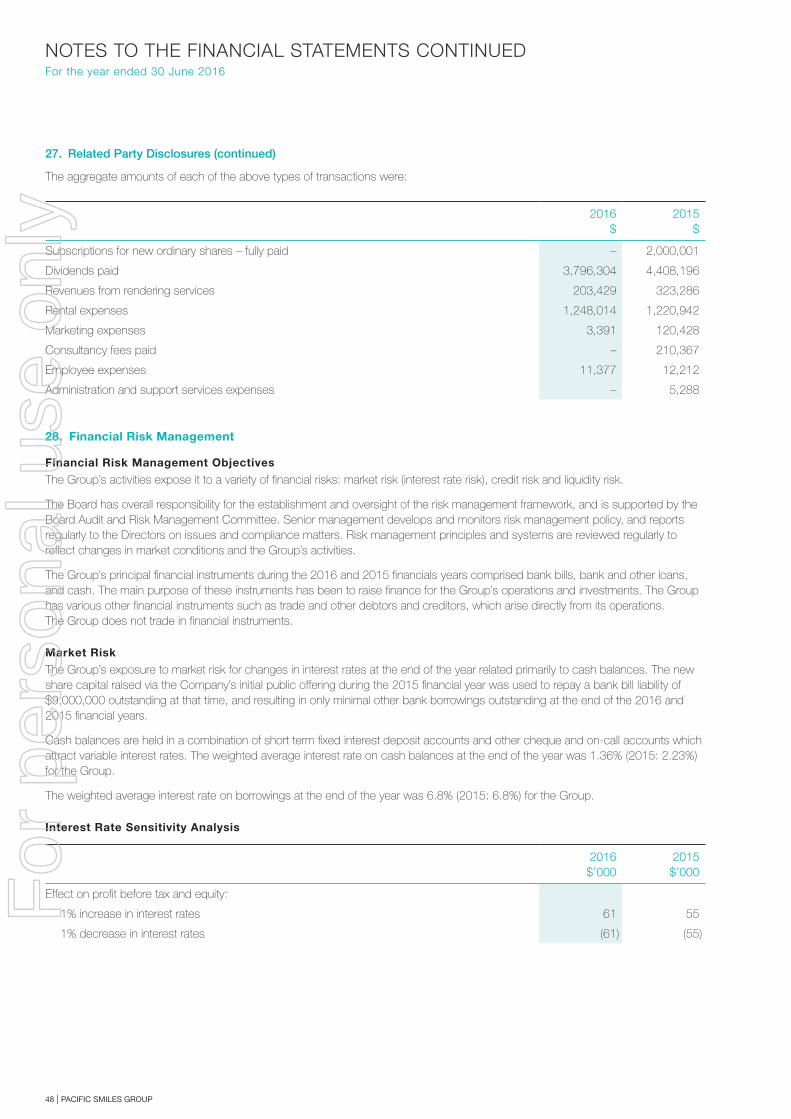
48 | PACIFIC SMILES GROUP
NOTES TO THE FINANCIAL STATEMENTS CONTINUEDFor the year ended 30 June 2016
27. Related Party Disclosures (continued)
The aggregate amounts of each of the above types of transactions were:
2016$
2015$
Subscriptions for new ordinary shares – fully paid – 2,000,001
Dividends paid 3,796,304 4,408,196
Revenues from rendering services 203,429 323,286
Rental expenses 1,248,014 1,220,942
Marketing expenses 3,391 120,428
Consultancy fees paid – 210,367
Employee expenses 11,377 12,212
Administration and support services expenses – 5,288
28. Financial Risk Management
Financial Risk Management Objectives
The Group’s activities expose it to a variety of financial risks: market risk (interest rate risk), credit risk and liquidity risk.
The Board has overall responsibility for the establishment and oversight of the risk management framework, and is supported by the Board Audit and Risk Management Committee. Senior management develops and monitors risk management policy, and reports regularly to the Directors on issues and compliance matters. Risk management principles and systems are reviewed regularly to reflect changes in market conditions and the Group’s activities.
The Group’s principal financial instruments during the 2016 and 2015 financials years comprised bank bills, bank and other loans, and cash. The main purpose of these instruments has been to raise finance for the Group’s operations and investments. The Group has various other financial instruments such as trade and other debtors and creditors, which arise directly from its operations. The Group does not trade in financial instruments.
Market Risk
The Group’s exposure to market risk for changes in interest rates at the end of the year related primarily to cash balances. The new share capital raised via the Company’s initial public offering during the 2015 financial year was used to repay a bank bill liability of $9,000,000 outstanding at that time, and resulting in only minimal other bank borrowings outstanding at the end of the 2016 and 2015 financial years.
Cash balances are held in a combination of short term fixed interest deposit accounts and other cheque and on-call accounts which attract variable interest rates. The weighted average interest rate on cash balances at the end of the year was 1.36% (2015: 2.23%) for the Group.
The weighted average interest rate on borrowings at the end of the year was 6.8% (2015: 6.8%) for the Group.
Interest Rate Sensitivity Analysis
2016$’000
2015$’000
Effect on profit before tax and equity:
1% increase in interest rates 61 55
1% decrease in interest rates (61) (55)
For
per
sona
l use
onl
y
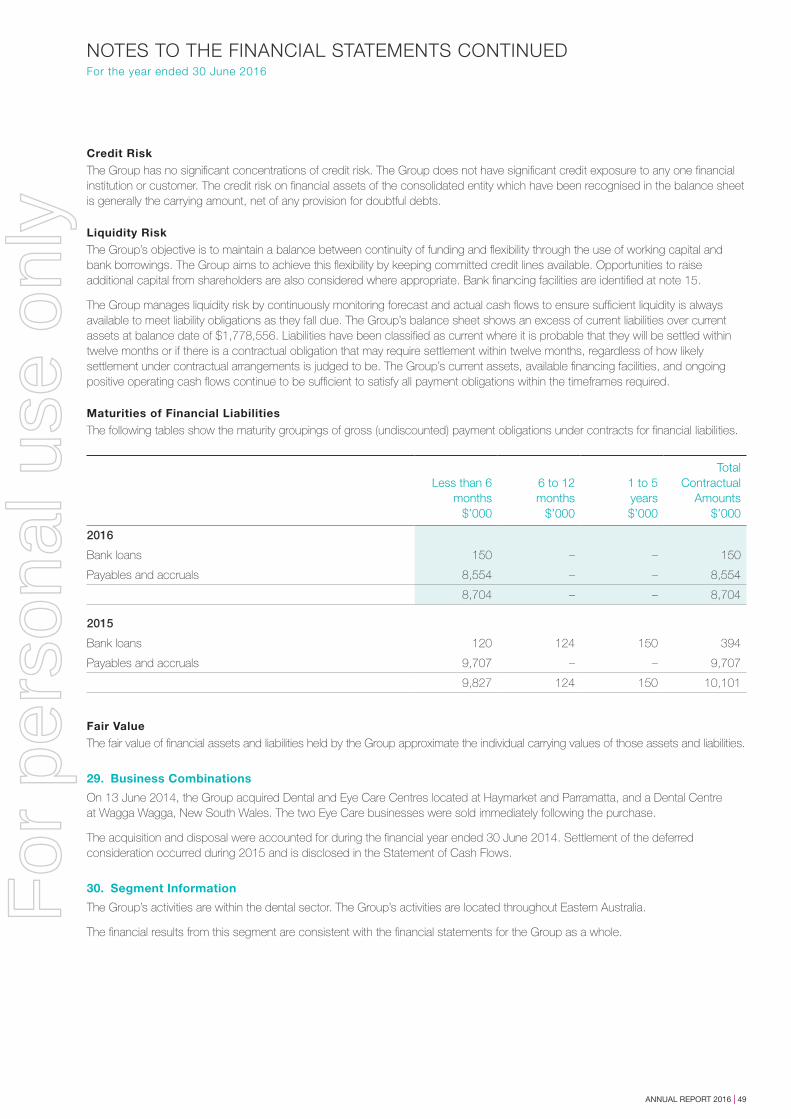
ANNUAL REPORT 2016 | 49
NOTES TO THE FINANCIAL STATEMENTS CONTINUEDFor the year ended 30 June 2016
Credit Risk
The Group has no significant concentrations of credit risk. The Group does not have significant credit exposure to any one financial institution or customer. The credit risk on financial assets of the consolidated entity which have been recognised in the balance sheet is generally the carrying amount, net of any provision for doubtful debts.
Liquidity Risk
The Group’s objective is to maintain a balance between continuity of funding and flexibility through the use of working capital and bank borrowings. The Group aims to achieve this flexibility by keeping committed credit lines available. Opportunities to raise additional capital from shareholders are also considered where appropriate. Bank financing facilities are identified at note 15.
The Group manages liquidity risk by continuously monitoring forecast and actual cash flows to ensure sufficient liquidity is always available to meet liability obligations as they fall due. The Group’s balance sheet shows an excess of current liabilities over current assets at balance date of $1,778,556. Liabilities have been classified as current where it is probable that they will be settled within twelve months or if there is a contractual obligation that may require settlement within twelve months, regardless of how likely settlement under contractual arrangements is judged to be. The Group’s current assets, available financing facilities, and ongoing positive operating cash flows continue to be sufficient to satisfy all payment obligations within the timeframes required.
Maturities of Financial Liabilities
The following tables show the maturity groupings of gross (undiscounted) payment obligations under contracts for financial liabilities.
Less than 6 months
$’000
6 to 12 months
$’000
1 to 5years$’000
Total Contractual
Amounts $’000
2016
Bank loans 150 – – 150
Payables and accruals 8,554 – – 8,554
8,704 – – 8,704
2015
Bank loans 120 124 150 394
Payables and accruals 9,707 – – 9,707
9,827 124 150 10,101
Fair Value
The fair value of financial assets and liabilities held by the Group approximate the individual carrying values of those assets and liabilities.
29. Business Combinations
On 13 June 2014, the Group acquired Dental and Eye Care Centres located at Haymarket and Parramatta, and a Dental Centre at Wagga Wagga, New South Wales. The two Eye Care businesses were sold immediately following the purchase.
The acquisition and disposal were accounted for during the financial year ended 30 June 2014. Settlement of the deferred consideration occurred during 2015 and is disclosed in the Statement of Cash Flows.
30. Segment Information
The Group’s activities are within the dental sector. The Group’s activities are located throughout Eastern Australia.
The financial results from this segment are consistent with the financial statements for the Group as a whole.
For
per
sona
l use
onl
y
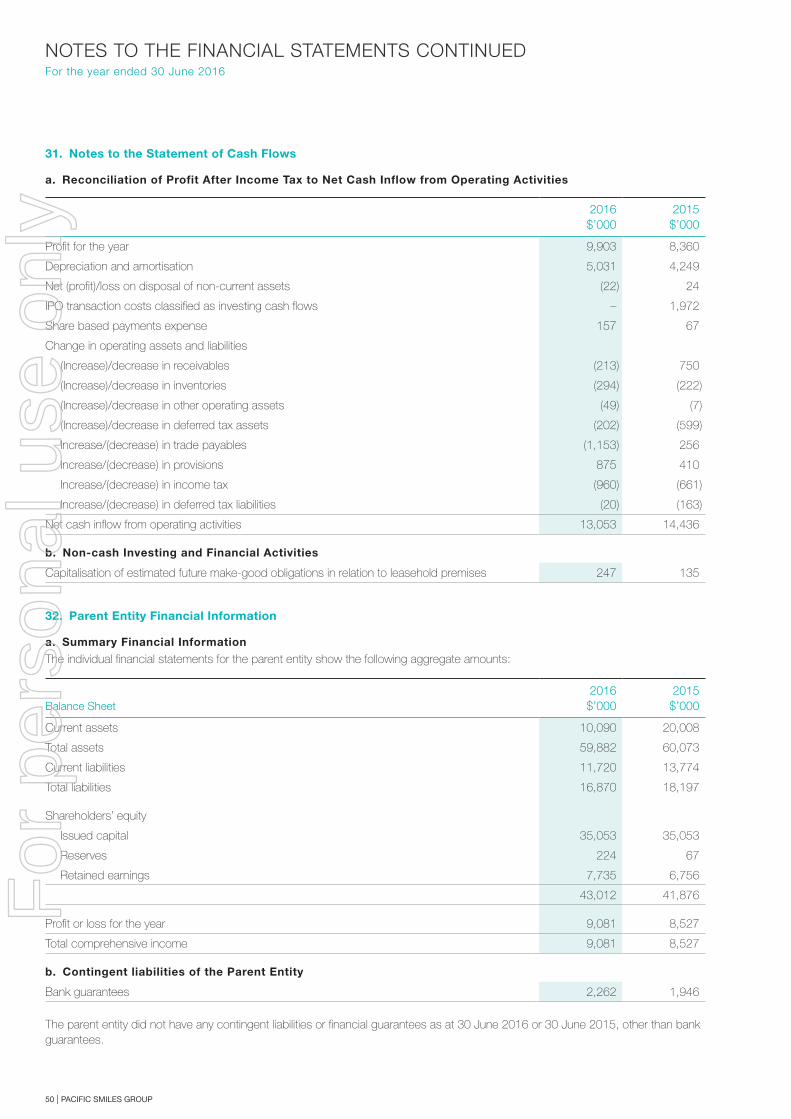
50 | PACIFIC SMILES GROUP
NOTES TO THE FINANCIAL STATEMENTS CONTINUEDFor the year ended 30 June 2016
31. Notes to the Statement of Cash Flows
a. Reconciliation of Profit After Income Tax to Net Cash Inflow from Operating Activities
2016$’000
2015$’000
Profit for the year 9,903 8,360
Depreciation and amortisation 5,031 4,249
Net (profit)/loss on disposal of non-current assets (22) 24
IPO transaction costs classified as investing cash flows – 1,972
Share based payments expense 157 67
Change in operating assets and liabilities
(Increase)/decrease in receivables (213) 750
(Increase)/decrease in inventories (294) (222)
(Increase)/decrease in other operating assets (49) (7)
(Increase)/decrease in deferred tax assets (202) (599)
Increase/(decrease) in trade payables (1,153) 256
Increase/(decrease) in provisions 875 410
Increase/(decrease) in income tax (960) (661)
Increase/(decrease) in deferred tax liabilities (20) (163)
Net cash inflow from operating activities 13,053 14,436
b. Non-cash Investing and Financial Activities
Capitalisation of estimated future make-good obligations in relation to leasehold premises 247 135
32. Parent Entity Financial Information
a. Summary Financial Information
The individual financial statements for the parent entity show the following aggregate amounts:
Balance Sheet2016
$’0002015$’000
Current assets 10,090 20,008
Total assets 59,882 60,073
Current liabilities 11,720 13,774
Total liabilities 16,870 18,197
Shareholders’ equity
Issued capital 35,053 35,053
Reserves 224 67
Retained earnings 7,735 6,756
43,012 41,876
Profit or loss for the year 9,081 8,527
Total comprehensive income 9,081 8,527
b. Contingent liabilities of the Parent Entity
Bank guarantees 2,262 1,946
The parent entity did not have any contingent liabilities or financial guarantees as at 30 June 2016 or 30 June 2015, other than bank guarantees.
For
per
sona
l use
onl
y
ANNUAL REPORT 2016 | 51
DIRECTORS’ DECLARATION
In the directors’ opinion:
a. the financial statements and notes set out on pages 25 to 50 are in accordance with the Corporations Act 2001, including:
i. giving a true and fair view of the consolidated entity’s financial position as at 30 June 2016 and of its performance for the financial year ended on that date;
ii. complying with Australian Accounting Standards, the Corporations Regulations 2001 and other mandatory professional reporting requirements; and
b. there are reasonable grounds to believe that the Company will be able to pay its debts as and when they become due and payable.
Note 1 confirms that the financial statements comply with International Financial Reporting Standards as issued by the International Accounting Standards Board.
The directors have been given the declarations by the Chief Executive Officer and Chief Financial Officer required by section 295A of the Corporations Act 2001.
This declaration is made in accordance with a resolution of the Board of Directors.
Robert Cameron AOChairman
Greenhills18 August 2016
For
per
sona
l use
onl
y
52 | PACIFIC SMILES GROUP
INDEPENDENT AUDITOR’S REPORT
KPMG, an Australian partnership and a member firm of the KPMG network of independent member firms affiliated with KPMG International Cooperative (“KPMG International”), a Swiss entity.
Liability limited by a scheme approved under Profession Standards Legislation.
Independent auditor’s report to the members of Pacific Smiles Group Limited
Report on the financial report We have audited the accompanying financial report of Pacific Smiles Group Limited (the “Company”), which comprises the consolidated balance sheet as at 30 June 2016, and consolidated statement of profit and loss and other comprehensive income, consolidated statement of changes in equity and consolidated statement of cash flows for the year ended on that date, notes 1 to 32 comprising a summary of significant accounting policies and other explanatory information and the directors’ declaration of the Group comprising the Company and the entities it controlled at the year’s end or from time to time during the financial year.
Directors’ responsibility for the financial report
The directors of the Company are responsible for the preparation of the financial report that gives a true and fair view in accordance with Australian Accounting Standards and the Corporations Act 2001 and for such internal control as the directors determine is necessary to enable the preparation of the financial report that is free from material misstatement whether due to fraud or error. In note 1(b), the directors also state, in accordance with Australian Accounting Standard AASB 101 Presentation of Financial Statements, that the financial statements of the Group comply with International Financial Reporting Standards.
Auditor’s responsibility
Our responsibility is to express an opinion on the financial report based on our audit. We conducted our audit in accordance with Australian Auditing Standards. These Auditing Standards require that we comply with relevant ethical requirements relating to audit engagements and plan and perform the audit to obtain reasonable assurance whether the financial report is free from material misstatement.
An audit involves performing procedures to obtain audit evidence about the amounts and disclosures in the financial report. The procedures selected depend on the auditor’s judgement, including the assessment of the risks of material misstatement of the financial report, whether due to fraud or error. In making those risk assessments, the auditor considers internal control relevant to the entity’s preparation of the financial report that gives a true and fair view in order to design audit procedures that are appropriate in the circumstances, but not for the purpose of expressing an opinion on the effectiveness of the entity’s internal control. An audit also includes evaluating the appropriateness of accounting policies used and the reasonableness of accounting estimates made by the directors, as well as evaluating the overall presentation of the financial report. We performed the procedures to assess whether in all material respects the financial report presents fairly, in accordance with the Corporations Act 2001 and Australian Accounting Standards, a true and fair view which is consistent with our understanding of the Group’s financial position and of their performance.
We believe that the audit evidence we have obtained is sufficient and appropriate to provide a basis for our audit opinion.
For
per
sona
l use
onl
y
ANNUAL REPORT 2016 | 53
INDEPENDENT AUDITOR’S REPORT CONTINUED
Independent auditor’s report to the members of Pacific Smiles Group Limited (continued)
Independence
In conducting our audit, we have complied with the independence requirements of the Corporations Act 2001.
Auditor’s opinion In our opinion:
(a) the financial report of the Group is in accordance with the Corporations Act 2001, including:
(i) giving a true and fair view of the Group’s financial position asat 30 June 2016 and of its performance for the year ended on that date; and
(ii) complying with Australian Accounting Standards and the Corporations Regulations2001.
(b) the financial report also complies with International Financial Reporting Standards asdisclosed in note 1(b).
Report on the remuneration report We have audited the Remuneration Report included in pages 17 to 23 of the directors’ report for the year ended 30 June 2016. The directors of the company are responsible for the preparation and presentation of the remuneration report in accordance with Section 300A of the Corporations Act 2001. Our responsibility is to express an opinion on the remuneration report, based on our audit conducted in accordance with auditing standards.
Auditor’s opinion
In our opinion, the remuneration report of Pacific Smiles Group Limited for the year ended 30 June 2016, complies with Section 300A of the Corporations Act 2001.
KPMG
Chris Allenby Partner
Sydney
18 August 2016
For
per
sona
l use
onl
y
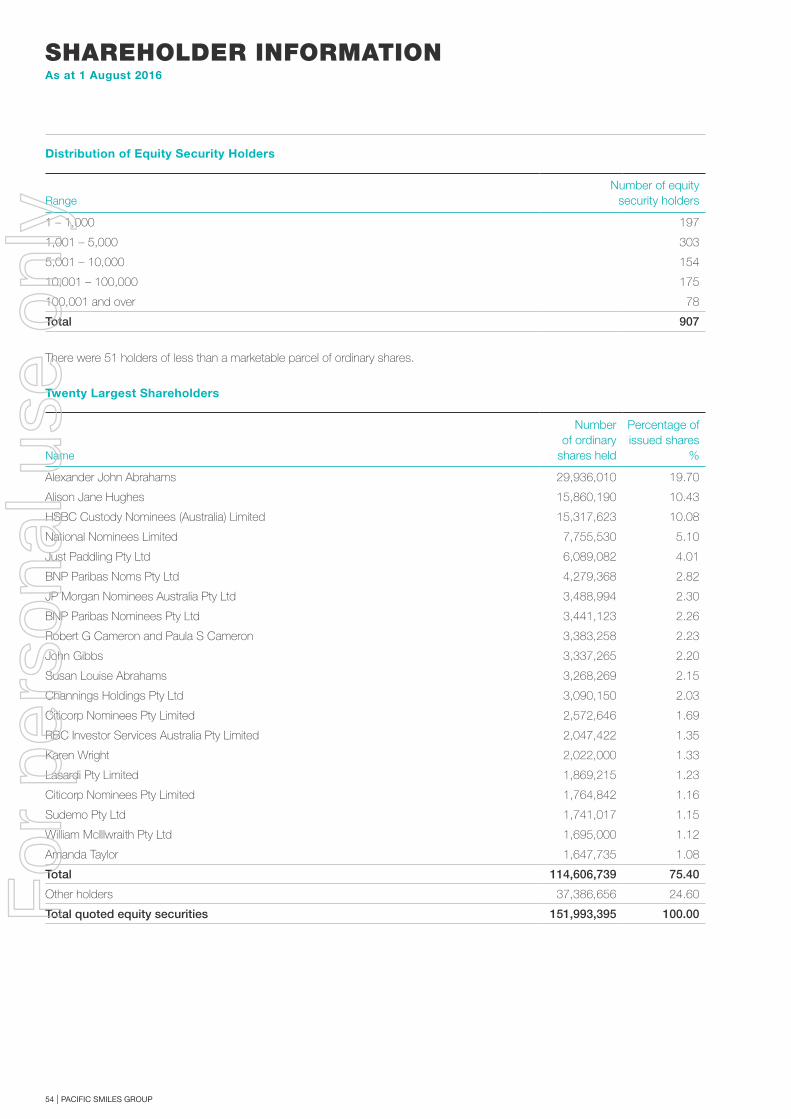
54 | PACIFIC SMILES GROUP
SHAREHOLDER INFORMATIONAs at 1 August 2016
Distribution of Equity Security Holders
RangeNumber of equity
security holders
1 – 1,000 197
1,001 – 5,000 303
5,001 – 10,000 154
10,001 – 100,000 175
100,001 and over 78
Total 907
There were 51 holders of less than a marketable parcel of ordinary shares.
Twenty Largest Shareholders
Name
Number of ordinary
shares held
Percentage of issued shares
%
Alexander John Abrahams 29,936,010 19.70
Alison Jane Hughes 15,860,190 10.43
HSBC Custody Nominees (Australia) Limited 15,317,623 10.08
National Nominees Limited 7,755,530 5.10
Just Paddling Pty Ltd 6,089,082 4.01
BNP Paribas Noms Pty Ltd 4,279,368 2.82
JP Morgan Nominees Australia Pty Ltd 3,488,994 2.30
BNP Paribas Nominees Pty Ltd 3,441,123 2.26
Robert G Cameron and Paula S Cameron 3,383,258 2.23
John Gibbs 3,337,265 2.20
Susan Louise Abrahams 3,268,269 2.15
Channings Holdings Pty Ltd 3,090,150 2.03
Citicorp Nominees Pty Limited 2,572,646 1.69
RBC Investor Services Australia Pty Limited 2,047,422 1.35
Karen Wright 2,022,000 1.33
Lasardi Pty Limited 1,869,215 1.23
Citicorp Nominees Pty Limited 1,764,842 1.16
Sudemo Pty Ltd 1,741,017 1.15
William McIllwraith Pty Ltd 1,695,000 1.12
Amanda Taylor 1,647,735 1.08
Total 114,606,739 75.40
Other holders 37,386,656 24.60
Total quoted equity securities 151,993,395 100.00For
per
sona
l use
onl
y
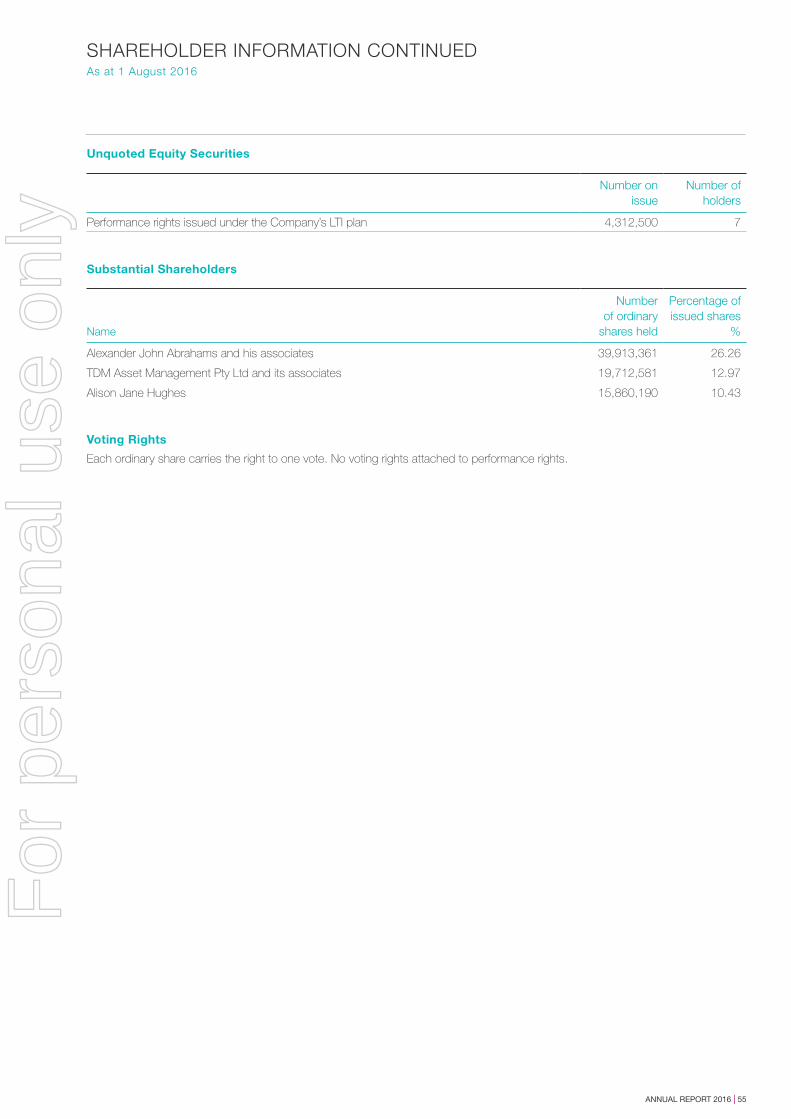
ANNUAL REPORT 2016 | 55
SHAREHOLDER INFORMATION CONTINUEDAs at 1 August 2016
Unquoted Equity Securities
Number on issue
Number of holders
Performance rights issued under the Company’s LTI plan 4,312,500 7
Substantial Shareholders
Name
Number of ordinary
shares held
Percentage of issued shares
%
Alexander John Abrahams and his associates 39,913,361 26.26
TDM Asset Management Pty Ltd and its associates 19,712,581 12.97
Alison Jane Hughes 15,860,190 10.43
Voting Rights
Each ordinary share carries the right to one vote. No voting rights attached to performance rights.
For
per
sona
l use
onl
y
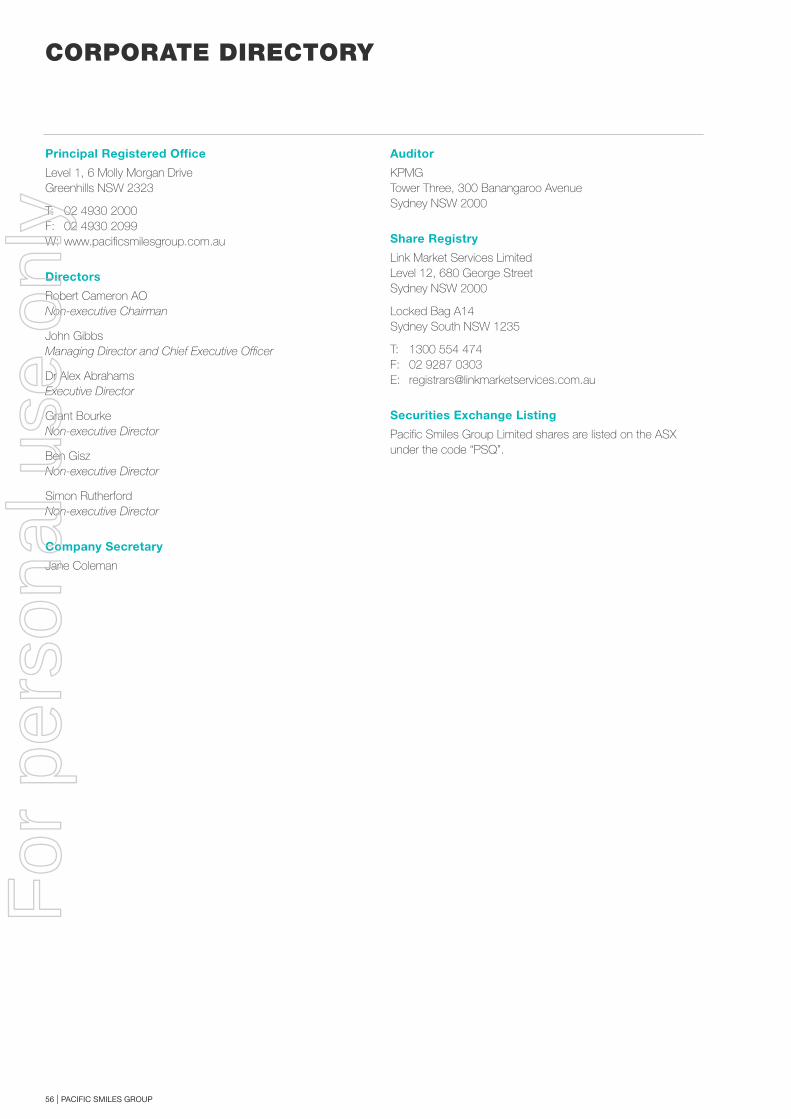
CORPORATE DIRECTORY
Principal Registered Office
Level 1, 6 Molly Morgan DriveGreenhills NSW 2323
T: 02 4930 2000F: 02 4930 2099W: www.pacificsmilesgroup.com.au
Directors
Robert Cameron AO Non-executive Chairman
John GibbsManaging Director and Chief Executive Officer
Dr Alex AbrahamsExecutive Director
Grant BourkeNon-executive Director
Ben GiszNon-executive Director
Simon RutherfordNon-executive Director
Company Secretary
Jane Coleman
Auditor
KPMGTower Three, 300 Banangaroo AvenueSydney NSW 2000
Share Registry
Link Market Services LimitedLevel 12, 680 George Street Sydney NSW 2000
Locked Bag A14Sydney South NSW 1235
T: 1300 554 474 F: 02 9287 0303 E: [email protected]
Securities Exchange Listing
Pacific Smiles Group Limited shares are listed on the ASX under the code “PSQ”.
MAKE SMILE
56 | PACIFIC SMILES GROUP
For
per
sona
l use
onl
y

RM-16095
MAKE SMILEYO
UFor
per
sona
l use
onl
y
For
per
sona
l use
onl
y