Embed Size (px)
Citation preview

Braz. J. Biol., 66(1B): 239-261, 2006
AnnuAl And Short-term VAriABility in PrimAry ProductiVity By PhytoPlAnkton And correlAted
ABiotic FActorS in the Jurumirim reSerVoir (São PAulo, BrAzil)
henry, r.1, noGueirA, m. G.1, PomPeo, m. l. m.2 and moSchini-cArloS, V.2
1dept. of zoology, institute of Biosciences, uneSP, Botucatu, SP, Brazil2dept. of ecology, institute of Biosciences, uSP, São Paulo, SP, Brazil
correpondence to: raul henry, dept. of zoology, institute of Biosciences, uneSP, ceP 18618-000, Botucatu, SP, Brazil, email: [email protected]
received January 19, 2004 – Accepted may 31, 2004 – distributed February 28, 2006
(With 9 figures)
ABSTRACT
the annual variability of the photosynthetic production (PP) by phytoplankton in the lacustrine zone of the Jurumirim reservoir (São Paulo, Brazil) was evaluated in a three-year study to identify recurrent patterns and their causes. Variability in PP was measured daily during two periods of the year (the dry and rainy seasons). An analysis of the PP data failed to identify a recurrent pattern, since the PP values showed no correlation with hydrological factors (rainfall, water level and discharge, and washout) nor, apparently, with the water’s nutritional conditions. A principal component analysis revealed that the PP and assimilation ratio were higher when the Po
43- and n–nh
4+ contents were low and the z
eu/z
miX ratios
were at their highest. Areal primary productivity can be predicted based on the ratio between the maximum volumetric productivity and the coefficient of vertical extinction of light. however, the biomass integrated for z
eu was a poor predictor of areal primary productivity. no correlation was found between water
temperature and areal and maximum volumetric productivity. thus, the three-year PP study indicated that the variability pattern is typically chaotic. As for the short-term measurements, the PP was found to be higher in the dry season than in the rainy, although both seasons showed an areal PP variability of 35 to 40%. this pattern was attributed to the daily variation in the nutritional conditions and the magnitude of light penetrating through the water, combined with the mixing of phytoplanktonic cells. A comment about the relationship between primary production by phytoplankton and fish yield is also briefly discussed here.
Keywords: primary productivity, phytoplankton, variability, reservoir, light, nutrients.
RESUMO
Variabilidade anual e de curto prazo na produtividade primária pelo fitoplâncton e fatores abióticos correlatos na Represa de Jurumirim (São Paulo, Brasil)
A variabilidade anual da produção fotossintética (PP) pelo fitoplâncton na zona da barragem da represa de Jurumirim (São Paulo, Brasil) foi medida após um estudo no período de três anos sucessivos, com o objetivo de identificar padrões recorrentes e suas causas. medidas da variabilidade da PP em escala diária foram obtidas em dois períodos do ano (estações seca e chuvosa). nenhum padrão recorrente foi verificado nos dados de PP, visto não haver relação de sua variabilidade com nenhum fator hidrológico (precipitação, nível e vazão de água e washout) nem, aparentemente, com as condições nutritivas da água. A análise de componentes principais revelou que a PP e a taxa de assimilação foram mais elevadas na época do ano em que o conteúdo de Po
43- e n–nh
4+ foi mais baixo e quando as razões z
eu/z
miX foram mais
elevadas. A produtividade primária/área pode ser estimada pela razão entre a produtividade volumétrica máxima e o coeficiente de extinção vertical da luz. entretanto, a biomassa integrada na z
eu foi um pobre

240 henry, r. et al.
Braz. J. Biol., 66(1B): 239-261, 2006
preditor da produtividade primária/área. nenhuma correlação foi encontrada entre a temperatura da água com a produtividade primária (por área e volumétrica máxima). em conseqüência, o estudo da PP em três anos sucessivos mostrou que o padrão de variabilidade é tipicamente caótico. em relação às medidas de curta duração, maior PP foi encontrada na estação seca do que na chuvosa. em ambos os períodos, a variabilidade da PP (por área) foi de aproximadamente 35-40%. o padrão foi atribuído não somente à variação na concentração dos nutrientes mas também à magnitude de penetração de luz na água associado ao regime de circulação. um comentário sobre a relação entre produção primária pelo fitoplâncton com produção pesqueira é também apresentada.
Palavras-chave: primária produtividade, fitoplâncton, variabilidade, represa, luz, nutrientes.
INTRODUCTION
the patterns of variability of phytoplankton productivity on latitudinal and temporal scales are still a controversial theme. melack (1979) showed that, in natural lakes, the variability (measured by the coefficient of variation, cV) tended to decrease as latitude shifted from temperate to tropical zones. Alvarez-cobelas & rojo (1994) reported a similar conclusion in a review in which they showed that the intra-annual variability of primary productivity in tropical lakes and reservoirs deviated little in relation to the mean in comparison to temperate re-gions. Also, the annual minima-maxima difference in areal primary productivity was about 40-fold in tropical lakes and reservoirs when compared with temperate lentic environments, where it could reach up to 150-fold (Alvarez-cobelas & rojo, 1994). however, seasonal variability of production in reservoirs and lakes with high water renewal rates is less evident than in lakes with low rates of water renewal, and the annual peaks in these rates are slightly delayed in reservoirs. According to kimmel et al. (1990), the photosynthetic production by phytoplankton in reservoirs varies almost insignificantly from that of natural lakes, presumably giving reservoirs a resilience or dynamic stability that enables them to return to their previous state after repeated perturbations. this characteristic is due to the relatively high external nutrient loads in reservoirs with low residence times. however, when turbidity is high and phytoplankton washout occurs during the rainy season in reservoirs with low residence times, the temporal variability in phytoplankton production can be significant (talling & lemoalle, 1998). in equatorial lakes, where the seasonal range of incident solar radiation is limited, the variability in
the production of organic matter by phytoplankton is also low, as in lake George (Ganf, 1975). in subtropical regions such as the Florida peninsula, Beaver & chrisman (1991) found a cV in lake productivity intermediate to that of equatorial and temperate systems.
in Brazilian reservoirs, studies of the variability of primary productivity (PP) by phytoplankton have been limited to an annual scale in monthly or bi-monthly sampling frequencies (tundisi et al., 1977; Franco, 1982; tundisi & matsumura-tundisi, 1990; henry, 1993; calijuri et al., 1999). the identification of annual PP variability patterns requires recurrent studies on a greater temporal scale.
measurements of PP on consecutive days or over short intervals of time are even scarcer (Sephton & harris, 1984; calijuri & dos Santos, 2001). An intensive sampling frequency during some periods of the year (e.g., in the rainy or dry seasons) in an apparently chemically homogeneous environment might be a useful strategy to pinpoint the daily effects of solar radiation penetrating into the water on the short-term variability of PP.
this work purported to: a) show the annual variability of PP by phytoplankton over three successive years in order to identify recurrent patterns and their causes, and b) present data about the daily variability of PP during two periods of the year (rainy and dry seasons) in order to understand the role of environmental variables in the process of photosynthesis.
STUDY AREA
the Jurumirim – the first of a series of reservoirs in a cascade sequence in the Paranapanema river, São Paulo state, Brazil – was formed by the confluence of two major tributaries

241VAriABility in PrimAry ProductiVity By PhytoPlAnkton
Braz. J. Biol., 66(1B): 239-261, 2006
(Paranapanema and taquari) for the purpose of generating electrical energy and storing water. Built in 1962, the artificial lake has an area of 484 km2 (579 m a.s.l.), a volume of 7.9 x 10⁹ m3, maximum width of 10.5 km, maximum length of 30.75 km, maximum and mean depths of 40 and 12.9 m, respectively, a shoreline development index of 14.9, a perimeter of 1,115 km; effluent discharge of 315 m3/s and residence time of 334 days (theoretical annual average of 1991). the hydrographic basin (17,800 km2 area) is covered by forest and reforested areas (35.2%), agriculture (17%) and temporary cultures (10%), grasslands (30.3%) and is also put to other uses (7.5%) (henry & Gouveia, 1993). the main tributary (Paranapanema river) annually introduces approximately 83.2 and 1,215 ton of total phosphorus and nitrogen, respectively (mean values for 1992 and 1993). A retention rate of about 75% of total P and 86% of suspended matter was recorded in the Jurumirim reservoir (henry et al., 1999).
our limnological studies of the Jurumirim reservoir began in the lacustrine zone surrounding the dam. this zone is a monomictic system, isothermal in late autumn and winter and stratified in spring and summer (henry, 1993). the thermocline is located in the lower third of the water column and the development of thermal stratification was attributed to the reservoir’s bottom topography (henry, 1995). A clinograde curve of oxygen is found during thermal stratification (from September to march) and a homogeneous condition occurs in the water column during the isothermal period (from may to August) (henry, 1992). in the lacustrine zone of the reservoir, phytoplankton growth is limited to phosphorus (henry, 1990). Phytoplankton abundance (mean for the water column) varies from 2,267 org.l-1 (summer-rainy season) to 8,558 org.l-1 (winter-dry season). diatoms, mainly Aulacoseira granulata in spring, and blue-green Anabaena circinalis and A. spiroides algae during winter, were found (nogueira, 2000). Further studies indicated that the reservoir’s spatial structure is complex. distinct ecological compartments were identified, with the presence of a longitudinal gradient in trophic conditions and a continuous mixing regime without seasonal thermal stratification in the upstream zones (nogueira et al., 1999).
MATERIAL AND METHODS
the primary productivity by phytoplankton and correlated abiotic factors were measured at sampling station d, located near the dam of the Jurumirim reservoir (Fig. 1). long-term studies (three years – from June 1992 to June 1995) were carried out with monthly measurements. measurements were taken on alternate days during two periods (from July 1-31, 1993, and from January 11 to February 8, 1994, in the dry and rainy seasons, respectively).
the c14 method was employed for the photosynthetic production by phytoplankton, using dark and transparent flasks (Vollenweider, 1974). Samples of phytoplanktonic populations, collected at depths corresponding to 100, 50, 25, 10 and 1% of incident solar radiation (measured with a kahlsico subaquatic radiometer), were inoculated in the two types of flasks (75 ml capacity) with 1 ml of nahc14o
3 (5 µci activity) and incubated in situ
for 4 hours (from 10:00 to 14:00 hours). Following this incubation period, sub-samples (two replicates ≅ 15-20 ml) were immediately filtered through millipore h.A. filters (0.45 µm mesh net, 25 mm diameter). the radioactivity was determined with the filters diluted in 10 ml scintillation liquid (Bray, 1960), using a Beckman l.S. 100 scintillometer. the assimilated carbon was computed according to Vollenweider (1974). chlorophyll-a, a biomass index of phytoplankton, was measured by the Golterman & clymo (1969) method, using 90% cold acetone to extract the pigment.
the correlated abiotic factors of water measured in the euphotic zone (five depths) and at 25 m depth were: a) seston, determined by the gravimetric method; b) dissolved oxygen, by the Winkler method modified by the addition of azide (Golterman & clymo, 1969); c) ph, alkalinity and inorganic C, according to mackereth et al. (1978); d) conductivity corrected to 25 °c with a hatch conductivimeter; and e) nitrate (n–no
3-),
nitrite (n–no2
-) and ammonia (n–nh4
+), total and inorganic phosphate (Po
43-),“reactive” silicate
(Si–Sio3
-) in filtered water, according to koroleff (1976), Strickland & Parsons (1960) and Golterman & clymo (1969), respectively.
the water temperature was measured with a toho dentam thermistor in a 0.5 m interval from surface to bottom (z
mAX). Water transparency was

242 henry, r. et al.
Braz. J. Biol., 66(1B): 239-261, 2006
of
Riv
erTa
quar
i
DA
M
D
T T
T
RP
P
P
P
Par
anap
anem
aR
iver
Sca
le 1
:250
.000
N.M
.III
II
II
IIIII
Res
ervo
ir
Juru
mirim
Bra
zil
São
Pau
lo
7062
5446
38
7062
5446
38
0 8 16 24 32
0 322416
8
50
510
1520
Km
Fig
. 1 —
Stu
dy s
ite: t
he J
urum
irim
res
ervo
ir in
São
Pau
lo s
tate
(B
razi
l), t
he s
ampl
ing
stat
ions
in th
e la
cust
rine
zon
e (d
) an
d th
e ta
quar
i (t
) an
d Pa
rana
pane
ma
(P)
“arm
s”.

243VAriABility in PrimAry ProductiVity By PhytoPlAnkton
Braz. J. Biol., 66(1B): 239-261, 2006
determined with a Secchi disk (zdS
). the mixing zone (z
miX) was the height of the water column
from the surface to a layer where the temperature difference was < 0.2 °c. the subaquatic solar radiation readings taken with the kahlsico radiometer were transformed into µe.m-2.s-1
(1 µW.cm-2 ≅ 0.046 µe.m-2.s-1).the physical, chemical and biological data
(log x + 1 transformed data) were correlated with the factor scores produced by Principal component Analysis to assess the correlation between photosynthetic production and environmental data during the first twenty-nine months of the study. the areal photosynthetic production values of the data from the two intensive studies (July 1993 and January-February 1994) were subjected to a factorial analysis of variance, considering the following sources of variation: a) the two periods of the year; b) the six depths (five in the euphotic zone and one at 25 m depth); and c) the number of days measurements were taken (thirty, 15 for the dry season and 15 for the rainy). tukey’s test was applied to compare the mean values. the environmental data were subjected to a variance analysis using as sources of variation the days of
measurements and sampling depths of each of the two intensive study periods.
RESULTS
Variability of primary productivity during the three years study
Rainfall, water discharge and renewal in the reservoir
the annual total rainfall in the lacustrine zone showed a low variability (cV = 18%) in relation to the annual average of the 3-year period (1,552 mm). in the first year of study (July 1992 to June 1993), rainfall corresponded to 1,695.9 mm, while in the second (July 1993 to June 1994) and third years (July 1995 to June 1995) rainfall was 1,225.2 and 1,744.4 mm, respectively. in the first and second years, the three months with the highest rainfall were January, February and march (Fig. 2), corresponding, respectively, to 43 and 50% of the annual rainfall. in the third year, the months with the highest rainfall were november and december 1994 and January 1995 (52% of the annual total). A
100
200
300
400
0
1993 1994 19951992
A S DO N J F AM M J J SA O N D FJ M A M AJ J S O N D J
J J
F M A MJ
A S DO N J F AM M J J SA O N D FJ M A M AJ J S O N D J F M A MJ
Mon
thly
tota
l pre
cipt
atio
nTo
tal d
isch
arge
1992
0
1993
200
600400
1000
1994 1995
Fig. 2 — monthly total rainfall (mm) and total water discharge (m3/s) of the Jurumirim reservoir during the 3-year study.

244 henry, r. et al.
Braz. J. Biol., 66(1B): 239-261, 2006
seasonal cycle in the rainfall pattern was evidenced, the rainy season extending from September to march and the dry season from April to August. in the first and second years, July and August, and in the third year, August and September, showed the lowest rainfall (Fig. 2).
Peaks of water discharge by the Jurumirim reservoir dam were recorded in december 1992, march 1993, February 1994, January and February 1995, and April 1995 (Fig. 2). the basic flow during the 3-year period fluctuated around 150-160 m3/s, although values exceeding 800 m3/s were occasionally recorded. the reservoir’s water residence time (t) during the basic flow period was assumed to vary from 574 to 613 days (theoretical values). under such conditions, the daily water renewal in the reservoir (1/t) would correspond to about 0.0017 and 0.0016 day-1 of the volume of water in the accumulation basin. in the higher discharge period (> 500 m3/s - rainy season – Fig. 2), the reservoir’s residence time presumably dropped to 184 days (theoretical value), with a water renewal rate of 0.0054 day-1.
Variability of the chemical environmentexcept for inorganic Po
43-, no significant
differences were found in n–no3
-, n–nh4
+ and Si–Sio
3- contents between the surface and bottom
(Fig. 3). the Po4
3- concentrations were lower than 30 µg.l-1, except in April 1993 (40 µg.l-1) and September 1994 (80 µg.l-1). With regard to no
3-,
the content was less than 100 µg.l-1 except during the period of July to december 1992. A pattern of variation in the n–nh
4+ concentrations was
identified (Fig. 3), with peaks recorded in december 1992, July 1993, and August and october 1994, but with values not exceeding 200 µg.l-1. the Si–Sio
3- content in the water at both depths fluctuated
during most of the study at around 3 mg.l-1 (Fig. 3). however, values of more than 10 mg.l-1 were also recorded (october 1992, and July to december 1993). A comparative analysis of variation of the dissolved nutrients during the study shows various periods with very peculiar characteristics. the first (from July to december 1992) presented low Po
43-
concentrations (≅ 10 µg.l-1), with a single peak of 30 µg.l-1 observed at 25 m in September, high n–no
3- contents (> 200 µg.l-1), low n–nh
4+ values
(< 40 µg.l-1) and a Si–Sio3- peak (10 mg.l-1). An
increase in Po4
3- and n–nh4+ and a decrease in
n–no3- and Si–Sio
3- were observed from January
to July 1993. in the third period (July to december, 1993), inorganic Po
43- was undetected; a reduction
in n–nh4
+ was initially observed, after which the content remained stable at approximately 40 µg.l-1. the highest concentrations of Si–Sio
3-
(> 10 mg.l-1) were recorded in this period, with no major variations observed in the following six months. n–no
3- presented no significant
difference in this period, remaining almost stable up to January 1994. From February to June 1994, the Po
43- concentration was exceeded 10 µg.l-1,
n–no3- was lower than 100 µg.l-1, and n–nh
4+
varied considerably (Fig. 3), while the Si–Sio3
- content was about 3 mg.l-1. the last period (July to december 1994) was characterized by an increase in Po
43-, highly variable n–nh
4+, and Si–Sio
3- content
with no significant difference (about 4 mg.l-1). A correlation analysis (Spearman correlation) showed that the Po
43- values were positively correlated
with n–nh4
+ (r = 0.585*; n = 30; P < 0.001), and that Si–Sio
3- was negatively correlated with
n–nh4+ (r = - 0.451*; n = 30; P < 0.05).
the intra-annual variability of dissolved inorganic nutrients was evaluated through the integrated values for z
eu, limited to data from the
first thirty months, since data for the last 6 months were unavailable. higher coefficients of variation were found for all the nutrients in the first year and for total Po
43- in the second (table 1). inorganic
n/P ratios, calculated as n–no3- + n–no
2- +
n–nh4+/Po
43- (integrated values for z
eu) ranged
from 4 to 193 (x = 42.3 ± 57.45 Sd; cV = 136%) in the first year and from 3 to 203 (x = 34.6 ± 74.3 Sd; cV = 215%) in the second.
Physical measurements (light and temperature) and correlated parameters
in the lacustrine region of the Jurumirim reservoir, the thermal regime during the 3-year study followed a warm monomictic pattern, as described before (henry, 1992; 1993). thermal stratification was evidenced from december 1992 to march 1993 (1st year), from october 1993 to march 1994 (2nd year) and from october 1994 to march 1995 (3rd year). in the remaining months of the 3-year study, isothermy and a trend for thermal homogeneity in the water column was the pattern of the thermal regime in the dam zone.

245VAriABility in PrimAry ProductiVity By PhytoPlAnkton
Braz. J. Biol., 66(1B): 239-261, 2006
PO
43–in
org.
(ug/
L)
20
10
30
0
19931992
A S O N D J F M MAJ
1994
J J A S O N D J F M A M J J
1995
A S O N D J
50
40
0.0 m
25.0 m
100
200
300
J A MMFJDNOSA
1992 1993
0
500
400
JJMAMFJDNOSAJJ
1994
JDNOSA
1995
25.0 m
0.0 m
NO
3–(u
g/L)
J A S DO N MA JMJ F FJ M A MNO DSJ A J AJ DNS O J0
2
4
6
8
10
12
1995199419931992
25.0 m
0.0 m
Sl0
3–(m
g/L)
0
19931992
A S O N D J F M MAJ
1994
J J A S O N D J F M A M J J
1995
A S O N D J
160
120
80
40
200
0.0 m
25.0 m
NH
4+(u
g/L)
Fig. 3 — intra and interannual variability of inorganic P–Po43-, n–no
3-, n–nh
4+ and Si–Sio
3- contents in water of the
lacustrine zone of the Jurumirim reservoir.

246 henry, r. et al.
Braz. J. Biol., 66(1B): 239-261, 2006
TA
BL
E 1
M
ean
(X),
sta
ndar
d-de
viat
ions
(SD
) an
d co
effic
ient
s of
var
iati
on (
CV
, %)
of a
biot
ic f
acto
rs, b
iom
ass
and
area
l pri
mar
y pr
oduc
tivi
ty b
y ph
ytop
lank
ton,
and
ass
imila
tion
rat
io
duri
ng t
he 3
-yea
r pe
riod
(Ju
ly 1
992
to J
une
1995
).
Para
met
ers
1st ye
ars
2nd ye
ars
3rd ye
ars
Thr
ee y
ears
xSD
CV
xSD
CV
xSD
CV
xSD
CV
Z DS (
m)
2.69
0.85
323.
830.
7419
3.68
0.95
263.
400.
9729
Z EU (m
)5.
671.
4025
7.34
1.89
267.
132.
3633
6.71
2.02
30Z M
IX (m
)19
.00
8.68
4613
.10
12.0
092
20.5
09.
6947
17.6
010
.40
59Z M
AX (m
)28
.50
0.62
229
.70
1.92
628
.60
0.73
329
.00
1.34
5Z EU
/ZM
AX
0.20
0.05
240.
250.
0728
0.25
0.08
320.
230.
0731
Z EU/Z
MIX
0.53
0.72
136
1.78
1.74
980.
881.
4015
91.
061.
4214
2pH
*6.
320.
305
6.22
0.34
56.
160.
142
6.23
0.28
4O
2 (g
.m-2)
43.8
010
.30
2459
.00
15.2
026
58.2
023
.80
413.
5018
.40
34To
t.Alk
(eq.
m-2)
2.34
0.61
262.
920.
8228
2.98
0.99
332.
750.
8531
Tot.P
O43-
(mg.
m-2)
181.
0015
9.00
8820
9.00
189.
0091
--
--
--
Inor
g.PO
43- (m
g.m
-2)
78.7
057
.60
7391
.30
106.
2011
6-
--
--
-N
–NO
3- (m
g.m
-2)
984.
0090
1.00
9253
3.00
122.
0023
--
--
--
N–N
O2- (
mg.
m-2)
30.0
027
.60
9214
.70
8.87
60-
--
--
-N
–NH
4+ (m
g.m
-2)
296.
0025
4.00
8636
0.00
247.
0069
--
--
--
Si–S
iO3- (
g.m
-2)
23.3
013
.80
5946
.70
17.3
037
--
--
--
Sest
on (g
.m-2)
7.50
4.50
608.
592.
7532
8.98
4.21
478.
363.
8546
Chl
orop
hyll-
a (m
g.m
-2)
10.5
09.
1087
13.6
07.
4355
13.8
03.
7027
12.5
97.
0756
Prod
.(mgC
.m-2.h
-1)
15.0
011
.90
7922
.30
17.3
078
25.1
014
.60
5820
.80
15.0
072
Ass
mila
tionR
atio
(mgC
.mgC
hl.a
.h-1)
2.05
2.09
110
2.19
2.38
109
1.91
1.16
612.
051.
9696
*mea
n in
ze
u

247VAriABility in PrimAry ProductiVity By PhytoPlAnkton
Braz. J. Biol., 66(1B): 239-261, 2006
Water transparency by Secchi disk ranged from 1.39 to 3.90 m (1st year), from 2.73 to 4.96 m (2nd year), and from 2.31 to 5.16 m (3rd year). the highest values in each year of the study were recorded in January. lower values were recorded in the beginning of dry season in the three years (Fig. 4). the intra- and interannual variability was < 30% (table 1). the euphotic layer (z
eu = 1% i
o)
ranged from 3.5 to 9.0 m (1st year), from 4.25 to 10 m (2nd year) and from 4.0 to 10 m (3rd year) (Fig. 4).
Annual mean zeu
values were very similar in the 2nd and 3rd years (≅ 7.1-7.3 m), and higher than that calculated for the 1st year (≅ 5.7 m). z
eu/z
dS
ratios corresponded to 2.11 for the 1st year, 1.92 for the 2nd year and 1.94 for the 3rd year, using the annual average data (table 1). high variability (92%) in the extent of z
miX was recorded in the
2nd year, though similar in the other two years (about 46-47%) (table 1). in July and August 1992, July 1993, may to July 1994, and April to June 1995, the z
miX extended to the bottom of the
reservoir (Fig. 4). the height of the water column above the sediment (z
mAX) ranged from 27.5 to
29.5 m (1st year), from 28 to 35.5 m (2nd year) and from 27.5 to 30 m (3rd year) (Fig. 4). low intra and inter-annual variations (< 6%) of z
mAX were
found. zeu
/zmAX
ratios varied from 0.13 to 0.31 in year 1, from 0.15 to 0.34 in year 2, and from 0.14 to 0.36 in year 3. the coefficients of variation of the values (in and between years) were lower than 32% (table 1). higher intra and inter-annual variability was recorded for z
eu/z
miX ratios
(> 90%, table 1). in the first year, zeu
/zmiX
ratios ranged from 0.13 to 2.75; in the second, from 0.33 to 6.50, and in the third, from 0.14 to 4.75. the photosynthetically active radiation in the surface water (i
o) varied from 442 to 1,840 (year 1), from 64
to 1,932 (year 2), and from 290 to 1,380 µe.m-2.s-1 (year 3). the intra-annual variability (computed through the cV) was 38% for the 1st year, 82% for the 2nd year and 50% for the 3rd year, while the inter-annual variability (three years) was 58% (x = 973 ± 563 µe.m-2.s-1 Sd).
Seston, phytoplankton biomass and volumetric and areal primary productivity during the study period
higher variability (cV = 60%) was found in the first year for the seston values (integrated for
zeu
), when the mean was the lowest of the three years (table 1). in the other two years, the annual averages were similar. the inter-annual variability of the mean content of seston in z
eu was very
similar to that of the 3rd year (table 1).the phytoplankton biomass (chlorophyll-a,
integrated for zeu
) ranged from 3.4 to 35.7 mg.m-2 in the year 1, from 5.4 to 30.0 mg.m-2 in year 2, and from 6.4 to 19.7 mg.m-2 in year 3 (Fig. 4).
lower mean phytoplanktonic biomass was found in the first year, but the variability of the values was higher than in the two other years (table 1). the mean chlorophyll-a in the years 2 and 3 was very similar, and slightly higher that the mean content of the 3-year period (table 1).
the areal photosynthetic production ranged from 3.4 to 41.6 mgc.m-2.h-1 in the 1st year, from 5.3 to 31.6 mgc.m-2.h-1 in the 2nd year and from 9.4 to 45 mgc.m-2.h-1 in the 3rd year (Fig. 4). the mean annual production apparently increased from the first to the second year, and from the second to the third (table 1). comparing the three years, a lower coefficient of variation was found for the period comprising July 1994 to June 1995. the inter-annual variability (cV = 72%) was similar to the intra-annual variability of the two first years (table 1). Photoinhibition of the volumetric primary production was recorded in surface water at five, seven and five of the monthly vertical profiles of the first, second and third years of the study, respectively. the majority of volumetric production peaks (A
max) were found at depths corresponding to
50 and 25% io during the 3-year period.
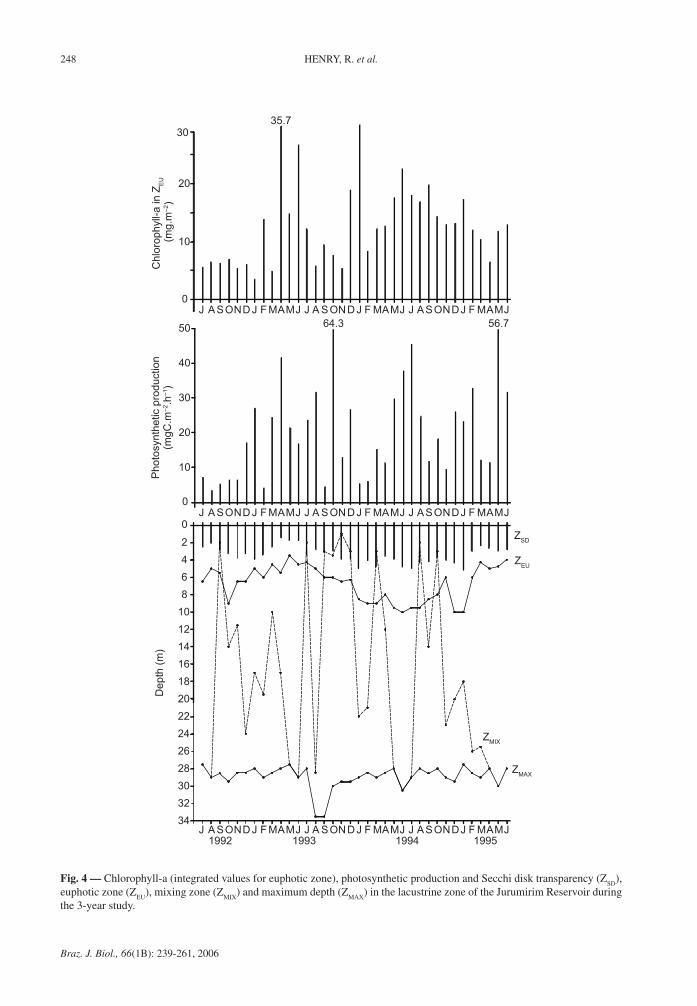
the Amax
value ranged from 0.8 to 19.5 mgc.m-3.h-1 in year 1, from 1.1-16.0 mgc.m-3.h-1 in year 2, and from 1.9 to 30.6 mgc.m-3.h-1 in year 3 (Fig. 5). the annual mean of the first year (x = 5.34 ± 5.56 mgc.m-3.h-1 Sd) was similar to that of the second (x = 5.55 ± 4.80 mgc.m-3.h-1 Sd), while the mean A
max of the third year was higher (x = 8.08 ±
8.52 mgc.m-3.h-1 Sd). the inter-annual variability (cV = 120%) was similar to the intra-annual variability of the first year (cV = 104%) and the third year (cV = 105%). the cV of A
max
(cV = 86%) was lower in the second year.the assimilation ratio in z
eu, calculated as the
areal productivity/chlorophyll-a ratio in zeu
, showed no significant variations for the annual averages of the three successive years. however, inter- and intra-annual variability was evidenced (table 1).
248 henry, r. et al.
Braz. J. Biol., 66(1B): 239-261, 2006
Fig. 4 — chlorophyll-a (integrated values for euphotic zone), photosynthetic production and Secchi disk transparency (zSd
), euphotic zone (z
eu), mixing zone (z
miX) and maximum depth (z
mAX) in the lacustrine zone of the Jurumirim reservoir during
the 3-year study.
Pho
tosy
nthe
tic p
rodu
ctio
n(m
gC.m
–2.h
–1)
20
10
0
50
40
30
(mg.
m–2
)C
hlor
ophy
ll-a
in Z
EU
0
10
20
3035.7
64.3 56.7
Dep
th (m
)
3234
2826
30
242220181614
ZMAX
ZMIX
1210
68
42
0
ZEU
ZSD
AJ1992 1994
MAMJ F1993
DONS DNO JJ AJ S OAJ SJF MAM MAMJFNDJ
AJ MAMJ FDONS DNO JJ AJ S OAJ SJF MAM MAMJFNDJ
1995
AJ MAMJ FDONS DNO JJ AJ S OAJ SJF MAM MAMJFNDJ
249VAriABility in PrimAry ProductiVity By PhytoPlAnkton
Braz. J. Biol., 66(1B): 239-261, 2006
Fig. 5 — intra and interannual variability of maximum volumetric primary productivity (Amax
) in the Jurumirim reservoir during the 3-year study.
Statistical analysis of datathe Principal component Analysis revealed
that Axes i and ii explained 55% and 14% of the total variance, respectively. table 2 shows the correlation of each individual variable with the first three axes. the ordination of the sampling months considering the first two components of the analysis showed a distribution containing three identifiable groups (Fig. 6). the first period of the study (July to december 1992) was positioned on the negative side of axis 2. this distribution was influenced by higher n–no
3- concentrations. in
1993, the months of the second half of the year were again grouped together on the negative side of axis 1. the variables influencing this position in the analysis were the high silica concentration followed by the high z
eu/z
miX ratio. lastly, a larger
and less evident group was positively associated to axis 1, with the distribution determined mainly by a higher phosphorus concentration.
Variability of primary productivity in short-term studies
tables 3 and 4 list the averages and amplitudes of variation of the water’s physical and chemical factors in dry and rainy seasons, respectively.
in July, the mean thickness of zeu
(1% io) was
approximately 50% lower than in the rainy season. Similar contents of oxygen in z
eu were found in
the two periods. however, dissolved oxygen at a 25 m depth in the rainy season corresponded to 50% of the mean value of the dry season. Alkalinity in July (about 0.42 meq.l-1) was slightly higher than in the rainy season (about 0.40 meq.l-1). in the latter period, the mean value at the bottom (0.431 meq.l-1) was about 10% higher than in z
eu.
conductivity was higher in July, while the mean values in z
eu during the rainy season were 20%
lower. At a 25 m depth, conductivity was higher than the average of z
eu. the seston concentration
was extremely low (about 1.1 mg.l-1), showing no variations among seasons and depths. the amount of chlorophyll-a was about 25% higher in July than in the rainy season. in January-February, the mean dissolved total Po
43- content was about 5-6 times
higher than in July. A considerable discrepancy in the inorganic Po
43- was recorded between the
two periods. the magnitude of variation was approximately 75 times higher in the rainy season. higher averages of n–no
3- were observed at 9 m
(1% of io) and 25 m depths when compared with
the values in the surface layer (0-3.95 m depth)
0
4
8
12
16
20
J A S O N D J F M A M J J A S O N D J F M A M J J A S O N D J F M A M J
1992 1993 1994 1995
30.6A
max
(mgC
.m-3.h
-1)

250 henry, r. et al.
Braz. J. Biol., 66(1B): 239-261, 2006
Jul/92
Sep/92
Oct/92Nov/92
Dec/92
Jan/93
Feb/93
Mar/93
Apr/93
May/93 Jun/93
Jul/93
Aug/93
Sep/93
Oct/93
Nov/93Dec/93
Jan/94
Feb/94
Mar/94
Apr/94
May/94
Jun/94Jul/94
Aug/94
Sep/94
Oct/94
Nov/94pH
ZEU
ZMAX/ZEU
ZMIX
ZEU/ZMIX
Alc
PO43–T
PO43–l
NO3–
NO2–
NH4
SIO3–
ChlaPP
Axis 1
Axis 2
Aug/92
Fig. 6 — Order of the sampling months by Principal Component Analysis and correlation of the variables with Axes 1 and 2.
Table 2 Variables correlation with the three first axis of the principal component analysis relative to the first twenty nine months of
study in Jurumirim Reservoir.
Variablesaxis
1 2 3Temperature (temp) 0.0010 0.0126 - 0.0113pH 0.0019 - 0.0154 - 0.0041Conductivity (K25) - 0.0026 - 0.0037 0.0192Secchi disk depth (ZSD) 0.0116 - 0.0135 - 0.1410Euphotic zone (ZEU) 0.0379 - 0.0387 - 0.1446Maximum depth/ euphotic zone (ZMAX/ ZEU) - 0.0435 0.0456 0.1434Mixing depth (ZMIX) 0.1944 - 0.1615 0.7289 Euphotic zone/ mixing depth (ZEU/ZMIX) - 0.1149 0.1163 - 0.4046Dissolved oxygen (O2) 0.0409 - 0.0257 - 0.1798Alkalinity (Alk) 0.0514 - 0.0603 - 0.1870Dissolved total phosphate (PO4
3- T) 0.3176 0.3720 - 0.0663Dissolved inorganic phosphate (PO4
3- I) 0.8446 - 0.1732 - 0.1451Nitrate (N–NO3
-) - 0.0914 - 0.4942 - 0.1759Nitrite (N–NO2
-) 0.1753 - 0.3945 - 0.1397Ammonium (N–NH4
+) 0.2248 0.4348 - 0.0624“Reactive” silicate (Si–SiO3
-) - 0.1427 0.0267 - 0.2166Seston (S) 0.0174 - 0.0602 - 0.1363Chlorophyll-a (Chl.a) 0.1075 0.2099 - 0.0977Phosynthetic production (PP) - 0.0068 0.3643 0.0616Assimilation ratio (AR) - 0.0720 0.1163 0.1310

251VAriABility in PrimAry ProductiVity By PhytoPlAnkton
Braz. J. Biol., 66(1B): 239-261, 2006
TA
BL
E 3
M
eans
and
am
plit
udes
of
vari
atio
n (i
n pa
rent
hesi
s) o
f so
me
chem
ical
and
bio
logi
cal v
aria
bles
at
100,
50,
25,
10
and
1% o
f lig
ht p
enet
rati
on a
nd a
t th
e bo
ttom
(25
m d
epth
) of
th
e w
ater
col
umn
in J
urum
irim
Res
ervo
ir d
urin
g th
e dr
y pe
riod
(Ju
ly, 1
993)
.
%
Io
Var
iabl
es
100
5025
101
25 m
dep
th (
m)
0.00
-0.
46(0
.25-
0.50
)0.
95(0
.50-
1.50
)1.
91(1
.20-
2.50
)4.
65(4
.0-6
.0)
- -
o2 (
mg.
l-1)
7.69
(6.6
3-8.
54)
7.80
(7.0
9-8.
51)
7.65
(6.0
6-8.
78)
7.71
(6.8
8-8.
66)
7.5
6(6
.38-
8.54
)7.
46(6
.14-
8.27
)
Alk
alin
ity (
meq
.l-1)
0.41
9(0
.407
-0.4
28)
0.41
7(0
.410
-0.4
26)
0.42
2(0
.407
-0.4
59)
0.41
8(0
.405
-0.4
27)
0.41
7(0
.403
-0.4
27)
0.41
6(0
.405
-0.4
22)
k25
(µS
.cm
-1)
63.8
(56.
2-71
.9)
63.7
(55.
7-69
.6)
63.3
(56.
7-73
.0)
62.0
(54.
0-68
.4)
63.0
(57.
2-68
.4)
62.9
(58.
3-68
.4)
Sest
on (
mg.
l-1)
1.14
(0.4
0-2.
38)
1.25
(0.3
3-2.
60)
1.06
(0.3
4-2.
37)
1.02
(0.2
0-2.
63)
1.26
(0.4
8-2.
52)
1.10
(0.5
4-2.
18)
chl
orop
hyll-
a (m
g.m
-3)
2.82
(1.0
1-6.
07)
2.40
(1.0
1-3.
60)
2.52
(0.5
6-6.
24)
2.39
(0.3
4-4.
39)
2.41
(0.0
0-4.
83)
3.01
(1.5
2-6.
46)
tota
l dis
solv
edP–
Po43-
(µg
.L-1)
10.2
(6.3
-20.
2)10
.0(3
.9-2
9.1)
11.6
(5.8
-27.
2)11
.3(7
.2-2
6.9)
11.0
(6.3
-22.
6)16
.3(4
.5-1
8.7)
dis
solv
ed i
norg
anic
P–Po
43-(µ
g.L-1
)0.
6(0
.0-0
.4)
1.0
(0.0
-8.2
)0.
6(0
.0-4
.2)
0.7
(0.0
-4.2
)0.
9(0
.0-4
.2)
0.5
(0.0
-2.9
)
n–n
o3- (
µg.L
-1)
88.3
(67.
3-10
8.9)
81.6
(63.
3-10
2.4)
88.0
(59.
1-12
5.7)
87.8
(46.
6-12
1.0)
83.3
(50.
0-11
0.6)
92.4
(55.
2-12
1.4)
n–n
o2-
(µg.
L-1)
1.2
(0.2
-2.0
)1.
3(0
.0-2
.1)
1.4
(0.2
-2.1
)1.
3(0
.4-2
.0)
1.3
(0.4
-2.1
)1.
3(0
.0-2
.5)
n–n
h4+
(µg
.l-1)
29.0
(19.
8-36
.0)
29.3
(16.
6-36
.1)
29.7
(17.
0-34
.5)
29.9
(19.
2-36
.0)
2.9
(18.
3-38
.6)
30.5
(17.
9-40
.3)
Si–S
io3- (
mg.
l-1)
8.4
(4.4
-11.
3)8.
2(3
.8-1
3.0)
9.0
(5.6
-13.
4)8.
5(3
.8-1
1.9)
8.9
(2.5
-11.
3)9.
4(5
.5-1
5.4)

252 henry, r. et al.
Braz. J. Biol., 66(1B): 239-261, 2006
TA
BL
E 4
M
eans
and
am
plit
udes
of
vari
atio
n (i
n p
aren
thes
is)
of s
ome
chem
ical
and
bio
logi
cal v
aria
bles
at
100,
50,
25,
10
and
1% o
f lig
ht p
enet
rati
on a
nd a
t th
e bo
ttom
(25
m d
epth
) of
th
e w
ater
col
umm
in J
urum
irim
Res
ervo
ir d
urin
g th
e ra
iny
peri
od (
Janu
ary-
Feb
ruar
y, 1
994)
.
% I
o
Var
iabl
es
100
5025
101
25 m
dep
th (
m)
0.00
-0.
76(0
.5-1
.0)
2.07
(1.1
-2.5
)3.
95(3
.2-6
.0)
8.98
(7.5
-10.
0)- -
o2 (
mg.
L-1)
7.69
(6.7
8-8.
97)
7.63
(6.7
8-8.
89)
7.61
(6.6
2-8.
73)
7.49
(6.8
6-8.
78)
7.61
(6.8
1-8.
81)
3.74
(2.2
6-5.
94)
Alk
alin
ity (
meq
.L-1)
0.39
9(0
.384
-0.4
17)
0.39
5(0
.377
-0.4
03)
0.39
7(0
.383
-0.4
08)
0.39
6(0
.366
-0.4
16)
0.39
6(0
.378
-0.4
07)
0.43
1(0
.415
-0.4
62)
k25
(µS
.cm
-1)
51.0
(41.
7-59
.0)
49.9
(38.
8-58
.8)
49.3
(38.
8-58
.8)
49.7
(39.
2-57
.4)
49.8
(42.
1-58
.4)
59.3
(44.
1-62
.4)
Sest
on (
mg.
L-1)
1.11
(0.6
5-1.
39)
1.05
(0.7
4-1.
62)
1.18
(0.6
3-2.
40)
1.24
(0.7
6-2.
24)
1.19
(0.6
7-1.
79)
1.15
(0.3
0-1.
99)
chl
orop
hyll-
a (m
g.m
-3)
2.00
(0.8
5-5.
00)
1.65
(0.6
7-3.
20)
1.53
(0.6
7-3.
88)
1.62
(0.8
5-3.
32)
1.70
(0.7
9-3.
82)
1.42
(0.6
8-3.
60)
dis
solv
ed t
otal
P–Po
43- (
µg.L
-1)
63.1
(16.
4-16
2.7)
58.0
(16.
8-13
7.3)
61.5
(18.
9-16
1.1)
64.0
(1.8
8-15
9.1)
58.1
(22.
5-14
2.1)
51.2
(16.
8-11
7.5)
dis
solv
ed i
norg
anic
P–Po
43- (
µg. L
-1)
45.9
(13.
7-58
.9)
30.5
(14.
0-62
.6)
29.3
(15.
9-63
.5)
28.6
(12.
3-61
.7)
31.3
(12.
7-55
.0)
32.3
(14.
0-57
.9)
n–n
o3- (
µg.L
-1)
52.4
(11.
9-82
.8)
56.7
(26.
3-84
.0)
56.7
(16.
0-88
.1)
53.6
(13.
3-89
.0)
62.9
(41.
6-97
.2)
86.4
(40.
2-11
7.8)
n–n
o2- (
µg.L
-1)
2.7
(1.3
-3.8
)3.
0(1
.6-5
.2)
3.2
(2.4
-4.9
)3.
3(1
.5-3
.7)
3.2
(1.9
-4.1
)2.
3(1
.7-4
.8)
n–n
h4+
(µg
.L-1)
94.0
(48.
9-11
9.5)
78.6
(35.
6-11
2.4)
81.5
(33.
4-11
2.8)
79.2
(32.
9-11
3.3)
84.1
(42.
3-11
7.7)
80.8
(36.
9-12
6.1)
Si–S
io3- (
mg.
L-1)
3.6
(1.9
-4.7
)3.
6(2
.9-5
..6)
3.6
(3.0
-4.5
)3.
6(3
.1-4
.9)
3.7
(1.6
-7.3
)3.
4(1
.9-5
.1)

253VAriABility in PrimAry ProductiVity By PhytoPlAnkton
Braz. J. Biol., 66(1B): 239-261, 2006
TABLE 5 Coefficients of variation (CV) and of determination (R2) and, F values for the two variation sources (days and depths)
for each period of the year (from July, 01 to 29, 1993 and from January, 11 to February, 08, 1994, dry and rainy seasons, respectively) in Jurumirim Reservoir.
PeriodsDry period Rainy period
Statistics
Variables
CV R2 F values CV R2 F valuesDays Depths Days Depths
temperature 1.55 0.74 21.34* 2.74* 2.10 0.89 9.50* 99.78*
dissolved oxygen 4.67 0.67 15.06* 1.78 12.21 0.74 3.92* 33.13*
ph 10.89 0.17 1.09 0.92 89.32 0.27 2.33* 1.03
Alkalinity - 0.17 1.00 1.00 1.46 0.86 16.32* 54.62*
conductivity 2.42 0.86 48.43* 1.25 3.64 0.92 86.90* 11.61*
Seston 60.85 0.35 3.36* 1.32 26.83 0.45 5.75* 1.35
chlorophyll-a 37.91 0.52 7.90* 0.74 30.79 0.82 34.62* 2.06
dissolved totalP–Po
43-
27.80 0.51 7.29* 1.22 15.49 0.95 153.63* 3.05*
dissolved inorg.P–Po
43-
111.22 0.71 18.32* 1.37 20.20 0.80 31.01* 1.89
n–no3- 18.35 0.44 5.14* 1.45 23.99 0.58 8.43* 4.34*
n–no2- 29.55 0.56 9.14* 0.66 16.79 0.66 10.64* 8.67*
n–nh4+ 8.28 0.81 33.03* 0.54 98.11 0.26 1.93* 1.44
Si–Sio3- 17.46 0.78 26.03* 2.52* 16.30 0.47 6.64* 0.78
*P < 0.05
of zeu
during the rainy season. in July, the mean concentrations were about 50% higher than in the rainy season, and without apparent differences with depth. the mean n–no
2- content in the
water column ranged from 2.7 to 3.3 µg.l-1 in the rainy season and from 1.2 to 1.4 µg.l-1 in July. in January-February 1994, the mean concentration of n–nh
4+ (78.6-94.0 µg.l-1) in the water column
was higher than in July (29.0-30.5 µg.l-1). Finally, the mean concentrations of Si–Sio
3- in the rainy
season corresponded to approximately one third of the mean in July.
the factorial analysis of variance revealed that, in the dry season, all the F values were significant (P < 0.05) on a temporal scale except for water ph and alkalinity (table 5). on the vertical scale (the water column), significant F values were found only for water temperature and silicate. in relation to water conductivity, the high r2 (0.86) indicated that the variability pattern was almost exclusively attributable to temporal variations
(days of measurement). other factors having high r2 (> 0.70) were n–nh
4+ and inorganic Po
43-,
which presented significant temporal variability in July (table 5). in the rainy season, the F values for all the factors were significant in terms of temporal variability (table 5). in January-February, r2 > 0.90 was found for dissolved total Po
43- and conductivity.
thus, the variability of these two factors was almost entirely due to the two sources of variation (the depths and the days).
despite the low coefficient of variation (cV = 1.55%), differences in water temperature were detected in the dry season and can be explained as a function of minor and temporary surface microstratifications (table 5). the ephemerality of the surface heating was real, for none of the variables showed any difference with depth (except for “reactive” silicate), indicating the complete circulation of the water column in July. in the rainy season, more than 50% of the factors presented variations in the vertical axis.

254 henry, r. et al.
Braz. J. Biol., 66(1B): 239-261, 2006
the areal photosynthetic productivity in July 1993 (x = 27.5 ± 9.79 mgc.m-2.h-1 Sd) was about fivefold higher than in January-February 1994 (x = 5.40 ± 2.12 mgc.m-2.h-1 Sd). considering the variability among days (Fig. 7), the cV was similar in the dry (cV = 36%) and rainy (cV = 39%) seasons. Photoinhibition was found in 11 out of 15 profiles of primary productivity in July 1993, but occurred in only 8 profiles in the rainy season.
the assimilation ratio in zeu
was higher in July (x = 0.4 ± 0.19 Sd; cV = 48%). the maximal volumetric production (A
max) was lower in January-
February 1994 (x = 1.9 ± 0.64 mgc.m-3.h-1 Sd) than in the dry season (x = 7.0 ± 1.71 mgc.m-3.h-1 Sd). Variability in July (cV = 24%) was lower than in the rainy season (cV = 34%) (Fig. 8). the A
max/B
in July (x = 2.9 ± 1.20 mgc (mgchl.-a)-1 h-1 Sd; cV = 44%) was about twofold higher than in the
Fig. 7 — Short-term variability of the areal primary productivity during the dry (July 1993) and rainy seasons (January-Febru-ary 1994) in the lacustrine zone of the Jurumirim reservoir.
July, 1993
0
10
20
30
40
50
0
10
01 03 05 07 09 11 13 15 17 19 21 23 25 27 29 Days
11 13 15 17 19 21 23 25 27 29 31 02 04 06 08 Days
Prim
ary
Pro
duct
ivity
(mgC
.m-2.h
-1)
Prim
ary
Pro
duct
ivity
(mgC
.m-2.h
-1)
January-February, 1994

255VAriABility in PrimAry ProductiVity By PhytoPlAnkton
Braz. J. Biol., 66(1B): 239-261, 2006
rainy season (x = 1.37 ± 0.51 mgc (mchla)-1h-1 Sd; cV = 37%).
the factorial analysis of variance showed significant differences in volumetric primary production between seasons, days and depths. tukey’s test indicated that: 1) higher volumetric production occurred at 25% of i
o depth and in
decreasing order in 50, 100, 10 and 1% of io
depths; 2) the averages were higher in the dry season than in the rainy season; and 3) with regard to the successive days of measurements, some of
the values could be considered similar while others showed statistical differences (Fig. 9).
DISCUSSION
Intra- and interannual variability of primary productivity and correlated factors
two groups of factors control phytoplanktonic growth and photosynthetic production in lakes and reservoirs. the first factor is the magnitude of
July, 1993
0
2
4
6
8
10
12
01 03 05 07 09 11 13 15 17 19 21 23 25 27 29
Am
ax(m
g.m
–3.h
–1)
0
2
4
January-February, 1994
11 13 15 17 19 21 23 25 27 29 31 02 04 06 08
Am
ax(m
gC.m
–3.h
–1)
Fig. 8 — Short-term variability of the maximum volumetric primary productivity (Amax
) during the dry (July 1993) and rainy seasons (January-February 1994) in the lacustrine zone of the Jurumirim reservoir.

256 henry, r. et al.
Braz. J. Biol., 66(1B): 239-261, 2006
solar radiation penetrating into the water, while the second concerns the water’s nutritional conditions. in environments with high water renewal, such as reservoirs, another factor can affect phytoplankton: the washout that exports populations at times of high dam water discharge. Washout is probably an insignificant controlling factor in the Jurumirim reservoir, given the relatively high theoretical residence time (even in the rainy season), an extremely low water renewal time and its relatively stable water level during the year (annual range: 2 m). moreover, the water outlet for the turbines is located at a depth of approximately 10 m (mitsuka & henry, 2002), thus below (in the dry season, table 3) and close to the transition between the euphotic and aphotic zones (in the rainy season, table 4).
Another factor that can influence phytoplanktonic abundance is the top down effects by zooplankton. nogueira (2001) showed that zooplankton in the lacustrine zone consists
predominantly of rotifera (51-79%) except in spring, when copepoda (42%) predominated in terms of numerical abundance. this area of the reservoir was also characterized by a lower abundance of total zooplankton when compared with the upstream region. unpublished zooplankton data from the same sampling series of the data considered here shows that the abundance of microcrustaceans remained consistently below 20,000 ind.m-3 except in April 1994 (about 58,000 ind.m-3), when phytoplankton biomass (chlorophyll-a) and photosynthetic production were both high. thus, the zooplanktonic composition and abundance in the lacustrine zone of the Jurumirim reservoir does not appear to exert a major effect in controlling phytoplanktonic productivity.
With regard to all the abiotic variables influencing phytoplankton (biomass and photosynthesis) during the twenty-nine consecutive months of measurements (July 1992 to november 1994), the P.c.A. revealed that two major groups
July, 1993
01 03 05 07 09 11 13 15 17 19 21 23 25 27 29
January and February, 1994
11 13 15 17 19 21 23 25 27 29 31 02 04 06 08
Days
Days
Fig. 9 — comparison of days of similar sets of primary productivity values in two different periods in the Jurumirim reser-voir (the continuous line indicates statistically similar values).

257VAriABility in PrimAry ProductiVity By PhytoPlAnkton
Braz. J. Biol., 66(1B): 239-261, 2006
can be distinguished, considering axis 1. the first group (from July to december, 1993) showed a higher areal photosynthetic production (27.14 ± 20.73 mgc.m-2.h-1 Sd) and assimilation ratio (6.62 ± 5.26 mgchl-a-1.h-1 Sd) than the second group (20.48 ± 12.67 mgc.m-2.h-1 Sd and 1.76 ± 1.96 mgchl-a-1.h-1 Sd, respectively), representing the period from January to June 1993 and from January to november 1994. Although the inorganic Po
43- (167.82 ± 65.24 mg.m-2 Sd) and n–nh+
4
(540.64 ± 274.33 mg.m-2 Sd) contents integrated for z
eu, were higher in the second group of months
than in the first (0.43 ± 1.04 mg.m-2 Sd and 182.1 ± 29.7 mg.m-2 Sd, respectively), the areal production was lower. this was attributed to z
eu/z
miX ratios
(0.91 ± 1.29 Sd) threefold lower (2.70 ± 1.87 Sd) than those recorded from July to december 1993. in the latter period, the mean Si–Sio
3- content (61.55
± 8.36 g.m-2 Sd) was approximately 2.4-fold higher (25.82 ± 10.74 mg.m-2 Sd) than in the second group of months. thus, the first group of months (July to december 1993) was affected mainly by the factors of light penetration in the mixing zone and by nutrition (Si–Sio
3-), which are crucial for
diatoms. the second group (January to June 1993 and January to november 1994) was controlled by the nutritional factor (both P–Po
4-3 and n–nh
4+).
the areal primary production was also lower as a function of the reduced P–Po
4-3 contents in z
eu
from July to december 1993; thus, the nutritional factor presumably had a significant effect during this period.
considering axis 2 of the P.c.A., the areal production (54.3 ± 1.56 mg.c.m-2.h-1 Sd) and chlorophyll-a (6.09 ± 0.51 mg.m-2) values in the period extending from July to december 1992 were higher than in the remaining months (primary production: 22.22 ± 14.95 mg.c.m-2.h-1 Sd; chlorophyll-a: 14.51 ± 7.80 mg.m-2 Sd). these findings were attributed to the low n–nh
4+ and
Po4
3- (Fig. 3) contents and depth of zmiX
> than z
eu (except in September 1992, see Fig. 4); hence,
the circulation factor in this period was of major importance. in the other months, the n–nh
4+
and total Po4
3- and low zeu
/zmiX
ratios favored a higher areal production and greater chlorophyll-a concentration.
An analytical description of the data indicated the absence of a recurrent pattern in areal primary productivity by phytoplankton in the lacustrine
zone of the Jurumirim reservoir. Since the temporal ordination of the values indicated no relationship with the hydrological conditions (rainfall, water level and discharge, and residence time) or with fluctuations in the water’s nutritional characteristics, the variability in photosynthetic production showed a chaotic pattern which was attributed to the magnitude of light penetrating into the water. the extent of z
eu in the Jurumirim reservoir was
highly changeable according to incident radiation, and the light (quality and intensity) available for photosynthesis was presumably modified by the presence of phytoplankton in the surface zone of the water column.
Although variations in the magnitude of solar radiation in surface water are low in equatorial and tropical regions, the penetration of light can be highly variable and can affect the modification pattern of productivity in aquatic environments (talling & lemoalle, 1998). in Africa, a linear correlation between the coefficient of vertical extinction of light (k
e; ln units.m-1)
and phytoplankton biomass (B in zeu
; mg.m-3) was found for lake George (Ganf & Viner, 1973) and for mcilwaine reservoir (talling, 1992). A positive correlation (r = 0.34*; P < 0.05) was also found for the Jurumirim reservoir. therefore, light in water plays an important role in phytoplankton dynamics. Another study in the lacustrine zone of the Jurumirim (henry, 1993), using data from an annual study (march 1988 to march 1989), showed that the areal primary production from September to november could be linked to an increase in solar radiation in combination with wind-induced water circulation.
Areal primary productivity (Σ A) can be predicted based on the ratio of maximum volumetric productivity (A
max) and coefficient of
vertical extinction of light (ke), as demonstrated
for east African lakes (talling, 1965). Based on the Σ A and k
e values of each month of the 3-year
period, a significant positive correlation (r = 0.66*; P < 0.05) was found between Σ A and A
max/k
e
for the Jurumirim reservoir. the dimensionless gradient of proportionality produced values of 2.7 to 3.6 for African lakes (talling & lemoalle, 1998) and a mean value of 3.5 for the Jurumirim reservoir in the 3-year period. Another parameter correlated with integrated primary production (Σ A) is the mean phytoplankton biomass content

258 henry, r. et al.
Braz. J. Biol., 66(1B): 239-261, 2006
in zeu
(mgchl-a.m-2). For the Jurumirim reservoir, the correlation between Σ A x B z
eu (n = 36)
was low (r = 0.22; P > 0.05); hence, the biomass content in the euphotic zone is a poor predictor of areal primary productivity. A similar situation was reported for lake mcilwaine (robarts, 1979), but not for lake chad (lemoalle, 1981).
using data from the literature, harris (1978) showed a linear correlation between the percentage decrease from the A
max value to
surface photosynthetic production (corresponding to % of photoinhibition), with the surface irradiance expressed in µe.m-2.s-1. our 3-year data (occurrence of 17 vertical profiles showing surface inhibition) showed no correlation for the Jurumirim reservoir.
Productivity in many lakes appears to depend on water temperature (harris, 1978; Ganf, 1972). despite the seasonal variability of mean water temperature in z
eu during the 3-year period (ranges:
18.2-26.0 °c, 19.0-26.0 °c and 17.6-24.5 °c for the first, second and third years, respectively), neither areal photosynthetic production (Σ A) nor maximum volumetric productivity (A
max)
displayed a significant correlation with the thermal factor. nor was any correlation found between the temperature and the assimilation ratio (integrated value for z
eu). As for the thermal regime in the
Jurumirim reservoir, previous studies found that the lacustrine zone displayed a monomictic seasonal pattern, with the thermocline located in the lower third of the water column below the euphotic zone (henry, 1993; 1995). therefore, the extent of z
miX
and the range of euphotic zone/mixing depth ratios that affect photosynthetic production are highly unstable and are induced by variations in wind action.
Short term variability of primary productivity by phytoplankton in the dry and rainy seasons
An environment appearing to be chemically homogeneous in z
eu was revealed in the dry
season (July 1993), but on a daily basis, Po43-
and n–nh4
+ varied greatly in concentration. this pattern, together with alterations in the magnitude of light penetration during the mixing period, can explain the high and also highly changeable values of areal primary productivity in this short-term period. in another study conducted at
the same time by calijuri & dos Santos (2001) in Barra Bonita, a eutrophic reservoir (São Paulo, Brazil), the range of areal primary productivity values (11-265 mgc.m-2.h-1) was lower in the dry season than in January-February 1994 (41-356 mgc.m-2.h-1). these data are in contrast with our results for the Jurumirim reservoir, whose mean areal primary productivity in the rainy season was fivefold lower than in July. the reduction in photosynthetic production in January-February compared with the dry season was likely related to the high variability of Po
43- in z
eu. episodic
periods of windstorms in the rainy season can also remove phytoplankton from the illuminated zone; thus, both of these factors can control primary production.
the correlation between areal primary productivity (Σ A) and the ratio of maximum volumetric productivity (A
max) and coefficient of
vertical extinction of light (ke) was 4.04 in the dry
season (r = 0.68*; P < 0.05). in January-February, the dimensionless gradient of proportionality was only 1.40 (r = 0.61*; P < 0.05), i.e., below the recorded range of African lakes (talling & lemoalle, 1998). in the two periods, no significant correlation was found between Σ A and biomass content in z
eu (r = 0.13 and r = 0.19; P > 0.05 for
the rainy and dry seasons, respectively). our data therefore indicated that the penetration of light into the lacustrine zone of the Jurumirim reservoir played an important role in the photosynthetic activity of areal primary productivity (see Fig. 9).
Comparison with primary productivity data of several Brazilian reservoirs, and applications for the fish yield
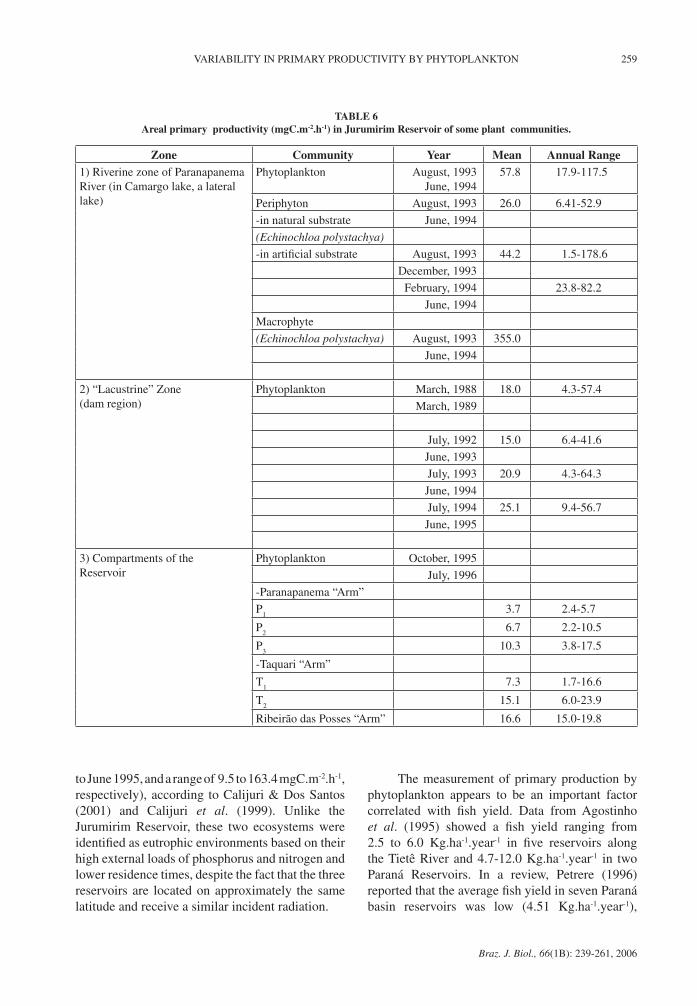
Although the areal primary productivity by phytoplankton in the Jurumirim reservoir was lower than that of other plant communities such as the periphyton and the macrophyte Echinochloa polystachya (table 6), considering the surface area (484 km2) of this artificial lake, we calculated a phytoplanktonic production of ≅ 6.8 ton c.h-1 (data computed using the mean values of the lacustrine zone and of the Paranapanema and taquari “Arms” – P and t stations, respectively (see location of the sites in Fig. 1). other reservoirs, such as Barra Bonita and Salto Grande (Americana), presented higher areal primary production (152.4 ± 193.8 mgc.m-2.h-1 Sd; cV = 127%, from July 1994
259VAriABility in PrimAry ProductiVity By PhytoPlAnkton
Braz. J. Biol., 66(1B): 239-261, 2006
to June 1995, and a range of 9.5 to 163.4 mgc.m-2.h-1, respectively), according to calijuri & dos Santos (2001) and calijuri et al. (1999). unlike the Jurumirim reservoir, these two ecosystems were identified as eutrophic environments based on their high external loads of phosphorus and nitrogen and lower residence times, despite the fact that the three reservoirs are located on approximately the same latitude and receive a similar incident radiation.
the measurement of primary production by phytoplankton appears to be an important factor correlated with fish yield. data from Agostinho et al. (1995) showed a fish yield ranging from 2.5 to 6.0 kg.ha-1.year-1 in five reservoirs along the tietê river and 4.7-12.0 kg.ha-1.year-1 in two Paraná reservoirs. in a review, Petrere (1996) reported that the average fish yield in seven Paraná basin reservoirs was low (4.51 kg.ha-1.year-1),
TABLE 6 Areal primary productivity (mgC.m-2.h-1) in Jurumirim Reservoir of some plant communities.
Zone Community Year Mean Annual Range1) riverine zone of Paranapanema river (in camargo lake, a lateral lake)
Phytoplankton August, 1993June, 1994
57.8 17.9-117.5
Periphyton August, 1993 26.0 6.41-52.9
-in natural substrate June, 1994
(Echinochloa polystachya)
-in artificial substrate August, 1993 44.2 1.5-178.6
december, 1993
February, 1994 23.8-82.2
June, 1994
macrophyte
(Echinochloa polystachya) August, 1993 355.0
June, 1994
2) “lacustrine” zone(dam region)
Phytoplankton march, 1988 18.0 4.3-57.4
march, 1989
July, 1992 15.0 6.4-41.6
June, 1993
July, 1993 20.9 4.3-64.3
June, 1994
July, 1994 25.1 9.4-56.7
June, 1995
3) compartments of thereservoir
Phytoplankton october, 1995
July, 1996
-Paranapanema “Arm”
P1
3.7 2.4-5.7
P2
6.7 2.2-10.5
P3
10.3 3.8-17.5
-taquari “Arm”
t1
7.3 1.7-16.6
t2
15.1 6.0-23.9
ribeirão das Posses “Arm” 16.6 15.0-19.8

260 henry, r. et al.
Braz. J. Biol., 66(1B): 239-261, 2006
while Gomes & miranda (2001) asserted that this yield corresponded to 9.1 kg.ha-1. the literature contains some estimates of fish yield calculated from primary production values (downing et al., 1990; hooker et al., 2001), which allow us to compare the actual correlation. Based on the Bulon-Vinberg relationship (hooker et al., 2001) and on the average primary production of the 3-year period in the lacustrine zone of the Jurumirim reservoir (table 1), and considering a 9-hour photoperiod for tropical regions (talling & lemoalle, 1998), the annual primary production by phytoplankton corresponded to 69 gc.m-2.year-1 and the estimated fish yield to 18.1 kg.ha-1.year-1. however, the data from a marginal lake at the mouth of the Jurumirim reservoir (table 6) shows a threefold higher annual primary production (190 gc.m-2.year-1) and a corresponding fish yield of 24.9 kg.ha-1.year-1. Fish yield data estimated from primary production values are consistent with information (17-28 kg.ha-1.year-1) reported by carvalho & Silva (1999) about the cPue for fish yields in the Jurumirim reservoir. the primary production data of some reservoirs in the state of São Paulo (calijuri et al., 1999) indicate fish yields of 17.0 kg.ha-1.year-1 (lobo reservoir), 15.4 kg.ha-1.year-1 (Jacaré-Pepira reservoir), 20.7 kg.ha-1.year-1 (Barra Bonita reservoir) and 25.0 kg.ha-1.year-1 (Salto Grande reservoir). these values are higher than the initial estimates (Agostinho et al., 1995). According to Petrere (1996), low fish yields can be attributed to three factors: a) low fishing intensity; b) lack of systematic stocking; and c) low densities of tilapia when compared with Brazil’s northeastern reservoirs, which show fish yields of 110 kg.ha-1.year-1. on the other hand, Gomes & miranda (2001) proposed that the low fish yields in the high Paraná reservoirs having low residence times are likely related with the asynchrony between water temperature and discharge and phytoplanktonic production, despite the high nutritional levels. consequently, hydrological and climatic factors are presumably the main primary controlling factors of fish yields.
Acknowlegments — this study was supported by FAPeSP (thematic project coordinated by Prof. J.G. tundisi-Proc. 91/ 0612-5). the authors are indebted to dr. luis carlos Gomes, to an anonymous reviewer, hamilton rodrigues, A. Jorcin and Silvia casanova, and rosilene c. c. rodrigues, respectively, for their invaluable comments and suggestions, field work, principal component analysis and computer work.
REFERENCES
AGoStinho, A. A., VAzzoler, A. e. A. de m. & thomAz, S. m., 1995, the high river Paraná Basin: limnological and ichthyological aspects, pp. 59-103. In: J. G. tundisi, C. E. M. Bicudo & T. matsumura-tundisi (eds.). Limnology in Brazil. rio de Janeiro, ABc/SBc.
AlVArez-coBelAS, m. & roJo, c., 1994, Spatial, seasonal and long-term variability of phytoplankton photosynthesis in lakes. J. Plankt . Res, 16: 1691-1716.
BeAVer, J. r. & criSmAn, t. l., 1991, temporal variability in algal biomass and primary productivity in Florida lakes relative to latitudinal gradients, organic color and trophic state. Hydrobiologia, 224: 89-97.
BrAy, G. A., 1960, A simple efficient liquid scintillation method for counting aqueous solutions in a liquid scintillation counter. Anal. Biochem., 1: 279-275.
cAliJuri, m. c. & doS SAntoS, A. c. A., 2001, temporal variations in phytoplankton primary production in a tropical reservoir (Barra Bonita, SP-Brazil). Hydrobiologia, 445: 11-26.
cAliJuri, m. c., deBerdt, G. l. B. & minoti, r. t., 1999, A produtividade primária pelo fitoplâncton na represa de Salto Grande (Americana-SP), pp. 109-148. In: R. henry (ed.). Ecologia de reservatórios: estrutura, função e aspectos sociais. ed. FAPeSP/ FundiBio, Botucatu, SP.
cArVAlho, e. d. & SilVA, V. F. B., 1999. Aspectos ecológicos da ictiofauna e da produção pesqueira do reservatório de Jurumirim (Alto do rio Paranapanema, São Paulo), pp. 771-799. In: R. henry (ed.). Ecologia de Reservatórios: estrutura, função e aspectos sociais. ed. FAPeSP/ FundiBio, Botucatu, SP.
doWninG, J. A., PlAnte, c. & lAlonde, S., 1990, Fish production correlated with primary productivity, not the morphoedaphic index. Can J. Fish. Aquat. Sci, 47: 1929-1936.
FrAnco, G. m. m., 1982, Ciclo sazonal da produção primária, “standing-stock” do fitoplâncton e fatores ambientais na Represa de Jacaré-Pepira (Brotas, SP). tese - uFScAr, São carlos, 289p.
GAnF, G. G., 1972, the regulation of net primary production in lake George, uganda, east Africa, pp. 693-708. In: Z. kajak & A. hillbricht-ilkowska. Productivity problems of freswaters. krakow, Polish Scientific Publishers.
GAnF, G. G., 1975, Photosynthetic production and irradiance-photosynthesis relationships of the phytoplankton from a shallow equatorial lake (lake George, uganda). Oecologia, 18: 165-183.
GAnF, G. G. & Viner, A. B., 1973, ecological stability in a shallow equatorial lake (lake George, uganda). Proc. R. Sc. (B), 184: 321-346.
GoltermAn, h. l. & clymo, r. S., 1969, Methods for chemical analysis of freshwaters. Blackwell Scientific Publications. oxford. 174p.
GomeS, l. c. & mirAndA, l. e., 2001, hydrologic and climatic regimes limit phytoplankton biomass in reservoirs of the upper Paraná river Basin, Brazil. Hydrobiologia, 457: 205-214.

261VAriABility in PrimAry ProductiVity By PhytoPlAnkton
Braz. J. Biol., 66(1B): 239-261, 2006
hArriS, G. P., 1978, Photosynthesis, productivity and growth: The physiological ecology of phytoplankton. Archiv für hydrobiologie, Beiheft 10, e. Schweizerbart’sche Verlagsbuchhandlung (nagele u. obermiller). Stuttgart. 171p.
henry, r., 1990, Amonia ou fosfato como agente estimulador do crescimento do fitoplâncton da represa de Jurumirim (rio Paranapanema, SP). Rev. Bras. Biol., 50(5): 883-892.
henry, r., 1992, the oxygen deficit in Jurumirim reservoir (Paranapanema river, São Paulo, Brazil). Jpn. J. Limnol., 53(4): 379-384.
henry, r., 1993, Primary production by phytoplankton and its controlling factors in Jurumirim reservoir (São Paulo, Brazil). Rev. Brasil. Biol., 53(3): 489-499.
henry, r., 1993, thermal regime and stability of Jurumirim reservoir (Paranapanema river, São Paulo, Brazil). Int. Revue Ges. Hydrobiol., 78(4): 501-511.
henry, r., 1995, the thermal structure of some lakes and reservoirs in Brazil, pp. 351-363. In: J. G. tundisi et al. (eds.). Limnology in Brazil. ABC/SBL, rio de Janeiro.
henry, r. & GouVeiA, l., 1993, os fluxos de nutrientes e seston em cursos de água do Alto Paranapanema (São Paulo)-sua relação com usos do solo e morfologia das bacias de drenagem. Anais Acad. Bras. Ciências, 65(4): 439-451.
henry, r., SAntoS, A. A. n. & cAmArGo, y. r., 1999, transporte de sólidos suspensos, n e P total pelos rios Paranapanema e taquari e uma avaliação de sua exportação na represa de Jurumirim, pp. 687-710. In: R. henry (ed.). Ecologia de Reservatórios: estrutura, função e aspectos sociais. ed. FAPeSP/FundiBio. Botucatu, SP.
hooker, e., choW-WonG, n., riVAS, k., erikiSon, r., AhlGren, i. & AhlGren, G., 2001, Primary production and estimation of potencial fish yield in lake cociboba, nicaragua. Verh. Internat. Verein. Limnol., 27: 3589-3594.
kimmel, B. l., lind, Q. t. & PAulSon, l. J., 1990, reservoir primary production, pp. 133-193. In: K. W. thornton, B. L. kimmel & F. E. Payne (eds.). Reservoir Limnology: ecological perspectives. John & Sons, inc. new york.
koroleFF, F., 1976, determination of nutrients, pp. 117-181. In: K. Grasshoff (ed.). Methods of seawater analysis. Verlag. chemie Weinheim.
lemoAlle, J., 1981, Photosynthetic production and phytoplankton in the euphotic zone of some African and temperate lakes. Rev. Hydrobiol. Trop., 11: 31-37.
mAckereth, F. J. h., heron, J. & tAllinG, J. F., 1978, Water analysis: some revised methods for limnologists. Freshwater Biological Association Scientific Publication nº 36, titus Wilson & Son ltd, kendall. 117p.
melAck, J. m., 1979, temporal variability of phytoplankton in a tropical lakes. Oecologia, 44: 1-7.
mitSukA, P. m. & henry, r., 2002, the fate of copepod populations in the Paranapanema river (São Paulo, Brazil), downstream the Jurumirim dam. Braz. Arch. Biol. Techn., 45(4): 479-490.
noGueirA, m. G., 2000, Phytoplankton composition, domi-nance and abundance as indicators of environmental com-partimentalization in Jurumirim reservoir (Paranapanema river) São Paulo, Brazil. Hydrobiologia, 431: 115-128.
noGueirA, m. G., 2001, zooplankton composition, dominance and abundance as indicators of environmental com-partimentalization in Jurumirim reservoir (Paranapanema river), São Paulo, Brazil. Hydrobiologia, 455: 1-18.
noGueirA, m. G., henry, r. & mAricAtto, F. e., 1999, Spatial and temporal heterogeneity in the Jurumirim reservoir, São Paulo, Brazil. Lakes & Reservoirs: Res. Manage., 4: 107-120.
Petrere, Jr. m., 1996, Fisheries in large tropical reservoirs in South America. Lakes and Reservoirs, Res. Manage., 2: 111-133.
roBArtS, r. d., 1979, underlight penetration, chlorophyll-a and primary production in a tropical African lake (lake mc ilwaine, rhodesia). Arch. Hydrobiol., 86: 423-444.
SePhton, d. h. & hArriS, G. P., 1984, Physical variability and phytoplankton communities. Vi.day-to-day changes in primary productivity and species abundance. Arch. Hydrobiol., 102: 155-175.
StricklAnd, J. d. & PArSonS, t. r., 1960, A manual of sea water analysis. Bull. Fish. Res .Bd. Can., 125: 1-185.
tAllinG, J. F., 1957, the phytoplankton population as a com-pound photosynthetic system. New Phytol., 56: 133-149.
tAllinG, J. F., 1965, the photosynthetic activity of phyto-plankton in east African lakes. Int. Rev. ges. Hydrobiol., 50: 1-32.
tAllinG, J. F., 1992, enviromental regulation in African shallow lakes and wetlands. Rev. Hydrobiol. Trop., 25: 87-144.
tAllinG, J. F. & lemoAlle, J., 1998, Ecological dynamics of tropical inland waters. cambridge, university Press, uk. 441p.
tundiSi, J. G. & mAtSumurA-tundiSi, t., 1990, limnology and eutrophication of Barra Bonita reservoir, São Paulo State, southern Brazil. Arch. Hydrobiol. Beih. Ergebn. Limnol., 33: 661-672.
tundiSi, J. G., mAtSumurA-tundiSi, t., rochA, o., Gentil, J. G. & nAkAmoto, n., 1977, Primary production, standing-stock of phytoplankton and ecological factors in a shallow reservoir (represa de Broa, São carlos, Brazil). Sem. Medio Ambiente y Represas, Montevideo, 1: 138-172.
VollenWeider, r. A., 1974, A manual on methods for measuring primary production in aquatic environments. Blackwell Scientific Publications, london, 225p.