Embed Size (px)
Citation preview
Annual and Special Shareholder MeetingMay 17, 2018

2
2017 in Review
Mandate:
Increase light oil exposure
Increase netbacks
Reduce operating Costs
Maintain dividend

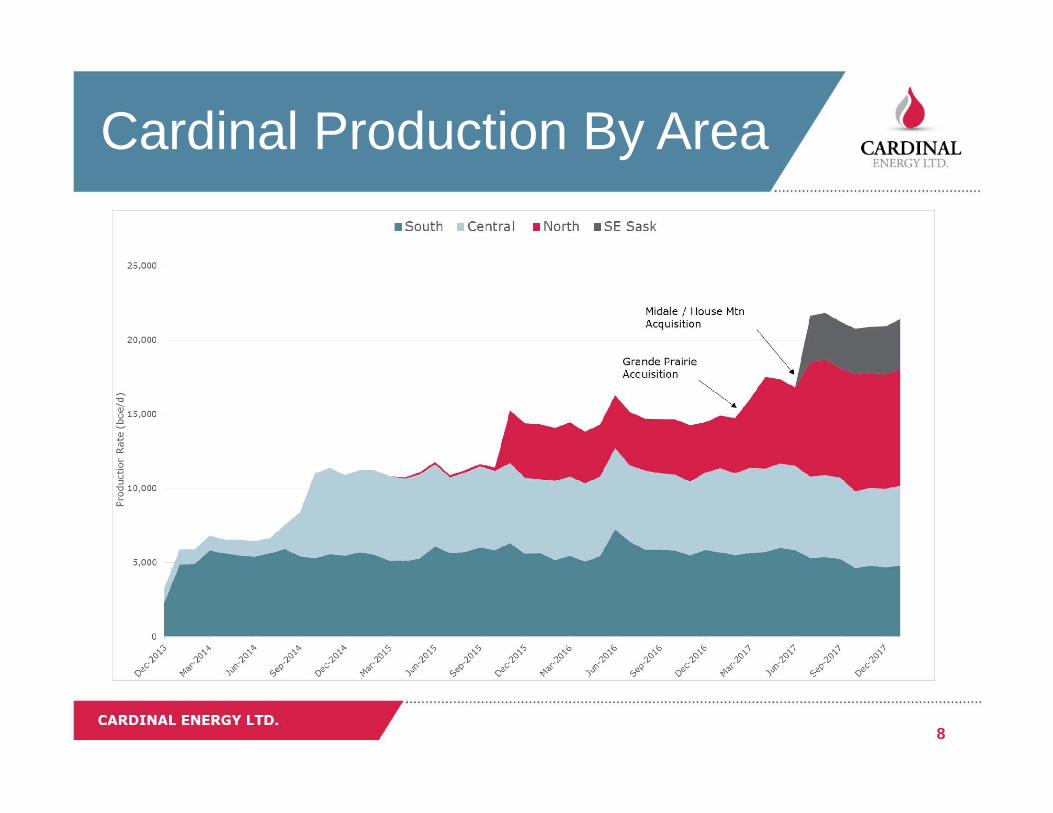
Grande Prairie Acquisition
PV10 excludes consideration of abandonment liability
Grande Prairie Acquisition (March 2017)
MM$Acquisition Consideration 312017 Capital Expenditures 12
Total Capital 43
2017 Cash Flow from Assets 6Net Capital Outlay 2017 37
Grande Prairie Acquisition – YE 2017 PV10, MM$PDP TP TPP
YE 2017 Closing 63 84 100
Reserves , Mmboe 6 8 9
3

0
1,000
2,000
3,000
4,000
5,000
6,000
08-Jul-17 08-Aug-17 08-Sep-17 08-Oct-17 08-Nov-17 08-Dec-17 08-Jan-18
boe/
d
Midale/House Mountain Historical Production
SE Sask (Midale)
House Mountain
PV10 excludes consideration of abandonment liability
Midale/House Mountain Acquisition (July 2017)
Midale/House Mtn Acq YE 2017 PV10, MM$PDP TP TPP
YE 2017 Closing 346 362 452
Reserves , Mmboe 22 23 30
MM$Acquisition Consideration 296 2017 Capital Expenditures 3
Total Capital 299
2017 Cash Flow from Assets 31 Net Capital Outlay 2017 268
4
5
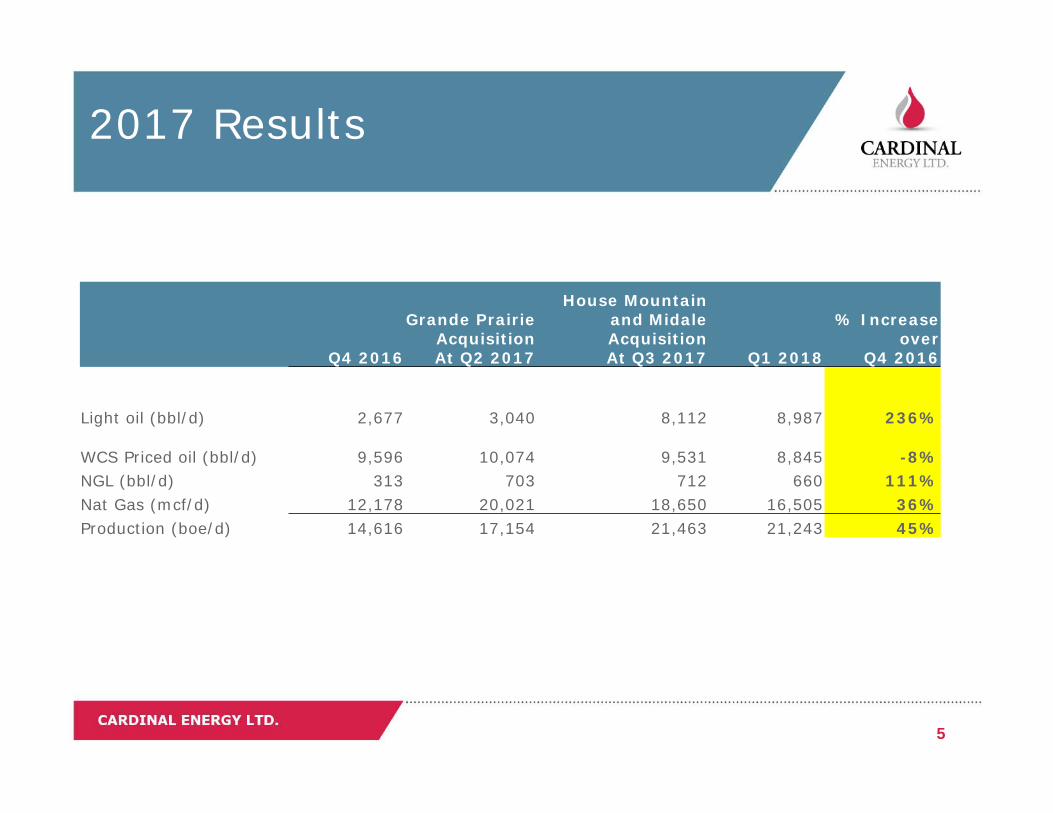
2017 Results
Q4 2016
Grande PrairieAcquisitionAt Q2 2017
House Mountain and MidaleAcquisitionAt Q3 2017 Q1 2018
% Increase over
Q4 2016
Light oil (bbl/d) 2,677 3,040 8,112 8,987 236%
WCS Priced oil (bbl/d) 9,596 10,074 9,531 8,845 -8%NGL (bbl/d) 313 703 712 660 111%Nat Gas (mcf/d) 12,178 20,021 18,650 16,505 36%Production (boe/d) 14,616 17,154 21,463 21,243 45%
6
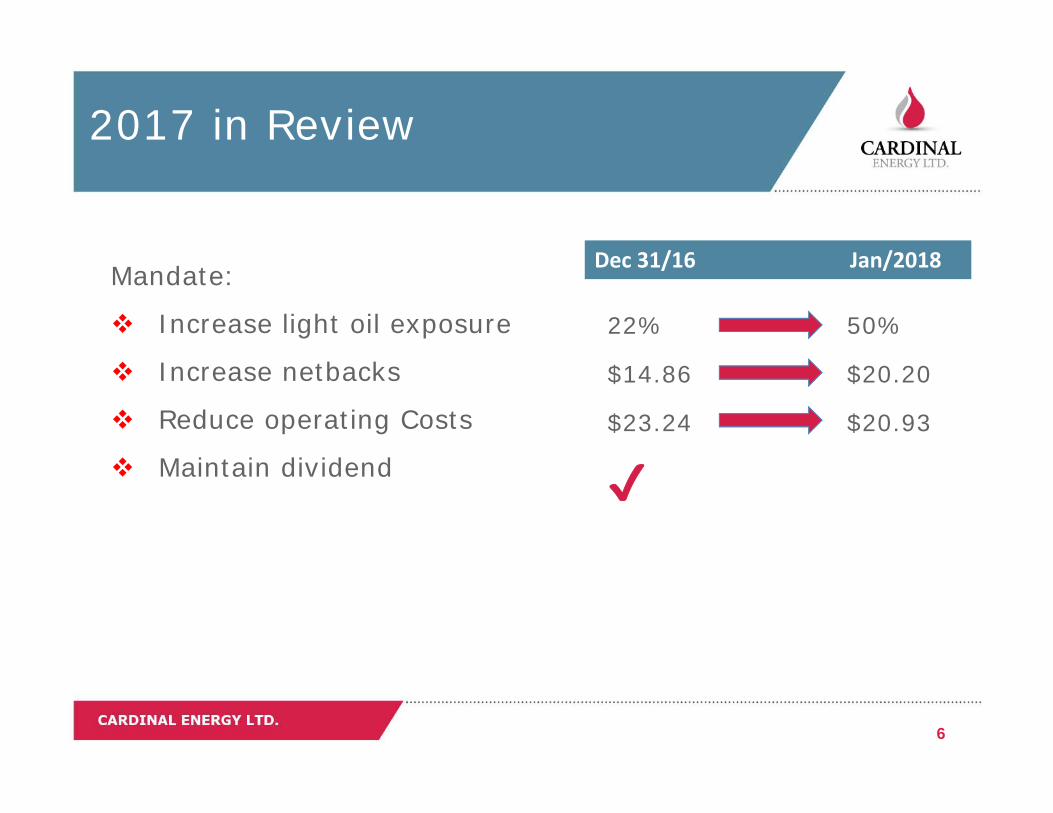
2017 in Review
Mandate:
Increase light oil exposure
Increase netbacks
Reduce operating Costs
Maintain dividend
Dec 31/16 Jan/2018
22% 50%
$14.86 $20.20
$23.24 $20.93
✔

7
2018 Outlook
Sustainable Business Model
Growth and Income funded thru cash flow, at less than 100% payout ratio
Focus Areas:
Reduce Net Bank Debt to 1x adjusted funds flow Maintaining best in class 10% decline Improve netback Begin long lead time operating cost reduction projects Maintain dividend
8
Cardinal Production By Area
9
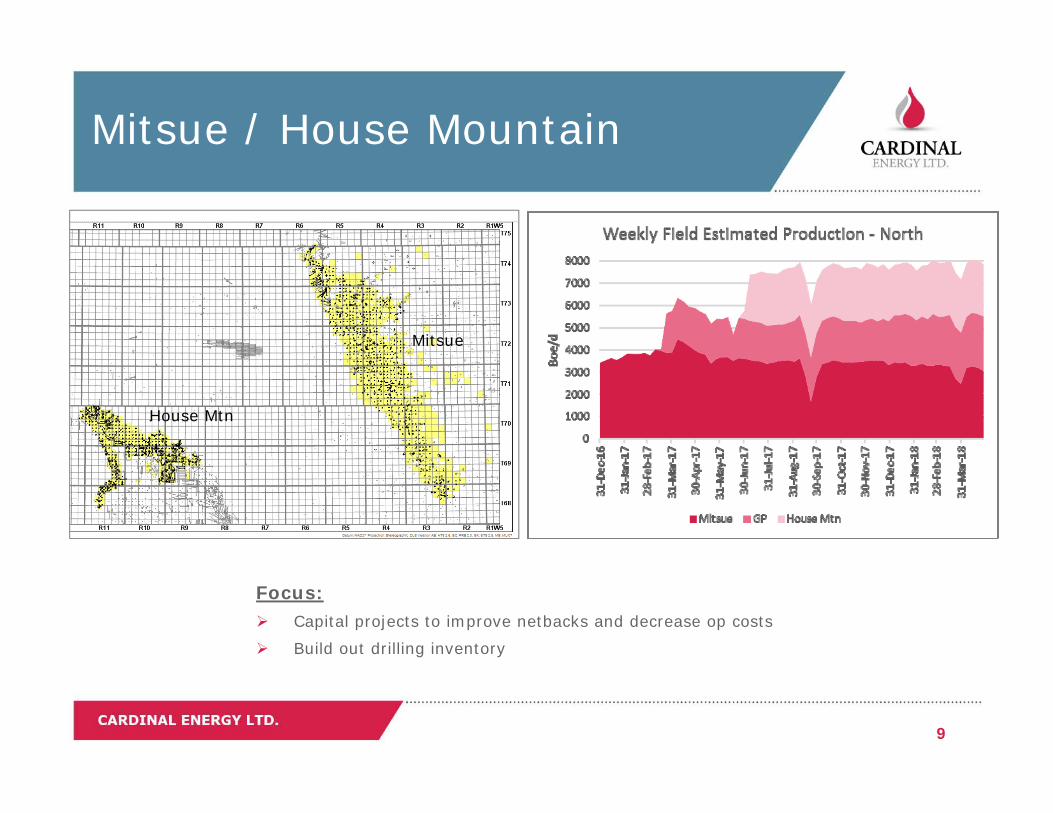
Mitsue / House Mountain
House Mtn
Mitsue
Focus: Capital projects to improve netbacks and decrease op costs
Build out drilling inventory
10
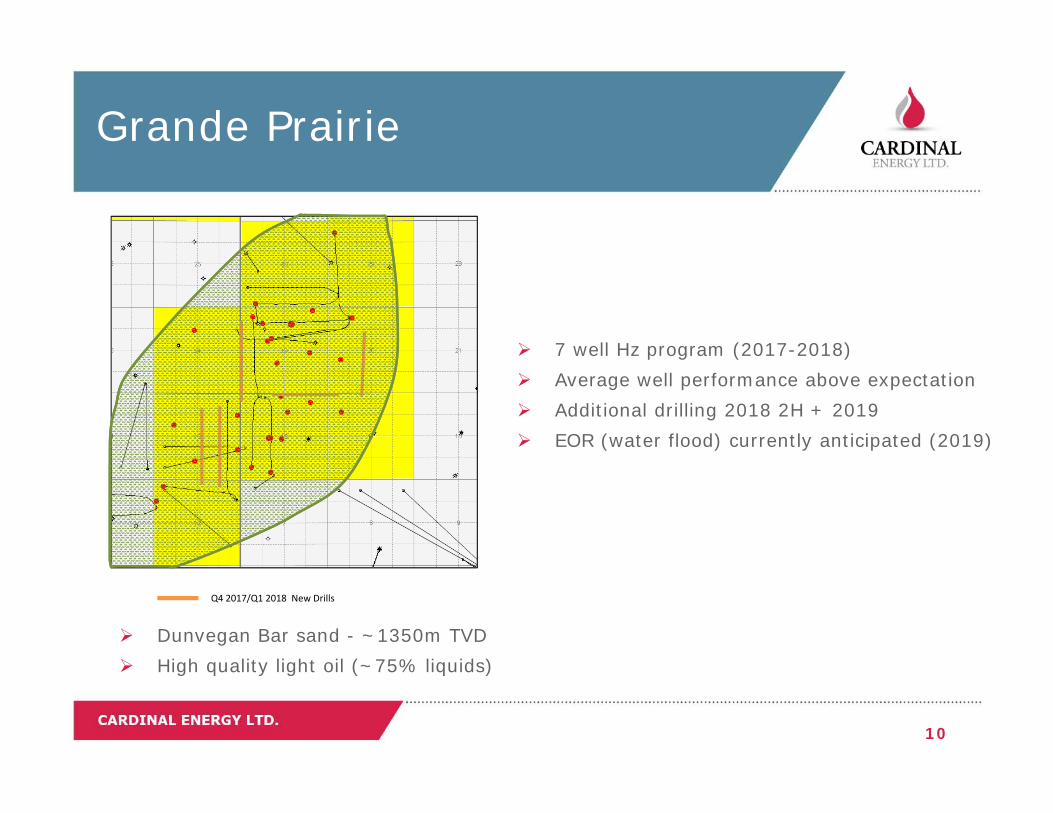
Grande Prairie
7 well Hz program (2017-2018) Average well performance above expectation Additional drilling 2018 2H + 2019 EOR (water flood) currently anticipated (2019)
Q4 2017/Q1 2018 New Drills
Dunvegan Bar sand - ~1350m TVD High quality light oil (~75% liquids)
11
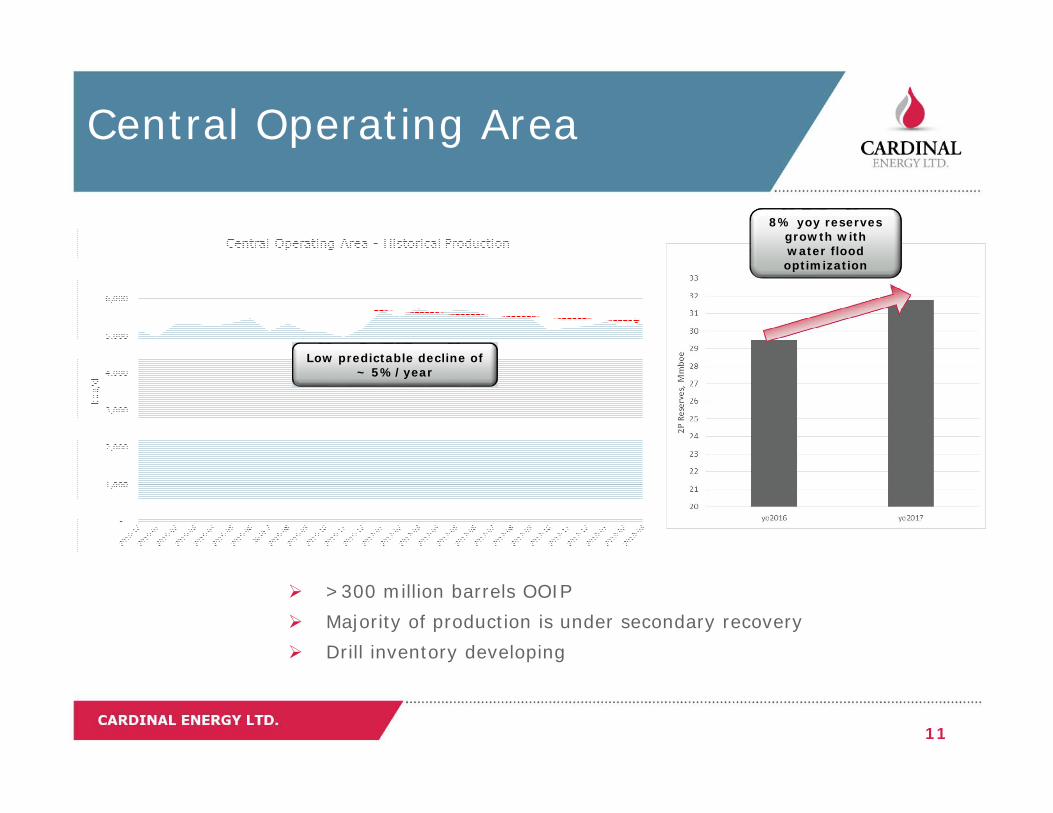
Central Operating Area
>300 million barrels OOIP Majority of production is under secondary recovery Drill inventory developing
Low predictable decline of ~ 5%/year
8% yoy reserves growth with water flood optimization

South - Bantry Strat Program
Initial success (2014-2016) focused in areas supported by abundant vertical well control
10 location strat program drilled (Jan-Feb 2018) to increase confidence in next round of horizontal drills
2018 Focus
Operating cost optimization
2H drilling program
Inventory expansion
Water flood optimization
12
Primary area of initial drilling
13
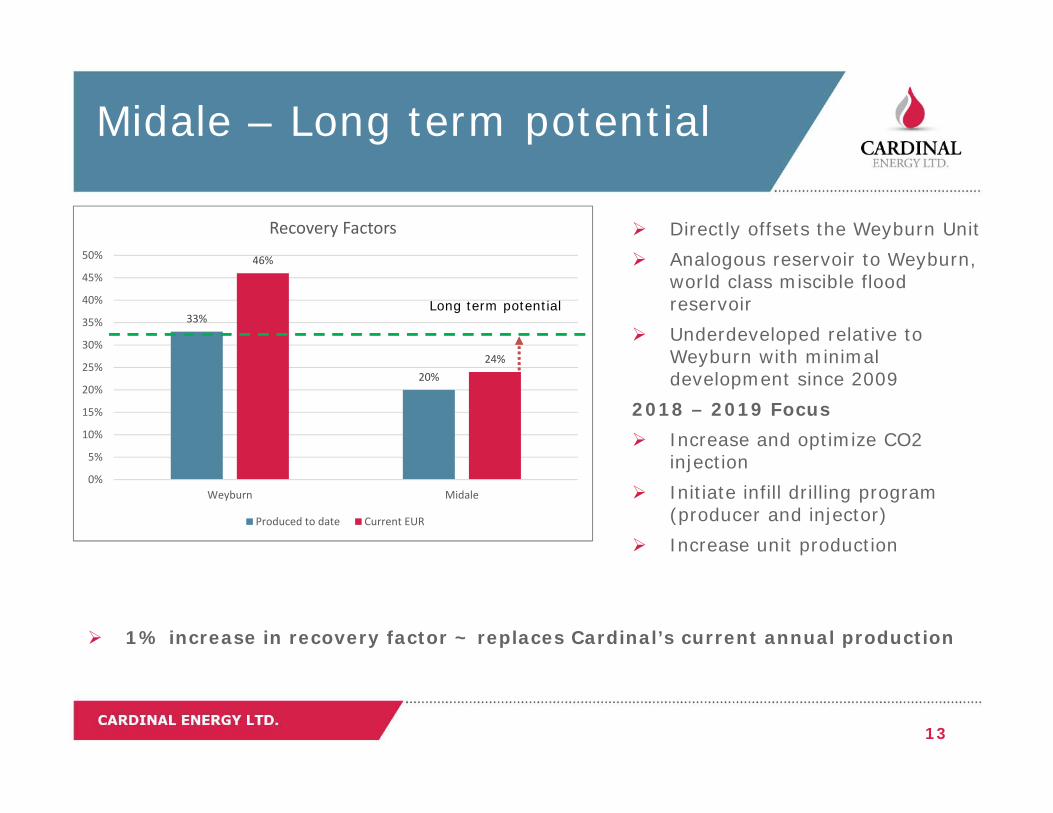
Midale – Long term potential
1% increase in recovery factor ~ replaces Cardinal’s current annual production
33%
20%
46%
24%
0%
5%
10%
15%
20%
25%
30%
35%
40%
45%
50%
Weyburn Midale
Recovery Factors
Produced to date Current EUR
Directly offsets the Weyburn Unit Analogous reservoir to Weyburn,
world class miscible flood reservoir
Underdeveloped relative to Weyburn with minimal development since 2009
2018 – 2019 Focus Increase and optimize CO2
injection Initiate infill drilling program
(producer and injector) Increase unit production
Long term potential

14
Balance of 2018
Q1 2018 Q2 2018 Q3 2018 Q4 2018
Total Production 21,200 20,500 21,250 21,500+
Bank Debt $213 M $200 M
Payout 98% Less than 100% Less than 100% Less than 100%
Dividend $0.035/month $0.035/month $0.035/month $0.035/month

15
AdvisoryForward-looking Statements
This presentation contains forward-looking statements and forward-looking information (collectively "forward-looking information") within the meaning of applicable securities laws relating to the Cardinal's plans and other aspects of Cardinal's anticipated future operations, management focus, objectives, strategies, financial, operating and production results. Forward-looking information typically uses words such as "anticipate", "believe", "project", "expect", "goal", "plan", "intend", "may", "would", "could" or "will" or similar words suggesting future outcomes, events or performance. The forward-looking statements contained in this presentation speak only as of the date thereof and are expressly qualified by this cautionary statement.
Specifically, this presentation contains forward-looking statements relating to our dividend policy, future payout ratios, capital expenditure plans, future abandonment and reclamation costs, anticipated operating costs, expected development capital, average and exit production, product mix, cash flow, net bank debt, net debt to cash flow, hedging plans, future acquisitions, drilling, completion and optimization opportunities, commodity prices and differentials, exchange rates, Cardinal’s asset base and future opportunities and prospects for development and growth therefrom.
Forward-looking statements regarding Cardinal are based on certain key expectations and assumptions of Cardinal concerning anticipated financial performance, business prospects, strategies, regulatory developments, current and future commodity prices and exchange rates, applicable royalty rates, tax laws, future well production rates and reserve volumes, future operating costs, the performance of existing and future wells, the success of its exploration and development activities, the sufficiency and timing of budgeted capital expenditures in carrying out planned activities, the availability and cost of labor and services, the impact of increasing competition, conditions in general economic and financial markets, availability of drilling and related equipment, effects of regulation by governmental agencies, the ability to obtain financing on acceptable terms which are subject to change based on commodity prices, market conditions, drilling success and potential timing delays and dividend re-investment plan and stock dividend plan participation.
These forward-looking statements are subject to numerous risks and uncertainties, certain of which are beyond Cardinal's control. Such risks and uncertainties include, without limitation: the impact of general economic conditions; volatility in market prices for crude oil and natural gas; industry conditions; currency fluctuations; imprecision of reserve estimates; liabilities inherent in crude oil and natural gas operations; environmental risks; incorrect assessments of the value of acquisitions and exploration and development programs; competition from other producers; the lack of availability of qualified personnel, drilling rigs or other services; changes in income tax laws or changes in royalty rates and incentive programs relating to the oil and gas industry; hazards such as fire, explosion, blowouts, and spills, each of which could result in substantial damage to wells, production facilities, other property and the environment or in personal injury; ability to access sufficient capital from internal and external sources and access to markets.
Management has included the forward-looking statements above and a summary of assumptions and risks related to forward-looking statements provided in this presentation in order to provide readers with a more complete perspective on Cardinal's future operations and such information may not be appropriate for other purposes. Cardinal's actual results, performance or achievement could differ materially from those expressed in, or implied by, these forward-looking statements and, accordingly, no assurance can be given that any of the events anticipated by the forward-looking statements will transpire or occur, or if any of them do so, what benefits that Cardinal will derive there from. Readers are cautioned that the foregoing lists of factors are not exhaustive. These forward-looking statements are made as of the date of this presentation and Cardinal disclaims any intent or obligation to update publicly any forward-looking statements, whether as a result of new information, future events or results or otherwise, other than as required by applicable securities laws.
This presentation contains future-oriented financial information and financial outlook information (collectively, "FOFI") about our prospective results of operations, cash flows, payout ratio and components thereof, all of which are subject to the same assumptions, risk factors, limitations, and qualifications as set forth in the above paragraphs. FOFI contained in this presentation were made as of the date hereof and is provided for the purpose of describing our anticipated future business operations. We disclaim any intention or obligation to update or revise any FOFI contained in this presentation, whether as a result of new information, future events or otherwise, unless required pursuant to applicable law. Readers are cautioned that the FOFI contained in this presentation should not be used for purposes other than for which it is disclosed herein.
Other Advisories
Cash dividends are not guaranteed. Although Cardinal intends to make dividends in the amounts indicated to shareholders, cash dividends may be reduced or suspended. The actual amount distributed, if any, will depend on numerous factors and conditions existing from time to time.
Finding and developments costs and finding, development and acquisition costs are used as a measure of capital efficiency. Finding and development costs are calculated on a per boe basis by dividing the aggregate of the change in future development costs from the prior year for the particular reserve category and the costs incurred on development and exploration activities in the year by the change in reserves (including royalty interest reserves) from the prior year for the reserve category. Development and exploration expenditures include costs of land and seismic, but exclude capitalized general and administration costs. The aggregate of the exploration and development costs incurred in the most recent financial year and the change during that year in estimated future development costs generally will not reflect total finding and development costs related to reserves additions for that year. Finding development and acquisition costs are calculated on a per boe basis by dividing the aggregate of the change in future development costs from the prior year for the particular reserve category and the costs incurred on development and exploration activities and property acquisitions (net of dispositions) in the year by the change in reserves (including royalty interest reserves) from the year for the reserve category. Acquisition costs include the announced purchase price of acquisitions rather than the amounts allocated to property, plant and equipment and exploration and evaluation assets for accounting purposes. The acquired cost per boe included all company interest reserves, including royalty interest reserves. Recycle ratio is calculated by dividing operating netback per boe (without realized gains on commodity contracts on a boe basis) by the finding, development and acquisition costs for the relevant reserve category for the year. Reserve life index is calculated based on the amount for the relevant reserve category divided by fourth quarter average daily working interest production.

16
AdvisoryNon-GAAP Measures
This presentation contains the terms "adjusted funds flow", “free cash flow”, "total payout ratio", "netback", "net bank debt", "net bank debt" and "net bank debt to adjusted funds flow" which do not have a standardized meaning prescribed by International Financial Reporting Standards ("IFRS" or, alternatively, "GAAP") and therefore may not be comparable with the calculation of similar measures by other companies. Cardinal uses adjusted funds flow and total payout ratio to analyze operating performance and assess leverage. Cardinal feels these benchmarks are key measures of profitability and overall sustainability for the Company. adjusted funds flow and total payout ratio are not intended to represent operating profits nor should they be viewed as an alternative to cash flow provided by operating activities, net earnings or other measures of performance calculated in accordance with GAAP. adjusted funds flow is calculated as cash flows from operating activities adjusted for changes in non-cash working capital and decommissioning expenditures. "Netback" is calculated on a boe basis and is determined by deducting royalties and operating expenses from petroleum and natural gas revenue. Netback is utilized by Cardinal to better analyze the operating performance of its petroleum and natural gas assets against prior periods. “Free cash flow” represents adjusted funds flow less dividends declared and less development capital expenditures necessary to maintain the Company's base production "Total payout ratio" represents the ratio of the sum of dividends declared (net of participation in the DRIP and SDP) plus development capital expenditures necessary to maintain the Company's base production divided by adjusted funds flow. Total payout ratio is a key measures to assess our ability to finance operating activities, capital expenditures and dividends. The term "net bank debt" is not recognized under GAAP and is calculated as bank debt plus current liabilities less current assets (adjusted for the fair value of financial instruments and the current portion of the decommissioning obligation. "Net bank debt" is used by management to analyze the financial position, liquidity and leverage of Cardinal. "Net bank debt to adjusted funds flow" is calculated as net bank debt divided by adjusted funds flow for the trailing twelve month period. The ratio of net bank debt to adjusted funds flow is used to measure the Company’s overall debt position and to measure the strength of the Company’s balance sheet. Cardinal monitors this ratio and uses this as a key measure in making decisions regarding financing, capital expenditures and dividend levels.
Advisory Regarding Oil and Gas Information
The crude oil, natural gas and natural gas liquid reserves of Cardinal presented herein were evaluated by GLJ Petroleum Consultants (“GLJ“), Cardinal's independent reserves evaluators, in accordance with the requirements of National Instrument 51-101 (“NI 51-101”) and the Canadian Oil and Gas Evaluation Handbook effective as of December 31, 2017 and using consultants average forecast product prices prices as of December 31, 2017. Actual crude oil, natural gas and natural gas liquids reserves may be greater than or less than the estimates provided herein. Reserves included herein are stated on a company interest basis (working interest before deduction of royalties plus royalty interests received) unless noted otherwise. The estimates of reserves for individual properties may not reflect the same confidence level as estimates of reserves for all properties due to the effects of aggregation. The estimated values of the future net reserves disclosed do not necessarily represent the market value of such reserves.Where applicable, oil equivalent amounts have been calculated using a conversion rate of six thousand cubic feet of natural gas to one barrel of oil. BOEs may be misleading, particularly if used in isolation. A boe conversion ratio of six thousand cubic feet of natural gas to one barrel of oil is based on an energy equivalency conversion method primarily applicable at the burner tip and does not represent a value equivalency at the wellhead. Given the value ratio based on the current price of crude oil as compared to natural gas is significantly different from the energy equivalency of 6 Mcf: 1 Bbl, utilizing a conversion ratio at 6 Mcf: 1 Bbl may be misleading as an indication of value.These materials include estimates of Original Oil in Place (OOIP) (and recovery rates based on these estimates of OOIP) that have been internally estimated by Cardinal. The OOIP estimate has not been prepared in accordance with National Instrument 51-101 and there is no certainty that such volumes exist or that such volumes will be recovered. OOIP is the equivalent to Discovered Petroleum Initially In Place (DPIIP) and is defined in the Canadian Oil and Gas Evaluation Handbook as the quantity of oil that is estimated to be in place within a known accumulation prior to production and referenced as discovered resources. There is no certainty that it will be viable to produce any portion of the resources.