Embed Size (px)
Citation preview

ComprehensiveAnnual
Financial ReportFor the Fiscal Year Ended June 30, 2011
Celebrating Milpitas
City of MilpitasCALIFORNIA
Halloween, The Enchanted Forest Summer Concert
Veterans Day Ceremony Red, White, & Boom Concert & Fireworks Show
CITY OF MILPITAS, CALIFORNIA
COMPREHENSIVE ANNUAL FINANCIAL REPORT
FOR THE FISCAL YEAR ENI)ED J IJNE 30, 2011
Prepared by
TI{E DEPARTMENT OF FINANCIAL SERVICES

CITY OF MILPITASCorn prehensive Annual Financial ReportFor the Fiscal Year Ended June 30, 2011
I INTRODUCTORY SECTION:
Table of Contents
Letter of Transmittal v
Directory of City Officials xiv
Map of City’s Location xv
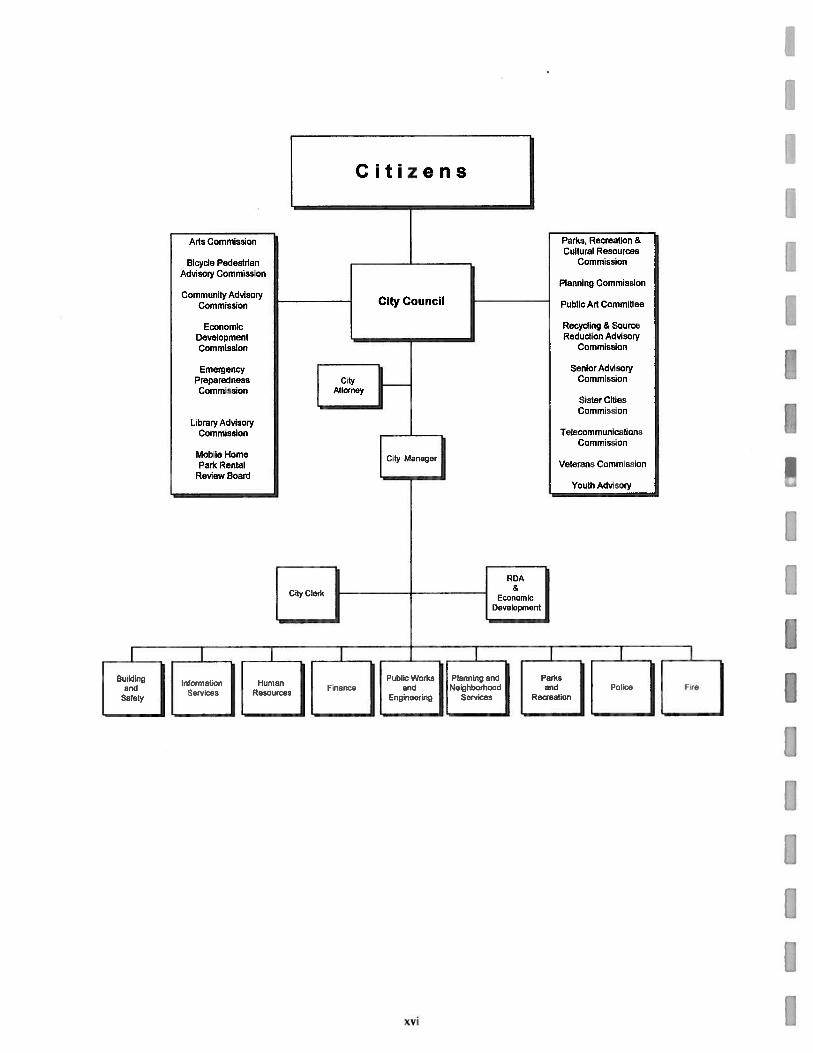
Organization Chart xvi
GFOA Certificate of Achievement xvii
(FINANCIAL SECTION:
Independent Auditor’s Report on Basic Financial Statements 1
Management’s Discussion andAnalysis 3
Basic Financial Statements:
Government-wide Financial Statements:
Statement of Net Assets 21
Statement of Activities 22
Fund Financial Statements:
Governmental Funds:
Balance Sheet 26
Statement of Revenues, Expenditures, and Changes in Fund Balances 28
Reconciliation of the Net Change in Fund Balances Total GovernmentalFunds with the Statement of Activities 30
Statements of Revenues. Expenditures, and Changes in Fund l3alances Budget and Actual:
General Fund 31
Housing Reserve Fund 32
CITY OF MILPITASComprehensive Annual Financial ReportFor the Fiscal Year Ended June 30, 2011
_________
fjgcFINANCL4L SECTION: (Continued) I
Proprietary Funds:
Statement of Net Assets 33
Statement of Revenue, Expenses and Changes in Fund Net Assets 34
Statement of Cash Flows 35
Fiduciary Funds:
Statement of Fiduciary Net Assets 37
Notes to Basic Financial Statements 39
Supplemental lnformation:
Major Governmental Funds Other Than the General Fund and Special Revenue Funds:
Schedule of Revenues, Expenditures, and Changes in Fund Balances -- Budget and Actual:
Redevelopment Project Fund 87
Street Improvement Fund 88
Non-major Governmental Funds:
Combining Balance Sheets 90
Combining Statements of Revenues, Expenditures and Changesin Fund Balances 92
Combining Schedule of Revenues, Expenditures and Changes inFund Balances - Budget and Actual (Non GAAP Legal Basis) 94
Fiduciar’ Funds:
Statements oIChanges in Assets and Liabilities — All Agency Funds 99
II
CITY OF MILPITASConijireliensive Annual Financial ReportFor (lie Fiscal Yeai- Ended June 30, 2011
I STATISTICAL SECTION:
Net Assets — Last Ten Fiscal Years 101
Changes in Net Assets — Last Ten Fiscal Years 102
Fund Balances, Governmental Funds — Last Ten Fiscal Years 104
Changes in Fund Balances, Governmental Funds — Last Ten Fiscal Years 105
Assessed Value and Actual Value of Taxable Property — Last Ten Fiscal Years 106
Direct and Overlapping Property Tax Rates — Last Ten Fiscal Years 107
Principal Property Tax Payers — Fiscal Year 201 0-2010-11 and 20012001-022002 108
Property Tax Levies and Collections — Last Ten Fiscal Years 109
Ratios of Outstanding Debt by Type — Last Ten Fiscal Years 110
Bonded Debt Pledge Revenue Coverage Redevelopment AgencyTax Allocation Bonds — Last Ten Fiscal Years Ill
Computation of Direct and Overlapping Debt 112
Legal Debt Margin Information — Last Ten Fiscal Years 113
Installment Payment Coverage, Sewer Certificates of Participation 114
Bimonthly Sewer Rates by Customer Class — Last Ten Fiscal Years 115
Demographic and Economic Statistics --- Last Ten Fiscal Years 116
Principal Employers—Fiscal Year 2009-10 and 2001-2002 117
Taxable Sales by Category — Last Ten Calendar Years 118
Direct and Overlapping Sales Tax Rates-- Last Ten Fiscal Years 119
Principal Sales Tax Payers— Calendar Years 2010 and 2001 120
Authorized Full-Time Equivalent Employees by Function/Program —
Last Ten Fiscal Years 121
Operating Indicators by Function/Program — Last Ten Fiscal Years 122
Capital Assets Statistics by [unction/Program — Last Ten Fiscal Years 124
‘Ii


fl 4E CITY OF MILPITAS, 4 LA LA! VI AJ’OL LI V \RD \4wi lAS IALIO N A 9O ‘4t ‘. ‘JW ci mi pit S L (IV
November 1, 2011
Honorable Mayor, Members of the City Council and City Manager:
Submitted herewith is the Comprehensive Annual Financial Report (CAFR) of the City of Milpitas (theCity) for the fiscal year ended June 30, 2011. The report was prepared by the Finance Department of theCity. Responsibility for both the accuracy of the presented data and the completeness and fairness of thepresentation, including all disclosures, rests with the City. The data, as presented, is accurate in allmaterial aspects; and is presented in a manner designed to fairly set forth the financial position andresults of operations of the City as measured by the financial activity of its various funds. All disclosuresnecessary to enable the reader to gain the maximum understanding of the City’s financial affairs havebeen included. The organization of the financial report follows the guidelines set forth by theGovernment Finance Officers’ Association of the United States and Canada.
A separate single audit report has been prepared in conformity with the provisions of the Federal SingleAudit Act amendments of 1996 and U.S. Office of Management and Budget Circular A-133, “Audits ofState and Local Governments.”
THE REPORTING ENTITY AND ITS SERVICES
This report reflects the entity concept prescribed by generally accepted accounting principles. Itcombines the financial statements of the Milpitas Redevelopment Agency (the Agency), the MilpitasEconomic Development Corporation (the EDC), the Milpitas Housing Authority (the Housing Authority)and the Terrace Gardens Inc. with those of the City to constitute a single reporting entity. In accordancewith the criteria of the Government Accounting Standards Board Statement 14, the basic financialstatements include the financial activity of the City, the Agency, the EDC, and Terrace Gardens. Duringfiscal year 2011, the Milpitas Housing Authority did not have any financial activities. The Agency, EDC,I-lousing Authority, and Terrace Gardens are separate legal entities from the City and are controlled bythe City. The Agency, the EDC and the I-lousing Authority have the same governing board as the Cityand the City also has control of the Terrace Gardens’ governing board. However, the Agency andTerrace Gardens Inc. issue their own component unit financial statements.
N4ilpitas is a general law city of the State of California. The City was incorporated in 1954 and operatesunder a Council-Manager form of government. The City’s political and legislative body is the CityCouncil and is empowered by the general laws of the State of California to formulate citywide policy,including a fiscal program, City services, and appointment of the City Manager and City Attorney. Thereare four City Council members who are elected at-large for staggered four-year terms, and the Mayor isselected every two years in a separate citywide election.
The City provides a full range of municipal services. These include: police, fire, community services,public improvements, planning, building and public facility inspection, engineering, water and sewerutilities, redevelopment, and general administrative services.
( ciicral Iii Ioriiiatiiiri: Iflt-6 lOOt)
II
Citizens of’ the City desiring to assist the City Council in forming government policy may do so byserving on a City commission. The commissions act in an advisory capacity to the City Council. They
are: Planning Commission; Community Advisory Commission; Library Advisory Commission; Parks,
Recreation and Cultural Resources Commission; Telecommunications Commission; Arts Commission,
Bicycle Pedestrian Advisory Commission; Emergency Preparedness Commission; Senior Advisory
Commission; Recycling and Source Reduction Advisory Commission; Sister Cities Commission; Youth
Advisory Commission; Economic Development Commission, Veterans Commission, Public Art
Committee and the Mobile Home Park Rental Review Board.
IECONOMIC CONDITION, OUTLOOK AND ACTIVITY
Milpitas is situated within the Silicon Valley region, known throughout the world as the home of high
technology, innovation and research. Milpitas, considered the “Crossroads of Silicon Valley,” with most
of its 13.6 square miles of land situated between two major freeways, 1-680 and 1-880, has experienced
tremendous growth since its incorporation in 1954. Over the past 40 years, the population growth has
increased from 26,561 in 1970 to over 66,790 in 2010 (latest census). The Bay Area has experienced
significant employment growth from 1992 through 2000, adding more than 170,000 jobs. However, in
2001, Santa Clara County experienced its first negative job growth since 1992. Between 2002 and 2004,
over 130,000 jobs were lost as a result of the economic recession. Between 2005 and 2007, local
economy began to recover slowly until 2008 when the economy went into global recession due to
stibprime mortgages, plummeting home sales and meltdown of the financial market. This region was
severely impacted due to a concentration of the high-tech industry, heavy reliance on exports, decline of
home prices, and reduced consumer spending. Milpitas was similarly impacted because of its location
and comparable economic mix. The section below entitled “Major Development Activities in the City”
will discuss some of the development activities that are occurring in Milpitas.
There are approximately 1,790 acres or 2.9 square miles of land area in the City limits designated for
various industrial uses; about 271 acres are vacant and available in parcels ranging in size from V2 acre to
75 acres. Included in this acreage total arc eight industrial parks and 550 manufacturing plants. An
estimated 350 acres of land are dedicated to regional and community retail centers supporting 3.5 million
square feet of commercial shops. The Great Mall of the Bay Area is the largest enclosed mall in
Northern California, with approximately 1.1 million square feet of leasable space for retail andentertainment operations. Several local shopping centers serve regional needs for Asian-oriented retail
and services. IThe leading economic segments are office equipment, apparel stores, restaurants, and auto sales. ‘[he
five largest manufacturing employers are Cisco Systems, Inc., KLA-Tencor Corporation., LSI Logic
Corporation, and Flextronics. Other major employers include SanDisk Corporation and Linear
Technology. Several of these top employers make Milpitas their corporate headquarters. ‘[he two largest
non-manufacturing employers in Milpitas are The Great Mall of the Bay Area and the Milpitas Unified
School District.
Milpitas Redevelopmnetit Agency is one of the top ten RDAs in the State. With the 2003 expansion of (lie
Agency, Redevelopment Area I encompasses 2,230 acres or 26% of the City. The Project Area produces
over $35 million in annual tax increment. In November 2003 the Agency issued $200 million in tax
allocation bonds to generate funds for key City and Agency projects including a new library, major
infrastructure improvements and a new senior center. IIn April 2010, the Redevelopment Agency Board approved an amendment to the Project Area No. I
Redevelopment Plan to extend the time limit of the Plan and the time limit to collect tax increment, Ivi I
increase the tax increment limit and bonded indebtedness limit, and add approximately 600 acres to theProject Area.
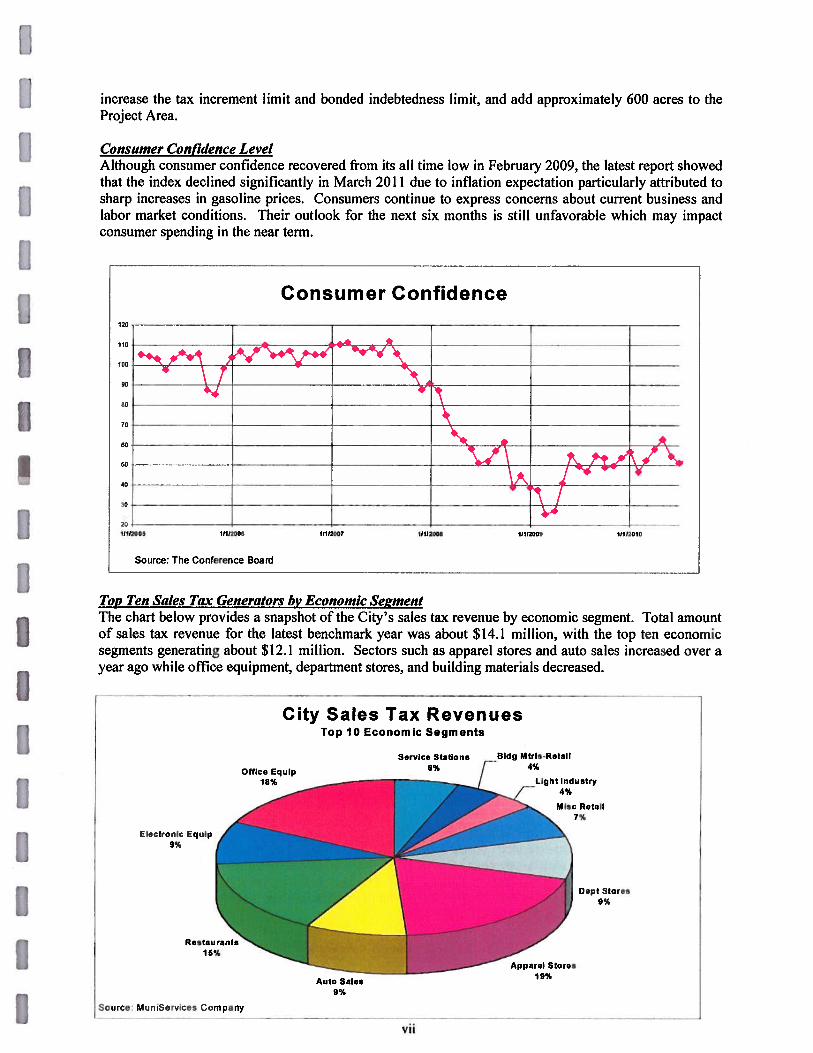
Consumer Confidence LevelAlthough consumer confidence recovered from its all time low in February 2009, the latest report showedthat the index declined significantly in March 2011 due to inflation expectation particularly attributed tosharp increases in gasoline prices. Consumers continue to express concerns about current business andlabor market conditions. Their outlook for the next six months is still unfavorable which may impactconsumer spending in the near term.
Top Ten Sales Tax Generators by Economic Sej’mentThe chart below provides a snapshot of the City’s sales tax revenue by economic segment. Total amountof sales tax revenue for the latest benchmark year was about $14.1 million, with the top ten economicsegments generating about $12.1 million. Sectors such as apparel stores and auto sales increased over ayear ago while office equipment, department stores, and building materials decreased.
Electronic Equip9%
Restaurants15%
Source: MurtiServices Company
City Sales Tax RevenuesTop 10 Economic Segments
Dept Stores9%
Consumer Confidence
¶1112005 11112006 11112087
Source: The Conference Board
11112008 1102809 11112010
I
Service Stations Bldg Mtrls-Retait
6% J 4%
Light Industry4%
Misc Retail7%
Apparel Stores19%
Auto Sales9%
vii
IMany of the major activities initiated in FYIO-1 I are consistent with the City Council’s direction to
focus on projects and funding that will provide for the economic stability of the community, especially
developments in the Midtown area that will enhance the City’s long-term financial condition.
Malor Development Activities in the City
Midtown Specific Plan — The vision for this area includes high density housing within walking distance
to light rail and BART to support the public investment in mass transit, transforming neighborhoods into
an attractive and economically vital district with plazas and a network of pedestrian and bicycle trails, a
vibrant streetscape along the north end of Main Street and a mixture of housing, shopping, employment,
entertainment, and cultural and recreational opportunities. The implementation efforts began with
several capital improvement projects such as the new Library, parking garage, Main Street and Abel
Street infrastructure improvements. Other development activities undertaken by outside agencies include
the construction of a County Health Center, a parking garage and a 103-unit Senior Housing apartment
building.
Transit Area Specific Plan — The City adopted a Transit Area Specific Plan in June 2008 which provides Ifor medium to high density development surrounding the fliture Montague/Capitol BART station and two
VTA Light Rail Stations. The intent of the Plan is to foster economic development of the area,
strengthen and expand retail uses to increase sales tax revenues, attract major retailers and provide
housing and amenities such as parks, retail and restaurants. In February 2009, the Council approved the
first high density residential project in this area. The project consisted of 639 housing units and will be
developed by Citation Homes. 1-lowever, there is no estimated construction start date yet. IResidential Development — Residential development activities were impacted by the soft housing market.
Several residential developments that received their application approvals were on hold. Nevertheless,
Milpitas represents one of the more affordable alternatives in Santa Clara County, with the median home
price at around $475,500. Residential developments that are under construction include Cerrano (374
apartment units) and Paragon (141 townhouse units).
Non-residential Development One of the larger commercial developments includes the conversion of
the vacant Home Depot Pro site into a Seafood Market shopping mall that includes a 33,000 square foot
grocery store and several restaurants. The mall had its grand opening in August 2010. Other non
residential development primarily consists of tenant improvements in existing commercial buildings.
Budy’et Strategies in Fiscal 2010-11 IThe City’s General Fund has been challenged with structural budget deficits since early this decade. The
fiscal 2011 budget anticipated an overall decrease of 2.4% in revenue due to continued deterioration of
the local economy. To resolve the long-term structural deficit issue, the City Council appointed a
Citizens Task Force to study and recommend ideas to resolve the oil-going General Fund budget
structural deficit by FY 2012-13. The results of the study culminated to a list of recommendations
presented to the City Council in November 2010. The recommendations, associated with the estimated
fiscal impact, cover areas such as salaries and benefits reductions, cost recovery and additional revenues.
To balance the fiscal 2011 General Fund budget, the City utilized several short-term strategies including
a furlough program that reduced compensation by 7%, demand of a loan payment from the
Redevelopment Agency for the purchase of City properties, and use of $2 million of the General Fund
unrestricted reserve. The City continued to maintain services and programs and implemented several
major capital improvement projects to serve the community. These accomplishments will be discussed in
the next section, City Annual Performance Report.
II
VIII
CITY ANNUAL PERFORMANCE REPORT
During fiscal year 2010-20 II, City staff initiated and implemented various programs and projects thatsignificantly improved services to the citizens and the community. These efforts are consistent with theCity mission statement and the City Council’s priorities and policy direction. A listing and briefdescription of these programs and projects is as follows:
Fire
• Responded to 4,380 emergency incidents with an average response time of 4.2 minutes.• Presented fire prevention information at over 80 public events.• Conducted 900 plan reviews, issued 965 approvals/permits and performed 1,172 fire inspections.• Certified 235 new “Strategic Actions For Emergencies” (SAFE) team members in various
neighborhoods.
Police
• Reduced violent crimes (murder, rape, robbery and aggravated assault) by 3 1.8%, to a 40-year low.• Maintained response time to emergency calls at 2:47 minutes in 2010, the second lowest emergency
response time average in the last ten years.• Increased Gang Awareness presentations by 31% 1021 presentations in 2010.• Increased car seat inspections by 5.9% to 216 inspections in 2010 and created Spanish language
flyers and local cable-access advertisement.
Enineerin2
• Completed construction of the new Senior Center, improvements to the City Civic Center, AlvisoAdobe and Phase I of the Cardoza Park.
• Completed the Storm Drain Master Plan, 2010 Urban Water Management Plan MRP stormwaterpenuit provisions.
• Obtained a FEMA grant for the Berryessa Pump Station and reduced Special Flood Hazard Area forapproximately 370 residents.
• Completed Great Mall Parkway recycled water main installation and Gibraltar Pump Stationrehabilitation project.
Public Works Maintenance
• Completed State mandated water distribution operator training for Utilities Maintenance staff andappropriate standby personnel.
• Investigated 3,09! customer service requests and provided immediate response for urgentlsafetyrelated service requests.
• Provided cross-training and safety training to staff to improve efficiency and reduce injuries.• Responded immediately to all roadway hazards, gralliti abatement, and emergency storm service
requests.
P1annin/Neihborhood Services
• Initiated the development of a citywide Climate Action Plan.• Updated the General Plan to incorporate the Parks and ‘I’rails Master Plans.• Completed (lie reports for impediments to Fair I lousing and the (‘ommiinity l)cvelopmcnl Block
Grant (CDBG) Consolidated Plan.
ix

I• Fully automated the Abandoned Vehicle Abatement Service Authority (AVASA) reporting process. IParks and Recreation
• Received a State CRPS Achievement Award in the Recreation and Community services — health andWeilness category for the Playground.
• Secured $5,000 sponsorship from Headway Technologies to assist with the cost of the 4th of JulyFestivities that served over 20,0000 community members.
• 1-losted a Sports Center Open I-louse that included various class demonstrations, health screeningsand vendors. The success of the event increased Sports Center membership by 81 members.
• Responded effectively and efficiently to customers’ program requests and the use of Parks andRecreation facilities that resulted in a 90% good or better marks on customer evaluations.
Bniidin Inspection
• Expanded on-line permits and design guidelines and updated checklists on-line for plan check,submittal and inspection.
• Continued cross-training staff to improve consistency and promote a working environment wherelearning is encouraged, new ideas are welcome and a friendly atmosphere prevails as Ihe mostproductive approach to business.
• Continued to utilize same inspector from start to finish, provided same day and outside businesshours services as requested.
• Organized outreach programs such as Building Safety Month, to promote building safety awarenessin the community.
Administration I• Implemented financial strategies that ensure cost effective City service delivery while limiting budget
expenditures.• Continued to reorganize City departments and divisions to improve staff utilization, increase
efficiency, accountability and savings to the City.• Negotiated agreements with SunPower and Flextronics Americas for the only U.S. manufacturing of
SunPower solar panels.• Completed a new Five Year Redevelopment implementation Plan.
City Attorney
• Provided training on Brown Act, open government, and ethics.• Provided hands-on legal guidance through furlough process.• Completed City Sign Ordinance amendment to allow freeway signs.• Partnered with Planning Department in creating equity sharing program for moderate-income
housing units.
Human Resources
• In cooperation with the City Attorney’s Office, developed a discipline manual for the Firel)epartmenl.
• Introduced and trained employees on the newly developed Work Place Violence Prevention Policy.• Provided one-on-one behind the wheel driver’s training to all employees who are required to drive on
the job.
II

• Successfully rehired from the reinstatement list six employees affected by previous layoff.
Information Services
• Completed the Computer Aided Dispatch (CAD) system upgrade.• Completed the Online Permitting system upgrade.• Continued with the replacement plan to replace servers.• Added a Geographic Information System (GIS) service component to Ihe City’s Web site.
Finance
• Implemented a new comprehensive utility remittance process to improve timeliness of payments.• Developed a plan to transition old financial records in storage and implemented electronic imaging
for new records in lieu of storage.• Provided financial analysis support to the Citizens’ Budget Task Force.• Provided accurate and timely reports within 15 days from month-end to assist departments in
monitoring their budget.
ACCOUNTING SYSTEM AND BUDGETARY CONTROL
In developing and evaluating the City’s accounting system, consideration is given to the adequacy ofinternal accounting controls. Internal accounting controls are designed to provide reasonable, but notabsolute, assurances regarding: (I) the safeguarding of assets against loss from unauthorized use ordisposition; and (2) the reliability of financial records for preparing financial statements and maintainingaccountability for assets. The concept of reasonable assurance recognizes that: (1) the cost of a controlshould not exceed the benefits likely to be derived; and (2) the evaluation of costs and benefits requiresestimates and judgments by management.
All internal control evaluations occur within the above framework. The Finance Department staffremains committed to improving the City’s accounting system; to maintain the City’s internal accountingcontrols to adequately safeguard assets; and to provide reasonable assurances of proper recording offinancial transactions. Budgetary control is directed by the City Council and the members of the Agencyby resolution when the budget is adopted each year. Expenditures may not legally exceed appropriationsat the department level by fund. The City utilizes the encumbrance system as a management controltechnique to assist in controlling expenditures. The City Manager has limited budget appropriationauthority in an amount not to exceed I % of the total general fund budget, although the appropriationsmust be reported to the City Council on a periodic basis. Periodic reports of revenue, expense, andinvestment activity are prepared and distributed to the City Council and City departments to monitorspending in relation to the budget. At fiscal year-end, open encumbrances are reported as reservations ofthe fund balance. The City’s accounting records are organized and operated on a “fund” basis, which isthe basic fiscal and accounting entity in governmental accounting. Each fund is classified by categoryand fund type:
xi
1Category and Fund Typ.ç I
Governmental Funds: General Fund, Special Revenue Funds, Debt Service Funds, and CapitalProjects Funds I
Proprietary Funds: Enterprise Funds and Internal Service Fund
Fiduciary Funds: Agency Funds
Governmental Funds: The basic financial statements necessary to fairly present the financial positionaiid operating results from major governmental funds are the balance sheet, and the statement ofrevenues, expenditures and changes in fund balance. These funds are maintained using the modifiedaccrual basis of accounting, which is more thoroughly explained in the Notes to the Financial Statements.
prietary Funds: Generally accepted accounting principles applicable to private commercial businessare applicable to proprietary funds of a government agency. The basic financial statements required topresent the financial position and operating results from major proprietary funds are the statement of netassets, statement of revenues, expenses, and changes in net assets, and the statement of cash flows. Theaccrual basis of accounting is utilized as explained in the Notes to the Financial Statements.
fiduciy_F Fiduciary funds are used to account for assets held by a government agency acting as atrustee or agent for individuals, assessment districts, organizations, other governmental units or otherfunds of the same entity. These funds are also identified in this report as Agency Funds. The modified Iaccrual basis of accounting is used as explained in the Notes to the Financial Statements.
FINANCIAL ANALYSIS IGeneral Accepted Accounting Principles (GAAP) require that management provide a narrativeintroduction, overview, and analysis to accompany the basic financial statements in the form ofManagement’s Discussion and Analysis (MD&A). This letter of transmittal is designed to complementMD&A and should be read in conjunction with it. The City of Milpitas’ MD&A can be foundimmediately following the report of the independent auditors. IINDEPENDENT AUDIT IEach year the City requires an independent annual audit of the City’s financial records, the results of itsoperations, and cash flows. This report includes the opinion of the City’s independent auditors, Maze &Associates, for the basic financial statements of the City. In addition, a separately issued documentcontains the auditors’ reports on the internal control structure and compliance with applicable laws andregulations related specifically to the single audit.
AWARDS
The Government Finance Officers’ Association of the United States and Canada (GFOA) awarded aCertificate of Achievement for Excellence in Financial Reporting to the City for its ComprehensiveAnnual Financial Report fur the fiscal year ended June 30, 2010. The Certificate of Achievement is thehighest form of recognition for excellence in state and local government financial reporting.
1I

in order to be awarded a Certificate of Achievement, a government unit must publish an easily readableand efficiently organized Comprehensive Annual Financial Report, whose contents conform to programstandards. Such CAFR must satisi’ both generally accepted accounting principals and applicable legalrequirements.
A Certificate of Achievement is valid for a period of one year only. The City has received the GFOACertificate of Achievement for twenty-two of the last twenty-three years (fiscal years ended 1988-2010).The 1992-93 report was not submitted to GFOA due to timing delays.
We believe our current report continues to conform to the Certificate program requirements. This reportwill be submitted to GFOA to determine its eligibility for another certificate.
ACKNOWLEDGMENTS
I extend my appreciation to the entire staff in the Finance Department and other departments whoassisted in the process of compiling the information for this report. In addition, I extend a special “thankyou” to the City’s Accounting Services Division staff and our external auditors who contributed longhours to make this document possible. Their efforts and continued dedication are greatly appreciated. Isincerely thank the Mayor, members of the City Council and City Manager, for their support, interest,and integrity in directing the financial affairs of the City in a responsible, professional, and progressivemanner.
Respectfully submitted,
Emma C. Karlen, CPADirector of Financial Services
xiii

II
DIRECTORY OF OFFICIALS
June 30, 2011
ICity Council
Mayor Jose S. Esteves IVice-Mayor Pete McHugh
CoLnciimernber Debra Giordano
Councilmember Armanco Gomez, Jr
CouncHmember Aithea Poiansk
ICity Manager
Thomas C WiHams
Police Chief Director of Financial ServicesDennis Graham Emma Karlen, CPA
Fire Chief City Clerk:ar Stjrcivart Mary Lavelle
City Attorney Chief Information OfficerMic-ae, Ogaz William Marion I
Human Resources Director Public Works DirectorlCity EngineerCarmen Valdez Greg Armendariz
Planning & Neighborhood Svc Director Chief Building OfficerJames Lindsay Keyvan Irannejad
Parks and Recreation Director IBonnie Greiner
1II

San FranciscoOakland
U J’ 15W
• \ ---LC
0
San Mateo
4k Fremont
I
/‘S
1280San Jose
TheCity of Milpitas is located near the southern tip of San Francisco Bay, forty-five miles south of San Francisco.
Milpitas is often called the “Crossroads of Silicon Valley” with most of its 13.56 square miles of land situatedbetween two major freeways (1-880 and 1-680), State Route 237, and a county expressway. The light rail lineopened for service in 2004 and an extension of BART, with a major multi-modal station, is in the planning stages.
xv
EM
___
RDA
Zomic
_
Iopment
I Building
I I
I I FçW1 Planning arid Parks II
_____________
and Neighborhood j and Police FireandInformation I Human Finance
Engineering Services Recreation I ISafetyServices Resources
II
CitizensII
Arts Commission
Bicycle PedestrianAdvisory Commission
Community AdvisoryCommission
EconomicDevelopmentCommission
EmergencyPreparednessCommission
Library AdvisoryCommission
Mobile HomePark Rental
Review Board
Parks, Recreation &Cultural Resources
Commission
Planning Commission
Public Art Committee
Recycling & SourceReduction Advisory
Commission
Senior AdvisoryCommission
Sister CitiesCommission
TelecommunicationsCommission
Veterans Commission
Youth Advisory
City Clerk
IIIII
I
IIii
I1IIxvi
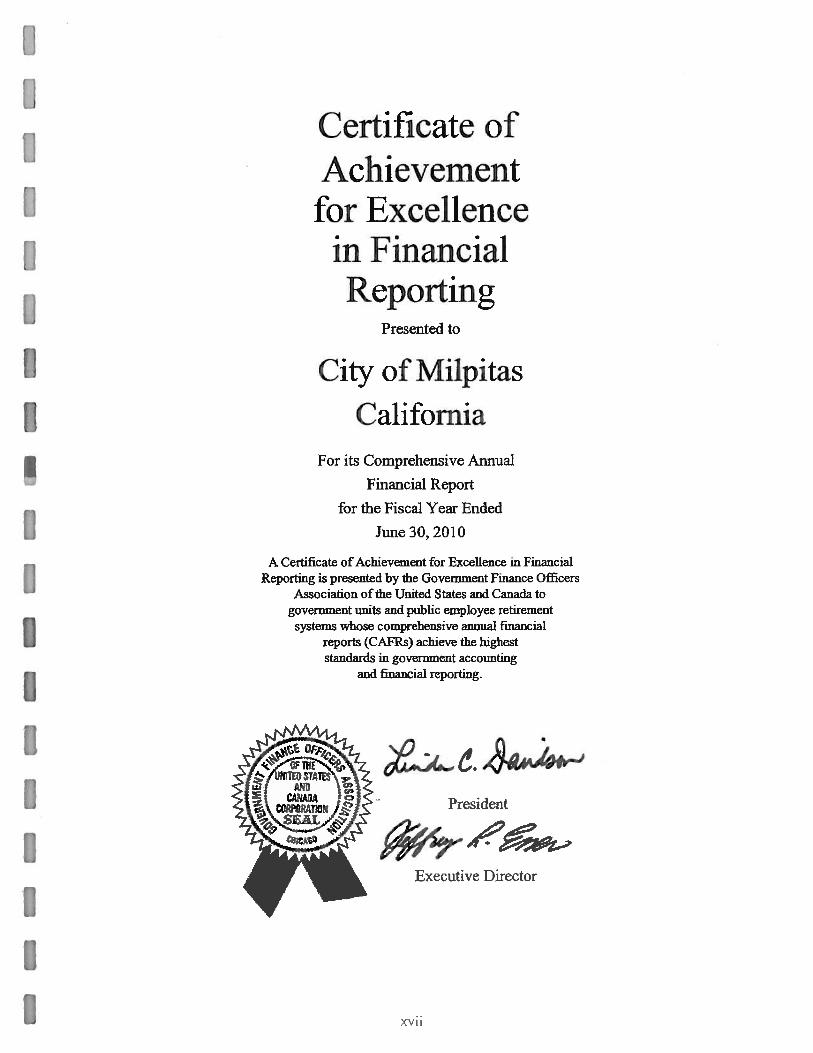
Certificate ofAchievementfor Excellence
in FinancialReporting
Presented to
City of Milpitas
CaliforniaFor its Comprehensive Annual
Financial Report
for the Fiscal Year Ended
June 30, 2010
A Certificate of Achievement for Excellence in FinancialReporting is presented by the Government Finance Officers
Association of the United States and Canada togovernment imits and public employee retirement
systems whose comprehensive annual financialreports (CAFRs) achieve the higheststandards in government accounting
and financial reporting.
4aPresident
*A
Executive Director
xv”

11 MAZE &ASSOCIATES
ACCOUNTANCY CORPORATIONINDEPENDENT AUDITOR’S REPORT ON 3478 Buskirk Ave. - Suite 215
BASIC FIIANCIAL STATEMENTS Pleasant ‘U!l, California 94523(925,) 930-0902 FAX (925) 930-0(35
To the FIonorable Members of the City Council maze ‘imazeassociates.comCity of Milpitas, California WWW, FflazeasSociates.corn
fl We have audited the financial statements of the governmental activities, the business-type activities, each major fund, and theaggregate remaining fund information of the City of Milpitas as of and for the year ended June 30, 2011, which collectivelycomprise the City’s basic financial statements as listed in the Table of Contents. These financial statements are the
Uresponsibility of the City’s management. Our responsibility is to express an opinion on these financial statements based on ouraudit. We did not audit the component unit financial statements of Terrace Gardens, Inc. as of and for the year ended December31, 2010, which represent 1.54%, 1.28%, and 2.09% of the assets, revenues, and capital assets of the reporting, respectively. Thesecomponent unit financial statements were audited by oilier auditors, whose report thereon has been furnished to us. Our opinion,insofar as it relates to the amounts included for this entity, is based solely on the report of these other auditors.
We conducted our audit in accordance with generally accepted auditing standards in the United States of America and thestandards for financial audit contained in Government Auditing Standards, issued by the Comptroller General of the UnitedStates. Those standards require that we plan and perform the audit to obtain reasonable assurance about whether the financialstatements are free of material misstatement. An audit includes examining on a test basis evidence supporting the amounts anddisclosures in the fmancial statements. Ai audit also includes assessing the accounting principles used and significant estimates! made by management, as well as evaluating the overall financial statement presentation. We believe that our audit and thereport of the other auditors provide a reasonable basis for our opinion.
IIn our opinion, based on our audit and the report of the other auditors, the basic financial statements referred to above presentfairly in all material respects the respective financial position of the governmental activities, the business-type activities, eachmajor fund, and the aggregate remaining fund information of the City of Milpitas as of June 30, 2011 and the respective changesin the financial position and cash flows, where applicable, thereof and the respective budgetary comparisons listed as part of the
I basic financial statements for the year then ended, in conformity with generally accepted accounting principles in the UnitedStates of America.
As disclosed in Note 17, the State of California adopted ABxl 26 on June 28, 2011, which suspends all new redevelopment‘ activities except for limited specified activities as of that date and dissolves redevelopment agencies effective October 1, 2011.Prior to dissolution, any transfers of Agency assets subsequent to January 1, 2011 to the City and the Economic DevelopmentCorporation, including those discussed in Notes 4 and 6, that were not obligated to third parties or encumbered may be subject to
I the State Controller’s review discussed above and required to be returned to the Agency. The State simullaneously adopted A13x I27 which allows redevelopment agencies to avoid dissolution by opting into an “alternative voluntary redevelopment program”requiring specified substantial annual contributions to local schools and special districts. These conditions raise substantial doubt
Iabout the ability of the Milpitas Redevelopment Agency, a component unit of the City, to continue as a going concern. However,on August 11, 2011, the California Supreme Court issued a partial stay ofABxl 26 and a full stay of ABxI 27, but the partial staydid not include the section of ABx 1 26 that suspends all new redevelopment activities. As a result, the accompanying financialstatements have been prepared assuming that the Milpitas Redevelopment Agency will continue as a going concern. The activities
I of the Milpitas Redevelopment Agency are included in the Housing Reserve Special Revenue Fund and Redevelopment ProjectCapital Projects Fund of the accompanying financial statements. The financial statements do not include any adjustments thatmight result from the outcome of this uncertainty.
I As of July 1, 2010, the City adopted the provisions of Governmental Accounting Standards Board Statement Number 54(GASB 54), Fund Balance Reporting and Governmental Fund Type Definitions. As discussed in Note 10 to the financialstatements, the provisions of this Statement affect the classification of fund balances reported in the linancial statements.
In accordance with Government Auditing Standardc, we have also issued our report dated September 30, 2011 on ourconsideration of the City’s internal control over financial reporting and on our tests of its compliance with certain provisions oflaws, regulations, contracts, and grant agreements and other matters. The purpose of that report is to describe the scope of our
I testing of internal control over linancial reporting and compliance and the results of that testing, and not to provide an opinionon the internal control over financial reporting or on compliance. That report is an integral part of an audit performed inaccordance with Government Auditing Standards and should be considered in assessing the results of our audit.
A 1’,ot sionji Corporation
IManagement’s Discussion and Analysis is not a required part of the basic fnancial statements but is supplemental)’ inlormation
required by the Governmental Accounting Standards Board. We have applied certain limited procedures, which consisted
pnncipalhy of inquiries of management regarding the methods of measurement and presentation of the required supplementary
information. 1-lowever we did not audit the information and express no opini on on it.
Our audit was conducted for the purpose of forming opinions on the financial statements that collectively comprise the basic
financial statements. The supplemental section listed in the Table of Contents is presented for purposes of additional analysis
and is not a required part of the basic financial statements. This information has been subjected to the auditing procedures
applied in the audit of the basic financial statements, and in our opinion, is fairly stated in all material respects in relation to the
basic financial statements taken as a whole.
The introductory section and statistical section have not been subjected to the auditing procedures applied in the audit of the
basic financial statemeilts and, accordingly, we express no opinion on them.
September 30, 2011 1III
IIIIIIIIII
MANAGEMENT’S DISCUSSiON AND ANALYSIS
The following discussion provides readers of the City of Milpitas’ financial statements a narrativeoverview and analysis of the financial activities of the City of Milpitas for the fiscal year ended June 30,201!. Please read this document in conjunction with the accompanying Transmittal Letter and BasicFinancial Statements.
FISCAL 2011 FiNANCIAL HIGHLIGHTS
The City’s revenues in fiscal 2011 reflect an slowly improving but somewhat mixed economic recovery.The relatively weak economic growth is primarily due to a stagnant housing market and highunemployment rate. The unemployment rate for the San Jose-Sunnyvale-Santa Clara metropolitan area inJune 2011 was at 10.4%, a small improvement from the unemployment rate of 11 .4% a year ago. Themeltdown of the housing market caused by the sharp decline of home prices and sub-prime mortgagesgreatly affected residential developments and property values. However, sales taxes, building pennit feesand Transient Occupancy Tax revenues were better than last fiscal year, reflecting a gradual, albeit slow,economic recovery.
In fiscal 2011, the Redevelopment Agency began reporting tax increment revenue gross of pass-throughpayments and administrative fees withheld by the County. The revenues and expenses derived from thefiscal year 2010 financial statements have been restated in this Management Discussion and Analysis tofacilitate comparison between the two fiscal years.
Fiscal 2011 financial highlights include the following:
City-wide:• The City’s total net assets were $438 million at June 30, 2011. Of this total, $289 million were
Governmental assets and $149 million were Business-type assets.• City-wide revenues include program revenues of $48.7 million and general revenues and
transfers of $82.9 million, totaling $131.6 million, a decrease of $2.9 million from the prioryear’s total of $134.5 million.
• ‘I’otal City-wide expenses were $118.7 million, a decrease of $16.7 million from the prior year’s$135.4 million.
Fund Level:• Governmental Fund balances were $138.9 million, a decrease of $0.9 million from fiscal 2010.• Governmental Fund revenues were $105.3 million in fiscal 2011, down $3.8 million from the
prior year’s $109.1 million.• Governmental Fund expenditures were $109.5 million in fiscal 2011, a decrease of $20.1 million
from fiscal 20 10’s level of$129.6 million.• General Fund revenues of $55.5 million represented an increase of $1.2 million from fiscal
20 10’s revenues of $54.3 million.• Total other financing sources of the General Fund was $33.5 million in fiscal 2011, $24.1 million
more than fiscal 20 10’s $9.4 million.• General Fund balance of $76.1 million at the fiscal 2011 year-end, $25.3 million more than the
fund balance at fiscal 2010 year-end.
3

IOVERVIEW OF TIlE COMPREHENSIVE ANNUAL FINANCIAL REPORT
This Comprehensive Annual Financial Report is in six parts:I) Introductory section, which includes the Transmittal Letter and general information,
2) Management’s Discussion and Analysis (this part),3) The Basic Financial Statements, which include the Government-wide and the Fund financial
statements, along with the Notes to these financial statements,
4) Supplementary Information,5) Combining statements for Non-major Governmental Funds and Fiduciary Funds,
6) Statistical information. IThe Basic Financial Statements
The Basic Financial Statements comprise the City-wide Financial Statements and the Fund Financial
Statements. These two sets of financial statements provide two different views of the City’s financial
activities and financial position—long-term and short-term. IThe City-wide Financial Statements provide a longer-term view of the City’s activities as a whole, and
comprise the Statement of Net Assets and the Statement of Activities. The Statement of Net Assets
provides information about the financial position of the City as a whole, including all its capital assets and
long-term liabilities on the full accrual basis, similar to that used by corporations. The Statement of
Activities provides information about all the City’s revenues and all its expenses, also on the full accrual
basis, with the emphasis on measuring net revenues or expenses of each of the City’s programs. The
Statement of Activities explains in detail the change in net assets for the year.
The Fund Financial Statements report the City’s operations in more detail than the City-wide statements Iand focus primarily on the short-term activities of the City’s General Fund and other Malor Funds. The
Fund Financial Statements measure only current revenues and expenditures, current assets, liabilities and
fund balances, but exclude capital assets, long-term debt and other long-term amounts. IMajor Funds account for the major financial activities of the City and are presented individually, while
the activities of Non-major funds are presented in summary, with subordinate schedules presenting the
detail for each of these Non-major funds. Major Funds are explained below.
The City acts solely as a depository agent for Local Improvement Districts and certain other entities. The
fiduciary statements provide information about the cash balances and activities of these Districts and
other entities. These statements are separate from the City’s financial statements and their balances are
excluded from the City’s fund balances.
Together, all these statements are called the Basic Financial Statements.
The city-wide Financial Statements IAll of the City’s basic services are considered to be governmental activities, including general
government, community development, public safety, public works, parks & recreation, public
improvements, planning and zoning, and general administration services. These services are supported by
general City revenues such as taxes, and by specific program revenues such as fees. ‘l’he basic flnanci
statements can be found in pages 2 1-23 of this report. IAll of the City’s enterprise activities, including water, recycled water, and sewer are also reported on the
basic financial statements. Unlike governmental services, these activities are supported by charges pind
by users based on the amount of their service consumption.
4 1
The City’s governmental activities include the activities of four separate legal entities, the MilpitasRedevelopment Agency (RDA), Milpitas Economic Development Corporation (EDC), the Milpitas1-lousing Authority (Housing Authority), and Terrace Gardens, inc., because the City is either financiallyaccountable for these entities or has control of the governing board of these entities. However, duringfiscal 2011, the Housing Authority did not have any financial activities.
Citywide financial statements are prepared on the accrual basis, which means they measure the flow of alleconomic resources of the City as a whole.
Fund Financial Statements
Governmental Fund financial statements are prepared on the modified accrual basis, which means theymeasure only current financial resources and uses. Capital assets and other long-lived assets, along withlong-term liabilities, are presented only in the citywide financial statements.
Enterprise and internal service fund financial statements are prepared on the full accrual basis and includeall these funds’ assets and liabilities, both current and long-term.
The Fund financial statements provide detailed information about each of the City’s most significantfunds, called Major Funds. Each Major Fund is presented individually, with all Non-major Fundssummarized and presented only in a single column. Subordinate schedules present the detail of theseNon-major funds. Major Funds present the major activities of the City for the year. The General Fund isalways a Major Fund, but other funds may change from year to year as a result of changes in the patternof the City’s activities.
The City has five other Major Governmental Funds in fiscal 2011 in addition to the General Fund. Theseare the Economic Development Corporation Fund, Housing Reserve Fund, the Redevelopment ProjectFund, the Street Improvement Fund and the Transit Area Impact Fee Fund, each of which is discussed indetail below.
All three of the City’s Enterprise Funds are reported as Major Funds.
Comparisons of Budget and Actual financial information are presented only for the General Fund andother Major governmental funds that are Special Revenue Funds, which in the City’s case includes theHousing Reserve Fund only.
Fiduciary Statements
The City is the agent for certain local improvement districts, holding amounts collected from propertyowners which await transfer to these Districts’ bond trustees. The City’s fiduciary activities are reportedin the separate Statements of Fiduciary Net Assets and the Agency Funds Statement of Changcs in Assetsand Liabilities. These activities are excluded from the City’s other financial statements because the Citycannot use these assets to finance its own operations.
5
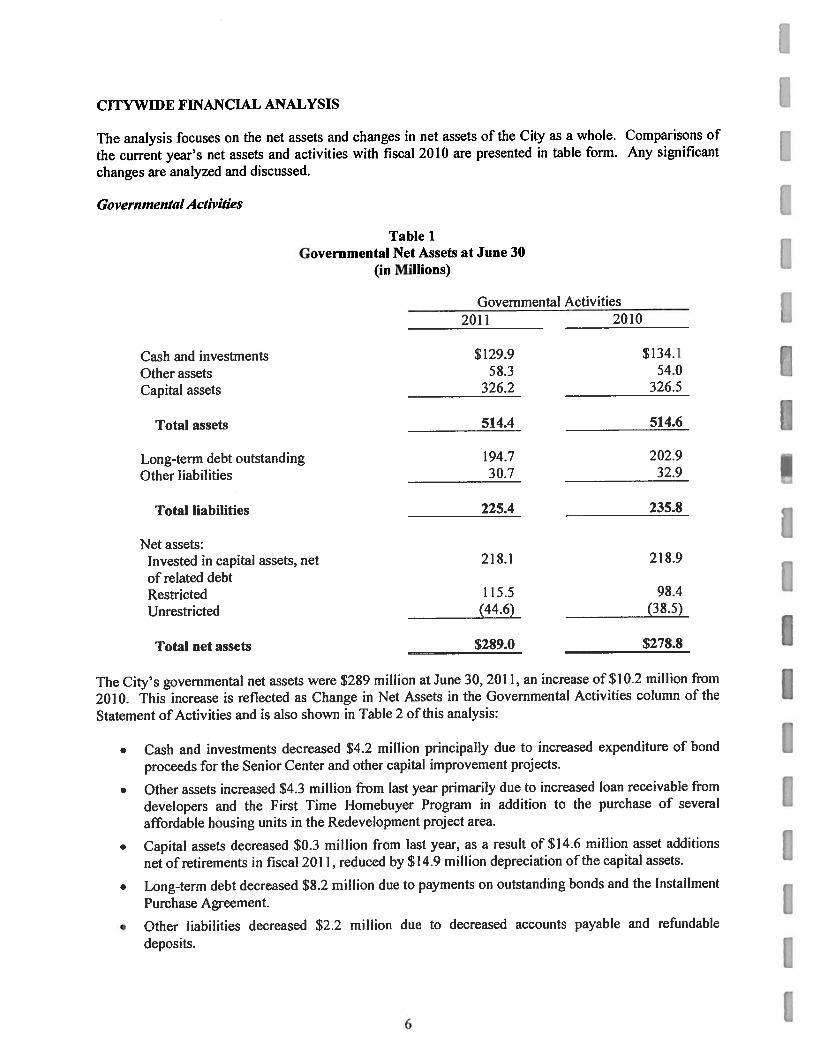
ICITYWIDE FINANCIAL ANALYSIS
The analysis focuses on the net assets and changes in net assets of the City as a whole. Comparisons of
the current year’s net assets and activities with fiscal 2010 are presented iii table form. Any significant
changes are analyzed and discussed.
Governmental Activities ITable 1
Governmental Net Assets at June 30 I(in Millions)
Governmental Activities2011 2010
Cash and investmenls $129.9 $134.1
Other assets 58.3 54.0
Capital assets 326.2 326.5
Total assets 514.4 514.6 1Long-term debt outstanding 194.7 202.9
Other liabilities 30.7 32.9
Total liabilities 225.4 235.8
Net assets:Invested in capital assets, net 218.1 218.9
of related debtRestricted 115.5 98.4
Unrestricted (44.6) (38.5)
Total net assets
______
$289.0 $278.8
The City’s governmental net assets were $289 million at June 30, 2011, an increase of$l0.2 million from
201 0. This increase is reflected as Change in Net Assets in the Governmental Activities column of the
Statement of Activities and is also shown in Table 2 of this analysis:
• Cash and investments decreased $4.2 million principally due to increased expenditure of bond
proceeds for the Senior Center and other capital improvement projects.
• Other assets increased $4.3 million from last year primarily due to increased loan receivable from
developers and the First Time Homehuyer Program in addition to the purchase of’ several
affordable housing units in the Redevelopment project area.
• Capital assets decreased $0.3 million from last year, as a result of $14.6 million asset additions
net of retirements in fiscal 2011, reduced by $14.9 million depreciation of the capital assets.
• Long-term debt decreased $8.2 million dtie to payments on outstanding bonds and the Installment
Purchase Agreement.
• Other liabilities decreased $2.2 million due to decreased accounts payable and refundable
deposits.
6
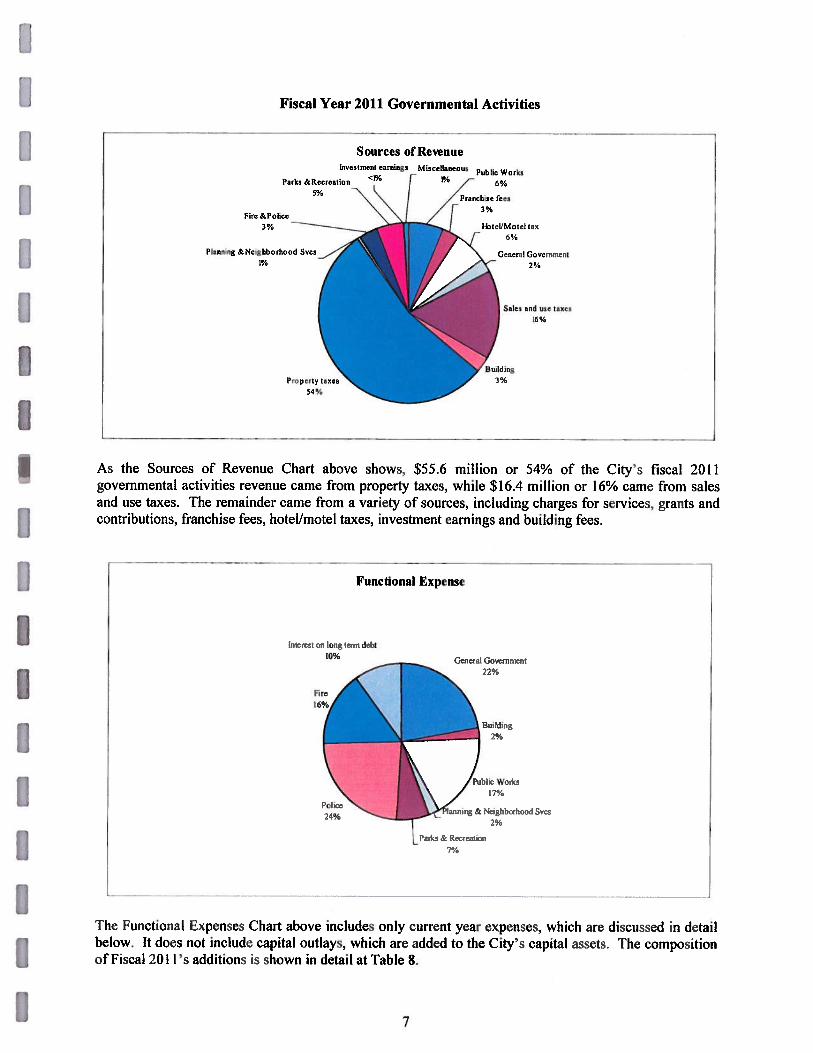
Fiscal Year 2011 Governmental Activities
As the Sources of Revenue Chart above shows, $55.6 million or 54% of the City’s fiscal 2011governmental activities revenue caine from property taxes, while $16.4 million or 16% came from salesand use taxes. The remainder came from a variety of sources, including charges for services, grants andcontributions, franchise fees, hotel/motel taxes, investment earnings and building fees.
Functional Expense
Building
2%
iblicWorks
17%
lanning & Neighbcwhood Svcs24%
s&Recreatio
2%
n
7%
Fire &Polrcc3%
‘binning & Neighborhood Svcs1%
Sources of RevenueInvestment earnings Miscellaneous Public Works
Park, &Rrcreation <i r 1% 6%
Franchise fees3%
ltotchiMotel lax6%
General Goveranicirt
2%
and use Lanes
16%
Interest on long tenti debt10% General Governitmnt
22%
‘r he Functional Expenses Chart above includes only current year expenses, which are discussed in detailbelow. It does not include capital outlays, which are added to the City’s capital assets. The compositionof Fiscal 2011’s additions is shown in detail at Table 8.
7
I
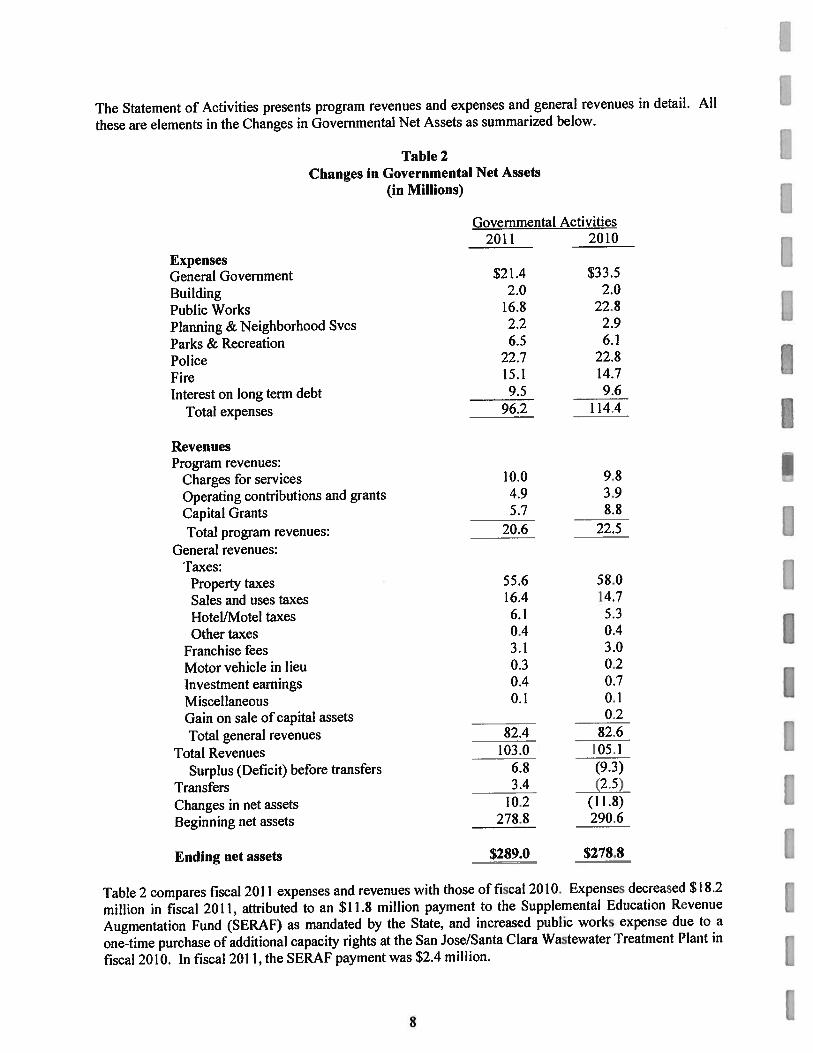
The Statement of Activities presents program revenues and expenses and general revenues in detail. All
these are elements in the Changes in Governmental Net Assets as summarized below.
Table 2 IChanges in Governmental Net Assets
(in Millions)
Governmental Activities2011 2010
Expenses IGeneral Government $2 1.4 $33.5
Building 2.0 2.0
Public Works 16.8 22.8
Planning & Neighborhood Svcs 2.2 2.9
Parks & Recreation 6.5 6.1
Police 22.7 22.8 IFire 15.1 14.7
Interest on long term debt 9.5 9.6
Total expenses 96.2 114.4 IRevenuesProgram revenues:
Charges for services 10.0 9.8
Operating contributions and grants 4.9 3.9
Capital Grants 5.7 — 8.8
Total program revenues: 20.6 22.5
General revenues:Taxes:
Property taxes 55.6 58.0
Sales and uses taxes 1 6.4 14.7
Flotel/Motel taxes 6.1 5.3
Other taxes 0.4 0.4
Franchise fees 3.1 3.0
Motor vehicle in lieu 0.3 0.2
Investment earnings 0.4 0.7 IMiscellaneous 0.1 0.1
Gain on sale of capital assets 0.2
Total general revenues 82.4 82.6
Total Revenues 103.0 105.1
Surplus (Deficit) before transfers 6.8 (9.3)
Transfers 3.4 (2.5)
Changes in net assets 10.2 (II .8)
Beginning net assets 278.8 290.6
Ending net assets $289.0 $278.8
Table 2 compares fiscal 2011 expenses and revenues with those of fiscal 2010. Expenses decreased $18.2
million in liscal 2011. attributed to an $11.8 million payment to the Supplemental Education Revenue
Augmentation Fund (SERAF) as mandated by the State, and increased public works expense due to a
one-time purchase of additional capacity rights at the San Jose/Santa Clara Wastewater ‘l’reatment Plant in
fiscal 2010. In fiscal 2011, the SERAF payment was $2.4 million.
8
Table 2 shows that total government revenues decreased $2. I million in fiscal 2011. Program revenuesand general revenues decreased $1.9 and $0.2 million respectively. The decrease in program revenueswas due to decreased capital grants. The decrease in general revenues was due to a combination ofdecreased property tax revenue and increased sales tax revenue and transient occupancy tax revenue.Property tax revenue in fiscal 2011 was $2.4 million less than last year primarily due to lower assessedvaluation on residential properties and successful appeals on the assessed valuation of several commercialproperties. Sales tax revenue in fiscal 2011 was $1.7 million more than fiscal 2010, reflecting improvedconsumer spending in the apparel stores and auto sales economic segments. Transient Occupancy Taxincreased $0.8 million in fiscal 2011 after two consecutive years of decline, reflecting a gradual economicrecovery.
Table 3 presents the net cost of each of the City’s largest programs—general government, building, publicworks, planning & neighborhood services, parks & recreation, police, fire, and interest expense. Net costis defined as total program cost less the revenues generated by those specific activities. The net cost ofproviding similar programs decreased $16.3 million due to an $1 1.8 million payment to SERAF asmandated by the State and a one-time purchase of additional capacity rights at the Wastewater TreatmentPlant in fiscal 2010. The decreased net program cost also reflects savings from the furlough program andother cost cutting measures.
Table 3Governmental Activities
(in Millions)
Net (Expenses) RevenueFrom Services
- 2011 2010
General Government $( 1 8.9) $(30. I)Building 0.8 0.1Public Works (10.5) (12.3)Planning & Neighborhood (1.6) (2.2)Parks& Recreation (1.6) (3.5)Police (20.6) (20.8)Fire (13.7) (13.5)Interest on long term debt (9.5) (9.6)
Totals $(75.6) -
_________________
9

I
Business-type Activities
Table 4Business-Type Net Assets at June 30
(in Millions)
Business-Type Activities2011 2010
Cash and investments $36.4 $37.7
Other assets 7.1 6.8
Capita) assets 115.8 112.8
Total assets 159.3 157.3
Other liabilities 2.6 2.9
Long-term Debt 7.7 8.1
Total liabilities 10.3 11.0
Net assets:Invested in capital assets 107.7 104.4
Restricted 20.7 24.0
Unrestricted 20.6 17.9
Total net assets $149.0 5146.3
The net assets of business-type activities were $149 million in fiscal 2011, an increase of $2.7 million
from fiscal 2010. Total assets increased $2.0 million while total liabilities decreased $0.7 million. The
increase in net assets was due to increased customer service charges for the Water, Sewer and Recycled
Water Funds.
IIII[[
10
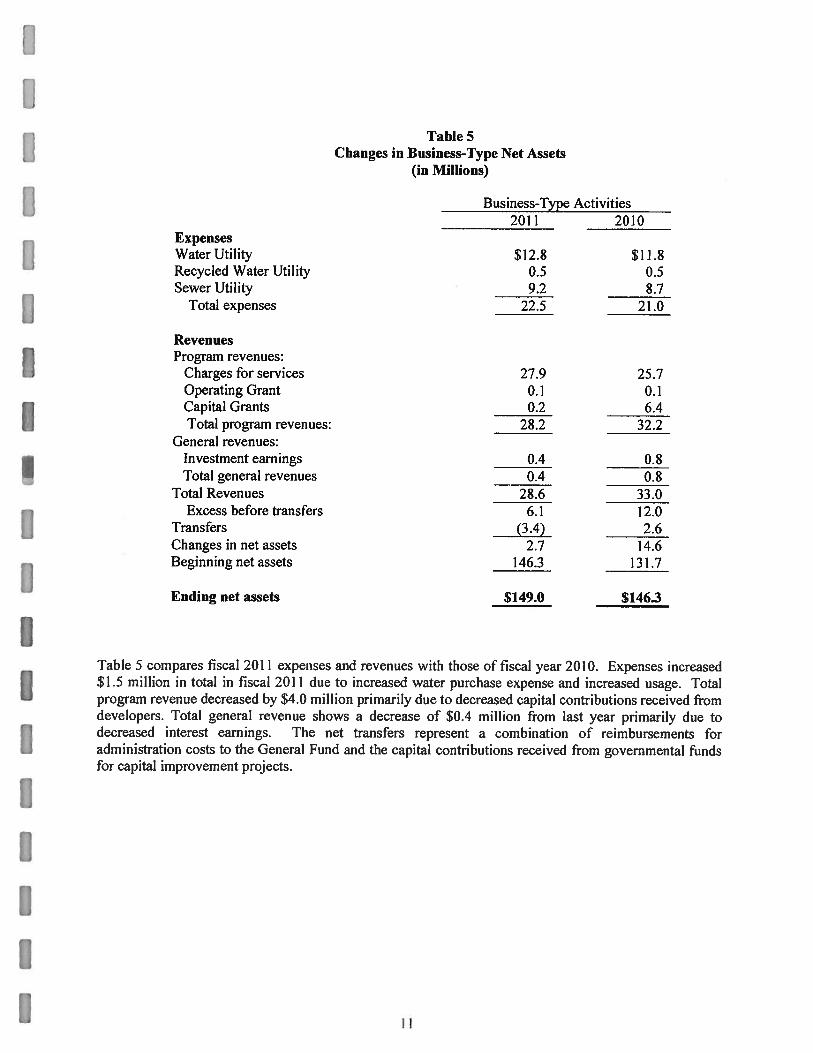
Table 5Changes in Business-Type Net Assets
(in Millions)
Business-Type Activities2011 2010
ExpensesWaterUtility $12.8 $11.8Recycled Water Utility 0.5 0.5Sewer Utility 9.2 8.7
Total expenses 22.5 21.0
RevenuesProgram revenues:
Charges for services 27.9 25.7Operating Grant 0.1 0.1Capital Grants 0.2 6.4Total program revenues: 28.2 32.2
General revenues:Investment earnings 0.4 0.8Total general revenues 0.4 0.8
Total Revenues 28.6 33.0Excess before traiisfirs 6.1 12.0
Transfers (3.4) 2.6Changes in net assets 2.7 14.6Beginningnetassets
— 146.3 131.7
Ending net assets $149.0 $146.3
TableS compares fiscal 2011 expenses and revenues with those of fiscal year 2010. Expenses increased$1.5 million in total in fiscal 2011 due to increased water purchase expense and increased usage. Totalprogram revenue decreased by $4.0 million primarily due to decreased capital contributions received fromdevelopers. Total general revenue shows a decrease of $0.4 million from last year primarily due todecreased interest earnings. The net transfers represent a combination of reimbursements foradministration costs to the General Fund and the capital contributions received from governmental fundsfor capital improvement projects.
II

IFINANCIAL ANALYSIS OF THE CITY’S FUNDS
Table 6 below summarizes activities and balances of the governmental funds at the fund level:
Table 6Financial Highlights of Governmental Funds at Fund Level at June 30
(in Millions)
2011 2010 ITotal assets $225.8 $213.8Total liabilities 86.9 74.0Total fund balances 138.9 139.8Total revenues 105.3 109.2Total expenditures 109.6 129.6
Total other financing sources 3.4 0.3
At June 30, 2011, the City’s governmental funds repoed combined fund balances of $138.9 million, a
decrease of $0.9 million from last year. The fund balances of the General Fund, and Other Governmental
Funds increased $25.3 million, and $4.1 million respectively while the fund balances of the Flousing
Reserve Fund, Redevelopment Project Fund, Transit Area Impact Fee Fund and Street Improvement Fund
decreased $7.2 million, $73.5 million, $1.2 million and $0.8 million, respectively. The Economic
Development Corporation, a new entity that was formed in fiscal 2011, had an ending fund balance of
$52.4 million at June 30, 2011. IRevenues at the fund level totaled $105.3 million, a decrease of $3.9 million. Revenues for the General
Fund and Other Governmental Funds increased $1.2 million and $2.2 million respectively while the
Housing Reserve Fund, Redevelopment Project Fund, and Street Improvement Fund declined $0.2
million, $3.9 million and $3.3 million, respectively. The Transit Area Impact Fee Fund did not receive
any revenue in fiscal 2011 other than a nominal amount of interest income. The EI)C is a new entity that
is considered a major fund of the City and received $0.1 million in interest income in fiscal 2011.
Expenditures decreased $20 million this year to $109.6 million from last year’s $129.6 million. The
expenditures of the Housing Reserve Fund Redevelopment Project Fund, Street Improvement Fund,
Transit Area Impact Fee Fund and Other Governmental Funds decreased by $0.3 million, $1 1 .9 million,
$0.6 million, $4.8 million and $2.5 million, respectively. The General Fund expenditures remained at
almost the same level of $68.7 million as last year while the EDC expended less than $0.1 million in
fiscal 2011.
Analyses ofMajor Gom’ernmental Funds
General Fund IGeneral Fund revenues increased to $55.5 million this fiscal year, up $1.2 million from the prior fiscal
year. Increases came from sales taxes, other taxes, licenses and fines, intergovernmental, and charges for
services categories. Property tax revenue decreased $0.5 million due to decreased assessed valuation on
residential properties and resolution olsome olthc property tax appeals by property owners.
I
2 I
Sales tax increased by approximately $1.7 million reflecting improved consumer spending in the apparelstores and auto sales economic segments. Other taxes increased by $0.8 million due to increasedTransient Occupancy Tax revenue. Licenses and permits increased $0.8 million primarily from thebuilding permit and inspection fees collected from one major residential development project thatconsisted of 374 apartment units. Intergovernmental revenues increased by $0.6 million due to increasedoperating grant revenues and reimbursement of staff costs from the Valley Transportation Authority forthe BART expansion project of approximately $350,000. Charges for services also increased by $0.2million due to increased revenues for planning and engineering fees received from private developments.
Interest income was down $2.5 million due to lower interest earnings from the investment portfolio asreinvestment yields declined. Another factor that contributed to the decreased interest income was due toa $2 million interest payment received from the Redevelopment Agency on a promissory note. In fiscal2010, a similar interest payment received from the Redevelopment Agency was $4.4 million.
General Fund expenditures decreased less than $0.1 million to $63.7 million in fiscal 2011. Despiteincreases in employee benefits such as employer’s contribution to CaIPERS and increased medicalpremiums, the furlough program saved the Fund approximately $3.2 million in fiscal 2011.
Net transfers were approximately $33.6 million, up $24.1 million from last year. Net transfers consist of$9.5 million reimbursements from other funds for administrative and overhead expenditures and capitalproject funding. it also includes properties transferred in of approximately $24.5 million from theRedevelopment Agency and a transfer out of $0.5 million to the Street Improvement Fund for capitalproject funding. The properties transferred from the RDA to the City were for the purpose of aiding andco-operating in the planning, construction and management o redevelopment projects. Findings weremade by the Agency Board to determine that the transfer of properties to the City will ultimately benefitthe project areas in the elimination of blight.
Compared to the final budget, expenditures were under budget by $2.8 million. The savings wereprimarily from attritions of work force and careful monitoring of expenditures. The differences betweenthe original budget and final budget were primarily attributable to additional budget appropriations relatedto operating grant revenues.
Economic Development Corporation
The fund accounts for the activities of the Economic Development Corporation. The EDC is a tax-exempt organization that was formed in fiscal 2011 for the purpose of facilitating and fostering the City’seconomic development and elimination of blight through public-private partnerships. During fiscal 2011,its only source of income was from interest earnings of approximately $0.1 million. Expenditures of$21,000 were primarily for consulting services
The EDC entered into an operating agreement with the Redevelopment Agency whereby the Agency willtransfer an initial start up working capital of up to $50 million cash to the EDC along with net currentassets. During fiscal 2011, the Agency transferred $62 million which consisted of’ cash and net currentassets to the EDC. The transfer in vas offset by a transfer 0th of $9.7 million to the Agency to pay foradministrative costs and capital improvement project costs incurred by the Agency during fiscal 2011.
Simultaneously, the El)C entered into a service agreement with the City to engage it in completing theactivities necessary to eliminate blight, provide affordable housing, facilitate public and privatedevelopments and other appropriate purposes allowed by the California Redevelopment Law.
13

IJoiisin Reserve
This Fund accounts for Redevelopment Agency activities designed to increase the amount of low and
moderate-income housing available in the City. In fiscal 2011, the balances of loans to developers
increased from $27.7 million to $29.8 million, due to a new loan provided to a developer for the
development of a 101-unit multi-family project restricted for very low-income households. Total
expenditures of $3.3 million primarily consisted of housing grants and loans for affordable housing.
Principal payments and in many cases interest payments on the “Silent Second” loan program to assist
qualified low-income families to purchase homes in Milpitas are deferred until the property is sold or re
financed, and are not considered revenues until they are received. Principal and interest on loans to non
profit developers of such properties typically are at below-market rates and payments are deferred for
considerable periods of years to assist these non-profit organizations in their efforts to develop affordable
housing. Al! these loans are secured by deeds of trust on the underlying properties, and if the facilities
constructed with these loans are not used for the purposes intended, the loans become due and payable
immediately.
Revenue from interest income at $0.4 million in fiscal 2011 was approximately the same as prior year.
The net transfers out of $5.5 million comprised ofatiansfer in of $11.7 million tax increment revenue for
the set-aside housing reserve requirement, and transfers out of $1 million to the General Fund and $0.4
million to the Redevelopment Project Fund for the Flousing Reserve Fund’s share of the administrative
costs and debt service payments. In addition, the Housing Reserve Fund transferred eleven affordable
housing units and parcels of land to the City valued at $15.8 million. The property transfer from the
i-lousing Reserve Fund to the City was for the purpose of aiding and co-operating in the planning.
construction and management of redevelopment projects. Findings were made by the Agency Board to
determine that the transfer of properties to the City will ultimately benefit the project areas in the
elimination of blight.
Redevelopment Project
This Fund accounts for property tax increments and other Redevelopment Agency revenues used to
construct or acquire capital assets in the Redevelopment Agency’s project areas. The Fund’s revenues
were $39.6 million in fiscal 2011, a decrease of $3.9 million from fiscal 2010. Property tax increment
revenue was $39 million in fiscal 2011, a decrease of $1.8 million or 4.4% from fiscal 2010 due to
reduced assessed valuation on residential properties and resolution of appeals on several commercial
properties. Interest income decreased by $0.6 million due to reduced interest earnings from bond
proceeds as the proceeds were spent on projects and reduced investment yields generated from the pooled
portfolio. Intergovernmental revenue at $0.1 million was $1.5 million less than fiscal 2010 due to grant
funding which did not recur.
Fund expenditures were $36 million in fiscal 2011, a decrease of $1 1.9 million. Interest and principal
payments totaling $19.9 million included $13.6 million debt service payments for the 2003 Tax fJAllocation Bonds, $4 million installment payment pursuant to a Purchase and Sale Agreement with the
County of Santa Clara, and $2.0 million interest expenditure on a promissory note related to the purchase
of properties from the City and $0.3 million accrued interest on advances from other funds. The advances
bear simple interest of 5% annually. Fund expenditures also included capital improvement project
expenditures of $8.9 million, a decrease of $1.6 million from prior year due to substantial completion of
the Senior Center project. Fund expenditures also included a $2.4 million payment to the Supplemental
Education Augmentation Revenue Fund, as mandated by the State; the fiscal 2010 payment was $11.8
million.
14I

Street Improvement Capital Project
This Capital Project Fund accounts for the majority of the capital projects activity in the City that is notdeveloped in the redevelopment area. The Fund’s revenues were $1.7 million in fiscal 2011, a decrease of$3.2 million from fiscal 2010. The decrease was due to decreased intergovernmental revenues anddecreased developer contributions.
Fund expenditures were $2.9 million in fiscal 2011, a decrease of $0.5 million from fiscal 2010 due todecreased capital outlay.
Transit Area Impact Fee
The Transit Area Impact Fee Fund was established in fiscal 2009 to account for impact fees revenuecollected from developers and related capital expenditures in the Transit Area. In fiscal 2011, fundexpenditures were $1.2 million, consisted of $0.6 million capital improvement project expenditures and$0.6 million for accrued interest on advances received from other funds. The advances bear simpleinterest of 5% annually.
Other Governmental Funds
These funds are not presented separately in the Basic Financial statements, hut arc individually presentedas Supplemental Information.
Fund Balance Classifications
In February 2009, the Government Accounting Standards Board (GASB) issued Statement No. 54, “FundBalance Reporting and Governmental Fund Type Definitions” that is applicable to the financialstatements issued by governmental entities for the reporting period ended June 30, 2011. The objective ofGASB Statement No. 54 is to enhance the usefulness of fund balance information by providing clearerfund balance classifications that can be more consistently applied and by clarifying the existinggovernmental fund type definitions. Before GASB 54, fund balances for the governmental funds wereclassified in three categories: reserved, unreserved designated and unreserved undesignated. UnderGASB Statement No. 54, •fund balances are classified in five categories: nonspendahie, restricted.committed, assigned and unassigned based on a hierarchy of constraint. Further details on fund balanceclassifications can be found in Note lOB.
For analytical and discussion purposes, fund balances of the major governmental funds for fiscal 2010have been reclassified in the Table 7.
15

I]U
‘[able 7Fund Balances at June 30 — Major Governmental Funds
(in Millions)
2011 2010
General FundNonspendable $21.0 $21.0
Restricted 24.6
Committed 5.4 5.4
Assigned 9.7 9.5
Unassigned 15.4 14.9
Total $76.1 $50.8
EDC FundRestricted
$52.4
____________
I-lousing Reserve fundRestricted $20.3 $27.5
Redevelopment Project FundNonspendable $ 0.1
Restricted 41.2
Unassigned $(32.2) -
________
Total $(32.2) $41.3
Street Improvement FundRestricted $11.9 — $12.8
Transit Area Impact Fee FundUnassigned $(1l.5) $(1O.2)
At June 30, 2011, the fund balance of the General Fund was $76.1 million. $21 million was classified as
nonspendable, comprised of $20.5 million interfund loans and $0.5 million prepaid materials and
supplies. $5.4 million lbr PERS Rate Stabilization was classified as committed. $9.7 million of the fund
balance comprised of $6.6 million for library and performance arts programs, $2.8 million for uninsured
claims payable and $0.3 million for encumbrances, was classified as assigned. $1 5.4 million was
classified as unassigned. With the exception of $24.6 million restricted fund balance, the amounts in the
nonspendable, committed, assigned and unassigned classifications were similar to prior fiscal year. $24.6
of the fund balance comprised of properties held for resale that were transferred from the Housing
Reserve Fund and Redevelopment Project Fund during fiscal 2011, was classified as restricted.
The fund balances of the Economic Development Corporation Fund, Housing Reserve Fund and Street
Improvement Fund were classified as restricted as the amounts were restricted for specific purposes.
The fund balances of the Redevelopment Project Fund and Transit Area lmpact Fee Fund were classified
as unassigned due to their negative amounts.
I
161

A na4’ses ofMajor Proprietary Funds
total operating revenues of Business-type Activities increased $2.2 million from last year, whileoperating expenses increased $1 .5 million. Total revenues and total operating expenses were $27.9million and $22.2 million respectively. Non-operating revenues of $0.2 million in fiscal 2011 were $0.4million lower than the prior year primarily due to decreased interest income. Capital contributionsdecreased by $9.2 million while net transfers out increased by $2.9 million.
Water Utility
Water fund revenues were $15.2 million in fiscal 2011, up $1.1 million from the prior year. The increasein revenues was primarily due to increased water rates. Expenses were $12.8 million in fiscal 2011, up $1million from the prior year primarily due to increased purchased water expense. Net assets of the WaterUtility Fund increased almost $2 million in the current year to a total of $62.8 million. The increasecomprised $2.4 million in operating income for the current year, $0.1 million in non-operating revenues,$0.1 million capital contributions from developers, offset by net transfers out of $0.6 million. Transfersin of $1 .2 million represent reimbursements for the cost of capital assets constructed by the WaterEnterprise Fund for the other enterprise funds. Transfers out of 81 .8 million were for reimbursements ofadministration costs incurred by the General Fund.
This Fund’s Net Assets includes $46.4 million invested in capital assets, $1 1.8 million in restricted netassets, and $4.6 million in unrestricted net assets.
Recycled Water Utility
Recycled Water fund revenues were $1.3 million in fiscal 2011, approximately $0.1 million more thanprior year. Expenses were $0.5 million in fiscal 2010, same as last fiscal year. Net assets of the Funddecreased $0.4 million in the current year to a total of approximately $1 million. This decrease included$0.8 million in operating income and $0.1 million in non-operating income, offset by transfers outtotaling $1.3 million. Transfers out were primarily reimbursements for the cost of capital assetsconstructed by the Waler Enterprise Fund and other capital project funds for the Recycled Water Fund.
This Fund’s Net Assets includes $0.2 million invested in capital assets and $0.8 million in unrestricted netassets.
Sewer Utility
Sewer fund revenues were $1 1.4 million in fiscal 2011, up $1 million from the prior year due to increasedsewer rates. Expenses were $8.9 million in fiscal 2011, up $0.5 million from the prior year due toincreased contribution requirements for the City’s share of the operating expenses at the Waste WaterTreatment Plant and increased depreciation expense. Non-operating revenues in fiscal year 2011consisted of $0.3 million interest income and $0.3 million interest expense. Net assets of the SewerUtility Fund increased $1.2 million in the current year to a total of $85.3 million. This increasecomprised of $2.5 million in operating income, $0.1 million in capital contributions by developers, andnet transfers out of $1.4 million for reimbursements of administration costs incurred by the General Fund.
$15.2 million of the Fund’s Net Assets was unrestricted at the fiscal year end. Of the remainder, $61.1million was invested in capital assets and $9 million was restricted as to use.
17
L
CAPITAL ASSITS
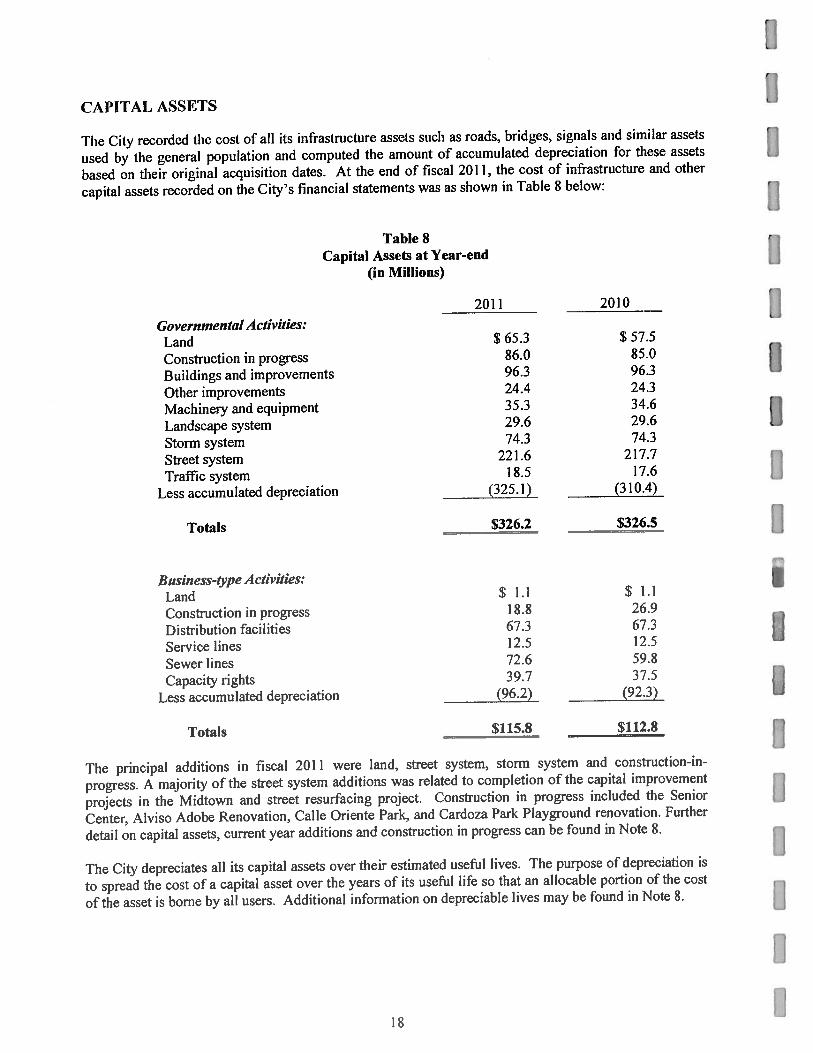
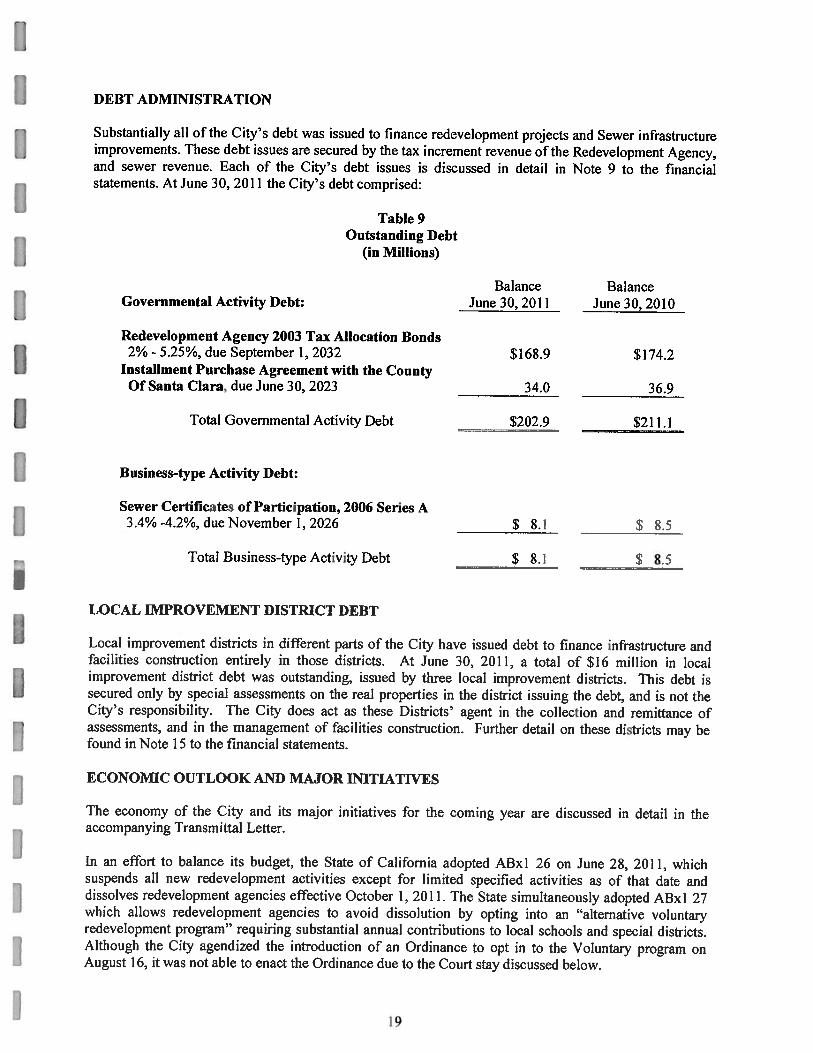
The City recorded the cost of all its infrastructure assets such as roads, bridges, signals and similar assets
used by the general population and computed the amount of accumulated depreciation for these assets
based on their original acquisition dates. At the end of fiscal 2011, the cost of infrastructure and other
capital assets recorded on the City’s financial statements was as shown in Table 8 below:
Table 8Capital Assets at Year-end
(in Millions)
2011 2010
Governmental Activities:Land $ 65.3 $ 57.5
Construction in progress 86.0 85.0
Buildings and improvements 96.3 96.3
Other improvements 24.4 24.3
Machineiy and equipment 35.3 34.6
Landscape system 29.6 29.6
Storm system 74.3 74.3
Street system 221 .6 217.7
Traffic system 1 8.5 17.6
Less accumulated depreciation
_____
(325.1) (310.4)
Totals $326.2 $326.5
Business-type Activities:Land $ 1.1 $ 1.1
Construct ion in progress 18.8 26.9
Distribution facilities 67.3 67.3
Service lines 12.5 12.5
Sewer lines 72.6 59.8
Capacity rights 39.7 37.5
Less accumulated depreciation (96.2) -_____ (92.3)
Totals $115.8 -
The principal additions in fiscal 2011 were land, street system, storm system and construction-in-
progress. A majority of the street system additions was related to completion of the capital improvement
projects in the Midtown and street resurfacing project. Construction in progress included the Senior
Center, Alviso Adobe Renovation, Calle Oriente Park, and Cardoza Park Playground renovation. Further
detail on capital assets, current year additions and construction in progress can he found in 1’ote 8.
The City depreciates all its capital assets over their estimated useful lives. The purpose of depreciation is
to spread the cost of a capital asset over the years of its useful life so that an allocable portion of the cost
of the asset is borne by all users. Additional information on depreciable lives may be found in Note 8.
I
181
DEBT ADMINISTRATION
Substantially all of the City’s debt was issued to finance redevelopment projects and Sewer infrastructureimprovements. These debt issues are secured by the tax increment revenue of the Redevelopment Agency,and sewer revenue. Each of the City’s debt issues is discussed in detail in Note 9 to the financialstatements. At June 30, 20]] the City’s debt comprised:
Table 9Outstanding Debt
(in Millions)
Balance BalanceGovernmental Activity Debt: June 30, 2011 June 30, 2010
Redevelopment Agency 2003 Tax Allocation Bonds2% - 5.25%, due September 1,2032 $168.9 $174.2
Installment Purchase Agreement with the CountyOf Santa Clara. due June 30, 2023 34.0 36.9
Total Governmental Activity Debt $202.9
_____
$211
Business-type Activity Debt:
Sewer Certificates of Participation, 2006 Series A3.4% -4.2%, due November 1, 2026 $ 8.1 $ 8.5
Total Business-type Activity Debt $ 8.1 $ 8.5
LOCAL IMPROVEMENT DISTRICT DEBT
Local improvement districts in different parts of the City have issued debt to finance infrastructure andfcilities construction entirely in those districts. Al June 30, 2011, a total of $16 million in localimprovement district debt was outstanding, issued by three local improvement districts. This debt issecured only by special assessments on the real properties in the district issuing the debt, and is not theCity’s responsibility. The City does act as these Districts’ agent in the collection and remittance ofassessments, and in the management of facilities construction. Further detail on these districts may hefound in Note 15 to the financial statements.
ECONOMIC OUTLOOK AND MAJOR JMTL&TIVES
The economy of the City and its major initiatives for the coming year are discussed in detail in theaccompanying Transmittal Letter.
In an efftri to balance its budget, the State of California adopted A13x1 26 on June 28, 2011, whichsuspends all new redevelopment activities except for limited specified activities as of that date anddissolves redevelopment agencies effective October 1, 2011. The State simultaneously adopted ABxI 27which allows redevelopment agencies to avoid dissolution by opting into an “alternative voluntaryredevelopment program” requiring substantial annual contributions to local schools and special districts.Although the City agendized the introduction of an Ordinance to opt in to the Voluntary program onAugust 16, it was not able to enact the Ordinance due to the Court stay discussed below.
19
On July 18, thc California Redevelopment Association, Ihe I eag1Je of California Cities and others
challenged (lie validity and constitutionality of ABIx 26 and 27 to the California Supreme Court. On
August 11, 2011, as modi1ed on August 17, 2011, the California Supreme Court agreed to hear the case
and issued a partial stay of ABxI 26 and a 11111 stay ofABxJ 27, but the stay did not include the section of
ABxI 26 that suspends all new redevelopment activities. It is anticipated that the Court will render its
decision before January 15, 2012, the date the first voluntary program payment is due.
Please refer to Note 17 for further discussion on the potential consequences to the Agency from the
decision of the Supreme Court.
CONTACTING THE CITY’S FiNANCIAL MANAGEMENT
This Comprehensive Annual Financial Report is intended to provide citizens, taxpayers, investors, and
creditors with a general overview of the City’s finances. Questions about this Report should be directed
to the Finance Department, at 455 East Calaveras Boulevard, Milpitas, CA 95035-5479 or to the City’s
website at www.ci.milpitas.ca.gov.
I
20I
STATEMENT OF NET ASSETS ANDSTATEMENT OF ACT!yin ES
The Statement o[ Net Assets reports the di fierence between the City’s total assets and the City’s total I abilities.including all the City’s capital assets and all its long—term debt. The Statement of Net Assets fbcuses the reader onthe composition olihe City’s net assets by subtracting total liabilities from total assets.
The Statement of Net Assets summarizes the financial position of the City’s Governmental Activities in a single
Ucolumn, and the financial position of all the City’s Business—type Activities in a single column; these columns arcIbilowed by a Total column that presents the financial position of the primary government. This column isFollowed by a column that displays the discretely presented component unit.
The City’s Governmental Activities include the activities of its General Fund, along with all its Special Revenue,Capital Projects and Debt Service Funds. Since the City’s Internal Service Funds service these Funds, theiractivities are consolidated with Governmental Activities, after eliminating inter-fund transactions and balances.The City’s Business-type Activities include all its Enterprise Fund activities.
The Statement of Activities reports increases and decreases in the City’s net assets. It is prepared on the full
fl accrual basis, which means it includes all the City’s revenues and all its expenses, regardless of when cashchanges hands. This differs from the “modified accrual” basis used in the Fund financial statements, whichreflect only current assets, current liabilities, available revenues and measurable expenditures.
The Statement of Activities presents the City’s expenses first, listed by the program, and follows these with theexpenses of its Business-type Activities. Program revenues — that is, revenues which are generated directly by
these
programs — are then deducted from program expenses to arrive at the net expense of’ each governmental andbusiness-type program. The City’s general revenues are then listed in the Governmental Activities, Business-typeActivities or discretely presented component unit column, as appropriate, and the Change in Net Assets iscomputed and reconciled with the Statement of Net Assets.
Both of these Statements include the financial activities of the City and the blended component unit: the MilpitasRedevelopment Agency (RDA) and the Economic Development Corporation (EDC). The RDA is a legally
fl separate component unit of the City because it is controlled by the City and the City is financially accountable forthe Agency’s activities. The EDC is a California nonprofit public benefit Corporation that is also a legallyseparate component unit of the City because it is governed by a board consisting of the members of the City
U Council. The balances and the activities of the discretely presented component unit of Terrace Gardens, Inc. areincluded in these statements as separate columns.
These financial statements along with the fund financial statements and footnotes are called Basic FinancialS1c11cinefl1s.
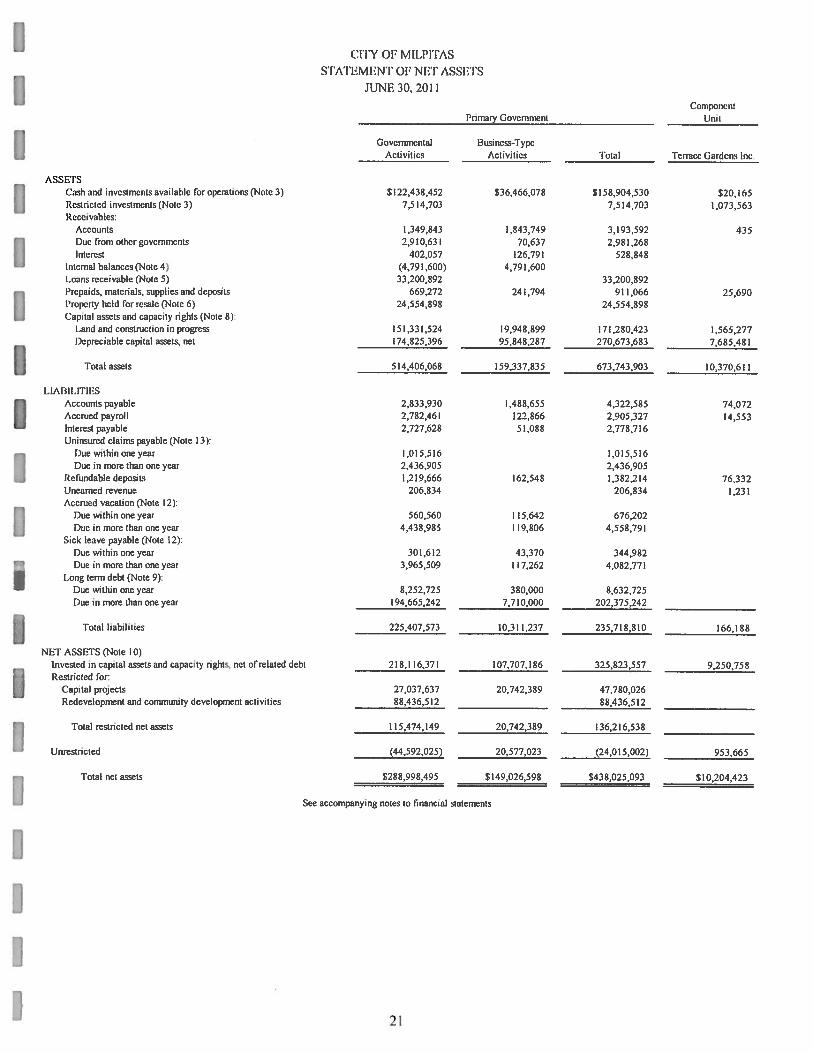
Cfl’Y OF MILPI’I’AS
STATEMENI’ OF NE’!’ ASSETS
JUNE 30, 2011
ComponentPci mary Government (lint
Governmental I3iisincssTypeActivities Activities Total Terrace Gardcns Inc
ASSI ‘l’s(‘ash and investments available toroperationS (Note 3) $122,438,452 $36,466,078 $158,904,530 $20165Rcstrictcd investments (Note 3) 7,514,703 7,514.703 .073,563Receivables:
Accounts 1,349,543 1843,749 3,193,592 435
Due
from other governments 2,910,63] 70,637 2,9S1 268Interest 402,057 126,791 528,848
Internal balances (Note 4) (4,791,600) 4,791,600Loans receivable (Note 5) 33.200,892 33.200,892
Prepaids,
materials, supplies and deposits 669,272 241,794 911,066 25,69(1Properly held for resale (Note 6) 24,554,898 24,554,898Capital assets and capacity rights (Note 8):
Land and construction in progress 151,331,524 19,948,899 171,280,423 1,565,277Depreciable capital assets, net 174,825,396 95,848,287 270,673,683 7,685,481
Total assets 514,406,068 159,337,835 673,743.903 10,370,611
I .IAI Ill .l’flt (S
Accounts
payable 2,833,930 L488,655 4,322.585 74,072Accrued payroll 2,782,46) 122,866 2,905,327 14,553tntcrest payable 2,727,628 51,088 2,778,716Uninsured claims payable (Note 13):
[Juewithinoneyear
1,015,516 1.015516Due in more than one year 2,436,905 2,436.905
Refundable deposits 1,219,666 162,548 1,382,214 76,332(Inearned revenue 206,834 206,834 1,231
Accrued
vacation (Note 12)Due within one year 560,560 115,642 676,202Due in more than one year 4,438,985 119.806 4,558,79]
Sick leave payable (Note 12):Due within one year 301,612 43,370 344,982
Due
in more than one year 3,965,509 117.262 4,1)82.77)I .ong term debt (Note 9)
Due within one year 8,252,725 380,001 8.632.725Due in more than one year 94,665,242 7,710,000 202,375,242
‘I’otal liabilities 225,407.573 1(1,311237 235,718,810 166,188
NUT ASSI(TS (Note 10)Invested in capital assets and capacity rights, net of related debt 2: 8,: (6,37 107,707,186 325,823,557 9,250,758Restricted for
Capital projects 27,037.637 20742,389 47.780,026Redevelopment and community development activities 88,436,512 88,436,512
‘l’otal restricted net assets 1)5,474,149 20,742,389 136,216,538
____________________
Unrestricted (4.1,592,025) 20,577,023 (24,015.002) 953,665
Total net assets S288,998,495 $149,026,598 S438,025,093 5 1(1,204,423
See accompanying notes to financial statements
21
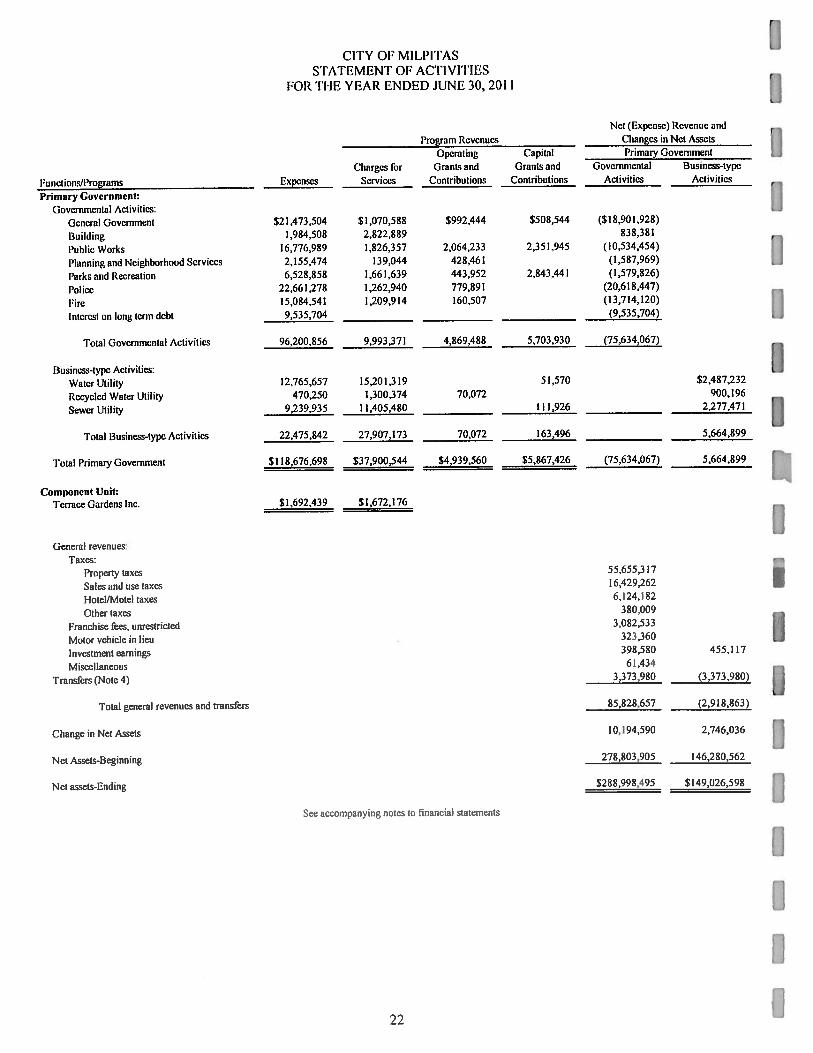
CJ’I’Y OF MILPI1’ASS’FAThMEN’I’ OF AC1’IVI’I’IFS
lOR fl IF YEAR ENDED JUNE 30, 2011
Net (Expense) RevenLie and
Program Revenues Changes in Net Assets
Operating Capital Primary Government
Charges Pir Grants and Grants and Governmental Busmess-type
Funelions/l’rograrns Expenses Services Contributions Contributions Activities Activities
Pi-ijuary Government:Governmental Activities:
General Government $21,473,504 $1,070,588 $992,444 $508,544 ($18,901,928)
Budding 1,984,508 2,822,889 838.381
l’uhlic Works 16,776,989 1,826,357 2,064,233 2,351.945 (10,534,454)
Planning and Neighborhood Services 2,155,474 139,044 428,461 (1.587,969)
Parks and Recreation 6,528,858 1,661,639 443.952 2,843,441 (1,579,826)
Police 22,661,278 1,262,940 779,891 (20,618,447)
Fire 15,084,541 1,209,914 160,507 (13,714,120)
lnlrrest on long term debt c,535,704 (9,535,704)
‘total Govcriiincntal Activities 96200856 9,993,371 4,869,488 5.703,930 (75,634,067)
Business-type Activities:
Water Utility 12,765,657 15,201,319 51,570 $2,487,232
Recycled Water Utility 470,250 1,300.374 70.072 900,196
Sewer Utility 9,239.935 11,405,480
_____________
111,926 2,277,471
Total Business-type Activities 22,475,842 27,907,173 70,072 163,496 5.664.899
lotal Primary Government $1 18.676.698 $37,900,544 $4,939,560 55,867,426 (75,634,067) 5,664,899
Component IjnB:Terrace Gardens Inc. $1,692,439 $1,672,176
General revenues
‘laxes:Property taxes 55.655,317
Sales and use taxes 16,429,262
I Iotel/MoleI taxes 6,124.182
Other taxes 3 80.009
Franchise fees, unrestricted 3.082,533
Motor vehicle in lieu 323.360
Investment earnings 398.580 455,117
Miscellaneous 61,434
Transfers (Note 4) 3,373,980 (3 .373 .980)
Total general revenues and transitrs 85,828,657 (2,918,863)
Change in Net Assets 10,194,590 2.746,036 flNet Assets-Beginning 278,803,905 146.280,562
Net assets-Endiris 5288,998.495 $1 49026,598
See accompanying notes to financial statements
II

Net (Ixpensc)
Revenue andChanges in Nct Assets
______________________
(‘oniponent UnitTerrace
lolal Gardens Inc.
($18,901,928)
838,381(10,534454)
(1,587,969)
(1,579,826)
(20,61 8,447)
(13,714,120)
(9.535,704)
(75,634,067)
2,487.232
900,1962,277,471
5,664,899
(69,969,168)
($20,263)
55,655,317
16,429,262
6,124,182
380,009
3,082,533
3 23 .360853,697 6,65561434
82,909,794 6,655
12,940.626 (13,608)
425,084,467 10,218,031
$438,025,093 $10,204,423
23

aa
aa
aa
aaa
[ FUND FINANCIAL STATEMENTS
GAS l 34 revises the lonnat of the Fund Financial Statements so that only individual major funds are presented,
[ while non—major kinds are combined m a single column. Major funds are defined generally as having signi licantJ activities or balances in the current year. No distinction is made between Fund types.
) - MAJOR GOVERNMENTAL_FUN1S-_____________
The funds described beloW were determined to be Major Funds by the City, individual non-major funds may belound in the Supplemental section.
GENERAL FUN I)
The General Fund is used for all the general revenues of the City not specifically levied or collected for other Cityfunds and the related expenditures. Eke general Find accounts For all financial resources of a governmental unit,which arc not accounted for in another fond.
ECONOMIC DEVELOPMENT CORPORATION FUND
U Established to account for ihc activities of the Milpitas Economic Development Corporation formed for the purposeof providing physical, economic and educational development, redevelopment and revitalization efforts within theCity.
HOUSING RESERVE FUND
Established by the Redevelopnient Agency of the City of Milpilas to account for tax allocations set aside for thepurpose of increasing or improving the City’s supply of low or moderate—income housing as required by Californiaredevelopment law.
REDEVELOPMENT PROJECT FUNI)
Established to account for the financing and construction activities in the redevelopment project areas.
STREET IMPROVEMENT FUND
Established to account for the construction and maintenance of the street system in Milpitas. Financing may beprovided through state and Federal grants.
TRANSET AREA IMPACT FEE FUNI)
Established to account for capital projects in the transit area. A special transit area impact fee is imposed ondevelopments to provide financing.
(‘Il’s’ OF MI ,l’l’I’AS
GOVI1RNMI1N’I’AI, ‘lINUS
BA] .AN(’li SI 11FF
.IUNI 30. 2011
I eonoinieDevelopment I lousirt’ Redevelopment Street
General Corporation Reserve Project Improvement
ASSI ‘I’S
(‘ash and investments avaAiblc for operations (Note 3) $32,529,518 $36,167,721 $11,687,354 $375,738 $11,973,658
Restrictcd mvcstrneiits (Note 3) 7,514,703
Receivables:Accounts 1,258,610 196 62,943
Due from other governments 2,037,986 163,221 414,491
Interest 103,668 133,381 40,049 42,346
Advances to other funds (Note 4) 23,225,237 9,359,194 8,925,177
Loans receivable (Note 5) 29,832,457
Prepaids, materials, supplies and deposits 514.352 3,822 15.868
Property held for resale (Note 6) 24,554,898
_________________
‘total Assets $84,224,269 $53,174,909 $50,488,859 $555,023 $12,493,438
I.IA III I .l’I’IES
Accountspayable $1,368,103 $6.801 $20,025 S517,556 $536,653
Accrued payroll 2.677,540 919 9,456 37A68 22.639
Refundable deposits 1,198,323 2,500
Deferred revenue 2,877,360 730,033 30,157,634
Advances from other hinds (Note 4) 32,150,414
________________
lolal 1.iabilities 8,121,326 737.753 30,180.615 32,705,438 559.292
FUND BALANCES
Fund balances (Note 10):
Nonspendabie 20,069.543 3822 15.868
Restricted 24,554.898 52.437.246 20.295422 11.934,146
Committed 5432,703
Assigned 9,697.740
Unassigned 15.448.050 (32,166,283)
TO’FAL FUND BAlANCES 76,102,943 52,437,246 20.299.244 (32,l50,45) 11,934,146
Total Liabilitiesand lund Balances $84,224,260 $53,174,990 $50,488,859 $555,023 $12,403,438
Amounts reported for Governmental Activities in the Statement of Net Assets
are dilibrent Irons those reported in the Governmental Funds above because of the following’
CAPI’I’AL ASSE’I’SCapital assets used in Governmental Activities are not current assets or linancial resources and therefore are not reported in the Governmental lands
Al .1 .OCATION OF INTERNAl. SERViCE FUND NET ASSETS
Internal service funds are not governmental funds. I lowever, they are used by management to charge the costs of certain activities, such as insurance and
central services and maintenance. to individual governmental funds, The net current assets ofllie Internal Service Funds are therefore included
in Governmental Activities in the Statement of Net Assets.
ACCRUAL OF NON-CURREN’l’ REVENUES AND FXI’ENSES
Revenues which are deferred on the Fund Balance Shcets because they are not available currently are taken
into revenue in the Statemcnt of Activities
:ONG TERM ASSETS A\i) LIABILITIES
‘I’he assets and liabilities below are not due and payable in the cuncnt period and tlierelbre are not reported in the Funds.
Long-tems debtInterest payableNon-current portion of accrtied vacation and sick leave
Non-current portion of uninsured clainss payable
NET ASSETS OF GOVERNMENTAL AC El VITIES
See accompanying notcs to financial statements
26
Other Total‘transit Area Governmental Governmental
1 mpact Fcc — Funds Funds
$2,794,415 $18,351,495 $113,879,8997,514,703
28,094 1,349,843294,933 2,910,631
1,691 50,951 372,08641,509,608
3,368,435 33,200,8923,201 537,243
24,554,898
$2,796, 106 $22,007,109 $225,829,803
$100,911 $211,887 $2,761,9362,572 13.393 2,763,987
18,843 1,219,66699,520 33,864,547
14.150,794 46,301.208
14.254.277 343,643 86.911.344
3,201 20,992,43419,622,759 128,844.471
5,432,7032,127,506 11,825,246
(11,458,171) (28,176.395)
(11,458,171) 21,753.466 138,918,459
$2796.106 $22,097,109
326,1 56.920
8,551,965
33.657.713
(2(12.917.967)(2,727.628)(9.1 88,546)(3,452,42))
$288,998,495
27

CITY OF MILPITASGOVERNMENTAL FUNDS
STATEMENT OF REVENUES, EXPENDITURESAND CHANGES IN FUND BALANCESFOR THE YEAR ENDED JUNE 30, 201 1
IEconomic
Development Housing Redevelopment Street
General Corporation Reserve Project Improvement
REVEN I iFS
I’roperty taxes $16,651,635 $39,003,681
Sales taxes 16,994,002
Other taxes 9,898,176
1,icenscs and lines 4,309,019
Use of money and property 2,745.499 $117,539 $377,576 416,709 $93,258
Intergovernmental 1,148,666 112,731 1,458529
Charges lbr services 3,658,956
Developer contributions 425,000 101,167 138,499
Other 90,074 940,876 3,221 1,500
Total Revenues 55,496,027 117.539 .743,452 39.637,509 1,691,786
I XPEND1’[’URES
Current:
General Government 11.885,491 3,057,528 3,830,950 110.241
Building and Safety 1,974,820
Publie Works 6,304,456 13,983 444,216 186,991
Planning and Neighborhood Services 1,199,410 288,963 356.686
Parks and Recreation 5,688,045
Police 21,636,783
Fire 14,994.417
Supplemental educational revenue
augmentation fund payment (Note lo) 2,424,140
Capital outlay 64.421 6,786 8,953,948 2,564.643
Debt service:
Principal 8,224,862
Interest and fees 11.748.543
Total Expenditures 63 .747,843 20,769 3.346,49 I 35,983,345 2,86 ,875
EXCESS (DEFICIENCY) OF RLVE1\
OVER EXPENDITURES (8,251.816) 96,770 (1,603.039) 3,654,164 (1,170.089)
OTHER FINANCING SOURCES (USES)
Proceeds from sale ol’property 5,116
Transfers in (Note 4) 34,054.456 62,047,926 11,668,669 10,555,357 744,439
Transfers (out) (Note 4) (500.000) (9,707,450) (17,227.386) (87,680,381) (423,903)
Total Other l’inancing Sources (Uses) 33,559,572 52,340,476 (5,558.717) (77,125,024) 320,536
NFl’ CFIANGE IN FUNI) I3ALANCES 25.307,756 52,437,246 (7,161,756) (73,470,860) (849.553)
Fund balances (deficits) at beginning o’pcrJoC 50,795,187 27,461.000 41,320,445 12,783,699
FUND BALANCES (DEFICITS) AT ENf) OF PERIOD $76,102,943 $52,437,246 $20,299,244 ($32,150,415) $11,934,146
See accornpan lag notes to financial statements
I
28
Other Total‘l’ranst Area Governmental GovernmentalImpact Fee Funds Funds
$55,655,31616,994,002
$1,018,660 10,916,8364,309,019
$825 196,798 3,948,2042,361,719 5,081,645
361,260 4,020,2162,695,030 3,359,696
_____________
3,050 1.038,721
825 6,636,517 105,323,655
119,150 19,003,360
1,974,8201,010,140 7,959,786
422,392 2,267,451
5.688,04545,035 21.681,818
4,994,417
2,424,140602,414 747,478 12,939,690
8,224,862637,381
_______________
2,385,924
1,239,795 2,344,195 109,544,313
(1,238,970) 4,292,322 (4,220658)
5,116142,112 119,212,959
_____________
(299,859) (115,838,979)
______________
(157,747) 3,379,096
(1,238,970) 4,] 34,575 (841,562)
(10,219,201) 17,618.89! 39.760,02!
($1 1.458,17]) $21,753,466 $138,918,459
29
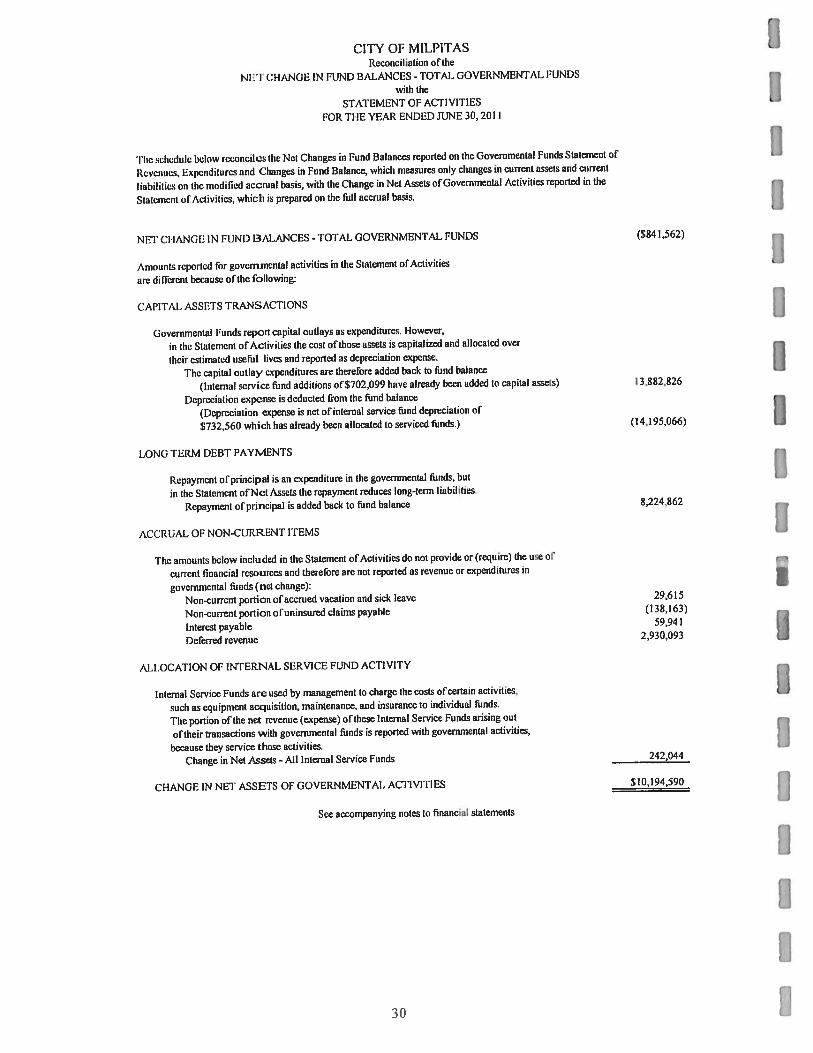
CITY OF MILPITASReconciliation of the
NE’I Ct-lANGE IN FUND BALANCES - TOTAl. GOVERNMENTAL FUNDS
with the
STATEMENT OF ACTIVItiES
FOR TI-IF YEAR ENDED JUNE 30, 2011
‘the schedule below reconciles the Net Changes in Fund Balances reported on the Governmental Funds Statement of
Revenues, Expenditures and Changes in Fund Balance, which measures only changes in current assets and current
liabilities on the modified accrual basis, with the Change in Net Assets ofGovernrnental Activities reported in the
Statement of Activities, which is prepared on the full accrual basis.
NFl’ Cl lANGE IN FtlNl) I3ALANCES - ‘tOTAL GOVERNMENTAL FUNDS ($841,562)
Amounts reported for governmental activities in the Statement of Activities
are different because of the following:
CAPITAL ASSETS TRANSACTIONS
Governmental Funds report capital outlays as expenditures. However,
in the Statement of Activities the cost of those assets is capitalized and allocated over
their estimated useful lives and reported as depreciation expense.
The capital outlay expenditures arc therefore added back to hind balance
(Internal service fund additions of$702.099 have already been added in capital ;isse:s) 13,882,826
Depreciation expense is deducted from the fund balance
(Depreciation expense is net of’ internal service fund depreciation of’
$732,560 which hrts already been allocated to serviced funds.) ([4,1 95,066)
LONG ‘l’ERM Dl iB’I’ IAYMENTS
Repayment of principal is an e\penuiturc in the governmcnial funds, but
in the Statement ofNct Assets the repayment reduces long-term Liabilities
Repayment of principal is added hack to fund balance 8,224.862
ACCRUAL OF NON-CL’RRLNT [TEMS
The amounts below included in the Statement of’ Activities do not provide or (require) the use of’
current financial resources and therefore are not reported as revenue or expenditures in
governmental funds (net change):
Non-current portion of accrued vacation and sick leave 29,615
Non-current portion ofuninsured claims payable (138,163)
Interest payable 59,941
Deterred revenue 2,930093
AlLOCATION OF INTERNAL SERVICE FUNF) AC FIVII’Y
nternal Service Funds arc used by management to charge the Costs ofccrtain activities, Usuch as equipment acquisition, maintenance, and insurance to individual funds.
‘The portion of the net revenue (expense) of these Internal Service Funds arising out
oftheir transactions with governmental funds is reported with governmental activities,
because they service those activities.
Change in Net Assets - All Internal Service Funds 242,044
Cl IANGI; IN NET ASSETS OF GOVERNMEN’I’AI. AC’I’IVITIES $10,194,590
See accompanying notes to financial statements
30

CITY OF MILPITASGENERAL FUND
STATEMENT OF REVENUES, EXPENDITURESAND CHANGES IN FUND BALANCE
13U[)GET AND ACTUAL (NON GAAP LEGAL BASIS)FOR THE YEAR ENDED JUNE 30, 2011
Variance withBudgeted Amounts Budget
Actual Amounts PositiveOriginal Final Budgetaiy Basis (Negative)
RevenuesProperty taxes $17.2 17,500 $17,217,500 $16,651,635 ($565,865)Sales taxes 15,364,697 15,364,697 16.994,002 1,629,305Other taxes 9.019,750 9,019,750 9,898,176 878,426Licenses and fines 3,306,000 3,316,000 4,309,019 993,019Use ot money and property 729,000 729,000 2,745,499 2,016,499Intergovernmental 351,000 595,104 1,148,666 553,562Charges for services 3,658,100 3,658,100 3,658,956 856Other 68,000 71,670 90,074 18.404
Total Revenues 49,714.047 49.971,821 55,496.027 5,524,206
Expenditures(‘urrerit:
General Government:City Manager 2,037,247 2,040,747 1,921,438 119,309City Attorney 646,200 646,200 646,198 2Finance 2,416,573 2.416,573 2,300,427 116,146Information Services 2,751.327 2,751,327 2,655.219 96,108Iluman Resources 1,014,885 1,014,885 787,669 227.216Non-departmental 4,962,185 4.381,998 3,735,863 646,135
Building and Satèty 1,978,287 1,978,287 1,974,820 3,467Public Works 6,618,931 6,633,066 6,327,271 305,795Planning and Ncighborhnod Services 1.290.944 1,290,944 1,199,410 91,534Parks and Recreation 6,310,915 6,315,730 5,688.509 627,221Police 22,121,728 22,191,628 21.639.617 552,011Fire 14.243,187 14,999,451 14,994,554 4,897
Total Expenditures 66,392409 66,660.836 63,870.995 2.789,841
EXCESS (DEFICIENCY) OF REVENUESOVER EXPENDITURES (16.678,362) (16,689,015) (8,374,968) 8,314.047
fY11 IER FINANCING SOURCES (USES)Proceeds from sale of property 3.000 3,000 5,116 2,116Transfers in 9.699.558 20.28(1,558 34.054,456 13,773,898Transfers (out) (350,000) (500,000) (500,000)
Total Other Financing Sources (Uses) 9,352,558 19.783,558 33,559,572 13,776,014
Net change in fund balance ($7,325,804) $3,094,543 25,184,604 $22,090,061
Adjustment to budgetat basis:Capital outlay (6.4,421)Encumbrance expenditures I 87.573
Fund balance. July 1 50,795,187
Fund balance. June30 $76,102,943
See aecompan ing notes to tinancial statements
31
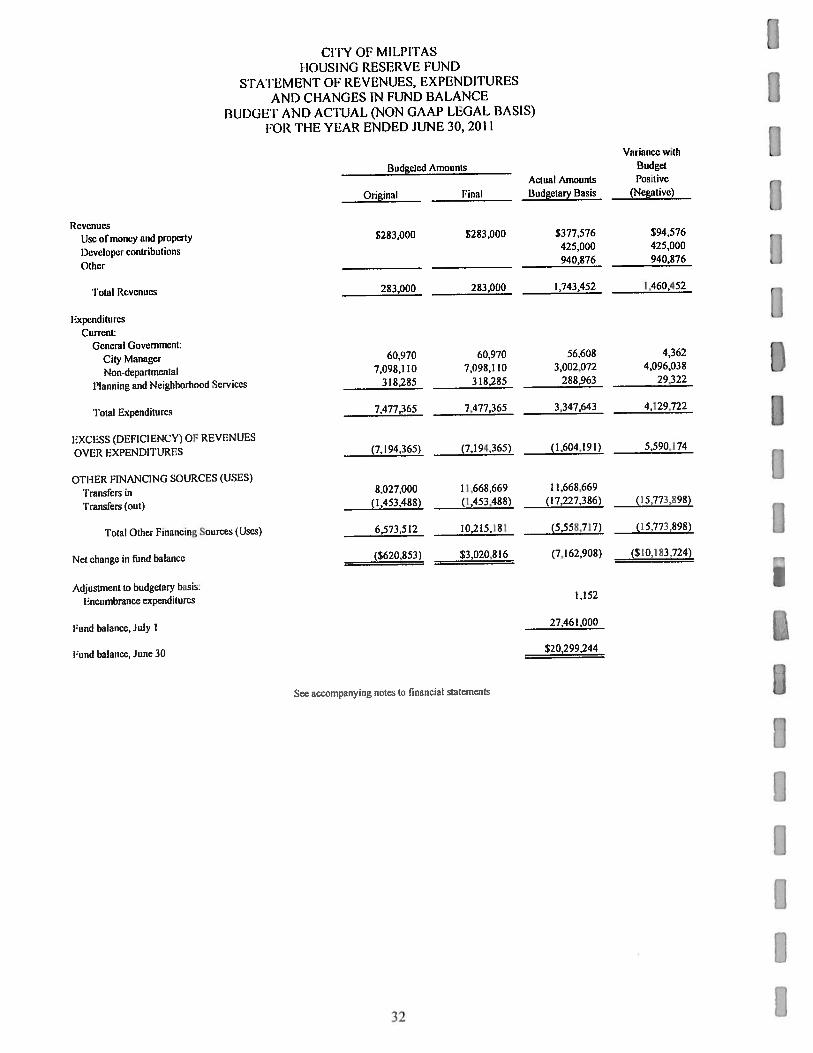
(i’I’Y OF MILP1TASI lOUSING RESERVE FIJN[)
STA’I’[iMENT OF REVENUES, EXPENDITURESANI) CI IANGES IN FUND BALANCE
BUDGET ANI) ACTUAL (NON GAAP LEGAL BASIS)
FOR THE YEAR ENDED JUNE 30, 2011
Variance with
lludgcted Amounts Budget
Actual Amounts Positive
Original Budgetary Basis (Negative)
Revenues
Use of money and property $283,000 $283,000 $377,576 $94,576
Developer contributions425,000 425,000
Other 940,876 940,876
lotat Revenues 283,000 283,01)0 1.743.452 1.460.452
I xpenditurcs
Current:General Government:
City Manager 60.970 60.970 56,608 4.362
Non-departmental 7,098,110 7,098,110 3,002.072 4,096,038
Planning and Neighborhood Services 318,285 318,285 288,963 29,322
‘t’otal Fxpenditurcs 7,477,365 7.477,365 3,347,643 4,120.722
FXCI1SS (DEFICIENCY) OF REVENUES
OVER IJXP[1NDI1’IIRII.S (7.194.365) (7,194,365) (1,604,19]) 5,590.174
O’l’l IJIR FINANCING SOURCES ((iS I S)
‘Franst1rs in 8,027.000 11668,669 11,668.669
Transfers (out) (1,453.488) (1.453,488) (17,227,386) (15.773.898)
‘lotal Other Financing Sources (Uses) 6,573,512 10,215,18 (5,558,717) (15,773,898)
Net change in bind balance ($620,853) $3,020,816 (7.162,908) ($10,] 83,724)
Adjustment to budgetary basis:
Encumbrance expenditures 1,152
Fund balance. July 1 27,461,000 1Fund balance. June 30 $20,299,244
See accompanying riolcs to financial statements
32 1
r AJ0R PROPRIETARY FUNDS 1Proprietary funds account for City operations financed and operated in a manner similar to a private business
enterprise.The intent of the City is that the cost of providing goods and services be financed primarily through usercharges.
fl [he concept of major fi,nds established by GASB Statement 34 extends to Proprietary Funds. The City hasidentified the funds below as major proprietary funds.
GASI3 34 does not provide for the disclosure of budget vs. actual comparisons regarding proprietary funds that aremajor funds.
WATER UTiLITY FUNI)
Accounts for the provision of water services to residents and businesses of’ the City. All activities necessary to[j provide such services are accounted for in this fund, including, but not limited to, administration, operations, capitalimprovements, maintenance, billing and collection.
RECYCLED WATER UTILITY FUND
Accounts for the provision of recycled water services to businesses within the City. All activities necessary toprovide such services are accounted for in this fund, including, hut not limited to, administration, operations, capitalimprovements, maintenance, hilling and collect ion
SEWER UTLLITY FUND
Accounts for the provision of sewer services to residents and businesses of the City. All activities necessary toprovide such services are accounted for in this fund, including, hut not limited to, administration, operations, capitalimprovements, maintenance, financing, hilling and collection.
r NON-MAJOR INTERNAL SERVICE FUND 1EQUIPMENT N’IANAGEMENT INTERNAL SERVICE FUND
The Equipment Management Internal Service Fund is used to finance and account for the replacement of equipmentused by City departments and the maintenance of computer systems on a cost reimbursement basis.
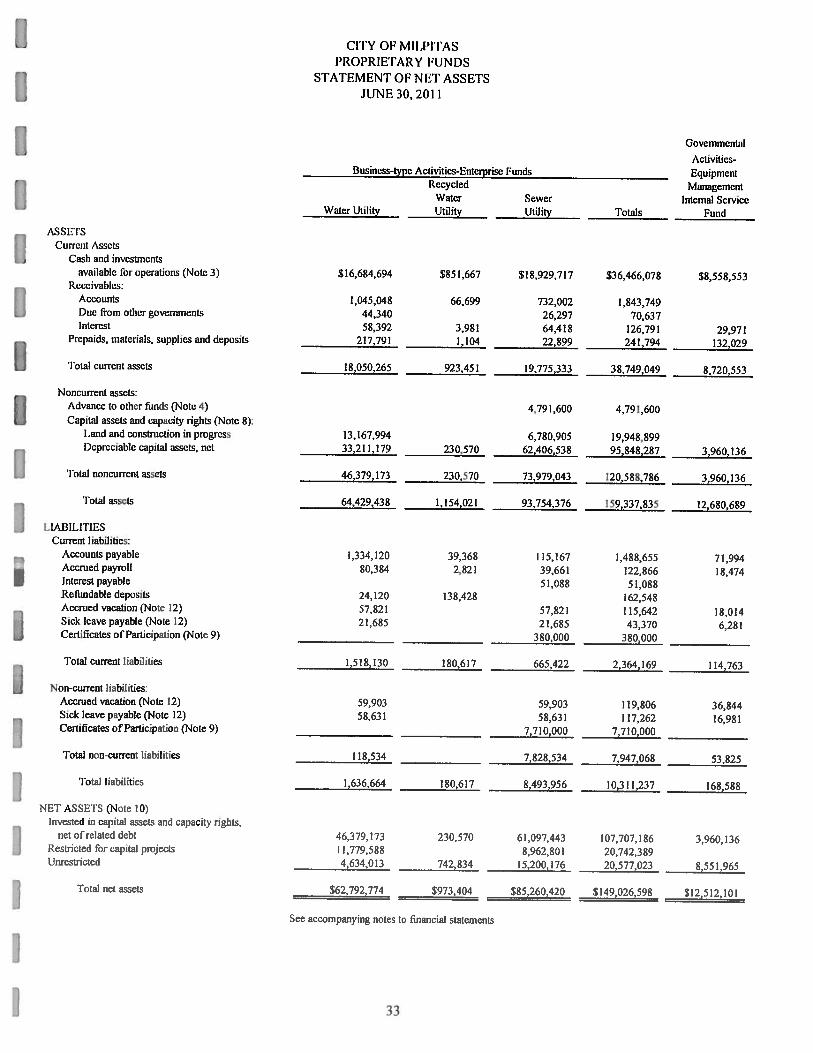
ASSIISCurrent Assets
Cash and investrncntsavailable for operations (Note 3)
Receivables:AccountsDue from other governmentsInterest
Prepaids, materials, supplies and deposits
‘l’otal eurrent assets
Noncurrent assets:Advance to other funds (Note 4)
Capital aS5ets and capacity rights (NoIc 8):Land and construction in progressDepreciable capital assets, net
Total noncurrent assets
Totil assets
I .IABILITIIiSCurrent liabilities:
Accounts payableAecrued payrollInterest payableRefundable depositsAccrued vacation (Note 12)Sick leave payable (Note 12)Certifeatcs of Participation (Note 9)
Total current liabilities
Non-current I abilities.Accrued vacation (Note 12)Sick leave payable (Note 12)Certificates of Participation (Note 9)
Total non-current liabilities
Total liabilities
NET ASSETS (Note 10)Invested in capital assets and capacity rights.
net of related debtRestricted for capital projectsUnrestricted
Total net assets
CI’l’Y OF MIU>[I’ASPROPRIEFARY FUNDS
STATEMENT 01: NET ASSETSJUNE 30, 2011
Business-type Activities-Entcrisc FundsRecycled
Water Sewer‘Vater Utility Utility Utility
GovernmentalActivities
__________________
EquipmentManagement
Internal ServiceTotals Fund
$36,466,078 $8,558,553
1,843,74970,637
126,791 29,971241,794 132,029
38,749,049 8,720,553
4,791,600
19,948,89995,848,287 3,960,136
120,588,786 3,960,136
159,337,835 12680,689
$16,684,694 $851,667 $18,929,717
1,045,048 66,699 732,00244,340 26,29758,392 3,981 64,418
217,791 1,104 22,899
18,050,265 923,451 19,775.333
4,791,600
13,167,994 6,780,90533,211,179 230.570 62.406,538
46,379,173 230.570 73,979,043
64.429,438 1,154.021 93.754,376
.334,120 39,368 I 15.16780,384 2,821 39,661
51,08824,120 138,42857,821 57,8212t.685 21,685
380,000
1.518.130 180.617 665,422
59,903 59,90358,631 58,631
7,710,000
118,534 7.828,534
1,636,664 180,617 8,493,956
1,488,655 71,994122.866 18,47451,088
162.548115.642 18.01443,370 6.281
___________________ ________________ ________________
380,000
________________
__________________ _______________ _______________
2.364,169 114,763
119.806 36,844117,262 16,981
___________________ ________________ ________________
7,710,000
________________
___________________ ________________ ________________
7,947,068 53,825
_________________ ______________ ______________
10,311,237 168,588
46,379,173 230.570 61,097.443 107.707.186 :3960,13611,779,588 8962,8(11 20.742.3894,634,013 742,834 15.200,176 20,577,023 8,551,965
.$62,792.774 $973,404 $85,260,420 $149,026,598 $12,512,101
See aeeonparwJng notes to financial statements
33
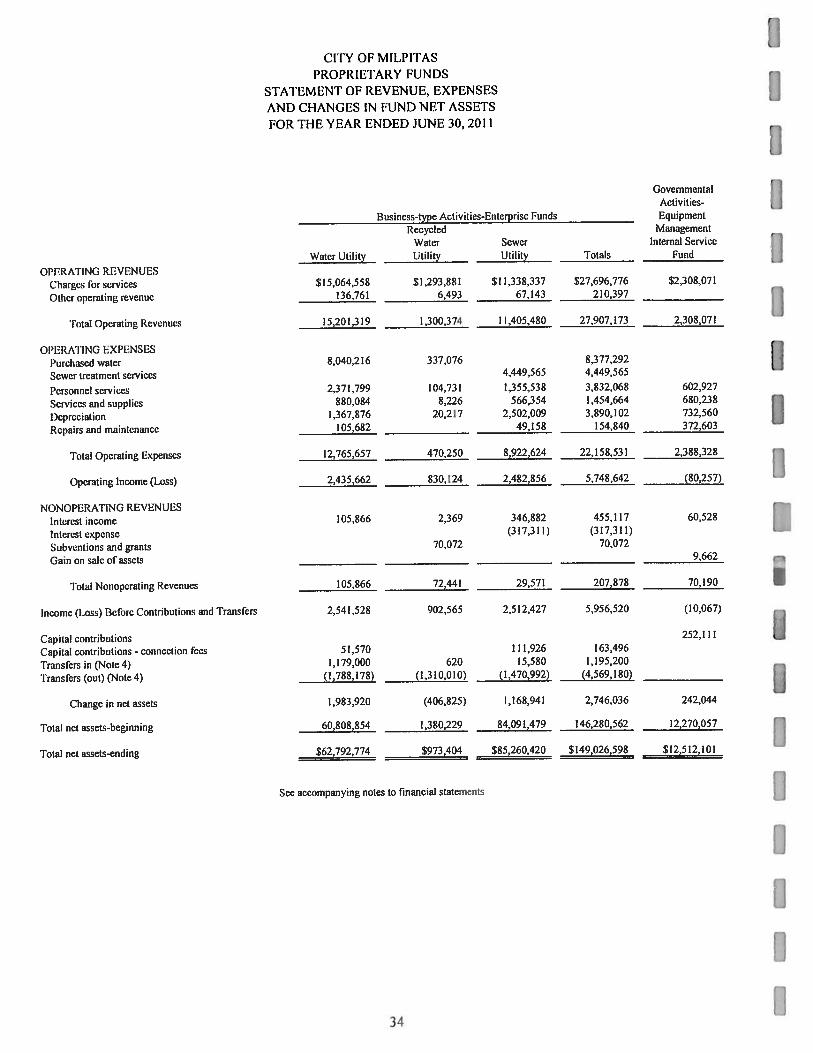
CITY OF MILPITAS
PROPRIL’I’ARY FUNDS
STATEMENT OF REVENUE, EXPENSES
AND CHANGES IN FUND NET ASSETS
FOR THE YEAR ENDED JUNE 30, 2011
GovernmentalActivities-
Business-type Activities-Enterprise Funds Equipment
Recycled Management
Water Sewer Internal Service
Water Utility Utility Utility Totals Fund
OPERATING REVENuESCharges forscrviccs $15,064,558 $1,293,881 $11,338,337 $27,696,776 $2,308,071
Other operating revenue 136,761 6,493 67,143 210,397
lotal Operating Revenues 15,201,319 1,300,374 11,405,480 27,907,173 2,308,071
OPERATING LXPENSF3SPurchased water 8,040,216 337.076 8,377,292
Sewer treatment services 4,449.565 4,449,565
Personnel services 2,371,799 104,731 1,355,538 3,832,068 602,927
Services and supplies 880,084 8,226 566.354 [.454,664 680,238
Depreciation 1,367,876 20,217 2.502,009 3,890,102 732,560
Repairs md maintenancr 105.682 4t, 158 154,840 372,603
Total Operating Expenses 12,765,657 470250 8.922.624 22,158,531 2.388,328
Operating Income (Loss) 2,435,662 830,124 2.482.856 5.748,642 (80.257)
NONOPERATING REVENUESInterest income 105,866 2,369 346,882 455,117 60,528
Interest expense (317,311) (317,311)
Subventions and grants 70,072 70,072
Gain on sale of assets 9,662
‘lola! Nonoperating Revenues 105,866 72.44 1 29,571 207.878 70.190
Income (I.oss) Before Contributions and ‘TransFers 2.541.528 902,565 2,512,427 5,956,520 (10,067)
Capital contributions 252.111
Capital contributions — connection Fees 51,570 111.926 163,496
Transfers in (Note 4) 1,179,000 620 15,580 1,195,200
Transfers (Out) (Note 4) (1.788.178) (1.310,010) (1470,992) (4.569.1 80
Change in nd assets 1.983,920 (406,825) 1.168,941 2,746,036 242.044
Total net assets-beginning 60,808,854 1,380,229 84,091,479 146,280,562 12,270,057
Total net assets-ending $62,792,774 $973,404 $85,260,420 $149,026,598 $12,512,101
See accompanying notes To financial Statements
34

CITY OF MILPITASPROPRIETARY FUNDS
STATEMEN’I’ OF CASH FLOWSFOR THE YEAR ENDED JUNE 30, 2011
GovcrnnicntalActivities-
Business-type Activities-I ntcrprise Funds EquipmentManagement
Recycled Water Sewer Internal ServiceWater Utility Utility Utility Totals Fund
CASH FLOWS FROM OPERATING AC’TIVITIES
Receipts
from customers $t5. 152,068 $1,328,811 $1 1,359,354 $27,840,233 $2,308.07 IPayments to suppliers (9,537,688) (339.684) (5,046,661) (14,924,033) (1,053,929)Payments to employees (2.343,710) (106.663) (1,333,254) (3,783,627) (591,981)
Net cash provided by operating activities 3,270,670 882,464 4,979,439 9,132,573 662,16!
CASh FLOWS FROM NONC’API’IAI.FINANCING ACTIVITIES
Subvcntions and grants 70,072 70,072
fl Advance to other hinds (217,800) (217,800)Transfers in 1,179,000 620 15,580 1,195,200Transfers (out) (1,788,178) (1,310,010) (1,470,992) (4,569.180)
Cash Flows from Noncapital Financing Activities (609,178) (1239,3 18) (1,673,212) (3.521,708)
CASh FLOWS I’ROM CAPI’l’AL. FINANCING ACTIVITIESPrincipal paid on Iong-tem debt (370,000) (370,000)
Interest
paid (319,468) (319,468)I’rocecds from sale of capital assets 9,662Acquisition of capital assets (3.724.217) (3.132.578) (6,856,795) (449,988)Capital contributions - connection kes 5 1.570 111.926 163,496
Cash Flows from Capital and RelatedFinancing Activities (3,672,647) (3,710.120) (7,382,7671 (440,326)
CASh FLOWS FROM INVESTING AC’FlVl’t’IIZSInterest received 139,005 9,474 358,375 506,854 71,347
Cash Flows from Investing Activities 139,005 9,474 358,375 506.854 71,347
Net increase (decrease) in cash and cash equivalents (872,150) (347,380) (45.518) (1.265.048) 293,182
Cash and investments at beginning of period 17,556,844 1,199,047 18,975,235 37,731,126 8,265.371
(‘ash and investments at end of’pcriod $16,684,694 $851,667 ¶i 18.929,717 $36466078 $8,558,553
Reconciliation of operating income to net cash provided byoperating activities:
Operating
income (loss) $2,435,662 $830,124 $2482856 $5,748,642 ($80,257)Adjushncnts to reconcile operating income to net cash provided
by operating activities:Depreciation 1,367.876 2(1.217 2,502.009 3,890.102 732.560
Change
in assets and liabilities:Receivables, net (48,871) (8,146) (46,126) (103,143)Materials, supplies and deposits (9,109) 1,914 693 (6.502) (28,994)Accrued payroll 11,300 (1,932) 5,495 4.863Accounts and other payables (486,188) 40,287 34.512 (411,389) 38,852
Net cash provided by operating activities $3,270,670 $882,464 $4,979,439 $9,132,573 $662,161
\ONCAS1l TRANSACTIONS.
Contributions and transfers of capital assets, net $252,111
Sec accompanying notes to financial statements
35

I FIDUUARY FUNDS
FIDUCIARY FUNDS
U Agency funds are used to account for assets held by the City as an agent for individuals, private organizations, andother governments. The financial activities of these funds are excluded from the City-wide financial statement, butare presented in separate Fiduciaiy Fund financial statements.
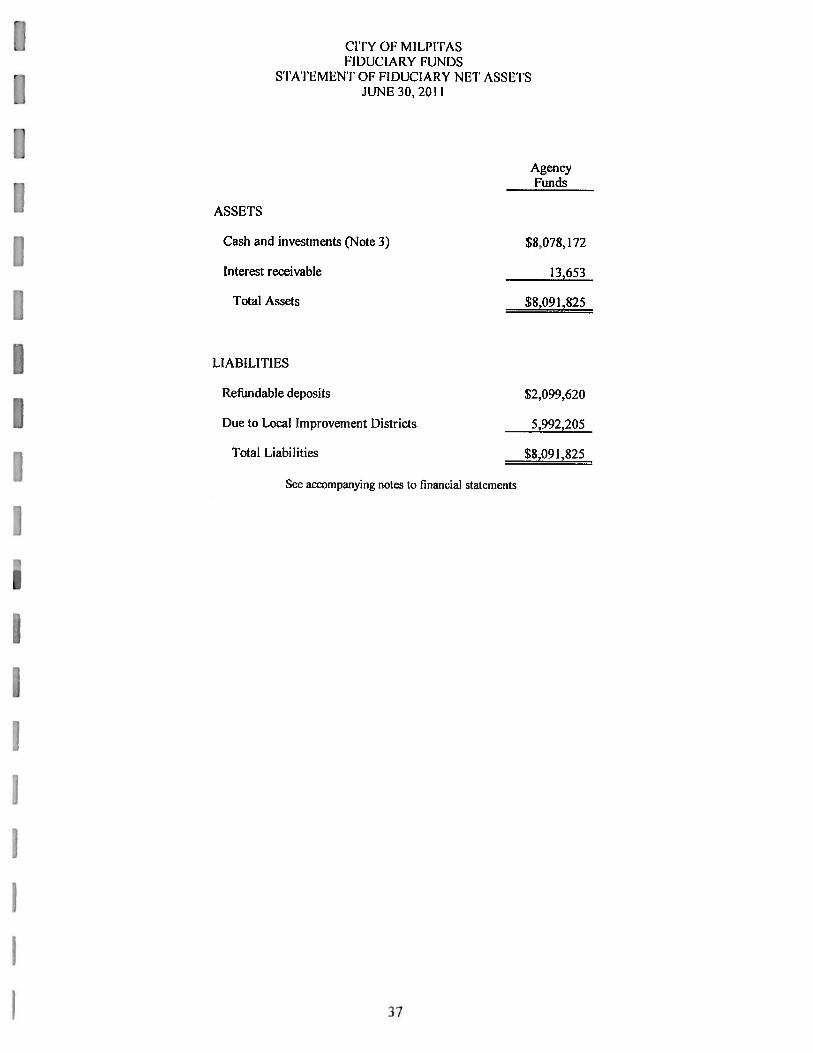
CITY OF MILIi’I’ASFIDUCIARY FUNI)S
S’FATFMENT OF FIDUCIARY NFT ASSLTSJUNE 30, 2011
AgencyFunds
ASSETS
Cash and investments (Note 3) S8.078,172
Interest receivable 13,653
Total Assets $8,091,825
LIABILITIES
Refundable deposits $2,099,620
Due to Local Improvement Districts 5,992,205
Total Liabilities $8,091,825
Sec accompanying notes to financial statements
37
L______3IVVIO?JI
CITY OF MILPITASNotes to Basic Financial Statements
[)TE1 — SUMMARY OF SIGNIFICANT ACCOUNTING POLICIES
The City of Milpitas was incorporated as a general law city on Januaty 26, 1954. The City operates under theCouncil-Manager form of government and provides the following services: public safety, police, fire andbudding inspection; parks and streets; water; sanitation; recreation services; planning and zoning; generaladministration services, and redevelopment.
The financial statements and accounting policies of the City conform with generally accepted accountingprinciples applicable to governments. The Governmental Accounting Standards Board (GASB) is theaccepted standard-setting body for governmental accounting and financial reporting principles. Significantaccounting policies are summarized below:
A. Reporting Entity
The accompanying basic financial statements present the financial activity of the City, which is the primarygovernment presented, along with the financial activities of its component units, which are entities for whichthe City is financially accountable. Although they are separate legal entities, blended component units are insubstance part of the City’s operations and are reported as an integral part of the City’s financial statements.Each discretely presented component unit, on the other hand, is reported in a separate column in the basicfinancial statements to emphasize it is legally separate from the government.
PRIMARY GOVERNMENT
The financial statements of the primary government of the City of Milpitas include the activities of the City aswell as the Milpitas Redevelopment Agency and the Milpitas Public Financing Authority, both of which arecontrolled by and dependent on the City. While these are separate legal entities, their financial activities areintegral to those of the City. Their financial activities have been aggregated and merged (termed “blended”)with those of the primary government of the City in the accompanying financial statements.
Blended Component Units
The Milpilas Redevelopment Agency is a separate government entity whose purpose is to prepare andimplement plans for improvement, rehabilitation, and development of certain areas within the City. TheAgency is controlled by the City and has the same governing board as the City, which also perfhrms allaccounting and administrative functions for the Agency. The financial activities of the Agency are includedin the Housing Reserve Special Revenue Fund and the Redevelopment Project Capital Projects.
The Milpitas Public Financing Authority is a separate government entity whose purpose is to assist with thefinancing or refinancing of certain public capital improvements within the City. ‘The Authority has the powerto purchase bonds issued by any local agency at public or negotiated sale and may sell such bonds to public orprivate purchasers at public or negotiated sale. The Authority is controlled by the City and has the samegoverning body as the City, which also perf’ornis all accounting and administrative functions for the Authority.The financial activities of the Authority are included in the Sewer Utility Enterprise Fund.
39

CITY OF MILPITASNotes to Basic Financial Statements
[irE 1 - SUMMARY OF SIGNIFICANT ACCOUNTING POLICIES
The Milpitas Economic Development Corporation, formed in February 2011, is a California nonprofit public
benefit Corporation formed by the City and the Redevelopment Agency under the laws of the State of
California. The Corporation was organized for the purpose of encouraging and facilitating the City’s
economic development, affordable housing and other community programs. The Corporation is governed by
a board of directors consisting of the members of the City Council. Under an operating agreement with the
Redevelopment Agency, the Corporation receives funding from the Agency and will use the funds for
redevelopment purposes consistent with the California Community Redevelopment Law, Health and Safety
Code Section 33000 and to implement and carry out the Redevelopment Plans. The Corporation also
entered into a Service Agreement with the City under which the City will perform the necessary services on
an independent contractor basis to eliminate blight, provide affordable housing, improve the public realm,
facilitate public and private developments, stimulate economic development, and create jobs. The
Corporation is controlled by the City and has the same governing body as the City, which also performs all
accounting and administrative functions for the Corporation. The financial activities of the Corporation are
included in the Economic Development Corporation Special Revenue Fund.
The City of Milpitas Housing Authority, formed in February 2011, is a separate government entity whose
purpose is to assist with the housing for the City’s low and moderate income residents. The I-lousing
Authority is controlled by the City and has the same governing body as the City, which also performs all
accounting and administrative functions for the Housing Authority. The Housing Authority did not
undertake any transactions during fiscal year 2011.
Financial statements for the Milpitas Redevelopment Agency and the Milpitas Economic Development
Corporation may be obtained from the City of Milpitas located at 455 East Calaveras Blvd., Milpilas, CA
95035 or www.ci.rnilpitas.ca.gov/governrnent/finance. Separate financial statements are not issued for the
Public Financing Authority or the City of Milpitas 1—lousing Authority.
Discretely Presented Component Unit
Terrace Gardens, Inc. is a non-profit public benefit corporation organized in September 1986 for the purpose
of developing and managing the operations of a residential complex known as Terrace Gardens, which is
located in the City of Milpitas and is dedicated to the needs of elderly persons. The Milpitas Redevelopment
Agency funded the construction of Terrace Gardens. City Council can appoint a voting majority of the
governing board and approves the annual budget. The City Council exercises control over the Board of
Terrace Gardens. Therefore, the financial activities of Terrace Gardens, Inc. as of and for the year ended
December 31, are discretely presented in the Terrace Gardens Inc. Component Unit column of the Statement
of Net Assets and the Statement of Activities.
Financial statements for Terrace Gardens, inc. may be obtained from Terrace Gardens, Inc., 186 BeresFord
Court, Milpitas, CA 95035.
B. Basis ofPresentat/on
The City’s Basic Financial Slatements are prepaied in conformity with accounting principles generally
accepted in the United States of America. The Government Accounting Standards Board is the
acknowledged standard setting body for establishing accounting and financial reporting standards followed
by governmental entities in the United States of America.
These Standards require that the financial statements described below be presented.
40

CITY OF MILPITASNotes to Basic Financial Statements
NOTE I- SUMMARY OF SIGNIFICANT ACCOUNTING POLICIES (Continued) IGoverninent—ivide Statements: The Statement of Net Assets and the Statement of Activities displayinformation about the primary government, the City and its blended and discretely presented componentunits. These statements include the financial activities of the overall City government, except for fiduciaryactivities. Eliminations have been made to minimize the double counting of internal activities. Thesestatements distingti ish between the governmental and business-type activities of the City. Governmentalactivities generally are financed through taxes, intergovernmental revenues, and other nonexchangetransactions. Business-type activities are financed in whole or in part by fees charged to external parties.
The Statement of Activities presents a comparison between direct expenses and program revenues for eachsegment of the business-type activities of the City and for each function of the City’s governmentalactivities. Direct expenses are those that are specifically associated with a program or function and,therefore, are clearly identifiable to a particular function. Program revenues include (a) charges paid by therecipients of goods or services offered by the programs, (b) grants and contributions that are restricted tomeeting the operational needs of a particular program and (c) fees, grants and contributions that arerestricted to financing the acquisition or construction of capital assets. Revenues that are not classified asprogram revenues, including franchise fees that are based on gross receipts and all taxes. are presented asgeneral revenues.
Fund Financial Statements: The •fund financial statements provide information about the City’s funds,including fiduciary funds and blended component units. Separate statements for each fund category—-governmental, proprietary and fiduciary—are presented. The emphasis of Fund financial statements is onmajor individual governmental and enterprise funds, each of which is displayed in a separate column. Allremaining governmental and enterprise funds are aggregated and reported as nonmajor funds.
Proprietary fund operating revenues and expenses, such as charges for services and the related costs, resultfrom exchange transactions associated with the principal activity of the fund. Exchange transactions arethose in which each party receives and gives up essentially equal values. Nonoperating revenues andexpenses, such as subsidies, investment earnings and any related costs, result from nonexchangetransactions or ancillary activities.
C. Major Funds
Major funds are defined as funds that have either assets, liabilities, revenues or expenditures/expensesequal to ten percent of their fund-type total and five percent of the grand total. The General Fund is alwaysa major fund. The City may also select other funds it believes should be presented as major funds.
The City reported the following major governmental funds in the accompanying financial statements:
General Fund - The General Fund is the general operating fund of the City. It is used to account for allfinancial resources except those required to he accounted for in another fund. The major revenue sources for
this Fund are sales taxes, property taxes, unrestricted revenues from the State, fines and forfeitures andinterest income. Expenditures are incurred for public safety, most street work and the other services describedabove.
Fconomic I)evelopment Corporation Fund — Established to account for the activities of the MilpitasEconomic Development Corporation established to provide physical, economic and educational development,redevelopment and revitalization efforts within the City.
41

CITY OF MILPITAS
Notes to Basic Financial Statements
[NOT MARY OF SIGNIFICANT ACCOUNTING POLICWS (Continued) IHousing Reserve Fund — Established by the Redevelopment Agency of the City of Milpilas to account fir
tax allocations set aside for the purpose of increasing or improving the City’s supply of low or moderate —
income housing.
Redevelopment Project Fund — Established to account for the financing and construction activities in the
redevelopment project areas.
Street Improvement Fund — Established to account for the construction and maintenance of the street
system in Milpitas. Financing is provided through State and Federal grants.
Transit Area Impact Fee Fund Established to account for the capital projects in the transit area. A special
transit area impact fee is imposed on developments to provide financing.
The City reported all its enterprise funds as major funds in the accompanying financial statements:
Water Utility Fund — Accounts fhr the provision of water services to residents and businesses of the City.
All activities necessary to provide such services are accounted for in this fund, including, but not limited to,
administration, operations, capital improvements, maintenance, billing and collection.
Recycled Water Utility Fund - Accounts for the provision of recycled water services to businesses within
the City. All activities necessary to provide such services are accounted for in this find, including, hut not
limited to, administration, operations, capital improvements, maintenance, billing and collection.
Sewer utility Fund — Accounts for the provision of sewer services to residents and businesses of the City.
All activities necessary to provide such services are accounted for in this fund, including, but not limited to,
administration. operations, capital improvements, maintenance, financing, and billing and collection.
The City also reports the following fund types:
Internal Service Fund — The Equipment Management Internal Service Fund is used to finance and account
for the replacement of equipment used by City departments and the maintenance of the online permit
development system on a cost reimbursement basis.
Fiduciary Funds — Agency funds are used to account for assets held by the City as an agent for negotiated
employee benefits, the Senior Advisory Commission, and Local Improvement Districts. The financial
activities of these funds are excluded from the City-wide financial statements, but are presented in separate
Fiduciary Fund financial statements.
D. Basis of.4ccounting
The government-wide, proprietary, and fiduciary fund financial statements are reported using the economic
resources measurement locus and the lull accrual basis olaccounting. Revenues are recorded when earned
and expenses are recorded at the time liabilities are incurred, regardless of when the related cash flows take
place. Agency funds are custodial in nature (assets equal liabilities) and do not involve measurement ol
results of operations.
42

CITY OF MILPITASNotes to Basic Financial Statements
NOTE I - SUMMARY Oil’ SIGNIFICANT ACCOUNTING POLICIES (Continued) INon-exchange transactions, in which the City gives or receives value without directly receiving or givingequal value in exchange, include property taxes, grants, entitlements, and donations. On the accrual basis,revenue from taxes is recognized in the fiscal year for which the taxes are levied or assessed. Revenuefrom grants, entitlements, and donations is recognized in the fiscal year in which all eligibilityrequirements have been satisfied.
Other revenues susceptible to accrual are sales taxes and interest revenue. Forfeitures, licenses, permits andmiscellaneous revenue are not susceptible to accrual because they are not measurable until received in cash.Grant funding received in advance of the related expenditure is accounted for as deferred revenue.
Grant revenues are recognized in the fiscal year in which all eligibility requirements are met. Under theterms of grant agreements, the City may fund certain programs with a combination of cost-reimbursementgrants, categorical block grants, and general revenues. Thus, both restricted and unrestricted net assets maybe available to finance program expenditures. The City’s policy is to first apply restricted grant resourcesto such programs, followed by unrestricted resources if necessary.
Governmental funds are reported using the current financial resources measurement focus and theinodfled accrual basis of accounting. Under this method, revenues are recognized when measurable andavailable. The City considers all revenues reported in the governmental funds to be available if therevenues are collected within forty-five days after year-end. Bxpenditures are recorded when the relatedfund liability is incurred, except for principal and interest on general long-term debt, claims and judgments,and accumulated unpaid vacation, sick pay and other employee benefit amounts, which are recognized asexpenditures to the extent they have matured. General capital asset acquisitions are reported asexpenditures in governmental funds. Proceeds of general long-term debt and acquisitions under capitalleases are reported as otherfinancing sources.
The City follows Statements and Interpretations of the Financial Accounting Standards Board and itspredecessors issued on or before November 30, 1989, in accounting for its business-type activities, unlessthose pronouncements conflict with Government Accounting Standards Board pronouncements.
E. Prepaids, Materials, Supplies and Deposits
Certain payments to vendors reflect costs applicable to future fiscal years and are recorded as prepaid itemsin both government-wide and fund financial statements.
Materials and supplies are valued at cost on a first-in first-out basis. Supplies in the enterprise and internalfunds consist principally of materials and supplies for utility and internal operations. Materials and suppliesof the governmental funds consist of expendable supplies and materials held for consumption. The cost isrecOr(led as an expense or expenditure in the funds at the time individual inventory items are consumed.
Prepaids, materials, supplies and deposits in governmental funds are equally offset by nonspendable fundbalance which indicates that they do not constitute available spendable resources even though they are acomponent of net current assets.
43
r CITY OF MILPITASNotes to Basic Financial Statements
NOTE I - SUMMARY OF SIGNIFICANT ACCOUNTING POLICIES (Continued)
F Properly Tax
Santa Clara County assesses properties and bills, collects, and distributes property taxes to the City. The
County remits the entire amount levied and handles all delinquencies, retaining interest and penalties. Secured
and unsecured property taxes are levied on January 1.
Secured property tax is due in two installments, on November 1 and March 1, and becomes a lien on those
dates. It becomes delinquent on December 10 and April 10, respectively. Unsecured property tax is due onJuly 1, and becomes delinquent on August 31. Collection of delinquent accounts is the responsibility of the
County, which retains all penalties.
The term “unsecured” refers to taxes on personal property other than real estate, land and buildings. ‘l’hese
taxes are secured by liens on the property being taxed. Property tax revenues are recognized by the City in the
fiscal year they are assessed, provided they become available as defined above.
G. Revenue Recognitionfor Water Utility, Recycled Water Utility and Sewer Utility
Revenues are recognized based on cycle billings rendered to customers. Revenues for services provided but
not billed at the end of a fiscal period are not mateiial and are not accrued.
H. Use ofEstimates
The preparation of financial statements in conformity with generally accepted accounting principles (GAAP)
requires management to make estimates and assumptions that affect the reported amounts o assets and
liabilities and disclosure of contingent assets and liabilities at the date of the financial statements and the
reported amounts of revenues and expenses during the reporting period. Actual results could differ from those
estimates.
New Fund and Fund Recategorization
The Economic Development Corporation Special Revenue Fund was established to account for the activities
of the Milpitas Economic Development Corporation.
The Public Art Fund was recategorized from a special revenue fund to a capital projects fund.
NOTE 2- BUDGETS AND BUDGETARY ACCOUNTING IA. Budgets and Budgetary Accounting
The City adopts an annual operating budget on or before June 30 of the previous fiscal year. The operating
budget takes the form of a one year financial plan which is adopted in its entirety by the City Council by
resolution. Because Milpitas is a general law city, it is not subject to a budgetary process prescribed by statute
or charter.
L
I
44
CITY OF I’1ILPITASNotes to Basic Financial Statements
[jOT1 2- BUDGETS AND BUDGETARY ACCOUNTING (Continued) IThe operating budget is subject to supplemental appropriations throughout its term in order to provideflexibility to meet changing needs and conditions. The City Manager may approve supplementalappropriations in the General Fund providing the total increase does not exceed 1% of the original totalGeneral Fund budget subject to the following. All additional appropriations that require the use of reservesmust be approved by City Council. Expenditures cannot exceed the appropriated budget at the departmentlevel without City Council approval.
The City Manager is authorized to amend appropriations within the various departments and projects within afund, provided that the amount of the amended appropriation is $20,000 or less. Interfund transfers ortransfers of an appropriation amount within a fund in which any single instance exceed $20,000 require priorapproval of the City Council.
Budgeted amounts are as originally adopted, or as amended by the City Council. Individual amendments werenot material in relation to the original appropriations which were amended.
B. Adjustments to GAAP Basisfrom Budgetary Basis
City budgets are adopted on a basis consistent with generally accepted accounting principles (GAAP) exceptthat encumbrances are considered budgetary expenditures in the year of the commitment to purchase, andcapital projects expenditures are budgeted on a project length basis rather than a fiscal year. The effects ofthese differences are shown as encumbrance adjustments, expenditures capitalized for GAAP purposes andcapital outlay in the budget and actual statements. The Park Improvement, General Government Project,Storm Drain Development and Transit Area Impact Fee Capital Projects Funds are budgeted on a projectlength basis and therefore are not comparable on an annual basis. The by laws of the Economic DevelopmentCorporation do not require the adoption of an annual budget.
C. Expenditures in Excess ofBudget
The Housing and Community Development Special Revenue Fund had planning and neighborhood servicesexpenditures in excess of budget in the amount of $9,400 and the Redevelopment Project Capital ProjectsFund had supplemental educational revenue augmentation fund expenditures in excess of budget in theamount of $65,954. Sufficient resources were available within the fund to finance these expenditures.
NOTE 3- CASH AND INVESTMENTS IThe City pools cash from all sources and all funds except Cash and Investments held by Trustees and TerraceGardens, Inc. so that ii can be invested at the maximum yield consistent with safety and liquidity, whileindividual funds can make expenditures at any time.
A. Policies
The City invests in individual investments and in investment pools. Individual investments are evidenced byspecific identifiable securities instruments, or by an electronic entry registering the owner in the records of theinstitution issuing the security, called the book ent,y system. In order to increase security, the City employsthe Trust Department ofa hank as the custodian of certain City managed investments, regardless oitheir form.
45
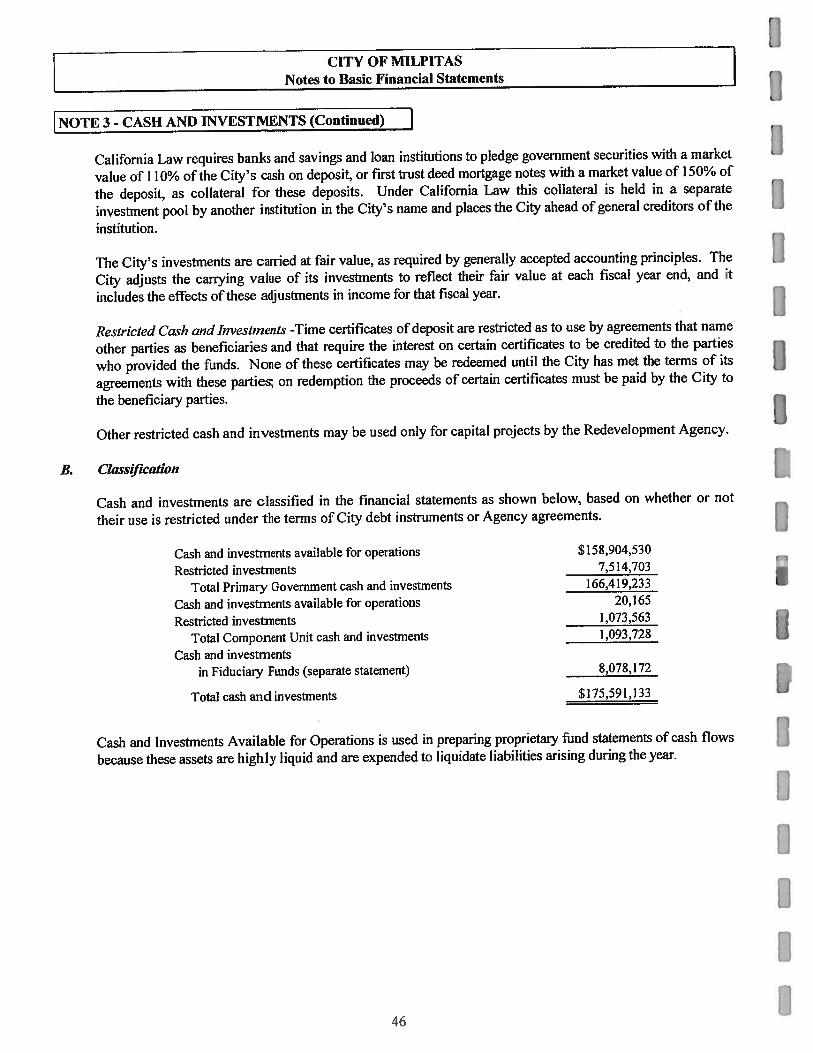
CITY OF MILPITAS
Notes to Basic Financial Statements
NOTE 3- CASH AND 1NVESTMNTS (Continued) 1California Law requires banks and savings and loan institutions to pledge government securities with a market
value of 110% of the City’s cash on deposit, or first trust deed mortgage notes with a market value of 150% of
the deposit, as collateral for these deposits. Under California Law this collateral is held iii a separate
investment pool by another institution in the City’s name and places the City ahead of general creditors of the
institutioii.
The City’s investments are carried at fair value, as required by generally accepted accounting principles. The
City adjusts the carrying value of its investments to reflect their fair value at each fiscal year end, and it
includes the effects of these adjustments in income for that fiscal year.
Restricted cash and Investments -Time certificates of deposit are restricted as to use by agreements that name
other parties as beneficiaries and that require the interest on certain certificates to be credited to the parties
who provided the funds. None of these certificates may be redeemed until the City has met the terms of its
agreements with these parties; on redemption the proceeds of certain certificates must be paid by the City to
the beneficiary parties.
Other restricted cash and investments may be used only for capital projects by the Redevelopment Agency.
B. classification
Cash and investments are classified in the financial statements as shown below, based on whether or not
their use is restricted under the terms of City debt instruments or Agency agreements. 1Cash and investments available for operations S 158,904,530
Restricted investnients 7,514,703
Total Primary Government cash and investments 166,419,233
Cash and investments available for operations 20,165
Restricted investnients I ,073,563
Total Component unit cash and investments 1,093,728
Cash and investmentsin Fiduciary Funds (separate statement) 8,078,172
Total cash and investments $175,591,133
Cash and Investments Available for Operations is used in preparing proprietary fund statements of cash flows
because these assets are highly liquid and are expended to liquidate liabilities arising during the year.
46
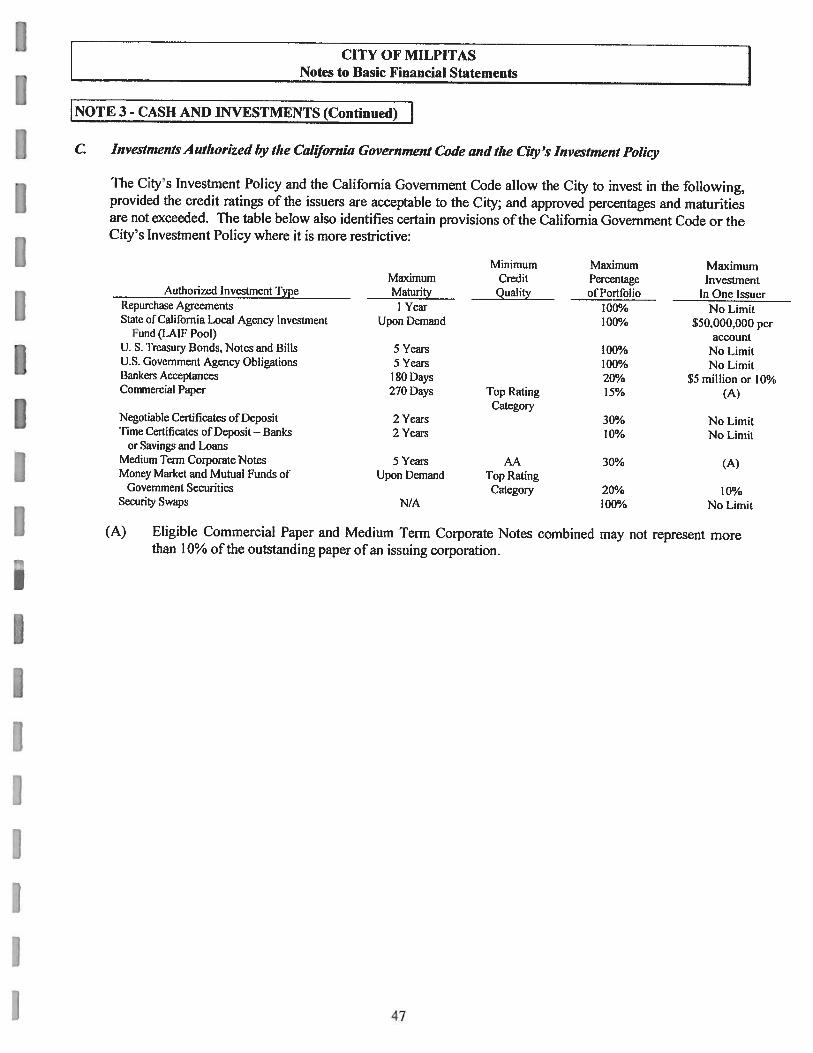
CITY OF MILPITASNotes to Basic Financial Statements
NOTI 3- CASH AND INVESTMENTS (Continued) IC Investments Authorized by the california Government Code and the city’s Investment Policy
The City’s Investment Policy and the California Government Code allow the City to invest in the following,provided the credit ratings of the issuers are acceptable to the City; and approved percentages and maturitiesare not exceeded. The table below also identifies certain provisions of the California Government Code or theCity’s Investment Policy where it is more restrictive:
Minimum Maximum MaximumMaximum Credit Percentage Investment
Authorized Investment Type _ritv
________________
of Portfolio In One IssuerRepurchase Agreements 1 Year 100% No LimitState of California Local Agency Investment Upon Demand 100% $50,000,000 per
Fund (1.A11 Pool) accountU. S. Treasury Bonds. Notes and Bills 5 Years 100% No 1.imilU.S. Government Agency Obligations 5 Years 100% No LimitBankers Acceptances 180 Days 20% $5 million or 10%Commercial Paper 270 Days i’op Rating 15% (A)
CategoryNegotiable Certificates of Deposit 2 Years 30% No I.imitTime Certificates of Deposit Banks 2 Years 10% No Limit
or Savings and LoansMedium Term Corporate Notes 5 Years AA 30% (A)Money Market and Mutual Funds of Upon Demand Top Rating
Government Securities Category 20% 10%Security Swaps N/A 100% No I ,irnit
(A) Eligible Commercial Paper and Medium Term Corporate Notes combined may not represent morethan 10% of the outstanding paper of au issuing corporation.
47
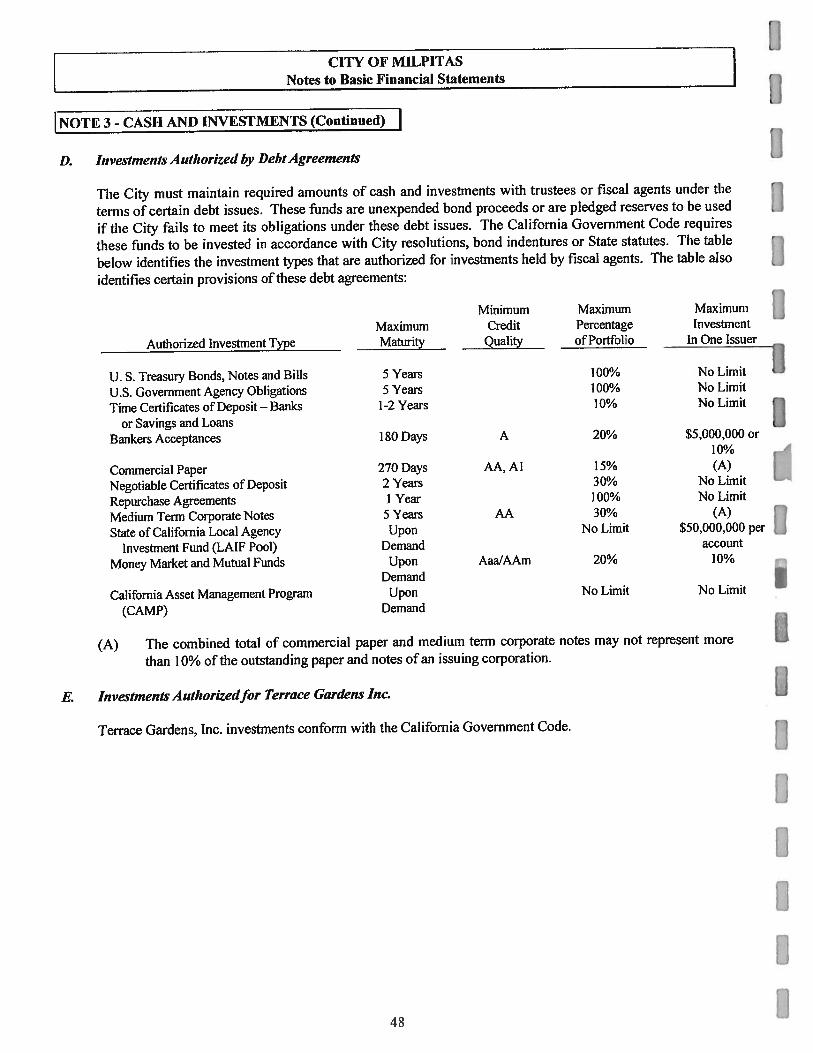
CITY OF MILPITASNotes to Basic Financial Statements
NOTE 3 - CASH ANI) INVESTMENTS (Continued) 1D. I,zvcs’tme,,Is A itihorized by Debt Agreements
‘[‘lie City must maintain required amounts of cash and investments with trustees or fiscal agents under the
terms of certain debt issues. These funds are unexpended bond proceeds or are pledged reserves to be used
if the City fails to meet its obligations under these debt issues. The California Government Code requires
these funds to be invested in accordance with City resolutions, bond indentures or State statutes. The table
below identifies the investment types that are authorized for investments held by fiscal agents. The table also
identifies certain provisions of these debt agreements:
Minimum Maximum Maximum
Maximum Credit Percentage Investment
Authorized Investment Type Maturity Quality of PortFolio - In One Issuer
U. S. Treasury Bonds, Notes and Bills 5 Years 100% No Limit
U.S. Government Agency Obligations 5 Years 100% No Limit
Time Certificates of Deposit — l3anks 1-2 Years 10% No Limit
or Savings and LoansBankers Acceptances 180 Days A 20% S5,000,000 or
10%
Commercial Paper 270 Days AA. Al 15% (A)
Negotiable Certificates of Deposit 2 Years 30% No Limit
Repurchase Agreements 1 Year 100% No Limit
Medium Terni Corporate Notes 5 Years AA 30% (A)
State of California Local Agency Upon No Limit $50,000,000 per
Investment Fund (LAIF Pool) Demand account
Money Market and Mutual Funds Upon AaaJAArn 20% 10%
Demand ICalifornia Asset Management Program Upon No Limit No Limit
(CAMP) Demand
(A) The combined total of commercial paper and medium term corporate notes may not represent more
than 10% of the outstanding paper and notes of an issuing corporation.
E. Investments Autlwrizedfor Terrace Gardens Inc
Terrace Gardens, Inc. investments conform with the California Government Code.
48
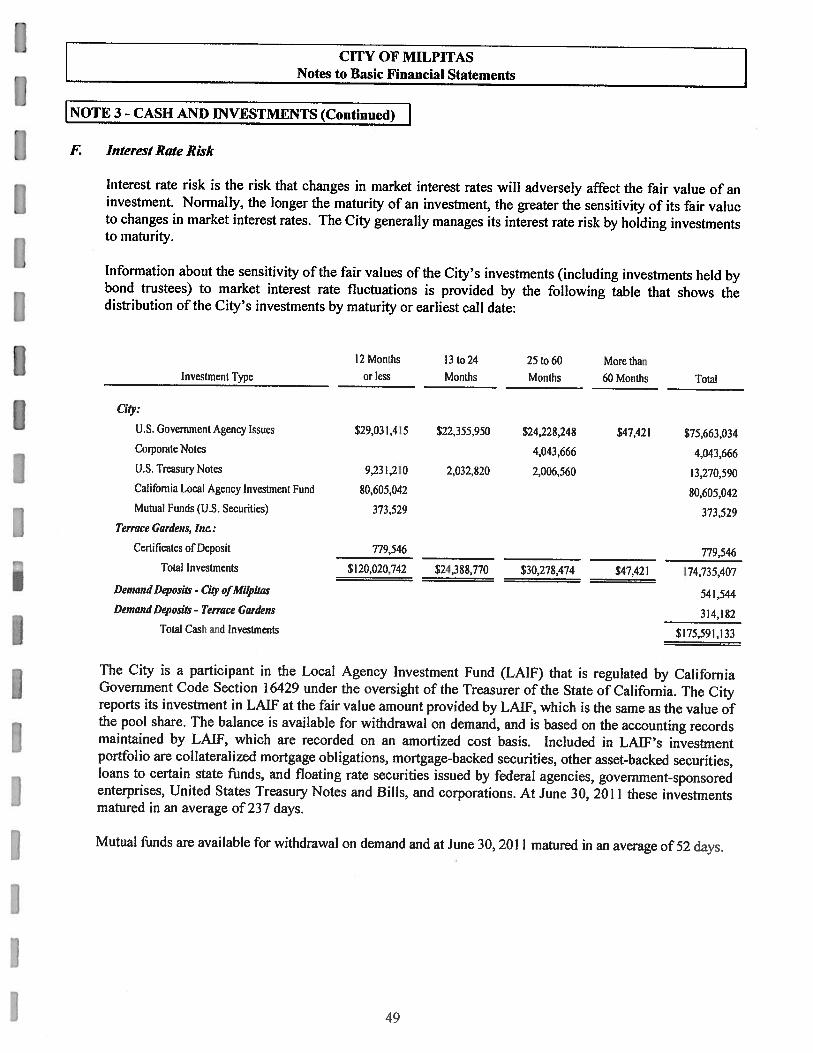
r CITY OF MILPITAS—-
L Notes to Basic Financial Statements
[NoTE 3- CASH AND I1NVESTMENTS (Continued)
F. Interest Rate Risk
Interest rate risk is the risk that changes in market interest rates will adversely affect the fair value of aninvestment. Normally, the longer the maturity of an investment, the greater the sensitivity of its fair valueto changes in market interest rates. The City generally manages its interest rate risk by holding investmentsto maturity.
Information about the sensitivity of the fair values of the City’s investments (including investments held bybond trustees) to market interest rate fluctuations is provided by the following table that shows thedistribution of the City’s investments by maturity or earliest call date:
12 Months 13 to 24 25 to 60 More thanInvestment Type or less Months Months 60 Months Total
City:
U.S. Government Agency Issues $29,031,415 522,355.950 $24,228,248 $47,421 $75,663,034Corporate Notes 4,043,666 4,043,666U.S. Treasury Notes 9.231,210 2.032820 2,006,560 13,270,590California 1,oca Agency Investment Fund 80.605.042 80,605,042Mutual Funds (US. Securities) 373,529 373,529
Terrace Gardens, Inc.:
Certificates of’ Deposit 779,546
______________ _______________ _____________
779,546Total Investments $120020742 $24,388,770 $30,278,474 $47.42 I 174,735,407
Demand Deposits - CiO’ ofMilpitas 541,544Demand Deposits - Terrace Gardens 314,182
Total Cash and Investments $175,591,133
The City is a participant in the Local Agency Investment Fund (LAIF) that is regulated by CaliforniaGovernment Code Section 16429 under the oversight of the Treasurer of the State of California. The Cityreports its investment in LAW at the fair value amount provided by LAW, which is the same as the value ofthe pool share. The balance is available for withdrawal on demand, and is based on the accounting recordsmaintained by LAIF, which are recorded on an amortized cost basis. Included in LAIF’s investmentportfolio are collateralized mortgage obligations, mortgage-backed securities, other asset-backed securities,loans to certain state funds, and floating rate securities issued by federal agencies, government-sponsoredenterprises. United States Treasury Notes and Bills, and corporations. At June 30, 2011 these investmentsmatured in an average of 237 days.
Mutual funds are available for withdrawal on demand and at June 30, 2011 matured in an average of 52 days.
49
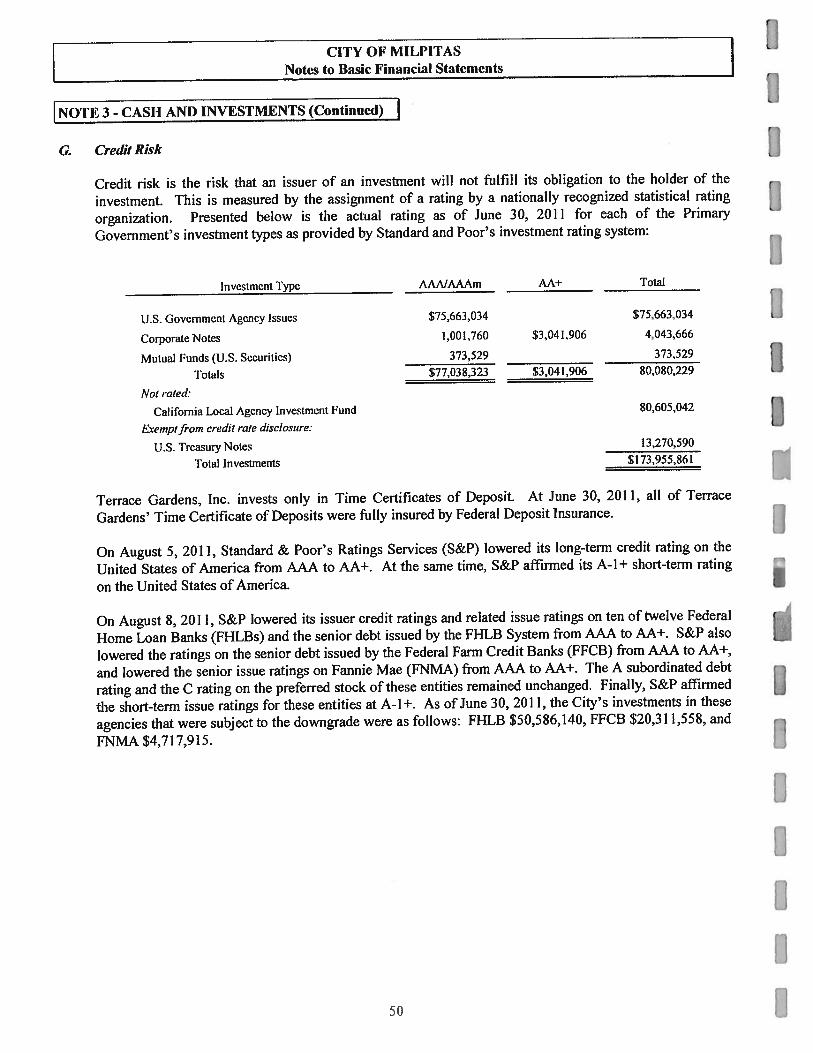
3 - CASH AND INV1STMLNTS (Continued) I
G. Credit Risk
Credit risk is the risk that an issuer of an investment will not fulfill its obligation to the holder of the
investment. ‘Ehis is measured by the assignment of a rating by a nationally recognized statistical rating
organization. Presented below is the actual rating as of June 30, 2011 for each of the Primary
Government’s investment types as provided by Standard and Poor’s investment rating system:
13.270,590
$173.955.861 ITerrace Gardens, Inc. invests only in Time Certificates of Deposit. At June 30, 2011, all of Terrace
Gardens’ Time Certificate of Deposits were fully insured by Federal Deposit Insurance.
On August 5, 2011, Standard & Poor’s Ratings Services (S&P) lowered its long-term credit rating on the
United States of America from AAA to AA+. At the same time, S&P affirmed its A-I + short-term rating
on the United States of America.
On August 8, 2011, S&P lowered its issuer credit ratings and related issue ratings on ten of twelve Federal
Home Loan Banks (FHLBs) and the senior debt issued by the FHLB System from AAA to AA+. S&P also
lowered the ratings on the senior debt issued by the Federal Farni Credit Banks (FFCB) from AAA to AA±,
and lowered the senior issue ratings on Fannie Mae (FNMA) from AAA to AA+. The A subordinated debt
rating and the C rating on the preferred stock of these entities remained unchanged. Finally, S&P affirmed
the short-term issue ratings for these entities at A-l+. As of June 30, 201 1, the City’s investments in these
agencies that were subject to the downgrade were as follows: Fl-ILB $50,586,140, FFCB $20,311,558, and
FNMA $4,717,915.
CITY OF MIl,I’ITAS
Notes to Basic Financial Statements
[1
Investment Type
U.S. Government Agency Issues
Corporate Notes
Mutual Funds (U.S. Securities)
Totals
Not ivied:
California Local Agency Invesirnent Fund
Etc,np(from credit ra(e dtcc!o,vure:
(IS. Trcasuiy Notes
‘Fotal Investments
AA,VAAAm AM- Total
$75,663,034 $75,663.034
1.001,760 $3,041,906 4,043,666
373.529
______________
373,529
$77,038,323 $3.04 1,906 80,080,229
80,605,042
50

CITY OF MI[YITASNotes to Basic Financial Statements
NOTF 3 - CASh ANI) INVESTMENTS (Continued) 1h’. Signjflcant Ii,i’estmenls
Investments in the securities of any individual issuers, other than U. S. Treasury securities, mutual fundsand the California Local Agency Investment Fund, that represent 5% or more of total Entity-wideinvestments are as follows at June 30, 2011:
Investment
Issuer Type Amount
Federal home Loan Bank Federal agency securities $50,586,140Federal Farm Credit Bank Federal agency securities 20.311,558
Investments in the securities of any individual issuers, other than U.S. Treasury securities, mutual fundsand the California Local Agency Investment Fund, that represent 5% or more of Agency Funds were asfollows at Juiie 30, 2011:
Investment
Issuer Type Amount
Federal 1-lome Loan Bank Federal agency securities $1,672,928
51
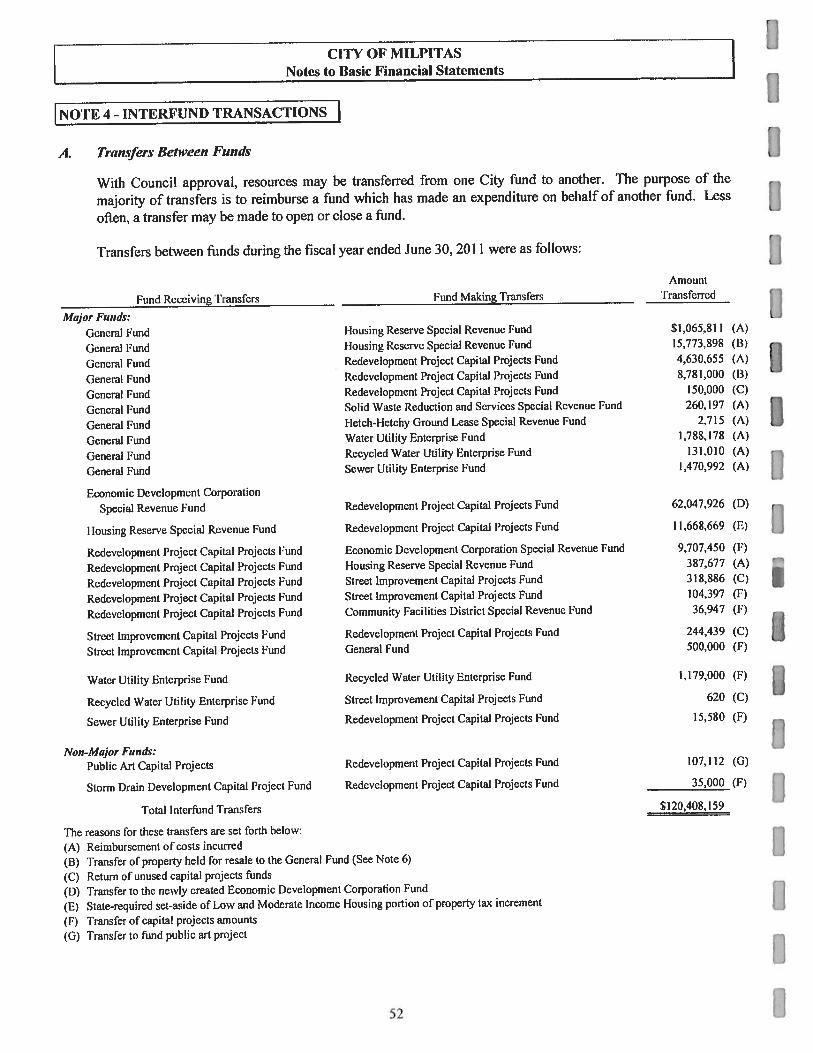
CITY OF MILPITASNotes to Basic Financial Statements
rNoTL 4- lN11(RFUND TRANSACTIONS IA. Transfers Bet,veen Funds
With Council approval, resources may be transferred from one City fund to another. The purpose of the
majority of transfers is to reimburse a fund which has made an expenditure on behalf of another fund. Less
often, a transfer may be made to open or close a fund.
Transfers between funds during the fiscal year ended June 30, 2011 were as follows:
Major Finids:
General Fund
General Fund
General Fund
General Fund
General Fund
General Fund
Genera) Fund
General Fund
General Fund
General Fund
Fund Making Transfers
housing Reserve Special Revenue Fund
I lousing Reserve Special Revenue Fund
Redevelopment Project Capital Projects Fund
Redevelopment Project Capital Projects Fund
Redevelopment Project Capital Projects Fund
Solid Waste Reduction and Services Special Revenue Fund
I )etch-1 )etchy Ground Lease Special Revenue Fund
Water Utility Enterprise Fund
Recycled Waler lildily Enterprise Fund
Sewer Utility Enterprise Fund
Redevelopment Project Capital Projects Fund
Redevelopment Project Capita; Projects Fund
Economic Development Corporation Special Revenue Fund
lousing Reserve Special Revenue Fund
Street Improvement Capital Projects Fund
Street Improvement Capital Projects Fund
Community Facilities District Special Revenue Fund
Redevelopment Project Capital Projects Fund
General Fund
AmountTransferred
$1,065,811 (A)
15.773.898 (B)4,630.655 (A)
5.781.000 (B)150,000 (C)
260,197 (A)
2.7)5 (A)
1.788.178 (A)
131,010 (A)
1,470,992 (A)
62047.926 (D)
11,668.669 (Ii)
9,707,450 (F)
387,677 (A)
318.886 (C)
104,397 (F)
36,947 (F)
244.439 (C)
500.000 (F)
Water Utility I nterprise Fund
Recycled Water Utility Enterprise Fund
Sewer Etility Enterprise Fund
Recycled Water Utility Enterprise Fund
Street Improvement Capital Projects Fund
Redevelopment Project Capital Projects Fund
1.179.000 (F)
620 (C)
15,580 (F)
Non-Major Funds:Public Art Capital Projects Redevelopment Project Capital Projects Fund
Storm Drain Development Capita] Project Fund Redevelopment Project Capital Projects Fund
The reasons for these transfers are set forth below:
(A) Reimbursement of costs incurred
(13) Transfer of property held tbr resale to the Genera! Fund (See \ote 6)
(C) Retum of unused capital projects funds
(0) Transfer to the newly created Economic :)eveiopmcn: Corporatior Fund
(F) State-required set-aside of Low and Moderate Income I-lousing port jo: of property tax increment
(F) Transfer of capital projects amounts
(G) Transfer to fund public art project
Fund Receiving I’ransfcrs
Economic Development Corporation
Special Revenue Fund
I lousing Reserve Special Revenue Fund
Redevelopment Project Capital Projects Fund
Redevelopment Project Capita] Projects Fund
Redevelopment Project Capital Projects Fund
Redevelopment Project Capital Projects Fund
Redevelopment Project Capita! Projects Fund
Street Improvement Capital Projects lund
Street Improvement Capital Projects Fund
Total Interfund Transfers
107.112 (G)
35,000 (F)
SI 20408. 159
UII152

r CITY OF MILPITASNotes to Basic Financial Statements
[NOTE 4- INTERFUND TRANSACTIONS (Continued) IB. Long-Terni InterfundAdvances
On September 7, 2004, the Agency entered into an Agreement with the City for the purchase of eightparcels of land which are located in the Project Area. However, the terms of the purchase were notfinalized until August 21, 2007 under the First Amendment to Agreement of Purchase and Sale. Under theterms of the Amended Agreement, the purchase price of the parcels is $20,455,191. The advance from theGeneral Fund to the Redevelopment Project Capital Projects Fund is due on September 7, 2044 and bearssimple interest of 10% annually. At June 30, 2011 the balance of the advance including principal andaccrued interest was $23,225,237.
On May 6, 2008, the City approved the purchase of 0.75 million gallons per day wastewater treatmentcapacity at the San Jose/Santa Clara Sanitary District via a purchase from the Cupertino Sanitary District(CuSD). The capacity is for build-out of the Transit Area Specific Plan. Funding for this purchase wasincluded in the Transit Area Development Impact Fee Program. The Transit Area Impact Fee CapitalProjects Fund does not have funding available since fees have not yet been collected. Therefore, theRedevelopment Project Capital Projects Fund advanced $4,549,161 to the Transit Area Impact Fee CapitalProjects Fund to cover the payment to CuSD and $200,000 to cover other associated costs. The advancesare due on April 7, 2029 and bear simple interest of 5% annually. During fiscal year 2011, theRedevelopment Project Capital Projects Fund transferred the advance to the Economic DevelopmentCorporation Special Revenue Fund. At June 30, 2011 the balance of the advance including principal andaccrued interest was $5,230,571.
During fiscal year 2010 the Redevelopment Project Capital Projects Fund advanced $1,330,000 to theTransit Area Development Impact Fee Capital Projects Fund for the preparation costs of the Transit AreaSpecific Plan. The Sewer Utility Enterprise Fund advanced $4,356,000 to the Transit Area DevelopmentImpact Fee Capital Projects Fund for costs associated with the main sewage pump station improvements iiithe Transit Area. The Transit Area Impact Fee Capital Projects Fund does not have funding available sincefees have not yet been collected. The advances are due on April 7, 2029 and bear simple interest of 5%annually. During fiscal year 2011, the Redevelopment Project Capital Projects Fund transferred theadvance to the Economic Development Corporation Special Revenue Fund. At June 30, 2011 the balanceof the Economic Development Corporation Special Revenue Fund advance including principal and accruedinterest was $1,463,000 and the balance of the Sewer Utility Enterprise Fund advance including principaland accrued interest was $4,791,600.
During fiscal year 2011 the Redevelopment Project Capital Projects Fund advanced $2,550,000 to theTransit Area Development Impact Fee Capital Projects Fund for the Light Rail Median LandscapingProject. The advance is due on August 2, 2030 and bear simple interest of 5% annually. During fiscal year2011, the Redevelopment Project Capital Projects Fund transferred the advance to the EconomicDevelopment Corporation Special Revenue Fund. At June 30, 2011 the balance of the advance includingprincipal and accrued interest was $2,665,623.
During fiscal year 2011 the Housing Reserve Special Revenue Fund advanced $6,800,000 and $1,800,000to the Redevelopment Project Capital Projects Fund Ibr the purchase of two land parcels. The $6,800,000advance is due on April 17, 2037, and the $1,800,000 advance is due on February 15, 2031. l3oth advancesbear simple interest of 5% annually. At June 30, 2011 the balance of the advances including principal andaccrued interest was $8.925.177.
53
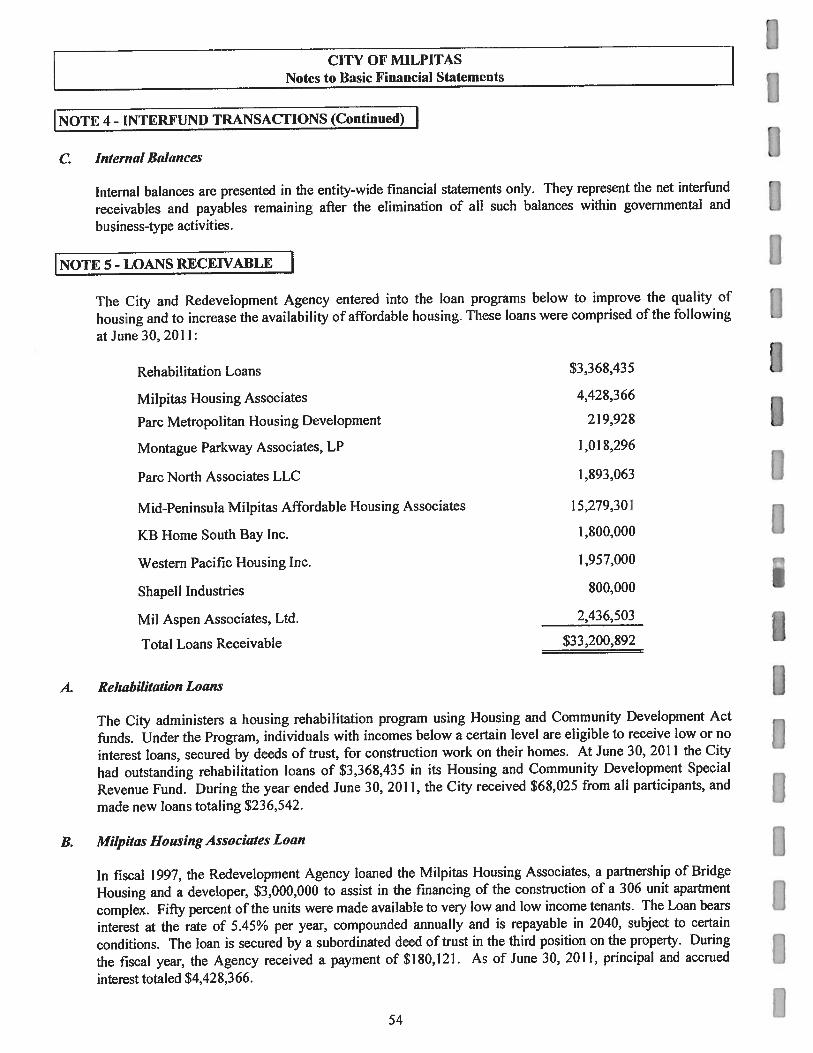
_________________________________
UCITY OF MILPFIAS
Notes to Basic Financial Statenwnts
[NoTE 4- ENTERFUND TRANSACTIONS (Continued)
C liziernal Balances
Internal balances arc presented in the entity—wide financial statements only. They represent the net interfund
receivables and payables remaining after the elimination of all such balances within governmental and
business-type activities.
NOTE 5- LOANS RECEIVABLE IThe City and Redevelopment Agency entered into the loan programs below to improve the quality of
housing and to increase the availability of affordable housing. These loans were comprised of the following
at June 30,2011:
Rehabilitation Loans $3,368,435
Milpitas Housing Associates 4,428,366
Parc Metropolitan Housing Development 219,928
Montague Parkway Associates, LP 1,018,296
Parc North Associates LLC 1,893,063
Mid-Peninsula Milpitas Affordable Flousing Associates I 5279.301
KB Home South Bay Inc. I £00,000
Western Pacific Flousing Inc. 1,957,000
Shapell Industries 800,000
Mu Aspen Associates. Ltd. 2,436,503
Total Loans Receivable $33,200,892
A. Rehabilitation Loans
The City administers a housing rehabilitation program using I-lousing and Community Development Act
funds. Under the Program, individuals with incomes below a certain level are eligible to receive low or no
interest loans, secured by deeds of trust, for construction work on their homes. At June 30, 2011 the City
had outstanding rehabilitation loans of $3,368,435 in its 1-lousing and Community Development Special
Revenue Fund. During the year ended June 30, 2011, the City received $68,025 from all participants, and
made new loans totaling $236,542.
B. Milpitas Housing Associates Loan
In fiscal 1997, the Redevelopment Agency loaned the Milpitas I-lousing Associates: a partnership of Bridge
1-lousing and a developer, $3,000,000 to assist in the financing of the construction of a 306 unit apartment
complex. Fifty percent of the units were made available to very low and low income tenants. The Loan bears
interest at the rate of 5.45% per year, compounded annually and is repayable in 2040, subject to certain
conditions. The loan is secured by a subordinated deed of trust in the third position on the property. During
the fiscal year, the Agency received a payment of $180,121. As of June 30: 2011, principal and accrued
interest totaled $4,428,366.
54 1

[ CITY OF MLLIITAS
L Notes to Basic Financial Statements
[p’H 5- LOANS RECEIVABLE (Continued) IC Parc Metropolitan Housing Dei’e!oprnenl Loans
The Redevelopment Agency provides loans to eligible low-income families for the purchase of townhomeunits at the Parc Metropolitan I-lousing Development. During the fiscal year, the Agency received principalpayments of $7,038 and as of June 30, 2011, there were $219,928 in loans outstanding.
B. Montague Parkvuy Associates, LP
The Redevelopment Agency loaned the Montague Parkway Associates, LP, a California limitedpartnership, $1,193,580 in fiscal 2001 to develop 464 units of rental multi-family housing. Ninety-four ofthe units were made available to low income households. The loan bears interest at the rate of 3.00% peryear, compounded annually. The principal and all accrued interest are due and payable in 2031 For the firstfive years, only interest is due and payable; principal payments commence on the sixth year and continue forthe remainder of the term. The loan is secured by a third deed of trust on the property. Principal of $74,095was paid in fiscal 2011. As of June 30, 201 1, the outstanding balance totaled $1,018,296.
E. Pare North Associates LLC Loan
In September 2003, the Agency entered into an Owner Participation Agreement with Parc North AssociatesLLC for the development of 285 town homes and condominiums. Eighteen of the units were madeavailable to very low income households, six of the units were made available to low income households,and thirty-four units were made available to moderate income households. In exchange. the Agencyprovided a grant of $1,823,480 to the Developer for permits, fees, and infrastructure, along with silent-second loans to eligible low-income families for the purchase of these town homes and condominium.Interest of 5% begins on the 6l month after the recordation of the deeds of trust and continues until theloans are paid in full. During the fiscal year the Agency made new loans totaling $100,000 and as of June30, 2011, there were $1,893,063 of such loans outstanding.
F. Mid-Peninsula Milpitas Affordable Housing Associates
In December 2005, the Agency entered into a Disposition and Development Agreement with Mid PeninsulaMilpitas Affordable Housing Associates for the development of a 103-unit senior housing project withlong-term affordability to extremely low and very low income seniors. Under the terms of the Agreement,the Agency provided a grant of $1 million to the Developer and will provide a development loan up to$14.6 million to the Developer. No interest is accrued on the first $5 million of loan proceeds. Theremaining $9.6 million bears simple interest of 3.00% annually. Repayment of interest and principal ispayable from surplus operating cash subject to certain conditions as defined in the Agreement, and unpaidprincipal and accrued interest is due in December 2062. ‘I-he loan is secured by second deed of trust on theproperty. Construction began in fiscal year 2006. During fiscal year 2011, a payment in the amount of$493,535 was made, interest of $288,000 was accrued, and as oF June 30. 2011, principal and accruedinterest outstanding totaled $15,279,301.
55

___________________________________________________________________________________________________
1’
- CITY 01? MILPITAS -j JNo(es to Basic Financial Statements I
[NOTI 5 LOANS R1Cl(VABLE (Continued)
G. KB home South Ba Inc. Loans flIn Januaiy 2005, the Agency entered into a Disposition and Development Agreement with KB Home South
Bay Inc. for the development of a public park and approximately 700 housing units on the two parcels
(Parcels C and D). In addition, the Agency would provide a total of $4,250,000 of silent-second mortgages
to eighty-five moderate income households on Parcel C, approximately $5,000,000 of subsidies to twenty-
five moderate income households on Parcel D. The silent-second mortgages are not due for 45 years or
upon the sale, renting or leasing of the property. Interest begins on the 37th month after the recordation of
the Deed of Trust and continues until the loans arc paid in full.
Due to the current housing market and stricter lending requirements which have created unforeseen challenges [1in finding qualified buyers for the affordable units, the Agency amended the Agreement in February 2009 to
establish an in-lieu housing payment of $1,702,000 to remove the affordable restrictions on 46 of the 67
remaining unsold affordable units ($37,000 for each unit). This amount will be paid in equal parts to the
Agency and to the County. In addition, the commitment for silent-second mortgages was reduced $2,300,000
to $1,950,000, and the total number of affordable units was reduced from 110 to 64.
As of June 30, 2011, there were $1,800,000 of loans to Parcel C households outstanding. As of June 30. 2011
the Agency had provided subsidies totaling $4,707,542.
II. Western Pacjfic Housing Inc., Loans
In August 2005, the Agency entered into an Owner Participation Agreement with Fairfield Development, LLC
for the development of a 464- unit residential apartment project called Centria, of which 93 units will be deed-
restricted for very low- to moderate- income households. Tn November 2005, the project was purchased by
Western Pacific Housing Inc. and obligations of the Owner Participation Agreement were assigned to Western
Pacific Housing Inc. The Agency will provide a grant of $379,480 for permits, fees, and infrastructure. The IAgency also will provide a total of $770,000 for silent-second down payment assistance loans for the 22 very-
low income units. The loans are not due for 25 years or upon the sale, renting or leasing of the property.
Interest will begin on the 6l month after the recordation of the Deed of Trust and continues until the loans
are paid in full. As of June 30, 2011, there were $760,000 such loans outstanding.
In August 2008 the Owner Participation Agreement was amended to reduce the number of units to be
constructed by Western Pacific Housing Inc. to 137 and provide for the conversion of 7 of the moderate
income units to low income units. In addition, in August 2008 the 327 unconstructed units of the project were
sold to Lyon Milpitas LLC and the Agency entered into a new Owner Participation Agreement with Lyon
Milpitas LLC to complete the construction of the affordable housing units.
In September 2006, the Agency entered into an Owner Participation Agreement with Western Pacific
Housing, Inc. for the development of a 147-unit townhorne project called Paragon that includes nine units
deed-restricted to very low income residents and twenty units deed-restricted to moderate income residents.
The Agency will provide silent-second loans of $133,333 to each of the very low income households.
interest will begin on the 61st month after the recordation of the Deed of Trust and continues until the loans
are paid in full. As of June 30, 2011, there were $1,197,000 of silent second loans outstanding.
II
56 1

CIFY OF MILPITASNotes to Basic Financial Statements
rNoTl 5.. LOANS RECEiVABLE (Continued)
Shape!! Industries
In June 2004, the Agency entered into an Agreement with Shapell Industries of Northern California for thedevelopment of a 65-unit townhome development, which will include twenty deed-restricted affordablehousing units for very low- and moderate-income units. In August 2005 the Agency entered into an OwnerParticipation Agreement with the Developer that, in exchange for the development of housing units, theAgency will provide a total of $800,000 silent-second mortgages to sixteen moderate-income households.In addition, under the terms of the Agreement, the Agency assisted in the rehabilitation of four existingvery low-income units in fiscal 2006. Interest will begin on the 37thi month following the recordation of theDeed of Trust and continues until the loans are paid in full. As of June 30, 201 1, there were $800,000 ofsilent second loans outstanding.
J. MIL Aspen Associates, L&L
In April 2007, the Agency entered into an Owner Participation Agreement with M1L Aspen Associates,Ltd. for the development of a 101-unit multi-family project, of which 100 units will be deed-restricted forvery low-income households. Under the terms of the Agreement, during fiscal year 2011 the Agencyprovided a $2,300,000 loan to the Developer. The loan bears simple interest at the rate of 5% per year, andis repayable in April 17, 2037. Upon June 1 of the year following the issuance of the final certificate ofoccupancy of the project and the first day of the each June during the term of the loan, the Developer shallpay 50% of Surplus Cash generated by the Project, as defined in the Agreement, during the previouscalendar year. As of June 30, 2011, principal and accrued interest totaled $2,436,503.
[NOTE 6- PROPERTY HELD FOR RESALE OR REDEVELOPMENT IThe Agency has purchased parcels of land as part of its efforts to develop or redevelop blighted propertieswithin the Redevelopment areas. Such land parcels are accounted for at the lower of cost or net realizablevalue or agreed-upon sales price if a disposition agreement has been made with a developer.
In August 2000 the Agency purchased land from the Santa Clara Valley Transportation Authority in theamount of $6,988,800 which is being held for future development projects.
In fiscal year 2010 the Agency purchased five housing units for $1,503,718 in the Parc Metro Subdivision,one housing unit for $207,179 in the Centria Subdivision, and one housing unit for $383,369 in the KBHome Subdivision. The Centria and KB Home Subdivision homes were sold during fiscal year 2011.During fiscal year 2011, the Agency purchased one additional Parc Metro Subdivision unit for $305,095,one Centria Subdivision housing unit for $248,056, and four KB Home Subdivision housing units for$1,273,892. The units were purchased in order to retain them as affordable housing units and are beingheld for future resale. Five of the units are rented to tenants.
In November 2009 the Agency purchased property along South Main Street in the amount of $12,443,137,which is intended to be sold to a developer in the near future, as discussed in Note 7E below.
In February’ 2011, the Agency purchased additional property along South Main Street in the amount of$1,792,200 which is intended to be incorporated into the Midtown Specific Plan.
In March 20]], the Agency made required findings in accordance with Health and Safety Code Sections33445 and 33490 to allow the conveyance of all of the above property to the City. The property is held inthe Genera] Fund.
57

______________________________________
nJ
CITV OF MILPITAS
Notes to Basic Financial Statements
FNOTE 7- DEVELOPMENT AGREEMENT]
The City and Redevelopment Agency have entered into the development agreements below in an cifort to tiprovide incentives to develop new businesses, new tax revenues and affordable housing.
A. The Grossing at Montague
In November 1 999, the City approved the development of a 468 unit apartment complex, known as the
Crossing at Montague Project (Project). As part of the conditions of approval, the developer of the Project
is required to restrict 20% (94 units) of the units to veiy low income households. On behalf of the
developer, the City issued $45,000,000 in tax exempt bonds and $15,000,000 in taxable bonds in June
2000. As of June 30, 201 1, the outstanding principal of the debt was $52,000,000. The debt service
payments on these bonds are solely the responsibility of’ the developer.
B. Apton Properties LLC
In September 2004, the Agency entered into an Owner Participation Agreement with Apton Properties, LLC
for the development of a mixed-use project that will include commercial retail and a 93-unit condominium
complex, of which nineteen units will be deed-restricted for very low- to moderate- income households. The
Owner Participation Agreement was amended in June 2008 to change the deed-restricted units to 12
extremely low-income units, 43 very low-income units, and 38 market rate units. In June 2010, Apton
Properties offered to sell the property to the Agency for $6.3 million plus reimbursement of $500.000 for in-
lieu fees and improvements made to the property. The City accepted the offer. Subsequently, the Owner
Participation Agreement was terminated and the Agency purchased the property in August 2010 Ibr the
development of open space in the future. ftC’. Installment Purchase Agreement
The Redevelopment Agency agreed to purchase two parcels of land comprising thirty-five acres Isurrounding the County Correctional Facility for $57,750,000 in cash and $135,000,000 payable over
eighteen years at no interest, under the Installment Purchase Agreement discussed in Note 9.
The Agency also agreed to re-sell this land to developers for a total of $57,750,000, of which $40,000,000
was received in fiscal 2005 and the remainder was received on the close of escrow on the second parcel in
fiscal 2006. The Agency’s intent in purchasing this land was to simultaneously re-sell it for development.
In addition, starting in 2024 the Agency is required to pay the County the greater of $2,000,000 or 50% of
the sales tax revenue arising out of sales originating on certain properties that are part of this land, but not
to exceed $5,000,000 annually, until the earlier of either June 30, 2038, the date that tax increment revenue
allocated to the Agency has reached its limit; or the termination of the Redevelopment Plan.
D. County ofSanta Clara
In August 2006. the Agency entered into a Disposition and Development Agreement with the County of Santa UClara to construct a health center and a public parking garage. Under the terms of the Agreement, the Agency
sold a parcel of land to the County for the construction of the health center for $1,862,360. In addition, the
Agency entered into a Ground Lease Agreement to lease a parcel of land to the County For 75 years for
constructing and operating a public parking garage adjacent to the health center site, The Agency constructed
certain public off-site improvements in the area, including underground utilities, roadway improvements and
streetscape improvements. I
581

CITY OF MILPITASNotes to Basic Financia’ Statements
NOTE 7 - I)EVELOPMENT AGREEMENTS (Continued) IE. Son/h Maui Senior Lifestyles, LLc.
In August 2009, the Agency entered into a Disposition and Development Agreement with the South MainSenior Lifestyles, LLC to develop 180 units of “Continuum of Care Senior Housing” (Phase I Parcel), ofwhich 63 units will be for very low and low income households, and 207 units of family housing (Phase 2Parcel) which will be market rate units. En accordance with the terms of the Agreement, the Agency willacquire the properties and resell them in two phases to the developer prior to construction, subject tocertain conditions in the Agreement. The sales price for the Phase I Parcel will be $5,022,129, and thesales price for the Phase 2 Parcel will equal the greater of the fair market value of the Phase 2 Parcel asdefined in the Agreement or $7,377,871. In addition, the Agency’s Housing Reserve Special RevenueFund will provide a grant in the amount of $7.7 million to support the development and operation of thePhase I Parcel project. As of June 30, 2010, the Agency had acquired the properties as discussed in Note 6above, but had not resold the parcels to the developer, and as of June 30, 2011, the Agency had notexpended any funds on the grant.
F. Integral Communities Mc€’andless, LLC’.
In August 2010, the Agency entered into an Owner Participation Agreement with Integral CommunitiesMcCandless, LLC, to develop 23 acres along McCandless Drive with 92,000 square feet of retail space,1,328 new residential units, and approximately three acres of new public open space. A grocery storespace will be created as part of the retail space and include a permanent covenant that will ensure a grocerystore will remain at that location. Fifteen percent of the total residential units (199 of 1,328 unitsconstructed) will be for moderate income households. Under the terms of the Agreement, the Agency willprovide financial assistance up to $41.3 million consisting of: $29,153,673 for the cost of olfsiteinfrastructure and associated development fees, $5,846,327 or $29,378 per unit for restricted unitassistance, and $6,300,000 for the grocery store covenant payments. The Agency will make an annualgrocery store covenant payment not to exceed $630,000 annually for up to 10 years for an amount not toexceed $6.30 million. A key provision in the Agreement limits the amount of annual assistance from theAgency to the additional tax increment revenue generated from the project and received by the Agencyeach year. The developer will not receive any annual assistance/reimbursement payments beyond 24 years.After 24 years, all assistance/reimbursements will slop and the Agency will retain lull share of the taxincrement revenue from the project until the Project Area expires. As of June 30, 20 11, the Agency hadnot expended any funds under the Agreement.
6 Sun Power corporation
In February 2011, the Agency entered into a Financing Agreement with SunPower Corporation toreimburse the Corporation for the acquisition and installation of capital equipment lur the purpose ofproducing SunPower solar panels. The Corporation intends to contract with Flextronics Americas toreceive shipments of specialized manufacturing equipment and to install and operate the equipment for aninitial period of five years and hire and continually employ at least 80 new employees (employment goal).Under the terms of the Agreement, the Agency will reimburse the Corporation $700,000 after receivingdocumentation of achieving the employment goal and confirming the applicable equipment was installed.The Agency also committed to reimburse the Corporation an additional $200,000 per year over a Ihur yearperiod ending on January 1, 2014, if the Corporation continues to meet the manufacturing and employmentobligations and has unreimbursed capital equipment and facilities improvement costs. The funding will heincrementally forgiven so long as the Corporation does not cease its relationship with Flextronics Americasor stop using the site br industrial/manufacturing purposes on or before January 1, 2014, but the remainingbalance is payable if the Corporation does cease the activities as noted. The agreement terminates January1,2016. As of June 30, 2011, the Agency had not expended any funds under the Agreement.
59
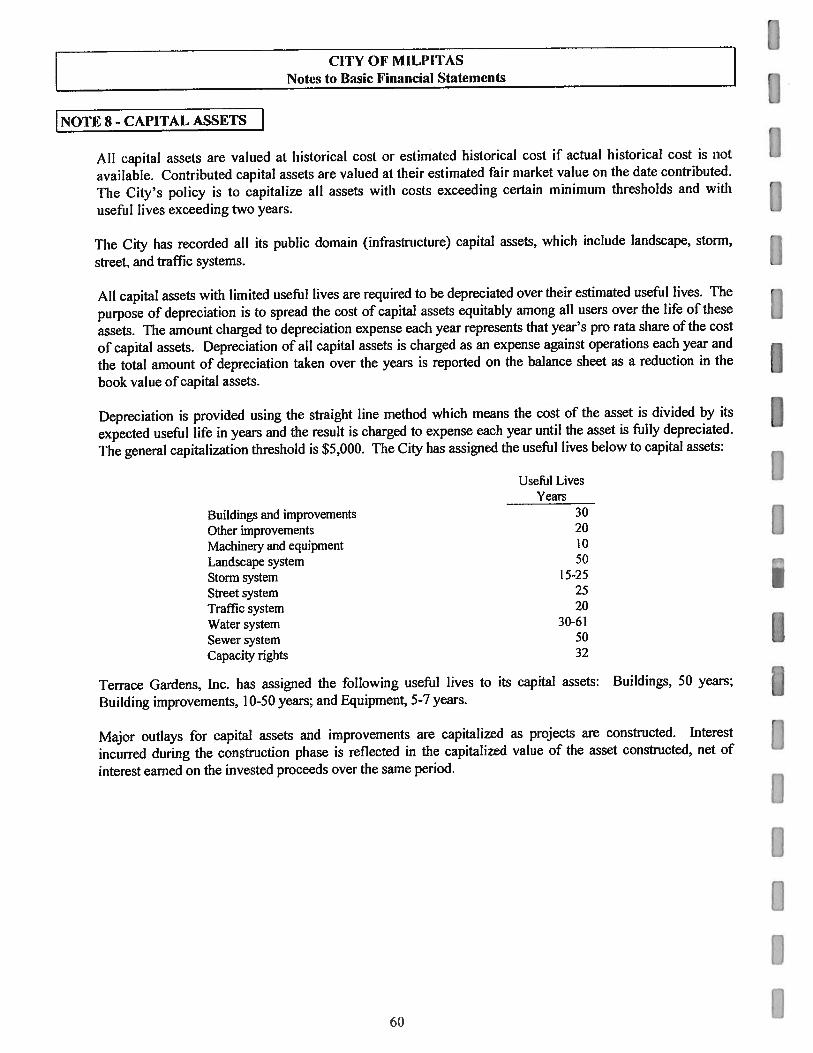
CITY OF MILPITAS
L Notes to Basic Financial Statements r
LSSETS 7All capital assets are valued at historical cost or estimated historical cost if actual historical cost is not
available. Contributed capital assets are valued at their estimated fair market value on the date contributed.
The City’s policy is to capitalize all assets with costs exceeding certain minimum thresholds and with
useful lives exceeding two years.
The City has recorded all its public domain (infrastructure) capital assets, which include landscape, storm,
street, and traffic systems.
All capital assets with limited useful lives are required to be depreciated over their estimated useful lives. The
purpose of depreciation is to spread the cost of capital assets equitably among all users over the life of these
assets. The amount charged to depreciation expense each year represents ihat year’s pro rata share of the cost
of capital assets. Depreciation of all capital assets is charged as an expense against operations each year and
the total amount of depreciation taken over the years is reported on the balance sheet as a reduction in the
book value of capital assets.
Depreciation is provided using the straight line method which means the cost of the asset is divided by its
expected useful life in years and the result is charged to expense each year until the asset is fully depreciated.
The general capitalization threshold is $5,000. The City has assigned the useful lives below to capital assets:
Useful LivesYears
Buildings and improvements 30
Other improvements 20Machinery and equipment 0
Landscape system 50
Storm system 15-25
Street system 25
Traffic system 20
Water system 30-61
Sewer system 50Capacity rights 32
Terrace Gardens, Inc. has assigned the following useful lives to its capital assets: Buildings, 50 years;
Building improvements, 10-50 years: and Equipment. 5-7 years.
Major outlays for capital assets and improvements are capitalized as projects are constructed. Interest
incurred during the construction phase is reflected in the capitalized value of the asset constructed, net of
interest earned on the invested proceeds over the same period.
I1I
60
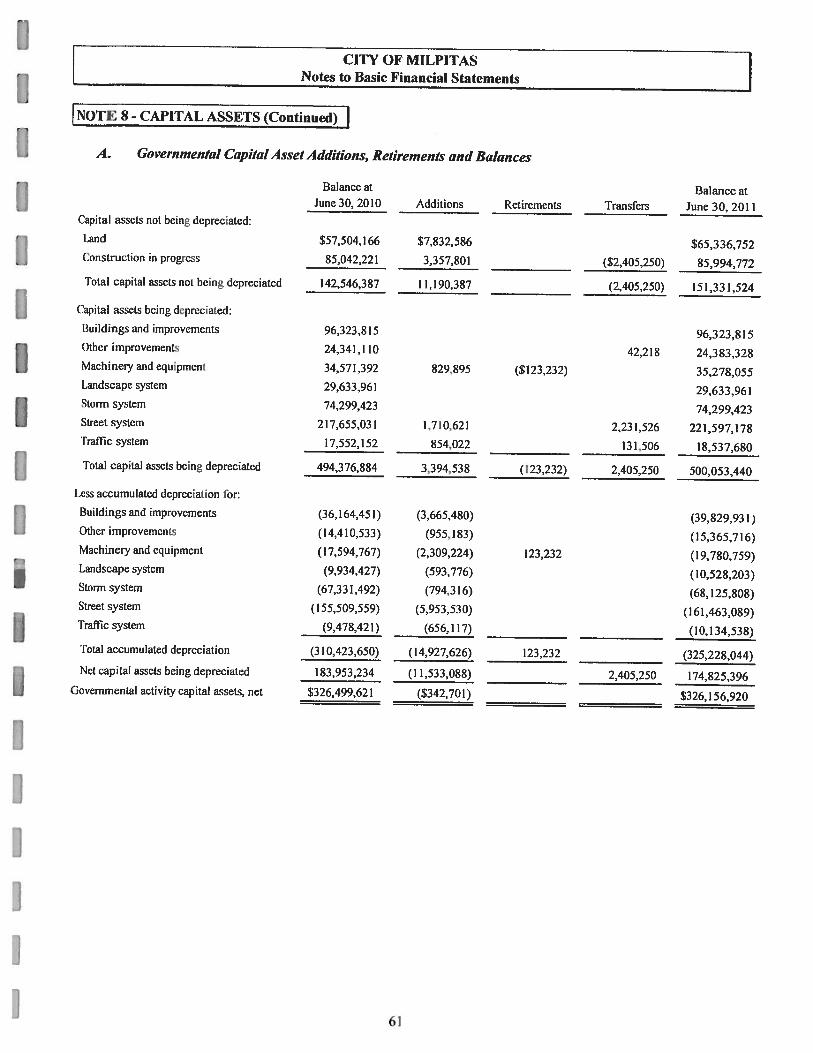
CITY OF MILPITASNotes to Basic Financial Statements
NOTE 8- CAPITAL ASSETS (Continued) IA. Governmental Capital Asset Additions, Retirements and Balances
Balance at Balance atJune 30, 2010 Additions Retirements ‘l’ransfers June 30, 2011
Capital assets not he!ng depreciated:
Land $57,504,166 $7,832,586 $65,336,752(‘onstruction in progress 85,042,221 3,357,801
______________
($2,401250) 85.994,772
Total capital assets not being depreciated 142,546.387 11.190.387
_______________
(2,405.250) 151,331.524
Capital assets being depreciated:
Buildings and improvements 96,323,815 96,323.815Other improvements 24,341.110 42,218 24,383,328Machirieiy and equipment 34.571,392 829895 ($123,232) 35,278.055Landscape system 29,633,961 29,633.961Storm system 74.299,423 74,299.423Street system 217,655.031 1.710.621 2.231,526 221,597,178Trafflc system 17,552,152 854,022
_____________
131.506 18,537,680
Total capital assets being depreciated 494,376.884 3,394.538 (1 23.232) 2.405.250 500.053,440
Less accumulated depreciation for:
Buildings
and improvements (36,164,45!) (3,665,480) (39,829,931)Other improvements (14.410,533) (955.183) (15,365,716)Machineiy and equipment (17,594.767) (2.309,224) 123,232 (19,780,759)Landscape system (9,934.427) (593,776) (10,528,203)Storm system (67,331,492) (794.316) (68,125,808)Street system (155,509.559) (5,953.530) (161,463,089)Trafl3c system (9,478,421) (656.117)
_____________ ______________
(10,134,538)
‘lotal accumulated depreciation (310.423,650) (14,927,626) 123,232
______________
(325.228,044)Net capital assets being depreciated 183,953,234 (11.533,088)
_______________
2,405,250 174,825,396Governmental activity capital assets, net $326,499.62 1 ($342,701) $326,! 56,920
61
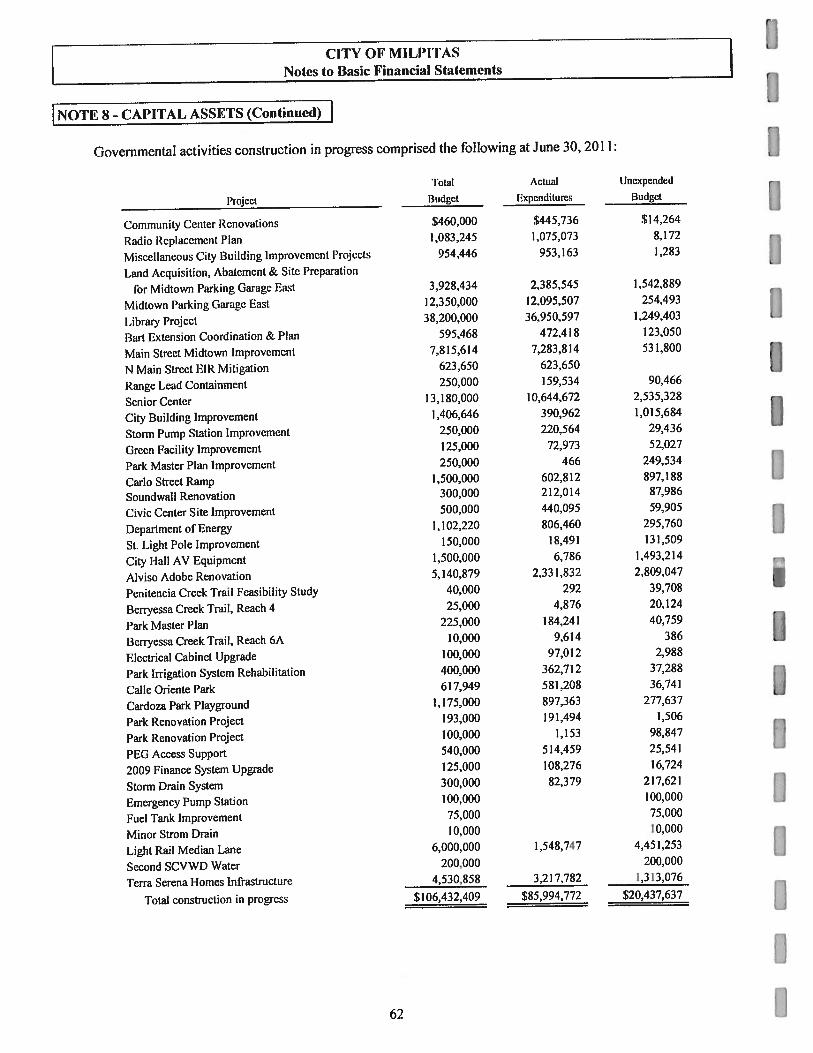
CITY OF MILITAS
Notes to Basic Financial Statements
[No’n S - CAPITAL ASSETS (Continued) IGovernmental activities construction in progress comprised the following at June 30, 2011:
IoEal Actual Unexpended
Projcct Iudget I ixpenditures I3udgct
Community Center Renovations $460,000 $445,736 $14,264
Radio Replacement Plan 1,083.245 1,075,073 8,172
Miscellaneous City Building Improvement Proleets 954,446 953.163 1,283
Land Acquisition, Abatement & Site Preparation
for Midtown Parking Garage East 3,928.434 2,385,545 1.542,889
Midtown Parking Garage East 12,350.000 12.095.507 254,493
Library Project 38,200,000 36,950.597 1.249,403
Burt Extension Coordination & Plan 595,468 472,418 123,050
Main Street Midtown Improvement 7,815,614 7,283,814 531,800
N Main Street FiR Mitigation 623,650 623,650
Range Lead Containment 250,000 159,534 90.466
Senior Center 13,180,000 10,644.672 2.535,328
City Building Improvement 1,406,646 390,962 1,015,684
Storm Pump Station Improvement 250.000 220,564 29,436
Green Facility Improvement 125,000 72,973 52,027
Park Master Plan Improvement 250,000 466 249,534
Carlo Street Ramp 1,500,000 602,812 897,188
Soundwall Renovation 300,000 212,014 87,986
Civic Center Site Improvement 500,000 440,095 59,905
Department of Energy 1,102.220 806,460 295,760
St. Light Pole improvement 150,000 18.491 13 1,509
City Hail AV Equipment 1,500,000 6,786 1,493,214
Alviso Adobe Renovation 5,140,879 2.331.832 2.809.047
Penitencia Creek Trail Feasibility Study 40,000 292 39,708
Berryessa Creek Trail. Reach 4 25,000 4.876 20.124
Park Master Plan 225,000 184.241 40,759
Berryessa Creek Trail, Reach 6A 10,000 9,614 386
Electrical Cabinet Upgrade 100.000 97,012 2,988
I’ark Irrigation System Rehabilitation 400,000 362,712 37,288
Calle Oriente Park 617,949 581.208 36.74
Cardoza Park Playground 1,175,000 897,363 277,637
Park Renovation Project 193,000 191.494 1.506
Park Renovation Project 100,000 1,153 98,847
PEG Access Support 540,000 514,459 25,541
2009 Finance System Upgrade 125,000 108,276 16,724
Storm Drain System 300,000 82.379 217.621
Emergency Pomp Station 100.000 100,000
Fuel Tank Improvement 75,000 75,000
Minor Strom Drain 10.000 10.000
Light Rail Median Lane 6,000,000 I.54&747 4.451,253
Second SCVW[) Water 200.000 200.000
Terra Serena I-tomes Infrastructure 4,530,858 3,217,782 1,313,076
1’otal construction in progress $106,432,409 S85.994.772 520,437.637
I62
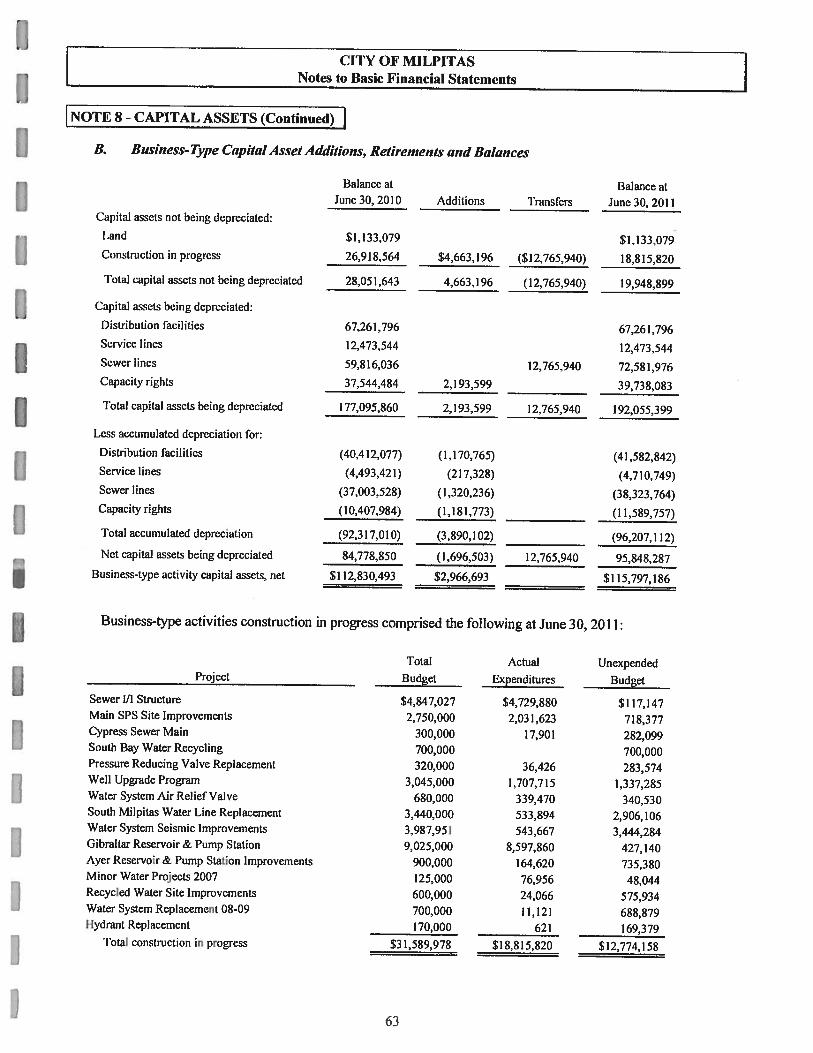
CITY OF MILPITASNotes to Basic Financial Statements
NOTE - CAPITAL ASSETS (Continued) IB. Business- Type Capital Asset Additions, Retirements aiid Balances
Balance at I3alance atJune 30, 2010 Additions ‘l’ransfcrs June 30, 2011
Capital assets not being depreciated:
1.and $1,133,079 $1,133,079Construction in progress 26,918,564 $4,663,196 ($12,765,940) 18,815,820
Total capital assets not being depreciated 28,051,643 4,663.196 (12,765,940) 19,948,899
Capital assets being depreciated:
Distribution facilities 67,261,796 67,261,796Service lines 12,473.544 12,473.544Sewer lines 59,816,036 12,765,940 72,581,976Capacity rights 37,544.484 2,193,599
______________
39,738,083
‘I’otal capital assets being depreciated 177,095,860 2,193.599 12.765,940 192,055.399
Less accumulated depreciation for:
Distribution facilities (40,412.077) (1,170,765) (41,582,842)Service lines (4,493,421) (217,328) (4,710,749)Sewer lines (37,003.528) (1,320,236) (38.323,764)Capacity rights (10,407,984) (1,181,773) (11,589.757)
Total accumulated depreciation (92,317,010) (3.890.102)
_______________
(96,207.112)
Net capital assets being depreciated 84.778,850 (1,696.503) 12,765.940 95,848,287Business-type activity capital assets, net $112,830,493 $2,966,693 $115,797,186
Business-type activities construction in progress comprised the following at June 30, 2011:
Total Actual UnexpendedProject Budget Expenditures Budget
Sewer 1/I Structure $4,847,027 $4,729,880 $117,147Main SPS Site Improvements 2,750,000 2,031,623 718,377Cypress Sewer Main 300,000 17,901 282,099South Bay Water Recycling 700,000 700,000Pressure Reducing Valve Replacement 320,000 36,426 283,574Well Upgrade Program 3,045,000 1.707,715 1.337,285Water System Air Relief Valve 680,000 339.470 340,530South Milpitas Water Line Replacement 3.440,000 533,894 2,906.106Waler System Seismic Improvements :3.987,951 543,667 3,444,284Gibraltar Reservoir& Pump Station 9.025,000 8.597,860 427,140Aver Reservoir & Pump Station Improvements 900,000 1 64,62t) 735,380Minor Water Projects 2007 125.000 76,956 48.044Recycled Water Site Improvements 600,000 24,066 575.934Water System Replacement 08-09 700.00(1 11,121 688,879I ldrant ReplacelTient 170,001) 621 169.379
lotal construcuon in progress 531,589,978 Si 8.815,820 SI 2,774,158
63

H(T1V OF MlL[[AS
L Notes to Basic Financial Statements
LN0’rE 8 - CAPITAL ASSETS (Continued) 1C Terrace Gardens, Inc. ‘s Capita! Assets
The following is a summaiy of Tei-race Gardens Inc’s chaiges in capital assets for the fiscal year ended
June 30, 2011:
I3alance Balance
December 31. 2010 Additions Deductions December 31. 2011
Capital assets not being depreciated:
land $1,565,277 $1,565,277
Capital assets being depreciated:
Buildings 12,519,332 $275238 12,794,570
Furniture 211,160 ($8,361) 202.7Q)
OlTiceequipment 60,710 60,710
Improvements
200,423
_______________ _______________
200,423
‘Fotal capital assets being depreciated 12,991,625 275.238 (8,361) 13,258,502
Less accumulated depreciation (5,285,404) (295,978) 8,361 (5,573,021)
Net capital assets being depreciated 7.706,221 (20,740) 7.685.481
l’otal capital assets. net $9.27 1.498 ($20,740) $9250,758
D. Depreciation Allocation
Depreciation expense is charged to functions and programs based on their usage of the related assets. The
amounts allocated to each function or program arc as follows:
Governmental Activities
General Government $3,114,876
Public Works 9,067,627
Parks and Recreation 787,1 42
Police 858,335
Fire 367,086
Internal Service Fund 732,560 flTotal Governmental Activities $14,927,626
Business- Type Actit’ities
Water Utility SI ,367,876
Recycled Water Utility 20,217
Sewer Utility 2,502,009
Total Business-Type Activities $3,890,102
Discretely Presented Component Unit:
Terrace Gardens, Inc. $295,978 I
64I

CITY OF MILPITASNotes to Basic Financial Statements
NOTE 8 - CAPITAL ASSETS (Continued) IE. Sewer Treatment capacity Rights
The City has a contract with the San Jose/Santa Clara Wastewater Treatment Plant, known as the WaterPollution Control Plant (WPCP), which gives Milpitas and other tributary agencies rights to a percentage ofthe capacity of their sewage treatment facilities. The contract terminates in 2031 and requires the City to payits share of operations, capital expenses and debt service on the treatment plant. The City also pays capitalcosts based on allocated flow capacity rights of 14.25 million gallons per day or about 8.1 % of the total plantcapacity. The City has capitalized its share in the amount of $20,570,361. The operation and maintenancecosts are calculated based upon actual sewage flow and strengths. In fiscal year 2011 the City’s operation andmaintenance share was approximately 7.65% of the total WPCP operations.
Under a plan approved by the Regional Water Resources Control Board, the City is responsible forapproximately 8.1% of the costs to be incurred by the WPCP to mitigate damage to an endangered specieshabitat. Approved in 1995, the South Bay Water Recycling Program (SBWRP) consisted of constructing awater recycling distribution system that would reduce the volume of wastewater discharged into the SanFrancisco Bay by the treatment plant. This Program was estimated to cost a total of $140 million for Phase Iand $100 million for Phase 11, of which the City’s share will approximate 8.1%. At June 30, 2007, Phase Iand Phase 11 construction for Milpitas’ infrastructure was completed and the City capitalized its’ share of theProgram in the amount of $14,618,561.
During fiscal year 2010, the City also purchased 0.75 million gallons per day of wastewater treatmentcapacity from the Cupertino Sanitary District in the amount of$4,549,161. The capacity is for build-out ofthe Transit Area Specific Plan. Funding for this purchase was included in the Transit Area DevelopmentLmpact Fee Program.
NOTE 9- LONG TERM DEBT
The City generally incurs long-term debt to finance projects or purchase assets which will have useful livesequal to or greater than the related debt.
A. Current Year Transactions and Balances
The City’s debt issues and transactions are summarized below and discussed in detail thereafler.
Balance Balance CurrentGovernmental Activity Debt: June 30, 2010 Retirements June 30, 2011 Port ion
2003 Redevelopment Agency Tax Allocation Bonds2%-5.25%, due September I. 2032 $174.1 80.000 $5,240,000 $ 168.940.000 $5.4 10.000
Installment Purchase Agreementwith the County of Santa Claradue June 30. 2023 36.962,829 2,984,862 33.977,967 2.842.725
Total Governmental Acti’itv l)ehi $211,142,829 $8,224,862 $202,917,967 $8,252,725
Business-type Activit) Debt:
Sewer Certificates of Participation, 2006 Series A
3.4%- 4.20°4. due \ovcrnbcr 1,2026 $8.460,000 $370,000 $8,090,000 $380.000
Total Business-type Activity Dch $8,460.000 $370,000 $8,090,000 $380,000
65
C[I’Y OF MJLII’IAS
Notes to Basic Finnncial Statements
NOTF 9 - LONG TFRM DEBT (Continued) IB. 2003 Redevelopment Agency Tax Allocation Bonds
In November 2003, the Agency issued Tax Allocation Bonds in the original principal amount of
$200,000,000 to advance refund and defease the outstanding 1997 and 2000 Tax Allocation Bonds, and to
provide financing for various redevelopment projects. The Bonds are secured by the Agency’s Tax
Increment Revenue. In lieu of a reserve fund, the 2003 Bonds also are secured by a $13,687,858 surety
bond issued by Municipal Bond Investors Assurance Corporation. Principal is payable annually and the
interest is payable semi-annually through 2033.
The pledge of all future tax increment revenue (housing and non-housing revenue) ends upon repayment of
the $264,575,085 remaining debt service oii the bonds which is scheduled to occur in fiscal year 2033.
Projected non-housing revenues are expected to provide coverage over debt service of 1 .58 over the life of
the bonds. Projected revenues for the low and moderate income housing set-aside amounts required to be
deposited into the Agency’s Housing Reserve Special Revenue Fund (housing revenue) are expected to
provide coverage over debt service of 13.79 over the life of the bonds. For fiscal year 2011, non-housing
tax increment revenue amounted to $24,685,068 which represented coverage of 1.87 over the $13,215,031
non-housing portion of debt service. For fiscal year 2011, the housing revenue amounted to $1 1.668,669
which represented coverage of 30.10 over the $387,677 housing portion of debt service.
C’. Installment Purchase Agreement with, the county ofSanta Clara
The Redevelopment Agency has a non-interest bearing Installment Purchase Agreement with the County of
Santa Clara in the original principal amount of $135,000,000, as mentioned in Note 7D above. As
discussed in Note 7D, under the Agreement, the City purchased two parcels of land that were later sold to
developers. The amount due under the Agreement does not bear interest and is payable annually through
2023. The Agency has therefore recorded a liability of $33,977,967 at June 30. 2011, representing the
present value of future payments due under this Agreement.
D. Sewer (‘ertficates ofParticipation, 2006 Series A
On December 1, 2006, the Milpitas Public Financing Authority issued Certificates of Participation, 2006
Series A (Sewer COPs), in the original principal amount of $9,535,000 to finance certain sewer facilities
within the City. The Sewer COPs are collateralized by net revenues from the City’s Sewer System
Installment Sale Agreement. For fiscal year 2011, net revenues amounted to $5,331,748, which
represented coverage of 7.77 over the $689,468 of debt service. In lieu of a reserve fund, the COPs are
secured by a $695,758 surety bond issued by the MB[A Insurance Corporation. Principal is payable
annually and interest is payable semi-annually through 2027.
III
66 I
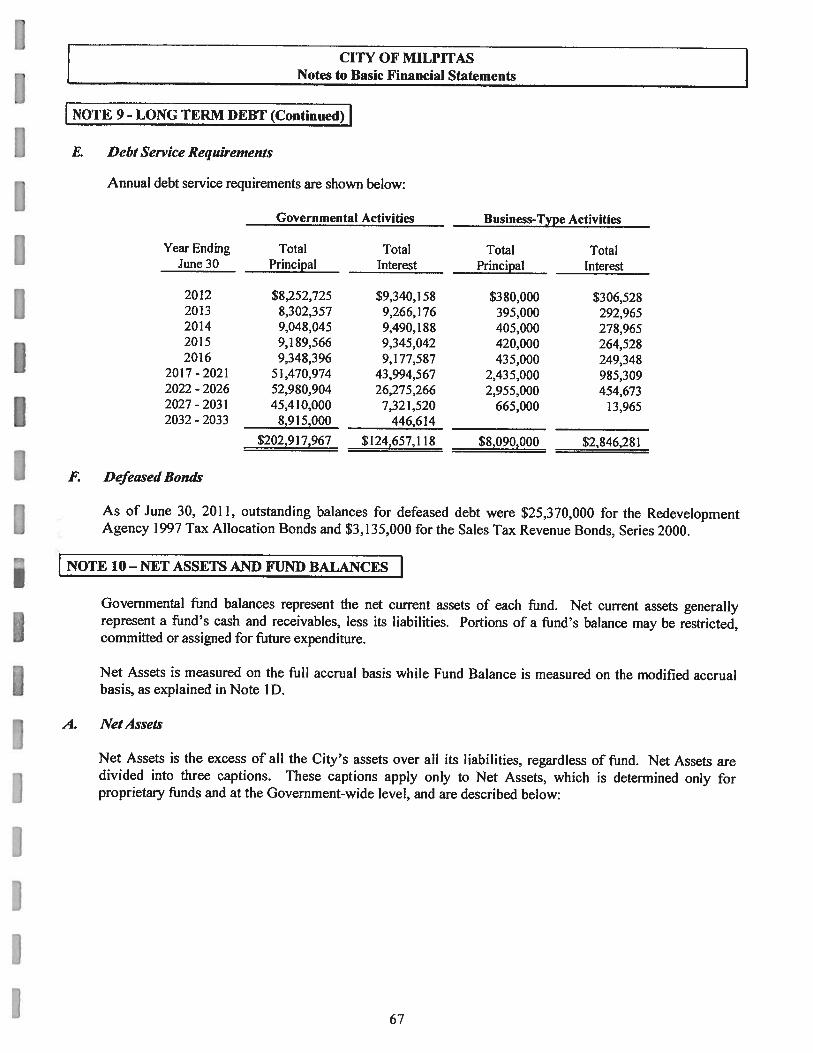
T CITY OF MILPITAS
J Notes to Basic Financial Statements
I NOTE 9 - LONG TERM 1)EBT (Continued) IE. Debt Seri’ice Requirements
Annual debt service requirements arc shown below:
Governmental Activities Business-Type Activities
Year Ending Total Total Total TotalJune 30 Principal Interest Principal Interest
2012 $8,252,725 $9,340,158 $3 80,000 $306,5282013 8,302,357 9,266,176 395,000 292,9652014 9,048,045 9,490,188 405,000 278,9652015 9,189,566 9.345,042 420,000 264,5282016 9,348,396 9,177,587 435,000 249,348
2017-2021 51,470.974 43,994,567 2,435,000 985,3092022 - 2026 52,980,904 26,275,266 2,955,000 454,6732027-2031 45,410,000 7,321,520 665,000 13,9652032 -2033 8,915,000
446,614
_____________ _____________
$202,917,967 $ 124,657,1 18 $8,090,000 $2,846,281
F. Defeased Bonds
As oF June 30, 2011, outstanding balances for defeased debt were $25,370,000 for the RedevelopmentAgency 1997 Tax Allocation Bonds and $3,135,000 for the Sales Tax Revenue Bonds, Series 2000.
NOTE 10- NET ASSETS AND FUND BALANCES
Governmental fund balances represent the net current assets of each Fund. Net current assets generallyrepresent a fund’s cash and receivables, less its liabilities. Portions of a fund’s balance may he restricted,committed or assigned for future expenditure.
Net Assets is measured on the Full accrual basis while Fund Balance is measured on the modified accrualbasis, as explained in Note I D.
A. Net Assets
Net Assets is the excess of all the City’s assets over all its liabilities, regardless of fund. Net Assets aredivided into three captions. These captions apply only to Net Assets, which is determined only forproprietary funds and at the Government-wide level, and are described below:
67
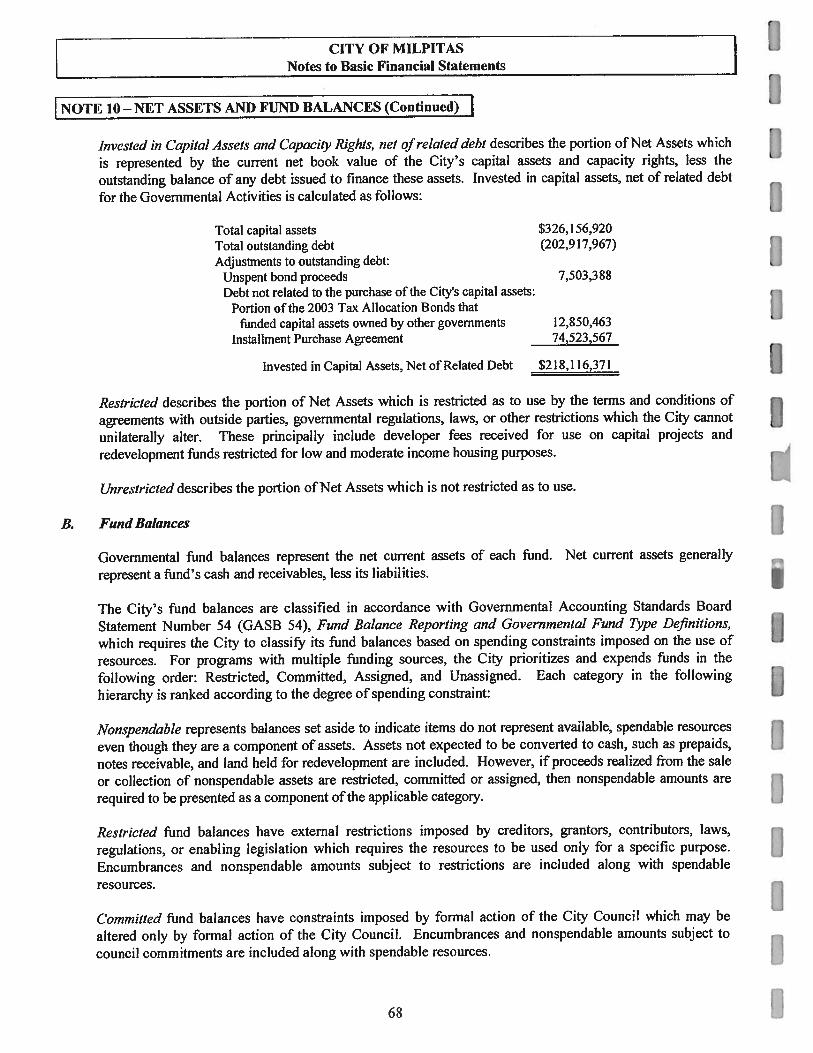
CITY OI’ MILPITAS
Notes to Basic Financial Statements
NOTE 10— NET ASSETS AND FUND BALANCES (Continued) IInvested in capital Assets and Capacity Rights, net ofrelated debt describes the portion of Net Assets which
is represented by the current net book value of the City’s capital assets and capacity rights, less the
outstanding balance of any debt issued to finance these assets. Invested in capital assets, net of related debt
For the Governmental Activities is calculated as follows:
Total capital assets $326, 156,920Total outstanding debt (202,917,967)Adjustments to outstanding debt:
Unspent bond proceeds 7,503,388Debt not related to the purchase of the City’s capital assets:
Portion of the 2003 Tax Allocation T3onds thatfunded capital assets owned by other governments 12,850,463
Installment Purchase Agreement 74,523,567
Invested in Capital Assets, Net of Related Debt $218, 116,371
Restricted describes the portion of Net Assets which is restricted as to use by the terms and conditions of
agreements with outside parties, governmental regulations, laws, or other restrictions which the City cannot
unilaterally alter. These principally include developer fees received for use on capital projects and
redevelopment funds restricted for low and moderate income housing pulposes.
Unrestricted describes the portion of Net Assets which is not restricted as to use.
B. Fund Balances
Governmental fund balances represent the net current assets of each fund. Net current assets generally
represent a fund’s cash and receivables, less its liabilities.
The City’s fund balances are classified in accordance with Governmental Accounting Standards Board
Statement Number 54 (GASB 54), Fund Balance Reporting and Governmental Fund Type Definitions,
which requires the City to classify its fund balances based on spending constraints imposed on the use of
resources. For programs with multiple funding sources, the City prioritizes and expends funds in the
following order: Restricted, Committed, Assigned, and Unassigned. Each category in the following
hierarchy is ranked according to the degree of spending constraint:
Nonspendable represents balances set aside to indicate items do not represent available, spendable resources
even though they are a component of assets. Assets not expected to be converted to cash, such as prepaids,
notes receivable, and land held for redevelopment are included. However, if proceeds realized from the sale
or collection of nonspendable assets are restricted, committed or assigned, then nonspendable amounts are
required to be presented as a component of the applicable category.
Restricted fund balances have external restrictions imposed by creditors, grantors, contributors, laws,
regulations, or enabling legislation which requires the resources to be used only For a specific purpose.
Encumbrances and nonspendable amounts subject to restrictions are included along with spendable
resources.
Committed fund balances have constraints imposed by formal action of the City Council which may be
altered only by formal action of the City Council. Encumbrances and nonspendable amounts subject to
council commitments are included along with spendable resources. I68

[1Cl IV OF MILIITAS
Notes to Basic Financial Statements
rN0TE 10— NET ASSETS ANI) FUND BALANCES (Continued) IAssigned fund balances are amounts constrained by the City’s intent to be used for a specific purpose, butarc neither restricted nor committed. Intent is expressed by the City Council or its designee and may bechanged at the discretion of the City Council or its designee. This category includes: encumbrances;nonspendables, when it is the City’s intent to use proceeds or collections for a specific purpose; andresidual fund balances, if any, of Special Revenue, Capital Projects and Debt Service Funds which have notbeen restricted or committed.
Unassigned fund balance represents residual amounts that have not been restricted, committed, or assigned.This includes the residual General Fund balance and residual fund deficits, if any, of other governmentalfunds.
Detailed classifications of the City’s Fund Balances, as of June 30, 2011, are below:
Major Major
Special Revenue Funds Caplal ProjectsEconomic Redevelopment Street ‘transit Area Other
General Development housing Project lmprovenicot Impact Fee GovernmentalFund Balance C’tass,Ircations Fund Corporation Reserve Fund Fuoml Fuod Funds ‘[vIal
Nonspeomlable:
Advances to OIlier Funds 520 455,thl $20,455,191Prepaid.s, materials. supplies
and deposits 514,352 S,822 $15,868 537,243
Rmxtricted
for:
Redevelopment Low and Moderate
Income I toLisitig } 5773898 20,295,422 36,06’i,]20Redevelopment Projects and Programs 11,781,001) 552,437,246 61,218,245Street and Road lrnprovcmnevts
and
Maintenance St :,934,t4(, 1,881.613 :7,S15,75’t[lousing and co:nmmtnnhty development 3,767,866 33t57t[(,(,Law enforcement services 219,l06 239,106Solid waste reduction and services 1,411,24] 1,41124]
Assessment
district services 655,425 1,55,425I etch-I tetchy ground lease 1695,257 1695257Park improvement projects 9,485287 9.485,287Storms drain projects 885,962 885962
(:omnmitted to:
PERS
stabilization .5.432.703 5,432,707Assigned to:
library pmsm[ect 6573,93’l 6,573,934Uninsured claims payable 2,8! 6,694 2,816,694
Sales
and use taxes 112,350 112,350Public art projects 1,345,691 1,345,69!Other contracts 194.762 194.762General govemmeiti capital projects 781.1115 781.815
Lnassigned:
Generat fund 15.448.050
O:hcrgovernmcntalfunddeficitreniduais
_____________ ____________________________
(32.166.283)
_______________
(Si .455,: 11)
_______________
143,624.454)
Total fund balances 117(m.)02.i),13 $52,437,246 820.296.244 1832.150.415 S .934J46 ($1 1.458.171) 521,753 41,6 8138.918.459
69
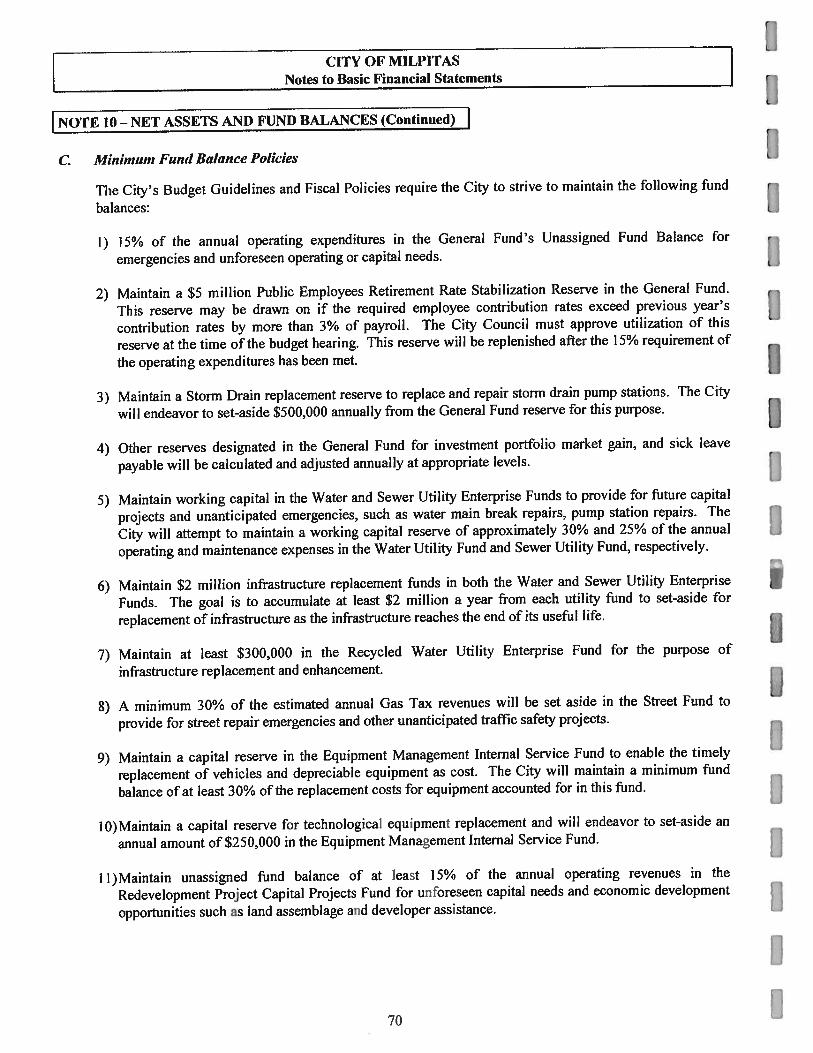
[1CITY OF MILPITAS
Notes to Basic Financial Statements
______________
UNOTE 10— NET ASSETS AND FuND BALANCES (Continued)
C Mmimwn Fund Balance Policies
The City’s Budget Guidelines and Fiscal Policies require the City to strive to maintain the following fund
balances:
1) 15% of the annual operating expenditures in the General Fund’s Unassigned Fund Balance for
emergencies and unforeseen operating or capital needs.
2) Maintain a $5 million Public Employees Retirement Rate Stabilization Reserve in the General Fund.
This reserve may be drawn on if the required employee contribution rates exceed previous year’s
contribution rates by more than 3% of payroll. The City Council must approve utilization of this
reserve at the time of the budget hearing. This reserve will be replenished after the 15% requirement of
the operating expenditures has been met.
3) Maintain a Storm Drain replacement reserve to replace and repair storm drain pump stations. The City
will endeavor to set-aside $500,000 annually from the General Fund reserve for this purpose. U4) Other reserves designated in the General Fund for investment portfolio market gain, and sick leave
payable will be calculated and adjusted annually at appropriate levels.
5) Maintain working capital in the Water and Sewer Utility Enterprise Funds to provide for future capital
projects and unanticipated emergencies, such as water main break repairs, pump station repairs. The
City will attempt to maintain a working capital reserve of approximately 30% and 25% of the annual
operating and maintenance expenses in the Water Utility Fund and Sewer Utility Fund, respectively.
6) Maintain $2 million infrastructure replacement funds in both the Water and Sewer Utility Enterprise
Funds. The goal is to accumulate at least $2 million a year from each utility fund to set-aside for
replacement of infrastructure as the infrastructure reaches the end of its useful life.
7) Maintain at least $300,000 in the Recycled Water Utility Enterprise Fund for the purpose of
infrastructure replacement and enhancement.
8) A minimum 30% of the estimated annual Gas Tax revenues will be set aside in the Street Fund to
provide for street repair emergencies and other unanticipated traffic safety projects.
9) Maintain a capital reserve in the Equipment Management Internal Service Fund to enable the timely
replacement of vehicles and depreciable equipment as cost. The City will maintain a minimum fund
balance of at least 30% of the replacement costs for equipment accounted for in this fund. IlO)rvlaintain a capital reserve for technological equipment replacemeni and will endeavor to set-aside an
annual amount of $250,000 in the Equipment Management Internal Service Fund. II l)Maintain unassigned fund balance of at least 15% of the annual operating revenues in the
Redevelopment Project Capital Projects Fund for unforeseen capital needs and economic development
opportunities such as land assemblage and developer assistance.
I
70 1
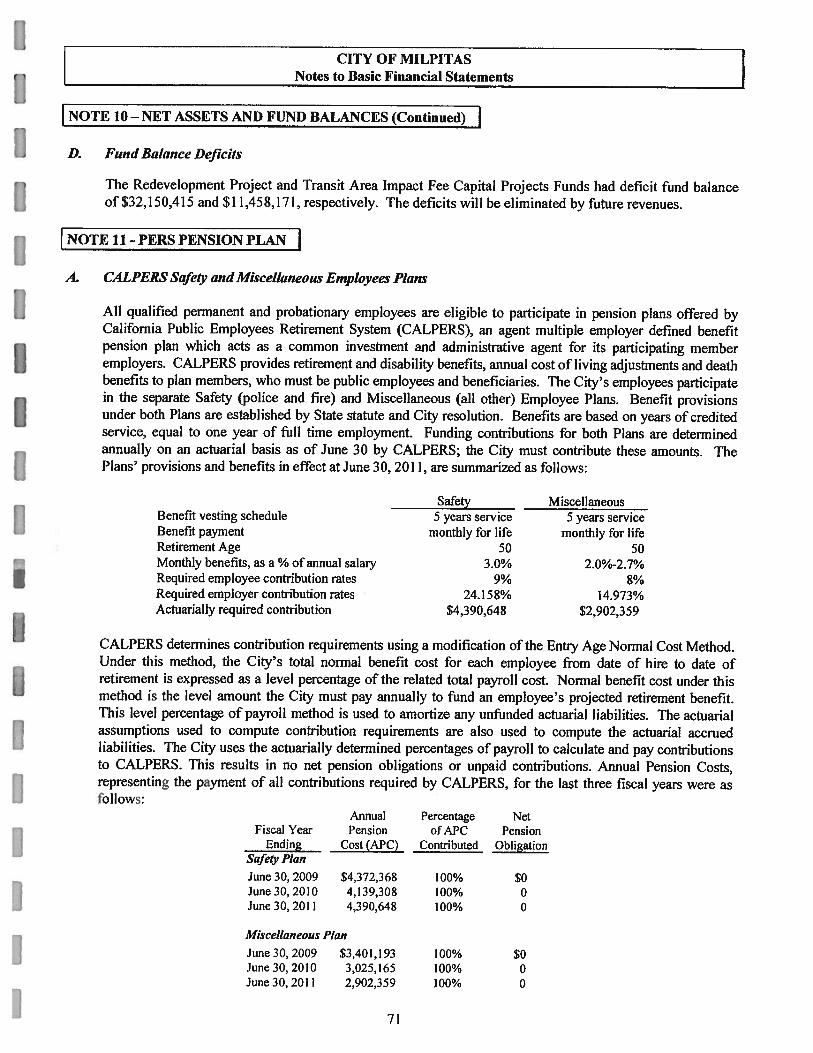
I CITY OF MILPITAS
L Notes to Basic Financial Statements
NOTE 10—NET ASSETS AND FUND BALANCES (Continued) ID. Fund Balance Dejici!.s
The Redevelopment Project and Transit Area Impact Fee Capital Projects Funds had deficit fund balanceof $32,150,415 and $1 1,458,171, respectively. The deficits will be eliminated by future revenues.
NOTE 11- PERS PENSION PLAN
A. CALPERS Safety and Miscellaneous Employees Plans
All qualified permanent and probationaiy employees are eligible to participate in pension plans offered byCalifornia Public Employees Retirement System (CALPERS), an agent multiple employer defined benefitpension plan which acts as a common investment and administrative agent for its participating memberemployers. CALPERS provides retirement and disability benefits, annual cost of living adjustments and deathbenefits to plan members, who must be public employees and beneficiaries. The City’s employees participatein the separate Safety (police and fire) and Miscellaneous (all other) Employee Plans. Benefit provisionsunder both Plans are established by State statute and City resolution. Benefits are based on years of creditedservice, equal to one year of full time employment. Funding contributions for both Plans are determinedannually on an actuarial basis as of June 30 by CALPERS; the City must contribute these amounts. ThePlans’ provisions and benefits in effect at June 30, 2011, are summarized as follows:
Safety MiscellaneousBenefit vesting schedule 5 years service 5 years serviceBenefit payment monthly for life monthly for lifeRetirement Age 50 50Monthly benefits, as a% of annual salary 3.0% 2.0%-2.7%Required employee contribution rates 9% 8%Required employer contribution rates 24.158% 14.973%Actuarially required contribution $4,390,648 52,902.359
CALPERS determines contribution requirements using a modification of the Entry Age Normal Cost Method.Under this method, the City’s total normal benefit cost for each employee from date of hire to date ofretirement is expressed as a level percentage of the related total payroll cost. Normal benefit cost under thismethod is the level amount the City must pay annually to fund an employee’s projected retirement benefit.This level percentage of payroll method is used to amortize any unfunded actuarial liabilities. The actuarialassumptions used to compute contribution requirements are also used to compute the actuarial accruedliabilities. The City uses the actuarially determined percentages of payroll to calculate and pay contributionsto CALPERS. This results in no net pension obligatioiis or unpaid contributions. Annual Pension Costs,representing the payment of all contributions required by CALPERS, for the last three fiscal years were asfollows:
Aimuel Percentage NetFiscal Year Pension of APC Pension
Ending Cost (APC) Contributed ObligationSafely Plan
June 30. 2009 54.372.368 100% 50June3O,20]0 4,139,308 100% 0June 30. 2011 4,390.648 100% 0
Miscellaneous P/au
.lune 30, 2009 $3.40 1,193 100% $0June 30. 2010 3.025.165 100% 0June 30, 2011 2.902,359 100% 0
71

T CITY OF M1LPITASNotes to Basic Financial Statements
N(Y[E 11 - PERS JENSION PLAN (Continued) ICALPERS uses the market related value method of valuing the Plan’s assets. For the most recent actuarial
report, as of June 30, 2009, an investment rate of return of 7.75% is assumed, including inflation at 3%.
Annual salary increases are assumed to vary by duration of service. Changes in liability due to plan
amendments, changes in actuarial assumptions, or changes in actuarial methods are amortized as a levelpercentage of payroll on a closed basis over twenty years. Investment gains and losses are accumulated as
they are realized and approximately 6 percent of the net balance is amortized annually over a rolling thirty
year period.
The schedule of funding progress presents multi-year trend information about whether the actuarial value ofplan assets is increasing or decreasing over time relative to the actuarial accrued liability for benefits. l’he
Plans’ actuarial value (which differs from market value) and finding progress over the most recent three yearsavailable are set forth below at their actuarial valuation date of June 30:
Safety Plan:
Audited annual financial statements and ten-year trend information are available from CALPERS at P.O. Box
942709, Sacramento, CA 94229-2709. CALPERS usually reports information for each fiscal year seventeen
months after the end of that fiscal year.
Actuarial
Entry Age UnfundedValuation Value of Accrued (Ovcrfiinded)
Date Assets Liability Liabihtv2007 $146,015,172 $164,391,869 $18.3766972008 156,862,634 186,1 62.4 70 29,299,8362009 164.507.549 203,923.730 39,416,181
Miscellaneous Pin,,:
Actuarial
ValuationDate200720082009
FundedRatio
88.8%84.3%80.7%
FundedRatio
88.0%87.1%82.0%
AnnualCoveredPayroll
$16,020,54718,863,36718,838,475
AnnualCoveredPayroll
$21.421.22922,479.52121.969.787
Value ofAssets
$101,344,341110.710,907117,726.837
Unfunded(Overfunded)Liability as
% of Payroll114.707%155.327%209.232%
Unfunded(Overfunded)
Liability as0/ of Payroll
64.788%72. 840%
117.728%
Entry AgeAccruedLiability
$115,222.810127,085.071143.591.380
Unfunded(Overfunded)
Liability$13,878,469
16.374, 16425,864,543
II
72

CITY OF MILPITASNotes to Basic Financial Statements
NOTE 11 - PERS PENSION PLAN (Continued) ICALPERS has reported that the value of the net assets in the Plans held for pension benefits changed duringthe year ended June 30, 2009 (the most recent available) as follows:
Safety Miscellaneous
Beginning Balance 6/30/09 $156,862,634 $1 10,710,907Contributions received 6,339,309 5,407,121Benefits and Refunds Paid (7,605,191) (4,670,831)Miscellaneous Adjustments (155,861) (350,3 16)Expected Investment Earnings Credited 12,097,179 8,578,856
Expected Actuarial Value of Assets 6/30/09 $167,538,070 $119,675,737
Market Value of Assets 6/30/09 $120,098,440 $85,833,131
Actuarial Value of Assets 6/30/09 $164,507,549 $117,726,837
Additional disclosures will be included when made available by PERS.
B. Public Agency Retirement System
The Omnibus Budget Reconciliation Act of 1990 (OBRA) mandates that public sector employees who are notmembers of their employer’s existing retirement system as of January 1, 1992 be covered by either SocialSecurity or an alternative plan.
The City’s part-time, seasonal and temporary employees are covered under the Public Agency RetirementSystem (PARS), a defined contribution plan, which requires these employees to contribute 6% and the City tocontribute I.5% of the employees pay plus administration costs. The City’s required contributions of S 17,647and the employee’s required contributions of $70,584 were made during the fiscal year ending June 30, 2011.
NOTE 12- EMPLOYEE BENEFITS
A. Deferred Compensation Plan
City employees may defer a portion of their compensation under a City sponsored Deferred CompensationPlan created in accordance with Internal Revenue Code Section 457. Under this Plan, participants are nottaxed on the deferred portion of their compensation until distributed to them; distributions may be made onlyat temiination, retirement, death or in an emergency defined by the Plan.
The laws governing deferred compensation plan assets require plan assets to be held by a Trust for theexclusive benefit of plan participants and their beneficiaries. Since the assets held under these plans are notthe City’s property and are not sublect to City control. they have been excluded from these financialstatements.
B. Retiree Medical Benefits
The City provides postrelirement health care benefits to employees who retire in good standing from theCity after attaining the age of 50 and to certain employees who retire due to disability. As of June 30, 2011there were 206 participants receiving these health care benefits.
73

11
LiCITY OF MILPITAS
L Notes to Basic Financial Statements
12- EMPLOYEE BENEFITS (Continued) IDuring fiscal year 2008, the City implemented the provisions of Governmental Accounting Standards [1Board Statement No. 45, Accounting and Financial Reporting by Employers for Postemployment Benefits
Other Than Pensions. This Statement establishes uniform financial reporting standards for employers [1
providing postemployrnent benefits other than pensions (OPEB). The provisions of this statement are
applied prospectively and do not affect prior year’s financial statements. Required disclosures are
presented below.
The City joined the Calilbrnia Employers’ Retiree Benefit Trust (CERBT), an agent multiple-employer
plan administered by CALIERS, consisting of an aggregation of single-employer plans. The CERBT issues
a publicly available financial report that includes financial statements and required supplementary
information. That report may be obtained from the California Public Employees’ Retirement System,
CERBT, P.O. Box 942703, Sacramento, CA 94229-2703.
In order to qualify for posternployment medical and dental benefits an employee must retire from the City
and maintain enrollment in one of City’s eligible health plans. In addition, there are eligibility rules and
contribution requirements defined in the Memorandum of Understanding (MOU) with each employee
group. In the MOUs, the Benefit Cap is defined as not more than the single medical premium rate paid by
the City for active employees, and the Retiree Cap is 15% above the single Kaiser medical premium rate.
The eligibility rules for each MOU are summarized below.
UI
UI
I1‘3I
74
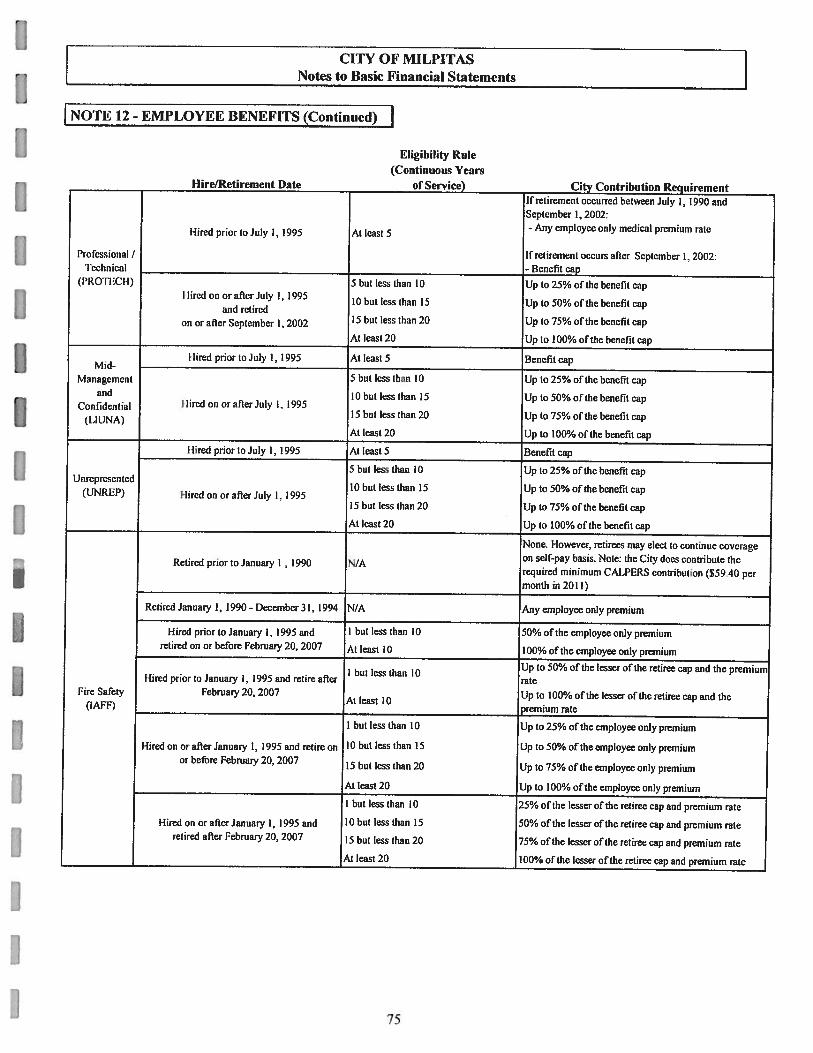
CflY OF MILPITASNotes to Basic Financial Statements
NOTE 12 - EMPLOYEE BENEFITS (Continued)
If retirement occurred between July 1, 1990 andSeptember I, 2002:- Any employee only medical premium rate[fired prior to July 1, 1995 At least 5
Professional / If retirement occurs after September I. 2002:1cchnical
- Benefit cap( P ROIl iCt 1) 5 but less than 10 Up to 25% of the benefit cap
I tired on or after July 1, 199510 but less than 15 Up 1050% of the benefit cap
and retiredon or after September 1, 2002 15 hut less than 20 Up to 75% of the benefit cap
At least 20 Up to 100% of the benefit cap
I tired prior to July 1, 1995 At least 5 Benefit capMid-
Management 5 hut less than 10 Up to 25% of the benefit capand to hut less than IS Up to 50% of the benefit cap
Confidential I lired on or after July 1, 199515 but less than 20 Up to 75% of the benefit cap(t.IUNA)At least 20 Up to 100% of the benefit cap
I lired prior to July I 1995 At least 5 Benefit cap
5 hut less than 0 Up to 25% of the benefit capUnrepresented
10 but less than 15 tip to 50% of the benefit cap(UNR1iP) I-fired on or alter July 1. 199515 but less than 20 Up to 75% of the benefit cap
At least 20 Up to 100% of the benefit cap
None. I lowever, retirees may elect to continue coverageon self-pay basis. Note: the City does contribute theRetired prior to January 1 1990 N/Arequired minimum CI.PERS contribution ($5940 permonth in 2011)
Retired January 1, 1990- December 31. 1994 N/A Any employee only premium
Hired prior [0 January 1, 1995 and I but less than 10 50% ofthe employee only premiumretired on or before February 20, 2007 Al least 10 100% of the employee only premium
Up to 505’o of the lesser oithe retiree cap and the premiumI hut less than 10I Fred prior to January 1, 1995 and retire utter rateFire Safety february 20, 2007 Up to 100% of the lesser ofttic retiree cap and theAt least 10(tAFt) premium rate
1 but less than 10 Up to 25% of the employee only premium
I-tired on or after January 1, 1995 and retire on 10 but less than 15 tip to 50% of the employee only premiumor hefbre February 20, 2007 15 bat less than 20 Up to 75% of the employee only premium
Al least 20 Up to 100% of the employee only premium
I but less than 1(1 25% of the lesser of the retiree cap and premium rate
tlircd on or amer January I, 1995 arid tO but less than 15 50% of the lesser of the retiree cap and premium rateretired alter February 20. 2007 15 hut less than 20 75% of time lesser of the rctirce cap and premium rate
At least 20 100% of the lesser ofihe retiree cap and premium rate
Eligibility Rule(Continuous Years
Hire/Retirement Date of Service) City Contribution Requirement
75

CITY OF MILPI [AS
Notes to Basic Financial Statements
j NOTE 12 - EMPLOYEE BENEFITS (Continued) IIlligibilit3’ Rule
(Continuous Years
I lire/Retiremeni Date of Sen’ice) City Contribution Requirement
None. I lowever, retirees may elect to continue coverage
on self-pay basis. Note: the City does contribute theRetired Prior to January I , 1989 N/A
required minimum CALPERS contnbution ($59.40 per
month in 2011)
If retirement occurs on or before June 30, 2003
- Any single, medical premium ratePolice I Iircd prior to January 1, I 9% At least 5
If retirement occurs on or after July I, 2003(MI’OA)
- up to the retiree cap
1 hut less than 9 full years of service Up to 25% of the retiree cap
9 hut less than 14 full years of service Up to 50% of the retiree capI lired on or after January I, 1996
14 but less than 19 full years ofservicc Up to 75% olthe retiree cap
Al least 19 full years of service Up to 100% of the retiree cap
If retirement occurs on or before July 17, 1 989
- NoneIf retirement occurs between July 17,1969 and March 16,
I tired prior to June 30. 1996 At least 5 2003
- Any employee only medical premium rate
If retirement occurs after March 18, 2003Fmploycc -Benefit cap
Association
(MEA) Up to 25% of the lowest cost employee only premium but
I but less than tO no more than the lowest employee only single rate paid by
the City
I lircd on or after June 30. 996 10 but less than 15 Up to 50% of the lowest cost employee only premium
15 but less than 20 Up to 75% of the lowest cost employee only premium
At least 20 Up to 100% of the lowest cost employee only premium
If retirement occurs before November 27, 2007
-Any employee only medical premium rateHired poor to June 30. 1995 At least 5 If retirement occurs on or after November 27. 2007
-Benefit capSupervisors
5 but less than 10 Up to 25% of the benefit cap(MSA)
Flired on or after tune 30, 1995 and rcirc after 10 hut less than 15 l.Ipto 50% of the benefit cap
November 27. 2007 15 but less than 20 Up to 75% o the benefit cap
At least 20 Up to 100% of the benefit cap
Funding Policy and Actuarial Assumptions
The City’s policy is to prefund these benefits by accumulating assets with CERBT discussed above
pursuant to the City’s annual budget approved by Council. The annual required contribution (ARC) for the
year ended June 30, 2011 was determined as part oFa July 1,2011 actuarial valuation using the enn-y age
normal actuarial cost method. This is a projected benefit cost method, which takes into account those
benefits that are expected to be earned in the future as well as those already accrued. The actuarial
assumptions included (a) 7.61% investment rate of return, (b) 3.25% projected annual salaiy increase, and
(c) health care cost trend rates of 5.50 7.60% for medical and 3.0% for dental.
I
76 I

CiTY OF MILPITASNotes to Basic Financial Statements
NOTE 12- EMPLOYEE BENEFITS (Continued) IProjections of benefits for financial reporting purposes are based on the substantive plan (the plan asunderstood by the City and plan members) and include the types of benefits provided at the time of eachvaluation and the historical pattern of sharing of benefit costs between the City and plan members to thatpoint. The actuarial methods and assumptions used include techniques that smooth the effects of short-termvolatility in actuarial accrued liabilities and the actuarial value of assets. Actuarial calculations reflect along-term perspective and actuarial valuations involve estimates of the value of reported amounts andassumptions about the probability of events far into the future. Actuarially determined amounts are subjectto revision at least biannually as results are compared to past expectations and new estimates are madeabout the future. The actuarial value of assets is based upon the balance in the CERBT Trust. The City’sOPEB unfunded actuarial accrued liability is being amortized as a level percentage of projected payrollusing a 30 year amortization period on a closed basis. The actuarial study indicates that as of July 1,2011,the actuarial accrued liability was estimated to be $48,698,709.
Funding Progress and Funded Status
Generally accepted accounting principles permit contributions to be treated as OPEB assets and deductedfrom the Actuarial Accrued Liability when such contributions are placed in an irrevocable trust orequivalent arrangement. During the fiscal year ended June 30, 2011, the City contributed the ARC of$3,494,309 to the Plan. As a result, the City has calculated and recorded the Net OPEB Asset/Liability,representing the difference between the ARC, amortization and contributions, as presented below:
Annual required contribution $3,494,309Adjustment to annual required contribution 0
Annual OPEB cost 3,494,309Contributions made (3,494,309)
(Decrease) increase in net OPEB obligations 0
Net OPEB obligation (asset) June 30, 2010 0
Net OPEB obligation (asset) June 30, 2011 $0
The actuarial accrued liability (AAL) representing the present value of future benefits, included in theactuarial study dated July 1, 2011, amounted to $48,698,709. The AAL is partially funded since assets havebeen transferred into CERBT. The City’s prior year contributions, the current year annual requiredcontribution, along with investment income net of current year premiums resulted in assets with CERBT of$19,032,986 as olJune 30, 2011, which partially reduced the unfunded actuarial accrued liability.
The Plan’s annual required contributions and actual contributions for fiscal years ended .lune 30, 2009. 2010and 2011 are set forth below:
Percentage ofAnnual Net OPER
Annual Actual OPEB Cost ObligationFiscal Year OPEB Cost Contribution Contributed (Asset)
June 30, 2009 $2.901,441 $2,901,441 100% $0June 30, 2010 3,356,836 3,356,836 100% 0June 30, 2011 3,494,309 3,494,309 100% 0
77
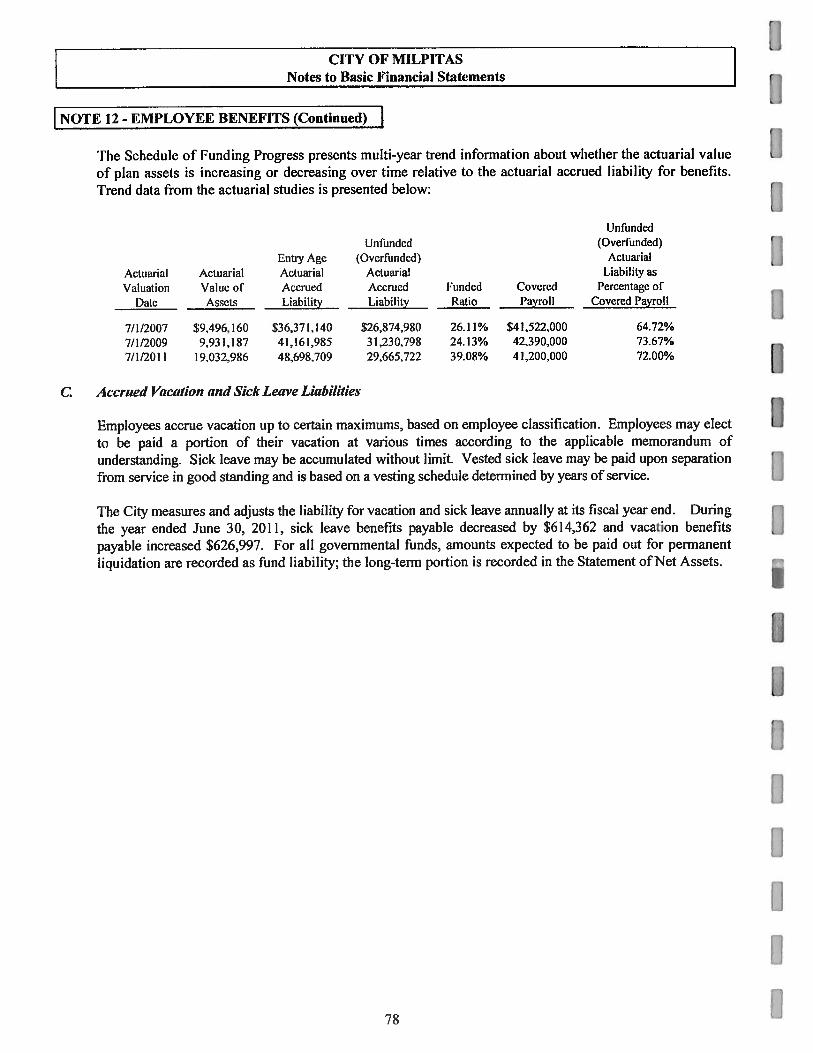
CITY OF M1L1ITASNotes to Basic Financial Statenients
[iENEFITS (Continued) I‘Ihe Schedule of Funding Progress presents multi-year trend information about whether the actuarial value
of plan assets is increasing or decreasing over time relative to the actuarial accrued liability for benefits.
Trend data from the actuarial studies is presented below:
UnfundedUnfunded (Ovcrfundcd)
Entry Age (Overfunded) Actuarial
Actuarial Actuarial Actuarial Actuarial Liability as
Valuation Value of Accrued Accrued Funded Covered Percentage of
Dale Assets Liability Liability Ratio Payroll Covered Payroll
7/1/2007 $9,496,160 $36,371,140 $26,874,980 26.11% $41,522,000 64.72%
7/1/2009 9.931,187 41,16] .985 31,230,798 24.13% 42.390,000 73.67%
7/1/2011 19,032,986 48,698.709 29,665.722 39.08% 41,200.000 72.00%
C. Accrued Vacation and Sick Leave Liabilities
Employees accrue vacation up to certain maximums, based on employee classification. Employees may elect
to be paid a portion of their vacation at various times according to the applicable memorandum ofunderstanding. Sick leave may be accumulated without limit. Vested sick leave may be paid upon separation
from service in good standing and is based on a vesting schedule determined by years of service.
The City measures and adjusts the liability for vacation and sick leave annually at its fiscal year end. During
the year ended June 30, 20 1, sick leave benefits payable decreased by $614,362 and vacation benefitspayable increased $626,997. For all governmental funds, amounts expected to he paid out for permanent
liquidation are recorded as fund liability; the long-term portion is recorded in the Statement of Net Assets.
IF:
78 1
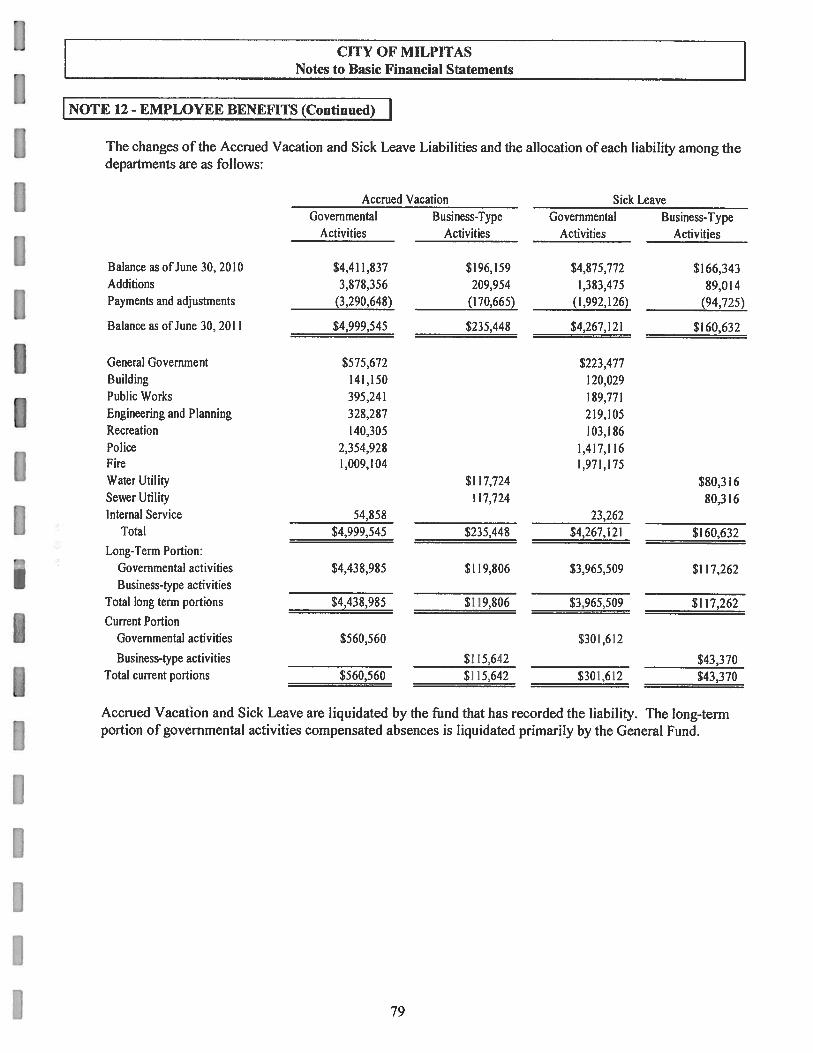
I CITY OF MLPITASNotes to Basic Finaicia Statements
NOTE 12 - EMPLOYEE BENEFITS (Continued) I‘l’he changes of the Accrued Vacation and Sick Leave Liabilities and the allocation of each liability among thedepartments are as follows:
Accrued Vacation Sick LeaveGovernmental Business-Type Governmental Business-Type
A clivities Activities Activities Activities
Balance as ofiune 30. 2010 $4.41 1,837 SI 96,159 $4.875,772 $1 66,343Additions 3,878,356 209,954 1,383,475 89,014Payments and adjustmenls (3,290,648) (170,665) (1,992,126) (94.725)
Balance as ofiune 30. 2011 $4,999,545 $235,448 $4,267,121 $160,632
General Government $575,672 $223,477Building 141,150 120,029Public Works 395,241 189,771Engineering and Planning 328,287 219,105Recreation 140,305 103.186Police 2354.928 1,417,116Fire l.009.104 1.971.175WaterUtility $1 17.724 $80,316Sewer Utility 117,724 80.316Internal Service 54,858
___________________
23,262
__________________
Total 54.999.545 $235448 $4,267,121 $160,632
Long-Term Portion:Governmental activities $4.438.985 $1 19,806 $3,965,509 $117,262Business-type activities
____________________ ____________________ ___________________
Total long term portions $4,438,985 $119,806 $3,965,509 $117,262Current Portion
Governmental activities $560,560 $301,612
Business-type activities
_________________
$1 15,642
________________
$43,370Total current portions $560,560 $115,642 $301,612 $43,370
Accrued Vacation and Sick Leave are liquidated by the fund that has recorded the liability. The long-termportion of governmental activities compensated absences is liquidated primarily by the General Fund.
79
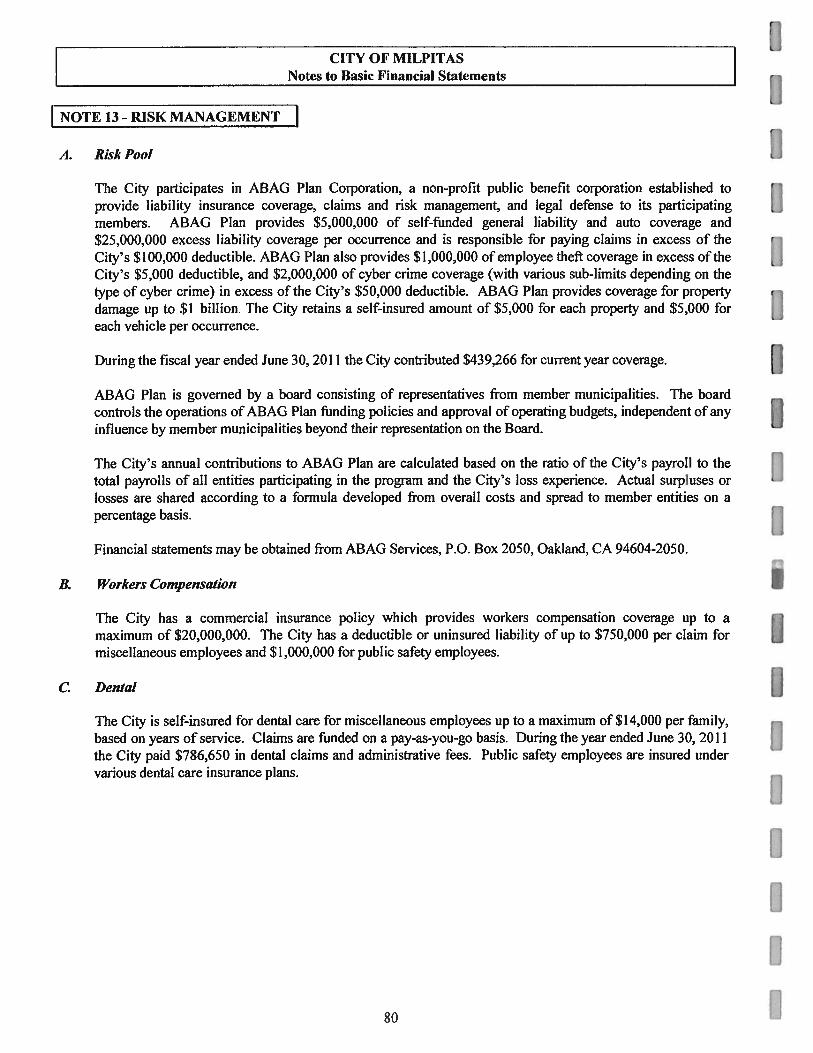
C[fl’ OF MILPITASNotes to Basic Financial Statements
NOTE 13 - RiSK MANAGEMENT
A. Risk Pool
The City participates in ABAG Plan Corporation, a non-profit public benefit corporation established toprovide liability insurance coverage, claims and risk management, and legal defense to its participatingmembers. ABAG Plan provides $5,000,000 of self-funded general liability and auto coverage and$25,000,000 excess liability coverage per occurrence and is responsible for paying claims in excess of theCity’s $100,000 deductible. ABAG Plan also provides $1,000,000 of employee theft coverage in excess of theCity’s $5,000 deductible, and $2,000,000 of cyber crime coverage (with various sub-limits depending on thetype of cyber crime) in excess of the City’s $50,000 deductible. ABAG Plan provides coverage for propertydamage up to $1 billion. The City retains a self-insured amount of $5,000 for each property and $5,000 foreach vehicle per occurrence.
During the fiscal year ended June 30, 2011 the City contributed $439,266 for current year coverage.
ABAG Plan is governed by a board consisting of representatives from member municipalities. The boardcontrols the operations of ABAG Plan funding policies and approval of operating budgets, independent of anyinfluence by member municipalities beyond their representation on the Board.
The City’s annual contributions to AI3AG Plan are calculated based on the ratio of the City’s payroll to thetotal payrolls of all entities participating in the program and the City’s loss experience. Actual surpluses orlosses are shared according to a formula developed from overall costs and spread to member entities on apercentage basis.
Financial statements may be obtained from ABAG Services, P.O. Box 2050, Oakland, CA 94604-2050.
B. Workers compensation
The City has a commercial insurance policy which provides workers compensation coverage up to amaximum of $20,000,000. The City has a deductible or uninsured liability of up to $750,000 per claim formiscellaneous employees and $1,000,000 for public safety employees.
c. Dental
The City is self-insured for dental care for miscellaneous employees up to a maximum of$l4,000 per family,based on years of service. Claims are funded on a pay-as-you-go basis. During the year ended June 30, 2011the City paid $786,650 in dental claims and administrative fees. Public safety employees are insured undervarious dental care insurance plans.
[1
1]
II
IIgo
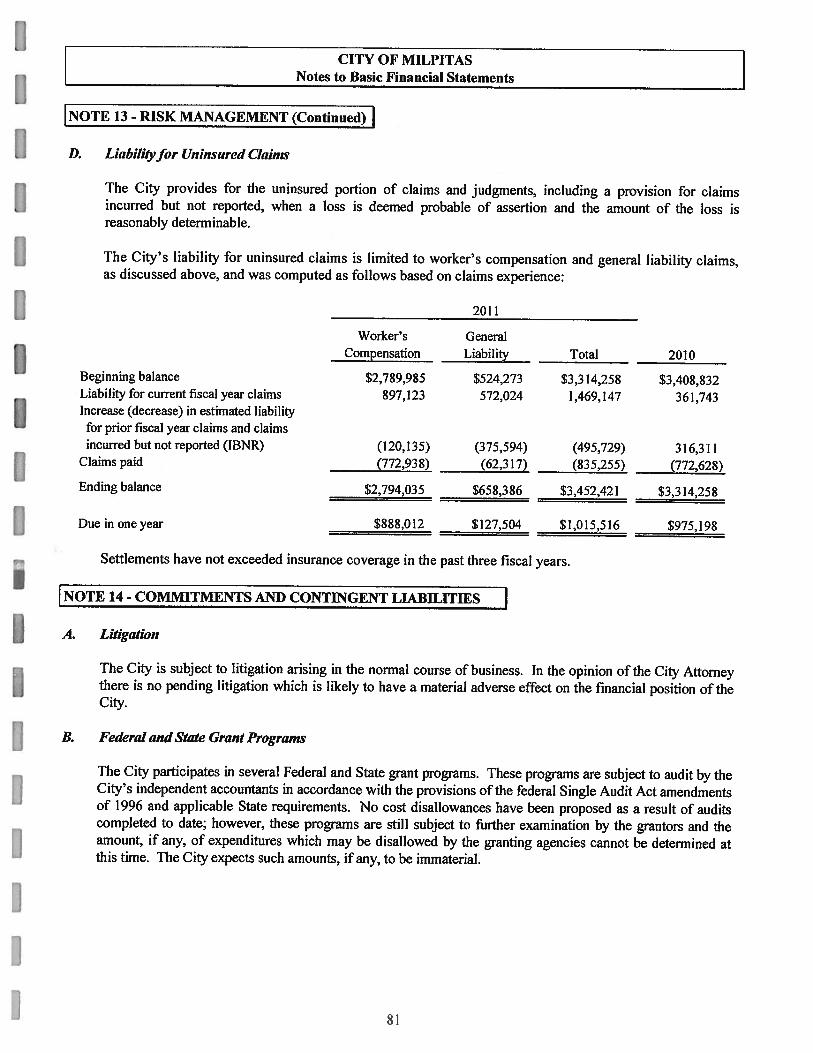
1 CITY OF MILPITAS
L Notes to Basic Financial Statements
NOTE 13 - RISK MANAGEMENT (Continued)
I). Liabilityfor Uninsured Claims
The City provides for the uninsured portion of claims and judgments, including a provision for claimsincurred but not reported, when a loss is deemed probable of assertion and the amount of the loss isreasonably determinable.
The City’s liability for uninsured claims is limited to worker’s compensation and general liability claims,as discussed above, and was computed as follows based on claims experience:
2011
Worker’s GeneralCompensation Liability Total 2010
Beginning balance $2,789,985 $524,273 $3,314,258 $3,408,832Liability for current fiscal year claims 897,123 572,024 1,469,147 361,743Increase (decrease) in estimated liabilityfor prior fiscal year claims and claimsincurred but not reported (IBNR) (120,135) (375,594) (495,729) 3 16,3 11
Claimspaid (772,938) (62,317) (835,255) (772,628)
Ending balance $2,794,035 $658,386 $3,452,421 $3,314,258
I)ueinoneyear $888,012 $127,504 $1,015,516 $975,198
Settlements have not exceeded insurance coverage in the past three fiscal years.
NOTE 14- COMMITMENTS AND CONTINGENT LiABILITIES j
A. Litigation
The City is subject to litigation arising in the normal course of business. In the opinion of the City Attorneythere is no pending litigation which is likely to have a material adverse effect on the financial position of theCity.
B. Federal and State Grant Programs
The City participates in several Federal and State grant programs. These programs are subject to audit by theCity’s independent accountants in accordance with the provisions of the federal Single Audit Act amendmentsof 1996 and applicable State requirements. No cost disallowances have been proposed as a result of auditscompleted to date; however, these programs are still subject to further examination by the grantors and theamount, if any, of expenditures which may he disallowed by the granting agencies cannot be determined atthis time. The City expects such amounts, if any, to be immaterial.
81
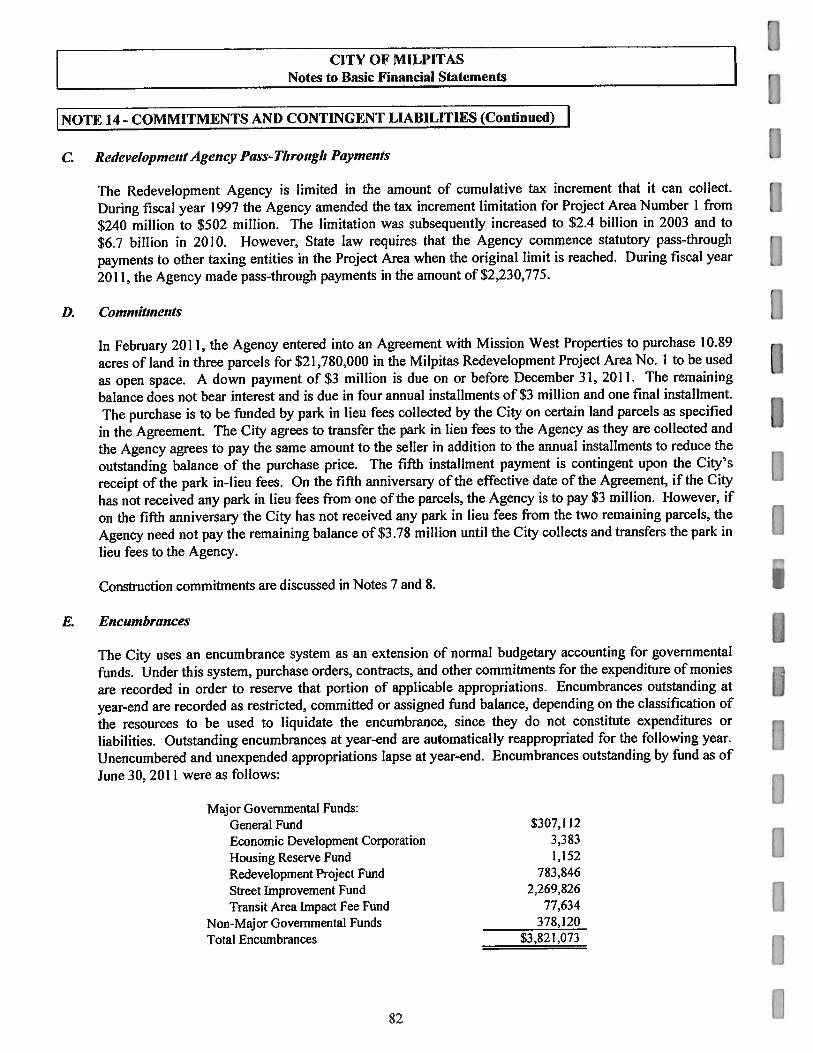
I_ CITY OF MILPITASNotes to Basic Financial Statements
1NOTE 14-COMMITMENTS ANt) CONTiNGENT LIABILITIES (Continued)
. Redevelopinelit Agency Pass.- Through Payments
The Redevelopment Agency is limited in the amount of cumulative tax increment that it can collect.
During fiscal year 1997 the Agency amended the tax increment limitation for Project Area Number I from
$240 million to $502 million. The limitation was subsequently increased to $2.4 billion in 2003 and to
$6.7 billion in 2010. However, State law requires that the Agency commence statutory pass-through
payments to other taxing entities in the Project Area when the original limit is reached. During fiscal year
2011, the Agency made pass-through payments in the amount of $2,230,775.
D. C’on,n,itments
In February 2011, the Agency entered into an Agreement with Mission West Properties to purchase 10.89
acres of land in three parcels for $21,780,000 in the Milpitas Redevelopment Project Area No. 1 to be used
as open space. A down payment of $3 million is due on or before December 31, 2011. The remaining
balance does not bear interest and is due in four annual installments of $3 million and one final installment.
The purchase is to be funded by park in lieu fees collected by the City on certain land parcels as specified
in the Agreement. The City agrees to transfer the park in lieu fees to the Agency as they are collected and
the Agency agrees to pay the same amount to the seller in addition to the annual installments to reduce the
outstanding balance of the purchase price. The fifth installment payment is contingent upon the City’s
receipt of the park in-lieu fees. On the fifth anniversary of the effective date of the Agreement, if the City
has not received any park in lieu fees from one of the parcels, the Agency is to pay $3 million. However, if
on the fifth anniversary the City has not received any park in lieu fees from the two remaining parcels, the
Agency need not pay the remaining balance of $3.78 million until the City collects and transfers the park in
lieu fees to the Agency.
Construction commitments are discussed in Notes 7 and 8.
E. Encumbrances
The City uses an encumbrance system as an extension of normal budgetary accounting for governmental
funds. Under this system, purchase orders, contracts, and other commitments for the expenditure of monies
are recorded in order to reserve that portion of applicable appropriations Encumbrances outstanding at
year-end are recorded as restricted, committed or assigned fund balance, depending on the classification of
the resources to be used to liquidate the encumbrance, since they do not constitute expenditures or
liabilities. Outstanding encumbrances at year-end are automatically reappropriated for the following year.
Unencumbered and unexpended appropriations lapse at year-end. Encumbrances outstanding by fund as of
June 30. 2011 were as follows:
Major Governmental Funds:General Fund S307,l 12Economic Development Corporation 3,383Housing Reserve Fund 1,152
Redevelopment Project Fund 783,846
Street improvement Fund 2269,826Transit Area Impact Fee Fund 77,634
Non-Major Governmental Funds 378,120
Total Encumbrances $3,821,073
82 I
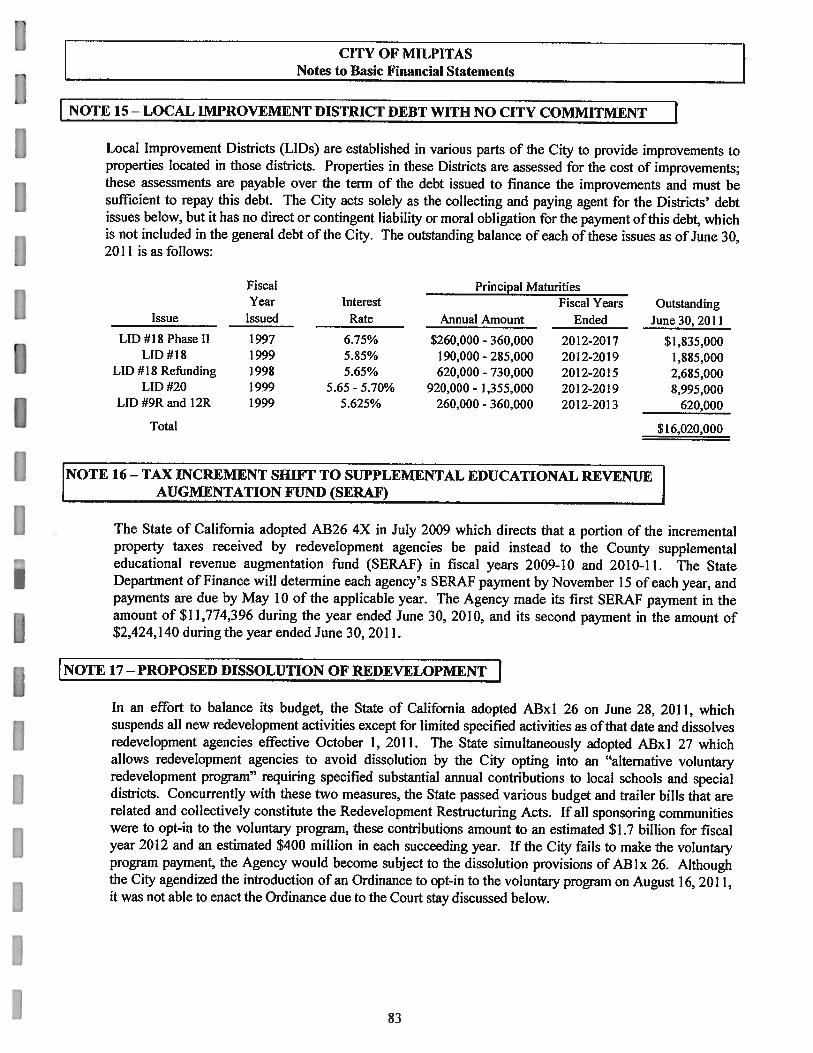
CITY OF MILPITASNotes to Basic Financial Statements
r)TE 15- LOCAL IMPROVEMENT DISTRICT DEBT WITH NO CiTY COMMITMENT ILocal Improvement Districts (LIDs) are established in various parts of the City to provide improvements toproperties located in those districts. Properties in these Districts are assessed for the cost of improvements;these assessments are payable over the term of the debt issued to finance the improvements and must besufficient to repay this debt. The City acts solely as the collecting and paying agent for the Districts’ debtissues below, but it has no direct or contingent liability or moral obligation for the payment of this debt, whichis not included in the general debt of the City. The outstanding balance of each of these issues as of June 30,2011 is as follows:
Fiscal Principal MaturitiesYear Interest Fiscal Years Outstanding
Issue Issued Rate Annual Amount Ended June 30, 2011
LID #18 Phase 11 1997 6.75% $260,000 -360,000 2012-2017 $1,835,000LID#18 1999 5.85% 190,000-285,000 2012-2019 1,885,000
LID #18 Refunding 1998 5.65% 620,000-730,000 2012-2015 2,685,000LiD #20 1999 5.65 - 5.70% 920,000- 1,355,000 2012-2019 8,995,000
LID #9R and 12R 1999 5.625% 260,000-360,000 2012-2013 620,000
Total $16,020,000
NOTE 16- TAX 11CREMENT SI-LIFT TO SUPPLEMENTAL EDUCATIONAL REVENuEAUGMENTATION FUND (SERAF)
The State of California adopted AB26 4X in July 2009 which directs that a portion of the incrementalproperty taxes received by redevelopment agencies be paid instead to the County supplementaleducational revenue augmentation fund (SERAF) in fiscal years 2009-10 and 2010-Il. The StateDepartment of Finance will determine each agency’s SERAF payment by November 15 of each year, andpayments are due by May 10 of the applicable year. The Agency made its first SERAF payment in theamount of $11,774,396 during the year ended June 30, 2010, and its second payment in the amount of$2,424,140 during the year ended June 30, 2011.
NOTE 17 - PROPOSED DISSOLUTION OF REDEVELOPMENT IIn an effort to balance its budget, the State of California adopted ABxI 26 on June 28, 2011, whichsuspends all new redevelopment activities except for limited specified activities as of that date and dissolvesredevelopment agencies effective October 1, 2011. The State simultaneously adopted ABxI 27 whichallows redevelopment agencies to avoid dissolution by the City opting into an “alternative voluntaryredevelopment program” requiring specified substantial annual contributions to local schools and specialdistricts. Concurrently with these two measures, the State passed various budget and trailer hills that arerelated and collectively constitute the Redevelopment Restructuring Acts. If all sponsoring communitieswere to opt-in to the voluntary program, these contributions amount to an estimated $1.7 billion for fiscalyear 2012 and an estimated $400 million in each succeeding year. If the City fails to make the voluntaryprogram payment, the Agency would become subject to the dissolution provisions of ABIx 26. Althoughthe City agendized the introduction of an Ordinance 10 opt-in to the voluntary program on August 16, 2011,it was not able to enact the Ordinance due to the Court stay discussed below.
83
CITY OF MILPITASNotes to Basic Financial Siatements
[NorE 17-- PIWPOSEI) DISSOLUTiON OF REDEVELOPMENT (Continued) IOn July 18, 2011, the California Redevelopment Association, the League of California Cities and others
challenged the validity and constitutionality of ABIx 26 and 27 to the California Supreme Court on
numerous grounds, including that the acts violate certain provisions of the California Constitution. On
August 11, 2011, as modified on August 17, 2011, the California Supreme Court agreed to hear the case and
issued a partial stay of ABxI 26 and a full stay of ABxI 27, but the stay did not include the section ofABxl
26 that suspends all new redevelopment activities, It is anticipated that the Court will render its decision
before January 1 5, 2012, the date the first voluntary program payment is due.
The suspension provisions of ABxI 26 prohibit all redevelopment agencies from a wide range of activities,
including incurring new indebtedness or obligations, entering into or modifying agreements or contracts,
acquiring or disposing of real property, taking actions to adopt or amend redevelopment plans and other
similar actions, except actions required by law or to carry out existing enforceable obligations, or to
preserve Agency assets, as defined in ABxl 26. During the suspension period, an agency is required to
prepare an Enforceable Obligation Payment Schedule no later than August 29, 2011, that allows it to
continue to pay certain obligations. The Agency adopted its Enforceable Obligation Payment Schedule on
August 23, 2011.
In addition, the suspension provisions require the State Controller to review the activities of all
redevelopment agencies to determine whether an asset transfer between an agency and any public agency
occurred on or after January 1, 2011. If an asset transfer did occur and the public agency that received the
asset is not contractually committed to a third party for the expenditure or encumbrance of the asset, the
State Controller is required to order the asset returned to the redevelopment agency. The State Controller’s
Office has not yet provided any information about the timing or the process for this statewide asset transfer
review.
The Agency is currently subject to the suspension provisions as described above. These facts indicate that
there is more than a remote possibility the Agency may not continue as a going concern beyond October 1,
2011. The continuation of the Agency beyond October 1, 2011 will initially depend upon whether the
Supreme Court rules in favor of the petitioners. There are three possible consequences to the Agency from
a decision of the Supreme Court. when it is rendered:
1. If the Supreme Court determines that both ABIx 26 and ABIx 27 are valid, then the City will
consider whether it will enact an ordinance to opt-in to the alternative voluntary redevelopment
program. If enacted, the City would be required to make annual payments to the County Auditor-
Controller and the Agency would no longer be subject to the suspension provisions. The State
Department of Finance calculated the City’s Voluntary Program payment for fiscal year 2012 to be
$13,819,770.
2. If the Supreme Court determines that both ABIx 26 and ABIx 27 are valid and the City decides not
to participate in the alternative voluntary redevelopment program, or if the Supreme Court
detennines that ABIx 26 is valid, but ABIx 27 is not valid, the Agency will continue to be subject
to the suspension provisions and would be dissolved in accordance with certain provisions ofABIx
26. Upon dissolution, all assets and obligations of the Agency would he transferred to a successor
agency.
Li
84 1
CITY OF MILPITASNotes to Basic Financial Statements
NOTE 17— PROPOSED DISSOLUTION OF REDEVELOPMENT (Continued) I3. lIthe Supreme Court determines that both ABIx 26 and ABIx 27 are invalid, the Agency wonld no
longer be subject to the suspension provisions and would continue in existence under CaliforniaRedevelopment Law as it existed prior to the enactment of AB lx 26 and AB lx 27.
As of September 30, 2011, the Supreme Court has not ruled on the case and the Agency is subject to thesuspension provisions as discussed above.
85

f SUPPLEN’IENTARY INFORMATION 1The supplementary information provides budget comparisons for major governmental funds which are not generalFund or major special revenue funds. GASB 34 requires this information for any major governmental fund that hasadopted budget.

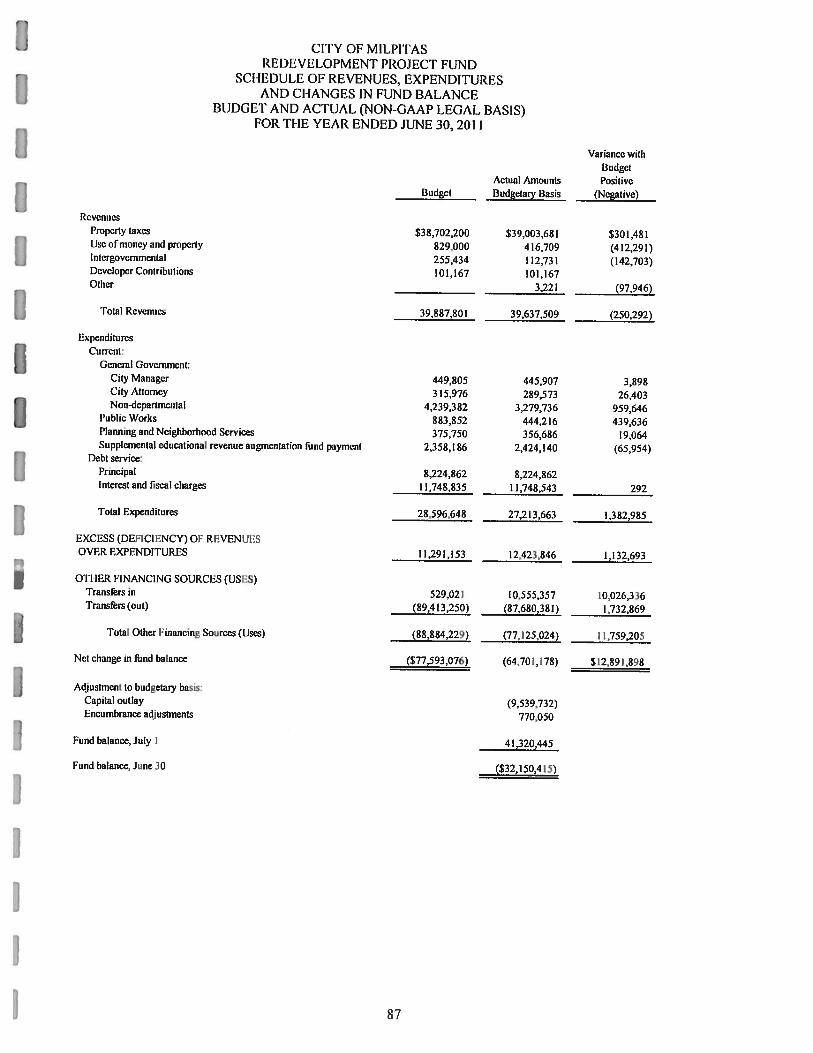
CItY OF MILPI’I’ASREI)1 VEI .OPMENT PROJEC’I’ FUND
SCHEDULE OF REVENUES, EXPENDITURESAND CIJANGES IN FUND BALANCE
13U1)GET AND ACTUAL (NON-GAAP LEGAL BASIS)FOR THE YEAR ENDED JUNE 30, 2011
Variance withBudget
Actual Amounts PositiveBudget Budgetary Basis (Negative)
RevenuesProperty taxes $38,702,200 $39,003,681 $301,481Use of money and property 829.000 416.709 (412,291)Intergovernmental 255,434 112,731 (142,703)Developer Contributions 101,167 101,167Other 3,221 (97,946)
‘l’otal Revenues 39,887,801 39,637,509 (250,292)
ExpendituresCurrent
General Government:City Manager 449,805 445,907 3,898City Attorney 315.976 289,573 26.4 03NOn-departmental 4,239,382 3.279,736 959,646
I’ublie Works 883,852 444,216 439,636Planning and Neighborhood Services 375,750 356,686 19,064Supplemental educational revenue augmentation fund payment 2.358,186 2,424,140 (65,954)
Debt service:Principal 8,224,862 8.224,862Interest and fiscal charges 11.748.835 11,748,543 292
Total Expenditures 28,596,648 27,213,663 1.382,985
EXCESS (DEFICIENCY) OF RI’VENUFSOVER EXPENDI’[’URES 11,291,153 12.423,846 1,132,693
OIlIER FINANCING SOURCES (USES)Transfersin 529.021 10,555,357 10.026,336‘l’ransfers (out) (89.4 13.250) (87,680,381) 1,732,869
Total Other Financing Sources (Uses) (88,884,229) (77,125,024) 11,759,205
Nctehange in fund balance ($77,593.076) (64,701,178) $12,891,898
Adjustment to budgetary basis:Capital outlay (9.539,732)Encumbrance adjustments 770,050
Fund balance, July 1 41,320,445
Fund balance. June30 ($32,150,415)
87
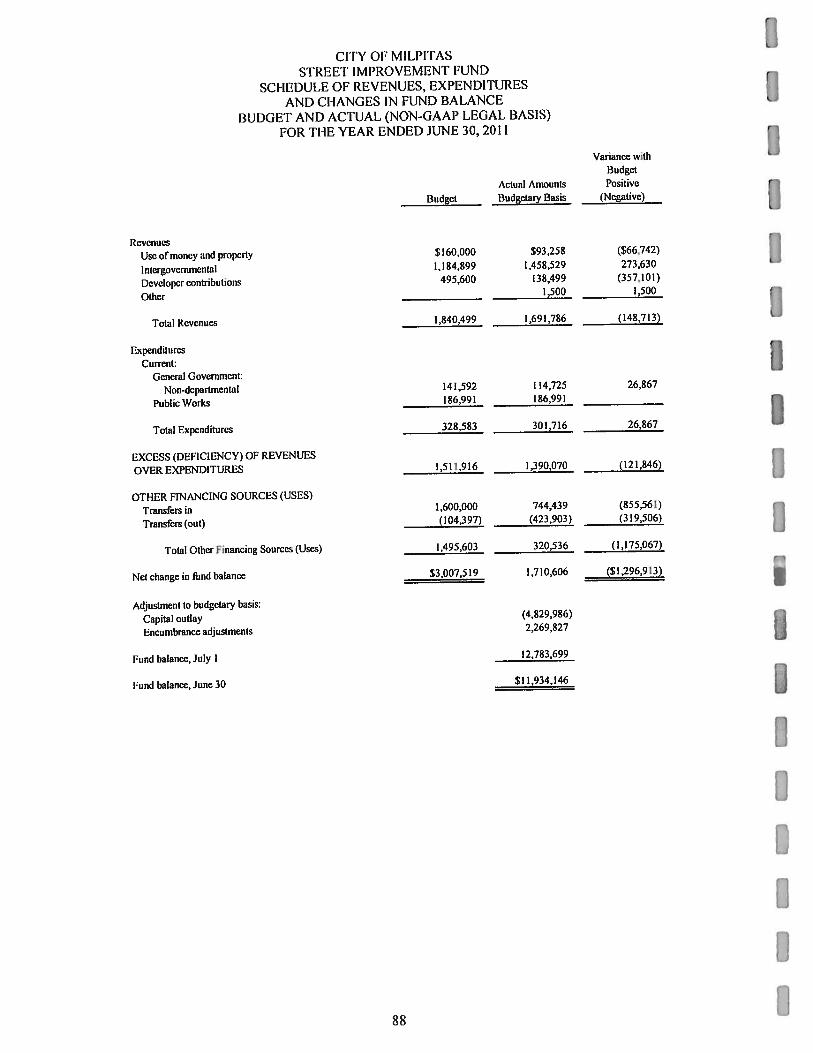
(i’l’Y 01’ MILPI’l’ASS’I’RELI’ IMPROVLMLN’F FUNI)
SCI lhl)ULE OF REVENUES, EXPENDITURES
ANI) CI IANGES IN FUNI) BALANCE
BUDGL’I’ AND AC’I’UAL (NON-GAAP LEGAL BASIS)
FOR TIlE YEAR ENDED JIJNE 30, 2011
Variance with
Budget
Actual Amounts Positive
Budget Budgetary Basis (Negative)
Revenues
Use of money and property $160,000 $93,258 ($66.742)
lntergovcrnmcntal 1,184,899 1,458,529 273,630
Developer contributions 495,600 138,499 (357,101)
Other 1,500 1,500
Total Revenues 1,840,499 1,691,786 (148,713)
Expenditu rca
Current:General Government
Non-departmental 141,592 114.725 26,867
Public Works 186,991 186,991
Total Expenditures 328,583 301.716 26,867
EXCESS (DEFICIENCY) OF REVENUES
OVER EXPENDITURES 1,511,916 1,390,070 (121,846)
OTHER FINANCING SOURCES (USES)
Transfers in 1,600,000 744,439 (855,561)
Translërs (out) (104,397) (423,903) (319,506)
Total Other Financing Sources (Uses) 1,495,603 320,536 (1,175,067)
Net change in fund balance $3,007,511) 1,710.606 ($1,296,913)
Adjustment to budgetary basis:
Capital outlay (‘.829,986)
Encumbrance adjustments 2,269,827
Fund balance, July I 12,783699
lund balance, June30 $11,934,146
88
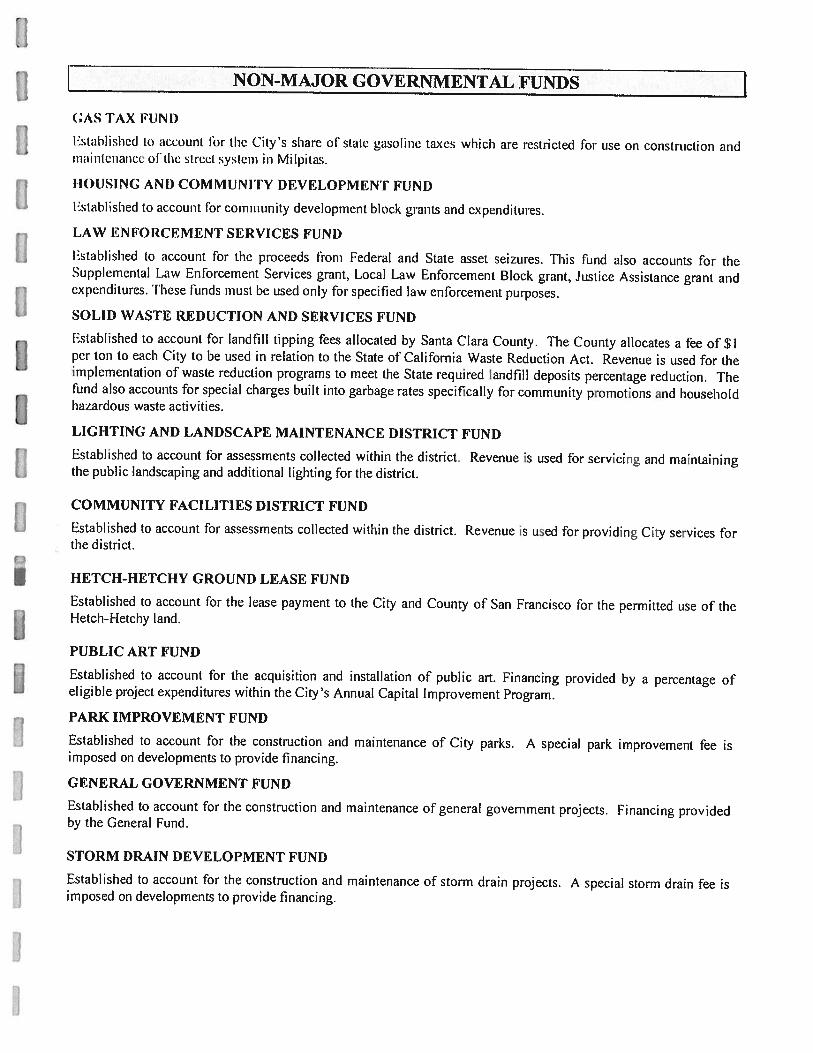
NON-MAJOR GOVERNMENTAL_FUNI)S-___
(;AS TAX FLINI)
Established to account br the City’s shai-e oF state gasohne taxes which are restricted For LISC n construction andinaiiiteiiaiice of the street System in Milpitas.
HOUSING AND COMMUNITY DEVELOPMENT FUNI)
Established to account 11w community development block grants and expenditures.
LAW ENFORCEMENT SERVICES FUND
Established to account For the proceeds From Federal and State asset seizures. This Fund also accounts For theSupplemental Law EnForcement Services grant. Local Law EnForcement Block grant, Justice Assistance grant andexpenditures. These Funds must be used only for specified law enForcement purposes.
SOLID WASTE REDUCTION AND SERVICES FUND
Established to account for landfill tipping Fees allocated by Santa Clara County. The County allocates a fee of$lU per ton to each City to be used in relation to the State of California Waste Reduction Act. Revenue is used for theimplementation oF waste reduction programs to meet the State required landfill deposits percentage reduction. TheFund also accounts for special charges built into garbage rates specifically For community promotions and householdhazardous waste activities.
LIGHTING AND 1,ANDSCAPE MAINTENANCE DISTRICT FUND
O Established to account For assessments collected within the district. Revenue is used thr servicing and maintainingthe public landscaping and additional lighting For the district.
COMMUNITY FACILiTIES DISTRICT FUND
Established to account for assessments collected within the district. Revenue is used ibr providing City services thrthe district.
I1ETCH-HETCHY GROUNI) LEASE FUNI)
Established to account For the lease payment to the City and County of San Francisco for the permitted use of theHeich-1-letchy land.
PUBLIC ART FUND
Established to account for the acquisition and installation of public art. Financing provided by a percentage ofeligible project expenditures within the City’s Annual Capital Improvement Program.
IARK IMPROVEMENT FUND
Established to account for the construction and maintenance oF City parks. A special park improvement Fee isimposed on developments to provide financing.
GENERAL GOVERNMENT FUND
Established to account for the construction and maintenance of general government projects. Financing providedby the General Fund.
STORM DRAIN DEVELOPMENT FUND
Established to account for the construction and maintenance oF storm drain projects. A special storm drain fee isimposed on developments to provide financing.

(‘IlY OF MIt .151’I’AX
NON—MAJOR (iOVFRNMLN’I’AI, FL NI)S
COMBINING BAt .ANCI. SI IkLl’S
JUNU 30,2011
SPI ClAl. RI1VFNLJL FUNDS
I .ighting and
lousrng and law Solid Waste Landscape Community
CommuniLy Fnforcement Reduction and Maintenance Facilities
Gas ‘fax Development Services Services District District
ASSI iTS
Cash and inveslmentsavailable for operations $1,879,360 $3,009 $311360 $1,357,137 $459,594 $207,962
Receivables:Accounts 28,094
Due from other ovcrnments 117,450 26,361 66,494 1,235
Interest 2,253 535 1.116 4.306 1,306 342
Loans receivable 3,368.435
t’repaids, materials, supplies and deposits
______________
LOSS
______________
1.034 754 358
‘total Assets $1,881,613 $3,400,484 $338,837 $1,457,155 $461,654 $209,897
l.1AI3ILJTI 135
Accounts payable $120,544 $211 $21,445 $496 $8,209
Accrued payroll 1,019 4,590 3,159 3,150
Deferred revenue 99,520
Refundable deposiLs
________________ ________________ ________________
18.843
________________ ________________
‘fotal 1,iabilities
_____________
21,563 99,731 44,878 3,655 1,359
FUND BALA}1C13
lund BalancesNonspendahlc 1,055 1.034 754 358
Restricted $1,881,613 3.367,866 239.106 1,411,243 457,245 198,18(3
Assigned
_______________ _______________ _______________ _______________ _______________ _______________
mliii Fund Balances .881 613 3,368,923 239.106 1.412,277 457,999 98,538
Total l.iabilities and Fund l3alanccs $1,881,613 $3,490,484 $338837 $1,457, 55 $461 ,65 $209,897
90
CA1I1’AL 1>ROJEC1’S FUNDS
ThtaII Ictcli-I lctchy General Storm Nonrnajor
Ground Public Park Government Drain GovernmentalLease Art Improvement Project Development Funds
$1,694,241 $I,348.085 $9,403,946 $793,948 $892.853 $18,351,495
28,09483.393 294,933
2,016 4,606 28.257 3.003 3,121 50.9513,368,435
_____________ _____________ _____________ _____________ _____________
3,201
$1,696,257 $1,352,691 $9,515,596 $796,951 $895,974 $22,097.1 09
$7,000 $29,252 $15,136 $9,594 $2! 1,8871,057 418 13,393
99,520
______________ _____________ _____________ _____________ _____________
18,843
____________
7,000 30.309 15136 10.012 343,641
3.201$ 1,696.257 9,485,287 885,962 19.622,759
_____________
1,345,691
_____________
781,815
_____________
2.127.506
1,696,257 1,345,691 9.485,287 781,8 5 885,962 21,753,466
$1 .696.257 $1,352.69 $9,515,596 $796951 $895974 $22.097. 109
91

C’VFV 01: MI I .I’li’AS
NON-MAJOR (1OVERNMEN’FAI. Fl JNI)S
(‘DIvIIlINING S’I’A’FEMEN’FS OF REVI:NIJES. l:XPENI)l’l’I IRIS
AND ChANGES IN FUND BAI.AN(’LS
FOR fl ii: YEAR ENDED JUNE 30. 201
SPECIAL REVENUE FUNDS
Lighting and
I lousing & Solid Waste Landscape Community
Community l.aw Enforcement Reduction and Maintenance Facilities
Gas ‘fax Development Services Services District District
REV EN UI1S:Sales taxesOther taxes
$411,165 $307,500 $299,995
Usc of money and property $10,836 $2,980 $4,126 17,724 5,816 2,1 II
Intergovernmental 1,571,404 432,148 111,470 140,816
Charges for services361.260
Developer contributionsOther
3,050
Total Revenues 1,582,240 435,128 115.596 934,015 313,316 302,106
I Xl’l N Dt’FURES:Current:
General Govcnimenl 35.523
Public Works512,820 234,605 170.186
Engineering and l’Ianning 422.392
Poliec45,035
Capital outlay
______________ ______________
74006
_____________
2.225
____________
Total Expenditures
______________
457,915 119,041 512,820 236,830 170,186
EXCESS (DElICt ENCY) 01 REVENUES
OVER EXPENDITURES 1.582,240 (22.787) (3.445) 421,195 76,486 131,920
Oil ILk FINANCING SOURCES (USES)
‘I’ransfcrs inl’ranskrs (out)
(260,197)
_____________
(36,947)
Total OIlier Financing Sources (Uses) (260.197)
_____________
(36.947)
NET Cl lANGE IN FUND BALANCES 1.582,240 (22,787) (3,445) 160,998 76.486 94,973 1FUND BALANCES AT BEGINNING OF YEAR 299,373 3,391,708 242,551 1,251,279 381,513 103.565
FIJNI) BALANCES AT END OF YEAR $1,881,613 $3,368,921 $239,106 $1.4 12,277 $457,999 $I98,538
921

______________
(‘API’FAI._PR()JFC1’S_FUNDS
totalIelch-t tetchy General Storm Nonma jot
Ground Public Park Government Drain GovernmentalLease Art Improvement Project Development Funds
$1,018,660$66,993 $9,780 $52,529 $11,410 $12,493 196,798
105,881 2,361,719361,260
2,695,030 2,695,030
__________ __________ ___________ ___________ ___________
3,050
66.993 9,780 2,853,440 11,410 12.493 6.636,517
27,376 56,251 119,15074,784 17,745 L010,140
422,39245,035
____________ ____________
559,488 88,959 22,800 747,478
27,376 56,251 559,488 163,743 40,545 2,344.195
39,617 (46.471) 2,293952 (152,333) (28.052) 4292,322
107,112 35.000 142,112- (2,715)
___________ ____________ ___________ ___________
(299,859)
(2,715) 107,112
___________ ___________
35,000 (157,747)
36,902
60,641 2,293,952 (152,333) 6948 4,134,575
1,659,355 285,050 7,191,335 934,148 879,014 17618,891
$1,696,257 $1,345,691 $9,485,287 $78 1,815 $885,962 $2 1,753.466
93
(‘DY (iF MN .l’I’IAS
lIt II )(il.’lFI ) NON—MAJOR Ft IN Dx
(‘OMIIINING S(’llIl)1il.k OF REVENUES, EXPENI)l’l’IJRES
ANI) (‘I IANGES IN FUND BALANCES
111 JDGVI ANI) A(’l( Al, (NON-GAAP I FOAl. BASIS)
FOR II IF VI AR ENI)ld) it JNJ 30, 201 I
hOUSING ANI) COMMUNI’I’Y
GAS ‘FAX I)EVELOPMEN’I
Variance Variance
Actual Amounts Positive Actual Amounts Positive
Budget Budgetary Basis (Negative) l3udget Budgetary Basis (Negative)
RI VENL iFSOther taxesUse olmoney and property $5,000 $10,836 $5,836 $2,980 $2,980
Intergovernmental 1,100,000 1,571,404 471,404 $678,914 432,148 (246,766)
Charges for servicesOther
‘Fotal Revenues 1,105,000 1,582,240 477,240 678,914 435,128 (243,786)
FXPIN1)I’IlJRESCurrent:
General Government:Finance 1 8.514 17,113 1,401
Non-departmental 22.785 21,793 992
Public WorksPlanning and Neighborhood Services 649.532 658,932 (9.400)
Police
Total Expenditures 690,831 697,838 (7.007)
IXCESS (DE1:ICIENCY) OF RlVFNVFS
OVER EXPENDITURES 1,105.000 1,582.240 477,240 (11,917) (262,710) (250,793)
OTHER FINANCING SOURCES (USES)
Tratsfers inTransfers (out) (1,100,000) 1,100,000
‘l’olaI Other Financing Sources (Uses) (1.100,000) 1,100,000
NET Cl IANGF. IN FUND BALANCES $5.000 1,582.240 $I.577.240 ($11,917) (262.710) ($250,793)
ADJUSTMEN’I TO BUDGETARY BASIS:
Expenditures capitalized for (iAAP purposes 236.540
Capital outlayEncumbrance adjustments 3,383
Fund balances at beginning of year 299,373 3,391.708
Fund balances at end ofycar $1,881.61 3 $3.368.92 I
III
94 1

SOLII) WASIE REI)UCTION LIGII’l’JNG ANI) LANI)SCAPJNGLAW ENR)RCEMEN’I’ SERVICES ANI) SERVICES MAINTENANCE DISTRICT
Variance Variance VarianceActual Amounts Positive Actual Amounts Positive Actual Amounts Positive
Budget Budgetary Basis (Negative) Budget Budgetary Basis (Ncgativc) Budget Budgetary Basis (Negative)
$399,000 $411,165 $12,165 $312,400 $307,500 ($4,900)$6,000 $4,126 ($1,874) 20,000 17,724 (2,276) 4.000 5,816 1,81659,983 111,470 51,487 117,000 140,816 23,816
380,000 361,260 (18,740)
____________ ______________ ____________ ____________
3,050 3,050
____________ ______________ ____________
65,983 115,596 49.613 916,000 934,015 18,015 316.400 313,316 (3.084)
716,014 517,221 198,793 358,660 234,605 124,055
97.211 51.702 45,509
__________ ____________ __________ __________ ____________ __________
97,211 51,702 45,509 716.014 517,221 198,793 358,660 234.605 124,055
(31.228) 63,894 95,122 199.986 416,794 216,808 (42,260) 78,71! 120.971
____________ ______________ ____________
(260,197) (260,197)
____________ ____________ ______________ ________________________ ______________ ____________
(260,197) (260,197)
____________ ____________ ______________ ____________
($31,228) 63,894 $95,122 ($60,211) 156,597 $216,808 ($42,260) 78.711 $120,971
(74,006) (2.2256,667 4,401
242,551 1.251,279 381,513
$239,106 $1,412,277 $457,999
(Continued)
95

‘FIT ( )f Mu I’Ti’AXRI IDGI’I’EI) NON—MAJOR 11 INDS
(‘OMBININ(i XCI III)Ul.I Ol R VItNLJES, IXPIND1I1JRISANI) UI IANGIX IN IUNI) BAI.AN(’ES
III II)GE’l’ ANI) AU’ILJAI. (NON—GAAI’ I.E(IAI. BASIS)FOR ‘Ii JE YEAR ENI)EI) J tiNE 30, 201 1
COMMUNITY FACILITiES DISTRICT I IETCI I-I IltICI-IY GROUND LEASEVariance Variance
Actual Amounts Positive Actual Amounts PositiveBudget Budgetary Basis (Negative) Budget Budgetary Basis (Negative)
REVENUESOther taxes $300,000 $299,995 ($5)Use of money and property 2,111 2,111 $24,000 $66,993 $42,993lntcrgovcrnmcntalCharges for servicesOther
Total Revenues 300,000 302,106 2.106 24,000 66,993 42.993
EX113ND1TURESCurrent:
General Government:FinanceNon-departmental 28,000 27,376 624
Public Works 209,071 170,186 38.885Planning and Neighborhood ServicesPolice
Total Expenditures 209,071 170,186 38.885 28,000 27.376 624
EXCESS (DEFICIENCY) OF REVINUESOVER EXPEND1’FURES 90,929 131,920 40,991 (4,000) 39,617 43.617
OTI1ER FINANCING SOURCES (USES)Transfers inTransibra (out) (36.947) (36.947)
____________
(2.715) (2.715)
____________
Total Other Financing Sources (Uses) (36,947) (36,947)
____________
(2.715) (2,715)
____________
NET Cl LANGE IN FUNI) BALANCES 553.982 94.973 $40,991 ($6,715) 36.902 $43,617
ADJUSTMENl’IO BUDGEIARY BASIS:Expenditures capitalized for GAAI purposesCapital outlayEncumbrance adjustments
Fund balances at beginning of year 103,565 1.659.355
Fund balances at end ofyear 5198.538 $1.696.257
96
PUBLiC AR’I’ I’O’lALSVariance Variance
Actual Amounts Positive Actual Amounts PositiveIludget Budgctaiy Basis (Negative) Budget ftudgeiaty Basis (Negative)
$l,0l1.400 $1,018,660 $7,260$17,000 $9,780 ($7,220) 76,000 120,366 44,366
1,955,897 2.255,838 299.941380,000 361.260 (18,740)
3,050 3,050
17,000 9,780 (7,220) 3,423.297 3.759,174 335,877
18,514 17,113 1.40176.047 56.251 19,796 126,832 105,420 21.412
1.283.745 922,012 361.733649,532 658.932 (9,400)
__________
97,211 51,702 45.509
76,047 56,251 19.796 2,175,834 1,755,179 420,655
(59.047) (46.471) 12.576 1.247.463 2.003,995 756.532
100,000 107,112 7,112 100.000 107,112 7,112
______________________
(1,399,859) (299,859) 1.100.000
100.000 107.112 7.112 (1,299.859) (192,747) 1.107.112
$40,953 60,641 $19,688 ($52.396) 1,811.248 $1,863,644
236,540(76.231)14,451
1,285,050 8,614,394
$1,345,691 $10,600,402
97

II
u
IH
fl: f: r j fN; F 41 N COB PD B TE 1)
JANUARY 26, 1954
L 1GASB Statement 34 requires that Agency Funds, the only Fiduciary funds the City has, be pi-esented separately fromthe Government-wide and Fund financial statements.
Agency Funds account for assets held by the City as agent lbr individuals, government entities, and non-publicorganizations. These funds include the following:
EMPLOYEE BENEFITS FUND
Established to account lbr specific negotiated employee benefits.
SENIOR ADVISORY COMMISSION FUND
Established to account for the fund raising activities ofthe Commission.
LOCAL IMPROVEMENT I)ISTRICT (LID) FUNDS
Established to account for debt service reserves of Local Improvement Districts (LIDs) for which the City acts asadministrator and paying agent. The City is not obligated for the debt issued by the LIDs.

CI’I’Y OF MILP[FASAGENCY FUNDS
S’FATEMENTS OF CHANGES IN ASSETS AN!) LIABILITIESI’OR THE YEAR ENDED JUNE 30, 20!!
13a1:ince BalanceJune 30, 201(1 Additions Deductions June 30, 2011
Lmployee Benefit
Assets
Cash and investments available for operations $1,941,292 $530472 $389212 $2,082,552Receivables:Interest 10,585
_____________
2.755 7,830
Total Assets $1,951,877 $530,472 $391,967 $2,090,382
Liabilities
Refundable deposits $ 1,951.877 $530,472 $391,967 $2,090,382
Total Liabilities $1,951,877 $530,472 $391,967 $2,090,382
Senior Advisory Commission
Assets
Cash and investments available for operations $11,674 $2,691 $5 161 $9,204Receivables:Interest 59 34 59 34
‘fotal Assets $11,733 $2,725 $5,220 $9,238
liabilities
Relundabledcposits $11,733 $2,725 $5.220 $9,218
Total 1.iahilities $11,733 $2,725 $5,220 $9,238
LII) #18 - Reassessment and Refunding
Assets
Cash and investments available for operations $1 ,1036 If $1,484,615 SI ,435962 $1 452,269Cash and investments held by trustees 1,209.119 54354 47,865 1.215.608ReceivableInterest 3,785 2,664 3.785 2,664
‘l’otal Assets $2,616,520 $1,541,633 $1,487,612 $2,670,541
Liabilities
Duelo Local Improvement l)istricts $2,616,520 $1,541,633 $1,487,612 $2,670,541
Total Uabilities $2,616,520 $1,541,633 $1 .487612 $2670.54 I
99
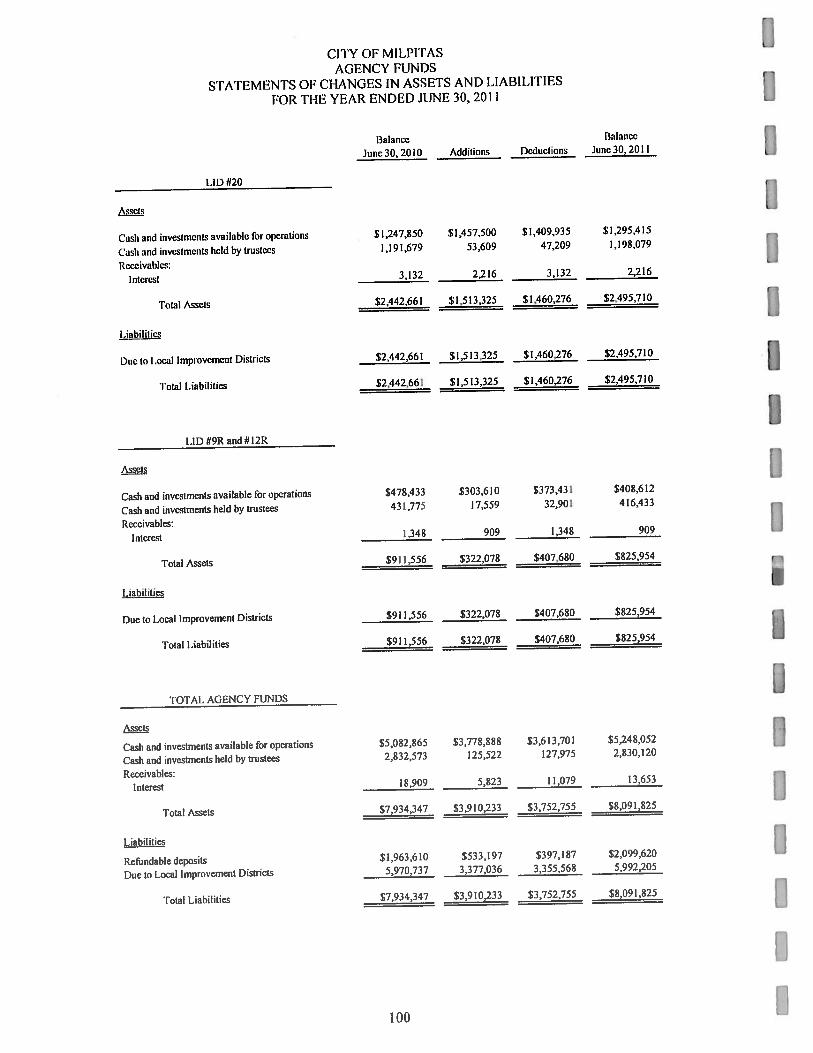
(YTY OF MILPFI’ASAGENCY FUNDS
S’I’ATEMENTS OF CHANGES IN ASSETS AND LIABILITIES
FOR TI IF YEAR ENDED JUNE 30, 201 1
l3alanec Balance
June 30, 2010 Additions Deductions June 30, 2011
LID //20
Assets
Cash and investments available for operations $1,247,850 $1,457,500 $1,409,935 $1,295,415
(‘ash and nvestmeiils held by trustees 1,191,679 53,609 47,209 1,198,079
Receivables.
Interest 3,132 2,216 3,132 2,216
‘l’olal Assets $2,442,661 $1,513,325 $1,460,276 82495,710
Liabilities
Due to I .ocal Improvement Districts 82442.661 $1,513,325 $1,460,276 $2,495.7 10
‘total liabilities $2,442,661 $1.51 3,325 $1,460,276 82,405310
LID #9R and#l2R
Assets
Cash and investments available tar operations $478,433 $303,610 8373.431 $408,612
Cash and investments held by trustees 431,775 17.559 32,90! 416,433
Receivables
Interest 1,348 909 .348 909
‘Total Assets $911,556 $322,078 $407,680 8825.954
I. ahil lies
i)ue to Local Improvement Dislrits $911,556 8322.078 8407,680 8825,954
‘total liabilities $911,556 $322,078 $407,680 $825,954
‘tOTAl. AGFNCY FUNDS
Assets
Cash and investments available for operations $5,082,865 83,778.888 83,613,701 $5,248,052
Cash and investments held by trustees 2,832,573 125,522 127,975 2,830,120
Receivables:Interest 18,909 5.823 11,079 13,653
‘total Assets $7,934,347 $3.91 0,233 $3,752,755 88,091.825
Liabilities
Refundable deposits 81,963,610 $533,197 $397,187 $2,099,620
Due to Local Improvement 1)/studs 5,970,737 3,377,036 3,555,568 5,992.205
l’otal 1,/abilities $7,934,347 $3,910,233 $3,752,755 $8,091,825
I
100 1

[ STATISTICAL SECTION 1this
part ol the City’s (‘wurpreheosive Annual Financial Report presents detailed inforn ni n as a context for understamlino,what the in forniat ion in the [inane al statements, note disclosures, and req u ired supp lemen tory in form at on says about the City’soveral tinanc al health - In contrast to the financial sect n, the slat st crl sect ion in format on is not subject to independent and it.
Eliniticial irt’iids
Iliese schedules contain trend information to help the reader understand how the City’s financial performance and well beingia’ c changed over Ii me:
Net Assets Schedule IChanres in Net Assets Schedule 2Fund Balances, Governmental Funds Schedule 3Changes in Fund Balance, Governmental Funds Schedule 4
ReI’L’ilue capacity
These schedules contain information to help the reader assess the City’s must significant local revenue source, the property tax:
Assessed Value and Actual Value of Taxable Property-- Schedule 5Direct and Overlapping Property Taxes Rates — Schedule 6Principal Property Taxpayers— Schedule?Property Tax Levies and Collections — Schedule 8
] Debt capacityThese schedules present information to help the reader assess the affordability of’ the City’s current levels of outstanding debtand the City’s ability to issue additional debt in the future:
Ratios of Outstanding Debt by Type— Schedule 9Bonded Debt Pledged Revenue Coverage, Redevelopment Agency l’ax Allocation Bonds- Schedule 10Computation of’ Direct and Overlapping Debt — Schedule IILegal Debt Margin Information—- Schedule 12
Denwgraphic and Economic Infornutiwn‘I’hese schedules oflir demographic and economic indicators to help the reader understand the environment v ithin which theCity’s financial activities take place:
Installment Payment Coverage, Sewer Certificates of Participation— Schedule 13Bimonthly Sewer Rates by Customer Class-- Schedule 14Demographic and Economic Statistics-- Schedule ISPrincipal Employers — Schedule 16Taxable Sales by Category — Schedule I 7Direct arid Overlapping Sales Tax Rates— Schedulel8Principal Sales Tax Payers - Schedule 19
‘I Operating Infornwtwn
Theseschedules contain service and infrastructure data to help the reader understand how the infhrrnation in the City’s financial
report relates to the services the City provides and the activities it performs:
A uthorized Fuff-Time Equivalent Employees by Function/Program — Schedu Ic 20Operating Indicators by Function/Program -- Schedule 21Capital Asset Statistics by Function/Program --- Schedule 22
SourcesUnless othersisc noted, the information in these schedules is derived from the Comprehensive Annual Financial Reports for therelevant year. The City implemented GASB Statement 34 in 2002; schedules presenting governnien1-s dc information includeinformation beginning in that year.
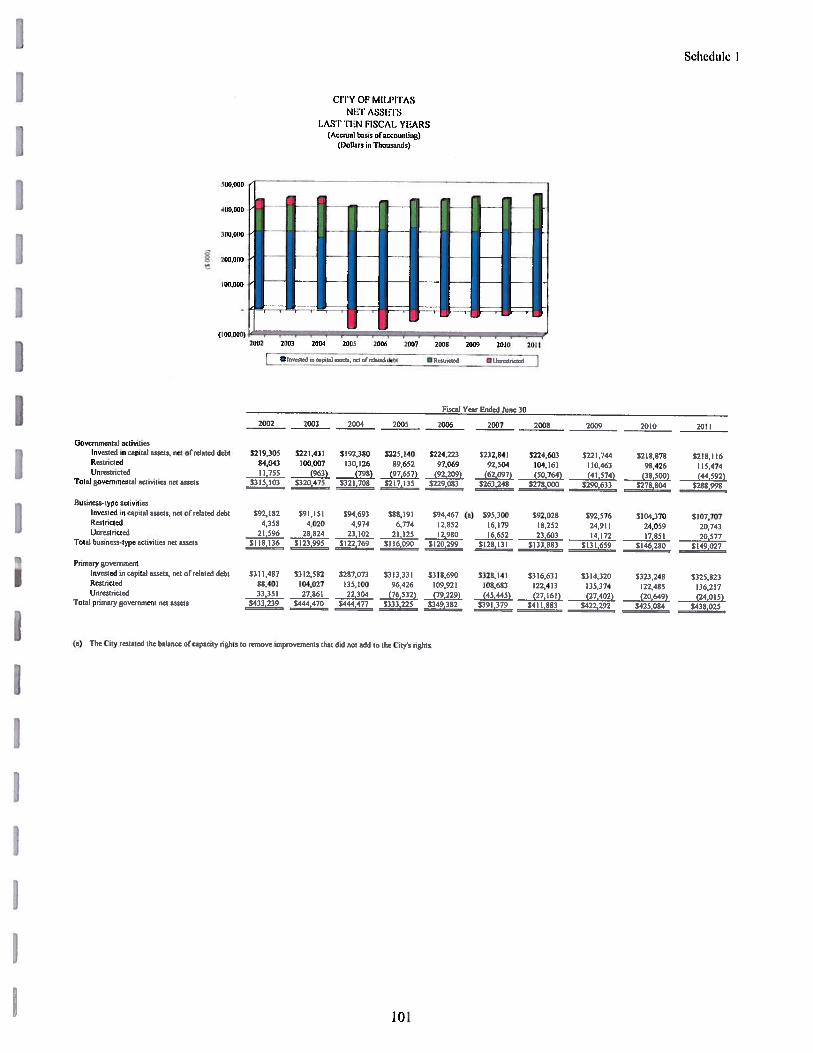
Schedule I
(ii VOl Mliii I ASNI I ASSLIS
LAS r ri N FISCAL YLARS(Accnt,il basis ofaccountuig)
(Dollars in I lious.iruls)
500 III))) 1
TT[iflflJ(tOO 01)11) ii,’
2)0)2 200) 2)104 2005 201)6 2007 2008 21)01) 201)1 20)1
C mfh01mi,hj Z”i 1
Fiscal Year I oiled June 30
2002 2003 2004 2006 2006 2007 2008 2009 2010 2011
Govt’ntroenial activitiesitiveslert in capital assets, net of related debt $219,309 $221431 $192 300 $229.40 $224 223 $232041 $224,603 $221,744 $210,878 $210, 116Restorted 84,043 100.007 110,126 05692 97,069 92,904 104 16) 110,463 90,426 11547’)Unrestricted 11,755 (963) (790) (97 1,67) (92 209) (62(197) (50 764) (41.574) (18 600) (44,992)
ToI,il governmental aC6sstIen net assets $315,103 $320 476 5321 700 $217116 $229 083 $263 248 5270 (0.10 5290 633 5270 004 5288 998
flasirtess.typc ,tulrvrtIes
Invested in capital assets, net of related debt $92,182 $91,151 $94,693 $80,161 $94,467 (a) $96,300 $92,020 $92,570 $104,370 $107,707l{cslricterl 4,358 4,020 4,974 6,774 2,852 16,179 8,252 24,911 24,059 20,743Uitreslrtcted 21,596 28,824 23,102 21,125 12,980 16,652 23,603 14,172 7,85) 20,577
Total buvness.lype activities net assets $118,136 5123,995 $122,769 $116,090 $120,299 $128,131 $133,883 $131,659 $146,200 $149 027
Priritaty govcrniuei’t
Invested iii capital assets, net of related debt $311,487 $312,502 $287,073 $313,331 5318,690 5328 4) 5316,631 $314,320 $323,240 $325,023Restricted 0040) 04,027 136,100 96426 109,92) 00,603 122 4)3 135,374 122,486 136,217Unrestricted 33,351 27,06) 22)04 (76 5)2) (79 2265 (45,445) (27,161) (27,402) (20 649) ç24 0)9)
rolal ptltttaty government net assets $433,239 $444 470 5444.477 5333 225 5319 182 $391,879 5411 883 5422.292 5429 004 5438 025
(a) The (.riy reslaled the balance of capacity ng)tts 10 remove improvements Ihat did not add to the (.11(15 rights
101

Schedule 2
CITY OE MII.I’I’FASCl ANC ‘S IN NI T ASSITSI,AS’l’I’CNI1ISCAI. YCARS
(HernIal lnirsrs ,rI aecnr,,nntrrng)
I l)ollnw ri ‘l’lurnsinnds)
Frac,,) Year Errded June 30
2002 200.) 2004 2.005 200), 2007 200X 2.00’) 2010 2.011
I’.IIrL’IIrC’I
(ir,vern,,nerrhhl ,,clrv,Iles
(ierrerul (i,rve,n,nenl $10,687 $13,178 $13243 $17,412 $113.65! $16,297 $18,130 $18,184 $33,535 (c) $21,474 (c)
Iluildung and Sith’Iy 2,348 2,512 2,017 2,048 2,195 2,334 2,1,26 2,40! 1,972 1,904
l’ubl,c Works I 7,85! 18,131 17,537 I 7,71)4 17,156 20,647 20,745 9,1.05 22,84] 16,777
Plurrrung and Ne,1’Jrborliond Services 8,549 7,156 7,114 7,116 7,453 2,396 3.239 3,24’) 2,874 2,155
Sinks and Rrcrcal,o,, 3,852 ‘1,21’) 4,246 4,170 ‘1,266 7,30! (,527 1,5 18 6,096 6,52’)
I’ol,ce I6’165 ‘1,59.1 19,575 8,773 20,473 21.452 22,140 22,514 22,771 22,66!
I’,re 11,353 4,293 3,865 14,440 14,301 4)29 15,411 15,260 14,748 5,005
Payne’,) mdc, develoj,er ,,,;reeinerrts 210 98 ‘1,384
,nteresl on Lonng’l’enm Debt 4,289 ‘1.724 ‘3.82’) ‘1,378
____________
‘1,4)’) .534 5,402 ‘3,570 9571
Iota! llOveIoifleflI.II activ,I,cs expenses 75,1,03 42,’)04 87.42), ‘11,0’!’) ‘11,959 ‘14,175 , 00,1,52 “7.1 II II 4,10’) ‘11,201
IIusnrcss’typc aCl,V,ties
Water Utility 8,375 8,583 9,877 9,668 9,837 0,673 11,567 12.545 11.7813 12.766
Recycled Wnlcr Utilily Cr6 208 255 247 328 337 481 576 476 470
Sewer Urilily ,_,,,,,,,,,3(n9 J_ 1,040 7,047 8,210 8,626 12,312 8,750 0,240
Total bnsinevs.lype ,rct)VitieH expenses 15,575 l),,21)7 I S,’155 7,212 1’),220 20,674 25,433 _22,_’‘1.01,,! pr,nnnarygoaernnmeill expense’) _S’i(),,,, S’It),17’t $101.12.! SI0’l,0’)4 $111.17! SI 1 33)5 $121121, $122,566 5135,10.) SI 5,1.2’)
Progr,riri Itevemimics
Govern,nerrl,rI acl,v,Iies
CIr,,,ges for $eIxxCes
Ciener,,t Government $465 $437 $860 5401, $580 $662 $996 $956 $1,165 $1.07!
l)ruldrn,g ,nnd Safely 1,951 1,305 l,’188 2,899 5,800 5,02’) 4,194 2,897 2,0.11 2,823
l’,,bl,e Works 285 320 307 311 744 2,8t7 2,410 1,996 2,571 1,82)’
Planning and Ne,gbhorIr,,od Services ‘113 ‘101 1,185 1678 2,412 .131, .35’) 358 1132 13’)
Parks and Recreclron 1,226 1.382 1,391 1,482 1,496 1,599 .1,63 1,655 1,642 1,662
l’,,Irc,, 087 I,l’I0 1,273 1,693 I 132 1,406 1.151 1.425 1,091 1,213
bre 524 4’IO 76), 305 .070 1,109 1.144 1.108 1,137 1,210
O1rcralorg grants )rnlI CD,,), ,buI,ans r,,098 ),6’)7 4,11)7 3.780 4,689 4,600 4,6)7 4,920 3,892 4.869
Cupilal grants mcI eorrlr,bol,ons 8,52! 8,124 11,770 12.012 12.97! 6,056 15,2.12 9,801 8,840 5704
‘ala! govmn,ner,t .,cl,v,l,cs prn)’,rarn revc,,ncs 21,066 17,811, 25,237 25,066 29,594 31,714 32,071, 25.116 22,55! 20,51,7
llusnrress’type ,nct,v,t,es
Charges for servIces
Water Utilily 10,148 10,779 12,265 2,430 13,224 14,523 14,937 13,873 14,051 15,20!
Recycled Water Utility 680 747 878 1,017 1,086 1.203 1.323 1,288 1,261) 1,300
Sewer Uttity 7,826 (.547 7.472 8,253 8,966 9,833 0,041 9,849 0,393 11,401,
Operating gants and co,ntr,but,ons 85771) 70
Cap,Iul grants and eo,nlr,tnr,)ions 7,400 8,937 _) 60’) 3,854 2,418 951, 471 6,406 163
Total bnxinuss’Iypeactivitesprograur revenue 22,911 27,010 22,217 22,30’! 27,130 27,977 27,257 25,481 32,189 28.1.111
l’,nI,,l primary gnvennrr,ennl program revenues $43,977 544.856 S47,454 547.770 $57,024 S61,69t 55’l,333 $50,597 $54,740 $40,707
Net (Expemmsc)/Revenue
Goverrnrnrenrtal ac)iv,l,es ($54,537) (S65,058l ($62,189) (566,033) ($64,065) ($60,461) ($68,576) ($72,017) ($91,858) ($75,634)
fl,,snnesstypeaet,vities 8,001 11,475 5,920 6,349 9,918 8,757 6.583 48 11,195 5,664
Tolal prlrnarygovernrrncnt ncr evperrse (546.5)6) ($57,623) ($56,269) ($59,684) ($54,147) ($51,704) ($61,993) ($71,969) ($80,663) ($69,970)
II
III
1021
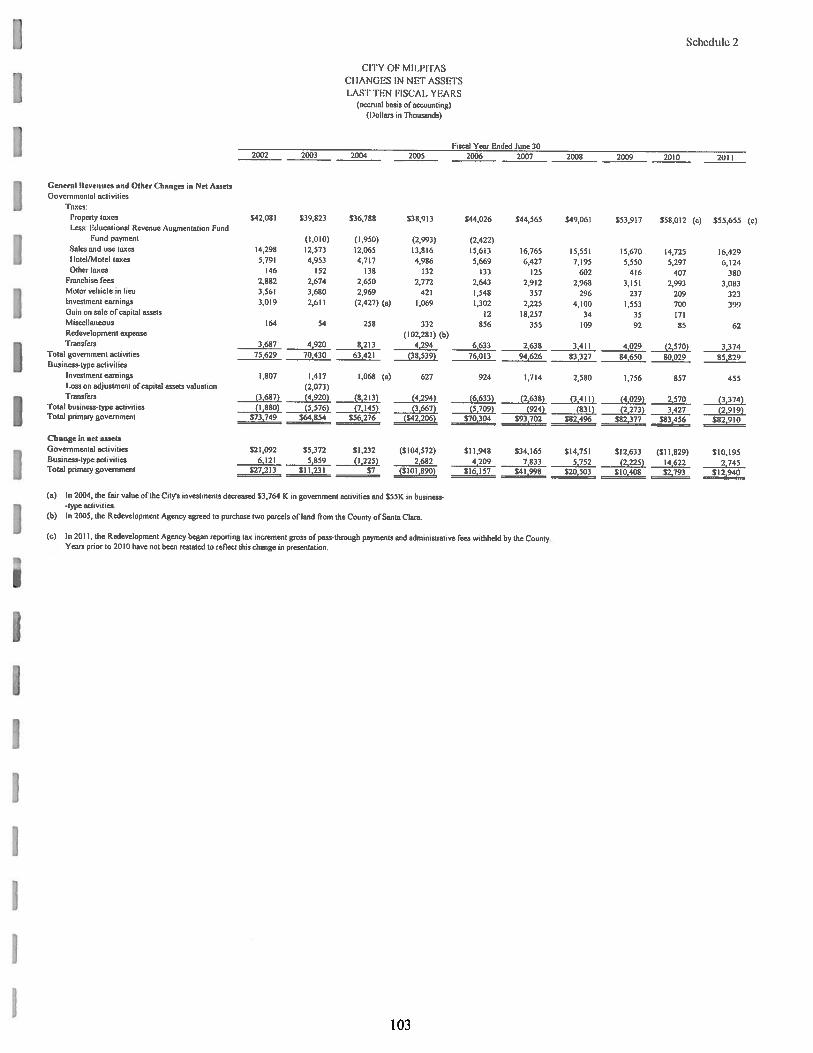
(FFY OF MILPII’ASCl IANGFS IN NFT ASSLTSI.AST’fFN FISCAL YFARS
(.icerual 1,asis of accounting)
I I)nllars in thousands)
Schedule 2
Fiscal Year F,nded June 302002 2003 2004 2005 2006 2007 2008 2009 20)0 2011
] t;e,irr,iI I(evriii,es unit Oilier ( inaugen in. Net As. .sets(iovcrniurciitol activities
I II’S CS
Proper iy taxes
Less Educational Revenue Augnrcutntron FundFund payment
Silos arid rise to,’Ses
I Intel/Motel taxesOilier taxes
Franchise fees
Motor
vehicle in lieu
l,ivCslutciii earnings
(hurt on sale of capital assetsMrxcelhmuieous
Redenelopntertt expensetrrrnxfers
Total r;overuuicui actuvitieuflnsiness.type activities
Investment earuningsI.os oii atIjusInteni of capital assets valuation
‘[run sfers
Total business-type activitiesTotal primary gOn.euinivefli
Chan.ge in. inn uISSC(3
(loveinmentat activities
tlusoicss—type activities
Total prmmir,u-y goverinrneni
P42,081 $39,823 $36,788 $38,913
(1,010) ((050) (2,993)14,298 2,573 12,065 13,8165,791 4,953 4,717 4,986
(46 152 138 1322,882 2,674 2,650 2.772356) :1,180 2,969 42)3,010 2,611 (2,427) (a) 1,069
$44,021, $44,565 S49,01r1 $53,917 $58,012 (c) $55,655 Ic)
(2,422)15,613 6,765 tS,55t 15,1570 14,7255,669 6,427 7,195 5,550 5,297
33 125 602 416 4072,643 2,912 2,468 3,151 2,0931,548 357 296 217 2091,302 2,225 4)00 1,553 700
12 18,257 34 15 17!355 tOO 92 85
(a) In 200.1, the fair value of the (Sty’s investments dec,eased $3,764 K in goverinnent activities and 555K in business--typo activities
(6) In 2005, the Redeveloprnrernt Agency agreed to purchase two parcels of land from tIme County of Santa Clara
(c) In 201 1, the Redevelopment Agency began reporting tax increment gross of pass-tlttoagli payments and administrative fees withheld by the County.Years prior to 20)0 have not been restated to reflect this change in presentation
16,421)
(m,124
380
3,083
3233iti)
6264 54 258 332 856(102,281) (b)
3,687 4,020 8,213 4,294 6,633 2,638 3,411 4,020 (2,570) 3,37475,629 70.430 63,421 (38,539) 76,013 94,626 83,327 84,650 80,029 85,820
1,807 1,417 1,068 (a) 627 924 t,7t4 2,580 756 857 455(2,073)
(3,687) (4,920) (8,213) (4,294) (6,633) (2,638) (3,411) 2,570 (3,374)(1,880) (7,145) (3,667) (5.709) (924) (831) (2,273) 3,427 (2,919)
S73,749 $64,854 $56,276 ($42,206) $70304 $93,702 $82,496 $82,377 $83,456 $82,910
$2t,092 $5,372 $1,232 ($104,572) $11,948 $34,165 $14,751 $12,633 ($11,829) $tO,t956,121 5,859 (t2 2.682 4,209 7,833 5,752 (2,225) 4,622 2,745
S27.2t3 $11231 $7 ($101,890) Stb,157 $41,998 $20,503 $10408 $2,703 $12,940
103

(‘ElY 01: MII,PFFAS
FUNI) I(ALAN(’E.S, (I()VIRNMEN’I’AI. FUNDS
l .AS’l’’l’ EN F1S(’AI Y1ARS(anvil tied ten til Isisis nt accoanlilig)
(t)ollai s in Iliottsiiids)
Schcditk 3
2002 2003 2004 2005Fiscal Year Ended June 30
2006 2007 2(108 2009 2010(b) 2011(b)
11
General land
Reserved
Unreserved
Nonspendable
Restricted
Coununillcd
Assigned
Unassigned
Total (leneral Fund
All Other Governmental lands
Reserved
Unreserved, reported in:
Special revenue Rinds
Capital project funds
Debt service funds
Nonspendabte
Restricted
Assigned
Unassigned
Total all other governmental funds
$3,458 $1,134 $2,366 Sl,344 $1,315 $21,753 $21.74’) $21,542
36,588 37,529 30,636 26,699 27,966 26,716 29,359 29,293
S20.977 $20,970
24,555
5,433 5,433
9,698
__________
15,448
________
$76,104
$115 S23
96.873 104.290
2.196 2,127
(10,219) (43,624)
$88,965 $62,816
(a) The change in total fund baJance for the General Fund and other governmental funds
is explained in Management’s Discussion and Analysis,
(6) The City inipletnented tite provisions of GASB Statement 54 in fiscal year 2011, and years prior 102010 have tot been
restated to conform with the new presentation.
I
UIII
UII2002 2003 2004 2005 2t)6 2(107 2Oes 21)0)
r. Reserved Unreserved 0 Nonspcndsbl
C] Restricted Cousnuilted C] Assigned
L Unassigned
2)110 201t
(1’) (h)
9,465
14,920
$50,795
II
9I
$40,046 $38,963 $33,002 $28,043 $29,281 $48,469 $51,108 $50,835
$29.18’) $29,351 $11,131 $23.01’) S36,812 $54,763 $41,416 $50,608
3,454 8,113 19,493 23,745 3,524 4,025 4,213 4,603
63,454 59,127 179,291 137,415 140,259 74,178 69,028 53,845
185 966
$96,582 $97,557 $239,915 $184,209 $180,595 $132,966 $114,657 $109,056
104

Schedule 4
(‘fly OF MI J’l’FAS(‘I IANGIlS IN FIJNI) I)AI.AN(’I’S, (;OVIiRNMLNTAI. FuNDS
l.AS’fFliN FISCAL YLARS(inodilicil accrual basis of accounting)
(l)ollars ii ‘)iioosarols)
Fiscal Year Ended june 302002 2003 2004 2005 2006 2007 2008 2009 2010 2011
Revenuesl’inpnrly lanes $41782 $39520 $36.86 $38,337 $43,155 $44289 $49,060 $53,917 858,0)2 (d) $55,655 (if)tees I:docalional Revenue
Augnierilalnir
‘soil payment (1,010) ((.950) (2.993) (2.422)Salcstaxes 15009 13,222 2,659 4.409 6,228 7,181 16,173 16.251 15.268 6,994106cr lanes 9572 0,509 8,555 9,066 10,001 10,508 11,636 9,937 9,495 10,917Licenses anti fines 2,974 2.431 3,020 4,320 7,357 6,958 5,991 4,619 3,481 4,309tea of nroney sal piopeis 8,940 7,086 2.515 (.r) 6,149 6,260 0,292 11,096 0,984 7.168 3,948
tetcigooorini,ierrl.il
0,587 9412 11.124 4,914 6,045 5,5,9’) 4,092 6,001 6,362 5,082(barges ‘or services 2,683 2,721 3.277 3,842 4,165 ‘1,715 4.612 4.116 3,704 4.020Ibiseloper ecrrrtrhi,00es .535 823 3,452 1.439 5.010 1,217 2.884 2,558 4,739 3.360Other 458 361 790 4,097 1,186 8.978 584 816 933 1,039Total Revenues 91,548 83,109 79,632 83,568 96,987 107,929 106,128 107,232 109,162 105,324
•:rpeutililuii’esCurrent
General governrnrcnt 10,391 11,245 10,365 13,026 15,608 14.136 15,079 7,034 20,602 (dl 19,003 Id)Iluildirrg and safely 2,368 2,389 1.978 2,075 2.226 2,232 2,566 2,420 1,992 1,975Poblic snorlis 7,171 7,005 7,130 7,7.36 7,789 0,646 (a) 11,016 10.066 13,619 7,960l(ngineering and planning 8,381 6,262 5,983 6.1.11 6,58) (a)Planning and neighborhood services 2,329 (a) 2528 2,576 2,180 2.267Recreauon 3.532 3,806 3.860 4,1)1 4,284 (a)Parka and recrrar,oir 6.486 (c) 6,513 6,416 6,052 5.688Police 19,740 17.197 18,384 9,723 20,167 20.081 21,701 21,602 22,071 21,682Fire 11.218 lI,’iS7 12,864 15,363 14,112 13,717 1.1,664 15,279 14,249 14,994
Supplemental
educational revenueougmnenralron fund puynsenl 11,774 2,424
Cnpual outlay 30,227 17,431 11,169 15.998 16,861 46,076 33.133 21,585 16.938 2.940Payments nuder developer agreements 210 98 127Debt service
Pnncspal 6,260 6,470 8,860 6.609 8.559 8,508 8,490 8,481 8,169 8.225Intermtandfees .1,198 4.194 9,686 9,379 9,424 15.250 11,528 11,516 11,982 12,386
Toial tisperrdilures 99.6gb 88,114 90,406 06,548 105,011 159,461 127.218 117.775 129,628 109.544
Escecs (deficiency) of revenues riser(under) enpcndilures (5,029) (lO,774) ,j)g_))6O) (8,824) (51.532) (21,090) (10,543) (20,166) (.1,220)
Other Financing Suurcrs )Uscs)Proceeds from debt issuance 200,000 20,455lurid Issuance premium 5,372
Payments Icr refunded debt escrow agent (67,164)Preereds from sale of prnperlies 1,868 14 4 5
Transfers
in 47,3(1 42,620 124,899 23,095 28,523 22,561 20.420 23,278 23,590 119,213Transfers (out) (43,601> (37,700) (115,936) (18.801) (22,075) (19.92.1) (16,069) (10,624) (23.259) (115,839)
Total other fnnancorg sources (uses> 3,682 4,920 117,171 4,294 6,4’t8 23,092 5.419 4,668 335 3,379
Special lIensRedevelopment enpenSe
____________ ____________ ___________
(48,000) (6)
____________ ____________ ___________ ____________ _____________ _____________
‘(el Change it. fend balances ($4,465) ($109> 8136.397 ($60,666) ($2,376> ($20,440) ($15,671> ($5,875) ($20,131) ($841)
Debt service as a percetaloge ofnoncapita] expenditures 5 1% 5 1% 234% 18 9n/ 202% 265% 213% 208% 18.5% 21 5%
(a) In 2004, the fair valoe nf the inveslnrcnrs decreased $3,764 K in gnvernrnerrlnl aclnvntes(In> In 2005, Ihe Redevelopment Agency made a cash payment of $48,000 K to the Coooly of Santa Clara Ion Iwo parcels of land(c) ThnCily depaolnrienls were reorganrzed in fiscal 2007.(dl lit 2011, the Redevelopment Agency began reporting tax increment gross of puss.througli payments and adnriluslral,ve fees withheld by die (‘manly
Years ptor 102010 have 001 been reslaled In reflect this change in prexeurtasos.
105

Schedule 5
CITY OF MILPITAS
ASSESSED VALUE AND ACTUAL VALUE OF TAXABLE PROPER’I’Y
LAST TEN FISCAL YEARS(1)ol tars in l’hotpsands)
$14,000,000I
___
I$8,000,000 —-----—-—-——-—-—----—---—----——----
I
$6,000,000
$4,000,000 -
-
I$2,000,000 - -
$0
2001-02 2002-03 2003-04 2004-05 2005-06 2006-07 2007-08 2008-00 2009-tO 2010-I I
Real Property Less: Total ‘l’axablc
Eiscal Residential Commercial Industrial fax—Exempt Assessed Total Direct
Year Property Property Property Other Unsecured Property Value (a) Tax Rate (h)
2001-02 $3,417,125 $779,136 $2,166,036 $1,274,151 $1,825,539 ($85,563) $9,376,424 1%
2002-03 3,746,467 835.889 2,502,123 1,016,922 1,833,384 (111,940) 9,822,845 l%
2003-04 4,377,568 964,438 2,340,453 227,739 1,595,224 (107,860) 9,397,562 1%
2004-05 4.572,065 798,350 2.095,928 603,547 1,379,444 (110,377) 9,338,957 1%
2005-06 4,952,629 814,287 2,032,245 641.662 1.651,527 (131,810) 9,960,540 1%
2006-07 5.513,377 1,141,925 2,179.658 328,782 1,284.778 (129,187) 10,319,333 1%
2007-08 5,974,338 1.208,674 2,423,285 320,499 1,329,060 (146,495) 11,109.361 1%
2008-09 6.345,176 1,350,579 2,806.181 307,980 1,437,414 (220.624) 12,026,706 1%
2009-10 6,199.167 1,368,086 2,904,523 352,408 1,446,827 (245,778) 12,025,233 1%
2010-Il 6.169.631 1,347,861 2,772,974 346,493 1,557.639 (282,502) 11,912.096 1%
Source: 1-1d1 Coren & Cone, Santa Clara County Assessor Combined ‘Fax Rolls
Note:(a) The State Constitution requires property to be assessed at one hundred percent of the most recent purchase price, plus an increment of
no more than two percent annually, plus any local over-rides. These values are considered to be full market values.
(h) California cities do not set their own direct tax rate. The state constitution establishes the rate at 1% and allocates a portion of that amount.
by an annual calculation, to all the taxing entities within a tax rate area.
106
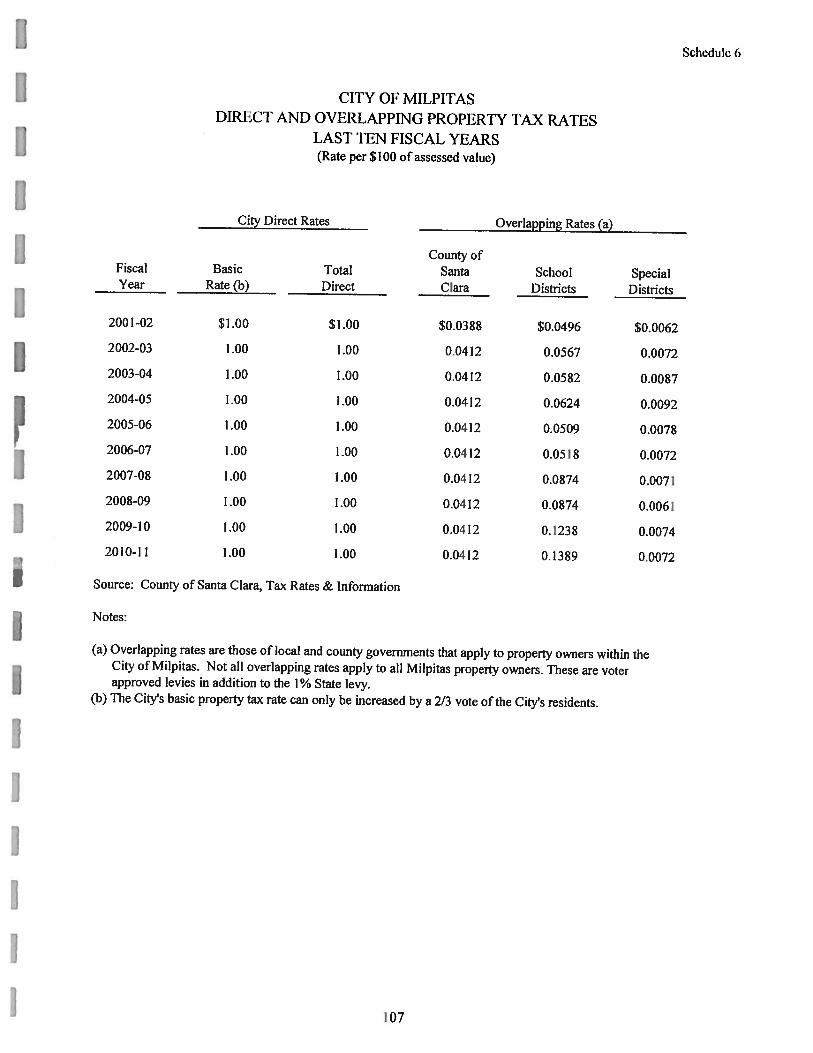
Schedule 6
CITY OF MILPITASD1RLCT AN1) OVERLAPPING PROPERTY 1’AX RATES
LAST TEN FISCAL YEARS(Rate per $100 of assessed value)
City Direct Rates Overlapping Rates (a)
County ofFiscal Basic Total Santa School SpecialYear Rate (b) Direct Clara Districts Districts
2001-02 $1.00 $1.00 $00388 $0.0496 $0.0062
2002-03 1.00 1.00 0.0412 0.0567 0.0072
2003-04 1.00 1.00 0.0412 0.0582 0.0087
2004-05 1.00 1.00 0.0412 0.0624 0.0092
2005-06 1.00 1.00 0.0412 0.0509 0.0078
2006-07 1.00 1.00 0.0412 0.0518 0.0072
2007-08 1.00 1.00 0.04 12 0.0874 0.0071
2008-09 1.00 1.00 0.0412 0.0874 0.0061
2009-10 1.00 1.00 0.0412 0.1238 0.0074
2010-11 1.00 1.00 0.0412 0.1389 0.0072
Source: County of Santa Clara, Tax Rates & Information
Notes:
(a) Overlapping rates are those of local and county governments that apply to property owners within theCity of Milpitas. Not all overlapping rates apply to all Milpilas property owners. These are voterapproved levies in addition to the 1% State levy.
(b) The City’s basic properly tax rate can only be increased by a 2/3 vote of the City’s residents.
107

Schedule 7
CIFY OF MILPIFAS
PRINCIPAl PROPLR’l’Y ‘I’AX PAY ERS
FISCAL YEARS 2010-Il and 2001-02(Dollars in thousands)
2010-2011 2001-2002
Percentage Percentage
of Total City of Total City
Taxable Taxable Taxable Taxable
Assessed Assessed Assessed Assessed
Taxpayer Value Rank Value Value Rank Value
Cisco Technology Inc. S 584,277,379 1 4.90%
Milpitas Mills LP 318,591,678 2 2.67%
KLA TencorCorporation 203,516,223 3 1.71% $ 144,743,903 7 1.54°/b
Silicon Valley California LLC 175,255,293 5 1 .47%
DiversiFied Real Estate Investors 185,839,684 4 1.56%
1-leadway Technologies Inc 123,824,481 6 1.04%
BRE Milpitas LLC 115,567.449 7 0.97%
Linear Technology Corporation 107,655,795 8 0.90% 130.029,428 9 1 .39%
Solyndra Inc. 82,207,448 9 0.69%
Lifescan Inc 80,419,329 10 0.68%
Societe Generale Find Corporation 364,982,758 1 3.89%
Seagate Technology 178,012,362 2 1.90%
Trinet Milpitas Associates 173,759.402 3 1.85%
Richard T. Peery Trustee 171,482,521 4 1 .83%
Irvine Company 155,799,910 5 1.66%
Great Mall of The Bay Area 150,228,896 6 1.60%
Solectron Corporation 139,127,407 8 1.48%
Quantum Corporation 129,127,427 10 1.38%
Subtotal $ 1,977,154,759 16.60% $ 1,737,294,014 18.53%
Fiscal Year2OIO-201 I Total Net Assessed Valuation SI 1,912,096,000
Fiscal Year 2001-2002 Total Net Assessed Valuation $9,376,424,000
Source: HdI, Coren & Cone. Santa Clara County Assessor 2010/11 Combined Tax Rolls
108 1

Schedule 8
CITY OF MILPITASPROPERTY TAX LEVIES AND COLLECTIONS
LAST TEN FISCAL YEARS(Dollars in thousands)
Percent Delinquent TotalFiscal Taxes Current of Levy Tax Taxes PercentYear Levied (a) Collections (a) Collected Collections Collected (a) of Levy
2001-02 $41,782 $41,782 100.00% 0 $41,782 100.00%
LI 2002-03 39,520 39,520 100.00% 0 39,520 100.00%2003-04 36,186 36,186 10000% 0 36,186 100.00%2004-05 38,337 38,337 100.00% 0 38,337 100.00%2005-06 43,155 43,155 100.00% 0 43,155 100.00%
I2006-07 44,289 44,289 100.00% 0 44,289 100.00%2007-08 49,060 49,060 100.00% 0 49,060 100.00%
2008-09
53,917 53,917 100.00% 0 53,917 100.00%2009-10 (b) 58,012 58,012 100.00% 0 58,012 100.00%2010-11 (b) 55,655 55,655 100.00% 0 55,655 100.00%
(a) The City elected to participate in the ‘Teeter” plan offered by the County wherebycities receive 100% of the taxes levied in exchange for foregoing any interest and penaltiescollected on delinquent taxes.
(b) In 2011, the Redevelopment Agency began reporting tax increment gross of pass-throughpayments and administrative fees withheld by the County.Years prior to 2010 have not been restated to reflect this change in presentation.
Source: City of Milpitas Comprehensive Financial Annual Report
109
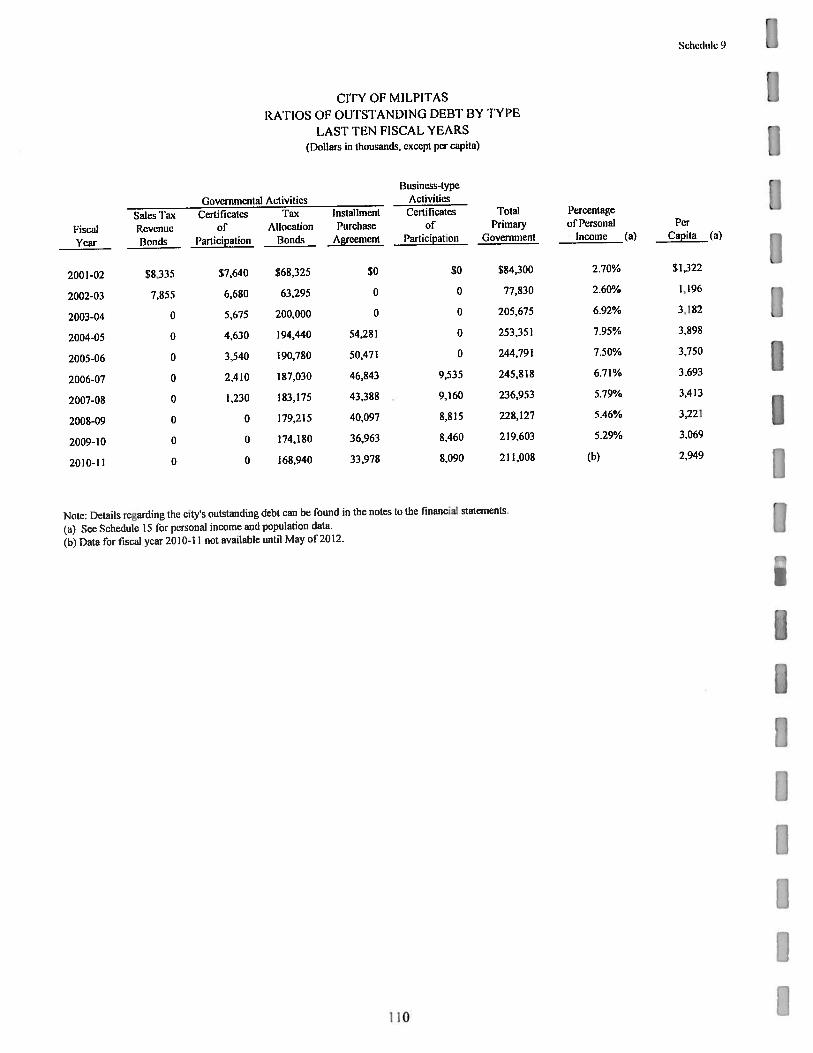
Schedule 9
Cl’I’Y OF MILPITAS
RATIOS OF OU’I’S’I’ANDING DEBT BY ‘I’YPL
LAST TEN F1SCAL YEARS(Dollars in thousands, except per capita)
[3usincss-typc
Governmental Activities Activities
Sales ‘l’ax Certificates ‘fax Installment Certificates ‘Folal Percentage
Fiscal Revenue of Allocation Purchase of Primary of Personal Per
Year Bonds Participation Bonds Agreement Participation Government Income (a) Capita (a)
2001-02 $8,335 $7,640 $68,325 $0 $0 $84,300 270% $1,322
2002-03 7,855 6,680 63,295 0 0 77,830 2.60% 1,196
2003-04 0 5,675 200,000 0 0 205675 6.92% 3,182
2004-05 0 4,630 194,440 54.281 0 253,351 7.95% 3,398
2005-06 0 3,540 190,780 50,471 0 244,791 7.50% 3,750
2006-07 0 2,410 187,030 46,843 9,535 245,818 6.71% 3.693
2007-08 0 1,230 183,175 43,388 9,160 236,953 5.79% 3,413
2008-09 0 0 179,215 40,097 8.815 228.127 5.46% 3,221
2009-10 0 0 174,180 36,963 8,460 219,603 5.29% 3.069
2010-11 0 0 168.940 33,978 8.090 211,008 (h) 2.949
Note: l)ctails regarding the city’s outstanding debt can be found in the notes to the financial statenients
(a) See Schedule 15 for personal income and population data.
(b) Data for fiscal year 20 10-1 1 not available until May of2O 2.
10
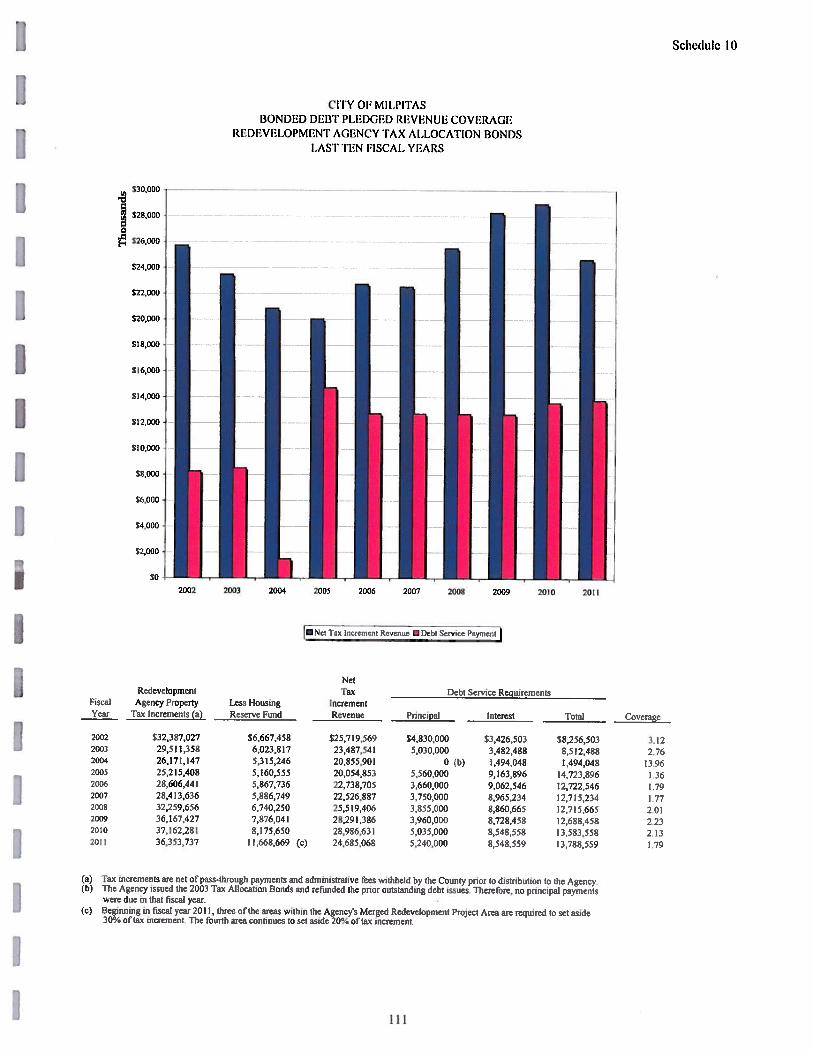
Schedule 10
530,000
$28,000 j$26,000
$24,000
$22,000 -
$10,000
$8,000 -
$1,000 -
54,000 -
$2,000 -
(‘I’I’Y OF MIl,PI’I’ASHONDLI) I)1il3’I’ 1,FI)GID RLVFNUI COVFRAGE
RF.DEVE1.0PMFN’1’ AGF,NCY ‘I’AX A1,LOCA’flON BONDSLAS’ i’TI’N FISCAL YFARS
2008
I Debt Service Payment
NetTax Debt Service Requirements
Increment
____________________
Revenue Principal Interest total Coverage
$20,000 -
$18,000 -
$14,000 -
$12,000
$0 I-—- I2002
I2004
Redevelopment1-iscal Agency Property Less HousingYear Tax Increments (a) Reserve Fund
2002 $32,387,0272003 29,511,3582004 26,171,1472005 25,215,4082006 28,606,4412007 28,413,6362008 32,259,6562009 36,167,4272010 37,162,2812011 36,353,737
$6,667,4586,023,8175,315,2465, 160 ,5555,867,7365,886,7496,740,2507,876,0418,175,650
11,668,669 (c)
$25,719,56923,487,54120,855,90120,054,85322,738,70522,526,88725.59,406
28,291,38628,986,63124,685,068
$4,830,0005,030,000
0 (b)5,560,0003,660,0003,750,000
3,855,0003,960,0005,035,0005240,000
$3,426,5033,482,4881,494,0489,163,8969,062,5468,965,2348,860,6658,728,4588,548,5588,548,559
$8,256,5038,512,4881,494,0484,723,896
12,722,546
12,715,23412,715,66512,688,45813,583,55813,788,559
3.122.76
13.96I 361.791.772.012.232.131.79
(a) Tax increments are net of pass-througti payments and administrative fees withheld by itie Couniy prior ho distribution to the Agency.(6) The Agency issued the 2003 Tax Allocation Bonds and refunded ttie prior outstanding debt issues Therefore. no principal payments
were due ui that fiscal year.(c) Beginning in fiscal year 2011, three of ttie areas within the Agency’s Merged Redevelopment Project Area are required to set aside
30% of tax increment The fourth area continues to set aside 20% of tax increment
111
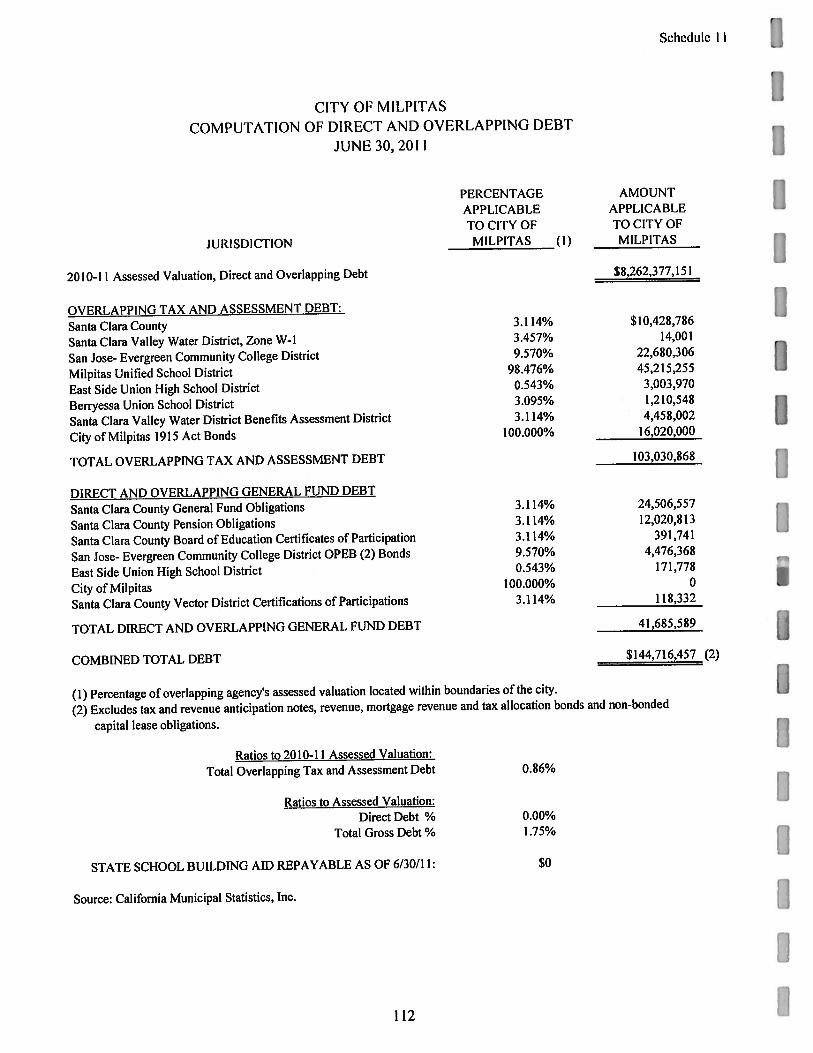
Schedule I I
CITY OF MILPITAS
COMPUTA’I’ION OF DIRECT AND OVERLAPPING DEBT
JUNE3O,2011 IPERCENTAGE AMOUNTAPPLICABLE APPLICABLE
TO CITY OF TO CITY OF
JURISDICTION MILPITAS (1) MILPITAS I2010-11 Assessed Valuation, Direct and Overlapping Debt $8,262,377,151
OVERLAPPING TAX AND ASSESSMENT DEBT:
Santa Clara CountySanta Clara Valley Water District, Zone W-1
San Jose- Evergreen Community College District
Milpitas Unified School District
East Side Union High School District
Berrycssa Union School District
Santa Clara Valley Water District Benefits Assessment District
City of Milpitas 1915 Act Bonds
_________________
TOTAL OVERLAPPING TAX AND ASSESSMENT DEBT
____________
3.114% 24,506,557
3.114% 12,020,8133.114% 391,741
9.570% 4,476,3680.543% 171,778
100.000% 03.114% 118,332
41,685,589
$144,716,457 (2)
(I) Percentage of overlapping agency’s assessed valuation located within boundaries of the city. I(2) Excludes tax and revenue anticipation notes, revenue, mortgage revenue and tax allocation bonds and non-bonded
capital lease obligations.
Ratios to 2010-Il Assessed Valuation:
Total Overlapping Tax and Assessment Debt 0.86%
Ratios to Assessed_Valualion:Direct Debt %
Total Gross Debt %
STATE SCHOOL BUILDING AID REPAYABLE AS OF 6/30/Il: $0
Source: California Municipal Statistics, Inc.
3.114%3.457%9.570%
98.476%0.543%3.095%3.114%
100.000%
$10,428,78614,001
22,680,30645,215,255
3,003,9701,210,5484,458,002
16,020,000
103,030,868
DIRECT AND OVERLAPPING GENERAL FUND DEBT
Santa Clara County General Fund Obligations
Santa Clara County Pension Obligations
Santa Clara County Board of Education Certificates of Participation
San Jose- Evergreen Community College District OPEB (2) Bonds
East Side Union High School District
City of MilpitasSanta Clara County Vector District Certitications of Participations
‘IOTAL DIRECT AN1) OVERLAPPING GENERAL FUNI) DEBT
COMBINED TOTAL DEBT
IUIIII
I
11
0.00%1.75%
112

Schedule 12
CITY OF Mll,Pl’FASLLGAL DEB’F MARGIN INFORMATION
LAST TEN FISCAL YEARS(I)ollars in ‘l’hotisands)
Legal L)cbt Margin Calculation for Fiscal Year 2010-11
Assessed value (net) - June 30, 2011
Debt limit: 3.75% of assessed value (a)
l)ebt applicable to limitTotal Bonded DebtLess: Tax Allocation Bonds
not subject to limit
Amount of Debt subject to limit
Legal debt margin
Total Net Debt
FiscalYear
200 1-022002-032003-042004-052005-062006-072007-082008-092009- 102010-11
DebtLimit
$351,616368,356352,408350,211373,520386,975416,601451,001450,946446,703
total Net DebtApplicable to Limit
0000000000
LegalDebt Margin
$351,616368,356352,408350,211373,520386,975416,601451,001450,946446,703
Applicable to theLimit as a
percentage ofDebt Limit
0.0%0.0%0.0%0.0%0.0%0.0%0.0%0.0%0.0%0.0%
(a) California Government Code, Section 43605 sets the debt limit at 15%. The Code section was enactedprior to the change in being assessed value to full market value when it was previously 25% ofmarket value. Thus, the limit shown as 3.75% is one-fourth the liniit to account for the adjustmentof showing assessed valuation at full cash value.
Source: City ofMilpitas Finance DepartmentSanta Clara County Tax Assessor’s Office
$168,940
168,940
$11,912,096
$446,704
0
$446,704
113
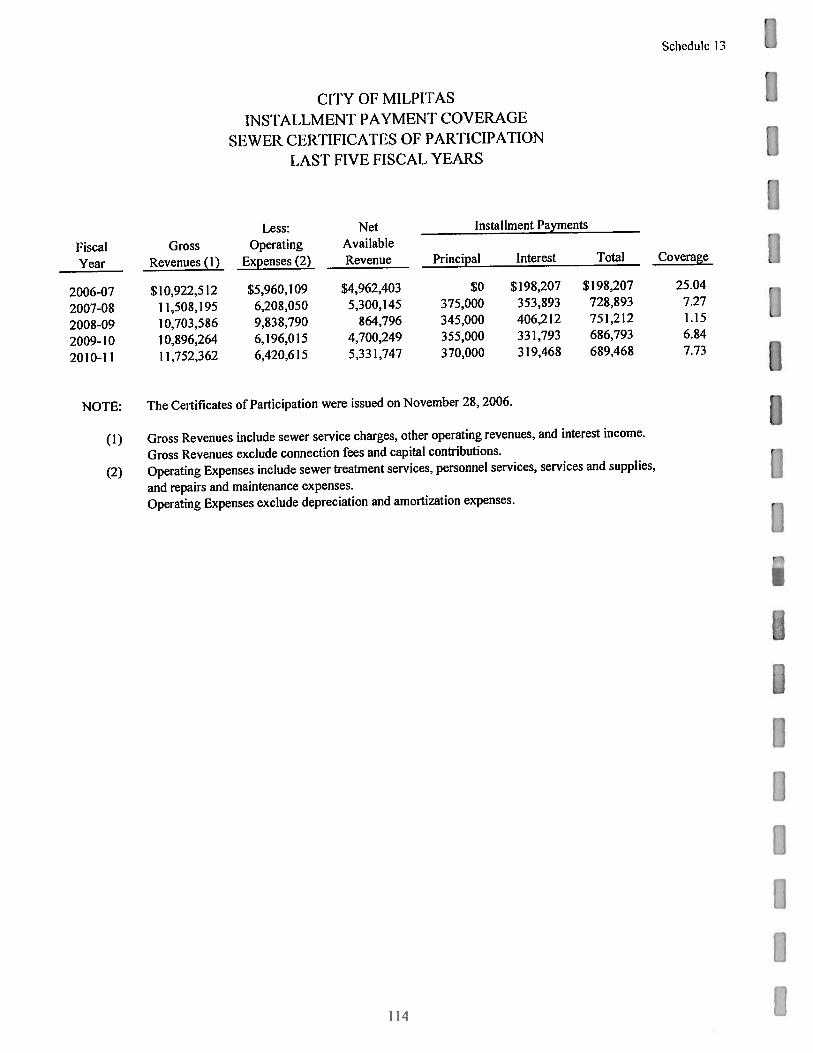
Schedule I 3
CITY OF MILPI’FAS
INS’I’ALLMEN’I’ PAYM EN’!’ COVERAGE
SEWER CER1 ‘1 FICATI S OF PARTICIPATION
LAST FIVE FISCAL YEARS
NOTE: The Certificates of Participation were issued on November 28, 2006.
(1) Gross Revenues include sewer service charges. other operating revenues, and interest income.
Gross Revenues exclude connection fees and capital contributions.
(2) Operating Expenses include sewer treatment scrvices personnel services, services arid supplies,
and repairs and maintenance expenses.
Operating Expenses exclude depreciation and amortization expenses.
IIIII
Less: Net
Fiscal Gross Operating Available
Year Revenues (1) Expenses (2) Revenue
Installment Payments
Principal Interest Total
2006-07 $10,922,512 $5,960,109 $4,962,403 $0 $198,207 $198,207 25.04
2007-08 1 1,508,195 6,208,050 5,300,145 375,000 353,893 728,893 7.27
2008-09 10,703,586 9,838,790 864,796 345,000 406,212 751,212 1.15
2009-10 10,896,264 6,196,015 4,700,249 355,000 331,793 686,793 6.84
2010-11 11,752,362 6,420,615 5,331,747 370,000 319,468 689,468 7.73
Coverage
114
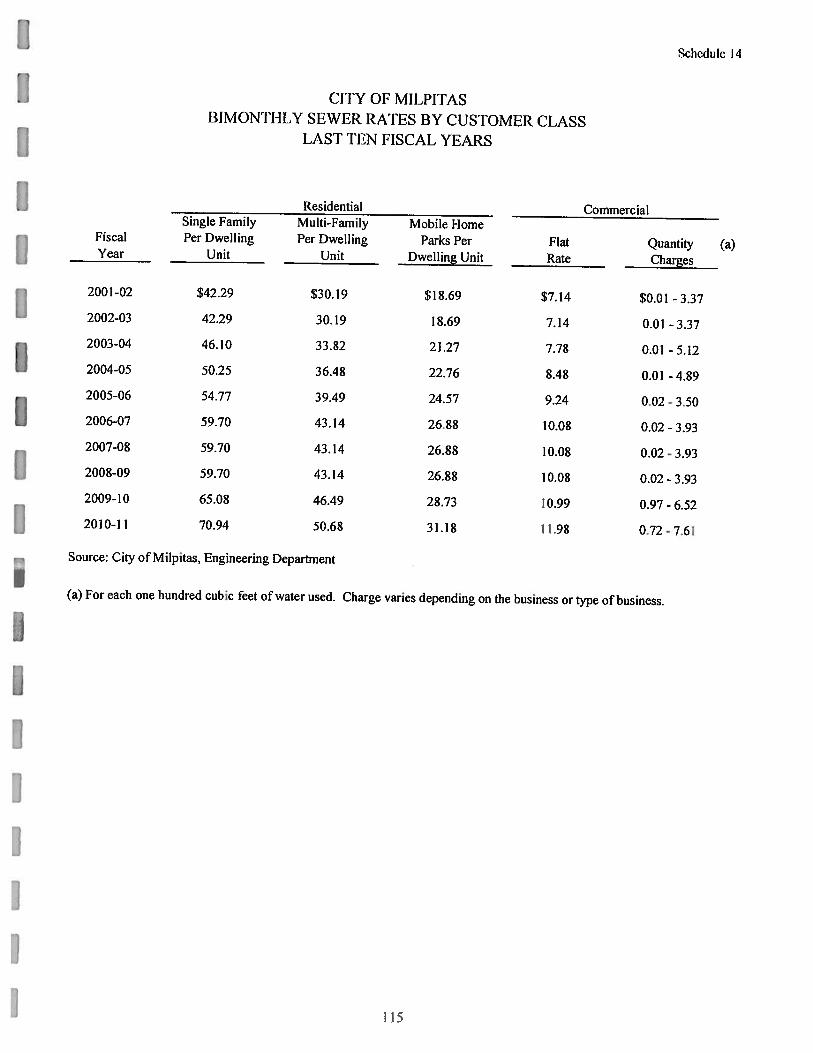
Schcdnlc 14
CITY OF MILPITASBIMON’flILY SEWER RATES BY CUSTOMER CLASS
LAST TEN FISCAL YEARS
Residential CommercialSingle Family Multi-Family Mobile Home
Fiscal Per Dwelling Per Dwelling Parks Per Flat Quantity (a)Year Unit Unit Dwelling Unit Rate Charges
2001-02 $42.29 $30.19 $18.69 $7.14 $0.01 -3.37
2002-03 42.29 30.19 18.69 7.14 0.01 -3.37
2003-04 46.10 33.82 21.27 7.78 0.01 -5.12
2004-05 50.25 36.48 22.76 8.48 0.01 -4.89
2005-06 54.77 39.49 24.57 9.24 0.02 - 3.50
2006-07 59.70 43.14 26.88 10.08 0.02-3.93
2007-08 59.70 43.14 26.88 10.08 0.02-3.93
2008-09 59.70 43.14 26.88 10.08 0.02-3.93
2009-10 65.08 46.49 28.73 10.99 0.97-6.52
2010-11 70.94 50.68 31.18 11.98 0.72 - 7.61
Source: City of Milpitas, Engineering Department
(a) For each one hundred cubic feet of water used. Charge varies depending on the business or type of business.
115

Selodok’ 5
(‘FlY OF MILPITAS
DEMOGRAPI-IIC ANI) LCONOMIC S’FAlIS’I’IC’S
LAS’I ‘[EN FISCAL YIARS(Dollars in Ihousands)
n
Population Pcr Capita
liscal Density ‘Iota! Personal Personal School Unemployment Land Area
Year Population (Sq. Mile) Income (a), (b) Income (a) Enrollment Rate (%) (a) (Sq. Mile)
2001-02 63,768 4,668 $3,124,632 $49 9.424 8.70% 13.66
2002-03 65,049 4,762 2,992.254 46 9,516 9.30% 13.66
2003-04 64,629 4.731 2,972,934 46 9.528 6.90% 13.66
2004-05 64,998 4,758 3.184.902 49 9,602 5.60% 13.66
2005-06 65,276 4.779 3,263.800 50 9,748 4.40% 13.66
2006-07 66,568 4,873 3.661,240 55 9,682 4.70% 13.66
2007-08 69,419 5,082 4,095,721 59 9.590 5.90% 13.66
2008-09 70.817 5,184 4,178,203 59 9,649 11.80% 13.66
2009-10 71,553 5,238 4,150,074 58 9.802 11.30% 13.66
2010-11 71,552 5.238 (c) (c) 9,887 10.30% 13,66
(a) lor Santa Clara County.
(b) Data not available for the City, therefore the balance reported is the product ol the County’s Per Capita Personal Income
and the City’s population. 1(c) Data for fiscal year 2010-11 is not available until May o2012.
Sources: California Department of Education
California Employment Development Department
State ot Ca1ibrnia. Department of Finance.
U.S. Department of Commerce. Bureau of Economic Analysis
0IIII
116

Schedule 16
CITY OF MIl,PITASPRINCIPAL EMPLOYERS
FISCAL YEAR 2009-10 and 200 1-2002
2009-I() (a) 2001-2002
Percentage Percentage
Number of of I’otal City Number of of lotal City
Frnployer
Lmployees Rank Employment Employees Rank Employment
Cisco Systems, Inc. 4,339 1 5.3 1% 8,200 I 10.04%
Great
MaIl 3,500 2 4.29% 3.100 3 3.80%
KLA-’l’encor Corporation 2,000 3 2.45%
Elextronics 1,850 4 2.27%
LSI Logic Corporation 1,320 5 1.62% 1,286 8 1.58%
SanDisk Corporation 1,200 6 1.47%
Linear Technology 1,100 7 1.35% 2,000 4 2.45%
Milpitas Unified School District 808 8 0.99%
LiIscan, Inc. 800 9 0.98% 1,801 5 2.21%
JDS Uniphase Corporation 800 10 0.98%
Solectron
California 6.000 2 7.35%
Quantum 1,669 6 2.04%
Read Rite 1,500 7 1.84%
Adaptec, Inc. 1,207 9 1.48%
Adac Labs 1,100 10 1.35%
Subtotal 17,717 21.70% 27,863 34.13%
Estimated City Day Population, Census 2000 8 1.646 81,646
(a) [)ata for fiscal year 2010-11 is not available until December 2012.
Source: Association of Bay Area Governments
Milpitas Chamber of Commerce
117
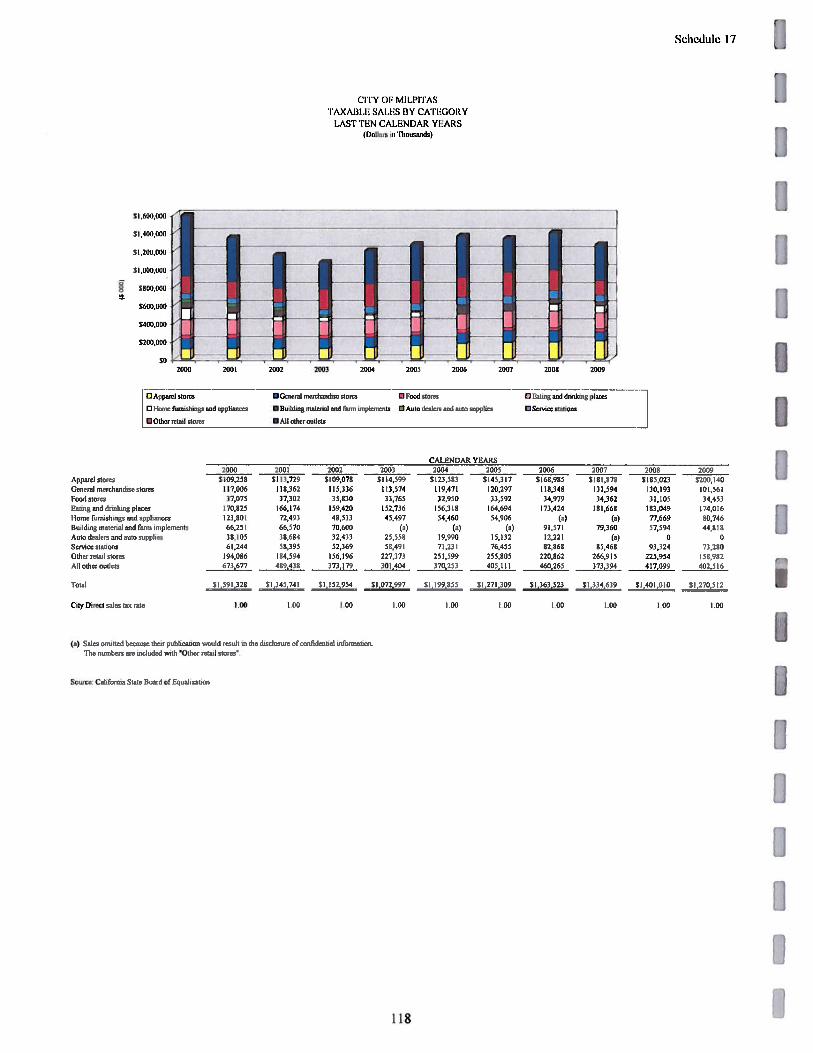
1Schedule 17
(‘ITY OF M LPI’I’AS‘FAXA)3I.E SAILS ISV CATHORY
LAST ‘I’LN CALI(NDAR YLARS(Dollurs ai ‘flroosunils)
2000 21101 2002 2003 2004 2005 2006 2007 2000 2009
OApprrrlslores - •Gertcudorctuhuiuhseutowo •Foodslores Dlalungaoddrrolortgpbccs 1o I ksnc, liirnishrrrps and rppli;orccs • Building rnatcrsd and fanrt nnrnplcnncros •Aulo dcalcrs and auto supplies 0 Service stations
•011crrctail Stoics • All 016cr outlets
CALENDAR YEARS2000 2001 2002 2003 2004 2005 2006 2007 2000 2009
Apparel stores $109,258 $11 3,729 $109,078 $114,599 $123,503 $145.3 17 $168,985 $181,070 $185,023 $200,140Genital tnercluuulise stores 117,006 110,362 115,336 113,574 119,471 20,297 110,348 I 11,594 130,193 101.561Food stores 37,075 37,302 35,830 33,765 32,950 33,592 34,979 34.362 31,105 34,453Eating and drinking places 170,825 166,174 159,420 152,736 156,310 164,694 173,424 181,660 183,049 174,016I trnrre funrisltnnys ansi apphainces 123,801 72,493 48,513 45,497 54,160 54,906 (a) (a) 77,669 80,746180114199 uratcrral and farnrn ninplcinerts 66,251 66,570 70,600 (st) (a) (a) 91,571 79,360 57,594 44,818Auto dealers and auto supplies 38,105 30,684 32,433 25,558 19,990 15,132 2,221 (a) 0 0Service stations 61,244 58,395 52,369 58,491 71,231 76,45.9 82.868 85,468 93,324 73,280Ollrerretatl stores 194,086 184,594 156,196 227,373 251,599 255.805 220,862 266,915 225,954 158,982All oIlier outlets 673,677 409,438 373,179 301.404 370,253 405,111 460,265 373,394 417.099 402,516
Total $1,591,725 $1,345,741 $1,152,954 $1,072,997 $1,199,855 $1,271,109 $1,363,523 $1334639 - $1,401,010 $1270512
City Dined sales tax rate 100 100 .00 1.00 1.00 101) I 08 100 1,00 1.00
(a) Sales onnntted because their publication would result in the disclosure of conftdentiai information.The nornnbers are included with “Oilier retail stores”.
Source: California State Board of Equalization
118
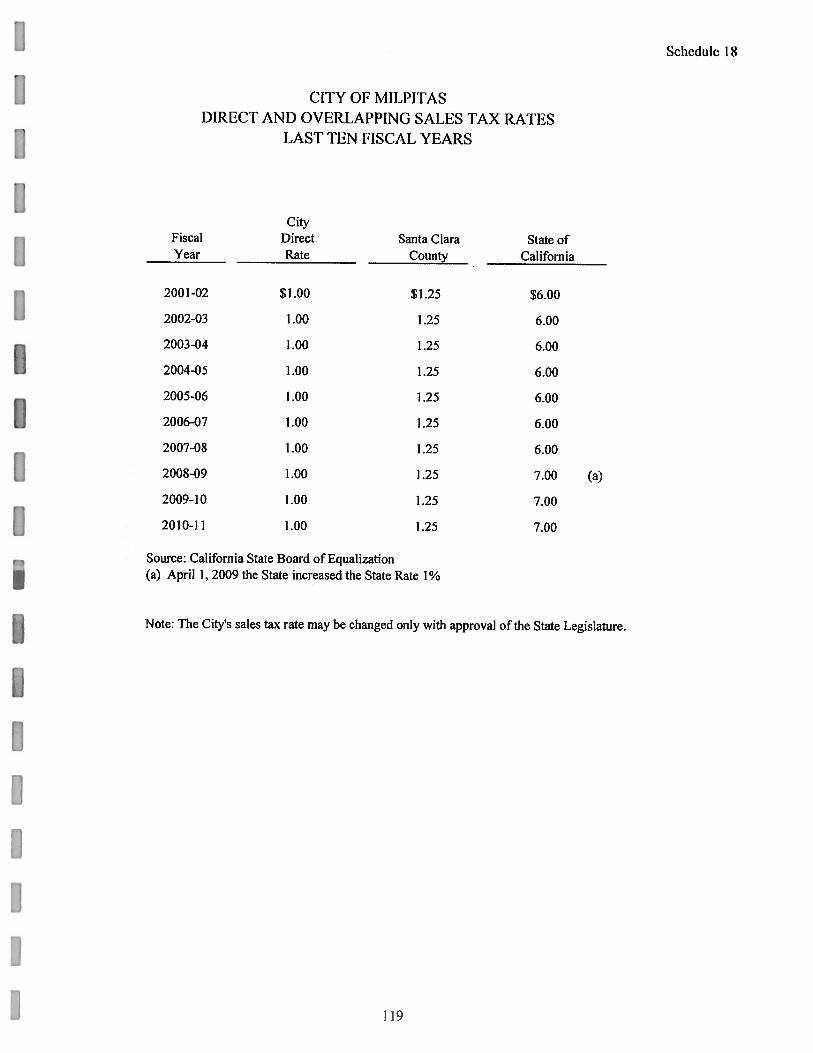
Schedule I 8
CITY OF MILPITASDIRFC’ I’ AN 1) OV FRI SAPPING SM ES TAX RA’I’FS
LAS’!’ TEN FISCAL YEARS
CityFiscal Direct Santa Clara State ofYear Rate County California
2001-02 $1.00 $1.25 $6.00
2002-03 1.00 1.25 6.00
2003-04 1.00 1.25 6.00
2004-05 1.00 1.25 6.00
2005-06 1.00 1 .25 6.00
2006-07 1.00 1.25 6.00
2007-08 1.00 1.25 6.00
2008-09 1.00 1.25 7.00 (a)
2009-10 1.00 1.25 7.00
2010-11 1.00 1.25 7.00
Source: California State Board o Equalization(a) April 1, 2009 the State increased the State Rate 1%
Note: The City’s sales tax rate may be changed only with approvaJ of the State Legislature.
119

Schedule IQ
CiTY OF MILPITASPRINCIPAL SALES TAX PAYERSCALEN1)AR YEARS 2010 and 2001
IN ALPIIABETICAL ORDER
20W 2001
Best Buy Stores Acropolis System
Burlington Coat Factoty ADAC Laboratories
Chevron Service Stations Areom Electronics Inc.
Cisco Systems Inc. Best Buy
Coach Stores Billings Chevrolet PContract Office Group Burlington Coat Factory
Dave & Busters Contempo Design West
Flextron ics Continental Resources
Forever 21 Contract Office Group
1-I & M Dave & Busters
l-leadway Technologies Dynamic Circuits
Home Depot Headway Technologies
KLA Tencor Corporation Home Depot
Kohl’s Department Stores KLA Tencor Corporation
LSI Logic Lifescan
Marshall’s Department Shores Marshall’s Department Stores
Milpitas Materials Company Mervyn’s Department Stores
Nanometrics Milpitas Materials Company
Neiman Marcus Department Store One Workplace L. Ferrari IOff Fifth Saks Orchard Supply Hardware
One Workplace Photronic Labs
Piercey Toyota & Scion Solectron Corporation
South Bay Honda Sun Microsystems
The Gap U.S. Amada
Walmart Stores Walmart Stores
ISource: MBJA MuniServices Company
IUI
120 I
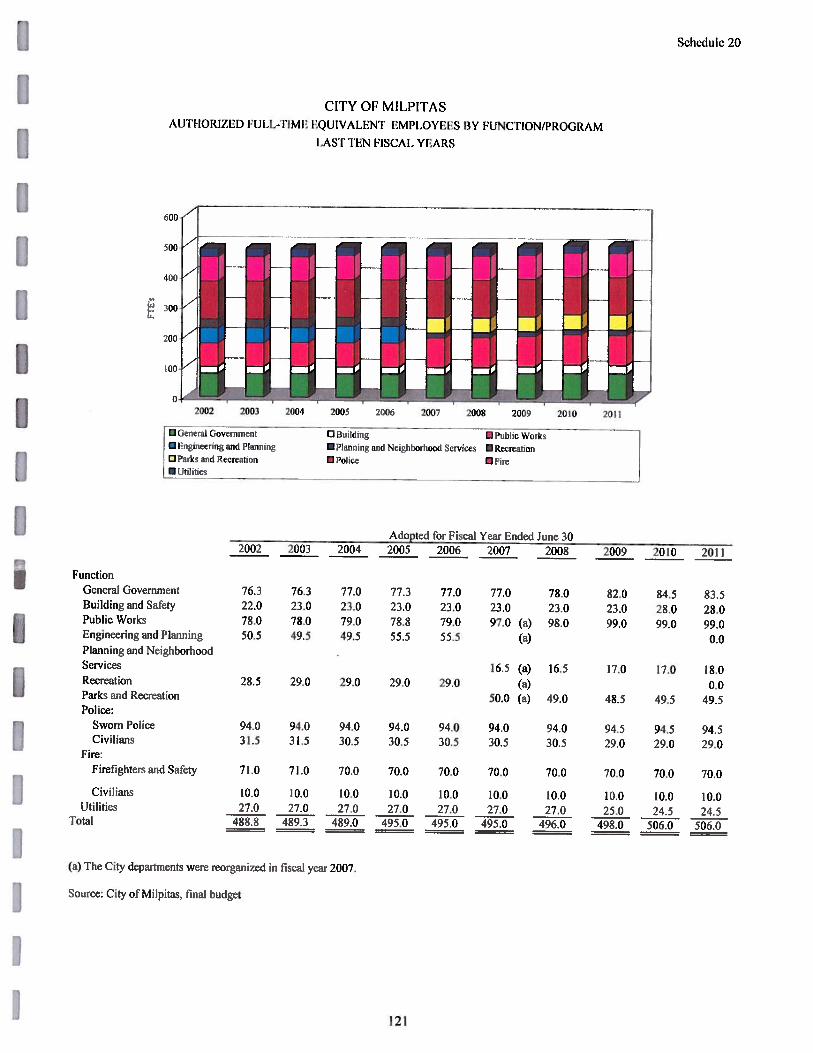
Schedule 20
CITY OF MILPITASAUTI IORIZEI) FULL—liME EQUIVALENT EMPLOYEES BY FUNCTION/PROGRAM
600-
500
400
300
200
100
0
LAST TEN FISCAL YEARS
pted for Fiscal Year Ended June302002 2003 2004 2005 2006 2007 2008 2009 2010 2011
FunctionGeneral GovernmentBuilding and SafetyPublic WorksEngineering and PlanningPlanning and NeighborhoodServicesRecreationParks and RecreationPolice:
82.0 84.5 83.523.0 28.() 28.099.0 99.0 99.0
0.0
17.0 17.0 18.00.0
48.5 49.5 49.5
94.0 94.5 94.5 94.530,5 29.0 29.0 29.0
70.0 70.0 70.0 70.0
10.0 10.0 10.0 10.0 10.0 10.0 10.0 10.0 10.0 10.027.0 27.0 27.0 27.0 27.0 27.0 27.0 25.0 24.5 24.5
488.8 489.3 489.0 495.0 495.0 495.0 496.0 498.0 506.0 506.0
(a) The City departments were reorganized in fiscal year 2007.
Source: City of Milpitas, final budget
/
GcneraIGovcrnment Dl3nikling lie its•1iigineering and Planning •I’Ianning and Neighborhood Services •RecreationIJParks and Reercalion •Policc Fire
L.!u!eics—----—.-- —
76.3 76.3 77.0 77.3 77.0 77.0 78.022.0 23.0 23,0 23.0 23.0 23.0 23.078.0 78.0 79.0 78.8 79.0 97.0 (a) 98.050.5 49.5 49.5 55.5 55.5 (a)
16.5 (a) 16.528.5 29.0 29.0 29.0 29.0 (a)
50.0 (a) 49,0
94.0 94.0 94,0 94.0 94.0 94.031.5 31.5 30.5 30.5 30.5 30.5
71.0 71.0 70.0 70.0 70.0 70.0
Sworn PoliceCivilians
Fire:Firefighters and Safety
CiviliansUtilities
Total
121

Schedule 2 I
CITY OF MILPITAS
OPERATiNG INDICATORS BY FUNCTION/PROGRAM
LAST TEN FISCAL YEARS
Fiscal Year
2002 2003 2004 2005 2006
Function/ProgramBuilding and Safety
Building permits issued 1,735 1,777 1,650 3,156 3,788
Plan checked performed 340 536 590 650 l,I81
Public WorksStreet miles maintained 137 137 137 138 139
Customer Service Requests 4,150 4,000 3,506 3,500 3,326
Development projects reviewed 150 115 n/a n/a 293
Planning and Neighborhood Services
Customer Service Requests/Violations abated 2,023 2,065 1,656 1,620 1,802
Applications to Planning Commission 110 93 100 120 150
Parks and Recreation
Sports Center members 2,741 4,398 5,800 6,500 7,508
Senior nutrition meals served 23,886 23,886 16,139 16,932 19,421
Athletic Field maintenance (hours) n/a n/a 4,098 1,947 1,947
Police
Avg response time to emergency calls (minutes) n/a n/a 3:35 3:44 3:12
Number of anti-terrorist patrol checks n/a 2,924 7,649 10,664 12,8 13
Crime prevention presentations 191 175 201 180 179
Number ofvehicle citations issued 12,804 15,312 15,041 14,453 14,161
DARE presentations: schools/students 14/1468 14/1,456 13/1,610 14/1579 13/1538
FireEmergency calls for service 3,550 3,850 4,100 4,200 4,250
Public education events 140 75 73 73 70
Permits Inspections 3,750 2,160 1,909 2,514 4,231
Plan Review 1,420 660 786 845 1,005
UtilityClean sewer lines (feet) 552,000 347,670 358,610 500,000 500,000
Repair, replace or set water meters 678 399 341 422 425
Average daily consumption (thousands of gallons) 10,290 11,120 11,222 10,090 9,162
Source: City of Milpitas, final budget
I122 1

Schedule 2 I
Fiscal Year2007 2008 2009 200 2011
3,500 3,500 3,500 2,700 2,8001,000 1,000 1,000 800 800
139 139 139 139 1393,208 3,500 3,924 3,900 3,000
190 150 100 118 225
1,470 1,100 1,250 980 800165 150 112 84 45
7,885 8,278 8,500 10,000 1,20020,667 21,165 23,228 24,056 23,076
1,947 1,946 2,242 2,100 1,641
3:06 3:06 2:46 2:47 2:4912,300 3,500 3,500 1,469 1,469
190 240 275 266 28110,624 12,386 11,558 11,391 8,544
14/1572 14/1492 13/1440 12/850 11/845
4,000 4,368 4,300 4,400 4,40065 80 70 90 80
4,300 5,400 4,000 4,000 4,0001,000 750 995 1,000 900
500,000 500,000 500,000 550,000 500,000600 580 700 500 380
9,693 9,566 8,870 9,200 8,100
123

Schedule 22
CITY OF MILPITAS
CAPI1’AL ASSL’l’ S’I’ATISliCS BY FUNCTION/PROGRAM
LAST TEN FISCAL YEARS
Fiscal Year
2002 2003 2004 2005 2006
Funcli on/ProgramPublic Works
Miles of streets 137 137 137 137 139
Street lights 4,262 4,281 4,324 4,346 4,354
Square feet of buildings
maintained (in thousands) 252 299 344 350 350
City vehicles 657 618 626 631 635
Signs 6,900 7,050 7,150 7,250 7,167
Signal lights 64 66 68 68 68
City Parks 24 26 24 26 26
Acres of Parkland 178 161 171 172 172
Playgrounds 26 26 26 32 32
Parks and recreationCommunity centers I I I I
Senior centers I I I I
Sports cenlers 1 1 1 1 1
Swimming pools 3 3 3 3 3
Tennis courts 24 24 24 22 22
Football field I I I I
Baseball fields 21 21 21 21 21
Soccer fields 10 10 13 13 13
Basketball courts 5 5 5 5 5
Volleyball courts 7 7 7 7 7
Handball courts 4 4 4 4 4
PolicePolice stations 2 2 2 2 2
Police patrol vehicles 28 30 30 30 30
FireFire stations 4 4 4 4 4
Fire Apparatus 10 11 15 13 14
Fire hydrants 1,661 1,670 1,739 1,755 1,756
ljtilityMiles of water mains 198 199 202 203 204
Water Tank Storage
capacity (million of gallons) 15.64 15.64 15.64 15.64 15.64
Miles of sanitary sewers 167 168 168 173 173
Miles of storm drain 98 99 99 99 105
Milesofrecycledwatermain 7.5 7.5 7.5 11.0 11.0
Source: City of Milpitas, final budget
I 4t
Schedule 22
Fiscal Year2007 2008 2009 2010 2011
139 139 138 139 1394,354 4,435 4,460 4,496 4,496
350 350 350 350 427635 630 617 622 622
7.400 8,000 8,131 8,363 8,36368 68 7129 32 32 29 31
172 172 179 179 17830 29 37 33 33
1 1 1 1 11 1 1 1 1I I I I I4 4 3 4 4
22 22 24 20 171 1 1
21 21 21 15 1513 13 13 5 2
5 5 5.5 5.0 5.07 7 7 5 44 4 4 1 1
2 2 2 2 228 27 28 28 28
4 4 4 4 416 14 14 13 15
1,756 1,809 1,756 1,840 1,840
204 206 204 213 213
15.64 16.21 15.64 16.26 16.26173 177 173 178 17805 107 106 11(1 110
11.0 11.0 11.0 3.1 3.1
125