Embed Size (px)
Citation preview

ANNUAL DISCLOSURE
YEAR 2017
ACCORDING TO REGULATION (EU) 575/2013 /PART EIGHT – DISCLOSURE BY INSTITUTIONS/

2
TABLE OF CONTENTS
DISCLOSURE INDEX TABLE ............................................................................................................................................... 5
1 REPORTING ENTITY .................................................................................................................................................. 7
2 RISK MANAGEMENT, OBJECTIVES AND POLICIES ......................................................................................... 8
2.1 Overview ............................................................................................................................................................. 8 2.2 Risk Governance Bodies and Committees ............................................................................................. 9 2.3 Internal Audit Function .............................................................................................................................. 11 2.4 Compliance Function .................................................................................................................................. 12
3 INFORMATION ON RISK MANAGEMENT, OBJECTIVES AND POLICIES BY CATEGORY OF RISKS 13
3.1 Market, Countrerparty Credit Risk and Liquidity Risk ..................................................................... 13 3.2 Operational Risk ............................................................................................................................................ 17 3.3 Credit Risk........................................................................................................................................................ 19 3.4 Information on governance arrangements ........................................................................................ 20
4 SCOPE OF APPLICATION ...................................................................................................................................... 24
5 OWN FUNDS ............................................................................................................................................................ 25
6 CAPITAL REQUIREMENTS .................................................................................................................................... 26
7 EXPOSURES TO COUNTERPARTY CREDIT RISK ........................................................................................... 27
8 CAPITAL BUFFERS .................................................................................................................................................. 28
9 INDICATORS OF GLOBAL SYSTEMIC IMPORTANCE .................................................................................... 29
10 CREDIT RISK ADJUSTMENTS .............................................................................................................................. 30
11 UNENCUMBERED ASSETS ................................................................................................................................... 32
12 INFORMATION ABOUT NOMINATED ECAIS AND EIAS UNDER THE STANDARDISED APPROACH FOR CREDIT RISK .................................................................................................................................................. 33
13 EXPOSURE TO MARKET RISK ............................................................................................................................. 34
14 OPERATIONAL RISK ............................................................................................................................................... 35
15 EQUITIES IN THE BANKING BOOK .................................................................................................................... 37
16 INTEREST RATE RISK IN THE BANKING BOOK ............................................................................................. 38
17 SECURITISATION ..................................................................................................................................................... 39
18 LEVERAGE ................................................................................................................................................................. 40
19 USE OF THE INTERNAL RATING BASED APPROACH TO CREDIT RISK ................................................. 41
19.1 Overview .......................................................................................................................................................... 41 19.2 Qualitative information related to local IRB models ..................................................................... 42
20 CREDIT RISK MITIGATION TECHNIQUES ........................................................................................................ 45
21 REMUNERATION POLICY ..................................................................................................................................... 47
APPENDIX 1 .................................................................................................................................................................. 51 APPENDIX 2 .................................................................................................................................................................. 52 APPENDIX 3 .................................................................................................................................................................. 53 APPENDIX 4 .................................................................................................................................................................. 54 APPENDIX 5A ............................................................................................................................................................... 55 APPENDIX 5B ................................................................................................................................................................ 56 APPENDIX 5C ................................................................................................................................................................ 57

3
APPENDIX 5D ............................................................................................................................................................... 58 APPENDIX 6 .................................................................................................................................................................. 61 APPENDIX 7 .................................................................................................................................................................. 62 APPENDIX 8 .................................................................................................................................................................. 63 APPENDIX 9 .................................................................................................................................................................. 64 APPENDIX 10 ................................................................................................................................................................ 65 APPENDIX 11 ................................................................................................................................................................ 66 APPENDIX 12 ................................................................................................................................................................ 68 APPENDIX 13 ................................................................................................................................................................ 69 APPENDIX 14 ................................................................................................................................................................ 70 APPENDIX 15 ................................................................................................................................................................ 71 APPENDIX 16 ................................................................................................................................................................ 72 APPENDIX 17 ................................................................................................................................................................ 73 APPENDIX 18 ................................................................................................................................................................ 74 APPENDIX 19 ................................................................................................................................................................ 75 APPENDIX 20 ................................................................................................................................................................ 76 APPENDIX 21 ................................................................................................................................................................ 77 APPENDIX 22 ................................................................................................................................................................ 78 APPENDIX 23 ................................................................................................................................................................ 79 APPENDIX 24 ................................................................................................................................................................ 80 APPENDIX 25 ................................................................................................................................................................ 81 APPENDIX 26 ................................................................................................................................................................ 82 APPENDIX 27A ............................................................................................................................................................. 83 APPENDIX 27B ............................................................................................................................................................. 84 APPENDIX 27C ............................................................................................................................................................. 85 APPENDIX 28A ............................................................................................................................................................. 86 APPENDIX 28B ............................................................................................................................................................. 87 APPENDIX 29 ................................................................................................................................................................ 88 APPENDIX 30 ................................................................................................................................................................ 89 APPENDIX 31 ................................................................................................................................................................ 90 APPENDIX 32 ................................................................................................................................................................ 91 APPENDIX 33A ............................................................................................................................................................. 92 APPENDIX 33B ............................................................................................................................................................. 93
Declaration by the Manager charged with preparing the financial reports ............................................ 94

4
This report is prepared following the requirements of the Regulation (EU) 575/2013 of the European Parliament and of The Council, Part Eight – Disclosure by Institutions and of the EBA/GL/2016/11 Guidelines on disclosure requirements under Part Eight of Regulation (EU) 575/2013. As per the prescription of the EBA/GL/2016/11, below is a disclosure index table providing reference both to the requirements set in Part Eight of the Regulation (EU) 575/2013 and the EBA/GL/2016/11. All amounts, unless otherwise specified, are presented in Bulgarian Lev (BGN) rounded to the nearest thousand. Bulgarian Lev is the functional and reporting currency of UniCredit Bulbank AD. Data refer to prudential scope of consolidation. This document was prepared in accordance with specific Internal Regulation (Rules following the Annual Disclosure of capital adequacy information of UniCredit Bulbank AD). The disclosure of the Annual Consolidated Financial Statements is published on the website of UniCredit Bulbank AD (https://www.unicreditbulbank.bg/bg/za-nas/rezultati/finansovi-otcheti/).

5
DISCLOSURE INDEX TABLE
REGULATION (EU) 575/2013 EBA/GL/2016/11 ANNUAL DISCLOSURE
Article & Content Section & Template Chapter & Appendix
435. Risk management objectives and policies
Section 4.3. Chapter 2.; Chapter 3
Appendix 1 436. Scope of application Section 4.4.
Template 1; Template 2; Template 3
Chapter 4.
Appendix 2 Appendix 3 Appendix 4
437. Own funds Section 4.5. Chapter 5
Appendix 5 (A, B, C, D) 438. Capital requirements Section 4.6.
Template 4; Template 5; Template 6
Chapter 6
Appendix 6; Appendix 7
439. Exposure to counterparty credit risk
Section 4.11.
Template 25; Template 26; Template 27; Template 31; Template 32; Template 33
Chapter 7
Appendix 8; Appendix 9
440. Capital buffers Section 4.7., art.72 Chapter 8
Appendix 10; Appendix 11
441. Indicators of global systemic importance
Section 4.7., art.73 Chapter 9
442. Credit risk adjustments Section 4.8.
Template 7; Template 8; Template 9; Template 10; Template 11; Template 12; Template 13; Template 14; Template 15; Template 16; Template 17
Chapter 10
Appendix 12; Appendix 13; Appendix 14; Appendix 15; Appendix 16; Appendix 17; Appendix 18; Appendix 19; Appendix 20; Appendix 21; Appendix 22
443. Unencumbered assets Section 4.12. Chapter 11 444. Use of ECAIs Section 4.9.; Section 4.11.
Template 20; Template 28
Chapter 12
Appendix 23; Appendix 24
445. Exposure to market risk Section 4.13.
Template 34
Chapter 13
Appendix 25 446. Operational risk - Chapter 14 447. Exposures in equities not included
in the trading book - Chapter 15
448. Exposure to interest rate risk on positions not included in the trading book
- Chapter 16

6
REGULATION (EU) 575/2013 EBA/GL/2016/11 ANNUAL DISCLOSURE
Article & Content Section & Template Chapter & Appendix
449. Exposure to securitisation positions
- Chapter 17
450. Remuneration policy Section 4.14. Chapter 21
451. Leverage Section 4.15. Chapter 18
Appendix 26 452. Use of the IRB Approach to credit
risk Section 4.10.; Section 4.11.
Template 21; Template 29; Template 30
Chapter 19
Appendix 27 (A, B, C); Appendix 28 (A, B)
453. Use of credit risk mitigation techniques
Section 4.8.; Section 4.9.; Section 4.10.
Template 18; Template 19; Template 22; Template 23; Template 24
Chapter 20
Appendix 29; Appendix 30; Appendix 31; Appendix 32; Appendix 33 (A, B)
454. Use of the Advanced Measurement Approaches to operational risk
- Chapter 14
455. Use of Internal Market Risk Models Section 4.13.
Template 35; Template 36; Template 37; Template 38
Chapter 13

7
1 REPORTING ENTITY UniCredit Bulbank AD (the Bank) is an universal Bulgarian Bank established upon triple legal merger of Bulbank AD, HVB Bank Biochim AD and Hebros Bank AD. The merger was legally completed on April 27th, 2007 with retroactive effect commencing January 1st, 2007. UniCredit Bulbank AD possessed a full-scope banking licence for performing commercial banking activities. It is domiciled in the Republic of Bulgaria, with registered address Sofia, 7 “Sveta Nedelya” sq. In 2017 UniCredit Bulbank AD has received BBB/Negative rating by Fitch, one of the most respectable agency in the world. As of 1st of October 2016, UniCredit Bulbank AD is under the direct control of UniCredit S.p.A. after the transfer of the activities and ownership of the CEE Division from UniCredit Bank Austria (UCBA) to UniCredit S.p.A. (UniCredit Group/Holding Company)
8
2 RISK MANAGEMENT, OBJECTIVES AND POLICIES
2.1 OVERVIEW
UniCredit Bulbank offers a comprehensive range of banking and financial products and services to individuals and corporate customers including multinationals, public sector and institutional customers.
The Bank is fully integrated into UniCredit Group – a simple, successful Pan European Commercial Bank, with a fully plugged-in Corporate and Investment Banking, delivering a unique Western, Central and Eastern European network to the extensive franchise of 25 million clients.
UniCredit Group Strategy is long-term. The UniCredit Group is transforming through decisive actions to lay the groundwork for the future, changing the way it works to anticipate the clients’ medium-term evolution.
Following “Banking that matters” concept UniCredit Group has a simple and successful Pan European Commercial banking model delivering relevant solutions to the real needs and wants of today’s customers.
The strategic orientation of UniCredit Bulbank is to affirm and further strengthen the leadership position, both in terms of size and performance, as well as to create value for all its stakeholders. It is supported by various transformation initiatives under the umbrella of Group Transform 2019 Plan. The main transformational pillars for UniCredit Bulbank are in line with UniCredit CEE strategy: Combining the Innovations and Risk Discipline, keeping the Customer First, striving for Efficiency, Sharing & Replicating the best practices within UniCredit Group.
The implementation of UniCredit Bulbank strategy is guided by the five Fundamentals of UniCredit Group:
Customers First People Development Cooperation and Synergies Risk Management Execution and discipline
The Risk Appetite is defined at Group level reflecting macro-scenarios and the Group Ambition in terms of capital, financial structure and profitability. This definition includes the Risk Appetite Statement and the set of KPIs together with their applicable thresholds. The Risk Appetite Statement expresses the overall perception for the risk boundaries and focus of activities. It is a commitment to a robust business model with low risk framework. The Risk Appetite Statement provides an indication of the strategies necessary to manage key risks within the perimeter of the Group. Risk Appetite definition and approval are performed annually according to the timeline and stages in the planning calendar for Ambition and budget definition and the process of cascading the Risk Appetite to the Group’s Legal Entities essentially represents the definition of local Risk Appetite. In UniCredit Bulbank, the set of Risk Appetite KPIs and their applicable thresholds follow a top-down Holding Company proposal and are verified locally against regulatory requirements, budget and other applicable stand-alone assumptions. The local Risk Appetite Statement and set of Risk Appetite KPIs (Dashboard) are presented to the Bank’s Management Board for approval and is subject to subsequent Supervisory Board approval as well.
9
The Risk Appetite of UniCredit Bulbank reflects the ambition to:
Pursue a robust business model with low risk framework ensuring sustainable profits and return on equity above the cost of capital.
Ensure the fulfillment of regulatory requirements with solid capital position, also under stressed scenarios, and maintain the capacity to fulfill ordinary and extraordinary payment obligations while minimizing costs (LCR and NSFR above 100%).
Maintain an efficient level of costs while still managing customer relations in the best possible way.
Keep specific risks under control and set boundaries for management decisions.
The annual process of defining and setting the Group Risk Appetite and the subsequent cascading to the level of local Risk Appetite is described in the Group Risk Appetite Framework Management.
2.2 RISK GOVERNANCE BODIES AND COMMITTEES
Supervisory Board The Supervisory Board (SB) performs preliminary, current and consecutive control on the compliance of the Management Board’s and the Bank's activities to the applicable laws, the Statute and the decisions of the General Meeting of the shareholders in the interest of the Bank's clients and shareholders.
Management Board The Management Board (MB) arranges, administers, supervises and solves all the problems related to the Bank’s activity except from those which by the force of law or the Statute are within the competence of the General Meeting of the Shareholders or the Supervisory Board.
Risk Committee The Risk Committee is an independent permanent advisory body appointed and dismissed by the SB of the Bank. The Risk Committee advises the Supervisory Board and the Management Board of the Bank on the Bank’s overall current and future risk appetite and strategy and assist the SB and MB in overseeing the implementation of the strategy by senior management of the Bank. For avoidance of doubt the Risk Committee has advisory functions only, and the SB and MB retain overall responsibility for risks, the risk management and control.
Credit Committee The Credit Committee is a collective body for taking credit decisions, in accordance with the Statute and the relevant resolutions of the Management Board and the Supervisory Board. The Credit Committee also discusses proposed new products, internal credit rules, in compliance with regulations, takes relevant decisions or submits the issue for approval by the Management Board and/or Supervisory Board.
Credit Council The Credit Council is a collective body for taking credit decisions in the scope of granting loans in compliance with the statutory requirements and internal bank regulations, applicable at the moment of considering the specific loan application, and the relevant resolutions of the Management and/or Supervisory Board.

10
Provisioning and Restructuring Committee (PRC) The Provisioning and Restructuring Committee is a standing specialized internal body, responsible for the monitoring, evaluation, classification, and provisioning of risk exposures for losses from impairment, restructuring and write-off of risk exposures of the Bank.
The Credit Monitoring Commission The Credit Monitoring Commission is a collective specialized internal body established for taking decisions, corresponding to the process of monitoring of loans to business, corporate and key clients.
Asset-Liability Committee (ALCO) ALCO is equipped with decision authority in following areas:
Integrated management of both balance sheet and off-balance sheet in given legal, regulatory and tax framework.
Definition of boundary conditions for customer business (except credit risk and operational issues).
Set-up of Profit centres. Development of system that generates justice, economically motivating signals. Mainly proper internal transfer pricing (FTP). Ultimately also capital should be allocated to individual Profit centres (RAROC concept).
Risk management system in “ALCO areas” (i.e. Market Risk, Liquidity Risk).
Decisions within boundaries defined by Legal environment, BNB and Group. Proposals in name of Bank (to change Group boundaries)
Operational and Reputational Risk Committee The established Operational and Reputational Risk Committee greatly enhanced the regular exchange of information and promotion of the operational risk awareness within the Bank. Meetings are held quarterly and are attended by the Bank’s senior management. The Operational and Reputational Risk Committee acts also as a Permanent Workgroup, where current operational and reputational risk issues and developments are reported, and serves as a platform for discussion of unresolved issues for the purpose of finding risk mitigation solutions. General purpose: Optimization of Operational and Reputational Risk management within the Bank through:
Regular exchange of information on Operational risk and Reputational risk affecting different units;
Improvement of internal communication for finding proper risk mitigation solutions;
Coordination of regular risk activities such as limits, key risk indicators, risk scenarios, loss data collection;
Introduction and implementation of Regulatory OpRisk requirements;
Introduction and implementation of OpRisk and RepRisk UniCredit Group standards;
Level of competence – the entire bank and subsidiaries;
Functions as a Permanent Workgroup (PWG) as per the Group Operational Risk Management Global Policy and Operational Risk Permanent Workgroup Operations Global Process Regulation; PWG documents are the Committee’s presentation and meeting minutes;
Decision taking body, reconfirmed by the Management Board;
Related activities: internal audit, legal, HR, security, operations, insurance, money laundering, out-sourcing, etc.
11
Internal Control Business Committee (ICBC) The UniCredit Bulbank’s Internal Control Business Committee (ICBC) supports the General Manager in the assessment of the overall Internal Control System adequacy (“System” or “ICS”) in the Bank through:
The analysis of the critical topics,
Monitoring and prioritization of the corrective actions related to ICS, in order to contribute to the efficiency and effectiveness of the ICS.
The UniCredit Bulbank’s ICBC supports the General Manager by consolidating ICS relevant topics within one committee putting forward recommendations in the examination of the proper functioning of the ICS in the Bank in order to protect the needs of business and customers and ensure compliance with external regulations as well as Group guidelines and policies and intra-bank regulations
Audit Committee The main functions of the Audit Committee are:
To monitor the financial reporting processes in the Bank;
To monitor the effectiveness of the Bank’s internal control system and to analyze the related periodic information;
To monitor the effectiveness of the risk management system in the Bank;
To monitor the effectiveness of the independent financial audit in the Bank;
To supervise the external auditing process and the registered auditors’ activity;
To evaluate the results of the work performed by the registered auditors and to examine the status of relations with them;
To examine, at least once a year, the adequacy of accounting principles used in the process of preparation of the annual and interim financial statements on the basis of reports and information provided by the responsible Bank officers operating within the related function, and, to discuss them, at its sole discretion, with the registered auditors;
To review the independence of the registered auditors of the Bank in accordance with the legal requirements and the Code of Ethics of professional accountants, and to monitor the provision of additional services by the registered auditors to the Bank;
To ensure the relationship with the registered auditors, by receiving the terms of engagement, and to assess the audit findings and recommendations, as well as the ones issued by other external supervision and control authorities;
To evaluate the findings of the Bank’s Internal Audit or the examinations and/or investigations of other responsible Bank officers operating within the related Function.
2.3 INTERNAL AUDIT FUNCTION
Internal Audit is an independent function established by Governing Bodies of UniCredit Bulbank and it is an integral part of the internal controls environment. It carries out an independent, objective assurance and consulting activity in order to evaluate, add value and improve Internal Control System. Internal Audit Department of UniCredit Bulbank is in charge of the internal audit activity within the local banking group, including UniCredit Bulbank and its subsidiaries.
The audit engagements are executed according to the UniCredit Group Internal Audit Framework applied in compliance with the local legal requirements and regulations and is based on the

12
International Audit Standards. UniCredit Bulbank Internal Audit is subject to a periodic quality assessment, external to the assessed function, which is realized by Audit Quality Assurance department of UniCredit S.p.A (Italy).
To achieve the degree of independence necessary to effectively carry out the responsibilities of the internal audit activity, Head of Internal Audit Department reports to the highest level of corporate governance of UniCredit Bulbank. Chief Audit Executive (CAE) is appointed with a resolution of the General Shareholding Meeting and interfaces with the Statutory Bodies, Audit Committee, UniCredit Bulbank’s governing bodies including all the managerial levels, Supervisory Authorities and External Auditors as well.
Internal Audit activity is duly planned, controlled and recorded in order to determine priorities, establish and achieve objectives.
In accordance with the provisions of Ordinance 10 of BNB, reports with the results of the internal audit activity including assessment of the control systems, measures and actions undertaken are duly prepared and presented to the Governing bodies on a quarterly and annual basis.
2.4 COMPLIANCE FUNCTION
The Compliance function in UniCredit Bulbank is organized as a Compliance Department with two Units - General Compliance Unit and Anti Money Laundering Unit. The Head of the Compliance Department reports to the Chief Executive Officer of the Bank.
Among the functional range of the General Compliance Unit are to conduct monitoring on compliance risk (second level controls), to prepare proposals for organizational and procedural changes in order to ensure the proper management of the identified compliance risks, to advice and assists the Top Management in all matters concerning compliance risk, to analyse the compliance/reputational risk in new products and businesses, etc.
Among the functional range of the Anti-Money Laundering Unit are to conduct monitoring and where necessary approval of documentation related to customer identification for existing and new customers, to ensure timely and accurate communication with the Financial Intelligence Agency (FIA), Bulgarian National Bank and/ or law enforcement agencies (as directed by law and bank policy), etc.

13
3 INFORMATION ON RISK MANAGEMENT, OBJECTIVES AND POLICIES BY CATEGORY OF RISKS
UniCredit Bulbank is exposed to the following risks from its use of financial instruments:
Market Risks Liquidity Risks Credit Risks Operational and Reputantional Risks
Different types of risks are managed by specialized departments and bodies within the Bank’s structure. The applicable policies entirely correspond to the requirements of Risk Management Group Standards as well as all respective requirements set by Bulgarian banking legislation.
3.1 MARKET, COUNTRERPARTY CREDIT RISK AND LIQUIDITY RISK
3.1.1 Management of Market risks Market risk management in UniCredit Bulbank and consolidated subsidiaries encompasses all activities in connection with Markets and Investment Banking operations and management of the balance sheet structure. The collective Bank’s body with delegated by MB decision authority for market, liquidity and integrated risks management is ALCO (Assets and Liabilities Committee). Risk monitoring and measurement in the area of market and liquidity risks, along with trading activities control is performed by Market Risk unit. Prudent market risk management rules and limits are explicitly defined in the Market Risk Strategy document of UniCredit Bulbank, reviewed at least annually. A product introduction process is established, in which risk managers play a decisive role in approving a new product. UniCredit Bulbank applies uniform Group risk management procedures. Risk positions are aggregated at least daily, analyzed by the independent Market risk management unit and compared with the risk limits set by the Management Board and ALCO. For internal risk management and Group compliant risk measurement, the Bank applies UniCredit Group’s internal model IMOD. It is based on historical simulation with a 500-day market data time window for scenario generation and covers all major risk categories: interest rate risk and equity risk (both general and specific), currency risk and commodity position risk. Internal model also includes quantification of Stressed VaR and Incremental Risk Charge values. The simulation results, supplemented with distribution metrics and limit utilization are reported on a daily basis to the Management and the responsible business units. Reliability and accuracy of the internal model is monitored via daily back-testing, comparing the simulated results with actually observed fluctuations in market parameters and in the total value of books.
A set of granular sensitivity-oriented limits accross asset classes is defined as complementary to VaR measure. The most important detailed presentations include: basis point shift value (interest rate /spread changes of 0.01 % by maturity bucket), credit spread basis point value (credit spread changes of 0.01% by maturity bucket) and FX sensitivities. In the interest rate sector, the Basis-

14
Point-Value (BPV) limit restricts the maximum open position by currency and time buckets, with valuation changes based on shift by 0.01% (1 basis point). Additional element is the loss-warning level limit, providing early indication of any accumulation of position losses. Internal model results are complemented by various stress scenarios to identify potential effects of stressful market conditions on the Bank’s earnings. The assumptions under such stress scenarios include extreme movements in prices or rates and deterioration in market liquidity. Stress results for major asset classes and portfolios (credit, rates and FX) and estimated impact on liquidity position are reported at least monthly to ALCO. In 2017 the Bank’s Management continued prudent risk management practice with primary focus on client-driven business. Market risks in the trading book In accordance with the Capital Requirements Regulation, and as defined in Group policy “Eligibility Criteria for the Regulatory Trading Book assignment”, Trading Book is defined as all positions in financial instruments and commodities held either with trading intent, or in order to hedge positions held with trading intent. Books held with trading intent are composed of:
Positions arising from client servicing and market making; Positions intended to be resold short term; Positions intended to benefit from actual or expected short-term price differences
between buying and selling prices or from other price or interest rate variations.
The above defined “trading intent” is essential requirement for assignment to Regulatory Trading Book. Additionally, the following requirements have to be assessed:
Tradability - refers to positions free of restrictions on their tradability and coherently reflected within the “Trader Mandate” of the risk-taker;
Marketability - refers to positions for which a reliable Fair Value can be evaluated based on independently verified observable market parameters;
Hedgeability - refers to positions for which a hedge could be put in place. The hedgeability is meant to apply for “material” risks of a position.
When opening a new book, the risk-taker makes proposal if the book should be managed as a Trading Book or a Banking Book based on the planned trading activity. The risk-taker is required to clearly declare the trading intent and therefore to explain the business strategy behind. For risk management purpose UniCredit Bulbank uses the group internal model, incl. stressed VaR and Incremental Risk Charge (IRC).
3.1.2 Management of Counterparty credit risk Counterparty credit (CCR) risk arises from exposures due to:
transactions in derivative instruments; repurchase agreements; securities lending or borrowing transactions; margin lending transactions; long settlement transactions
For the purpose of mitigating counterparty risk and settlement risk, the Bank has approved credit limits for pre-settlement risk (derivatives, repo’s, MM) and settlement risk. UniCredit Bulbank employes the Group internal model method for counterparty risk measurement and limit compliance control. The limit relevant value or Conditional expected shortfall is determined as weighted average of the exposures’ distribution on the counterparty’s hazard rates of all scenarios higher than 87.5% scenario.

15
Market Risk unit monitors on a daily basis the exposures and escalates limit breaches for resolution. UniCredit Bulbank mitigates Counterparty Credit risk from derivatives and other transactions exposed to CCR through the use of netting, collateralisation and Central Counterparties. Netting allows for the aggregation of positive and negative Mark-to-Market derivative transactions with the same counterparty to be offset, hence reducing exposure if either counterparty were to default. Collateral agreements (if legally enforceable in the jurisdiction) might be required, depending on the creditworthiness of the counterparty and the nature of the transaction. Management of Wrong Way Risks Both Holding Company and Legal Entities CCR control functions assess and manage the Wrong Way Risk, arising when the risk factors driving the exposure to a counterparty are positively correlated with the credit worthiness of that same counterparty. Wrong way Risk is then distinguished in Specific Wrong Way Risk (SWWR) and General Wrong Way Risk (GWWR). Specific Wrong Way Risk arises when the exposure on a transaction is positively correlated with the counterparty’s creditworthiness for a reason that is specific to the counterparty. Most commonly this kind of correlation is seen where there is similar material legal/economic ownership between collateral/reference entity and counterparty. In detail, Specific Wrong Way transactions are likely to generate higher exposures than standard industry PFE (Potential Future Exposure) methodologies would indicate, as the latter applies to plain vanilla derivatives and assumes limited correlation. The Specific Wrong Way Global Policy aims to complement our exposure calculation methodologies by providing a unified group wide framework for the appetite, definition, risk monitoring and management of Specific Wrong Way Risk exposures. General Wrong Way Risk arises when the credit quality of the counterparty is correlated with a risk factor which also affects the value of the transaction with the Group. The Global policy relating to the General Wrong Way Risk aims at defining the framework for analysing, monitoring and managing the potential impact of GWWR risk by product, region and industry and it also seeks to add additional levels of control to General Wrong Way Risk transactions.
3.1.3 Management of Liquidity risks Liquidity risk is the risk that UniCredit Bulbank is unable to meet its financial obligations as they become due. In UniCredit Bulbank the governance and control of the exposure of the liquidity risk is performed through setting and monitoring of several operating restrictions on a group of liquidity metrics, with the aim to prevent potential vulnerabilities in the bank's ability to meet its cash flow obligations. For some metrics, a monitoring only process is provided without setting specific restrictions. At least on a yearly basis, the risk limits and thresholds are reviewed and calibrated in order to align the risk appetite framework with the bank’s strategy. UniCredit Bulbank has set targets and early warning indicators which, when breached, will trigger corrective actions in order to ensure that the bank remains within its risk appetite. UniCredit Bulbank’s stress test framework assesses the bank’s liquidity adequacy and the main objective is to determine whether it has sufficient liquid assets to ensure it is operating within the liquidity and funding risk appetite framework. Under a managerial perspective, the bank has to keep an amount of liquidity that is such as to survive a combined scenario of the liquidity stress test. The details of principles and rules for the control of UniCredit Bulbank’s exposure to liquidity risk are included in the Global Process Regulation – Limits Setting, Monitoring and Escalation of Breaches.

16
In UniCredit Bulbank the monitoring of liquidity risk is performed at three levels: UniCredit Group level: the Holding Company is in charge of overseeing the Group’s
liquidity in terms of compliance with the consolidated limits and warning/trigger levels and with those of all the liquidity reference banks and legal entities;
UniCredit Bulbank: is responsible for compliance with its own limits and warning/trigger levels and with those of the Legal Entities falling within UniCredit Bulbank Group.
Legal Entities within UniCredit Bulbank Group: they are responsible for compliance with their own limits.
A thorough description of the liquidity management set up and the relations among each single component can be found in the Liquidity Management & Control Global Policy.
Structure and organization of the liquidity risk The main relevant functions working on managing liquidity are ALM, Treasury and Liquidity Risk function. The monitoring of relevant set of Liquidity Indicators is carried out by these functions, according to their own responsibilities. They perform first and second level controls on liquidity, interest rate and exchange rate refinancing risk management. From an organizational point of view, this system of check and balances ensures that the Bank has always sufficient liquidity to face its obligations in business as usual and stressed conditions. From an operational perspective, this organizational framework operates both in a Going Concern situation and in a Contingency situation. An important tool that ensures the proper working of the check and balances system in place is the set of liquidity risk metrics, defined within the Risk Function, in cooperation with ALM and Treasury structures. The liquidity risk metrics are described in the document GOR “Liquidity Risk Taxonomy” and in the annexes for its local implementation.
Following the EBA/GL/2017/01 Guidelines on LCR disclosure to complement the disclosure of liquidity risk management under Article 435 of Regulation (EU) 575/2013, the information related to Templates EU LIQ1: LCR disclosure template and the template on qualitative information on the LCR is presented below.
The LCR disclosure template on quantitative information of LCR is presented in APPENDIX 1 – EU LIQ1: LCR disclosure template on quantitative information (Template EU LIQ1, EBA/GL/2017/01).
The qualitative information on LCR, which complements the LCR disclosure template (EU LIQ 1) is described below:
Measurement and reporting of liquidity risk UniCredit Bulbank measures both short-term and structural liquidity. The metrics included in 2017 RAF were:
the funding gap, that measures the structural liquidity risk and the dependence from the volatility of the wholesale market;
the 3 month gap of the operative maturity ladder, that measures the short- term liquidity risk;
the Liquidity Coverage Ratio (LCR), a regulatory metric that measure the contingency risk; the Net Stable Funding Ratio (NSFR), that measures the structural liquidity risk.
Through the risk appetite framework, the bank monitors and controls the evolution of the funding gap due to the commercial activity. This metric quantifies the difference between commercial loans and commercial sources of funding and as such it represents the amount of loans to customers to be covered via funding provided/managed exclusively by Treasury/Finance. Short-term liquidity (operative maturity ladder) is the main metric used to measure the short term liquidity position and is composed of Primary Gap and Counterbalancing Capacity (CBC). The STL limits are set in order to indicate whether the Bank remains in a position to fulfil its cash payment obligations, be they expected or unexpected.
17
Liquidity Coverage Ratio is calculated according to the Delegated Act rules. While the operative maturity ladder and the LCR restrictions ensure that the liquidity reserves are adequate, the respect of the NSFR ensures that the bank maintains an appropriate balance between assets and liabilities in the medium-long term (beyond one year), preventing additional pressure on the short term liquidity position. Concentration of funding and liquidity sources The Funding Plan includes the set of funding instruments (with relevant amount, maturity, timing, cost) to be realized in order to cover the expected funding needs deriving from the evolution of the liquidity uses and sources, avoiding unsustainable pressure on the short-term liquidity position and respecting internal and regulatory liquidity risk limits. Currency mismatch The Bank has specific restrictions in place on the foreign exchange liquidity risk. These restrictions aim to maintain the short-term liquidity gaps in foreign currency within sustainable levels, taking into account the bank’s access to the specific currency on the interbank market and in the Central Bank.
3.2 OPERATIONAL RISK
Operational risk is defined as the risk of loss resulting from inadequate or failed internal processes, people and systems or from external events (including legal risk). Examples include compensations paid to customers for incorrect/inadequate product-related advice, IT system failures, damage to property, processing errors or fraud, subject to consolidated risk measurement and management (collection of loss data, external data, scenarios, indicators), on which the calculation of capital held for operational risk is based. Legal and compliance risk is a sub-category of operational risk: it is the risk to earnings from violations or non compliance with laws, rules, regulations, agreements, prescribed practices or ethical standards.
UniCedit Bulbank Management Board is responsible for operational risk oversight, also with the support of Audit Committee and UniCredit Bulbank Operational and Reputational Risk Committee.
In UniCredit Bulbank the operational risk management framework is a combined set of Global policies, Global Operation Instructions and Global Process Regulations for controlling, measuring and mitigating the operational risk exposure, which includes the guidelines of UniCredit Group and local documents. An integral part of the framework is the internal regulation “Data collection procedure for the purpose of operational risk assessment in UniCredit Bulbank”.
The Bank has a dedicated function to operational risk management, which is independent from business and operational areas. The responsibilities of the unit are in line with those envisaged by the Holding Company. Nominated operational risk managers in the branch network and the Head Office, working on a decentralized basis, are responsible for loss data identification and reporting as well as for adoption of measures to reduce and prevent risks in their respective areas. Reputational Risk function is within the scope of the responsibility of the Operational and Reputational Risk Unit. Reputational risk is defined as the current or prospective risk to earnings and capital arising from adverse perception of the image of the financial institution on the part of customers, counterparties, shareholders/investors, regulators or employees (stakeholders). All relevant rules and policies for the management and monitoring of the Reputational Risk exposure have been adopted in full compliance with the UniCredit Group guidelines. Under the Reputational risk process, special attention is paid to the management and monitoring of the Bank’s exposure

18
towards economic sectors and transactions, such as Defence/Weapons, Nuclear energy etc. The Operational and Reputational Risk Unit continued to develop the reputational risk process in compliance with UniCredit Group principles, policies and rules for monitoring the Reputational risk exposure.
The main activities of the Operational and Reputational Risk Unit in 2017 were focused on the further development of the Operational Risk management, with emphasis on preventative and mitigation actions to reduce future losses.
A significant part of the resources of the Operational and Reputational Risk Unit were also devoted towards the implementation and monitoring of the 2017 Operational Risk Strategies of the Bank (Operational risk strategies deploy their effect in a multiyear perspective) and include different approaches to mitigate Cyber risk, Credit application fraud, Compliance risk, etc. As part of the definition of the Operational Risk Strategies 2018, the Business Syndication activity was performed. This activity is performed by the OpRepRisk unit in order to collect information related to business strategies in a forward looking perspective. The aim is to measure the operational risk arising from Strategies implementation using also risk indicators. Additionally, the Operational and Reputational Risk team was also deeply involved in several critical initiatives for the Bank, such as projects covering the General Data Protection Regulation (GDPR), the second Payment Services Directive (PSD2), Anti-money Laundering, the upgrade of the core banking system, etc.
The Bank applies the Advanced Measurement Approach (AMA) for calculation of capital requirements of operational risk and is the first bank in Bulgaria certified to use this approach, after authorisation received by Bank of Italy (as UniCredit Group’s Supervisory Authority) and BNB.
The internal AMA model developed by UniCredit Group is based on internal loss data, external loss data (consortium and public data), scenario data and risk indicators. The Group AMA capital at risk is distributed through a risk-sensitive allocation mechanism to those legal entities that are authorized for AMA use. The AMA Capital charge for UniCredit Bulbank was significantly reduced (16%) as of 4Q2017 due to AMA model decision tree recalibration, significantly decreasing OpRisk losses evolution, and forward looking risk (scenario analysis) reduction.
In UniCredit Bulbank operational risk reduction is accomplished with the use of insurance policies, as well as other risk transfer methods, among which outsourcing activities. The criteria for risk reduction through insurance are formalized in the Insurance Strategy of the Bank, which defines the policy of securing the bank risk profile with adequate and optimal insurance coverage, including the main inherent risk categories to the performed activities along with the overall risk exposure. As far as outsourcing as an operational risk transfer technique is concerned, examples of outsourced services in the Bank are security services (branch security and ATM full servicing), cash counting services, IT and other services maintenance.
Apart from the above mentioned, the participants in the Operational and Reputational Risk Committee1 on a quarterly basis identify and propose risk mitigation solutions in their respective areas of responsibility in the Bank.
Moreover, the risk culture has been constantly spread out throughout the organization. All the training activities, combined with methodological guidance and support to the other structures within the Bank by the OpRepRisk unit ensure the outstanding OpRisk awareness at Bank level. In this regard, at the end of 2017, a dedicated OpRisk training was organized and took place as a webinar for the OpRisk managers in the branch networks both in Retail Banking and Corporate Investment and Private Banking Divisions.
1 Operational and Reputational Risk Committee monitors also the exposure to reputational risk, as well as identifies and proposes risk mitigation solutions.
19
3.3 CREDIT RISK
Credit risk is defined as potential losses arising from unfulfilment of any contractual obligation with regard to financial instruments receivables.
The Bank effectively manages the credit risk inherent to its trading and banking book. The policy of the Bank related to the credit deals is determined by the principles of conformity with the law, safety, stability, profitability and liquidity. Main Authority Bodies in the credit process are (top - down):
The Supervisory Board The Management Board The Credit Committee The Credit Council The Chief Risk Officer The Head of Credit Risk Department The Senior Managers of Corporate Credit Underwriting Unit, Small Business Credit
Underwriting Unit, Individuals Credit Underwriting Unit within the structure of Credit Risk Department
Senior Risk Managers
The Supervisory Board is a collective body, which approves the credit policy and the Rules for lending. The Supervisory Board carries out its activity according to the strategic guidelines determined by the General Meeting of the Shareholders. The Management Board is a collective body, which defines the guidelines in the credit policy and directions for assuming of a credit risk. The Management Board has the highest operative authority power in the credit process. The Management Board, on proposal of the Chief Risk Officer, approves/terminates the limits of the individual authority bodies. The Credit Committee is a collective body that applies the credit policy of the Bank - it manages and controls the entire credit activity in UniCredit Bulbank. The Credit Committee carries out its activity according to the internal lending rules and a Statute, approved as per decision of the Management Board of the Bank. The Credit Council is a collective body with less authority power than the Credit Committee. The Credit Council carries out its activity according to the present rules and a Statute, approved as per decision of the Management Board of the Bank. The Chief Risk Officer organizes the operative management of the credit process, exercising control for the exact execution of the decisions of the collective authority bodies – Supervisory Board, Management Board, Credit Committee and the Credit Council. The Head of Credit Risk Department delivers his decision on credit deals, which exceed the authorization of the Head of the Underwriting Units if they are within his authorization according to the internal lending rules. When the deal exceeds his authorities the Head of Credit Risk Department present the application with his opinion for consideration to the Credit Council.
The members of the Management Board, Credit Committee and Credit Council, the executives with managing functions, persons, authorized to represent the Bank under credit deals, including employees involved in the credit process, do not participate in the negotiations, in the preparation

20
of reports, in the discussions and do not have voting decisions under credit deals, under which they or members of their families:
are parties under the contract with the Bank; have substantial commercial, financial or other type of business interest in terms
of the deal/ person, who is a party under the contract with the Bank. They are obliged to declare in advance the presence of business interests.
The authorities under credit deals are exercised at full differentiation between the credit and commercial function and undependently of the approved for the relevant structural unit budget. Right to take decisions under credit deals have the authorities /bodies/ of the Bank within their relevant applicable limits in accordance with the internal rules. The level of every body is a function of the determined for it level of risk and competences for risk assessment in accordance to its place in the hierarchy of the organizational structure of the Bank. The Provisioning and Restructuring Committee is a standing specialized internal body responsible for the monitoring, evaluation, classification, and provisioning of risk exposures. The Credit Monitoring Commission is a collective specialized internal body established for taking decisions, corresponding to the process of monitoring of loans to business, corporate and key clients.
Credit risk monitoring and management is also focused in fulfillment of statutory lending limits set in Law on Credit Institutions. Exposures to one client exceeding 10% of the capital base are treated as big exposures and has to be approved by the Management Board. Maximum amount of an exposure to one client or group of related clients must not exceed 25% of the capital base of the Bank.
3.4 INFORMATION ON GOVERNANCE ARRANGEMENTS
3.4.1 Directorships held by members of the management body
The members of the Management Board of UniCredit Bulbank AD hold the following directorship positions: The CEO of UniCredit Bulbank AD is holder of one directorship position as member of the
Management Board of UniCredit Bulbank AD and as member of the Supervisory Boards of
its wholly owned subsidiaries UniCredit Consumer Financing EAD and UniCredit Leasing
EAD, and of second directorship position as member of the Board of Directors Borica AD;
The General Manager is holder of one directorship position as member of the Management
Board of UniCredit Bulbank AD and as member of the Supervisory Boards of its wholly
owned subsidiaries UniCredit Consumer Financing EAD and UniCredit Leasing EAD;
Head of Retail Division is holder of one directorship position as member of the
Management Board of UniCredit Bulbank AD and as member of the Management Board of
its wholly owned subsidiary UniCredit Consumer Financing EAD;
Head of Corporate and Investment Banking and Private Banking (CIB&PB) Division is holder
of one directorship position as member of the Management Board of UniCredit Bulbank
AD, as member of the Supervisory Board of its wholly owned subsidiary UniCredit Leasing
EAD and as member of the Board of Directors of its wholly owned subsidiary UniCredit
Factoring EAD;

21
CFO is holder of one directorship position as member of the Management Board of
UniCredit Bulbank AD and as member of the Supervisory Boards of its wholly owned
subsidiaries UniCredit Consumer Financing EAD and UniCredit Leasing EAD;
CRO is holder of one directorship position as member of the Management Board of
UniCredit Bulbank AD and as member of the Supervisory Board of its wholly owned
subsidiary UniCredit Consumer Financing EAD;
Head of Global Banking Services (GBS) is holder of one directorship position as member of
the Management Board of UniCredit Bulbank AD and of second directorship position as
member of the Board of Directors of Cash Service Company AD.
3.4.2 Recruitment policy for the selection of members of the management body
In compliance with BNB requirements and Ordinance No. 20 on the Issuance of Approvals to the Members of the Management Board (Board of Directors) and Supervisory Board of a Credit Institution and Requirements for Performing their Duties, the candidates are assessed on the basis of completed fitness and propriety question form. They meet the requirements under Article 11, paragraph 1, items 3–8 of the Law on Credit Institutions and cover fitness and propriety requirements necessary to hold the position.
UniCredit Bulbank established the Nomination and Compensation Committee. The Committee has the power to nominate and recommend candidates to be appointed as members of the Management Board, considering their experience and qualification needed for the bank’s management and in view with the existing regulations. The Nomination and Compensation Committee has the responsibility for performing the internal assessment of the candidates for members of the Management Board
UniCredit Bulbank has adopted and implemented the rules of General guidelines on the structure, composition and remuneration of the Corporate Bodies of Group Companies, as well as procedures for the appointment of corporate officers. The policy, without prejudice to local law and/or regulations application, has the aim to define the principles, guidelines and rules for the management of corporate members at Group level with regard to: structure of the Corporate Bodies and requirement of their Members with the aim to
balance the presence of Internal and External (independent) Members, an appropriate
gender balance and an adequate composition to oversee efficaciously the whole business
operation for the management and control;
remuneration for the positions assigned according to the type and economic relevance of
the subsidiaries , considering – inter alias – the corporate complexity, the business activity
and the connected risk profile, the customer operation and the multiplicity of the products
offered.
UniCredit Group has a structured succession EDP (Executive Development Process) and TMR (Talent Management Review) for identification and evaluation of potential succssesrors for managerial positions/roles.
3.4.3 Diversity policy, including the policy on gender diversity
At the end of December 2017, the presence of Women in top and middle management positions was assessed as balanced. Overall the rate of female SVP&Above went up from 25% to 43%. Regarding Competence Lines, the female presence is balanced among FVP in managerial roles across all above mentioned lines, with the exception of GBS. In 2017 women are 41% of the Executive population and 46% of talaents.

22
Female Appointment Index had slightly increased in the last four years and stands at 51.2% in 2017. Demographic data show that for female VP and FVP, Age and Seniority are aligned, which signals that women have grown professionally within the Bank.
3.4.4 Risk Reporting to Management
Risk reporting to management body covers information for all types of risks in UniCredit Bulbank: credit, market, liquidity, operational and reputational risks. The Bank has set up a reporting system based on risk profiles/parameters and the reports are prepared on a daily, weekly, monthly, quarterly and annually basis. Recipients of the information are Management board, Risk Committee, Credit Committee, ALCO, PRC, Operational and Reputational Risk Committee, other control functions in the Bank, responsible Board members, Head of Departments, Senior Managers as well as Holding Company’s competence lines.
In order to improve the overall transparency of the Risk Reporting process in the Bank and aiming to have a clear overview of both internal and external managerial reports produced by the Risk Management functions, a Risk Reporting Map was introduced in 2015.
The latter was prepared and implemented through the participation of all subordinated functions in risk competence area under the supervision of the Chief Risk Officer of the Bank, where each single report is amended on the initiative of the respective Collective Body or MB member, and it is properly reviewed on a semi-annual basis.
The Risk Reporting Map valid as of the end of 2017 contains the following main information depending on the respective Risk function:
The Credit Risk reports might be differentiated on the basis of the specifics of the credit risk metrics: Loan Portfolio – monthly Credit Risk Report including loan portfolio evolution, asset quality, loan loss provision charge and coverage, segments, regions, products and top 20 obligor performing and non-performing group; monthly Risk class migration of the loans, Individually assessed exposures for the month, etc. A Credit Risk Profile on consolidated basis is submitted to the Supervisory Board and includes information about credit risk profile for each Legal Entity, per segment and debt migration. Credit Risk Models – separate Validation report for each credit risk model (PD, EAD, LGD) that has been developed and is currently in use. Validation reports are preparated on annual basis and presented to MB for approval. Credit Risk Control and Risk Integration – yearly ICAAP report is prepared and submitted to MB (and BNB) containing quantitative information regarding Econimic Capital, AFR and RTC end-of-year results and stress test, Risk Apetite summary, main Balance sheet and P&L items and KPIs as well as description of models and procedures for measuring risks according to internal models (Economic Capital). Risk Appetite Dashboard is prepared on quarterly basis including actual end-of-quarter values of Risk Apetite KPIs against their approved thresholds. Three different reports are produced on a quarterly basis related to data quality issues including Collateral Data Quality Report for missing information for collateral (insurance, market evaluation, statutory validity, wrong rank of mortgage, etc.); Rating Data Quality Report in respect of unrated customers, Age Restrictions, inadequate rating model used, etc.; and Tableau de Board reflecting the main issues detected during the analysis of data quality controls performed on the local PD models.
23
Systematic Monitoring – quarterly Watch List Report is produced with the purpose to indicate endangered customers with newly detected monitoring triggers, for which Risk Mitigation strategy has to be applied. Additionally, analysis of the Watch list is presented including volume, structure, dynamics, exceptions to the maximum recommended duration for staying in Watch list under sticter monitoring. A managerial aggregated view on client level in terms of number and volume based on the annual/ semi-annual Corporate credit review status is prepared on quarterly basis and presented at Credit Committee. A set of escalation reports related to overdue reviews and collaterals is implemented to duly inform the Management for identified issues in the monitoring process. General reports – a couple of overview reports is prepared to present the most important aspects of the credit risk in the Bank. Monthly Risk Report – Portfolio overview, and summarized reports by segment, Expected Loss by Segment, Sub-Segment and Region, New Business expected loss and overdue credit reviews for Corporate and Small Business clients. Quarterly Overall Risk Report is submitted with information for Gross loans, Ipmaired Loans raio, coverage on impaired portfolio, loans evolution, Break down by BoI classes, Business segment and legal entity, net LLP change and cost of risk ratio. There is also information for EAD break downby business segment, performing/non-performing and industry, RWA by business segment, Stres tests on credit risk, RAF monitoring section as well as Default ageing summary. There is a set of Market, Operational and Reputational Risk reports, which might be differentiated by the specifics of the risk exposure: Market Risk - There is a set of daily managerial reports that affect some critical Market Risk metrics like Open FX position - comparison ag. limits, calculated adjustment to WSS arising from small customer FX and bankbook, Overview of market risk limit utilizations – VaR limit, FX, SOV, CPV, IRC limits, stressed VaR, STWL and LWL as well as Liquidity relevant early warning indicators plus managerial limits compliance report, liquidity relevant RAF metrics, Intraday critical payments buffer and Intraday Residual payments buffer. Additionally, on a monthly basis are prepared the following reports – Summary of counterparty and issuer limit excesses, VAR limit and risk components history, FX, IR, CR sensitivities overview and stress test results, important volatility dynamics, VAR backtesting results. There are also Structural liquidity limits monitoring and Short-term liquidity stress tests (Survival period monitoring), Market conformity checks for all trades, PV and overdue payments on customer IRS, Liquidity Coverage Ratio, Net Sales Funding Report, Derivatives with customers and quarterly XFA adjustemnts. A detailed information about bond trading and investment portfolios including market price book value, issuer limits, CPV, PV, rating, MIFID category, derivative limit utilization. Operational and Reputational Risk – Quarterly Operational Risk analysis/reporting is prepared with information for loss data (overview of the major loss events), scenarios, KRIs, risk mitigation measures, capital at risk, major Operational Risk issues, strategies, planned and/or implemented measures. On a semi-annual basis is submitted description of the top 5 Operational Risk net bookings as well as a Reputational Risk summary. Yearly is prepared and submitted managerial reports containing the scenario analysis results including assessed scenario storylines, and scenario 1:10 and scenario 1:40 loss estimations compared to the highest losses registered in the bank per risk category. There is also information for insurance recoveries on previous year trends (split by event type and % of losses) as well as an assessment of the impact of ICT failures in the banking running activities (expected impact) and in stressed scenarios (extreme impact).

24
4 SCOPE OF APPLICATION This disclosure is prepared on consolidated basis and includes all UniCredit Bulbank’s participations in financial institutions and companies providing auxiliary services where the Bank exercises control or significant influence. All participations, not listed in Appendix 4, are not subject of consolidation in the context of the current disclosure. There are no significant differences between the amounts in the financial statements under the accounting scope of consolidation and the financial statements under the regulatory scope of consolidation since they are fully IFRS based. There are only presentation differences e.g. inventories are reported under Other assets in the financial reports published by UniCredit Bulbank while in FinRep Balance sheet are reported under Property, plant, equipment and investment properties. These differences do not impact major financial items, nor net assets, equity or profit or loss. The information related to the scope of application of the regulatory framework is disclosed as follows:
APPENDIX 2: EU LI1 – Differences between accounting and regulatory scopes of consolidation and the mapping of financial statement categories with regulatory risk categories. (Template 1, EBA/GL/2016/11);
APPENDIX 3: EU LI2 – Main sources of differences between regulatory exposure amounts and carrying values in financial statements. (Template 2, EBA/GL/2016/11);
APPENDIX 4: EU LI3 – Outline of the differences in the scopes of consolidation (entity by entity). (Template 3, EBA/GL/2016/11).
25
5 OWN FUNDS Capital Base (Own Funds) eligible for regulatory purposes include Tier I and Tier II capital as defined by Basel III regulatory framework. In 2014, the new Directive 2013/36/EU requirements (CRD IV) were enforced in Bulgaria and Ordinance 8 of BNB was abrogated and substituted by Regulation (EU) 575/2013 of the European Parliament and of the Council. In parallel to the introduction of the new Basel III regulatory framework, BNB defined two additional capital buffers: Capital Conservation buffer and Systemic Risk buffer. The detailed information regarding consolidated Own Funds of UniCredit Bulbank AD is disclosed in Appendix 5 according to Commission Implementing Regulation (EU) No 1423/2013 and includes the following:
APPENDIX 5A – Regulatory scope Balance sheet;
APPENDIX 5B – Balance sheet reconciliation methodology;
APPENDIX 5C – Capital Instruments’ main features template;
APPENDIX 5D – Transitional Own Funds disclosure template
Additional information for specific capital positions can be found in the Consolidated Financial Statements of UniCredit Bulbank AD.

26
6 CAPITAL REQUIREMENTS
For estimation of the capital requirements, UniCredit Bulbank applies:
For Credit Risk: Advanced Internal Rating Based Approach (A-IRB) for classes: Corporates2; Retail-Small
Business (including covered by residential real estates); Retail – Individuals (including covered by residential real estates); and Equity claims3;
Foundation Internal Rating Based Approach (F-IRB) for classes: Financial Institutions; and Corporates - Specialized Lending4;
Standardized Approach for classes5: Central Governments or Central Banks; Regional Governments or Local Authorities; Multilateral Development Banks; Administrative Bodies and Non-commercial Undertakings; International Organisations; and Other items.
For Market Risk: Standardized Appoach.
For Operational Risk: Advanced Measurement Approach.
For preparation of the regulatory reports under new Regulation (EU) 575/2013, the Bank applies Financial Collateral Comprehensive Approach for credit risk mitigation where financial collateral is used.
Capital Requirements for Credit Risk, Market Risk and Operational Risk are disclosed as follow:
APPENDIX 6: EU OV1 – Overview of RWAs. (Template 4, EBA/GL/2016/11);
APPENDIX 7: EU CR10 - IRB (Specialized Lending and Equities). (Template 5, EBA/GL/2016/11).
The information for EU INS1 – Non-deducted participations in insurance undertakings (Template 6, EBA/GL/2016/11) is not relevant to UniCredit Bulbank.
2 Except for Corporates – Specialized Lending. 3 UniCredit Bulbank applies Simple Approach. 4 UniCredit Bulbank applies Slotting Criteria Model (regulatory defined risk weights and expected loss levels). 5 For client type detailization purposes, classes are represented in accordance with Standardized approach segregation.
27
7 EXPOSURES TO COUNTERPARTY CREDIT RISK UniCredit Bulbank employes the Group internal model method for counterparty risk measurement and limit compliance control. Market Risk unit monitors on a daily basis the exposures on counterparty credit risk and escalates limit breaches for resolution. The concept of CVA charge is adopted for risk-adjusted pricing of derivatives. For more details related to counterparty credit risk, please refer to point 3.1.2. above in the present document. The information related to CCR is disclosed as follows:
APPENDIX 8: EU CCR1 – Analysis of CCR exposure by approach. (Template 25, EBA/GL/2016/11);
APPENDIX 9: EU CCR2 – CVA capital charge. (Template 26, EBA/GL/2016/11).
The following information is not relevant to UniCredit Bulbank:
EU CCR8 – Exposures to CCPs. (Template 27, EBA/GL/2016/11);
EU CCR5-A – Impact of netting and collateral held on exposure values. (Template 31, EBA/GL/2016/11);
EU CCR5-B – Composition of collateral for exposures to CCR. (Template 32, EBA/GL/2016/11);
EU CCR6 – Credit derivatives exposures. (Template 33, EBA/GL/2016/11).

28
8 CAPITAL BUFFERS The detailed information regarding capital buffers of UniCredit Bulbank is disclosed according to Commission Delegated Regulation (EU) 2015/1555 of 28 May 2015. The Bank’s compliance with the requirements for a countercyclical capital buffer is disclosed in APPENDIX 10: Disclosure of the amount of institution specific countercyclical buffer (Table 2, EU 2015/1555). The geographical distribution of a credit exposures relevant to the calculation of countercyclical buffer is presented in APPENDIX 11: Disclosure of the geographical distribution of credit exposures (Table 1, EU 2015/1555).

29
9 INDICATORS OF GLOBAL SYSTEMIC IMPORTANCE In order to ensure global consistency and uniform formats and data for the disclosure of the values used to identify Global Systemically Important Institutions (G-SIIs), the EU Parliament and the Council issues a Commission Implementing Regulation (EU) No 1030/2014 of 29 September 2014. In December 2016, Bulgarian National Bank classified UniCredit Bulbank AD as Other Systemically Important Institutions (O-SIIs) and thus the disclosure requirements set in Regulation (EU) No 1030/2014 are not relevant to the Bank.
30
10 CREDIT RISK ADJUSTMENTS The carrying amounts of Bank’s assets are regularly reviewed for assessment whether there is any objective evidence of impairment as follows:
for loans and receivables – by the end of each month for the purposes of preparing interim financial statements reported to the Bulgarian National Bank and Management;
for available for sale and held to maturity financial assets – semi-annually based on review performed the Bank and decision approved by ALCO;
for non-financial assets – by the end of each year for the purposes of preparing annual financial statements.
If any impairment indicators exist, the asset’s recoverable amount is estimated. An impairment loss is recognised whenever the carrying amount of an asset or its cash-generating unit exceeds its recoverable amount. Impairment losses are recognised in the Income Statement. In assessing the provisions Management uses expert estimates such as legal and regulatory advisors as well as credit risk specialists. Usually more conservative approach is followed in order to protect the Bank in case of adverse development of uncertain events. According to the internal evaluation process the Bank divide customers’ credit portfolio into performing loans (those without detected default events) and non-performing portfolio (those with detected default events). The basis for default event detection is the approved “Methodology paper on Default according to Basel III” where generally (but not exhaustive) default event is detected always when either or both of the following conditions are met:
the Bank considers that the obligor is unlikely to pay its credit obligations to the Bank,
without recourse to actions such as realising the collateral (if held);
the obligor is past due more than 90 days on any material credit obligation to the Bank.
In UniCredit Bulbank, all exposures with more than 90 days past due are considered as impaired. For determination of general credit risk adjustments the bank is using the expected loss concept, which is than adjusted with loss confirmation period. For determination of specific credit risk adjustments the bank is using either collective evaluation approach or is performing individual assessment for relative big exposures.
Following the Regulation (EU) 2015/1278, UniCredit Bulbank applies below definitions for performing and non-performing forborne exposures:
1/ Performing forborne exposures:
The Bank considers an exposure as forborne performing, when all of the following
conditions are met:
the extension of the tenor of the facility is not more than two years, from the original
one; and
the amendments in the repayment terms and conditions are NPV neutral.

31
2/ Non-performing forborne exposures: Cases where as a result of declined financial standing and solvency of the obligor, the Bank
has consent to distressed restructuring of the credit obligation through material
forgiveness, or postponement of principal, interest, or fees which results in debt reduction
(non NPV neutral).
Distressed restructuring shall be registered also in all cases of substitution of part of the
debt against equity (ownership), as well as extension of the original tenor by more than 2
years.
General quantitative information on credit risk is disclosed as follows:
APPENDIX 12: EU CRB-B – Total and average net amount of exposures. (Template 7, EBA/GL/2016/11);
APPENDIX 13: EU CRB-C – Geographical breakdown of exposures. (Template 8, EBA/GL/2016/11);
APPENDIX 14: EU CRB-D – Concentration of exposures by industry or counterparty types. (Template 9, EBA/GL/2016/11);
APPENDIX 15: EU CRB-E – Maturity of exposures. (Template 10, EBA/GL/2016/11);
APPENDIX 16: EU CR1-A – Credit quality of exposures by exposure class and instrument. (Template 11, EBA/GL/2016/11);
APPENDIX 17: EU CR1-B – Credit quality of exposures by industry or counterparty types. (Template 12, EBA/GL/2016/11);
APPENDIX 18: EU CR1-C – Credit quality of exposures by geography. (Template 13, EBA/GL/2016/11);
APPENDIX 19: EU CR1-D – Ageing of past-due exposures. (Template 14, EBA/GL/2016/11);
APPENDIX 20: EU CR1-E – Non-performing and forborne exposures. (Template 15, EBA/GL/2016/11);
APPENDIX 21: EU CR2-A – Changes in the stock of general and specific credit risk adjustments. (Template 16, EBA/GL/2016/11);
APPENDIX 22: EU CR2-B – Changes in the stock of defaulted and impaired loans and debt securities. (Template 17, EBA/GL/2016/11).

32
11 UNENCUMBERED ASSETS According to Article 443 of the Regulation (EU) 575/2013, UniCredit Bulbank is disclosing the following information related to encumbered assets (as of 31.12.2017):
in thousands of BGN
Carrying amount of encumbered assets
Carrying amount of non-encumbered assets
Assets: 380 542 19 878 617
Debt securities 29 733 3 725 359
Loans and advances 350 809 15 341 208
Other assets - 812 050
Fair value of encumbered
collateral received Fair value of collateral
received non-encumbered
Collateral received: - -
Collateral received available for encumbrance
- -
Matching liabilities Encumbered assets and
collateral received
Total sources of encumbrance: 263 336 380 542
Derivatives 2 196 95 923
Repurchase agreements 29 859 29 733
Collateralised deposits other than repurchase agreements
231 281 254 886
As of 31.12.2017, there is no overcollaterisation of liabilities with encumbered assets in the Bank.

33
12 INFORMATION ABOUT NOMINATED ECAIS AND EIAS UNDER THE STANDARDISED APPROACH FOR CREDIT RISK
Following the requirements of Article 113 of the Regulation (EU) 575/2013, UniCredit Bulbank uses Standard & Poor’s Agency ratings for calculating risk weights of its asset and off-balance sheet exposures.
The calculation methodology follows strictly the requiements listed in Article 138, Article 139, Article 140 and Article 141 of the Regulation (EU) 575/2013.
Asset Classes where ECAI are used are as follows: Claims or contingent claims on central governments; Claims or contingent claims on multilateral development banks; Claims or contingent claims on institutions (providing unavailability of internal
rating); Claims or contingent claims on regional governments or local authorities; Short-term claims on institutions and corporates (providing unavailability of
internal rating).
A breakdown of exposures under the standardised approach by asset class and risk weight (corresponding to the riskiness attributed to the exposure according to the standardised approach) assigned to each credit quality step is disclosed in APPENDIX 23: EU CR5 – Standardised approach (Template 20, EBA/GL/2016/11). A breakdown of CCR exposures using the credit risk standardised approach to compute RWAs by portfolio (type of counterparties) and by risk weight is disclosed in APPENDIX 24: EU CCR3 – Standardised approach – CCR exposures by regulatory portfolio and risk (Template 28, EBA/GL/2016/11).

34
13 EXPOSURE TO MARKET RISK UniCredit Bulbank calculates its Own funds requirements for market risk under the Standardised Approach. The Bank does not apply internal models for calculating capital requiremenrs for market risks within the reporting cycle to the local regulator. The Group-wide internal market risk model is applied for risk management and control purposes, and for consiolidated requirements reporting at UniCredit Group level. For more details, please refer to point 3.1.1. above in the present document. The Capital requirements and RWAs for market risk under the Standardised Approach are disclosed in APPENDIX 25: EU MR1 – Market risk under the standardised approach (Template 34, EBA/GL/2016/11). The following information is not relevant to UniCredit Bulbank:
EU MR2-A – Market risk under the IMA. (Template 35, EBA/GL/2016/11);
EU MR2-B – RWA flow statements of market risk exposures under the IMA. (Template 36, EBA/GL/2016/11);
EU MR3 – IMA values for trading portfolios. (Template 37, EBA/GL/2016/11);
EU MR4 – Comparison of VaR estimates with gains/losses. (Template 38, EBA/GL/2016/11).

35
14 OPERATIONAL RISK
For the purpose of reporting Capital Adequacy in accordance with Regulation (EU) 575/2013 of The European Parlament and of The Council, UniCredit Bulbank applies Advanced Measurement Approach (AMA) for the capital calculation of Operational Risk. In order to better represent the operational risk exposure, the combination of the seven event types and the product associated to each operational event generates the twelve model risk categories.
Operational risk events are attributed exclusively to seven classes (or event types). 1. Internal frauds are acts intended to defraud, misappropriate property or circumvent
regulations, the law or Company policy (excluding diversity or discrimination events) involving at least one internal party and excluding malicious damage. The internal fraud is originated inside the Company and the internal nature of the event must be definitely ascertained, otherwise it should be considered as external fraud. In many cases, an internal audit report may clarify this point.
2. External frauds are acts intended to defraud, misappropriate property or circumvent the law committed by a third party, without the assistance of an employee and excluding malicious damage:
2.1. External frauds – Payments. This model risk category includes frauds on all payment systems, in order to have evidence of all phenomena involved in money transfer, to highlight any anomalies and deficiencies in security measures. Payment system meaning client management of cash inflows/outflows; all forms of payments; clearing, settlement and exchange services.
2.2. External frauds – Others. This model risk category includes all events associated to all others products or non banking products (other products/services not generally considered part of a bank or investment bank’s offering, e.g. insurance) or non-product related (for situations where no specific process was involved).
3. Employment practices and workplace safety are events resulting from violating employment or health or safety laws and agreements, personal injury claims or diversity discrimination events.
4. Clients, products and business practices are unintentional or negligent failure to meet obligations to clients (including fiduciary and suitability requirements) or from the features of a product. The events where the Company committed an improper business act fall into this category, likewise when it has been the victim of similar practices by another Company:
4.1. Clients, products and business practices – Derivatives. This model risk category includes all derivative products, selling either via an exchange or over the counter; they have been isolated from all others financial instruments to better represent the phenomena;
4.2. Clients, products and business practices - Financial Instruments. This model risk category includes all others financial instruments, selling either via an exchange or over the counter;
4.3. Clients, products and business practices – Others. This class includes all events associated to all others products or no banking products (Other products/services not generally considered part of a bank or investment bank’s offering, e.g. insurance) or non-product related (for situations where no specific process was involved).
5. Damages to physical assets are events caused by natural disaster or other similar event type.
6. Business disruption and system failures are losses caused by technology problems. 7. Execution, delivery and process management are failed transactions processing or process
management, or losses coming from relations with counterparties and vendors. These

36
events are not intentional and involve documenting or completing business transactions (typically, operational risk events that occur in back office areas fall in this category):
7.1. Execution, delivery and process management – Financial Instruments. This model risk category includes all derivative products and financial instruments, selling either via an exchange or over the counter; they have been isolated to better represent the phenomena. This model risk category includes all others financial instruments, selling either via an exchange or over the counter;
7.2. Execution, delivery and process management – Payments. This model risk category includes events connected with all payment system, in order to have evidence of all phenomena involved in money transfer. Payment system meanings client management of cash inflows/outflows, all forms of payments; clearing, settlement and exchange services;
7.3. Execution, delivery and process management – Others. This model risk category includes all events associated to all others products or no banking products (Other products/services not generally considered part of a bank or investment bank’s offering, e.g. insurance) or non-product related (for situations where no specific process was involved).

37
15 EQUITIES IN THE BANKING BOOK
According to Article 434, para 2 of the Regulation (EU) 575/2013, equivalent disclosure is made in the Annual Consolidated Financial Statements of UniCredit Bulbank AD.

38
16 INTEREST RATE RISK IN THE BANKING BOOK
Exposure to interest rate risk in the banking book is captured and measured on daily basis in the market risk management systems. The managerial limit-relevant risk metrics includes daily VaR and basis point value sensitivity, weekly stress test warning level and monthly reporting of regulatory required variation in economic value (instantaneous 200 bps interest rate shock ag. 20% of equity) and variation in earnings (net interest income simulation using +/- 100 bps shock of interest rates and hypothesis of evolution of assets and liabilities). Executive summary is reported in each monthly ALCO session. According to Article 434, para 2 of the Regulation (EU) 575/2013, equivalent disclosure is made in the Annual Consolidated Financial Statements of UniCredit Bulbank AD.

39
17 SECURITISATION UniCredit Bulbank applies securitisation since 2012 under the Agreement with European Investment Fund (EIF) for granting of finance to small and medium-sized enterprises under the initiative JEREMIE. According to the Agreement (signed in 2011), the EIF provides guarantee for coverage of first loss (First Loss Portfolio Guaranee-FLPG), thus the tranche of first loss is transfer to EIF, and the Bank effectively holds the second loss tranche to this programme. The Agreement is treated as synthetic securitisationand for regulatory purposes and from October 2016, UniCredit Bulbank applies Supervisory Formula Method for calculation of capital requirements of credit risk. As of 31.12.2017, the allocation of tranches is as follows: Nominal value of the portfolio: 41 306 ths.BGN First Loss Tranche: 23 397 ths.BGN Second Loss Tranche: 9 648 ths.BGN

40
18 LEVERAGE In compliance with Article 451 of Regulation (EU) 575/2013, UniCredit Bulbank disclose the information regarding the leverage ratio and the management of the risk of excessive leverage. The Basel III framework introduces the leverage ratio as a credible supplementary measure to the risk-based capital requirements which is defined as the Capital Measure divided by the Exposure Measure. The Capital Measure is the Tier 1 capital and the Exposure Measure is the sum of on-balance sheet exposures; derivative exposures; securities financing transaction exposures; and off-balance sheet items. The Basel III Leverage Ratio is one of the Risk Appetite KPI of UniCredit Bulbank which is subject to quarterly monitoring against the approved Risk Appetite thresholds (target, trigger and limit levels). UniCredit Bulbank discloses the Leverage ratio according to article 499, 1 (a) of Regulation (EU) 575/2013 and Commission Implementing Regulation (EU) 2016/200 of 15 February 2016. Detailed information is disclosed in APPENDIX 26: Leverage ratio (Templates provided in Regulation EU 2016/200).

41
19 USE OF THE INTERNAL RATING BASED APPROACH TO CREDIT RISK
19.1 OVERVIEW
Starting from July 2016, UniCredit Bulbank AD applies Advanced Internal Rating Based Approach (AIRB) for calculation of capital requirements of credit risk for Corporate (excluding Specialised Lending) and Retail (Small Business and Individuals) clients’ exposure. Financial Institutions and Specialised Lending clients remain at Foundation Internal Rating Based Approach (F-IRB) and exposures to Public Sector Entities, Multilateral Development Banks and Municipalities are treated under Standardised Approach. UniCredit Bulbank is the first bank in Bulgaria certified by the European Central Bank (joint decision with Bank of Italy and BNB) to use A-IRB Approach for locally developed internal models for Probability of Default (PD), Exposure at Default (EAD) and Loss Given Default (LGD). When applying Internal Rating Based Approach for calculation of capital requirements for credit risk, UniCredit Bulbank uses several rating models6 in order to carry out clients’ creditworthiness analyses. Rating models can be generally summarized as:
Group-wide rating models (GWM) Group wide rating models7 are used for group wide client segments or transactions, whose risk factors are independent from the counterpart’s geographic location, local market characteristics, business lines and processes used. UniCredit Bulbank uses group wide rating model for creditworthiness analyses for: Multinational Companies8; Security Industry Companies; and Financial Institutions.
Local rating models
Corporate rating model The model is used for corporate clients (using full accounting) with a turnover < 500 Mio EUR (except for Specialized lending). For risk parameters EAD and LGD UniCredit Bulbank uses internally developed models.
Slotting Criteria Model The model is used for assessment of capital requirements and expected loss for exposures clasifed as Specialized Lending. As Risk parameters: EAD and LGD, UniCredit Bulbank uses regulatory defined parameters in Regulation (EU) 575/2013.
Retail Scoring Models The Bank uses two scoring models: Scoring model for Small Business and Scoring Model for Private Individuals. For risk parameters EAD and LGD UniCredit Bulbank uses internally developed models.
Default definition and the list of the default events valid for UniCredit Bulbank are described in “Default methodology” document applied in the Bank. The document is in compliance with Article 178 of the Regulation (EU) 575/2013, further specifying list of default events maintained in the Bank.
6 UniCredit Bulbank uses master scale for rating result competability. 7 Group wide rating models are developed by UCI Holding Company (HC) and are adopted by UniCredit Bulbank. 8 Companies with turnover over 500 mln euro.

42
The established internal risk control environment is sound and realiable and is an integral part of the operatative working process within the Bank. Risk control fuctions ensure:
minimum yearly validation of the rating systems in used; maintenance of relevant model and validation documentation;
maintenance of all necessary data for management and assessment of the credit risk; periodic assessment of the accuracy, completeness, and appropriateness of model inputs
and results.
The customer rating is not only the basis for a risk-related credit decision but, for example, also for:
Credit conditions (interest rates, security) Credit risk control (reporting, watch list, early warning instruments) Credit risk trade (securitization) Cost of risk (impairment, loan loss provision) Calculation of capital required under Basel III (capital requirements, capital adequacy) Portfolio analysis (credit portfolio steering)
Cases Occasioning a Rating:
Provision of financial statements Application for credit/ lending of credit Credit risk control/prolongation Change in soft facts and warning signals relevant to creditworthiness Change relevant to creditworthiness in connection with the overruling of a customer rating Removal of a rating recipient from a rating group and break-up of the entire rating group Existence of a warning signal Existence of an aging restriction Elimination of a default event New Nostro/ Loro account; MM placement/ Repo deals/ Other obligations counterparties
(esp. Banks) New Issuer of a personal guarantee (esp. Bank or Company Guarantee/ contra-guarantee
received in favour of a customer) If there are rating relevant changes of hard/soft facts or warning signals, a new rating assessment is required.
Notwithstanding the above factors, rating is renewed each year, whereas customers with high risk and problem exposures must be checked in shorter intervals.
The historical losses for the previous period are defined based on occurred default events in accordance with the applied Default Methodology.
19.2 QUALITATIVE INFORMATION RELATED TO LOCAL IRB MODELS
Locally developed internal models for Probability of Default (PD), Exposure at Default (EAD) and Loss Given Default (LGD) that are used for regulatory calculation of capital requirements for credit risk with their main characteristics are:
Corporate PD model:
Corporate PD model is internally developed statistical regression model, developed on a data covering the period 2009-2011. The applicable floor is related to the PD of Bulgarian country. The model covers financial and qualitative factors related to the company and considers also warning signals, if any. Based on the PD value the customers are ranked using a 23 notches rating master scale.

43
SME PD model:
SME PD model is internally developed statistical regression model, developed on a data covering the period 2009-2014. The applicable floor is related to the PD of Bulgarian country and there is an additional conservative floor of 0.12%. PD model covers the origination and monitoring phase with application and behavioral score calculculation. The model considers financial factors, qualitative factors and behavioral ones. Based on the PD value the customers are ranked using a 23 notches rating master scale. Private Individuals PD model:
Private Individuals PD model is internally developed statistical regression model, developed on a data covering the period 2009-2014. The applicable floor is related to the PD of Bulgarian country and there is an additional conservative floor of 0.12%. PD model covers the origination and monitoring phase with application and behavioral score calculculation. The model considers financial factors, qualitative factors and behavioral ones. Based on the PD value the customers are ranked using a 23 notches rating master scale.
Specialised Lending Slotting Criteria model:
For Income Producing Real Estate (IPRE) and Project Finance (PF) transactions a dedicated slotting model is used. Slotting models are used to estimate the risk for specialized lending transactions and utilize dedicated qualitative questionnaires. As an outcome of the model the transactions are assigned to one of 4 possible slots - Strong, Good, Satisfactory, Weak. LGD model:
LGD model is developed on a data covering the period 2008-2014. The result of the model is a decision tree, splitting the exposures on the base of customer segment, product type and EAD. As part of the model internal haircuts for eligible collaterals are calculated as well. Relevant downturn analysis is performed as well, showing positive correlation between the downturn periods and LGD estimations.
EAD model:
EAD model is developed on a data covering the period 2007-2013. The result of the model is a decision tree, splitting the exposures on the base of customer segment, revolving/non-revolving type of exposure, product type and additional model specific parameters. Relevant downturn analysis is performed as well, not showing positive correlation between the downturn periods and EAD estimations. The percentage of RWAs (of total IRB portfolio) covered by the models for each of the Bank’s regulatory portfolios is presented below:
IRB models IRB Regulatory Portfolios RWA %
of IRB Portfolio
Group-Wide Rating Models Banks 15.5%
Multinationals 0.7%
Local Rating Models
Corporate 55.8%
Slotting 13.9%
SME 6.8%
Retail 7.3%

44
Internal credit risk models are developed by Credit Risk Models and Policies Unit within Risk Management Division. Each model is being annualy validated and as part of the internal controls environment, the Internal Audit of the UniCredit Bulbank performs regular audits (on annual basis) on AIRB local models and validations. The internal models are initially validated by an independent structure, not involved in the development of the model and where relevant the Group Internal Validation (GIV9) function at Holding level performs re-validation and joint validations of the local models. In order to achieve more indepence of the function in charge of the model review from the functions responsible for model development, starting from 2018 a dedicated Internal Validation Center is in place that is directly reporting to Chief Risk Officer of the UniCredit Bulbank and to the GIV. All locally developed models (model changes) and respective validations are subject to approval by the Management Board of the Bank, including information on the models’ development and validation conclusions, fulfilment of the recommendations given, the performance of the models, areas for improvement etc. The process of modelling and validation activities planning is defined in the Group Guidelines and in the local Methodological Framework for the maintenance of the Risk Models applied in UniCredit Bulbank which stipulates in detail the roles and responsibilities of the local parties. The annual validation plan is based on 3 years perspective. Quantitative information on the use of the IRB approach is disclosed as follows:
APPENDIX 27A: EU CR6 – IRB approach – Credit risk exposures by exposure class and PD range: Foundation IRB Approach. (Template 21, EBA/GL/2016/11);
APPENDIX 27B: EU CR6 – IRB approach – Credit risk exposures by exposure class and PD range: Advanced IRB Approach. (Template 21, EBA/GL/2016/11);
APPENDIX 27C: EU CR6 – IRB approach – Credit risk exposures by exposure class and PD range: Equity. (Template 21, EBA/GL/2016/11);
APPENDIX 28A: EU CCR4 – IRB approach – CCR exposures by portfolio and PD scale: Foundation IRB Approach. (Template 29, EBA/GL/2016/11);
APPENDIX 28B: EU CCR4 – IRB approach – CCR exposures by portfolio and PD scale: Advanced IRB Approach. (Template 29, EBA/GL/2016/11).
The information related to EU CCR7 – RWA flow statements of CCR exposures under the IMM (Template 30, EBA/GL/2016/11) is not relevant to UniCredit Bulbank.
9 GIV is the function in charge of the validation of the Group models.

45
20 CREDIT RISK MITIGATION TECHNIQUES When granting loans the Bank accepts collaterals as follows:
Property – all types of real estates and relevant real rights; Pledge on movables properties; Pledges of all enterprise assets and shares; Tangible assets; Securities; Cash and receivalbes; Precious Metals; Surety and Guarantee; Other collaterals stipulated in the law
When negotiating the collateral the following general principles should be met:
Reality – existence and perfect documentation; Identity – the collateral should be clearly concretized; Exclusivity – the Bank should be the only bearer of the rights over the collaterals
or privileged lender; Sufficiency – the amount of the collateral should be enough to cover (to
preliminary defined extent) the debtor’s liabilities throughout the whole period of the loan;
Liquidity – the collateral itself should allow the possibility for fast sale.
The obligations regarding the collateral are stipulated in written form with collateral contract. Accepted collaterals are valued at Market Value. The value of the Properties is determined periodically by an independent registered appraiser. The value of the real estate collaterals is regularly monitored as well as the presence of their respective insurance. Within UniCredit Bulbank exists specialised unit responsible for supporting the process of real estate financing, where cash flow predominantly originates from renting and/or sales of real estate properties and the loan is being repaid from this cash flow. UniCredit Bulbank uses only part of the abovementioned types of collaterals when applying credit risk mitigation techniques in accordance with Regulation (EU) 575/2013:
Financial collaterals – blocked cash and securities, strictly observing the requirements of Chapter Four Credit Risk Mitigation of the Regulation (EU) 575/2013. For calculation of capital requirements for credit risk under IRB approach, Financial collaterals are treated like LGD- reducing collaterals (in accordance with the Regulation (EU) 575/2013;
Guarantees that meet the requirements of Chapter Four Credit Risk Mitigation of the Regulation (EU) 575/2013. For calculation of capital requirements for credit risk under IRB approach, Guarantees are treated like PD- reducing collaterals;
Real Estate Properties that meet the requirements of Article 124, Article 125 and Article 126 of the Regulation (EU) 575/2013. For calculation of capital requirements for credit risk under IRB approach, Real Estate collaterals are treated like LGD- reducing collaterals (in accordance with the Regulation (EU) 575/2013. For exposures treated under A-IRB Approach, UniCredit Bulbank uses internally developed discount factors (part of LGD model) for eligible real estate collaterals.

46
The Bank is monitoring the principles for low correlation, legal cerntainty and all operative requirements. The Bank does not apply the netting technique for calculation of its risk-weighted assets for the purposes of the Regulation (EU) 575/2013. Quantitative information related to Credit Risk Mitigation is disclosed as follows:
APPENDIX 29: EU CR3 – CRM techniques – Overview. (Template 18, EBA/GL/2016/11);
APPENDIX 30: EU CR4 – Standardised approach – Credit risk exposure and CRM effects. (Template 19, EBA/GL/2016/11);
APPENDIX 31: EU CR7 – IRB approach – Effect on the RWAs of credit derivatives used as CRM techniques. (Template 22, EBA/GL/2016/11);
APPENDIX 32: EU CR8 – RWA flow statements of credit risk exposures under the IRB approach. (Template 23, EBA/GL/2016/11);
APPENDIX 33: EU CR9 – IRB approach – Backtesting of PD per exposure class. (Template 24, EBA/GL/2016/11).

47
21 REMUNERATION POLICY Compensation Policy of UniCredit Bulbank AD is determined by the Management Board and approved by the Supervisory Board of the Bank. The Policy is part of UniCredit Group’s policy to attract, retain and motivate a highly qualified workforce. The main pillars of the Policy are in compliance with the principles set by the Group Compensation Policy. The principles of the Compensation policy of UniCredit Bulbank also apply to Bank’s subsidiaries. The main principles (pillars) of the Policy are: Clear and transparent governance, Compliance with the regulatory requirements and principles of good business conduct, Continuous monitoring of the market trends and practices, Sustainable pay for sustainable performance, Motivation and retention of all employees, with particular focus on talents and key personnel. The key pillars of Compensation Policy ensure a correct definition of competitive compensation levels, internal equity and transparency The Nomination and Compensation Committee determines on behalf of the Supervisory Board, the individual compensation of the Bank’s Management Board members including the Executive Directors. The Committee consists of two members - Supervisory board Chairman and a Supervisory board member. The Nomination and Compensation Committee has the power to nominate and recommend candidates to be appointed as members of the Management Board. The Nomination and Compensation Committee acts and takes its decisions in compliance with the Group Compensation Policy, the Global Job Model, and in a manner consistent with the UniCredit Group processes of determination and review of the compensation of its senior executive staff. A main requirement of the Incentive Systems applicable to all categories employees at all levels, is to contribute to the sustainability of the Bank and to the Group by aligning individual goals and behaviors to the long-term mission of the Group and the Bank while avoiding taking a risk that exceeds the general level of risk tolerated by the Bank. Following the UniCredit Group’s Policy, UniCredit Bulbank applies the principle of “Sustainable pay for sustainable performance” when determining the results and behaviors which aim to reward. Sustainable pay is a principle that ensures a continuous direct link between pay and performance as well as binds the rewards to the long-term value creation for the organization and to the sound and effective risk management through a variable payment which binds the pay to the achieved short-term and long-term results. The variable remuneration linked to the achieved results of the employee and to the individual contribution is supplementing the fixed salary contracted according to individual’s professional qualification, experience and skills. In this way the Bank ensures an adequate balance between the fixed and the variable part of the total compensation package in order to ensure sound and effective risk management. This excludes encouraging of behaviors not aligned to the Bank’s sustainable business results as well as rewarding single employees for taking risks which exceed those acceptable for the institution. The alignment between the incentive payout levels with the overall economic results of the Bank is guaranteed by the adopted flexible and adaptive Incentive systems. In compliance with the policy and practices of UniCredit Group these systems ensure a direct link between the individual incentive payout levels on one hand and the overall achieved team and individual results for the Bank on the other. This is ensured by setting overall cap on performance related payout for the Bank as appropriate according to the Bank economic results and consistent with local market practice. Performance Management and Incentive System is set in order to create a strong link between actual results and annual bonus, as for the purpose UniCredit Bulbank adopts a "Bonus Pool" approach, which is based on “Solidarity” approach - local overall amount for bonus allocation is subject not only to country achievement of Bank targets and results, but also to CEE Division and Group results. In order to avoid payment of guaranteed bonuses not linked to the achieved results, the implemented Incentive Systems introduce minimum performance thresholds below which zero

48
bonus is paid out. Thereby avoiding payment of guaranteed additional financial rewards (bonuses) that do not correspond to the achieved results. In compliance with the regulatory requirements - for the personnel belonging to the business functions, including Identified Staff, is applicable an adoption of a maximum ratio between variable and fixed remuneration of 2:1. For the rest of the staff it is a maximum ratio between the components of remuneration equal to 1:1 that is usually adopted, except for the staff of the Company Control Functions, for which it is expected that fixed remuneration is predominant component of total remuneration and incentive mechanisms are consistent with the assigned tasks as well as being independent of results from areas under their control. Labor employment/civil contract with the Bank, including management contract, do not guarantee additional remuneration (bonus). The Incentive systems and the corresponding remuneration are constructed in accordance to the objectives stated in the Strategic plan of UniCredit Group and UniCredit Bulbank. Through the compensation systems the variable remuneration payment is aligned with performance of the goals at Bank level, performance of the goals of the respective structure and the individual contribution of the employee. The overall evaluation of the results from the activity is based not only on the sole basis of short-term results but also on their long-term impact on company’s achievements. This is ensured through setting the annual goals targeted to sustainable value creation for the company with particular reference to risk. The goals are set by implementation of key performance indicators (KPIs) that include besides profitability other drivers of sustainable business development including reference to risk, and efficiency, customer satisfaction, quality of internal interaction between business lines, sustainable transfer of knowledge and ensuring business continuity and process management. Performance is measured and rewarded not only on the sole basis of achieving financially-based objectives but also on other criteria for example - risk management, adherence to group values and standards of consistently ethical behavior. Evaluation is made also of the contribution of each individual and unit to the overall value created by the related business group and to the organization as a whole. Evaluating the activity of the control functions and defining the remuneration is based on the principle of independence of the structural units that they control. This is achieved by not setting financial goals of the control functions that are related to the achievement of financial and business goals of the structures that they control. According to the Bulgarian and European legislation, UniCredit Bulbank introduces the identified
staff category for which the principles of deferred variable compensation payout in cash and equity
apply. Identified staff is divided into two groups. Group Identified Staff - responsible for the daily
management of the bank (which positions belong to the Group SVP band or above) and heads of
independent control functions. Local Identified staff - all other employees in selected roles which
meets European quantitative and qualitative criteria and consistent with the governance structure
of UniCredit Bulbank. For Identified staff are determined certain specific performance indicators,
through the measurement of which is warranted that in case of poor performance, reduction of
deferred remuneration will apply (so-called Malus conditions / Zero Factor, which could
completely cancel the payment of variable remuneration in case of unsatisfactory results). The
variable compensation of the identified staff is paid within a predetermined four, five or six year
period and take into account the performance on key performance indicators (KPIs) related to the
operating activities and long-term development of the Bank. Bonus payouts are made in separate
parts through a balanced structure of upfront (following the moment of performance evaluation)
and deferred payouts in cash and instruments (shares).

49
The schemes of variable compensation (bonus) payout for the staff categories for which the principles of upfront and deferred payouts in cash and shares are applied, are as follow:
Staff category YEAR 1 YEAR 2 YEAR 3 YEAR 4 YEAR 5 YEAR 6
Cash & Shares
Cash Shares Shares Shares Cash
EVP & above & other identified staff 20% & 20% &
10% 10% 10% 10% 20%
Cash & Shares
Cash Shares Cash & Shares
- -
SVP & other identified staff 30% & 30% &
10% 10% 10% & 10% &
- -
Cash & Shares
Cash & Shares
Shares Cash - -
Local identified staff 30% & 30% &
10% & 10% &
10% 10% - -
A retention period applies to the remuneration in shares. For 2017 year this group includes the members of the Supervisory Board of the Bank, the Chief Executive Officer and the General Manager of UniCredit Bulbank, the Members of the Management board of the Bank, the Managers of Control functions, UniCredit Leasing Management Board members, UniCredit Consumer Financing Management Board members, employees in Markets and Brokerage Department depending on their individual limits for transactions incl. Head of Markets and Brokerage Department, members of Credit council/ Credit Committee, еmployees in Risk Management Division with individual limits for approval of loans exceeding the quantitative criteria. The criteria for inclusion in the category of "identified staff" follow the detailed criteria of the European Banking Authority and are consistent with the approach of UniCredit Group, taking into account the powers of individual material impact. For every member of Identified staff, for every particular year, the payment of the Bonus shall be subject to the assessment, which may confirm, reduce or cancel eligibility to the Bonus Instalment. For Identified staff is applied the threshold for variable remuneration of 50 000 Euro, below which variable remuneration is not deferred.
In thousands of BGN
2017 Executive’s Compensation
Staff category
Number of participants
Total fixed compensation
for 2017
Total variable compensation
for 2017
Deferred variable compensation depending on the year of payment and underlying instruments
Cash Shares Cash Shares Shares Cash Shares Shares Cash Shares
2018 2019 2020 2021 2022 2023
Identified staff
33 6 742 3 401 1 507 255 51 613 139 254 237 230 115

50
APPENDICES

51
APPENDIX 1
EU LIQ1: LCR DISCLOSURE TEMPLATE ON QUANTITATIVE INFORMATION /AS OF 31.12.2017/ In thousands of BGN
31.12.2017 31.12.2017
12 12
1 Total high-quality liquid assets (HQLA) 6 508 499
2Retail deposits and deposits from small
business customers, of which:9 522 694 888 678
3 Stable deposits 2 046 753 102 338
4 Less stable deposits 7 475 941 786 340
5 Unsecured wholesale funding 5 080 517 1 783 875
6
Operational deposits (all counterparties)
and deposits in networks of cooperative
banks
3 436 651 759 026
7Non-operational deposits (all
counterparties)1 643 866 1 024 849
8 Unsecured debt - -
9 Secured wholesale funding -
10 Additional requirements 1 714 352 180 087
11Outflows related to derivative exposures
and other collateral requirements10 724 10 724
12Outflows related to loss of funding on
debt products- -
13 Credit and liquidity facilities 1 703 628 169 363
14 Other contractual funding obligations - -
15 Other contingent funding obligations 1 047 141 -
16 TOTAL CASH OUTFLOWS 2 852 640
17 Secured lending (eg reverse repos) 273 139 -
18 Inflows from fully performing exposures 693 556 620 742
19 Other cash inflows 2 632 605 1 322
EU-19a
(Difference between total weighted inflows
and total weighted outflows arising from
transactions in third countries where there
are transfer restrictions or which are
denominated in non-convertible currencies)
-
EU-19b(Excess inflows from a related specialised
credit institution)-
20 TOTAL CASH INFLOWS 3 599 300 622 064
EU-20a Fully exempt inflows - -
EU-20b Inflows Subject to 90% Cap - -
EU-20c Inflows Subject to 75% Cap 3 599 300 622 064
TOTAL ADJUSTED VALUE
21 LIQUIDITY BUFFER 6 508 499
22 TOTAL NET CASH OUTFLOWS 2 230 576
23 LIQUIDITY COVERAGE RATIO (%) 291.79%
HIGH-QUALITY LIQUID ASSETS
CASH-OUTFLOWS
CASH-INFLOWS
Scope of consolidation (solo) UC Bulbank onlyTotal unweighted value Total weighted value
Currency and units (BGN thousand)
Quarter ending on (31 December 2017)
Number of data points used in the calculation of
averages

52
APPENDIX 2
EU LI1 – DIFFERENCES BETWEEN ACCOUNTING AND REGULATORY SCOPES OF
CONSOLIDATION AND THE MAPPING OF FINANCIAL STATEMENT CATEGORIES WITH REGULATORY RISK CATEGORIES
/AS OF 31.12.2017/
In thousands of BGN
a b c d e f g
Assets
Cash and balances with Central Bank 3 729 633 3 729 633 3 729 633 - - - -
Non-derivative financial assets held for
trading23 819 23 819 23 783 - - 36 -
Derivatives held for trading 86 332 86 332 - 86 332 - 4 704 -
Derivatives held for hedging 6 339 6 339 - 6 339 - - -
Loans and advances to banks 1 629 431 1 629 431 1 629 431 - - - -
Loans and advances to customers 10 629 087 10 629 087 10 596 077 - 33 010 - -
Available for sale investments 3 762 901 3 762 901 3 762 901 - - - -
Investments in associates 2 717 2 722 2 722 - - - -
Property, plant, equipment and
investment properties196 345 268 059 268 059 - - - -
Intangible assets 38 024 38 024 - - - 38 024
Deferred tax assets 8 673 8 655 8 655 - - - -
Other assets 147 046 74 157 74 157 - - - -
Total assets 20 260 347 20 259 159 20 095 418 92 671 33 010 4 740 38 024
Liabilities
Financial liabilities held for trading 82 483 82 483 - - - - 82 483
Derivatives used for hedging 42 898 42 898 - - - - 42 898
Deposits from banks 1 258 484 1 258 483 - - - - 1 258 483
Deposits from customers 15 512 999 15 517 748 57 187 - - - 15 517 748
Provisions 41 946 41 946 2 183 - - - 39 763
Current tax liabilities 5 022 5 004 - - - - 5 004
Deferred tax liabilities 59 59 - - - - 59
Other liabilities 116 710 116 265 - - - - 116 265
Total liabilities 17 060 601 17 064 886 59 370 - - - 17 062 703
Subject to the credit
risk framework
Subject to the CCR
framework
Subject to the
securitisation
framework
Subject to the market
risk framework
Not subject to capital
requirements or subject to
deduction from capital
Carrying values as
reported in published
financial statements
Carrying values under
scope of regulatory
consolidation
Carrying values of items

53
APPENDIX 3
EU LI2 – MAIN SOURCES OF DIFFERENCES BETWEEN REGULATORY EXPOSURE AMOUNTS
AND CARRYING VALUES IN FINANCIAL STATEMENTS /AS OF 31.12.2017/
In thousands of BGN
a b c d e
Credit risk
framework CCR framework
Securitisation
framework
Market risk
framework
1Assets carrying value amount under the scope of
regulatory consolidation (as per template EU LI1) 20 259 159 20 095 418 92 671 33 010 4 740
2Liabilities carrying value amount under the regulatory scope
of consolidation (as per template EU LI1) 17 064 886 59 370 - - -
3Total net amount under the regulatory scope of
consolidation - - - - -
4 Off-balance-sheet amounts 3 493 663 1 443 270 - - -
5 Differences in valuations - - - - -
6Differences due to different netting rules, other than those
already included in row 2 - - - - -
7 Differences due to consideration of provisions - 643 779 - 35 -
8 Differences due to prudential filters - - - - -
9 Collaterals - 27 025 -23 397
10 Equity - -11 439 - - -
11 Other assets - -720 262 - - -
12 Deferred tax assets - 1 077 - - -
13Exposure at default resulting from the Limit Overdraft
Factor of the Bank's EAD model - 87 240 - - -
14Add-on amounts for PFE associated with all derivatives
transactions (mark-to-market method) - - 103 711 - -
16 Exposure amounts considered for regulatory purposes 21 712 769 21 506 738 196 382 9 648 4 740
Total
Items subject to

54
APPENDIX 4
EU LI3 – OUTLINE OF THE DIFFERENCES IN
THE SCOPES OF CONSOLIDATION (ENTITY BY ENTITY) /AS OF 31.12.2017/
Full
consolidation
Proportional
consolidation
Neither
consolidated
nor deducted
Deducted
UniCredit Factoring EAD Full consolidation X Factoring activities
UniCredit Consumer Financing EAD Full consolidation X Consumer lending and other similar activities in
line with the applicable law and regulations
UniCredit Leasing EAD Full consolidation X Leasing activities
UniCredit Fleet Management EOOD Full consolidation X Transport services
Cash Service Company ADProportional
consolidation X
Accepting, processing, safekeeping and delivering
of valuable consignments with banknotes and
coins to the banks
Name of the entity Method of accounting
consolidation
Method of regulatory consolidation
Description of the entity
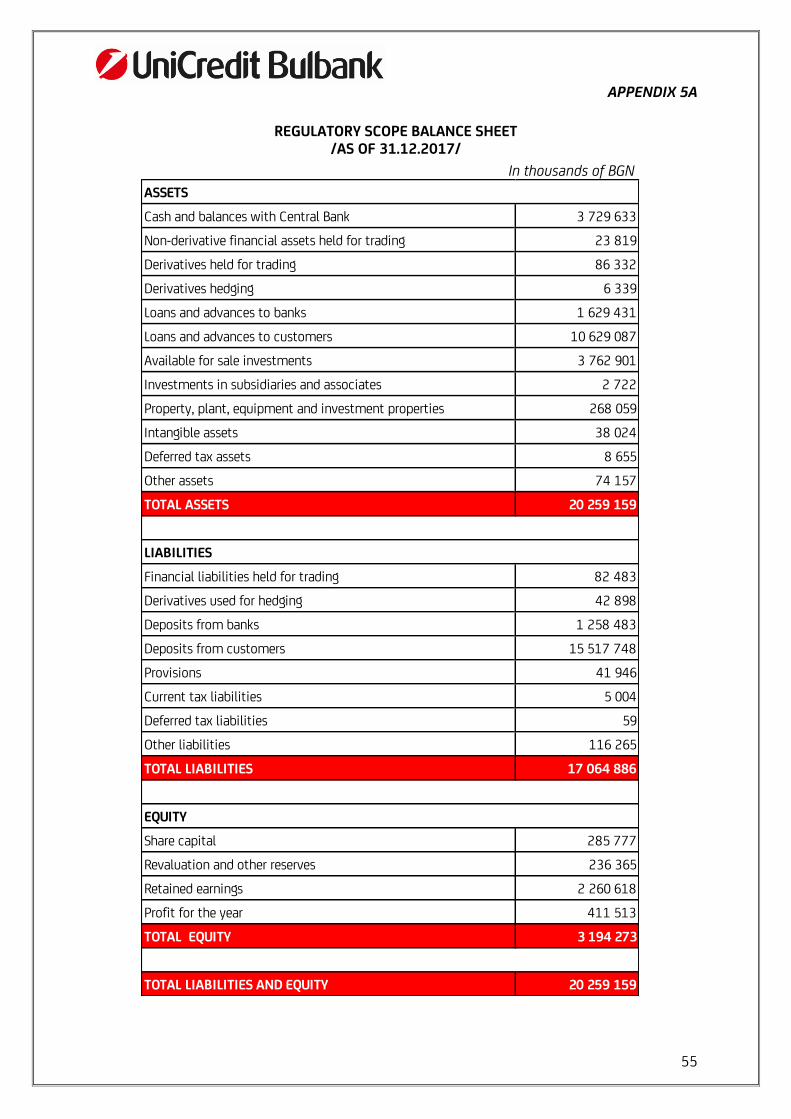
55
APPENDIX 5A
REGULATORY SCOPE BALANCE SHEET
/AS OF 31.12.2017/
In thousands of BGN
Cash and balances with Central Bank 3 729 633
Non-derivative financial assets held for trading 23 819
Derivatives held for trading 86 332
Derivatives hedging 6 339
Loans and advances to banks 1 629 431
Loans and advances to customers 10 629 087
Available for sale investments 3 762 901
Investments in subsidiaries and associates 2 722
Property, plant, equipment and investment properties 268 059
Intangible assets 38 024
Deferred tax assets 8 655
Other assets 74 157
TOTAL ASSETS 20 259 159
Financial liabilities held for trading 82 483
Derivatives used for hedging 42 898
Deposits from banks 1 258 483
Deposits from customers 15 517 748
Provisions 41 946
Current tax liabilities 5 004
Deferred tax liabilities 59
Other liabilities 116 265
TOTAL LIABILITIES 17 064 886
Share capital 285 777
Revaluation and other reserves 236 365
Retained earnings 2 260 618
Profit for the year 411 513
TOTAL EQUITY 3 194 273
TOTAL LIABILITIES AND EQUITY 20 259 159
ASSETS
LIABILITIES
EQUITY

56
APPENDIX 5B
BALANCE SHEET RECONCILIATION METHODOLOGY /AS OF 31.12.2017/ In thousands of BGN
Balance sheet
positions included
in the calculation of
Tier 2
Share capitalRevaluation
reserves
Retained
earnings
Profit for the
year
Adjustments to
CET1 due to
prudential
filters
Intangible
assets
Subordinated
liabilities
Balances as at 31 December 2017 of the positions included in the
calculation of CET 1285 777 236 365 2 260 618 411 513 - -38 024 - 3 156 249
Regulatory corrections of CET 1
Correction of Cash flow hedges reserves - 28 052 - - - - 28 052
Current year profit, not yet eligible for own funds inclusion - - - -411 513 - - -411 513
Deferred tax liabilities associated to intangible assets - - - - 1 077 1 077
Shortfall related to performing exposures treated under A-IRB - - - - - -33 390 -33 390
Fair value gains and losses arising from the institution's own credit risk
related to derivative liabilities-453 -453
Total regulatory corrections of CET 1 (fully loaded) - 28 052 - -411 513 -453 1 077 -33 390 -416 227
Core Equity Tier 1 (CET 1) (fully loaded) 285 777 264 417 2 260 618 - -453 -36 947 -33 390 2 740 022
Correction of positive revaluation reserve related to available for sale
financial assets (20%)- -53 628 - - - - -53 628
10% from shortfall related to performing exposures treated under A-IRB
(transitional provisions)3 339 3 339
Total regulatory corrections of CET 1 (transitional provisions) - -53 628 - - - - 3 339 -50 289
Core Equity Tier 1 (CET 1) (transitional provisions) 285 777 210 789 2 260 618 - -453 -36 947 -30 051 2 689 733
Balances as at 31 December 2017 of the positions included in the
calculation of Tier 2- -
Regulatory corrections of Tier 2
Excess of loan loss provisions over expected loss on defaulted exposures
treated under A-IRB (capped to 0.6% from A-IRB RWA)- 42 208 42 208
Total regulatory corrections of Tier 2 (fully loaded) - 42 208 42 208
Tier 2 capital (fully loaded) - 42 208 42 208
10% from shortfall related to performing exposures treated under A-IRB
(transitional provisions)-3 339 -3 339
Total regulatory corrections of Tier 2 (transitional provisions) - -3 339 -3 339
Tier 2 capital (transitional provisions) - 38 869 38 869
Total own funds (fully loaded) 285 777 264 417 2 260 618 - -453 -36 947 - 8 818 2 782 230
Total own funds (transitional provisions) 285 777 210 789 2 260 618 - -453 -36 947 - 8 818 2 728 602
Positions and regulatory corrections
Balance sheet positions included in the calculation of CET 1
Other
correctionsTotal
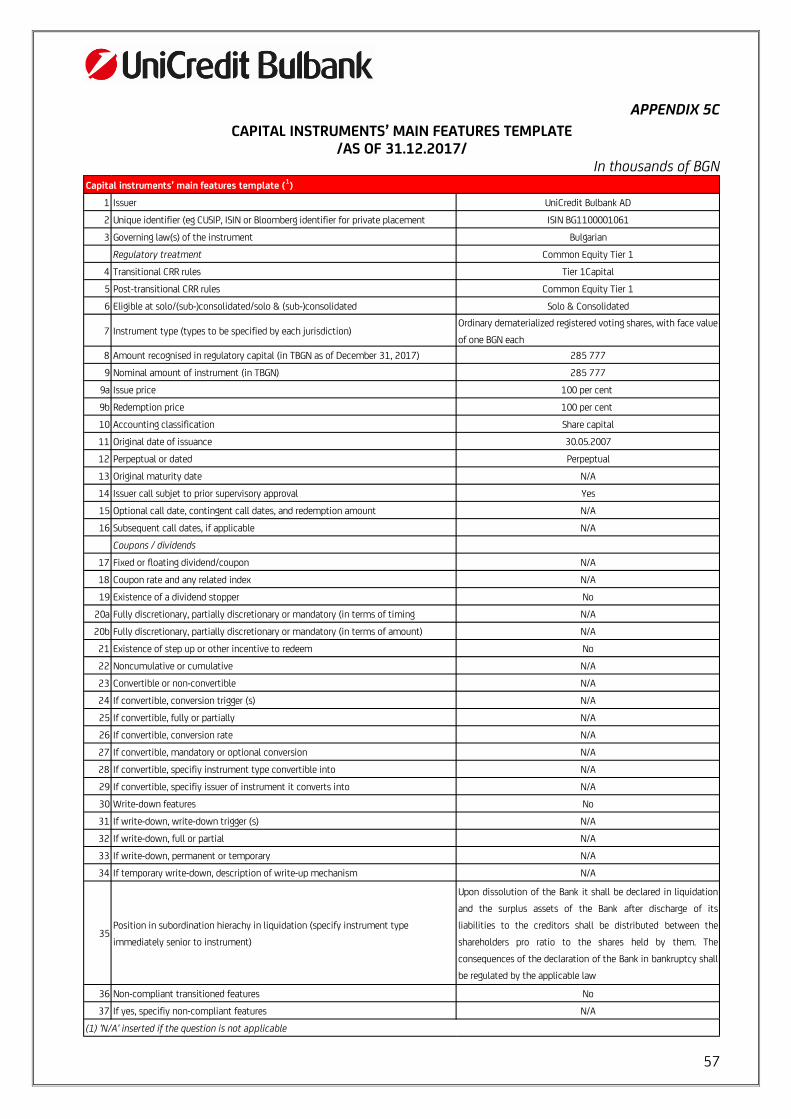
57
APPENDIX 5C
CAPITAL INSTRUMENTS’ MAIN FEATURES TEMPLATE /AS OF 31.12.2017/
In thousands of BGN
1 Issuer UniCredit Bulbank AD
2 Unique identifier (eg CUSIP, ISIN or Bloomberg identifier for private placement ISIN BG1100001061
3 Governing law(s) of the instrument Bulgarian
Regulatory treatment Common Equity Tier 1
4 Transitional CRR rules Tier 1Capital
5 Post-transitional CRR rules Common Equity Tier 1
6 Eligible at solo/(sub-)consolidated/solo & (sub-)consolidated Solo & Consolidated
7 Instrument type (types to be specified by each jurisdiction)Ordinary dematerialized registered voting shares, with face value
of one BGN each
8 Amount recognised in regulatory capital (in TBGN as of December 31, 2017) 285 777
9 Nominal amount of instrument (in TBGN) 285 777
9a Issue price 100 per cent
9b Redemption price 100 per cent
10 Accounting classification Share capital
11 Original date of issuance 30.05.2007
12 Perpeptual or dated Perpeptual
13 Original maturity date N/A
14 Issuer call subjet to prior supervisory approval Yes
15 Optional call date, contingent call dates, and redemption amount N/A
16 Subsequent call dates, if applicable N/A
Coupons / dividends
17 Fixed or floating dividend/coupon N/A
18 Coupon rate and any related index N/A
19 Existence of a dividend stopper No
20a Fully discretionary, partially discretionary or mandatory (in terms of timing N/A
20b Fully discretionary, partially discretionary or mandatory (in terms of amount) N/A
21 Existence of step up or other incentive to redeem No
22 Noncumulative or cumulative N/A
23 Convertible or non-convertible N/A
24 If convertible, conversion trigger (s) N/A
25 If convertible, fully or partially N/A
26 If convertible, conversion rate N/A
27 If convertible, mandatory or optional conversion N/A
28 If convertible, specifiy instrument type convertible into N/A
29 If convertible, specifiy issuer of instrument it converts into N/A
30 Write-down features No
31 If write-down, write-down trigger (s) N/A
32 If write-down, full or partial N/A
33 If write-down, permanent or temporary N/A
34 If temporary write-down, description of write-up mechanism N/A
35Position in subordination hierachy in liquidation (specify instrument type
immediately senior to instrument)
Upon dissolution of the Bank it shall be declared in liquidation
and the surplus assets of the Bank after discharge of its
liabilities to the creditors shall be distributed between the
shareholders pro ratio to the shares held by them. The
consequences of the declaration of the Bank in bankruptcy shall
be regulated by the applicable law
36 Non-compliant transitioned features No
37 If yes, specifiy non-compliant features N/A
Capital instruments’ main features template (1)
(1) 'N/A' inserted if the question is not applicable

58
APPENDIX 5D
TRANSITIONAL OWN FUNDS DISCLOSURE TEMPLATE
/AS OF 31.12.2017/
In thousands of BGN
(A) (B) (C)
Amount at DisclosureRegulation (EU) No 575/2013 article
reference
Amounts subject to Pre-
Regulation (EU) No 575/2013
treatment OR prescribed
residual amount of Regulation
(EU) 575/2013
1 Capital instruments and the related share premium accounts 285 777 26 (1), 27, 28, 29, EBA list 26 (3) N/A
of which: Instrument type 1 N/A EBA list 26 (3) N/A
of which: Instrument type 2 N/A EBA list 26 (3) N/A
of which: Instrument type 3 N/A EBA list 26 (3) N/A
2 Retained earnings 2 260 618 26 (1) (c) N/A
3 Accumulated other comprehensive income (and any other reserves) 236 365 26 (1) N/A
3a Funds for general banking risk - 26 (1) (f) N/A
4Amount of qualifying items referred to in Article 484 (3) and the related share premium accounts
subject to phase out from CET1N/A 486 (2) N/A
Public sector capital injections grandfathered until 1 january 2018 N/A 483 (2) N/A
5 Minority interests (amount allowed in consolidated CET1) - 84, 479, 480 N/A
5a Independently reviewed interim profits net of any foreseeable charge or dividend - 26 (2) N/A
6 Common Equity Tier 1 (CET1) capital before regulatory adjustments 2 782 760 N/A
7 Additional value adjustments (negative amount) - 34, 105 N/A
8 Intangible assets (net of related tax liability) (negative amount) -29 558 36 (1) (b), 37, 472 (4) N/A
9 Empty set in the EU - N/A
10Deferred tax assets that rely on future profitability excluding those arising from temporary difference
(net of related tax liability where the conditions in Article 38 (3) are met) (negative amount)- 36 (1) (c), 38, 472 (5) N/A
11 Fair value reserves related to gains or losses on cash flow hedges 28 052 33 (a) N/A
12 Fair value gains and losses arising from the institution's own credit risk related to derivative liabilities -453 33 ( c )
13 Negative amounts resulting from the calculation of expected loss amounts -26 712 36 (1) (d), 40, 159, 472 (6) N/A
14 Any increase in equity that results from securitised assets (negative amount) - 32 (1) N/A
15 Gains or losses on liabilities valued at fair value resulting from changes in own credit standing - 33 (1) (b) (c) N/A
16 Defined-benefit pension fund assets (negative amount) - 36 (1) (e), 41, 472 (7) N/A
17 Direct and indirect holdings by an institution of own CET1 instruments (negative amount) - 36 (1) (f), 42, 472 (8) N/A
18
Direct, indirect and synthetic holdings of the CET1 instruments of financial sector entities where those
entities have reciprocal cross holdings with the institution designed to inflate artificially the own funds
of the institution (negatvie amount)
- 36 (1) (g), 44, 472 (9) N/A
19
Direct, indirect and synthetic holdings of the CET1 instruments of financial sector entities where the
institution does not have a significant investment in those entities (amount above 10% threshold and
net of eligible short positions) (negative amount)
- 36 (1) (h), 43, 45, 46, 49 (2) (3), 79, 472 (10) N/A
20
Direct, indirect and synthetic holdings of the CET1 instruments of financial sector entities where the
institution has a significant investment in those entities (amount above 10% threshold and net of
eligible short positions) (negative amount)
-36 (1) (i), 43, 45, 47, 48 (1) (b), 49 (1) to (3),
79, 470, 472 (11)N/A
21 Empty set in the EU - N/A
21aExposure amount of the following items which qualify for a RW of 1250%, where the institution opts for
the deduction alternative- 36 (1) (k) N/A
21b of which: qualifying holdings outside the financial sector (negative amount) - 36 (1) (k) (i), 89 to 91 N/A
21c of which: securitisation positions (negative amount) - 36 (1) (k) (ii) ; 243 (1) (b); 244 (1) (b); 258 N/A
21d of which: free deliveries (negative amount) - 36 (1) (k) (iii), 379 (3) N/A
22Deferred tax assets arising from temporary difference (amount above 10 % threshold , net of related tax
liability where the conditions in Article 38 (3) are met) (negative amount)- 36 (1) (c), 38, 48 (1) (a), 470, 472 (5) N/A
23 Amount exceeding the 15% threshold (negative amount) - 48 (1) N/A
24of which: direct and indirect holdings by the institution of the CET1 instruments of financial sector
entities where the institution has a significant investment in those entities- 36 (1) (i), 48 (1) (b), 470, 472 (11) N/A
25 Empty set in the EU - N/A
26 of which: deferred tax assets arising from temporary difference - 36 (1) (c), 38, 48 (1) (a), 470, 472 (5) N/A
26a Losses for the current financial year (negative amount) - 36 (1) (a), 472 (3) N/A
26b Foreseeable tax charges relating to CET1 items (negative amount) - 36 (1) (l) N/A
27Regulatory adjustments applied to Common Equity Tier 1 in respect of amounts subject to pre-CRR
treatment- N/A
27a Regulatory adjustments relating to unrealised gains pursuant to Articles 467 and 468 -53 628 N/A
27bAmount to be deducted from or added to Common Equity Tier 1 capital with regard to additional filters
and deductions required pre CRR- 481 N/A
Common Equity Tier 1 capital: instruments and reserves (1)
Common Equity Tier 1 (CET1) capital: regulatory adjustments

59
(A) (B) (C)
Amount at DisclosureRegulation (EU) No 575/2013 article
reference
Amounts subject to Pre-
Regulation (EU) No 575/2013
treatment OR prescribed
residual amount of Regulation
(EU) 575/2013
28 Qualifying AT1 deductions that exceeds the AT1 capital of the institution (negative amount) -10 728 36 (1) (j) N/A
29 Total regulatory adjustments to Common Equity Tier 1 (CET1) -93 027 N/A
30 Common Equity Tier 1 (CET1) capital 2 689 733 N/A
31 Capital instruments and the related share premium accounts - 51, 52 N/A
32 of which: classified as equity under applicable accounting standards - N/A
33 of which: classified as liabilities under applicable accounting standards - N/A
34Amount of qualifying items referred to in Article 484 (4) and the related share premium accounts
subject to phase out from AT1- 486 (3) N/A
Public sector capital injections grandfathered until 1 january 2018 - 483 (3) N/A
35Qualifying Tier 1 capital included in consolidated AT1 capital (including minority interest not included in
row 5) issued by subsidiaries and held by third parties - 85, 86, 480 N/A
36 of which: instruments issued by subsidiaries subject to phase-out - 486 (3) N/A
37 Additional Tier 1 (AT1) capital before regulatory adjustments - N/A
38 Direct and indirect holdings by an institution of own AT1 instruments (negative amount) - 52 (1) (b), 56 (a), 57, 475 (2) N/A
39
Holdings of the AT1 instruments of financial sector entities where those entities have reciprocal cross
holdings with the institution designed to inflate artificially the own funds of the institution (negative
amount)
- 56 (b), 58, 475 (3) N/A
40
Direct, indirect and synthetic holdings of the AT1 instruments of financial sector entities where the
institution does not have a significant investment in those entities (amount above 10% threshold and
net of eligible short positions) (negative amount)
- 56 (c), 59, 60, 79, 475 (4) N/A
41
Direct, indirect and synthetic holdings of the AT1 instruments of financial sector entities where the
institution has a significant investment in those entities (amount above 10% threshold and net of
eligible short positions) (negative amount)
- 56 (d), 59, 79, 475 (4) N/A
42
Regulatory adjustments applied to Additional Tier 1 capital in respect of amounts subject to pre-CRR
treatment and transitional treatments subject to phase-out as prescribed in Regulation (EU) No
585/2013 (ie. CRR residual amounts)
N/A N/A
42a
Residual amounts deducted from Additional Tier 1 capital with regard to deduction from Common
Equity Tier 1 capital during the transitional period pursuant to article 472 of Regulation (EU) No
575/2013
-10 728472, 473(3)(a), 472 (4), 472 (6), 472 (8) (a),
472 (9), 472 (10) (a), 472 (11) (a)N/A
thereof: Intangible assets -7 389 472 (4)
thereof: IRB shortfall of provisions to expected losses -3 339 472 (6)
42bResidual amounts deducted from Additional Tier 1 capital with regard to deduction from Tier 2 capital
during the transitional period pursuant to article 475 of Regulation (EU) No 575/2013- 477, 477 (3), 477 (4) (a) N/A
42cAmounts to be deducted from added to Additional Tier 1 capital with regard to additional filters and
deductions required pre- CRR- 467, 468, 481 N/A
43 Qualifying T2 deductions that exceed the T2 capital of the institution (negative amount) - 56 (e) N/A
44 Total regulatory adjustments to Additional Tier 1 (AT1) capital -10 728 N/A
45 Additional Tier 1 (AT1) capital N/A
46 Tier 1 capital (T1 = CET1 + AT1) 2 689 733 N/A
47 Capital instruments and the related share premium accounts - 62, 63 N/A
48Amount of qualifying items referred to in Article 484 (5) and the related share premium accounts
subject to phase out from T2- 486 (4) N/A
Public sector capital injections grandfathered until 1 january 2018 - 483 (4) N/A
49Qualifying own funds instruments included in consolidated T2 capital (including minority interest and
AT1 instruments not included in rows 5 or 34) issued by subsidiaries and held by third party- 87, 88, 480 N/A
50 of which: instruments issued by subsidiaries subject to phase-out - 486 (4) N/A
51 Credit risk adjustments 42 208 62 (c) & (d) N/A
52 Tier 2 (T2) capital before regulatory adjustment 42 208 N/A
53Direct and indirect holdings by an institution of own T2 instruments and subordinated loans (negative
amount)- 63 (b) (i), 66 (a), 67, 477 (2) N/A
54
Holdings of the T2 instruments and subordinated loans of financial sector entities where those entities
have reciprocal cross holdings with the institutions designed to inflate artificially the own funds of the
institution (negative amount)
- 66 (b), 68, 477 (3) N/A
55
Direct, indirect and synthetic holdings of the T2 instruments and subordinated loans of financial sector
entities where the institution does not have a significant investment in those entities (amount above 10
% threshold and net of eligible short positions) (negative amount)
- 66 (c), 69, 70, 79, 477 (4) N/A
55a Of which new holdings not subject to transitional arrangements - N/A
55b Of which holdings existing befor 1 January 2013 and subject to transitional arrangements - N/A
56
Direct, indirect and synthetic holdings of the T2 instruments and subordinated loans of financial sector
entities where the institution has a significant investment in those entities (net of eligible short
positions) (negative amounts)
- 66 (d), 69, 79, 477 (4) N/A
Common Equity Tier 1 capital: instruments and reserves (1)
Tier 2 (T2) capital: instruments and provisions
Tier 2 (T2) capital: regulatory adjustments
Additional Tier 1 (AT1) capital: instruments
Additional Tier 1 (AT1) capital: regulatory adjustments
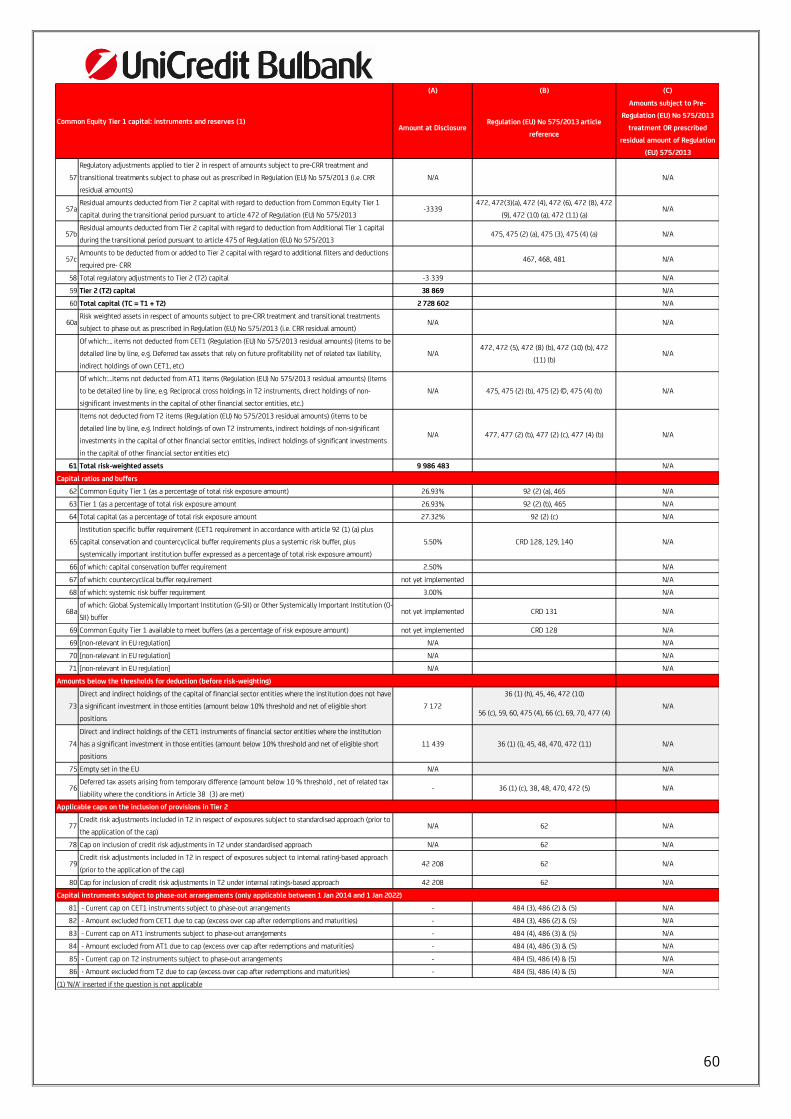
60
(A) (B) (C)
Amount at DisclosureRegulation (EU) No 575/2013 article
reference
Amounts subject to Pre-
Regulation (EU) No 575/2013
treatment OR prescribed
residual amount of Regulation
(EU) 575/2013
57
Regulatory adjustments applied to tier 2 in respect of amounts subject to pre-CRR treatment and
transitional treatments subject to phase out as prescribed in Regulation (EU) No 575/2013 (i.e. CRR
residual amounts)
N/A N/A
57aResidual amounts deducted from Tier 2 capital with regard to deduction from Common Equity Tier 1
capital during the transitional period pursuant to article 472 of Regulation (EU) No 575/2013-3339
472, 472(3)(a), 472 (4), 472 (6), 472 (8), 472
(9), 472 (10) (a), 472 (11) (a)N/A
57bResidual amounts deducted from Tier 2 capital with regard to deduction from Additional Tier 1 capital
during the transitional period pursuant to article 475 of Regulation (EU) No 575/2013475, 475 (2) (a), 475 (3), 475 (4) (a) N/A
57cAmounts to be deducted from or added to Tier 2 capital with regard to additional filters and deductions
required pre- CRR467, 468, 481 N/A
58 Total regulatory adjustments to Tier 2 (T2) capital -3 339 N/A
59 Tier 2 (T2) capital 38 869 N/A
60 Total capital (TC = T1 + T2) 2 728 602 N/A
60aRisk weighted assets in respect of amounts subject to pre-CRR treatment and transitional treatments
subject to phase out as prescribed in Regulation (EU) No 575/2013 (i.e. CRR residual amount)N/A N/A
Of which:… items not deducted from CET1 (Regulation (EU) No 575/2013 residual amounts) (items to be
detailed line by line, e.g. Deferred tax assets that rely on future profitability net of related tax liability,
indirect holdings of own CET1, etc)
N/A472, 472 (5), 472 (8) (b), 472 (10) (b), 472
(11) (b)N/A
Of which:…items not deducted from AT1 items (Regulation (EU) No 575/2013 residual amounts) (items
to be detailed line by line, e.g. Reciprocal cross holdings in T2 instruments, direct holdings of non-
significant investments in the capital of other financial sector entities, etc.)
N/A 475, 475 (2) (b), 475 (2) ©, 475 (4) (b) N/A
Items not deducted from T2 items (Regulation (EU) No 575/2013 residual amounts) (items to be
detailed line by line, e.g. Indirect holdings of own T2 instruments, indirect holdings of non-significant
investments in the capital of other financial sector entities, indirect holdings of significant investments
in the capital of other financial sector entities etc)
N/A 477, 477 (2) (b), 477 (2) (c), 477 (4) (b) N/A
61 Total risk-weighted assets 9 986 483 N/A
62 Common Equity Tier 1 (as a percentage of total risk exposure amount) 26.93% 92 (2) (a), 465 N/A
63 Tier 1 (as a percentage of total risk exposure amount 26.93% 92 (2) (b), 465 N/A
64 Total capital (as a percentage of total risk exposure amount 27.32% 92 (2) (c) N/A
65
Institution specific buffer requirement (CET1 requirement in accordance with article 92 (1) (a) plus
capital conservation and countercyclical buffer requirements plus a systemic risk buffer, plus
systemically important institution buffer expressed as a percentage of total risk exposure amount)
5.50% CRD 128, 129, 140 N/A
66 of which: capital conservation buffer requirement 2.50% N/A
67 of which: countercyclical buffer requirement not yet implemented N/A
68 of which: systemic risk buffer requirement 3.00% N/A
68aof which: Global Systemically Important Institution (G-SII) or Other Systemically Important Institution (O-
SII) buffernot yet implemented CRD 131 N/A
69 Common Equity Tier 1 available to meet buffers (as a percentage of risk exposure amount) not yet implemented CRD 128 N/A
69 [non-relevant in EU regulation] N/A N/A
70 [non-relevant in EU regulation] N/A N/A
71 [non-relevant in EU regulation] N/A N/A
36 (1) (h), 45, 46, 472 (10)
56 (c), 59, 60, 475 (4), 66 (c), 69, 70, 477 (4)
74
Direct and indirect holdings of the CET1 instruments of financial sector entities where the institution
has a significant investment in those entities (amount below 10% threshold and net of eligible short
positions
11 439 36 (1) (i), 45, 48, 470, 472 (11) N/A
75 Empty set in the EU N/A N/A
76Deferred tax assets arising from temporary difference (amount below 10 % threshold , net of related tax
liability where the conditions in Article 38 (3) are met)- 36 (1) (c), 38, 48, 470, 472 (5) N/A
77Credit risk adjustments included in T2 in respect of exposures subject to standardised approach (prior to
the application of the cap)N/A 62 N/A
78 Cap on inclusion of credit risk adjustments in T2 under standardised approach N/A 62 N/A
79Credit risk adjustments included in T2 in respect of exposures subject to internal rating-based approach
(prior to the application of the cap)42 208 62 N/A
80 Cap for inclusion of credit risk adjustments in T2 under internal ratings-based approach 42 208 62 N/A
81 - Current cap on CET1 instruments subject to phase-out arrangements - 484 (3), 486 (2) & (5) N/A
82 - Amount excluded from CET1 due to cap (excess over cap after redemptions and maturities) - 484 (3), 486 (2) & (5) N/A
83 - Current cap on AT1 instruments subject to phase-out arrangements - 484 (4), 486 (3) & (5) N/A
84 - Amount excluded from AT1 due to cap (excess over cap after redemptions and maturities) - 484 (4), 486 (3) & (5) N/A
85 - Current cap on T2 instruments subject to phase-out arrangements - 484 (5), 486 (4) & (5) N/A
86 - Amount excluded from T2 due to cap (excess over cap after redemptions and maturities) - 484 (5), 486 (4) & (5) N/A
Applicable caps on the inclusion of provisions in Tier 2
Capital instruments subject to phase-out arrangements (only applicable between 1 Jan 2014 and 1 Jan 2022)
(1) 'N/A' inserted if the question is not applicable
Common Equity Tier 1 capital: instruments and reserves (1)
Capital ratios and buffers
Amounts below the thresholds for deduction (before risk-weighting)
73
Direct and indirect holdings of the capital of financial sector entities where the institution does not have
a significant investment in those entities (amount below 10% threshold and net of eligible short
positions
7 172 N/A

61
APPENDIX 6
EU OV1 - OVERVIEW OF RWAs
/AS OF 31.12.2017/
In thousands of BGN
Minimum capital
requirements
31.12.2017 31.12.2016 31.12.2017
1 Credit risk (excluding CCR) 8 908 813 8 838 435 712 705
Article 438(c)(d) 2 Of which the standardised approach 1 983 538 2 239 579 158 683
Article 438(c)(d) 3 Of which the foundation IRB (FIRB) approach 1 785 593 1 513 652 142 847
Article 438(c)(d) 4 Of which the advanced IRB (AIRB) approach 5 118 907 5 067 978 409 513
Article 438(d) 5 Of which equity IRB under the simple risk-weighted approach or the IMA 20 775 17 226 1 662
Article 107, Article 438(c)(d) 6 CCR 112 010 130 921 8 961
Article 438(c)(d) 7 Of which mark to market 110 860 128 358 8 869
Article 438(c)(d) 8 Of which original exposure
9 Of which the standardised approach
10 Of which internal model method (IMM)
Article 438(c)(d) 11 Of which risk exposure amount for contributions to the default fund of a CCP
Article 438(c)(d) 12 Of which CVA 1 150 2 563 92
Article 438(e) 13 Settlement risk - - -
Article 449(o)(i) 14 Securitisation exposures in the banking book (after the cap) 675 2 212 54
15 Of which IRB approach
16 Of which IRB supervisory formula approach (SFA) 675 2 212 54
17 Of which internal assessment approach (IAA)
18 Of which standardised approach
Article 438 (e) 19 Market risk 37 464 40 026 2 997
20 Of which the standardised approach 37 464 40 026 2 997
21 Of which IMA
Article 438(e) 22 Large exposures - - -
Article 438(f) 23 Operational risk 903 338 972 000 72 267
24 Of which basic indicator approach
25 Of which standardised approach
26 Of which advanced measurement approach 903 338 972 000 72 267
Article 437(2), Article 48 and Article 60 27Amounts below the thresholds for deduction (subject to 250% risk
weight) 24 183 30 155 1 935
Article 500 28 Floor adjustment
29 Total 9 986 483 10 013 749 798 919
RWAs

62
APPENDIX 7
EU CR10 - IRB SPECIALIZED LENDING AND EQUITIES
/AS OF 31.12.2017/
In thousands of BGN
Less than 2.5 years - - 50% - - -
Equal to or more than 2.5 years 210 741 7 856 70% 213 427 149 390 854
Less than 2.5 years - - 70% - - -
Equal to or more than 2.5 years 564 885 104 963 90% 614 105 551 354 4 901
Less than 2.5 years - - 115% - - -
Equal to or more than 2.5 years 115 836 6 244 115% 122 320 140 599 3 423
Less than 2.5 years - - 250% - - -
Equal to or more than 2.5 years 16 965 452 250% 18 025 45 063 1 442
Less than 2.5 years - - - - - -
Equal to or more than 2.5 years 79 213 16 - 167 978 - 83 989
Less than 2.5 years - - - - -
Equal to or more than 2.5 years 987 640 119 531 1 135 855 886 406 94 609
10 008 - 190% 10 008 19 015 1 521
607 - 290% 607 1 760 141
- - 370% - - -
10 615 - 10 615 20 775 1 662
RWAs Capital
requirements
Private equity exposures
Exchange-traded equity exposures
Other equity exposures
Total
On-balance
sheet amount Categories
Category 5
Total
Off-balance
sheet amount Risk weight
Exposure
amount
Equities under the simple risk-weighted approach
RWAs Expected
losses
Category 1
Category 2
Category 3
Category 4
On-balance
sheet amount
Regulatory
categories Remaining maturity
Off-balance
sheet amount Risk weight
Exposure
amount
SPECIALISED LENDING

63
APPENDIX 8
EU CCR1 – ANALYSIS OF CCR EXPOSURE BY APPROACH
/AS OF 31.12.2017/
In thousands of BGN
a b c d e f g
1 Mark to market 92 671 103 711 196 382 110 860
2 Original exposure
3 Standardised approach 1.4
4 IMM (for derivatives and SFTs) SFTs) 1.4
5 Of which securities financing transactions 1.4
6 Of which derivatives and long settlement transactions 1.4
7 Of which from contractual cross- product netting 1.4
8 Financial collateral simple method (for SFTs)
9 Financial collateral comprehensive method (for SFTs)
10 VaR for SFTs
11 Total
Notional
Replacement
cost/current
market value
Potential
future credit
exposure
EEPE Multiplier RWAs EAD post CRM

64
APPENDIX 9
EU CCR2 – CVA CAPITAL CHARGE
/AS OF 31.12.2017/
In thousands of BGN
a b
Exposure value RWAs
1 Total portfolios subject to the advanced method - -
2 (i) VaR component (including the 3× multiplier)
3 (ii) SVaR component (including the 3× multiplier)
4 All portfolios subject to the standardised method 6 539 1 150
EU4 Based on the original exposure method - -
5 Total subject to the CVA capital charge 6 539 1 150

65
APPENDIX 10
DISCLOSURE OF THE AMOUNT OF INSTITUTION
SPECIFIC COUNTERCYCLICAL BUFFER /AS OF 31.12.2017/
In thousands of BGN
Row Column
010
010 Total risk exposure amount 13 068 525
020 Institution specific countercyclical buffer rate 0%
030 Institution specific countercyclical buffer requirement 0%

66
APPENDIX 11
DISCLOSURE OF THE GEOGRAPHICAL DISTRIBUTION OF CREDIT EXPOSURES /AS OF 31.12.2017/ In thousands of BGN
Exposure value for SA Exposure value IRB
Sum of long and
short position of
trading book
Value of trading
book exposure for
internal models
Exposure
value for SA
Exposure
value for IRB
of which: General
credit exposures
of which: Trading
book exposures
of which:
Securitisation
exposures
Total
010 020 030 040 050 060 070 080 090 100 110 120
010 Breakdown by country 2 318 275 10 293 457 447 145 - - 9 648 645 984 2 990 2 550 651 524 0.00% 0.00%
Country: ANDORRA - 6 - - - - - - - - 0.00% 0.00%
Country: UNITED ARAB EMIRATES - 65 - - - - 2 - - 2 0.00% 0.00%
Country: ALBANIA - 10 - - - - - - - - 0.00% 0.00%
Country: ARMENIA - 425 - - - - 14 - - 14 0.00% 0.00%
Country: ARGENTINA - 2 - - - - - - - - 0.00% 0.00%
Country: AUSTRIA 103 342 - - - - 17 - - 17 0.00% 0.00%
Country: AUSTRALIA - 95 - - - - - - - - 0.00% 0.00%
Country: AZERBAIJAN - 1 - - - - - - - - 0.00% 0.00%
Country: BOSNIA AND HERZEGOVINA - 13 - - - - - - - - 0.00% 0.00%
Country: BELGIUM - 147 - - - - 18 - - 18 0.00% 0.00%
Country: BULGARIA 2 260 486 9 769 568 447 103 - - 9 648 614 482 2 987 2 550 620 019 0.00% 0.00%
Country: BRAZIL - 26 - - - - - - - - 0.00% 0.00%
Country: BELARUS - 31 - - - - - - - - 0.00% 0.00%
Country: CANADA - 41 023 - - - - 1 142 - - 1 142 0.00% 0.00%
Country: SWITZERLAND 17 3 434 - - - - 38 - - 38 0.00% 0.00%
Country: CYPRUS 30 13 936 - - - - 722 - - 722 0.00% 0.00%
Country: CZECH REPUBLIC 83 23 - - - - 8 - - 8 0.00% 0.00%
Country: GERMANY 14 747 6 288 - - - - 1 236 - - 1 236 0.00% 0.00%
Country: DENMARK - 5 - - - - - - - - 0.00% 0.00%
Country: ALGERIA - 1 805 - - - - 180 - - 180 0.00% 0.00%
Country: ESTONIA 1 - - - - - - - - - 0.00% 0.00%
Country: EGYPT - 52 - - - - - - - - 0.00% 0.00%
Country: SPAIN 52 75 - - - - 4 - - 4 0.00% 0.00%
Country: FINLAND 152 8 - - - - 12 - - 12 0.00% 0.00%
Country: FRANCE 17 542 28 - - - - 1 403 - - 1 403 0.00% 0.00%
Country: UNITED KINGDOM - 292 699 - - - - 9 312 - - 9 312 0.00% 0.00%
Country: GEORGIA - 189 - - - - 17 - - 17 0.00% 0.00%
Country: GREECE 986 716 - - - - 81 - - 81 0.00% 0.00%
Country: CROATIA 42 - - - - - 3 - - 3 0.00% 0.00%
Country: HUNGARY 20 6 - - - - 2 - - 2 0.00% 0.00%
Country: IRELAND - 82 - - - - - - - - 0.00% 0.00%
Country: ISRAEL 8 40 - - - - 2 - - 2 0.00% 0.00%
Country: INDIA 220 27 - - - - 18 - - 18 0.00% 0.00%
Country: ITALY 3 807 1 581 - - - - 400 - - 400 0.00% 0.00%
Country: JORDAN - 41 - - - - 4 - - 4 0.00% 0.00%
Country: JAPAN - 6 - - - - - - - - 0.00% 0.00%
Country: KYRGYZSTAN - 244 - - - - 2 - - 2 0.00% 0.00%
Country: KUWAIT - 175 - - - - 1 - - 1 0.00% 0.00%
Own funds
requirement
weights
Countercyclical
capital buffer rateRow
General credit exposures Trading book exposure Securitisation exposure Own funds requirements

67
Exposure value for SA Exposure value IRB
Sum of long and
short position of
trading book
Value of trading
book exposure for
internal models
Exposure
value for SA
Exposure
value for IRB
of which: General
credit exposures
of which: Trading
book exposures
of which:
Securitisation
exposures
Total
Country: KAZAKHSTAN - 11 - - - - - - - - 0.00% 0.00%
Country: LEBANON - 1 - - - - - - - - 0.00% 0.00%
Country: SRI LANKA - 297 - - - - 36 - - 36 0.00% 0.00%
Country: LITHUANIA - - - - - - - - - - 0.00% 0.00%
Country: LATVIA - 52 - - - - 1 - - 1 0.00% 0.00%
Country: LIBYAN ARAB JAMAHIRIYA - 2 - - - - - - - - 0.00% 0.00%
Country: MOROCCO 72 610 - - - - 40 - - 40 0.00% 0.00%
Country: MARSHALL ISLANDS - 31 196 - - - - 864 - - 864 0.00% 0.00%
Country: MACEDONIA,THE FORMER YUGOSLAV REPUBLIC 35 14 - - - - 3 - - 3 0.00% 0.00%
Country: MALTA 5 - - - - - - - - - 0.00% 0.00%
Country: MEXICO - 4 - - - - - - - - 0.00% 0.00%
Country: MALAYSIA - 100 - - - - 4 - - 4 0.00% 0.00%
Country: NETHERLANDS - 52 607 - - - - 7 310 - - 7 310 0.00% 0.00%
Country: NORWAY - 41 - - - - - - - - 0.00% 0.00%
Country: OMAN - 15 - - - - - - - - 0.00% 0.00%
Country: PERU 205 - - - - - 16 - - 16 0.00% 0.00%
Country: PAKISTAN - 22 - - - - - - - - 0.00% 0.00%
Country: POLAND - 56 - - - - - - - - 0.00% 0.00%
Country: PALESTINA - 34 - - - - - - - - 0.00% 0.00%
Country: PORTUGAL - 4 - - - - - - - - 0.00% 0.00%
Country: QATAR - 16 - - - - - - - - 0.00% 0.00%
Country: ROMANIA 333 46 - - - - 29 - - 29 0.00% 0.00%
Country: SERBIA - 20 - - - - 1 - - 1 0.00% 0.00%
Country: RUSSIAN FEDERATION 171 51 399 - - - - 3 834 - - 3 834 0.00% 0.00%
Country: SAUDI ARABIA - 47 - - - - - - - - 0.00% 0.00%
Country: SEYCHELLES - 1 - - - - - - - - 0.00% 0.00%
Country: SUDAN - 18 - - - - - - - - 0.00% 0.00%
Country: SWEDEN - 1 - - - - - - - - 0.00% 0.00%
Country: SLOVENIA - 3 - - - - - - - - 0.00% 0.00%
Country: SLOVAKIA - 65 - - - - 1 - - 1 0.00% 0.00%
Country: SAN MARINO - 116 - - - - 15 - - 15 0.00% 0.00%
Country: SYRIAN ARAB REPUBLIC - 1 - - - - - - - - 0.00% 0.00%
Country: THAILAND - 1 - - - - - - - - 0.00% 0.00%
Country: TURKMENISTAN - 30 - - - - - - - - 0.00% 0.00%
Country: TURKEY 19 098 752 - - - - 1 528 - - 1 528 0.00% 0.00%
Country: TAIWAN 2 - - - - - 0 - - - 0.00% 0.00%
Country: UKRAINE 57 412 - - - - 7 - - 7 0.00% 0.00%
Country: UNITED STATES - 22 237 42 - - - 3 175 3 - 3 178 0.00% 0.00%
Country: SAINT VINCENT AND THE GRENADINES - 3 - - - - - - - - 0.00% 0.00%
Country: VENEZUELA - 9 - - - - - - - - 0.00% 0.00%
Country: VIET NAM 1 - - - - - - - - - 0.00% 0.00%
Country: Others Countries - - - - - - - - - - 0.00% 0.00%
020
Row
General credit exposures Trading book exposure Securitisation exposure Own funds requirementsOwn funds
requirement
weights
Countercyclical
capital buffer rate
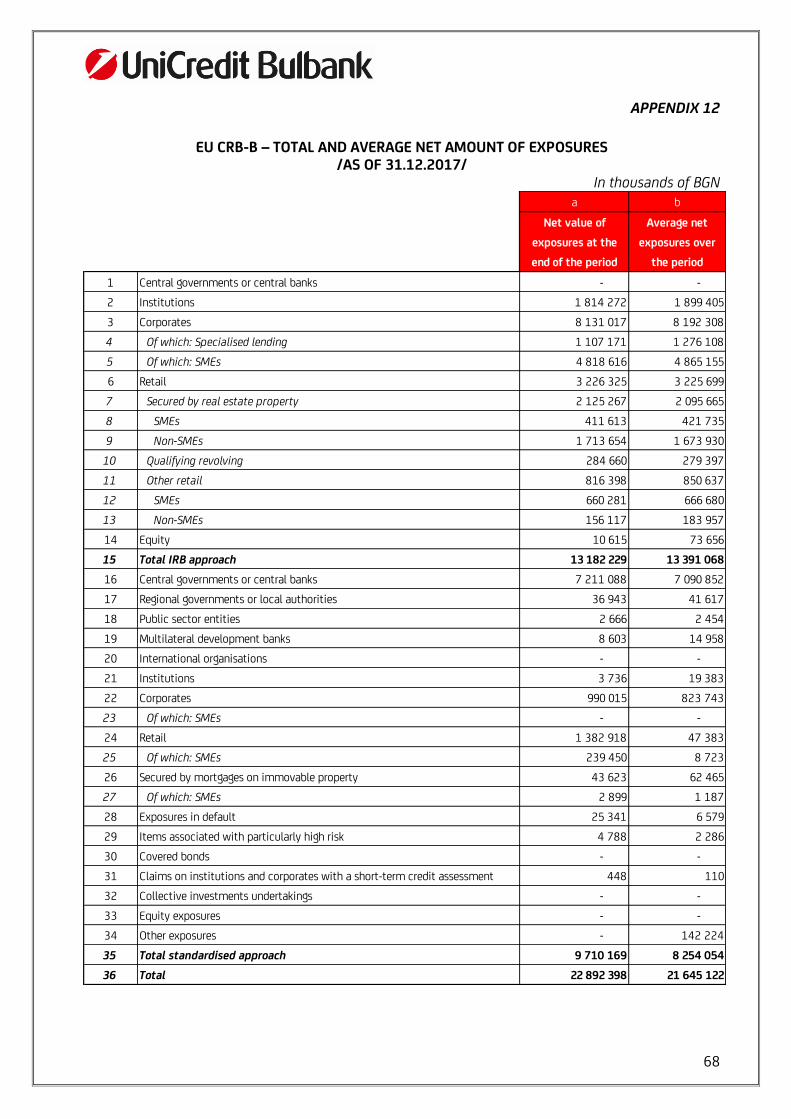
68
APPENDIX 12
EU CRB-B – TOTAL AND AVERAGE NET AMOUNT OF EXPOSURES
/AS OF 31.12.2017/ In thousands of BGN
a b
Net value of
exposures at the
end of the period
Average net
exposures over
the period
1 Central governments or central banks - -
2 Institutions 1 814 272 1 899 405
3 Corporates 8 131 017 8 192 308
4 Of which: Specialised lending 1 107 171 1 276 108
5 Of which: SMEs 4 818 616 4 865 155
6 Retail 3 226 325 3 225 699
7 Secured by real estate property 2 125 267 2 095 665
8 SMEs 411 613 421 735
9 Non-SMEs 1 713 654 1 673 930
10 Qualifying revolving 284 660 279 397
11 Other retail 816 398 850 637
12 SMEs 660 281 666 680
13 Non-SMEs 156 117 183 957
14 Equity 10 615 73 656
15 Total IRB approach 13 182 229 13 391 068
16 Central governments or central banks 7 211 088 7 090 852
17 Regional governments or local authorities 36 943 41 617
18 Public sector entities 2 666 2 454
19 Multilateral development banks 8 603 14 958
20 International organisations - -
21 Institutions 3 736 19 383
22 Corporates 990 015 823 743
23 Of which: SMEs - -
24 Retail 1 382 918 47 383
25 Of which: SMEs 239 450 8 723
26 Secured by mortgages on immovable property 43 623 62 465
27 Of which: SMEs 2 899 1 187
28 Exposures in default 25 341 6 579
29 Items associated with particularly high risk 4 788 2 286
30 Covered bonds - -
31 Claims on institutions and corporates with a short-term credit assessment 448 110
32 Collective investments undertakings - -
33 Equity exposures - -
34 Other exposures - 142 224
35 Total standardised approach 9 710 169 8 254 054
36 Total 22 892 398 21 645 122

69
APPENDIX 13
EU CRB-C – GEOGRAPHICAL BREAKDOWN OF EXPOSURES /AS OF 31.12.2017/
In thousands of BGN
a b c d e f g h i j k l m n o p q r s t u
Country Country Country Country Country Country Country Country Country Country Country Country Country Country Country
BULGARIA ITALYUNITED
KINGDOMGERMANY BELGIUM NETHERLANDS AUSTRIA LUXEMBOURG POLAND SWEDEN FINLAND USA TURKEY
RUSSIAN
FEDERATIONSWITZERLAND
1Central governments or central
banks - - - - - - - - - - - - - - - - - - - - -
2 Institutions 1 699 546 4 050 1 150 942 31 502 227 259 195 575 7 823 32 704 14 368 12 299 6 446 4 832 11 746 31 701 31 504 42 918 39 778 40 107 - 37 959 1 814 272
3 Corporates 7 946 475 7 570 946 4 806 290 729 10 750 - 52 299 - - - - - 16 945 45 033 14 988 4 210 2 831 135 299 93 417 6 000 8 131 017
4 Retail 3 219 797 3 217 096 661 793 281 48 60 345 - 44 - 10 459 144 10 1 375 166 5 009 4 202 105 3 226 325
5 Equity 3 549 3 442 - - - 107 - - - - - - - 7 066 7 066 - - - - - 10 615
6 Total IRB approach 12 869 367 10 795 534 1 156 409 323 024 238 290 195 730 60 182 33 049 14 368 12 343 6 446 4 842 29 150 83 944 53 568 48 503 42 775 180 415 97 619 44 064 13 182 229
7Central governments or central
banks 7 211 088 7 211 053 4 - - - - - - - - - 31 - - - - - - - 7 211 088
8Regional governments or local
authorities 36 943 36 943 - - - - - - - - - - - - - - - - - - 36 943
9 Public sector entities 2 666 2 666 - - - - - - - - - - - - - - - - - - 2 666
10 Multilateral development banks - - - - - - - - - - - - - - - - - 8 603 - - 8 603
11 International organisations - - - - - - - - - - - - - - - - - - - - -
12 Institutions 3 443 597 266 - 120 - - - - - - - 2 460 293 293 - - - - - 3 736
13 Corporates 977 499 951 217 1 194 - 17 484 - - - - 412 - 1 395 5 797 205 - 11 876 11 766 435 334 30 990 015
14 Retail 1 382 892 1 382 891 1 - - - - - - - - - - - - 3 2 23 20 - 1 382 918
15Secured by mortgages on
immovable property 43 395 43 395 - - - - - - - - - - - - - - - 228 171 - 43 623
16 Exposures in default 25 341 25 308 33 - - - - - - - - - - - - - - - - - 25 341
17Items associated with particularly
high risk 4 788 4 788 - - - - - - - - - - - - - - - - - - 4 788
18 Covered bonds - - - - - - - - - - - - - - - - - - - - -
19
Claims on institutions and
corporates with a short-term credit
assessment
8 - - - - - - - - - - - 8 - - 440 - - - - 448
20Collective investments
undertakings - - - - - - - - - - - - - - - - - - - - -
21 Equity exposures - - - - - - - - - - - - - - - - - - - - -
22 Other exposures - - - - - - - - - - - - - - - - - - - - -
23 Total Standardised approach 9 688 063 9 658 858 1 498 - 17 604 - - - - 412 - 1 395 8 296 498 293 12 319 11 768 9 289 525 30 9 710 169
24 Total 22 557 430 20 454 392 1 157 907 323 024 255 894 195 730 60 182 33 049 14 368 12 755 6 446 6 237 37 446 84 442 53 861 60 822 54 543 189 704 98 144 44 094 22 892 398
REST OF THE
WORLDTOTAL
Net value
EUROPE
Other
European
countries
AMERICA ASIA

70
APPENDIX 14
EU CRB-D – CONCENTRATION OF EXPOSURES BY INDUSTRY OR COUNTERPARTY TYPES /AS OF 31.12.2017/
In thousands of BGN
a b c d e f g h i j l m n o p q r s u
Agriculture,
forestry and
fishing
Mining
and
quarrying
Manufacturing
Electricity, gas,
steam and air
conditioning
supply
Water
supplyConstruction
Wholesale
and retail
trade
Transport
and storage
Accommodation
and food service
activities
Information and
communication
Real estate
activities
Professional,
scientific and
technical
activities
Administrative
and support
service activities
Public
administration and
defence, compulsory
social security
Education
Human health
services and
social work
activities
Arts,
entertainment
and recreation
Other
servicesTotal
1Central governments or central
banks - - - - - - - - - - - - - - - - - - -
2 Institutions - - - - - - - - - - - - - - - - - - -
3 Corporates 420 158 33 233 2 303 736 459 870 12 632 546 843 2 203 672 217 291 241 284 191 000 720 576 196 452 115 822 - 3 8 550 251 21 493 7 692 866
4 Retail 138 926 1 818 148 023 5 362 4 812 95 150 389 492 108 782 33 041 26 208 12 528 59 542 20 283 - 1 685 11 169 3 797 2 163 723 3 224 341
5 Equity - - - - - - - - - - 67 - - - - - - - 67
6 Total IRB approach 559 084 35 051 2 451 759 465 232 17 444 641 993 2 593 164 326 073 274 325 217 208 733 171 255 994 136 105 - 1 688 19 719 4 048 2 185 216 10 917 274
7Central governments or central
banks - - - - - - - - - - - - - 3 755 093 17 - 519 35 3 755 664
8Regional governments or local
authorities - - - - - - - - - - - - - 36 943 - - - - 36 943
9 Public sector entities - - - - - - - - - - - - - - - - 175 2 488 2 663
10 Multilateral development banks - - - - - - - - - - - - - - - - - - -
11 International organisations - - - - - - - - - - - - - - - - - - -
12 Institutions - - - - - 2 449 - - - - - - - - - - - - 2 449
13 Corporates 42 599 1 569 156 288 74 174 5 665 98 742 252 468 145 551 22 720 17 927 23 063 4 177 853 - - 10 305 58 890 905 001
14 Retail 760 64 1 193 291 169 1 759 7 895 484 462 3 195 36 1 269 462 - 58 56 42 42 773 60 968
15Secured by mortgages on
immovable property 237 - 721 - - 3 966 1 360 50 13 970 729 16 141 805 - - - - 75 5 569 43 623
16 Exposures in default 1 265 - 2 350 - 4 1 330 3 196 1 489 301 32 - 4 - - - - 4 5 9 980
17Items associated with particularly
high risk - - - - - 3 307 - - - - 1 481 - - - - - - - 4 788
18 Covered bonds - - - - - - - - - - - - - - - - - - -
19
Claims on institutions and
corporates with a shortterm credit
assessment
- - - - - - - - - - - - - - - - - - -
20 Collective investments undertakings - - - - - - - - - - - - - - - - - - -
21 Equity exposures - - - - - - - - - - - - - - - - - - -
22 Other exposures - - - - - - - - - - - - - - - - - - -
23 Total standardised approach 44 861 1 633 160 552 74 465 5 838 111 553 264 919 147 574 37 453 21 883 40 721 6 255 1 315 3 792 036 75 66 1 120 109 760 4 822 079
24 Total 603 945 36 684 2 612 311 539 697 23 282 753 546 2 858 083 473 647 311 778 239 091 773 892 262 249 137 420 3 792 036 1 763 19 785 5 168 2 294 976 15 739 353

71
APPENDIX 15
EU CRB-E – MATURITY OF EXPOSURES
/AS OF 31.12.2017/
In thousands of BGN
a b c d e f
1 Central governments or central banks - - - - - -
2 Institutions 368 994 602 298 488 444 131 178 - 1 590 914
3 Corporates 771 022 1 231 669 1 866 740 1 671 614 - 5 541 045
4 Retail 228 317 387 838 338 224 1 810 203 - 2 764 582
5 Equity - - - - 10 615 10 615
6 Total IRB approach 1 368 333 2 221 805 2 693 408 3 612 995 10 615 9 907 156
7 Central governments or central banks 3 421 203 169 586 899 677 2 702 462 6 654 7 199 582
8 Regional governments or local authorities 960 41 7 065 26 612 - 34 679
9 Public sector entities 7 170 56 34 - 267
10 Multilateral development banks - - - - - -
11 International organisations - - - - - -
12 Institutions 51 2 675 - - - 2 726
13 Corporates 19 781 120 814 571 880 122 913 2 023 837 410
14 Retail 2 467 289 830 781 156 253 321 35 111 1 361 886
15 Secured by mortgages on immovable property 81 4 436 5 336 16 787 - 26 640
16 Exposures in default 2 086 2 429 16 861 2 217 - 23 593
17 Items associated with particularly high risk - - 2 416 2 372 - 4 788
18 Covered bonds - - - - - -
19Claims on institutions and corporates with a
shortterm credit assessment - 8 - - - 8
20 Collective investments undertakings - - - - - -
21 Equity exposures - - - - - -
22 Other exposures - - - - - -
23 Total standardised approach 3 446 636 589 989 2 284 447 3 126 718 43 788 9 491 579
24 Total 4 814 969 2 811 794 4 977 855 6 739 713 54 403 19 398 735
Net exposure value
On demand <= 1 year > 1 year <= 5 years > 5 years Total No stated maturity

72
APPENDIX 16
EU CR1-A – CREDIT QUALITY OF EXPOSURES
BY EXPOSURE CLASS AND INSTRUMENT /AS OF 31.12.2017/
In thousands of BGN
a b c d e f G
Net values
Defaulted
exposures
Non-defaulted
exposures (a+b-c-d)
1 Central governments or central banks - - - - - - -
2 Institutions - 1 814 272 - - - - 1 814 272
3 Corporates 688 443 7 950 943 508 369 - 15 862 124 028 8 131 017
4 Of which: Specialised lending 167 981 1 035 129 95 939 - 3 081 15 884 1 107 171
5 Of which: SMEs 470 902 4 721 962 374 248 - 9 177 105 638 4 818 616
6 Retail 196 711 3 165 024 135 410 - 3 018 32 640 3 226 325
7 Secured by real estate property 130 085 2 065 756 70 574 - 1 562 15 962 2 125 267
8 SMEs 45 997 399 869 34 253 - 837 5 541 411 613
9 Non-SMEs 84 088 1 665 887 36 321 - 725 10 421 1 713 654
10 Qualifying revolving 4 948 285 867 6 155 - 115 2 156 284 660
11 Other retail 61 678 813 401 58 681 - 1 341 14 522 816 398
12 SMEs 37 120 659 685 36 524 - 1 072 10 187 660 281
13 Non-SMEs 24 558 153 716 22 157 - 269 4 335 156 117
14 Equity - 10 615 - - - - 10 615
15 Total IRB approach 885 154 12 940 854 643 779 - 18 880 156 668 13 182 229
16 Central governments or central banks - 7 211 116 28 - - - 7 211 088
17Regional governments or local
authorities - 37 182 239 - - 11 36 943
18 Public sector entities - 2 669 3 - - 2 2 666
19 Multilateral development banks - 8 603 - - - - 8 603
20 International organisations - - - - - - -
21 Institutions - 3 736 - - - - 3 736
22 Corporates - 995 010 4 995 - - 55 990 015
23 Of which: SMEs - - - - - - -
24 Retail - 1 413 641 30 723 - - 41 1 382 918
25 Of which: SMEs - 240 718 1 268 - - 16 239 450
26Secured by mortgages on immovable
property - 43 792 169 - - 58 43 623
27 Of which: SMEs - 2 900 1 - - - 2 899
28 Exposures in default 109 383 - 84 042 - 237 3 872 25 341
29Items associated with particularly high
risk - 4 821 33 - - 26 4 788
30 Covered bonds - - - - - - -
31Claims on institutions and corporates
with a shortterm credit assessment - 448 - - - - 448
32 Collective investments undertakings - - - - - - -
33 Equity exposures - - - - - - -
34 Other exposures - - - - - - -
35 Total standardised approach 109 383 9 721 018 120 232 - 237 4 065 9 710 169
36 Total 994 537 22 661 872 764 011 - 19 117 160 733 22 892 398
37 Of which: Loans 983 678 15 421 582 761 747 - 19 117 158 895 15 643 513
38 Of which: Debt securities - 3 755 137 81 - - - 3 755 056
39 Of which: Offbalance-sheet exposures 10 859 3 485 153 2 183 - - 1 838 3 493 829
Gross carrying values of Specific credit
risk adjustment
Accumulated
write-offs
General credit
risk adjustment
Credit risk
adjustment charges
of the period

73
APPENDIX 17
EU CR1-B – CREDIT QUALITY OF EXPOSURES BY INDUSTRY
OR COUNTERPARTY TYPES /AS OF 31.12.2017/
In thousands of BGN
a b c d e f g
Net values
Defaulted
exposures
Non-defaulted
exposures (a +b-c-d)
1 16 018 605 689 17 762 - 190 6 723 603 945
2 575 36 648 539 - - 6 36 684
3 246 776 2 555 163 189 628 - 2 240 36 351 2 612 311
4 2 452 542 452 5 207 - 4 564 539 697
5 485 23 311 514 - 12 35 23 282
6 111 896 729 687 88 037 - 2 531 21 227 753 546
7 155 910 2 851 291 149 118 - 2 926 40 690 2 858 083
8 21 024 472 017 19 394 - 308 3 086 473 647
9 43 571 299 710 31 503 - 139 13 473 311 778
10 3 079 239 660 3 648 - 48 593 239 091
11 206 361 671 761 104 230 - 3 453 20 856 773 892
12 29 589 257 634 24 974 - 2 658 1 766 262 249
13 5 057 137 400 5 037 - 34 994 137 420
14 - 3 792 276 240 - - 11 3 792 036
15 84 1 718 39 - - 13 1 763
16 480 19 638 333 - 10 40 19 785
17 16 5 185 33 - - 11 5 168
18 127 307 2 243 396 75 727 - 1 485 19 907 2 294 976
19 970 680 15 484 636 715 963 - 16 038 166 346 15 739 353
Education
Human health services and social work
activities
Arts, entertainment and recreation
Other services
Total
Accommodation and food service
activities
Information and communication
Real estate activities
Professional, scientific and technical
activities Administrative and support service
activities
Public administration and defence,
compulsory social security
Manufacturing
Electricity, gas, steam and air
conditioning supply
Water supply
Construction
Wholesale and retail trade
Transport and storage
Specific credit risk
adjustment
General credit risk
adjustment
Accumulated write-
offs
Credit risk
adjustment
charges
Agriculture, forestry and fishing
Mining and quarrying
Gross carrying values of

74
APPENDIX 18
EU CR1-C – CREDIT QUALITY OF EXPOSURES BY GEOGRAPHY
/AS OF 31.12.2017/
In thousands of BGN
a b c d e f g
Net values
1 EUROPE 1 000 974 22 286 914 730 458 16 027 160 910 22 557 430
2 OF WHICH: BULGARIA 1 000 040 20 183 498 729 145 16 008 160 504 20 454 393
3 OF WHICH: ITALY 310 1 157 649 52 4 6 1 157 907
4 OF WHICH: UNITED KINGDOM 259 323 455 690 2 137 323 024
5 OF WHICH: GERMANY 92 255 903 101 5 11 255 894
6 OF WHICH: BELGIUM 2 195 730 2 - - 195 730
7 OF WHICH: NETHERLANDS 2 60 339 159 - 158 60 182
8 OF WHICH: AUSTRIA - 33 050 1 - - 33 049
9 OF WHICH: LUXEMBOURG - 14 368 - - - 14 368
10 OF WHICH: POLAND 48 12 721 14 2 13 12 755
11 OF WHICH: SWEDEN 1 6 446 1 - - 6 446
12 OF WHICH: FINLAND - 6 242 5 - 5 6 237
13 OF WHICH: OTHER EUROPEAN COUNTRIES 220 37 513 288 6 76 37 445
14 AMERICA 109 84 490 157 - 128 84 442
15 OF WHICH: USA 107 53 906 152 - 124 53 861
16 ASIA 57 60 817 52 1 30 60 822
17 OF WHICH: TURKEY 1 54 551 9 - 9 54 543
18 REST OF THE WORLD 1 712 188 849 857 9 55 189 704
19 OF WHICH: RUSSIA 1 496 97 138 490 7 48 98 144
20 OF WHICH: SWITZERLAND - 44 094 - - - 44 094
21 TOTAL 1 002 852 22 621 070 731 524 16 037 161 123 22 892 398
Credit risk
adjustment
charges
Defaulted
exposures
Non-defaulted
exposures (a+ b -c-d)
Gross carrying values of Specific credit risk
adjustment
General credit risk
adjustment
Accumulated write-
offs

75
APPENDIX 19
EU CR1-D – AGEING OF PAST-DUE EXPOSURES
/AS OF 31.12.2017/
In thousands of BGN
a b c d e f
≤ 30 days * > 30 days ≤ 60 days > 60 days ≤ 90 days > 90 days ≤ 180 days > 180 days ≤ 1 year > 1 year
1 Loans 9 773 466 73 889 291 087 66 095 93 918 557 190
2 Debt securities
3 Total exposures 9 773 466 73 889 291 087 66 095 93 918 557 190
Gross carrying values

76
APPENDIX 20
EU CR1-E – NON-PERFORMING AND FORBORNE EXPOSURES
/AS OF 31.12.2017/
In thousands of BGN
a b c d e f g h i j k l m
of which
defaulted
of which
impaired
of which
forborne
of which
forborne
of which
forborne
010 Debt securities 3 755 137 -81
020 Loans and advances 15 435 833 87 996 313 736 994 183 994 183 923 166 583 225 -75 925 -7 473 -685 857 -341 171 279 778 46 516
030 Off-balance-sheet exposures 3 485 153 2 227 10 859 10 859 431 -2 183 8 951 1 470
of which
performing
Gross carrying values of performing and non-performing exposuresAccumulated impairment and provisions and negative fair
value adjustments due to credit risk
Collaterals and financial
guarantees received
of which
performing but
past due > 30 days
and <= 90 days
of which
performing
forborne
of which non-performing on performing exposures On non-performing exposures On non-
performing
exposures
Of which
forborne
exposures

77
APPENDIX 21
EU CR2-A – CHANGES IN THE STOCK OF GENERAL AND
SPECIFIC CREDIT RISK ADJUSTMENTS /AS OF 31.12.2017/
In thousands of BGN
a b
Accumulated specific
credit risk adjustment
Accumulated general
credit risk adjustment
1 Opening balance 921 697 87 091
2Increases due to amounts set aside for estimated loan losses during
the period 298 855 49 561
3Decreases due to amounts reversed for estimated loan losses during
the period -177 515 -60 646
4Decreases due to amounts taken against accumulated credit risk
adjustments -417 461
5 Transfers between credit risk adjustments
6 Impact of exchange rate differences -376
7Business combinations, including acquisitions and disposals of
subsidiaries
8 Other adjustments 12
9 Closing balance 625 212 76 006
10Recoveries on credit risk adjustments recorded directly to the
statement of profit or loss 28 088
11Specific credit risk adjustments directly recorded to the statement
of profit or loss

78
APPENDIX 22
EU CR2-B – CHANGES IN THE STOCK OF DEFAULTED AND
IMPAIRED LOANS AND DEBT SECURITIES /AS OF 31.12.2017/
In thousands of BGN
a
Gross carrying value
defaulted exposures
1 Opening balance 1 546 108
2Loans and debt securities that have defaulted or impaired
since the last reporting period 141 096
3 Returned to non-defaulted status -110 820
4 Amounts written off -416 830
5 Other changes - collected amounts -165 374
6 Closing balance 994 180

79
APPENDIX 23
EU CR5 – STANDARDISED APPROACH
/AS OF 31.12.2017/
In thousands of BGN
0% 2% 4% 10% 20% 35% 50% 70% 75% 100% 150% 250% 370% 1250% Others Deducted
1 Central governments or central banks 7 190 104 - - - - - - - - - - 9 673 - - - - 7 199 777 299 055
2Regional government or local
authorities - - - - - - - - - 35 693 - - - - - - 35 693 35 693
3 Public sector entities - - - - - - - - - 1 171 - - - - - - 1 171 1 171
4 Multilateral development banks 63 661 - - - - - - - - - - - - - - - 63 661 63 661
5 International organisations - - - - - - - - - - - - - - - - - -
6 Institutions - - - - 276 - 2 955 - - - - - - - - - 3 231 3 231
7 Corporates - - - - - - 16 873 - - 868 208 - - - - - - 885 081 885 081
8 Retail - - - - - - - - 1 367 174 - - - - - - - 1 367 174 1 367 174
9Secured by mortgages on immovable
property - - - - - 9 102 26 022 - - - - - - - - - 35 124 35 124
10 Exposures in default - - - - - - - - - 11 699 12 764 - - - - - 24 463 24 463
11Exposures associated with particularly
high risk - - - - - - - - - - 4 788 - - - - - 4 788 4 788
12 Covered bonds - - - - - - - - - - - - - - - - - -
13Institutions and corporates with a
short-term credit assessment - - - - - - - - - 220 8 - - - - - 228 228
14 Collective investment undertakings - - - - - - - - - - - - - - - - - -
15 Equity - - - - - - - - - - - - - - - - - -
16 Other items - - - - - - - - - - - - - - - - - -
17 Total 7 253 765 - - - 276 9 102 45 850 - 1 367 174 916 991 17 560 9 673 - - - - 9 620 391 2 719 669
Exposure classes Risk weight
Total Of which
unrated

80
APPENDIX 24
EU CCR3 – STANDARDISED APPROACH – CCR EXPOSURES
BY REGULATORY PORTFOLIO AND RISK /AS OF 31.12.2017/
In thousands of BGN
0% 2% 4% 10% 20% 50% 70% 75% 100% 150% Others
1Central governments or central
banks - - - - - - - - - - - - -
2Regional government or local
authorities - - - - - - - - - - - - -
3 Public sector entities - - - - - - - - - - - - -
4 Multilateral development banks - - - - - - - - - - - - -
5 International organisations - - - - - - - - - - - - -
6 Institutions - - - - - - - - - - - - -
7 Corporates - - - - - - - - 1 417 - - 1 417 1 417
8 Retail - - - - - - - - - - - - -
9Institutions and corporates with a
short-term credit assessment - - - - - - - - - - - - -
10 Other items - - - - - - - - - - - - -
11 Total - - - - - - - - 1 417 - - 1 417 1 417
Exposure classes Total Of which
unrated
Risk weight
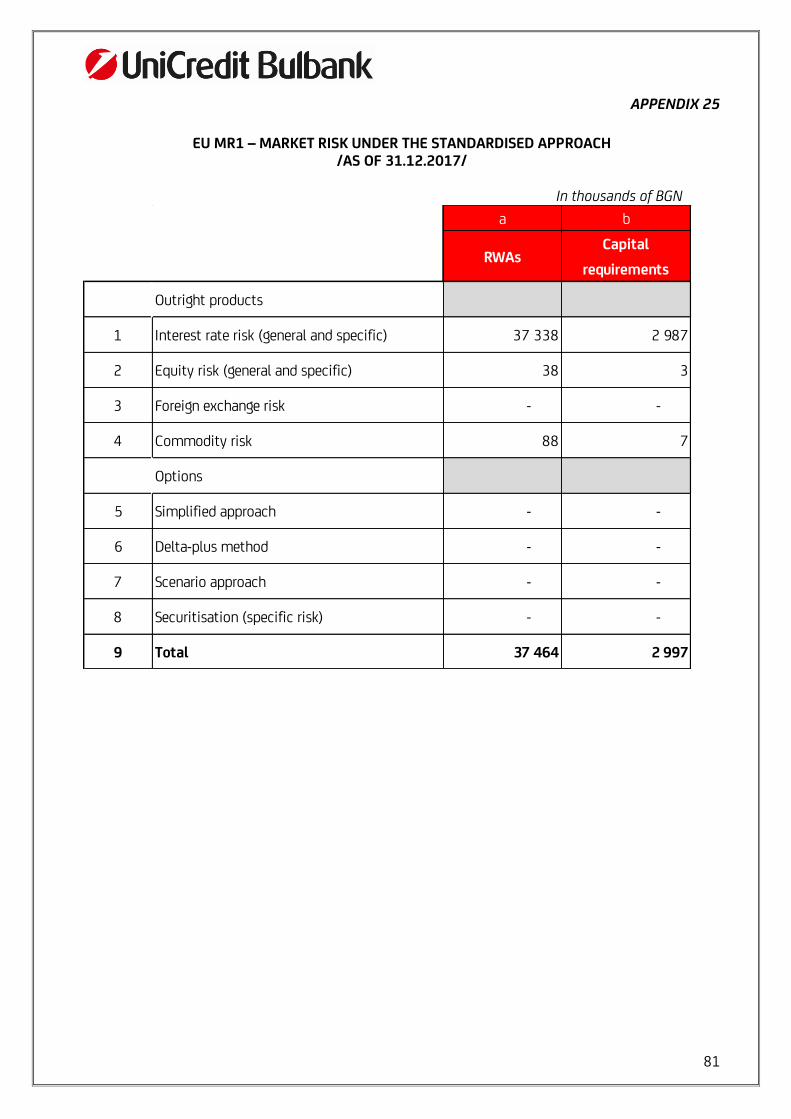
81
APPENDIX 25
EU MR1 – MARKET RISK UNDER THE STANDARDISED APPROACH
/AS OF 31.12.2017/
In thousands of BGN
a b
RWAs Capital
requirements
Outright products
1 Interest rate risk (general and specific) 37 338 2 987
2 Equity risk (general and specific) 38 3
3 Foreign exchange risk - -
4 Commodity risk 88 7
Options
5 Simplified approach - -
6 Delta-plus method - -
7 Scenario approach - -
8 Securitisation (specific risk) - -
9 Total 37 464 2 997

82
APPENDIX 26
LEVERAGE RATIO
/AS OF 31.12.2017/
In thousands of BGN
In thousands of BGN
In thousands of BGN
Total assets as per published financial statements 20 259 159
Adjustments for derivative financial instruments 103 711
Adjustments for securities financing transactions "SFTs"[1] -
Adjustment for off-balance sheet items (i.e. conversion to credit equivalent amounts of off-balance sheet
exposures)1 327 895
Other adjustments -42 738
Total leverage ratio exposure 21 648 027
Summary reconciliation of accounting assets and leverage ratio exposures
[1] SFT, which is an abbreviation of Securities Financing Transaction and shall mean ‘repurchase transactions, securities or commodities lending or
borrowing transactions, long settlement transactions and margin lending transactions’ of Regulation (EU) № 575/2013.
Tier 1 capital - Fully phased in 2 740 022
Leverage ratio in accordance with Regulation (EU) № 575/2013 12.66%
Leverage ratio common disclosure
Total on-balance sheet exposures (excluding derivatives, SFTs, and exempted exposures), of which: 20 166 488
Trading book exposures 36
Banking book exposures, of which: 20 166 452
Exposures treated as sovereigns 7 199 582
Exposures to regional governments, MDB, international organisations and PSE not treated as sovereigns 34 946
Institutions 1 593 648
Secured by mortgages of immovable properties 2 026 623
Retail exposures 2 053 501
Corporate 6 167 837
Exposures in default 307 195
Other exposures (eg equity, securitisations, and other non-credit obligation assets) 783 120
Asset amounts deducted in determining Tier 1 capital -42 738
Derivative exposures, of which: 196 382
Replacement cost associated with all derivatives transactions (i.e. net of eligible cash variation margin) 92 671
Add-on amounts for PFE associated with all derivatives transactions (mark-to-market method) 103 711
Securities financing transaction exposures, of which: -
Counterparty credit risk exposure for SFT assets -
Other off-balance sheet exposures 1 327 895
Leverage ratio exposures - Regulation (EU) № 575/2013

83
APPENDIX 27A
EU CR6 – IRB APPROACH – CREDIT RISK EXPOSURES BY EXPOSURE CLASS AND PD RANGE
FOUNDATION IRB APPROACH /AS OF 31.12.2017/
In thousands of BGN
a b c d e f g h i j k l
FIRB PD scale Original on-balance
sheet gross exposures
Off-balance sheet
exposures pre-CCF Average CCF
EAD post CRM and
post CCF Average PD Number of obligors Average LGD Average maturity RWAs RWA density EL
Value adjustments and
provisions
Institutions 0.00 to <0.15 269 037 99 356 17.94% 286 864 0.10% 56 45.00% 2.50 118 360 41.26% 126 -
Institutions 0.15 to <0.25 1 318 956 73 919 59.01% 1 362 574 0.16% 11 45.00% 2.50 754 274 55.36% 986 -
Institutions 0.25 to <0.50 444 35 092 64.16% 22 959 0.40% 13 45.00% 2.50 19 493 84.91% 41 -
Institutions 0.50 to <0.75 - 8 906 50.00% 4 453 0.57% 2 45.00% 2.50 3 495 78.49% 12 -
Institutions 0.75 to <2.50 2 471 5 941 23.50% 3 867 0.77% 3 45.00% 2.50 3 436 88.86% 13 -
Institutions 2.50 to <10.00 - 144 50.00% 72 3.74% 4 45.00% 2.50 114 158.41% 1 -
Institutions 10.00 to <100.00 5 - 0.00% 5 30.77% 1 45.00% 2.50 15 292.97% 1 -
Institutions 100.00 (Default) - - 0.00% - 0.00% - 0.00% - - 0.00% - -
Institutions Subtotal 1 590 914 223 358 40.24% 1 680 794 0.16% 90 45.00% 2.50 899 187 53.50% 1 180 -
Corporates: Of which: specialised lending Excelent 211 282 7 856 27.30% 213 427 21 149 390 70.00% 854 541
Corporates: Of which: specialised lending Good 569 007 104 965 46.42% 614 107 94 551 354 89.78% 4 901 4 123
Corporates: Of which: specialised lending Satisfactory 117 637 6 244 75.00% 122 320 31 140 599 114.94% 3 423 1 801
Corporates: Of which: specialised lending Weak 17 686 452 75.00% 18 025 2 45 063 250.00% 1 442 721
Corporates: Of which: specialised lending Default 167 966 16 75.00% 167 977 39 - 0.00% 83 989 88 753
Corporates: Of which: specialised lending Subtotal 1 083 579 119 531 46.77% 1 135 856 187 886 406 78.04% 94 609 95 939
2 674 492 342 890 42.23% 2 816 649 0.16% 277 45.00% 2.50 1 785 592 63.39% 95 789 95 939
Total (all portfolios)

84
APPENDIX 27B
EU CR6 – IRB APPROACH – CREDIT RISK EXPOSURES BY EXPOSURE CLASS AND PD RANGE ADVANCED IRB APPROACH
/AS OF 31.12.2017/ In thousands of BGN
a b c d e f g h i j k l
AIRB PD scale Original on-balance sheet
gross exposures
Off-balance sheet
exposures pre-CCF Average CCF
EAD post CRM and post
CCF Average PD Number of obligors Average LGD Average maturity RWAs RWA density EL
Value adjustments and
provisions
Corporates 0.00 to <0.15 307 018 566 074 29.94% 476 500 0.08% 44 47.12% 1.31 101 231 21.24% 168 13
Corporates 0.15 to <0.25 66 925 137 476 32.96% 112 236 0.19% 14 53.16% 1.77 48 577 43.28% 112 16
Corporates 0.25 to <0.50 76 058 91 411 33.27% 106 466 0.42% 20 52.45% 1.69 67 971 63.84% 230 86
Corporates 0.50 to <0.75 64 846 161 876 42.17% 133 114 0.61% 16 52.10% 2.08 125 810 94.51% 427 102
Corporates 0.75 to <2.50 474 925 178 378 36.73% 539 639 1.23% 43 44.87% 2.62 555 816 103.00% 2 944 1 342
Corporates 2.50 to <10.00 8 825 33 120 30.35% 18 877 6.55% 21 39.11% 2.25 27 793 147.23% 513 90
Corporates 10.00 to <100.00 23 469 3 106 38.18% 24 655 19.97% 2 32.45% 3.54 46 625 189.11% 1 596 1 066
Corporates 100.00 (Default) 49 547 358 96.23% 49 891 100.00% 31 80.67% 1.90 - 0.00% 40 249 35 468
Corporates Subtotal 1 071 612 1 171 800 33.33% 1 461 378 1.04% 191 48.39% 2.00 973 824 66.64% 46 239 38 182
Corporates: Of which: sme 0.00 to <0.15 95 521 75 098 48.33% 131 815 0.12% 47 45.00% 2.59 40 523 30.74% 70 28
Corporates: Of which: sme 0.15 to <0.25 110 495 91 985 43.30% 149 964 0.20% 118 28.31% 3.13 35 726 23.82% 83 52
Corporates: Of which: sme 0.25 to <0.50 334 602 175 021 42.49% 408 155 0.40% 371 41.08% 2.94 204 899 50.20% 666 294
Corporates: Of which: sme 0.50 to <0.75 218 597 96 977 46.31% 262 368 0.63% 275 41.67% 2.28 141 667 54.00% 675 307
Corporates: Of which: sme 0.75 to <2.50 1 617 040 545 047 39.30% 1 806 091 1.49% 997 36.94% 2.95 1 303 743 72.19% 9 879 5 424
Corporates: Of which: sme 2.50 to <10.00 923 831 279 613 41.74% 1 035 217 4.48% 721 32.96% 2.80 891 214 86.09% 15 985 8 888
Corporates: Of which: sme 10.00 to <100.00 121 472 31 678 28.94% 130 641 14.79% 58 28.22% 3.42 141 162 108.05% 4 983 3 915
Corporates: Of which: sme 100.00 (Default) 470 481 8 006 94.74% 478 066 100.00% 291 59.73% 1.57 - 0.00% 285 549 355 339
Corporates: Of which: sme Subtotal 3 892 040 1 303 424 41.67% 4 402 316 2.46% 2 878 38.83% 2.73 2 758 934 62.67% 317 890 374 248
Retail Secured on real estate property 0.00 to <0.15 192 770 12 162 81.70% 202 706 0.12% 2 647 14.32% 8 525 4.21% 36 11
Retail Secured on real estate property 0.15 to <0.25 169 610 6 962 100.34% 176 511 0.20% 2 471 14.11% 10 190 5.77% 49 20
Retail Secured on real estate property 0.25 to <0.50 346 911 14 263 93.70% 360 275 0.37% 5 680 14.01% 32 087 8.91% 185 92
Retail Secured on real estate property 0.50 to <0.75 210 390 8 739 97.19% 218 818 0.61% 3 501 14.70% 28 523 13.03% 195 107
Retail Secured on real estate property 0.75 to <2.50 657 276 16 177 120.77% 676 066 1.36% 10 423 15.98% 156 405 23.13% 1 466 887
Retail Secured on real estate property 2.50 to <10.00 291 994 2 024 280.51% 296 915 4.93% 4 839 15.61% 142 374 47.95% 2 276 1 295
Retail Secured on real estate property 10.00 to <100.00 135 683 796 318.04% 137 845 19.85% 2 650 14.65% 106 915 77.56% 4 076 2 240
Retail Secured on real estate property 100.00 (Default) 130 069 16 0.00% 130 069 100.00% 1 995 35.74% - 0.00% 46 493 65 922
Retail Secured on real estate property Subtotal 2 134 703 61 138 108.81% 2 199 205 2.63% 34 206 16.26% 485 018 22.05% 54 777 70 574
Retail Qualifying revolving 0.00 to <0.15 6 853 69 814 63.11% 50 909 0.12% 30 442 31.96% 1 239 2.43% 20 6
Retail Qualifying revolving 0.15 to <0.25 5 510 20 916 64.09% 18 916 0.20% 12 615 32.63% 691 3.65% 12 5
Retail Qualifying revolving 0.25 to <0.50 10 964 25 165 63.04% 26 827 0.36% 16 980 33.54% 1 630 6.08% 32 15
Retail Qualifying revolving 0.50 to <0.75 7 517 12 662 63.28% 15 529 0.62% 10 796 33.62% 1 452 9.35% 32 16
Retail Qualifying revolving 0.75 to <2.50 27 689 36 785 62.13% 50 546 1.45% 37 066 33.64% 8 984 17.77% 246 132
Retail Qualifying revolving 2.50 to <10.00 29 648 17 949 62.78% 40 916 5.00% 30 271 34.43% 17 761 43.41% 707 444
Retail Qualifying revolving 10.00 to <100.00 12 193 2 202 67.33% 13 676 16.02% 11 246 34.65% 11 699 85.55% 759 974
Retail Qualifying revolving 100.00 (Default) 4 751 197 0.00% 4 751 100.00% 6 192 65.90% - 0.00% 3 131 4 563
Retail Qualifying revolving Subtotal 105 124 185 691 62.98% 222 069 2.42% 155 608 34.05% 43 456 19.57% 4 939 6 155
Other retail 0.00 to <0.15 22 837 40 180 53.74% 44 263 0.12% 6 184 45.33% 5 221 11.80% 25 7
Other retail 0.15 to <0.25 21 129 26 139 54.72% 35 246 0.20% 2 865 47.37% 5 918 16.79% 33 9
Other retail 0.25 to <0.50 47 851 44 379 54.48% 71 530 0.39% 4 522 49.83% 18 739 26.20% 139 50
Other retail 0.50 to <0.75 54 104 28 583 56.21% 68 671 0.61% 3 859 50.32% 23 211 33.80% 211 84
Other retail 0.75 to <2.50 263 867 57 891 59.23% 294 316 1.41% 14 105 55.01% 151 467 51.46% 2 290 910
Other retail 2.50 to <10.00 127 161 15 308 63.21% 135 804 4.85% 8 495 55.31% 92 185 67.88% 3 641 1 486
Other retail 10.00 to <100.00 61 671 1 915 85.61% 63 037 21.47% 5 151 52.07% 63 154 100.19% 7 156 3 240
Other retail 100.00 (Default) 61 544 519 74.23% 61 843 100.00% 6 615 77.64% - 0.00% 48 014 52 894
Other retail Subtotal 660 164 214 915 56.83% 774 710 3.52% 51 796 54.83% 359 895 46.46% 61 508 58 681
7 863 644 2 936 967 42.23% 9 059 680 2.35% 244 679.00 36.15% 2.55 4 621 128 51.01% 485 352 547 840
Total (all portfolios)

85
APPENDIX 27C
EU CR6 – IRB APPROACH – CREDIT RISK EXPOSURES BY EXPOSURE CLASS AND PD RANGE
EQUITY /AS OF 31.12.2017/
In thousands of BGN
a b c d e f g h i j k l
EQUITY PD scale Original on-balance
sheet gross exposures
Off-balance sheet
exposures pre-CCF Average CCF
EAD post CRM and
post CCF Average PD Number of obligors Average LGD Average maturity RWAs RWA density EL
Value adjustments
and provisions
Equity Equity 22 487 - 22 487 11 50 192 223.21% 88 -
22 487 - 22 487 11 50 192 223.21% 88 -
Total (all portfolios)

86
APPENDIX 28A
EU CCR4 – IRB APPROACH – CCR EXPOSURES BY PORTFOLIO AND PD SCALE
FOUNDATION IRB APPROACH /AS OF 31.12.2017/
In thousands of BGN
FIRB PD scale EAD post CRM Average PD Number of
obligors Average LGD Average maturity RWAs RWA density
Institutions 0.00 to <0.15 5 826 0.12% 5 45.00% 2.50 2 691 46.20%
Institutions 0.15 to <0.25 100 743 0.16% 4 45.00% 2.50 55 760 55.35%
Institutions 0.25 to <0.50 293 0.30% 1 45.00% 2.50 168 57.40%
Institutions 0.50 to <0.75 - 0.00% - 0.00% - - 0.00%
Institutions 0.75 to <2.50 201 0.76% 1 45.00% 2.50 177 88.35%
Institutions 2.50 to <10.00 - 0.00% - 0.00% - - 0.00%
Institutions 10.00 to <100.00 - 0.00% - 0.00% - - 0.00%
Institutions 100.00 (Default) - 0.00% - 0.00% - - 0.00%
Institutions Subtotal 107 062 0.16% 11 45.00% 2.50 58 797 54.92%
Corporates: Of which: specialised lending Excelent 10 628 10 7 440 70.00%
Corporates: Of which: specialised lending Good 22 706 41 20 435 90.00%
Corporates: Of which: specialised lending Satisfactory 1 420 6 1 633 115.00%
Corporates: Of which: specialised lending Default 4 600 2 - 0.00%
Corporates: Of which: specialised lending Subtotal 39 354 59 29 508 74.98%
146 416 0.16% 70 45.00% 2.50 88 304 60.31%Total (all portfolios)

87
APPENDIX 28B
EU CCR4 – IRB APPROACH – CCR EXPOSURES BY PORTFOLIO AND PD SCALE
ADVANCED IRB APPROACH /AS OF 31.12.2017/
In thousands of BGN
AIRB PD scale EAD post CRM Average PD Number of
obligors Average LGD
Average
maturity RWAs RWA density
Corporates 0.00 to <0.15 25 800 0.13% 2 45.00% 2.50 6 254 24.24%
Corporates 0.15 to <0.25 11 860 0.15% 3 44.69% 2.50 3 473 29.29%
Corporates 0.25 to <0.50 1 850 0.41% 2 45.00% 2.50 1 735 93.75%
Corporates 0.50 to <0.75 - 0.00% - 0.00% - - 0.00%
Corporates 0.75 to <2.50 4 338 1.10% 9 45.00% 2.50 4 713 108.64%
Corporates 2.50 to <10.00 245 6.95% 2 45.00% 2.50 417 170.28%
Corporates 10.00 to <100.00 - 0.00% - 0.00% - - 0.00%
Corporates 100.00 (Default) 49 100.00% 1 45.00% 2.50 - 0.00%
Corporates Subtotal 44 142 0.28% 19 44.92% 2.50 16 592 37.59%
Corporates: Of which: sme 0.00 to <0.15 61 0.08% 2 45.00% 2.50 25 41.32%
Corporates: Of which: sme 0.15 to <0.25 - 0.00% - 0.00% - - 0.00%
Corporates: Of which: sme 0.25 to <0.50 577 0.42% 8 45.00% 2.50 372 64.52%
Corporates: Of which: sme 0.50 to <0.75 113 0.64% 3 45.00% 2.50 60 53.10%
Corporates: Of which: sme 0.75 to <2.50 2 820 1.89% 16 45.00% 2.50 3 343 118.53%
Corporates: Of which: sme 2.50 to <10.00 415 4.76% 9 45.00% 2.50 494 119.13%
Corporates: Of which: sme 10.00 to <100.00 81 10.77% 1 45.00% 2.50 149 182.69%
Corporates: Of which: sme 100.00 (Default) - 0.00% - 0.00% - - 0.00%
Corporates: Of which: sme Subtotal 4 067 2.09% 39 45.00% 2.50 4 443 109.25%
Other retail 0.00 to <0.15 - 0.00% - 0.00% - - 0.00%
Other retail 0.15 to <0.25 47 0.18% 1 45.00% 2.50 6 13.84%
Other retail 0.25 to <0.50 138 0.39% 2 45.00% 2.50 37 26.45%
Other retail 0.50 to <0.75 47 0.51% 1 45.00% 2.50 12 26.38%
Other retail 0.75 to <2.50 108 1.56% 4 45.00% 2.50 48 44.01%
Other retail 2.50 to <10.00 - 0.00% - 0.00% - - 0.00%
Other retail 10.00 to <100.00 - 0.00% - 0.00% - - 0.00%
Other retail 100.00 (Default) - 0.00% - 0.00% - - 0.00%
Other retail Subtotal 340 0.75% 8 45.00% 2.50 103 30.28%
48 550 0.44% 66 44.92% 2.50 21 139 43.54%Total (all portfolios)

88
APPENDIX 29
EU CR3 – CRM TECHNIQUES – OVERVIEW
/AS OF 31.12.2017/
In thousands of BGN
a b c d e
Exposures unsecured –
Carrying amount
Exposures secured –
Carrying amount
Exposures secured by
collateral
Exposures secured by
financial guarantees
Exposures secured by
credit derivatives
52 812 -
2 Total debt securities 3 755 056 - - - -
1 Total loans 9 989 274 3 593 677 3 540 865
52 812 -
4 Of which defaulted 151 501 134 349 134 297 51 -
3 Total exposures 13 744 330 3 593 677 3 540 865

89
APPENDIX 30
EU CR4 – STANDARDISED APPROACH – CREDIT RISK EXPOSURE AND CRM EFFECTS
/AS OF 31.12.2017/
In thousands of BGN
a b c d e f
Exposure classes On-balance-sheet
amount
Off-balance-sheet
amount
On-balance-sheet
amount
Off-balance-sheet
amount RWAs RWA density
1 Central governments or central banks 7 199 582 11 506 7 199 582 195 24 183 0.34%
2 Regional government or local authorities 34 679 2 264 34 679 1 014 35 693 100.00%
3 Public sector entities 267 2 399 266 905 1 171 100.00%
4 Multilateral development banks - 8 603 59 178 4 483 - 0.00%
5 International organisations - - - - - 0.00%
6 Institutions 2 726 1 010 2 726 505 1 533 47.45%
7 Corporates 837 410 152 605 831 167 53 914 866 428 97.89%
8 Retail 1 361 886 21 032 1 361 789 5 385 1 024 420 74.93%
9 Secured by mortgages on immovable property 26 640 16 983 26 640 8 484 16 034 45.65%
10 Exposures in default 23 593 1 748 23 589 874 30 845 126.09%
11 Exposures associated with particularly high risk 4 788 - 4 788 - 7 182 150.00%
12 Covered bonds - - - - - 0.00%
13Institutions and corporates with a short-term
credit assessment 8 440 8 220 232 101.75%
14 Collective investment undertakings - - - - - 0.00%
15 Equity - - - - - 0.00%
16 Other items - - - - - 0.00%
17 Total 9 491 579 218 590 9 544 412 75 979 2 007 721 20.87%
Exposures before CCF and CRM Exposures post CCF and CRM RWAs and RWA density

90
APPENDIX 31
EU CR7 – IRB APPROACH – EFFECT ON THE RWAs OF CREDIT DERIVATIVES
USED AS CRM TECHNIQUES /AS OF 31.12.2017/
In thousands of BGN
a b
Pre-credit derivatives RWAs Actual RWAs
1
2 Central governments and central banks - -
3 Institutions 899 187 899 187
4 Corporates – SMEs - -
5 Corporates – Specialised lending 886 406 886 406
6 Corporates – Other - -
7
8 Central governments and central banks - -
9 Institutions - -
10 Corporates – SMEs 2 758 679 2 758 679
11 Corporates – Specialised lending - -
12 Corporates – Other 973 824 973 824
13 Retail – Secured by real estate SMEs 128 741 128 741
14 Retail – Secured by real estate non- SMEs 356 278 356 278
15 Retail – Qualifying revolving 43 456 43 456
16 Retail – Other SMEs 297 607 297 607
17 Retail – Other non-SMEs 62 288 62 288
18 Equity IRB 49 373 49 373
19 Other non-credit obligation assets 469 436 469 436
20 Total 6 925 275 6 925 275
Exposures under FIRB
Exposures under AIRB

91
APPENDIX 32
EU CR8 – RWA FLOW STATEMENTS OF CREDIT RISK EXPOSURES
UNDER THE IRB APPROACH /AS OF 31.12.2017/
In thousands of BGN
a b
RWA amounts Capital requirements
1 RWAs as at the end of the previous reporting period 6 682 529 534 602
2 Asset size -143 589 -11 487
3 Asset quality -82 028 -6 562
4 Model updates
5 Methodology and policy
6 Acquisitions and disposals
7 Foreign exchange movements
8 Other
9 RWAs as at the end of the reporting period 6 456 912 516 553

92
APPENDIX 33A
EU CR9 – IRB APPROACH – BACKTESTING OF PD PER EXPOSURE CLASS
FOUNDATION IRB APPROACH /AS OF 31.12.2017/
In thousands of BGN
a b c d e g h i
End of previous year End of the year
Institutions 0.00 to <0.15 0.09% 0.33% 53 56 - -
Institutions 0.15 to <0.25 0.24% 1.90% 3 11 - -
Institutions 0.25 to <0.50 0.30% 2.15% 3 13 - -
Institutions 0.50 to <0.75 0.59% 0.75% 5 2 - -
Institutions 0.75 to <2.50 0.79% 1.20% 2 3 - -
Institutions 2.50 to <10.00 3.13% 3.13% 1 4 - -
Institutions 10.00 to <100.00 30.79% 30.79% 1 1 - -
Institutions Subtotal 0.10% 1.03% 68 90 - - 0.00%
Of which new
obligors
Average historical
annual default rateFIRB PD range
External rating
equivalent
Weighted average
PD
Arithmetic average
PD by obligors
Defaulted obligors
in the year
f
Number of obligors

93
APPENDIX 33B
EU CR9 – IRB APPROACH – BACKTESTING OF PD PER EXPOSURE CLASS
ADVANCED IRB APPROACH /AS OF 31.12.2017/
In thousands of BGN
a b c d e g h i
End of previous year End of the year
Corporates 0.00 to <0.15 0.08% 0.77% 33 44 - -
Corporates 0.15 to <0.25 0.18% 4.54% 10 14 - -
Corporates 0.25 to <0.50 0.38% 5.78% 36 20 - -
Corporates 0.50 to <0.75 0.66% 5.41% 15 16 - -
Corporates 0.75 to <2.50 1.41% 16.70% 57 43 - -
Corporates 2.50 to <10.00 4.20% 39.82% 25 21 - -
Corporates 10.00 to <100.00 19.99% 50.59% 3 2 - -
Corporates Subtotal 1.43% 13.74% 179 160 - - 1.29%
Corporates: Of which: sme 0.00 to <0.15 0.10% 1.13% 53 47 - -
Corporates: Of which: sme 0.15 to <0.25 0.18% 1.32% 107 118 - -
Corporates: Of which: sme 0.25 to <0.50 0.38% 2.76% 376 371 - -
Corporates: Of which: sme 0.50 to <0.75 0.64% 3.94% 255 275 2 -
Corporates: Of which: sme 0.75 to <2.50 1.39% 10.11% 966 997 6 -
Corporates: Of which: sme 2.50 to <10.00 4.14% 28.36% 741 721 27 -
Corporates: Of which: sme 10.00 to <100.00 13.12% 85.52% 53 58 5 -
Corporates: Of which: sme Subtotal 2.27% 14.72% 2 551 2 587 40 - 1.29%
Retail Secured on real estate property: Of which: sme 0.00 to <0.15 0.12% 0.34% 129 133 1 -
Retail Secured on real estate property: Of which: sme 0.15 to <0.25 0.19% 0.60% 152 148 - -
Retail Secured on real estate property: Of which: sme 0.25 to <0.50 0.39% 1.33% 362 333 2 -
Retail Secured on real estate property: Of which: sme 0.50 to <0.75 0.62% 2.26% 276 291 1 -
Retail Secured on real estate property: Of which: sme 0.75 to <2.50 1.38% 5.40% 1 307 1 194 13 -
Retail Secured on real estate property: Of which: sme 2.50 to <10.00 4.78% 16.43% 640 612 27 -
Retail Secured on real estate property: Of which: sme 10.00 to <100.00 24.41% 74.54% 359 279 62 -
Retail Secured on real estate property: Of which: sme Subtotal 3.77% 14.13% 3 225 2 990 106 - 3.44%
Retail Secured on real estate property: Of which: non-sme 0.00 to <0.15 0.12% 0.35% 1 987 2 397 2 -
Retail Secured on real estate property: Of which: non-sme 0.15 to <0.25 0.20% 0.56% 1 935 2 187 3 -
Retail Secured on real estate property: Of which: non-sme 0.25 to <0.50 0.36% 1.02% 4 695 5 139 9 -
Retail Secured on real estate property: Of which: non-sme 0.50 to <0.75 0.61% 1.69% 2 957 3 002 4 -
Retail Secured on real estate property: Of which: non-sme 0.75 to <2.50 1.37% 3.87% 8 506 8 657 16 -
Retail Secured on real estate property: Of which: non-sme 2.50 to <10.00 4.98% 14.11% 3 994 4 001 37 -
Retail Secured on real estate property: Of which: non-sme 10.00 to <100.00 18.73% 52.44% 2 286 2 277 171 -
Retail Secured on real estate property: Of which: non-sme Subtotal 2.62% 8.37% 26 360 27 660 242 - 2.12%
Retail Qualifying revolving 0.00 to <0.15 0.12% 0.33% 22 706 25 978 54 -
Retail Qualifying revolving 0.15 to <0.25 0.20% 0.60% 9 287 10 305 41 -
Retail Qualifying revolving 0.25 to <0.50 0.36% 1.16% 12 289 13 560 40 -
Retail Qualifying revolving 0.50 to <0.75 0.61% 2.06% 8 138 8 559 45 -
Retail Qualifying revolving 0.75 to <2.50 1.44% 4.87% 28 054 29 757 233 -
Retail Qualifying revolving 2.50 to <10.00 4.99% 16.86% 22 717 24 486 536 -
Retail Qualifying revolving 10.00 to <100.00 16.06% 49.27% 8 015 9 284 773 -
Retail Qualifying revolving Subtotal 2.48% 8.62% 111 206 121 929 1 722 - 2.12%
Other retail: Of which: sme 0.00 to <0.15 0.12% 0.33% 2 110 2 435 12 -
Other retail: Of which: sme 0.15 to <0.25 0.20% 0.70% 765 909 1 -
Other retail: Of which: sme 0.25 to <0.50 0.39% 1.51% 1 363 1 547 7 -
Other retail: Of which: sme 0.50 to <0.75 0.61% 2.51% 1 087 1 282 6 -
Other retail: Of which: sme 0.75 to <2.50 1.41% 6.21% 4 852 5 407 67 -
Other retail: Of which: sme 2.50 to <10.00 4.70% 18.80% 3 326 3 404 170 -
Other retail: Of which: sme 10.00 to <100.00 22.39% 85.61% 1 525 1 417 303 -
Other retail: Of which: sme Subtotal 3.62% 15.25% 15 028 16 401 566 - 3.44%
Other retail: Of which: non-sme 0.00 to <0.15 0.12% 0.28% 3 512 2 965 9 -
Other retail: Of which: non-sme 0.15 to <0.25 0.20% 0.44% 1 894 1 423 3 -
Other retail: Of which: non-sme 0.25 to <0.50 0.36% 0.80% 2 577 1 839 6 -
Other retail: Of which: non-sme 0.50 to <0.75 0.63% 1.37% 2 164 1 507 4 -
Other retail: Of which: non-sme 0.75 to <2.50 1.42% 3.13% 5 946 4 071 40 -
Other retail: Of which: non-sme 2.50 to <10.00 5.18% 11.15% 4 207 2 786 76 -
Other retail: Of which: non-sme 10.00 to <100.00 19.42% 40.45% 3 609 2 739 341 -
Other retail: Of which: non-sme Subtotal 4.31% 9.13% 23 909 17 330 479 - 2.12%
Defaulted
obligors in the
year
Of which new
obligors
Average
historical annual
default rate
f
AIRB PD range External rating
equivalent
Weighted
average PD
Arithmetic
average PD by
obligors
Number of obligors

94
Declaration by the Manager charged with preparing the financial reports
The undersigned, Jasna Mandac – CFO and Member of the Management Board of UniCredit Bulbank AD,
in his/her capacity as the Manager charged with preparing the financial reports of UniCredit Bulbank AD
DECLARES
that, pursuant to article 154-bis, paragraph 2, of the “Consolidated Law on Financial Intermediation”,
the information disclosed in this document corresponds to the accounting documents, books and
records.
Sofia,
June 14, 2018
Jasna Mandac
CFO and Member of the Management Board of UniCredit Bulbank AD
…………………………………………………..……..
/signature/