Embed Size (px)
Citation preview

DOE/EIA-0383(97)Distribution Category UC-950
Annual Energy Outlook 1997
With Projections to 2015
December 1996
Energy Information AdministrationOffice of Integrated Analysis and Forecasting
U.S. Department of EnergyWashington, DC 20585
This report was prepared by the Energy Information Administration, the independent statisticaland analytical agency within the Department of Energy. The information contained hereinshould not be construed as advocating or reflecting any policy position of the Department ofEnergy or any other organization.

For Further Information . . .The Annual Energy Outlook 1997 (AEO97) was prepared by the Energy Information Administration(EIA), Office of Integrated Analysis and Forecasting, under the direction of Mary J. Hutzler([email protected], 202/586-2222). General questions may be addressed to Arthur T. Andersen([email protected], 202/586-1441), Director of the Energy Demand and Integration Division; ScottSitzer ([email protected], 202/586-2308), Director of the Energy Supply and Conversion Division; orAndy S. Kydes ([email protected], 202/586-2222), Senior Modeling Analyst. Detailed questions aboutthe forecasts and related model components may be addressed to the following analysts:
Overview, Emissions . . . . . . . . . . Susan H. Shaw ([email protected], 202/586-4838)Economic Activity . . . . . . . . . . . . Ronald Earley ([email protected], 202/586-1398)International Oil Markets . . . . . . G. Daniel Butler ([email protected], 202/586-9503)Residential Demand . . . . . . . . . . John Cymbalsky ([email protected], 202/586-4815)Commercial Demand . . . . . . . . . . Erin Boedecker ([email protected], 202/586-4791)Industrial Demand . . . . . . . . . . . T. Crawford Honeycutt ([email protected], 202-586-1420)Transportation Demand . . . . . . . David Chien ([email protected], 202/586-3994)Electricity Generation, Futures . . David Schoeberlein ([email protected], 202/586-2349)Electricity Prices, Deregulation . . Art Holland ([email protected], 202/586-2026)Nuclear Energy . . . . . . . . . . . . . . Laura Church ([email protected], 202/586-1494)Renewable Energy . . . . . . . . . . . Perry M. Lindstrom ([email protected], 202/586-0934)Oil and Gas Production . . . . . . . . Ted McCallister ([email protected], 202/586-4820)Natural Gas Markets . . . . . . . . . Phyllis Martin ([email protected], 202/586-9592)Natural Gas Regulations . . . . . . James Diemer ([email protected], 202/586-6126)Oil Refining and Markets . . . . . . Stacy MacIntyre ([email protected], 202/586-9795)Coal Supply and Prices . . . . . . . . Richard Newcombe ([email protected], 202/586-2415)
The AEO97 will be available on the EIA Home Page (http://www.eia.doe.gov/oiaf/aeo97/homepage.html) by January 1997, including text, forecast tables, and graphics. To download the tables or the entirepublication, go to the EIA FTP Site (ftp://ftp.eia.doe.gov/pub/forecasting/aeo97). Assumptions under-lying the projections and tables of regional and other detailed results will be available on the EIA HomePage by January 1997. AEO97, the assumptions, and the supplementary tables will be available onCD-ROM by February 1997. Forecast tables are available on diskette by contacting the Office ofScientific and Technical Information by telephone at 615/576-8401 or by mail at P.O. Box 62, Oak Ridge,TN 37831; they are also available through EIA’s Fax-on-Demand (see Appendix I).
Model documentation reports for the National Energy Modeling System (NEMS) are also available onCD-ROM. Quarterly projections of energy supply and demand for 1996 and 1997 are available in theShort-Term Energy Outlook (Fourth Quarter 1996). For ordering information and questions on otherenergy statistics available from EIA, please contact EIA’s National Energy Information Center.Addresses, telephone numbers, and hours are as follows:
National Energy Information Center, EI-231Energy Information AdministrationForrestal Building, Room 1F-048Washington, DC 20585
Telephone: 202/586-8800 E-mail: [email protected]: For people who are deaf World Wide Web Site: http://www.eia.doe.gov/
or hard of hearing: 202/586-1181 Gopher Site: gopher://gopher.eia.doe.gov/9 a.m. to 5 p.m., eastern time, M-F FTP Site: ftp://ftp.eia.doe.gov/

PrefaceThe Annual Energy Outlook 1997 (AEO97) presentsmidterm forecasts of energy supply, demand, andprices through 2015 prepared by the Energy Infor-mation Administration (EIA). These projections arebased on results of EIA’s National Energy ModelingSystem (NEMS).
This report begins with a summary of the referencecase, followed by a discussion of the legislativeassumptions and evolving legislative and regulatoryissues. “Issues in Focus” discusses emerging energyissues and other topics of particular interest. It isfollowed by the analysis of energy market trends.
The analysis in AEO97 focuses primarily on a refer-ence case and four other cases that assume higherand lower economic growth and higher and lowerworld oil prices than in the reference case. Forecasttables for these cases are provided in Appendixes Athrough C. Appendixes D and E present summariesof the reference case forecasts in units of oil equiva-lence and household energy expenditures. Twenty-three other cases explore the impacts of varying keyassumptions in NEMS—generally, technology pene-tration, with the major results shown in Appendix F.
Appendix G briefly describes NEMS and the majorAEO97 assumptions, with a summary table. Appen-dix H provides tables of energy conversion andmetric conversion factors. Appendix I presents
instructions for obtaining tables through the EIAFax-On-Demand system. AEO97 and the detailedassumptions will also be available on the EIA HomePage and on CD-ROM.
The AEO97 projections are based on Federal, State,and local laws and regulations in effect on October1, 1996. Pending legislation and sections of existinglegislation for which funds have not been appropri-ated are not reflected in the forecasts. The AEO97projections were prepared by using the most currentdata available as of July 31, 1996, when most 1995data but only partial 1996 data were available. His-torical data are presented for comparative purposes.Data documents referenced in the source notesshould be consulted for official values. The AEO97projections for 1996 and 1997 incorporate the short-term projections from EIA’s Short-Term EnergyOutlook (STEO), Fourth Quarter 1996, published inOctober 1996.
The AEO97 projections are used by Federal, State,and local governments, trade associations, and otherplanners and decisionmakers in the public and pri-vate sectors. They are published in accordance withSection 205c of the Department of Energy Organiza-tion Act of 1977 (Public Law 95-91), which requiresthe Administrator of EIA to prepare an annualreport that contains trends and projections of energyconsumption and supply.
The projections in AEO97 are not statements ofwhat will happen but of what might happen, giventhe assumptions and methodologies used. The pro-jections are business-as-usual trend forecasts,given known technology and demographic trendsand current laws and regulations, thus providinga policy-neutral reference case that can be used toanalyze policy initiatives. EIA does not propose,advocate, or speculate on future legislative andregulatory changes. All laws are assumed to re-main as currently enacted; however, the impacts ofemerging regulatory changes, when defined, arereflected.
Because energy markets are complex, models aresimplified representations of energy productionand consumption, regulations, and producer andconsumer behavior. The forecasts are highly de-pendent on the data, methodologies, model struc-tures, and assumptions used in their development.
Behavioral characteristics are indicative of real-world tendencies rather than representations ofspecific outcomes.
Energy market projections are subject to muchuncertainty. Many events which shape energymarkets are random and cannot be anticipated,including severe weather, political disruptions,strikes, and technological breakthroughs. In addi-tion, assumptions concerning future technology,demographics, and resources cannot be known withany degree of certainty. Many key uncertainties inthe AEO97 projections are addressed throughalternative cases.
EIA has endeavored to make these forecasts as ob-jective, reliable, and useful as possible, but theseprojections should serve as an adjunct to, not asubstitute for, the analytical process that should beused to examine policy initiatives.
ii Energy Information Administration/ Annual Energy Outlook 1997

ContentsPage
Administrator’s Message . . . . . . . . . . . . . . . . . . . . . . . . . . . . . . . . . . . . . . . . . . . . . . . . . . . . . . . . . ix
Overview . . . . . . . . . . . . . . . . . . . . . . . . . . . . . . . . . . . . . . . . . . . . . . . . . . . . . . . . . . . . . . . . . . . . . . 1
Legislation and Regulations . . . . . . . . . . . . . . . . . . . . . . . . . . . . . . . . . . . . . . . . . . . . . . . . . . . . . . 7
Issues in Focus . . . . . . . . . . . . . . . . . . . . . . . . . . . . . . . . . . . . . . . . . . . . . . . . . . . . . . . . . . . . . . . . . 15Electricity Deregulation . . . . . . . . . . . . . . . . . . . . . . . . . . . . . . . . . . . . . . . . . . . . . . . . . . . . . . . . 16Electricity Futures . . . . . . . . . . . . . . . . . . . . . . . . . . . . . . . . . . . . . . . . . . . . . . . . . . . . . . . . . . . . 19Transportation Issues . . . . . . . . . . . . . . . . . . . . . . . . . . . . . . . . . . . . . . . . . . . . . . . . . . . . . . . . . 21Buildings Sector Issues . . . . . . . . . . . . . . . . . . . . . . . . . . . . . . . . . . . . . . . . . . . . . . . . . . . . . . . . 25Effects of Oil and Gas Supply Technology on Natural Gas and Renewables Markets . . . . . . . . . . 26
Market Trends . . . . . . . . . . . . . . . . . . . . . . . . . . . . . . . . . . . . . . . . . . . . . . . . . . . . . . . . . . . . . . . . . 31Key Assumptions in the Forecast . . . . . . . . . . . . . . . . . . . . . . . . . . . . . . . . . . . . . . . . . . . . . . . . . 32
Trends in Economic Activity . . . . . . . . . . . . . . . . . . . . . . . . . . . . . . . . . . . . . . . . . . . . . . . . . 32Economic Growth Cases . . . . . . . . . . . . . . . . . . . . . . . . . . . . . . . . . . . . . . . . . . . . . . . . . . . . 33International Oil Markets . . . . . . . . . . . . . . . . . . . . . . . . . . . . . . . . . . . . . . . . . . . . . . . . . . 34
Energy Demand by End Use . . . . . . . . . . . . . . . . . . . . . . . . . . . . . . . . . . . . . . . . . . . . . . . . . . . . 37Residential Sector . . . . . . . . . . . . . . . . . . . . . . . . . . . . . . . . . . . . . . . . . . . . . . . . . . . . . . . . 39Commercial Sector . . . . . . . . . . . . . . . . . . . . . . . . . . . . . . . . . . . . . . . . . . . . . . . . . . . . . . . . 40Industrial Sector . . . . . . . . . . . . . . . . . . . . . . . . . . . . . . . . . . . . . . . . . . . . . . . . . . . . . . . . . 41Transportation Sector . . . . . . . . . . . . . . . . . . . . . . . . . . . . . . . . . . . . . . . . . . . . . . . . . . . . . 43Energy Demand in Alternative Technology Cases . . . . . . . . . . . . . . . . . . . . . . . . . . . . . . . . . 45
Electricity . . . . . . . . . . . . . . . . . . . . . . . . . . . . . . . . . . . . . . . . . . . . . . . . . . . . . . . . . . . . . . . . . . 48Sales . . . . . . . . . . . . . . . . . . . . . . . . . . . . . . . . . . . . . . . . . . . . . . . . . . . . . . . . . . . . . . . . . . 48Generating Capacity . . . . . . . . . . . . . . . . . . . . . . . . . . . . . . . . . . . . . . . . . . . . . . . . . . . . . . 49Prices . . . . . . . . . . . . . . . . . . . . . . . . . . . . . . . . . . . . . . . . . . . . . . . . . . . . . . . . . . . . . . . . . . 50Generation . . . . . . . . . . . . . . . . . . . . . . . . . . . . . . . . . . . . . . . . . . . . . . . . . . . . . . . . . . . . . . 51Nuclear Power . . . . . . . . . . . . . . . . . . . . . . . . . . . . . . . . . . . . . . . . . . . . . . . . . . . . . . . . . . . 52Alternative Cases . . . . . . . . . . . . . . . . . . . . . . . . . . . . . . . . . . . . . . . . . . . . . . . . . . . . . . . . . 53Electricity from Renewable Sources . . . . . . . . . . . . . . . . . . . . . . . . . . . . . . . . . . . . . . . . . . . 54
Oil and Natural Gas . . . . . . . . . . . . . . . . . . . . . . . . . . . . . . . . . . . . . . . . . . . . . . . . . . . . . . . . . . 57Oil and Gas Prices . . . . . . . . . . . . . . . . . . . . . . . . . . . . . . . . . . . . . . . . . . . . . . . . . . . . . . . . 57Oil and Gas Reserve Additions . . . . . . . . . . . . . . . . . . . . . . . . . . . . . . . . . . . . . . . . . . . . . . . 58Natural Gas Production and Imports . . . . . . . . . . . . . . . . . . . . . . . . . . . . . . . . . . . . . . . . . . 59Natural Gas Consumption . . . . . . . . . . . . . . . . . . . . . . . . . . . . . . . . . . . . . . . . . . . . . . . . . . 60Natural Gas Prices . . . . . . . . . . . . . . . . . . . . . . . . . . . . . . . . . . . . . . . . . . . . . . . . . . . . . . . 61Oil and Gas Alternative Technology Cases . . . . . . . . . . . . . . . . . . . . . . . . . . . . . . . . . . . . . . 62Oil Production and Consumption . . . . . . . . . . . . . . . . . . . . . . . . . . . . . . . . . . . . . . . . . . . . . 64Petroleum Imports and Refining . . . . . . . . . . . . . . . . . . . . . . . . . . . . . . . . . . . . . . . . . . . . . 65Refined Petroleum Products . . . . . . . . . . . . . . . . . . . . . . . . . . . . . . . . . . . . . . . . . . . . . . . . . 66
Coal . . . . . . . . . . . . . . . . . . . . . . . . . . . . . . . . . . . . . . . . . . . . . . . . . . . . . . . . . . . . . . . . . . . . . . . 67Production and Prices . . . . . . . . . . . . . . . . . . . . . . . . . . . . . . . . . . . . . . . . . . . . . . . . . . . . . 67Coal Mining Labor Productivity . . . . . . . . . . . . . . . . . . . . . . . . . . . . . . . . . . . . . . . . . . . . . . 68Transportation Costs . . . . . . . . . . . . . . . . . . . . . . . . . . . . . . . . . . . . . . . . . . . . . . . . . . . . . . 69Consumption . . . . . . . . . . . . . . . . . . . . . . . . . . . . . . . . . . . . . . . . . . . . . . . . . . . . . . . . . . . . 70Exports . . . . . . . . . . . . . . . . . . . . . . . . . . . . . . . . . . . . . . . . . . . . . . . . . . . . . . . . . . . . . . . . 71Clean Air Standards . . . . . . . . . . . . . . . . . . . . . . . . . . . . . . . . . . . . . . . . . . . . . . . . . . . . . . 71
Emissions . . . . . . . . . . . . . . . . . . . . . . . . . . . . . . . . . . . . . . . . . . . . . . . . . . . . . . . . . . . . . . . . . . 72Carbon Emissions and Energy Use . . . . . . . . . . . . . . . . . . . . . . . . . . . . . . . . . . . . . . . . . . . . 72Emissions from Electricity Generation . . . . . . . . . . . . . . . . . . . . . . . . . . . . . . . . . . . . . . . . . 74
Energy Information Administration/ Annual Energy Outlook 1997 iii
Contents
PageForecast Comparisons . . . . . . . . . . . . . . . . . . . . . . . . . . . . . . . . . . . . . . . . . . . . . . . . . . . . . . . . . . . 75
List of Acronyms . . . . . . . . . . . . . . . . . . . . . . . . . . . . . . . . . . . . . . . . . . . . . . . . . . . . . . . . . . . . . . . 84
Notes and Sources . . . . . . . . . . . . . . . . . . . . . . . . . . . . . . . . . . . . . . . . . . . . . . . . . . . . . . . . . . . . . . 85
AppendixesA. Reference Case Forecast . . . . . . . . . . . . . . . . . . . . . . . . . . . . . . . . . . . . . . . . . . . . . . . . . . . . . 96B. Economic Growth Case Comparisons . . . . . . . . . . . . . . . . . . . . . . . . . . . . . . . . . . . . . . . . . . . . 124C. Oil Price Case Comparisons . . . . . . . . . . . . . . . . . . . . . . . . . . . . . . . . . . . . . . . . . . . . . . . . . . 152D. Crude Oil Equivalency Summary . . . . . . . . . . . . . . . . . . . . . . . . . . . . . . . . . . . . . . . . . . . . . . 180E. Household Expenditures . . . . . . . . . . . . . . . . . . . . . . . . . . . . . . . . . . . . . . . . . . . . . . . . . . . . . 181F. Results from Side Cases . . . . . . . . . . . . . . . . . . . . . . . . . . . . . . . . . . . . . . . . . . . . . . . . . . . . . 184G. Major Assumptions for the Forecasts . . . . . . . . . . . . . . . . . . . . . . . . . . . . . . . . . . . . . . . . . . . . 194H. Conversion Factors . . . . . . . . . . . . . . . . . . . . . . . . . . . . . . . . . . . . . . . . . . . . . . . . . . . . . . . . . 210I. EIA Fax-on-Demand . . . . . . . . . . . . . . . . . . . . . . . . . . . . . . . . . . . . . . . . . . . . . . . . . . . . . . . . 212
Index . . . . . . . . . . . . . . . . . . . . . . . . . . . . . . . . . . . . . . . . . . . . . . . . . . . . . . . . . . . . . . . . . . . . . . . . . 213
Tables
1. Summary of results for five cases . . . . . . . . . . . . . . . . . . . . . . . . . . . . . . . . . . . . . . . . . . . . . . . . . 62. NOx emissions standards under the Clean Air Act Amendments of 1990 . . . . . . . . . . . . . . . . . . . . 113. New car and light truck horsepower ratings and market shares, 1985, 1995, 2005, and 2015 . . . . . 434. Market shares of alternative-fuel light-duty vehicles by technology type, 2015 . . . . . . . . . . . . . . . . 445. Costs of producing electricity from new plants, 2000 and 2015 . . . . . . . . . . . . . . . . . . . . . . . . . . . . 516. Economically recoverable oil and gas resources in 1990,
measured under different technology assumptions . . . . . . . . . . . . . . . . . . . . . . . . . . . . . . . . . . . . . 577. Natural gas and crude oil drilling in three cases . . . . . . . . . . . . . . . . . . . . . . . . . . . . . . . . . . . . . . 588. Transmission and distribution revenues and margins, 1970, 1985, 1995, and 2015 . . . . . . . . . . . . 619. Components of residential and commercial natural gas end-use prices, 1985-2015 . . . . . . . . . . . . . 61
10. Representative average annual rates of technological progress in alternative technology cases . . . 6211. Petroleum consumption and net imports, 1995 and 2015 . . . . . . . . . . . . . . . . . . . . . . . . . . . . . . . . 6512. Scrubber retrofits, allowance costs, and banked allowances, 2000-2015 . . . . . . . . . . . . . . . . . . . . . 7413. Forecasts of economic growth, 1995-2015 . . . . . . . . . . . . . . . . . . . . . . . . . . . . . . . . . . . . . . . . . . . . 7614. Forecasts of world oil prices, 1995-2015 . . . . . . . . . . . . . . . . . . . . . . . . . . . . . . . . . . . . . . . . . . . . . 7615. Forecasts of average annual growth rates for energy consumption . . . . . . . . . . . . . . . . . . . . . . . . . 7716. Forecasts of average annual growth in residential and commercial energy demand . . . . . . . . . . . . 7717. Forecasts of average annual growth in industrial energy demand . . . . . . . . . . . . . . . . . . . . . . . . . 7718. Forecasts of average annual growth in transportation energy demand . . . . . . . . . . . . . . . . . . . . . . 7819. Comparison of electricity forecasts . . . . . . . . . . . . . . . . . . . . . . . . . . . . . . . . . . . . . . . . . . . . . . . . . 7920. Comparison of natural gas forecasts . . . . . . . . . . . . . . . . . . . . . . . . . . . . . . . . . . . . . . . . . . . . . . . 8021. Comparison of petroleum forecasts . . . . . . . . . . . . . . . . . . . . . . . . . . . . . . . . . . . . . . . . . . . . . . . . 8222. Comparison of coal forecasts . . . . . . . . . . . . . . . . . . . . . . . . . . . . . . . . . . . . . . . . . . . . . . . . . . . . . 83
Figures
1. Fuel price projections, 1995-2015: AEO96 and AEO97 compared . . . . . . . . . . . . . . . . . . . . . . . . . . 22. Energy production by fuel, 1970-2015 . . . . . . . . . . . . . . . . . . . . . . . . . . . . . . . . . . . . . . . . . . . . . . 23. Net energy imports by fuel, 1970-2015 . . . . . . . . . . . . . . . . . . . . . . . . . . . . . . . . . . . . . . . . . . . . . 34. Energy consumption by fuel, 1970-2015 . . . . . . . . . . . . . . . . . . . . . . . . . . . . . . . . . . . . . . . . . . . . . 35. Electricity generation by fuel, 1970-2015 . . . . . . . . . . . . . . . . . . . . . . . . . . . . . . . . . . . . . . . . . . . . 46. Energy use per capita and per dollar of gross domestic product, 1970-2015 . . . . . . . . . . . . . . . . . . 5
iv Energy Information Administration/ Annual Energy Outlook 1997

Contents
Figures (continued) Page
7. U.S. carbon emissions by sector and fuel, 1990-2015 . . . . . . . . . . . . . . . . . . . . . . . . . . . . . . . . . . . 58. Comparison of average natural gas transmission and distribution margins, 1970-2015 . . . . . . . . . 109. Nitrogen oxide emissions, 1994-2015 . . . . . . . . . . . . . . . . . . . . . . . . . . . . . . . . . . . . . . . . . . . . . . . 11
10. Changes in oil consumption for transportation and other uses, 1980-2015 . . . . . . . . . . . . . . . . . . . 2211. Changes in carbon emissions, 1990-2015 . . . . . . . . . . . . . . . . . . . . . . . . . . . . . . . . . . . . . . . . . . . . 2212. Trends in automobile fuel efficiency in the reference case, 1978-2015 . . . . . . . . . . . . . . . . . . . . . . 2213. Alternative-fuel vehicle shares of light-duty vehicle stock in two cases . . . . . . . . . . . . . . . . . . . . . . 2314. Trends in automobile fuel efficiency in the high efficiency case, 1978-2015 . . . . . . . . . . . . . . . . . . 2415. Changes from the reference case, assuming no increase in new car horsepower . . . . . . . . . . . . . . . 2416. Buildings sector energy prices, 1995 and 2015 . . . . . . . . . . . . . . . . . . . . . . . . . . . . . . . . . . . . . . . . 2517. Buildings sector energy consumption in alternative price and efficiency cases . . . . . . . . . . . . . . . . 2618. Buildings sector carbon emissions in alternative price and efficiency cases . . . . . . . . . . . . . . . . . . 2619. Lower 48 natural gas wellhead prices in two alternative oil and gas technology cases,
1970-2015 . . . . . . . . . . . . . . . . . . . . . . . . . . . . . . . . . . . . . . . . . . . . . . . . . . . . . . . . . . . . . . . . . . . 2820. Lower 48 natural gas production in two alternative oil and gas technology cases, 1970-2015 . . . . . 2821. Lower 48 natural gas wellhead prices in alternative oil and gas technology cases, 1995-2015 . . . . 2822. Natural gas and coal use for electricity generation in two alternative oil and gas technology cases,
1995, 2005, and 2015 . . . . . . . . . . . . . . . . . . . . . . . . . . . . . . . . . . . . . . . . . . . . . . . . . . . . . . . . . . . 2923. Electricity generation from renewables in two alternative oil and gas technology cases, 2015 . . . . 2924. Average annual real growth rates of economic factors, 1995-2015 . . . . . . . . . . . . . . . . . . . . . . . . . 3225. Sectoral composition of GDP growth, 1995-2015 . . . . . . . . . . . . . . . . . . . . . . . . . . . . . . . . . . . . . . 3226. Average annual real growth rates of economic factors in three cases, 1995-2015 . . . . . . . . . . . . . . 3327. Change in annual GDP growth rate for the preceding 20 years, 1966-2015 . . . . . . . . . . . . . . . . . . 3328. World oil prices in three cases, 1970-2015 . . . . . . . . . . . . . . . . . . . . . . . . . . . . . . . . . . . . . . . . . . . 3429. OPEC oil production in three cases, 1970-2015 . . . . . . . . . . . . . . . . . . . . . . . . . . . . . . . . . . . . . . . 3430. OPEC and non-OPEC oil production in two cases, 1990-2015 . . . . . . . . . . . . . . . . . . . . . . . . . . . . . 3531. Persian Gulf share of worldwide oil exports, 1965-2015 . . . . . . . . . . . . . . . . . . . . . . . . . . . . . . . . . 3532. U.S. petroleum imports by source, 1995-2015 . . . . . . . . . . . . . . . . . . . . . . . . . . . . . . . . . . . . . . . . 3633. Worldwide refining capacity by region, 1996 and 2015 . . . . . . . . . . . . . . . . . . . . . . . . . . . . . . . . . . 3634. Primary and delivered energy consumption, excluding transportation use, 1970-2015 . . . . . . . . . . 3735. Energy use per capita and per dollar of gross domestic product, 1970-2015 . . . . . . . . . . . . . . . . . . 3736. Energy use by fuel, 1970-2015 . . . . . . . . . . . . . . . . . . . . . . . . . . . . . . . . . . . . . . . . . . . . . . . . . . . . 3837. Energy use by sector, 1975-2015 . . . . . . . . . . . . . . . . . . . . . . . . . . . . . . . . . . . . . . . . . . . . . . . . . . 3838. Residential total energy consumption by fuel, 1970-2015 . . . . . . . . . . . . . . . . . . . . . . . . . . . . . . . . 3939. Residential total energy consumption by end use, 1987, 1995, and 2015 . . . . . . . . . . . . . . . . . . . . 3940. Commercial nonrenewable total energy consumption by fuel, 1970-2015 . . . . . . . . . . . . . . . . . . . . 4041. Commercial total energy consumption by end use, 1995 and 2015 . . . . . . . . . . . . . . . . . . . . . . . . . 4042. Efficiencies of commercial electric water heaters in the reference case, 1995-2015 . . . . . . . . . . . . . 4143. Industrial total energy consumption by fuel, 1970-2015 . . . . . . . . . . . . . . . . . . . . . . . . . . . . . . . . . 4144. Industrial primary energy consumption by industry category, 1995-2015 . . . . . . . . . . . . . . . . . . . . 4245. Manufacturing energy intensity by component, 1995-2015 . . . . . . . . . . . . . . . . . . . . . . . . . . . . . . . 4246. Transportation energy consumption by fuel, 1975, 1995, and 2015 . . . . . . . . . . . . . . . . . . . . . . . . . 4347. Transportation stock fuel efficiency by mode, 1980-2015 . . . . . . . . . . . . . . . . . . . . . . . . . . . . . . . . 4348. Alternative-fuel vehicle sales by type of demand, 1995-2015 . . . . . . . . . . . . . . . . . . . . . . . . . . . . . 4449. Alternative-fuel light-duty vehicle sales by fuel type, 1995-2015 . . . . . . . . . . . . . . . . . . . . . . . . . . 4450. Variation from reference case primary energy use by sector in two alternative technology cases . . 4551. Variation from reference case primary residential energy use in three alternative cases,
1995-2015 . . . . . . . . . . . . . . . . . . . . . . . . . . . . . . . . . . . . . . . . . . . . . . . . . . . . . . . . . . . . . . . . . . . 45
Energy Information Administration/ Annual Energy Outlook 1997 v

Contents
Figures (continued) Page
52. Changes in fuel and capital costs for selected residential appliances in the high technology case,1995-2015 . . . . . . . . . . . . . . . . . . . . . . . . . . . . . . . . . . . . . . . . . . . . . . . . . . . . . . . . . . . . . . . . . . . 46
53. Capital investment and energy cost savings for residential appliancesin the high technology case, 1995-2015 . . . . . . . . . . . . . . . . . . . . . . . . . . . . . . . . . . . . . . . . . . . . . 46
54. Variation from reference case primary commercial energy use in three alternative cases,1995-2015 . . . . . . . . . . . . . . . . . . . . . . . . . . . . . . . . . . . . . . . . . . . . . . . . . . . . . . . . . . . . . . . . . . . 46
55. Industrial energy intensity in two alternative technology cases, 1995-2015 . . . . . . . . . . . . . . . . . . 4756. Changes in key components of the transportation sector in two alternative cases, 2015 . . . . . . . . . 4757. Population, gross domestic product, and electricity sales growth, 1960-2015 . . . . . . . . . . . . . . . . . 4858. Annual electricity sales by sector, 1970-2015 . . . . . . . . . . . . . . . . . . . . . . . . . . . . . . . . . . . . . . . . . 4859. New generating capacity and retirements, 1990-2015 . . . . . . . . . . . . . . . . . . . . . . . . . . . . . . . . . . 4960. Electricity generation and cogeneration capacity additions by fuel type, 1995-2015 . . . . . . . . . . . . 4961. Fuel prices to electricity suppliers and electricity price, 1990-2015 . . . . . . . . . . . . . . . . . . . . . . . . 5062. Electric utility generator revenue requirements, 1990-2015 . . . . . . . . . . . . . . . . . . . . . . . . . . . . . . 5063. Electricity generation costs, 2000 and 2015 . . . . . . . . . . . . . . . . . . . . . . . . . . . . . . . . . . . . . . . . . . 5164. Electricity generation by fuel, 1995-2015 . . . . . . . . . . . . . . . . . . . . . . . . . . . . . . . . . . . . . . . . . . . . 5165. Nuclear power plant capacity factors, 1973-2015 . . . . . . . . . . . . . . . . . . . . . . . . . . . . . . . . . . . . . . 5266. Operable nuclear capacity in three cases, 1995-2015 . . . . . . . . . . . . . . . . . . . . . . . . . . . . . . . . . . . 5267. Cumulative new generating capacity by type in two cases, 1995-2015 . . . . . . . . . . . . . . . . . . . . . . 5368. Cumulative new generating capacity by type in three cases, 1995-2015 . . . . . . . . . . . . . . . . . . . . . 5369. Cumulative new electricity generating capacity by technology type in three cases, 1995-2015 . . . . 5470. Grid-connected electricity generation from selected renewable fuels, 1995-2015 . . . . . . . . . . . . . . . 5471. Wind-powered electricity generating capacity by region, 1995-2015 . . . . . . . . . . . . . . . . . . . . . . . . 5572. Levelized costs of electricity from wind power, 1990-2015 . . . . . . . . . . . . . . . . . . . . . . . . . . . . . . . 5573. Solar thermal and photovoltaic electricity generation, 1995-2015 . . . . . . . . . . . . . . . . . . . . . . . . . . 5674. Electricity generating capacity from renewable sources, 1995-2015 . . . . . . . . . . . . . . . . . . . . . . . . 5675. Lower 48 crude oil wellhead prices, 1970-2015 . . . . . . . . . . . . . . . . . . . . . . . . . . . . . . . . . . . . . . . . 5776. U.S. petroleum consumption in five cases, 1970-2015 . . . . . . . . . . . . . . . . . . . . . . . . . . . . . . . . . . . 5777. Lower 48 natural gas wellhead prices, 1970-2015 . . . . . . . . . . . . . . . . . . . . . . . . . . . . . . . . . . . . . 5778. Successful new lower 48 natural gas and oil wells in three cases, 1970-2015 . . . . . . . . . . . . . . . . . 5879. Lower 48 natural gas reserve additions in three cases, 1970-2015 . . . . . . . . . . . . . . . . . . . . . . . . . 5880. Lower 48 oil reserve additions in three cases, 1970-2015 . . . . . . . . . . . . . . . . . . . . . . . . . . . . . . . . 5881. Natural gas production by source, 1970-2015 . . . . . . . . . . . . . . . . . . . . . . . . . . . . . . . . . . . . . . . . . 5982. Natural gas production, consumption, and imports, 1970-2015 . . . . . . . . . . . . . . . . . . . . . . . . . . . 5983. Natural gas consumption in five cases, 1970-2015 . . . . . . . . . . . . . . . . . . . . . . . . . . . . . . . . . . . . . 6084. Pipeline capacity expansion by Census division, 1995-2015 . . . . . . . . . . . . . . . . . . . . . . . . . . . . . . 6085. Pipeline capacity utilization by Census division, 1995 and 2015 . . . . . . . . . . . . . . . . . . . . . . . . . . . 6086. Natural gas end-use prices by sector, 1970-2015 . . . . . . . . . . . . . . . . . . . . . . . . . . . . . . . . . . . . . . 6187. Wellhead share of natural gas end-use prices by sector, 1970-2015 . . . . . . . . . . . . . . . . . . . . . . . . 6188. Lower 48 natural gas production and wellhead prices in the low economic growth case,
1995-2015 . . . . . . . . . . . . . . . . . . . . . . . . . . . . . . . . . . . . . . . . . . . . . . . . . . . . . . . . . . . . . . . . . . . 6289. Lower 48 natural gas wellhead prices in three cases, 1970-2015 . . . . . . . . . . . . . . . . . . . . . . . . . . 6290. Lower 48 natural gas production in alternative technology cases, 1995-2015 . . . . . . . . . . . . . . . . . 6391. Lower 48 oil production in alternative technology cases, 1995-2015 . . . . . . . . . . . . . . . . . . . . . . . . 6392. Crude oil production by source, 1970-2015 . . . . . . . . . . . . . . . . . . . . . . . . . . . . . . . . . . . . . . . . . . . 6493. Petroleum production, consumption, and imports, 1970-2015 . . . . . . . . . . . . . . . . . . . . . . . . . . . . . 6494. Share of U.S. petroleum consumption supplied by net imports, 1970-2015 . . . . . . . . . . . . . . . . . . . 6595. Domestic refining capacity, 1975-2015 . . . . . . . . . . . . . . . . . . . . . . . . . . . . . . . . . . . . . . . . . . . . . . 6596. Change in petroleum products supplied in five cases, 1995 to 2015 . . . . . . . . . . . . . . . . . . . . . . . . 66
vi Energy Information Administration/ Annual Energy Outlook 1997

Contents
Figures (continued) Page
97. Components of refined product costs, 1995 and 2015 . . . . . . . . . . . . . . . . . . . . . . . . . . . . . . . . . . 6698. Coal production by region, 1970-2015 . . . . . . . . . . . . . . . . . . . . . . . . . . . . . . . . . . . . . . . . . . . . . . 6799. Average minemouth price of coal by region, 1990-2015 . . . . . . . . . . . . . . . . . . . . . . . . . . . . . . . . . 67
100. Coal mining labor productivity by region, 1990-2015 . . . . . . . . . . . . . . . . . . . . . . . . . . . . . . . . . . 67101. Labor cost component of minemouth coal prices, 1970-2015 . . . . . . . . . . . . . . . . . . . . . . . . . . . . . 68102. Average minemouth coal prices in three cases, 1995-2015 . . . . . . . . . . . . . . . . . . . . . . . . . . . . . . 68103. Percent change in coal transportation costs in three cases, 1995-2015 . . . . . . . . . . . . . . . . . . . . . 69104. Variation from reference case projection of coal demand in 2015 in two alternative cases . . . . . . . 69105. Electricity and other coal consumption, 1970-2015 . . . . . . . . . . . . . . . . . . . . . . . . . . . . . . . . . . . . 70106. Non-electricity coal consumption by sector, 1995, 2000, and 2015 . . . . . . . . . . . . . . . . . . . . . . . . . 70107. U.S. coal exports by destination, 1995, 2000, and 2015 . . . . . . . . . . . . . . . . . . . . . . . . . . . . . . . . . 71108. Coal distribution by sulfur content, 1995, 2000, and 2015 . . . . . . . . . . . . . . . . . . . . . . . . . . . . . . 71109. Carbon emissions by sector, 1990-2015 . . . . . . . . . . . . . . . . . . . . . . . . . . . . . . . . . . . . . . . . . . . . 72110. Carbon emissions per capita, 1990-2015 . . . . . . . . . . . . . . . . . . . . . . . . . . . . . . . . . . . . . . . . . . . . 72111. Carbon emissions by fuel, 1990-2015 . . . . . . . . . . . . . . . . . . . . . . . . . . . . . . . . . . . . . . . . . . . . . . 73112. Carbon emissions from electricity generation by fuel, 1990-2015 . . . . . . . . . . . . . . . . . . . . . . . . . 73113. Sulfur dioxide emissions from electricity generation, 1990-2015 . . . . . . . . . . . . . . . . . . . . . . . . . . 74114. Nitrogen oxide emissions from electricity generation, 1995-2015 . . . . . . . . . . . . . . . . . . . . . . . . . 74
Energy Information Administration/ Annual Energy Outlook 1997 vii

Administrator’s MessageOnce again, in the Annual Energy Outlook 1997(AEO97), the Energy Information Administration(EIA) presents baseline projections of energy mar-kets for the use of our customers. These projectionsextend to the year 2015 and, in addition to thereference case, include a number of side analysesthat address some of the key uncertainties thatinfluence energy supply, demand, and prices.
Use of the Projections
The projections in AEO97 are generated from EIA’sNational Energy Modeling System (NEMS), whichexamines the total energy system, including allenergy-producing and consuming sectors and themost significant macroeconomic indicators thataffect or are affected by the energy system. Thisallows us to look at the complex interactions withinenergy markets—as examples, the impact of increas-ing energy demand on domestic and internationalsupplies and prices, or the economic tradeoffsbetween conventional fossil fuels and renewableenergy sources.
As important as the projections in AEO97 are to themany users of the report as forecasts of energy, evenmore important is its use as a baseline for policyanalysis. Here again, the total look at energy mar-kets is valuable, as NEMS is used to anticipate theimpacts of new or proposed policies. The directimpacts of policies are often obvious, but the magni-tude of those impacts and the indirect impacts arefrequently less obvious without the total view of theenergy system. For example, an initiative to stimu-late production of domestic oil and natural gaswould have the positive impact of lowering consumerprices for the fuels and reducing oil imports. How-ever, secondary effects would include reducing theincentive for more efficient energy-using equipmentand slowing the penetration of renewable sources ofenergy—ultimately increasing consumption and po-tentially harmful emissions. This total look enablesus to identify and quantify the most significant out-comes of policy initiatives.
The AEO97 projections extend to 2015. This 20-yearperiod is a time interval during which EIA believesthat the most important characteristics of energyconsumption and production are sufficiently wellunderstood for credible projections to be developed
in considerable detail. The longer view is significantfor several reasons. First, the impacts of energypolicies or new technologies often take a number ofyears to develop fully because of the gradual turn-over of the vast stock of energy-using and producingequipment and the gradual adaption to changingenergy prices. Second, the longer term projections,examined in conjunction with long historical trends,help us put short-term phenomena in perspective.Severe weather conditions, international politicalevents, and disruptions in domestic supplies all havehad significant, but short-term, impacts on the priceand availability of energy in the past several years.But such short-term events typically have little im-pact on the longer term trends presented in AEO97.Finally, by projecting energy markets for twodecades, the report can alert readers to futureissues, such as the likely retirement of a significantnumber of the Nation’s nuclear generating plantsand the need to replace them with new plants usingnatural gas, coal, or renewable fuels.
Limitations of the Projections
Recognizing the value of the AEO97 projections, wemust also be aware of and alert our readers to thelimitations of the projections. First, although we usethe term “forecast” interchangeably with “projec-tions,” we fully recognize that we cannot predict thefuture. There are too many underlying forces ofenergy markets that cannot be known with certain-ty. Also, in its role as a policy-neutral data andanalysis organization, EIA does not speculate onchanges in energy policy. For this analysis, weassume that all current policies and regulations willbe stable over the projection period. However, policywill be modified over a 20-year period, and thatalone is a significant reason for energy markets todevelop differently than the forecasts indicate. Theassumption of stable regulation leads to assumptionsas sweeping as assuming that the current regulatoryenvironment for the electricity industry will contin-ue and as simple, but still important, as assumingthat Federal gasoline taxes will remain unchanged.
In addition, the projections do not reflect short-termvolatility. Prices on the futures markets can shiftdramatically over several weeks or even days as aresult of short-term conditions. Although monthlyand annual averages serve to dampen the extent of
Energy Information Administration/ Annual Energy Outlook 1997 ix

Administrator’s Message
price movements or other short-term events, ex-treme conditions can cause actual markets to differfrom projections. To consider these possibilities, wepresent ranges for key energy variables, such asworld oil prices. While prices can move outside theseranges, it would most likely be for a short period oftime.
Users of this report also must be alerted to the factthat the projections employ many of the perspectivesand conventions of economics. The prices projectedin AEO97 are controlled for general levels of infla-tion. Thus, a level track of prices does not indicatethat prices would be unchanged but that they wouldincrease at the general level of inflation. Forexample, the average crude oil price is projected torise from about $17 a barrel in 1995 to $21 a barrelin 2015 in inflation-adjusted dollars, or 1995 realdollars. Accounting for likely inflation, the price in2015 would be about $39 per barrel.
Technology is another key dynamic in energy mar-kets. Over recent years, major improvements inenergy technologies have dramatically improved theefficiency of energy consumption and production. Atthe same time, new end uses of energy have devel-oped, and other uses, such as air-conditioning, havecontinued to penetrate. Because of the time it takesnew technologies to penetrate markets, it is fareasier to assess such penetration in the early yearsof the forecast period than in the more distant years.We project substantial improvements in technologythrough the forecast horizon, but the magnitude ofsuch improvements is particularly difficult to assessin the later years. Also, we do not project any break-through or substantially new technologies. Becauseof these uncertainties and because technology is soimportant in the use and production of energy,AEO97 presents a number of alternative cases thatexplore the impacts of slower or more rapid rates ofimprovement in technology or productivity thanthose assumed in the reference case.
As difficult as it is to project developments in energyin the United States, where the economy is relative-ly stable and valid data are readily available, it iseven more difficult to assess international trends,which increasingly have impacts on the UnitedStates. It has long been recognized that events inthe energy-exporting nations have profound effectson international energy supply and prices. Butincreasingly, attention is being focused on economicgrowth and related energy use in countries withoutthe developed infrastructure of the nations in theOrganization for Economic Cooperation and Develop-ment. In addition, although we assume sometechnological improvements in the internationalproduction of oil, our ability to assess technologicaldevelopments worldwide and their impacts ondomestic technology development is limited. Forfurther discussions of international energy develop-ments, readers are referred to the InternationalEnergy Outlook 1997, scheduled for publication inApril 1997.
Early Availability of AEO97
Early availability of the AEO results is a frequentrequest to EIA, and we are making an effort toaccelerate the release of all our data and analysispublications. As a result, AEO97 is being publisheda month earlier, in December 1996, still using thesame dates for historical data inputs and assump-tions about legislation and regulations. In addition,with continued growth in the use of EIA’s Internetsite, we have made the reference case results and asummary discussion available on our Home Page inNovember, at the time this report was released forprinting. We intend to continue this service to ourcustomers in the future.
Jay E. HakesAdministratorEnergy Information Administration
x Energy Information Administration/ Annual Energy Outlook 1997

Overview

Overview
Prices
The Annual Energy Outlook 1997 (AEO97) projectslower prices for all energy fuels than were projectedin AEO96 (Figure 1). Average world crude oil pricesin AEO97 are projected to be about $21 a barrel (in1995 dollars) in 2015, $5 lower than the AEO96price of $26 a barrel. The lower prices reflect expec-tations that oil production from the Organization ofPetroleum Exporting Countries (OPEC) will expandand that technology advances will sustain non-OPEC production. It is assumed that Iraqi oil pro-duction will not resume until 1998 and then willincrease gradually to full capacity in 2000.
1995 2000 2005 2010 20150
5
10
15
20
AEO97
AEO96
1995 2000 2005 2010 20150
1
2
3
AEO97
AEO96
1995 2000 2005 2010 20150
2
4
6
8 AEO96
AEO97
1995 2000 2005 2010 20150
10
20
30 AEO96
AEO97
Electricity(cents per kilowatthour)
Natural gas wellhead(dollars per thousand cubic feet)
Crude oil(dollars per barrel)
Coal minemouth(dollars per ton)
Figure 1. Fuel price projections, 1995-2015:AEO96 and AEO97 compared (1995 dollars)
The AEO97 average wellhead price of natural gas in2015 is $2.13 per thousand cubic feet, comparedwith $2.63 in AEO96, primarily as the result of a re-evaluation of the impacts of technological progresson oil and natural gas discovery. In AEO96, techno-logical progress was assumed to slow the decline infinding rates—reserves discovered per new well. InAEO97, technological progress arrests and even re-verses declining finding rates in some regions. As aresult, natural gas production is increased, with lessdrilling activity and at lower cost, particularly inoffshore regions, where technological progress has agreater impact on the development of relativelyimmature fields. In addition, competition within theindustry and projections of lower interest ratesreduce the costs of transmission and distribution,offsetting the projected increase in wellhead prices,so that the average delivered price of natural gasdeclines between 1995 and 2015 at an averageannual rate of 0.2 percent.
Coal minemouth prices are projected to decline inthe forecast as a result of increasing productivity, a
shift to western production, and competitive pres-sures on labor costs. In AEO97, the average mine-mouth price of coal is projected to be $15.46 per tonin 2015, compared with $17.75 in AEO96. Lowercoal transportation rates—leading to higher produc-tion from western mines, where production costs arelower than in the East—are the primary reason forthe lower minemouth prices.
Average electricity prices also decline through 2015and are lower than in AEO96. The average price in2015 is projected to be 6.3 cents per kilowatthour,compared with 7.1 cents in AEO96, as a result oflower projected fossil fuel prices and anticipatedindustry restructuring. Increased competition in theelectricity industry is assumed to lead to loweroperating and maintenance costs, lower general andadministrative costs, early retirement of inefficientunits, and other cost reductions. AEO97 reflects theevolving trend of competition within electricity mar-kets but does not include the full impacts of restruc-turing and deregulation. Although the projectionsinclude the recent actions taken by the FederalEnergy Regulatory Commission on open access,specific actions to be taken by State public utilitycommissions and their timing are not yet known andhave not been incorporated. Electricity industry re-structuring is discussed further on pages 16-19.
Production and Imports
As a result of lower projected oil prices, crude oilproduction in the United States is lower in theAEO97 forecast, declining to 5.2 million barrels aday in 2015 (Figure 2), compared with 5.8 millionbarrels a day in AEO96. On average, U.S. oil pro-duction declines by 1.1 percent a year between 1995and 2015, consistent with long-term historical
1975 1985 1995 2005 20150
10
20
30
Coal
Natural gas
Nonhydrorenewablesand other
Nuclear
Petroleum
Hydro
History Projections
Figure 2. Energy production by fuel, 1970-2015(quadrillion Btu)
2 Energy Information Administration/ Annual Energy Outlook 1997

Overview
trends. Advances in oil discovery technologies areexpected to be insufficient to offset declining re-sources.
Declining production and rising consumption lead togrowing reliance on petroleum imports through 2015(Figure 3). The share of petroleum consumption metby net imports rises from 44 percent in 1995 (meas-ured in barrels per day) to 61 percent in 2015.
1975 1985 1995 2005 2015
0
10
20
30
0
-10
Coal
Natural gas
Petroleum
History Projections
Figure 3. Net energy imports by fuel, 1970-2015(quadrillion Btu)
Natural gas production is projected to increase at anaverage annual rate of 1.7 percent between 1995and 2015 to meet most of the growing demand forgas. In 2015, production is estimated to reach 26.1trillion cubic feet, compared to 18.5 trillion cubic feetin 1995. Net imports of natural gas, primarily fromCanada, also increase by 1.6 trillion cubic feet by2015 due to assumed growth and higher utilizationof pipeline capacity coupled with abundant suppliesof Canadian gas available at competitive prices.
Coal production increases by 1.0 percent a yearthrough 2015, from 1,033 million tons in 1995 to1,268 million in 2015. Most of the increase resultsfrom increasing domestic consumption. In addition,export demand is projected to rise through 2015.Exports of steam coal will primarily serve expandingmarkets for electricity generation in Europe andAsia, and some growth in metallurgical coal exportsto Asia is also projected in response to increasingdemand for steel.
With lower prices projected for all fuels, renewableenergy production, including hydropower, is 0.8quadrillion British thermal units (Btu) lower in theAEO97 forecast in 2015 than it was in AEO96. Low-er prices, particularly for natural gas, delay the pen-etration of some renewable technologies. Renewable
energy production, including hydropower, is project-ed to reach 7.7 quadrillion Btu in 2015, up from 6.3quadrillion Btu in 1995. More than half the in-crease, 0.8 quadrillion Btu, is biomass used byindustry and electricity generators, and most of therest is geothermal, municipal solid waste, and wind.
Consumption
The lower energy prices in AEO97 than in AEO96result in higher total consumption in 2015—111quadrillion Btu, compared with 108 quadrillion Btuin AEO96. Both industrial and transportation de-mand are higher, with stronger economic growthand higher projected travel.
Residential demand is the same in AEO97 as inAEO96. The lower prices are offset by more mobileand multifamily homes, improvements in shell andequipment efficiencies, and more conversions fromoil and conventional resistance heating to higherefficiency heating. Commercial demand is onlyslightly higher than in AEO96, because the lowerprices are mostly offset by improvements in lightingand in building shells for new construction, and bya 4 percent lower estimate of floorspace in 2015.
Natural gas consumption increases by an average of1.7 percent a year (Figure 4), mainly because ofgrowth in gas-fired electricity generation. Gas con-sumption by electric generators, excluding cogenera-tors, is projected to increase from 3.5 trillion cubicfeet in 1995 to 8.5 trillion cubic feet in 2015. Gasconsumption in the industrial sector, which includescogenerators, increases by 1.3 trillion cubic feet.Combined, by 2015 the residential and commercialsectors contribute 1.2 trillion cubic feet to theincreased use of gas.
1975 1985 1995 2005 20150
10
20
30
40
50
Coal
Natural gas
Nonhydrorenewablesand other
Nuclear
Petroleum
History Projections
Hydro
Figure 4. Energy consumption by fuel, 1970-2015(quadrillion Btu)
Energy Information Administration/ Annual Energy Outlook 1997 3
Overview
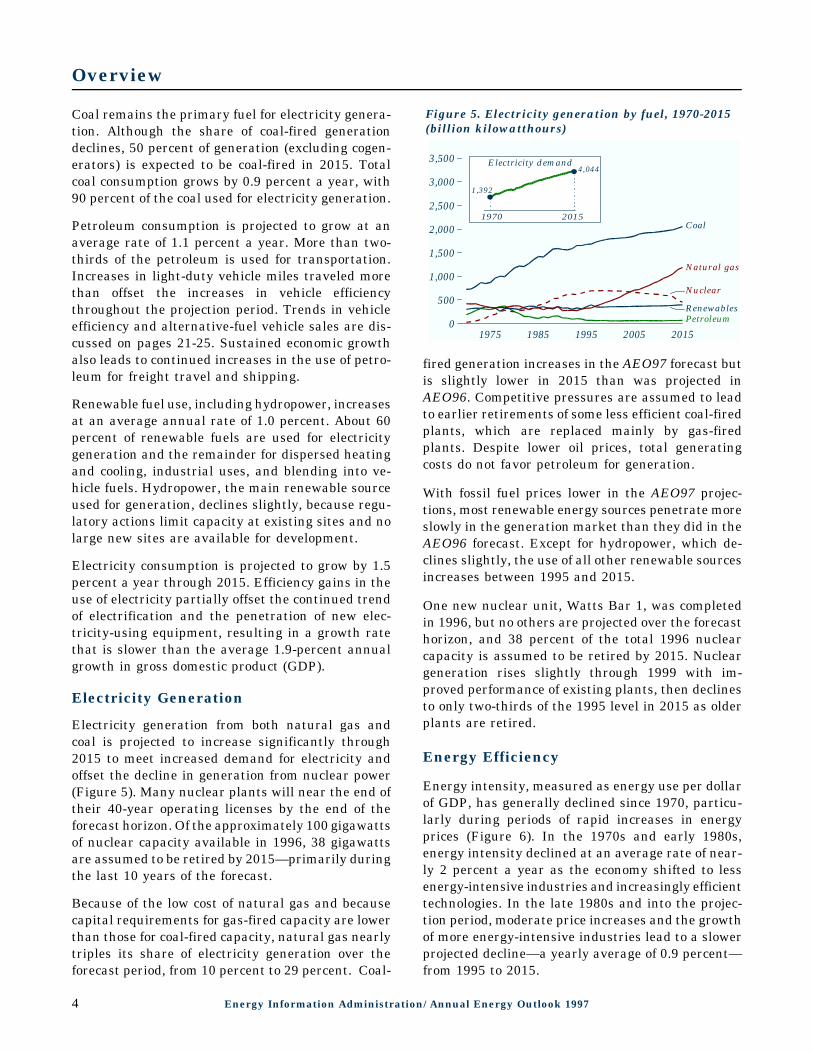
Coal remains the primary fuel for electricity genera-tion. Although the share of coal-fired generationdeclines, 50 percent of generation (excluding cogen-erators) is expected to be coal-fired in 2015. Totalcoal consumption grows by 0.9 percent a year, with90 percent of the coal used for electricity generation.
Petroleum consumption is projected to grow at anaverage rate of 1.1 percent a year. More than two-thirds of the petroleum is used for transportation.Increases in light-duty vehicle miles traveled morethan offset the increases in vehicle efficiencythroughout the projection period. Trends in vehicleefficiency and alternative-fuel vehicle sales are dis-cussed on pages 21-25. Sustained economic growthalso leads to continued increases in the use of petro-leum for freight travel and shipping.
Renewable fuel use, including hydropower, increasesat an average annual rate of 1.0 percent. About 60percent of renewable fuels are used for electricitygeneration and the remainder for dispersed heatingand cooling, industrial uses, and blending into ve-hicle fuels. Hydropower, the main renewable sourceused for generation, declines slightly, because regu-latory actions limit capacity at existing sites and nolarge new sites are available for development.
Electricity consumption is projected to grow by 1.5percent a year through 2015. Efficiency gains in theuse of electricity partially offset the continued trendof electrification and the penetration of new elec-tricity-using equipment, resulting in a growth ratethat is slower than the average 1.9-percent annualgrowth in gross domestic product (GDP).
Electricity Generation
Electricity generation from both natural gas andcoal is projected to increase significantly through2015 to meet increased demand for electricity andoffset the decline in generation from nuclear power(Figure 5). Many nuclear plants will near the end oftheir 40-year operating licenses by the end of theforecast horizon. Of the approximately 100 gigawattsof nuclear capacity available in 1996, 38 gigawattsare assumed to be retired by 2015—primarily duringthe last 10 years of the forecast.
Because of the low cost of natural gas and becausecapital requirements for gas-fired capacity are lowerthan those for coal-fired capacity, natural gas nearlytriples its share of electricity generation over theforecast period, from 10 percent to 29 percent. Coal-
1975 1985 1995 2005 20150
500
1,000
1,500
2,000
2,500
3,000
3,500
Coal
Natural gas
Renewables
Nuclear
Petroleum
1970 2015
Electricity demand
1,392
4,044
Figure 5. Electricity generation by fuel, 1970-2015(billion kilowatthours)
fired generation increases in the AEO97 forecast butis slightly lower in 2015 than was projected inAEO96. Competitive pressures are assumed to leadto earlier retirements of some less efficient coal-firedplants, which are replaced mainly by gas-firedplants. Despite lower oil prices, total generatingcosts do not favor petroleum for generation.
With fossil fuel prices lower in the AEO97 projec-tions, most renewable energy sources penetrate moreslowly in the generation market than they did in theAEO96 forecast. Except for hydropower, which de-clines slightly, the use of all other renewable sourcesincreases between 1995 and 2015.
One new nuclear unit, Watts Bar 1, was completedin 1996, but no others are projected over the forecasthorizon, and 38 percent of the total 1996 nuclearcapacity is assumed to be retired by 2015. Nucleargeneration rises slightly through 1999 with im-proved performance of existing plants, then declinesto only two-thirds of the 1995 level in 2015 as olderplants are retired.
Energy Efficiency
Energy intensity, measured as energy use per dollarof GDP, has generally declined since 1970, particu-larly during periods of rapid increases in energyprices (Figure 6). In the 1970s and early 1980s,energy intensity declined at an average rate of near-ly 2 percent a year as the economy shifted to lessenergy-intensive industries and increasingly efficienttechnologies. In the late 1980s and into the projec-tion period, moderate price increases and the growthof more energy-intensive industries lead to a slowerprojected decline—a yearly average of 0.9 percent—from 1995 to 2015.
4 Energy Information Administration/ Annual Energy Outlook 1997

Overview
1975 1985 1995 2005 20150.0
0.2
0.4
0.6
0.8
1.0
1.2Energyuse percapita
Energyuse perdollarof GDP
History Projections
Figure 6. Energy use per capita and per dollar ofgross domestic product, 1970-2015 (index, 1970 = 1)
Energy use per person, which also declined from1970 through the mid-1980s, rose in the mid-1980sas energy prices dropped. Per capita energy use isexpected to remain nearly stable through 2015 andbelow the high in the early 1970s, as efficiency gainsoffset higher demand for energy services.
AEO97 incorporates the efficiency standards for newenergy-using equipment in buildings and for motorsmandated through 1994 by the National ApplianceEnergy Conservation Act of 1987 and the EnergyPolicy Act of 1992. Additional improvements in theefficiency of energy-using technologies beyond thestandards are likely. Several alternative cases inAEO97 examine the impact of the penetration ofmore energy-efficient technologies in the end-usesectors beyond that projected in the reference case.
Carbon Emissions
Carbon emissions from energy use are projected toincrease by 1.2 percent a year through 2015, reach-ing 1,799 million metric tons (Figure 7), comparedwith the AEO96 projection of 1,735 million metrictons. The higher emissions projections are the resultof higher total energy consumption and lower pene-tration of renewable energy sources.
Higher projected economic growth in AEO97 andlower use of renewables contribute to higher carbonemissions in the industrial sector. Emissions arealso higher in the transportation sector, as strongereconomic growth and lower fuel prices boost person-al and freight travel and fuel consumption. Emis-sions in the residential and commercial sectors areonly slightly higher.
19901990 20002000 20102010 2015201500
500
1,000
1,500
2,000 IndustrialCommercial
Residential
Transportation
Natural gas
Coal
Petroleum
1990 2000 2010 2015
}}}
Figure 7. U.S. carbon emissions by sector and fuel,1990-2015 (million metric tons)
Over the forecast horizon, 40 percent of the increasein emissions results from the transportation sector,where increases in travel are projected for all modes.The industrial sector accounts for 28 percent of theincrease. The sectoral values in Figure 7 includeemissions from the generation of electricity used ineach sector. Although part of the growth in emis-sions from electricity generation results from thereplacement of nuclear power by fossil-fired genera-tion, the increased use of natural gas relative to coalmoderates the growth in emissions.
The Climate Change Action Plan (CCAP) was devel-oped to stabilize greenhouse gas emissions in 2000at 1990 levels. In 1990, carbon emissions from ener-gy use were estimated to be about 1,340 millionmetric tons. AEO97 analyzes the impacts of CCAPprovisions, including Climate Challenge and ClimateWise, which foster voluntary reductions in emissionsby electric utilities and industry. The first report onvoluntary programs, Voluntary Reporting of Green-house Gases 1995, was released in July 1996 [1].That report documents the Climate Wise and Cli-mate Challenge commitments.
Emissions grew more rapidly than expected in theearly 1990s, partly due to lower than expectedgrowth in energy prices, which is projected tocontinue through 2015. That trend, combined withfunding reductions for some CCAP programs, leadsto higher projected emissions than were estimated atthe time CCAP was formulated. The impacts ofadditional efforts that may be undertaken to curtailemissions are not analyzed in these projections.Further discussion of carbon emissions, as well asother emissions, begins on page 72.
Energy Information Administration/ Annual Energy Outlook 1997 5
Overview
Table 1. Summary of results for five cases
Sensitivity Factors 1994 1995
2015
Reference
LowEconomic
Growth
HighEconomic
Growth
LowWorld Oil
Price
HighWorld Oil
Price
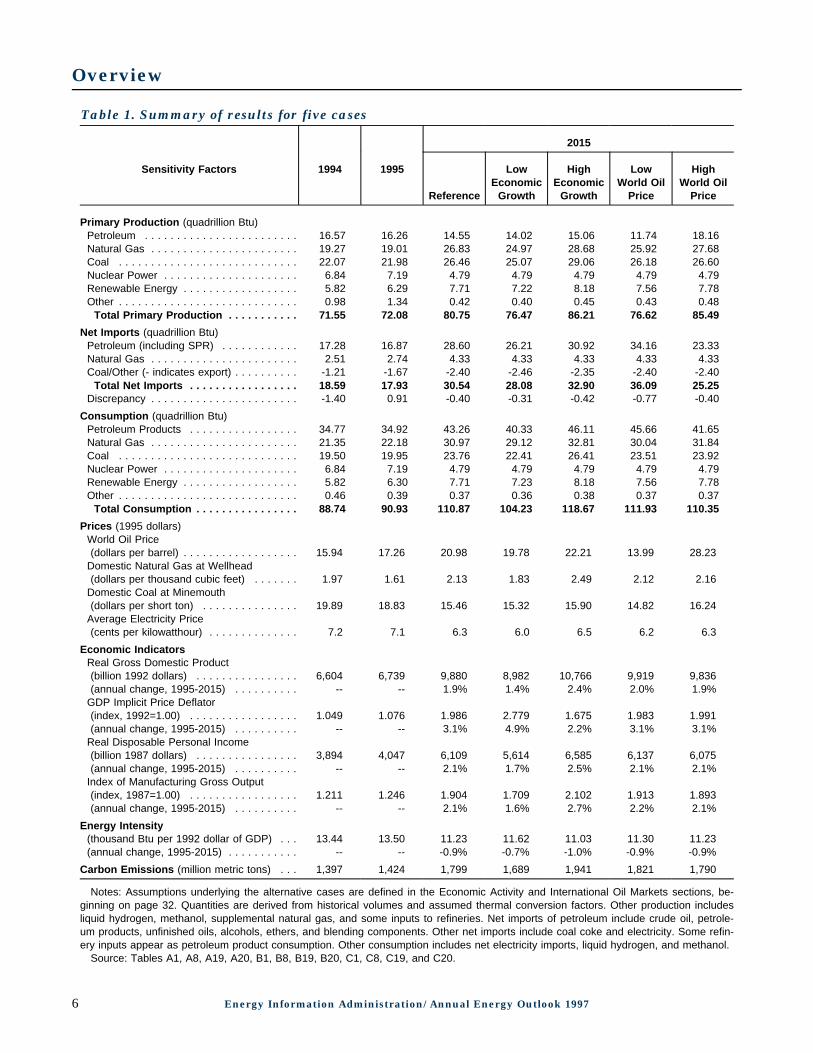
Primary Production (quadrillion Btu)Petroleum . . . . . . . . . . . . . . . . . . . . . . . . 16.57 16.26 14.55 14.02 15.06 11.74 18.16Natural Gas . . . . . . . . . . . . . . . . . . . . . . . 19.27 19.01 26.83 24.97 28.68 25.92 27.68Coal . . . . . . . . . . . . . . . . . . . . . . . . . . . . 22.07 21.98 26.46 25.07 29.06 26.18 26.60Nuclear Power . . . . . . . . . . . . . . . . . . . . . 6.84 7.19 4.79 4.79 4.79 4.79 4.79Renewable Energy . . . . . . . . . . . . . . . . . . 5.82 6.29 7.71 7.22 8.18 7.56 7.78Other . . . . . . . . . . . . . . . . . . . . . . . . . . . . 0.98 1.34 0.42 0.40 0.45 0.43 0.48
Total Primary Production . . . . . . . . . . . 71.55 72.08 80.75 76.47 86.21 76.62 85.49
Net Imports (quadrillion Btu)Petroleum (including SPR) . . . . . . . . . . . . 17.28 16.87 28.60 26.21 30.92 34.16 23.33Natural Gas . . . . . . . . . . . . . . . . . . . . . . . 2.51 2.74 4.33 4.33 4.33 4.33 4.33Coal/Other (- indicates export) . . . . . . . . . . -1.21 -1.67 -2.40 -2.46 -2.35 -2.40 -2.40
Total Net Imports . . . . . . . . . . . . . . . . . 18.59 17.93 30.54 28.08 32.90 36.09 25.25Discrepancy . . . . . . . . . . . . . . . . . . . . . . . -1.40 0.91 -0.40 -0.31 -0.42 -0.77 -0.40
Consumption (quadrillion Btu)Petroleum Products . . . . . . . . . . . . . . . . . 34.77 34.92 43.26 40.33 46.11 45.66 41.65Natural Gas . . . . . . . . . . . . . . . . . . . . . . . 21.35 22.18 30.97 29.12 32.81 30.04 31.84Coal . . . . . . . . . . . . . . . . . . . . . . . . . . . . 19.50 19.95 23.76 22.41 26.41 23.51 23.92Nuclear Power . . . . . . . . . . . . . . . . . . . . . 6.84 7.19 4.79 4.79 4.79 4.79 4.79Renewable Energy . . . . . . . . . . . . . . . . . . 5.82 6.30 7.71 7.23 8.18 7.56 7.78Other . . . . . . . . . . . . . . . . . . . . . . . . . . . . 0.46 0.39 0.37 0.36 0.38 0.37 0.37
Total Consumption . . . . . . . . . . . . . . . . 88.74 90.93 110.87 104.23 118.67 111.93 110.35
Prices (1995 dollars)World Oil Price(dollars per barrel) . . . . . . . . . . . . . . . . . . 15.94 17.26 20.98 19.78 22.21 13.99 28.23
Domestic Natural Gas at Wellhead(dollars per thousand cubic feet) . . . . . . . 1.97 1.61 2.13 1.83 2.49 2.12 2.16
Domestic Coal at Minemouth(dollars per short ton) . . . . . . . . . . . . . . . 19.89 18.83 15.46 15.32 15.90 14.82 16.24
Average Electricity Price(cents per kilowatthour) . . . . . . . . . . . . . . 7.2 7.1 6.3 6.0 6.5 6.2 6.3
Economic IndicatorsReal Gross Domestic Product(billion 1992 dollars) . . . . . . . . . . . . . . . . 6,604 6,739 9,880 8,982 10,766 9,919 9,836(annual change, 1995-2015) . . . . . . . . . . -- -- 1.9% 1.4% 2.4% 2.0% 1.9%
GDP Implicit Price Deflator(index, 1992=1.00) . . . . . . . . . . . . . . . . . 1.049 1.076 1.986 2.779 1.675 1.983 1.991(annual change, 1995-2015) . . . . . . . . . . -- -- 3.1% 4.9% 2.2% 3.1% 3.1%
Real Disposable Personal Income(billion 1987 dollars) . . . . . . . . . . . . . . . . 3,894 4,047 6,109 5,614 6,585 6,137 6,075(annual change, 1995-2015) . . . . . . . . . . -- -- 2.1% 1.7% 2.5% 2.1% 2.1%
Index of Manufacturing Gross Output(index, 1987=1.00) . . . . . . . . . . . . . . . . . 1.211 1.246 1.904 1.709 2.102 1.913 1.893(annual change, 1995-2015) . . . . . . . . . . -- -- 2.1% 1.6% 2.7% 2.2% 2.1%
Energy Intensity(thousand Btu per 1992 dollar of GDP) . . . 13.44 13.50 11.23 11.62 11.03 11.30 11.23(annual change, 1995-2015) . . . . . . . . . . . -- -- -0.9% -0.7% -1.0% -0.9% -0.9%
Carbon Emissions (million metric tons) . . . 1,397 1,424 1,799 1,689 1,941 1,821 1,790
Notes: Assumptions underlying the alternative cases are defined in the Economic Activity and International Oil Markets sections, be-ginning on page 32. Quantities are derived from historical volumes and assumed thermal conversion factors. Other production includesliquid hydrogen, methanol, supplemental natural gas, and some inputs to refineries. Net imports of petroleum include crude oil, petrole-um products, unfinished oils, alcohols, ethers, and blending components. Other net imports include coal coke and electricity. Some refin-ery inputs appear as petroleum product consumption. Other consumption includes net electricity imports, liquid hydrogen, and methanol.
Source: Tables A1, A8, A19, A20, B1, B8, B19, B20, C1, C8, C19, and C20.
6 Energy Information Administration/ Annual Energy Outlook 1997

Legislation andRegulations

Legislation and Regulations
Because EIA analyses are required to remain policy-neutral, the AEO97 projections assume that Federal,State, and local laws and regulations in effect onOctober 1, 1996, remain unchanged through 2015.The impacts of pending or proposed legislation andsections of existing legislation for which funds havenot been appropriated are not reflected in the projec-tions.
Federal legislation incorporated in the projectionsincludes the Omnibus Budget Reconciliation Act of1993, which adds 4.3 cents per gallon [2] to theFederal tax on highway fuels; the Clean Air ActAmendments of 1990 (CAAA90); and the EnergyPolicy Act of 1992 (EPACT). The provisions ofEPACT are focused primarily on reducing energy de-mand, requiring minimum building efficiency stand-ards for Federal buildings and other new buildingsthat receive federally backed mortgages. Efficiencystandards for electric motors, lights, and otherequipment are required, and owners of fleets ofautomobiles and trucks are required to phase invehicles that do not rely on petroleum products.
CAAA90 requires a phased reduction in vehicleemissions of regulated pollutants, to be met pri-marily through the use of reformulated gasoline. Inaddition, under CAAA90, annual emissions of sulfurdioxide by electricity generators are, in general,capped at 8.9 million short tons a year in 2000 andthereafter, although banking of allowances fromearlier years is permitted. CAAA90 also calls for theU.S. Environmental Protection Agency (EPA) toissue standards for the reduction of nitrogen oxide(NOx) emissions, leading to regulations that imposelimits on electricity generators for NOx emissions.The impacts of CAAA90 on electricity generators arediscussed on page 74. NOx emissions regulations arediscussed below.
Climate Change Action Plan
The AEO97 projections include analysis of provisionsof the Climate Change Action Plan (CCAP), 44 ac-tions developed by the Clinton Administration toachieve the stabilization of greenhouse gas emis-sions (carbon dioxide, methane, nitrous oxide, andothers) in the United States at 1990 levels by 2000.Energy combustion is the primary source of anthro-pogenic (human-caused) carbon emissions. AEO97estimates of emissions from fuel combustion do not
include emissions from activities other than fuelcombustion, such as landfills and agriculture, nor dothey take into account sinks that absorb carbon,such as forests. Of the 44 CCAP actions, 13 are notrelated to energy fuels and are not incorporated inthe analysis. The projections do not include addi-tional steps that might be taken in response to therecent call by Timothy Wirth, Under Secretary ofState for Global Affairs, for binding internationalagreements.
Climate Wise and Climate Challenge are two pro-grams cosponsored by EPA and the U.S. Departmentof Energy to foster voluntary reductions in emissionson the part of industry and electricity generators.These programs are new and are only beginning tohave effects, as reported in the EIA publicationVoluntary Reporting of Greenhouse Gases 1995 [3].AEO97 includes analysis of the impacts of bothprograms (see Appendix G).
Recent Actions
Legislation lifting a ban on exports of Alaskan crudeoil was signed on November 28, 1995. With the ex-ception of limited trade agreements, export of NorthSlope crude oil had been banned since 1973. Al-though this legislation passed late in 1995, theimpacts were included in AEO96. With the exportban removed, it is expected that Alaskan crude oilwill be exported to the Pacific Rim—primarily toJapan. It is projected that 100,000 barrels per daywill be shipped in 1997, declining to 70,000 barrelsin 1999. Exports of less than 50,000 barrels per dayare expected to continue through the remainder ofthe forecast.
The Outer Continental Shelf Deep Water RoyaltyRelief Act was also enacted on November 28, 1995.This legislation gives the Secretary of the Interiorauthority to suspend royalty requirements on newoil and gas production from qualifying existingleases—generally, production in most deep areas ofthe Gulf of Mexico that would not be economicalwithout royalty relief. It also requires that royaltypayments be waived on new leases sold in the next5 years for production in most of the deep Gulf.Although a representation of this legislation isincluded for the first time in the analytical frame-work underlying AEO97, the projected impacts oncrude oil and natural gas production are small.
8 Energy Information Administration/ Annual Energy Outlook 1997

Legislation and Regulations
Within the past year, Congressional action was initi-ated to allow leasing of the 1.5-million-acre coastalplain of the Arctic National Wildlife Refuge for oiland gas drilling and to suspend the 4.3-cents-per-gallon tax on highway fuels added in 1993. Neithereffort has resulted in signed legislation. Therefore,these changes are not included in the projections.
Recent actions by the Federal Energy RegulatoryCommission (FERC) foster alternative ratemakingby the natural gas industry and efficient capacityrelease, leading to a more efficient market. FERCalso issued Orders 888 and 889, providing openaccess to interstate transmission lines in electricitymarkets, a major step toward restructuring of theelectricity industry. The impacts of these actions onthe natural gas and electricity industries are dis-cussed below.
Natural Gas Regulatory Actions
The natural gas industry has witnessed major regu-latory and legislative changes during the pastseveral years [4]. Some of the regulatory changeshave allowed market forces to govern rate and serv-ice levels in areas of the industry where traditionalregulatory oversight was previously in effect. Recentregulatory actions have continued to expose moreaspects of the industry to market forces and haveincreased the options for interstate pipeline compa-nies and shippers.
An alternative rate policy paper issued by FERC onJanuary 31, 1996, provided interstate pipeline com-panies with the criteria for approval of applicationsfor rates other than the traditional cost-of-servicerates for transportation service. Options for alter-native rates include market-based rates (customer-driven, based on rates for competing services),negotiated rates (negotiated individually with eachcustomer), and incentive rates (determined by theachievement of target goals, such as improved effi-ciency or improved customer satisfaction relative tosome specific index).
Issuance of the policy statement indicates FERC’srecognition that additional rate design flexibilitymay be needed in the restructured environment. Forinstance, pipeline companies may need rate designflexibility to market, and recover the costs associ-ated with, excess capacity (capacity over and abovethat which is subscribed to by customers). FERC
will evaluate requests for alternative rates on acase-by-case basis.
In addition to its policy statement on alternativeratemaking methods, FERC has established a formalregulatory proceeding in which it will consider aproposal to allow pipeline companies to negotiateservice terms and conditions. Negotiating terms andconditions may allow pipeline companies to tailorservices to meet their customers’ specific needs.
FERC is also providing pipeline companies withflexibility in their access to markets. In an Orderissued on January 31, 1996 [5], FERC clarified thatOrder 636 does not prohibit interstate pipeline com-panies from obtaining capacity on other pipelines[6]. FERC cites at least two benefits of pipelinecompanies holding capacity on other pipelines. First,it would allow the pipeline companies to provideshippers access to new supply and market areas.Second, it would reduce the administrative burdenof shippers having to deal with several pipelinecompanies to secure the flow paths they desire.
On July 31, 1996, FERC issued a Notice of ProposedRulemaking (NOPR) that eliminates the require-ment for competitive bidding and price constraintson released capacity (unused firm capacity that ismade available for resale on the secondary, orcapacity release, market) in some instances. Thenotice also requires pipeline companies to havecomparable procedures for procuring released ca-pacity, interruptible, and short-term service (servicenot held under long-term contract and generally forless than 30 days). In the notice, FERC proposes todiscontinue the current bidding requirements in aneffort to end the uncertainty and delay that someshippers have experienced before they may use thereleased capacity. FERC is also proposing to removethe price cap for released, interruptible, and short-term firm capacity when releasing shippers andpipeline companies can demonstrate that they areunable to exercise market power.
In addition to making these services more compar-able, the removal of the price cap will enable releas-ing shippers and pipeline companies to sell thecapacity at market prices. Shippers releasing capac-ity may also be able to recover more of their firmcapacity costs, making this secondary (resale) mar-ket more attractive.
Energy Information Administration/ Annual Energy Outlook 1997 9

Legislation and Regulations
At the State level, unbundling is also making con-siderable inroads. Unbundled sales and delivery ser-vices for large industrial and electricity generatorcustomers are now commonplace, and State regula-tors are experimenting with various methods toextend choice to small customers. Some regulatorsare making provisions to allow third-party market-ers to aggregate the gas needs of smaller residentialand commercial customers so that these customerscan exercise choice in gas markets. A number ofStates have announced pilot projects in which par-ticipating residential customers may choose theirgas suppliers. All of these changes are driven by thedesire of regulators to give customers access to gasservices that meet individual needs in the best wayand at the least cost.
An unintended impact on consumer prices some-times occurs as the result of taxes during the re-structuring of public utility industries. When finalconsumers purchase gas and transportation servicesfrom parties other than the locally franchised pro-vider, they may avoid paying some or all of theState and local taxes that would have been collectedon a sale had it been made by the traditional pro-vider. This sometimes makes it less expensive topurchase services from third-party, out-of-Statevendors, even when the vendor’s prices before taxesare higher than the traditional provider’s. Manyjurisdictions are now trying to remedy both the com-petitive and the revenue impacts of these taxes byreplacing franchise and public utility sales taxeswith energy importation or consumption taxes.
All of these changes tend to reduce the price of gasto end-use consumers, and projected transmissionand distribution margins (costs the customers payfor transmission and distribution services) decline atan even greater rate than was projected in AEO96(Figure 8). Other factors that have contributed tothe decline in the projected average margin arechanges in the mix of end uses and changes in capi-tal costs. While changes in the mix of end uses aresimilar in both AEO96 and AEO97, a significant re-duction in the cost of capital as a result of projectedlower interest rates is reflected in AEO97. This re-duction contributes to a decline in transmission anddistribution margins over the forecast period, withprojected margins in 2015 almost 20 percent lowerthan those projected in AEO96.
1975 1985 1995 2005 2015 10
1
2
3
4
5
6
Residential
Commercial
WeightedaverageIndustrial
History Projections
Electricitygenerators
Figure 8. Comparison of average natural gastransmission and distribution margins, 1970-2015(1995 dollars)
The greatest decline in margins is seen in the resi-dential and commercial sectors, which consist pre-dominantly of core customers who depend on firmtransportation service. Declines in margins in bothof these sectors are about 30 percent between 1995and 2015. Margins in these two sectors include sig-nificant distribution costs, which are heavily influ-enced by interest rates, inasmuch as approximately40 percent of the distribution costs is assumed to berelated to the cost of capital. Industrial customersand electricity generators generally incur smalldistribution costs because they place a low burdenon the system relative to the large volumes theypurchase, or because they obtain their natural gasdirectly from the pipelines, bypassing the distri-bution segment of the market. Thus, they do not seethe declines that are seen in the other sectors.
Nitrogen Oxide Emissions Regulations
Title IV of CAAA90 requires that EPA establish NOxemission standards for certain coal-fired powerplants. NOx emissions from these power plants con-tribute to acid deposition in lakes and streams,concentrations of ground level ozone, and smog. Thegoal of the program is to reduce NOx emissions byapproximately 2 million tons from what they wouldhave been without the program.
As specified in CAAA90, the EPA has developed atwo-phase program, with the first set of standardstaking force in 1996 and the second set to be imple-mented in 2000 [7] (Table 2). Dry-bottom wall-firedand tangential-fired boilers, the most common boilertypes, referred to as Group 1 boilers, are required tomake significant reductions beginning in 1996 and
10 Energy Information Administration/ Annual Energy Outlook 1997

Legislation and Regulations
further reductions in 2000. Relative to their un-controlled emission rates, which range roughlybetween 0.6 and 1.0 pounds per million Btu, theyare required to make reductions of between 25 and50 percent to meet the Phase I limits.
The remaining boilers, Group 2 boilers, are not
Table 2. NOx emissions standards under theClean Air Act Amendments of 1990(pounds per million Btu)
Boiler typeNumber of
boilersPhase I
limitPhase II
limit
Group 1 boilersDry-bottom wall-fired 284 0.50 0.45Tangential-fired 296 0.45 0.38
Group 2 boilersCell burners 35 NA 0.68Cyclones 88 NA 0.94Wet-bottom wall-fired 38 NA 0.86Vertically fired 29 NA 0.80Fluidized-bed 5 NA 0.29
NA = not applicable.
required to make reductions until 2000. With theexception of fluidized-bed boilers, these boiler typesare not as amenable to control as Group 1 boilers,and as a result their standards are higher. However,the required reductions are still significant, rangingbetween 40 and 50 percent below their uncontrolledlevels.
With these standards, NOx emissions from electrici-ty generators will fall significantly (Figure 9). From1995 to 1996, NOx emissions decline by about 0.5million tons, from 7.2 to 6.7 million tons. With thePhase II standards, the reductions in 2000 are evenlarger, more than triple the reduction in 1996. NOxemissions continue to grow between 2000 and 2015as generators increase their use of fossil fuels to
1995 2000 2005 2010 20150
2
4
6
8
10
Figure 9. Nitrogen oxide emissions, 1994-2015(million tons)
meet the growing demand for electricity. The retire-ment of older nuclear plants also contributes toemissions growth. Emissions increase to 5.9 milliontons in 2015 but remain below the 1995 level. EPAand FERC, with various States, are monitoring NOxemissions and reviewing the need for additionalmitigation programs to bring areas currently unableto meet air quality standards into compliance. Anemissions trading program under considerationmight further lower NOx emissions, but the impactsof the program are not addressed in AEO97, becauseit is under negotiation. The Ozone Transport Assess-ment Group (OTAG), a committee of 37 easternStates, is currently analyzing interstate air qualityissues.
Open Access and Emissions Impacts
On April 24, 1996, FERC issued Orders 888 and889, which are designed to increase competition ininterstate electricity trade. The orders were titled“Promoting Wholesale Competition Through OpenAccess Non-Discriminatory Transmission Services byPublic Utilities; Recovery of Stranded Costs byPublic Utilities and Transmitting Utilities” and“Open Access Same-Time Information System andStandards of Conduct,” respectively.
Order 888 requires that utilities operating interstatetransmission facilities provide purchasers and sell-ers of wholesale power (other utilities, nonutilitypower producers, and power marketers and brokers)open access to the facilities under the same termsand conditions that they provide to themselves. Asa result, transmitting utilities must operate theirfacilities as if they were separate companies, inde-pendent of other operational units (i.e., generationand distribution). Also, the rule permits affectedutilities to seek recovery of “legitimate, prudent andverifiable stranded costs” caused by the implementa-tion of the rule.
Order 889 facilitates open access to interstate trans-mission facilities by requiring utilities owning oroperating such facilities to provide current and po-tential customers with real-time information aboutavailable capacity, prices, and any other terms need-ed to make purchase decisions. Again, they mustprovide the same information to potential customersas they provide to their other operational units.
Energy Information Administration/ Annual Energy Outlook 1997 11

Legislation and Regulations
As stated by FERC, “The Commission’s goal is toremove impediments to competition in the wholesalebulk power marketplace and to bring more efficient,lower cost power to the Nation’s electricity con-sumers.” In the short term, these rules are expectedto provide owners of economical, currently under-utilized power plants with a larger market for theiroutput. In the long term, these rules should providepower project developers with better information onthe economics of their projects by detailing the costsand operational constraints of delivering power topotential customers.
As these rules were being developed, concerns wereraised that the rules might have harmful environ-mental impacts, particularly with respect to NOxemissions, because open access might allow older,dirtier power plants to increase their generation byselling power to neighboring regions. In response tothose concerns, FERC prepared an environmentalimpact statement (EIS) [8], which found that theimplementation of the rules would have only smallimpacts on NOx emissions, generally changes of lessthan 2 percent. The key result was that NOx emis-sions were much more sensitive to relative coal andnatural gas prices than to the open access rule. Infact, they found that, if the ratio of natural gasprices to coal prices remains at its current level,NOx emissions might be slightly lower with openaccess.
EIA found similar results in an independent analy-sis of the rule requested by Senator James M.Jeffords, Vice Chairman of the Senate Subcommitteeon Energy Production and Regulation [9]. EIA foundthat the impact of the open access rule on emissionsis small relative to the change in emissions resultingfrom growth in the demand for electricity. Absentthe new boiler standards, NOx emissions would growsubstantially. The effects of open access depend to alarge extent on the availability of excess generationand transmission capacity, which determine howmuch surplus power exists and how much andwhere the electricity can be delivered. However,changes in excess generating capacity have moreimpact on the results than does transmission capac-ity. Thus, as demand grows, the amount of excesseconomical capacity available for trade declines, andthe impact of open access on emissions becomes verysmall (less than 3 percent).
The key result was that NOx and carbon emissionsare expected to increase through 2015, with orwithout open access, as a result of growth in elec-tricity demand and retirements of nuclear plants. Inmost cases, with Group 1 boiler standards only, NOxemissions will stay below current levels through2010 but exceed 1994 levels by 2015. Group 2 boilerstandards have been issued for comment by EPAand are expected to be implemented in late 1996. Ifthe standards are implemented, NOx emissions arelikely to stay below 1994 levels through 2015.
Gasoline Regulations
AEO97 gasoline projections reflect current legisla-tion, although ongoing environmental debates adduncertainty to the long-term outlook. In 1995, thereformulated gasoline program set forth in CAAA90was finally initiated. As a result, cleaner burningreformulated gasoline (RFG) was sold in many areasof the United States failing to meet the EPA’s ozoneattainment standards, representing around 28 per-cent of total gasoline sales in 1995 [10]. The RFGshare of gasoline sales for 1996 will be higher due tothe enactment of California’s State-wide require-ment for its own version of RFG. The AEO97 marketshare for RFG assumes current levels of participa-tion and remains around 36 percent from 1996through the end of the forecast. Currently debatedproposals to change ozone attainment standards, toallow attainment areas to require RFG, and to de-velop a national RFG requirement could substantial-ly change the reformulated gasoline picture.
As set forth in CAAA90, the requirement to use RFGwould apply to the nine areas with the worst ozonepollution record, classified by EPA as “severe ozonenonattainment areas.” Other, less severe nonattain-ment areas are also allowed to “opt-in” to the pro-gram at the discretion of their governors. Someareas that initially opted-in requested to opt-out ofthe program before its onset. While it is possible forsome areas to opt-out in the future, proposedchanges make it even more likely that other areaswill join the program.
EPA has proposed a new national air standard thatwould result in the classification of new ozonenonattainment areas. A trade group has estimatedthat the proposed standards would result in 119ozone nonattainment areas, compared with 75 areas
12 Energy Information Administration/ Annual Energy Outlook 1997

Legislation and Regulations
under current standards [11]. The proposed stand-ard would clearly increase the number of areas ableto participate in the RFG programs. The impact onRFG demand would depend on which areas were re-quired to use RFG (severe nonattainment areas) andwhich areas opted in.
EPA has also been considering a new provision thatwould allow areas that are in attainment but wishto curb ozone problems to participate in the RFGprogram. The provision would provide more oppor-tunity for renewable fuels to be used in RFG. WhileStates currently can only require nonattainmentareas to use RFG, larger areas—or even entireStates—could potentially join the RFG programunder the new provision. Refiners and marketers arealso concerned about logistical problems created byareas joining and dropping out of the program onshort notice.
The magnitude of the uncertainty surrounding RFGis illustrated by recent discussions of national andregional RFG programs. The idea of a national RFGprogram has been promoted by Senate MinorityLeader Thomas Daschle (South Dakota) as a meansto reduce pollution and petroleum imports [12]. Therequirement for 2.0 percent oxygen in Federal RFGresults in oxygenate blending, which displaces aportion of the petroleum content of gasoline, therebyreducing petroleum imports. During 1996 the Ozone
Transport Assessment Group (OTAG) conductedstudies on initiating a regional RFG program acrossthe 37 member States.
Federal RFG (phase 2) is only one of the formu-lations of gasoline being looked at by OTAG. Othersinclude California-style RFG and a formulation thatis lower in sulfur and olefins than conventional gas-oline [13]. Unlike Federal RFG, the other formula-tions under study do not have a minimum oxygencontent and, therefore, would not require blendingwith oxygenates. If a program requiring a newformulation were pursued, it is unclear what wouldhappen to areas currently using Federal RFG.OTAG plans to provide a proposal for controllingozone pollution to the EPA in 1997. A recommenda-tion for an OTAG gasoline program could set thestage for dramatic changes in the U.S. gasolinesupply around the year 2000.
The impact of additional RFG demand on the gaso-line market would depend on the magnitude and thelocation of the new demand. RFG currently repre-sents about 16 percent of U.S. petroleum consump-tion but could reach more than 40 percent if anational RFG program were enacted. Such a drama-tic change would require long-term planning andinvestment on the part of refiners, pipelines, andmarketers. Consumers would also pay a little extrafor the cleaner gasoline.
Energy Information Administration/ Annual Energy Outlook 1997 13

Issues in Focus

Issues in Focus
Electricity Deregulation
The Route to Competition
The electricity industry in the United States is inthe midst of a dramatic restructuring. Like the tele-communications, trucking, airlines, and natural gasindustries, the electricity infrastructure is beingdriven to a more competitive framework by pres-sures from consumers and legislators. In only twodecades, electricity consumers have seen a trans-formation from an industry structure that offered noreal choices in power purchases to the birth of acompetitive era where debates about the merits ofcompetition are being replaced by debates about howto effect the transition quickly and efficiently.
In hindsight, the route to competition can be seen asthe result of the passage of two pieces of legislation:the Public Utility Regulatory Policies Act of 1978(PURPA) and the Energy Policy Act of 1992(EPACT). Under PURPA, utilities are expected to in-crease energy efficiency and conservation by examin-ing the impacts of conservation policies—such asdemand-side management programs—on their re-source planning. PURPA also requires utilities topurchase electricity from certain “qualifying facili-ties” (QFs) at a price equal to the utility’s avoidedcost (the utility’s estimated cost of new plant con-struction plus forecast fuel consumption, or powerpurchases from other utilities, for example). The Actdefines QFs as renewable generators and cogenera-tors—facilities that meet certain ownership, operat-ing, and efficiency criteria and that produce elec-tricity and another form of useful energy (such assteam or heat) as inputs to an industrial or commer-cial process.
As a result of the QF provision, PURPA initiated amassive increase in the number of nonutility powerproducers. By 1995, QFs were annually generating340 billion kilowatthours of electricity—equivalentto 2 years’ power requirement for the State of NewYork. PURPA demonstrated the practicality of ex-tending the Nation’s power resources beyond theestablished private and public utility paradigm.
Passage of EPACT further extended the scope ofnonutility producers. EPACT establishes a class ofsuppliers called “exempt wholesale generators”(EWGs), which can sell electricity in wholesalemarkets. Unlike QFs, EWGs are not constrained by
efficiency or fuel requirements. Furthermore, unlikePURPA, which barred utilities from controllingownership of QFs, EPACT allows full utility partici-pation in the operation and ownership of EWGs.
More importantly, EPACT mandates that the own-ers of transmission facilities (primarily utilities)provide EWGs access to the grid by “wheeling”power to wholesale customers at cost-based rates.The FERC is required to establish regulations thatwill provide EWGs with open and nondiscriminatorytransmission services from public utilities. After aseries of individual utility wheeling orders underEPACT, FERC determined that uniform open accessto foster competition was needed. This determina-tion resulted in two closely related rules—OrdersNo. 888 and 889—detailing the mechanisms to beused to assure nondiscriminatory open access bywholesale power generators and recovery of the util-ities’ prudently incurred costs.
Utilities have owned and operated the electricitytransmission system for more than 100 years. Theyhave maintained reliability, resolved pricing issuesamong neighboring utilities, and served their nativecustomers through experimentation and voluntarycooperation with other utilities. More importantly,they currently operate in a vertically integratedenvironment, in which transmission, generation, anddistribution costs are “bundled” into a single price.
To ensure open access, Order No. 889 requires func-tional independence between wholesale transmissionoperations and marketing services. Extending openaccess to retail competition could require the com-plete divestiture of transmission assets by theowners of generation and distribution assets, toassure unbiased service. In addition, “strandedcosts” as a result of retail wheeling could besignificantly higher than those arising from similarchanges in wholesale power markets.
Competition in electricity markets also raisesenvironmental issues. Open access to the nationaltransmission grid, giving suppliers the means toship power over vast distances, could affect localemissions from generating plants. Lower electricityprices could lead to more consumption and less con-cern for conservation. Unless specific provisions aremade, the high capital costs and intermittent availa-bility of some renewable technologies could preclude
16 Energy Information Administration/ Annual Energy Outlook 1997

Issues in Focus
them from meaningful competition in new capacitydecisions.
On the consumer side, although competition general-ly leads to lower prices, there are some specificareas of concern for retail customers. For example,if the value of utility properties is diminished, theloss of tax revenues may be felt by local customers.The capability for customers to make price-basedpurchasing decisions might also require new meter-ing technologies to record sales from more than onesupplier, and the customers themselves could bearthe conversion costs.
Even in a deregulated market, it is likely that con-sumers will have varying degrees of freedom tochoose among energy service providers. Large in-dustrial and commercial consumers may well havegreater flexibility than residential consumers. Somecompetitors may be tempted to charge captive cus-tomers (those who have no alternative supplier ofenergy services) higher prices than they charge theirmore elastic customers (those who have greater free-dom to switch to another energy service provider). Ifthey do, the transition costs of restructuring and thefixed costs of electricity production could be borneprimarily by residential and small commercial con-sumers. In their effort to manage the transition tocompetition, some legislators and regulators, such asthose in California, are attempting to protect theinterests of small consumers.
State Initiatives
Currently, most States are attempting to addresssuch concerns. The diversity of proposed solutionsacross the States attests to the complexity of thetransformation. Nevertheless, scrutiny of the pro-posals reveals areas of consensus. First, most Statesagree that utilities should be required to provideservice to their regional customers until the cus-tomers choose service from another provider. Second,most legislators and public utility commissions aremoving toward the creation of independent systemoperators (ISOs) to operate, coordinate, and assurereliability of the local grid. The ISOs are expected todispatch generation on the basis of market prices,dispatching low-cost generators first and basing sub-sequent dispatching on a “merit order” of bid prices.Third, most commissions agree that competitionshould sustain past commitments in the areas of
public and environmental policy, such as use ofrenewable fuels, assistance to low-income house-holds, and conservation. On the other hand, anumber of proposals are vague about how thosecommitments are to be funded in the future. Lastly,while most States agree that some recovery ofstranded costs is desirable, the amounts to berecovered and the methods proposed for recoveryvary widely.
Recovery of stranded costs is the thorniest issuefacing competition-minded public service commis-sions. Estimates of stranded costs are in the rangeof zero to $130 billion and higher. Some sense of themany possible approaches can be acquired by exam-ining the propositions advanced in three States:California, New York, and Maine.
Among the States, California is at the forefront ofrestructuring legislation. The State’s legislature hassupported the California Public Utility Commission’sorder to permit competition and customer choice bypassing legislation to create a new industry struc-ture and provide for recovery of stranded costs. Asa result, California has taken the position that,while all electricity customers are responsible forpast obligations, the interests of residential andsmall commercial customers must be protected. Re-garding stranded costs (called “transition costs” inthe California legislation), accelerated recovery ofpast obligations is accomplished through a “competi-tive transition charge” (CTC).
The CTC is to be charged to all customers, based ontheir electricity consumption as a “non-bypassable”severance fee. (“Non-bypassable” means that thecharge is not transferable.) A rate cap guaranteesthat no customer’s rate will be higher than it was onJune 10, 1996. Small customers (with a maximumpeak demand less than 20 kilowatts) are to receivea rate reduction of at least 10 percent by January 1,1998, with a cumulative 20-percent reduction antici-pated by April 1, 2002. Investor-owned utilities(IOUs) have until December 31, 2001, to completerecovery of most of their stranded costs. Control, butnot ownership, of the transmission assets will beturned over to the ISO.
The New York Public Service Commission (NYPSC)is also proposing to distribute stranded costs acrossall consumers by mandating a non-bypassable “wires
Energy Information Administration/ Annual Energy Outlook 1997 17

Issues in Focus
charge” at the distribution level. The NYPSC doesnot presume full recovery of uneconomical contractsand investments under competition, but instead re-quires utilities under its jurisdiction to submitproposals that apply “creative means . . . to reducethe amount of strandable costs before they are con-sidered for recovery.”
The Commission estimates that about 38 percent ofNew York’s strandable costs are the result of con-tracts by utilities for purchases from independentpower producers (IPPs) at above-market prices.Apparently, the “creative means” directive hints thatNew York’s utilities and IPPs should begin investi-gating the possibility of buying out or renegotiatingthose agreements. The resolution of each proposalwill be accomplished through individual rate case orutility specific proceedings starting in 1996. WhileNew York is stopping short of legislative statutes,the NYPSC is moving to resolve stranded cost issuesas quickly as possible. The Commission has indi-cated that divestiture of generation assets is strong-ly encouraged to alleviate vertical market power andprovide a basis for recovery of stranded costs.
In contrast, the Public Utility Commission of theState of Maine (MPUC) is taking a more moderateapproach to the problem of stranded assets, bydeferring estimates of each utility’s stranded costsuntil the year 2000 and readjusting the estimates in2003 and 2006. Similarly, divestiture of transmis-sion and distribution assets by Maine’s utilities(municipal utilities and rural cooperatives areexempt) is to begin in 2000 and to be completed by2006. The MPUC views stranded costs as a problemwhose magnitude shrinks with the passage of time.Nevertheless, the MPUC recognizes that someamount of stranded costs may persist after 2000. Inthose cases, cost recovery will be accomplishedthrough a surcharge that will be administeredthrough the divested transmission and distributioncompanies and will be comparable with similarcharges that existed before deregulation [14].
Consumer and Supplier Responses
Many other State legislatures and public utilitycommissions are also developing proposals forcompetition, but the final form of a restructuredelectric power industry is still far from apparent.Consequently, the AEO97 reference case does not
address the major components of a restructuredindustry, such as stranded costs and open retailaccess. Ongoing EIA research, to be published in thespring of 1997 [15] provides clues as to the potentialprice impacts of institutional changes and changesin consumer behavior. The value that consumersplace on adequate generating resources, and theirwillingness to pay for reliability of service, will haveimportant implications for the willingness of marketparticipants to build generating plants.
Utilities attempt to design systems and select re-serve margins to balance the marginal costs andmarginal benefits of reserve capacity. The standardmeasure on which systems have been designed is toprovide enough generating capacity so that only oneday of capacity shortage results every 10 years. Theimplementation of this standard means that thecheapest capacity in service—typically, a combustionturbine plant that requires an annual carrying cost(not including the costs of operation) of about $36per kilowatt—is used 8 to 10 hours a year. Accord-ingly, the resulting reduction of 10 hours of unmetdemand (also called “unserved energy”) is worth$3.60 per kilowatthour ($36/10) in mitigated oppor-tunity costs for consumers.
In reality, the value of unserved energy is difficultto compute, because the opportunity costs for con-sumers vary widely. Estimates range from $2 to $25per kilowatthour and are affected by the nature ofconsumption, the timing of service curtailment, thelength of the interruption, and the amount of warn-ing before curtailment begins. For example, a black-out without warning during the dinner hour is muchmore expensive for a restaurant owner than it is formost residential consumers. Hence, a restaurantowner (and commercial consumers in general) wouldbe willing to pay more for reliable electric powerthan would most residential consumers. Further, adisruption is more costly if it lasts for a longerperiod of time and creates costs associated with foodspoilage, prolonged loss of residential heating andcooling, and the like.
In a competitive electric power industry, energyservice companies may have the means to determinethe value of unserved energy. If the real opportunitycost to consumers during a blackout is actuallylower than the assumed value that system plannershave traditionally used, and if consumer prices do
18 Energy Information Administration/ Annual Energy Outlook 1997

Issues in Focus
not support the level of capacity that has been builtunder regulation, then reserve margins will fall.Lower reserve margins could have important impli-cations for system operating costs and electricityprices.
Under cost-of-service regulation, prices can beexpected to increase when new capacity enters intoservice, because new capacity additions generallyqualify for regulated cost recovery. As a result,annual depreciation expense (representing investors’return of capital) and a return on investment (equalto the cost of capital, representing fair compensationto investors) are added into the price calculation. Inthe past, there have been occasions when additionsto prices have been so high (as with expensive nucle-ar plants) that they could have created rate shock,making it necessary to develop and use specialregulatory and financial conventions—such as ratephase-in plans and sales-leaseback transactions—tomitigate the shock.
The price impact of capacity additions under a com-petitive environment may be the opposite of thatunder cost-of-service regulation. That is, prices couldfall when new capacity comes into service in a com-petitive market if the price of electricity is dictatedby supply and demand. A new generating plant, rep-resenting an increase in supply, could put downwardpressure on electricity prices.
Another important aspect of consumer response to acompetitive electricity market is the degree to whichdemand patterns may change. Several actions maybe taken by market participants to stimulatechanges in demand patterns. Some end-use consum-ers may pay time-of-use prices for electricity, whichwould be higher during peak consumption periodsand lower during off-peak periods, providing anincentive for consumers to reduce peak period con-sumption and increase off-peak consumption.
It is possible that most end-use consumers will notsee time-of-use prices but, instead, will purchaseservice contracts that specify a fixed fee per kilo-watthour of consumption, regardless of when theelectricity is used. Still, the incentives that time-of-use prices provide for cutting consumption duringpeak periods may actually be incorporated intoattractively priced service packages offered byaggregators and distributors to consumers who are
willing to have service curtailed briefly during peakusage periods. In effect, this would translate theincentives of time-of-use market prices to the end-use consumer.
If time-of-use rates are used and consumers do re-spond to them, there could be two significant effects:aggregate consumption could rise in response to low-er overall electricity prices; and flatter demands(lower peak period consumption or higher off-peakperiod consumption) could produce higher plantutilization and, as a result, lower capacity require-ments. Reduced demand for electricity during peakperiods (or increased demand during off-peak peri-ods) could increase the efficiency of the electricpower industry and lower the cost of electricity inthe long run. However, there are no compelling re-search results indicating the degree to which con-sumption patterns will actually change. Like themarket value of reserve capacity, the way in whichconsumers respond to price signals and incentivesmust be market tested so that builders of generatingcapacity and providers of energy services can makesound decisions.
Electricity Futures
At 10:30 A.M. on March 29, 1996, the New YorkMercantile Exchange (NYMEX) launched the first-ever electricity futures contracts. By the end of theday, 1,216 wholesale power contracts had beentraded, comparable to the first-day volumes of thecrude oil and natural gas futures markets (1,884and 918 contracts, respectively). This event signaledthe recognition that, in a competitive market, elec-tricity prices could be influenced by highly variablechanges in supply and demand. With prices likely tobecome volatile, a futures market could hedge someof the price risk. Thus, electricity is joining copper,pork bellies, corn, and other products in the intense-ly competitive and highly visible open auctions thatare the hallmarks of today’s commodity markets.
The possibility of an electricity futures market wasanticipated by NYMEX and the Bonneville PowerAdministration (BPA) in 1993. They were quicklyjoined by Pacific Gas and Electric (PG&E), PortlandGeneral, and PacificCorp in committees to supplyinformation about the characteristics of the westernsupply region and to research possible deliverylocations.
Energy Information Administration/ Annual Energy Outlook 1997 19

Issues in Focus
NYMEX is the exchange that specializes in energyfutures contracts, historically launching trading inspecific energy products with the development ofspot or cash markets. NYMEX has developed futuresmarkets in natural gas, crude oil, gasoline, andother energy products on the basis of expectations ofcontinued price volatility in oil products and de-regulation of natural gas markets. Until recently,however, price stability in the regulated electricityindustry has not provided enough volatility for vi-able futures trading. Although the industry is stilltightly regulated, a move toward competition andthe ability of consumers to choose their electricitysuppliers—driven by the spirit of open transmissionaccess—is expected not only to lower average pricesbut also to make them volatile. Volatility, coupledwith the fungibility of electricity and the existinglarge pool of diverse buyers and sellers, is recognizedby commodity traders as the minimum criterion foran active futures market.
About three-fourths of the energy-related contractsintroduced since 1978 have failed. While it isdifficult—if not impossible—to determine the rea-sons for specific failures, in general, lack of liquidity,insufficient volatility, low correlation between fu-tures and cash prices, a nonviable spot market, andlimited effectiveness as a hedging instrument havebeen recognized as contributing factors in the down-fall of new futures markets. A viable electricityfutures market is far from certain; however, the ele-ments needed to maintain active participation maybe discernible in the example of a recent energyfutures market, namely, natural gas.
During the 1980s, natural gas markets were charac-terized by excess supply, low prices, and a legacy ofprior long-term contracts for high-priced gas. Natu-ral gas futures were introduced in 1990 to furnishbuyers and sellers the tools to hedge price risk andto provide an index for determining the price ofdelivered gas. Since then, the number of contractstraded daily has been regularly surpassing contractsin many other futures markets, with daily volumesfrequently in excess of 40,000 contracts.
More importantly, the natural gas futures contractprice is being used as an index of the physical priceof gas in spot market negotiations. In addition, asignificantly higher proportion of participants arehedging or “commercial” traders, as opposed to
speculators. Hedging is the substitution of futuresfor the later purchase or sale of the physical com-modity. Hedgers expect to maintain a position in thephysical market. In contrast, speculators do notattempt to maintain a position in the physicalmarket but “take profits” based on price changesbetween contracts. By significantly adding to thevolumes traded, speculators play an important andnecessary role. Without their participation, liquiditywould be severely diminished. Yet it is the combina-tion of the price discovery mechanisms of gas futuresand high-volume participation by marketers andproducers that has resulted in an active market.
The electricity industry currently shows similaritiesto the natural gas industry of the 1980s: surplussupply (in the form of excess baseload capacity) andhigh-priced, long-term contracts (brought about bythe qualifying facility provision of the Public UtilityRegulatory Policies Act of 1978). And, although elec-tricity prices in many regions of the country cannotbe characterized as low, the use of cost-of-service orrate-of-return pricing by utilities and regulators haskept them stable.
Competition in the electricity industry is expected toresult in lower but more volatile prices. Price vola-tility could accelerate the development of short-termor cash markets for consumers seeking progressivelylower prices. Conversely, suppliers could need amechanism to assure future revenue targets. Elec-tricity futures may provide a mechanism for suppli-ers to control price risk and stabilize revenuestreams.
In addition, the interaction of paper and physicalelectricity could accelerate movement toward the fullpotential for interregional trade. Open trade couldmake apparent the current high ratio of capacity todemand, putting downward pressure on prices. Theimbalance of supply and demand could expose eco-nomic inefficiencies, such as excess reserve margins;however, suppliers and public utility commissionswill need to monitor minimal reserve margin levelsaccurately to ensure reliability. The differencebetween electricity prices and the cost of generation(the “crack”) could decrease as inefficiencies areeliminated. As in the natural gas market, the priceand terms of electricity futures could be used as astandard for prices and contract terms in the physi-cal market.
20 Energy Information Administration/ Annual Energy Outlook 1997

Issues in Focus
Electricity futures prices are based on an index ofelectricity prices for delivery at two locations—thePalo Verde nuclear switchyard in Arizona and theCalifornia-Oregon Border (COB) intertie in thePacific Northwest. The index for each location isvolume-weighted and calculated on the basis oftransactions reported by 15 industry participants.Dow Jones began publishing the COB electricityindex in June 1995. Currently, both indexes arepublished daily as advertising in the Wall StreetJournal.
The COB connects utilities in the Northwest toCalifornia. The intertie consists of three 500-kilovoltlines on the south and three on the north side of theCalifornia border. Transmission capacity is rated at4,800 megawatts north-to-south and 3,675 mega-watts south-to-north. BPA operates the system northof the intertie, and PG&E manages flows to thesouth. Palo Verde is the intertie that connects util-ities in the Southwest to California—with capacityto move 6,100 megawatts east and 2,500 megawattswest. A single contract for both locations consists of736 megawatts of peak power in increments of 2megawatts an hour over 23 business days in eachmonth. Delivery is scheduled beginning at 7:00 amand ending at 10:00 pm, with delivery into Saturdayand Sunday allowed for months with fewer than 23business days.
As this publication goes to press it appears that thecurrent Palo Verde and COB contracts are strug-gling to achieve the degree of liquidity needed tomaintain interest by traders. The first few weeks oftrading found an average of 50 traders daily in thepits. Currently, trading volumes are about half theinitial volumes, with no more than 5 to 7 “warrant”traders (local traders who pay a fee to work newtrading rings) in the pits daily. While a handful ofbrokerage firms are still active, trading is beingdominated by only one or two, with none achievingthe volumes anticipated when the contract began. Itappears that these “noncommercial” or speculativetraders are concentrating on the more profitablenatural gas and crude oil markets and abandoningelectricity futures.
A lack of interest by commercial traders is alsoapparent. A limited number of power marketers areactive, but they are participating at volumes lowerthan when trading began. And although a few
utilities such as BPA, Portland General Electric, andone or two others are maintaining limited positionsin the COB market, utility interest in Palo Verdecontracts is nonexistent. It appears that utilities aremanaging risk by using such traditional tools asover-the-counter sales and block purchases of elec-tricity—transactions that are more liquid than thefutures market and have the added benefit of gen-erally not requiring administrative approval from autility’s board of directors or new accounting pro-cedures to document losses.
It is possible for competitive electricity markets toexist without a futures market. Forward contracts,energy swaps, or hedging with natural gas or oilfutures may be all that is required for risk manage-ment. The transmission and delivery of electricityalso presents technical challenges, requiring a fargreater measure of system control than is requiredfor the distribution of natural gas. In addition,electricity transmission systems are highly frag-mented, with local control tightly concentrated.Transmission networks in the East, West, and Texasare functionally independent. With no mechanismfor delivery to the East, traders there have littleinterest in West Coast indexes.
While experiments in and plans for competition areunderway in many States, deregulation is still in itsinfancy. Most States see 1998 as the earliest pos-sible date for retail wheeling and full consumerchoice. Perhaps, as deregulation progresses, utilitieswill incur higher levels of price and supply risk thancan be covered by traditional tools. If so, they mayturn to the futures market for coverage. Withoutstrong utility support, the prognosis for a viableelectricity futures market is uncertain.
Transportation Issues
The transportation sector’s almost exclusive relianceon oil and its increasing responsibility for higherU.S. carbon emissions has made it a focal point ofrecent policy debates. While consumers generallyappreciate low fuel prices and high rates of economicgrowth, these factors exacerbate problems associatedwith the Nation’s dependence on imported oil. Inrecent years, improvement in vehicle efficiency hasslowed while reliance on mass transit has dimin-ished. Consequently, transportation sector oil con-sumption has increasingly contributed to higher
Energy Information Administration/ Annual Energy Outlook 1997 21

Issues in Focus
demand for oil products and rising emissions ofgreenhouse gases.
Between 1980 and 1985, oil consumption for non-transportation uses declined by 25 percent, oralmost 4 quadrillion Btu (Figure 10), as consumerssubstituted other fuels to escape the high prices ofoil products and concerns about availability. Butwith no economically competitive alternatives avail-able for vehicle fuels, transportation oil consumptionincreased by 0.5 quadrillion Btu over the same peri-od, despite substantial improvements in the fuel effi-ciency of light-duty vehicles (cars, vans, pickuptrucks, and utility vehicles).
1980-1985
1985-1990
1990-1995
1995-2000
2000-2005
2005-2010
2010-2015
0
1
2
3
4
0-1
-2
-3
-4
-5
OtherTransportation
Figure 10. Changes in oil consumptionfor transportation and other uses, 1980-2015(quadrillion Btu)
In the AEO97 forecast, transportation uses of oilcontinue to dominate growth in domestic oil use.About 80 percent of the increase in annual oil con-sumption between 1995 and 2015 is directly attrib-utable to transportation vehicles. In fact, beyond2000, transportation oil use alone roughly equalstotal U.S. oil imports.
Compared with last year’s forecast, AEO97 featureslower energy prices and higher economic growth.Both tend to increase energy consumption, and thetransportation sector is particularly sensitive tothese changes. Of the increase in projected energyconsumption in 2015—2.9 quadrillion Btu higherthan last year’s forecast—transportation uses ac-count for more than two-thirds.
Growth in transportation oil use has been a majorfactor impeding the Nation’s progress toward thepolicy objective of rolling back carbon emissions to1990 levels. Cumulatively, carbon emissions in 2015are expected to be 64 million metric tons higher
than last year’s estimate, with transportation energyuse contributing two-thirds of that increase. Annualcarbon emissions are expected to reach 1,799 millionmetric tons or 34 percent above the 1990 target sta-bilization level, and transportation-related emissionsaccount for 39 percent of the overage (Figure 11).
1990-1995
1995-2000
2000-2005
2005-2010
2010-2015
0
25
50
75
100
125
150TransportationTotal
Figure 11. Changes in carbon emissions, 1990-2015(million metric tons)
Oil consumed in light-duty vehicles is expected tocontinue to account for more than half of total trans-portation oil consumption throughout the forecast,even though population growth slows and an in-creasing proportion of the driving population isbeyond retirement age [16]. Light-duty vehicles areexpected to consume 23 percent more energy in 2015than in 1995, with gasoline accounting for 80 per-cent.
Although highway travel growth slows over the fore-cast, the growth exceeds the minimal gains expectedin stock average “on-the-road” fuel efficiency (Figure12). New car and light truck fuel efficiencies in the
1980 1985 1990 1995 2000 2005 2010 2015 10
5
10
15
20
25
30
35
ProjectionsHistory
New cars
CAFEstandard
Average
Figure 12. Trends in automobile fuel efficiencyin the reference case, 1978-2015 (miles per gallon)
22 Energy Information Administration/ Annual Energy Outlook 1997

Issues in Focus
reference case do not exceed the corporate averagefuel economy (CAFE) standards currently being met[17] until the turn of the century. Average light-dutyvehicle fuel economy is thus expected to be onlyabout 8 percent higher in 2015 than it was in 1995,whereas vehicle miles traveled are projected to bealmost one-third higher. As a consequence, gasolinedemand in 2015 is expected to be more than 1 mil-lion barrels per day above 1995 levels.
The projected growth in vehicle miles traveled—about 1.4 percent annually for the period 1995 to2015—is lower than actual rates of growth over thepast decade. Between 1985 and 1995, vehicle milestraveled in the United States increased by morethan 3 percent a year. Slower growth is anticipatedin the future, principally because of slowing eco-nomic and population growth. If recent historicalrates of growth in vehicle miles traveled were sus-tained over the projection period, gasoline require-ments in 2015 would be 3 million barrels per dayhigher than the AEO97 reference case projection ofabout 9 million barrels per day.
The current and projected slow growth in fuel effi-ciency is a direct byproduct of oil price behavior andrising per capita income. At today’s prices (adjustedfor inflation), annual expenditures for gasoline andoil account for only about 15 percent of annual ve-hicle ownership costs, roughly half their share in1975 [18], and interest in fuel economy on the partof the car-buying population is limited. Oil priceincreases over the next 15 years are expected to berelatively modest. Thus, the projections indicate asimilar relationship between fuel and overall caroperating costs and relatively slow market penetra-tion by more fuel-efficient vehicles.
Just as low oil prices have suppressed the Nation’sappetite for more fuel-efficient vehicles, they havealso reduced market demand for vehicles that burnalternative fuels. From a technological standpoint,alternative-fuel vehicles (AFVs) have been availablefor many years. The conventional internal combus-tion engine, with relatively minor and inexpensivemodifications, can burn ethanol derived from “fuelcrops,” methanol derived from natural gas, or com-pressed natural gas stored in canisters on thevehicle.
Vehicles currently utilizing these fuels can be seenoutside some government buildings and in use by
many energy-related companies; however, most cur-rent demand is driven by government policy, noteconomics. The Energy Policy Act of 1992 mandatedthe introduction of such vehicles. Not many arebeing bought by the general public. While AFVs maynot cost much more than conventional vehicles, theydo not offer much in the way of improved fuel econo-my. Often, technology that improves the fuel econo-my of AFVs is also applicable to the engines thatdrive conventional gasoline-powered vehicles. Thus,the disadvantages of AFVs—range and fuel availa-bility—are likely to continue to impede their com-petitive success.
More advanced AFVs (battery-powered vehicles, fuelcell electric vehicles) may offer significant operatingcost savings in the future, but estimates of purchaseprice, performance characteristics, and consumeracceptance remain uncertain. In the reference caseeven in 2015, AFVs account for less than 10 percentof annual vehicle sales and 6 percent of the totallight-duty stock. More aggressive introduction, how-ever, has the potential to be a major influence ongasoline consumption (Figure 13). If the same mix ofAFVs chosen in the reference case reached roughlyan equal sales share with conventional vehicles by2005 and maintained that share thereafter, almost40 percent of all light-duty vehicles in 2015 couldburn fuels other than gasoline, potentially resultingin a 20-percent reduction in gasoline consumption.
2005 2010 20150
5
10
15
20
25
30
35
40 High AFV caseReference case
Figure 13. Alternative-fuel vehicle sharesof light-duty vehicle stock in two cases (percent)
The reference case outlook projects continued re-liance on conventional vehicles with increasinghorsepower. This forecast is based on analysis ofrecent auto industry sales trends. It is not astatement based on technical absolutes, and it does
Energy Information Administration/ Annual Energy Outlook 1997 23

Issues in Focus
not consider alternative domestic and foreign politi-cal developments that could profoundly alter thepicture. For example, if new car fuel economy im-provements over the forecast were to match theimprovements achieved between 1975 and 1995(roughly 11 miles per gallon), new cars would aver-age 39 miles per gallon by 2015. The average auto-mobile stock efficiency would reach 26 miles pergallon by 2015—10 percent higher than in the refer-ence case (Figure 14). Such efficiency gains could,annually, save more than 2 quadrillion Btu (about1 million barrels of gasoline a day) and reduce car-bon emissions by 50 million metric tons. In thatcontext, almost no increase in gasoline demandwould occur over the next two decades.
1980 1985 1990 1995 2000 2005 2010 2015 10
5
10
15
20
25
30
35
40
ProjectionsHistory
New cars
CAFEstandardAverage
Figure 14. Trends in automobile fuel efficiency inthe high efficiency case, 1978-2015 (miles per gallon)
If new car efficiency rose to 45 miles per gallon andfleet average efficiency increased to 34 miles pergallon by 2015, gasoline consumption would fallbelow current levels by more than 1 million barrelsper day. For those gains to be achieved, however,the costs of fuel-saving technologies would have tofall by 50 percent or more over the projection periodrelative to the reference case. Vehicles that achievethis efficiency level are available for sale today inthe subcompact size class. Also, jointly funded re-search efforts by the auto industry and the FederalGovernment are underway to greatly extend theavailability of high-efficiency vehicles comparable insize and performance characteristics to today’s mid-size cars [19]. The target for achieving the advancesis 2006.
Within a vehicle size class, fuel economy and horse-power compete directly for market share. In recentyears, horsepower has been the winner. Between
1990 and 1995, new car fuel efficiency remainedpractically fixed at 28 miles per gallon. Over thesame period, average new car horsepower increasedby 19 percent. Vehicle horsepower is expected tocontinue to increase in the reference case, althoughat a decreasing rate. By 2015, average new carhorsepower is expected to be more than one-thirdhigher than in 1995. If vehicle horsepower remainedconstant at 1995 levels, however, new car fuel econ-omy could reach nearly 36 miles per gallon by 2015,10 percent higher than in the reference case (Figure15). Such an improvement would cut gasoline de-mand by 4 percent, or 2 percent of total trans-portation oil consumption.
2005 2010 20150
5
10
15
20
25
30
35
40Increase in new car mpgReduction in horsepower
Decrease in gasoline consumption
Figure 15. Changes from the reference case,assuming no increase in new car horsepower(percent)
Vehicle miles traveled for personal transportationare projected to increase by nearly 25 percentbetween 1995 and 2015. One-third of the increaserelates to more drivers being on the road. The bal-ance relates to increased travel intensity for alldrivers. Policy initiatives designed to slow growth intravel intensity include actions to encourage morecar pooling or use of mass transit or, alternatively,the substitution of telecommuting for actual com-muting. Were travel per driver to stabilize atcurrent levels over the forecast horizon, three-fourths of all projected increases in gasoline demandcould be avoided, all else being equal.
As noted, projected gasoline demand does respond toalternative price paths. The low and high world oilprice cases included in this report result in upwardand downward shifts in gasoline prices in the rangeof 12 to 15 percent. In response to higher or lowerprices, consumers shift new car purchases. In thehigh price case, the market penetration of relatively
24 Energy Information Administration/ Annual Energy Outlook 1997

Issues in Focus
more fuel-efficient automobiles increases somewhatas consumers favor smaller cars with less horse-power. In the low price case the converse occurs.Although high prices moderate the growth in de-mand for gasoline, a price rise of 15 percent di-minishes demand by only about 2 percent over theprojection period. New car fuel economy in the highworld oil price case in 2015 is 3 percent higher thanin the reference case (33.5 miles per gallon). In thereference case, gasoline demand in 2015 is projectedto be about 1.3 million barrels per day higher thanit was in 1995. The projected increase in the highprice case, although lower, still reaches 1 millionbarrels per day.
Buildings Sector Issues
The buildings sector encompasses all the energy con-sumed in residential and commercial buildings, aswell as non-building energy use in the commercialsector, such as street lights and other municipaluses. In 1995, the buildings sector, which is heavilydependent on electricity, accounted for 36 percent ofthe total energy consumed—and 35 percent of totalcarbon emissions—in the United States, when elec-tric generation losses are included. For thesereasons, numerous policies have been initiated overthe past decade to increase energy efficiency, there-by reducing energy consumption and carbon emis-sions, in the buildings sector.
The AEO97 reference case includes existing policiesthat have had the effect of reducing the potentialgrowth of energy consumption in the buildings sec-tor. Examples include the minimum efficiency stand-ards set forth in the National Appliance EnergyConservation Act of 1987 (NAECA) and the EnergyPolicy Act of 1992 (EPACT), both of which targetedcertain energy-using equipment in the sector by re-quiring that equipment be manufactured to meet orexceed minimum efficiency levels.
Traditionally, efficiency standards and energy priceshocks have had large impacts on energy use in theUnited States. For the buildings sector, the level ofefficiency for each energy-using appliance purchasedin any given year is in part a function of mandatedefficiency standards and energy prices. All else beingequal, the higher the energy price and the morestringent the efficiency standard, the higher will bethe purchased efficiency level and the lower theenergy consumption and carbon emissions.
In 2015, energy consumption in the buildings sectorin the AEO97 reference case is projected to be 16percent (5.3 quadrillion Btu) higher than in 1995.Given the forecast for a decline in real energy prices(for natural gas and electricity) delivered to resi-dential and commercial customers in the referencecase (Figure 16), projected energy consumption in2015 would likely be lower if it were assumed thatprices remained constant. Figure 16 relates theenergy prices for major fuels in the buildings sectorin 1995 to the prices in 2015 in the reference caseand in a constant price case, in which prices areassumed to remain at 1995 levels.
Natural gas Electricity Distillate0.0
0.2
0.4
0.6
0.8
1.0
1.2
1.4Reference case price1995 price
Figure 16. Buildings sector energy prices,1995 and 2015 (index, 1995 = 1)
For both natural gas and electricity, real prices toconsumers in the buildings sector are projected to bemore than 10 percent lower in 2015 in the referencecase than their respective 1995 levels, while dis-tillate prices are projected to be more than 18 per-cent higher. In the constant price case, therefore,projected distillate consumption in 2015 is higherthan in the reference case, and natural gas andelectricity consumption are lower. In the constantprice case, buildings sector consumers are less likelyto switch from distillate use for heating applicationsto natural gas or electricity. Lower real energyprices discourage investment in energy-saving equip-ment and more efficient building shells, increasingthe demand for energy. If buildings sector energyprices were to remain at 1995 levels, almost 19 per-cent (1 quadrillion Btu) of the projected increase inenergy demand in the reference case would beaverted (Figure 17).
In the constant efficiency case, assuming no effi-ciency gains beyond 1995 levels, projected energy
Energy Information Administration/ Annual Energy Outlook 1997 25

Issues in Focus
19950
10
20
30
40
50
20151995
No price changeReference caseNo utility efficiency gainsNo utility or buildings efficiency gains
Figure 17. Buildings sector energy consumptionin alternative price and efficiency cases(quadrillion Btu)
consumption in 2015 is higher than in the referencecase, which incorporates numerous efficiency gainsin the buildings sector as well as other sectors. Inanalyzing the effect of efficiency gains on totalenergy consumption in the reference case, it isimportant to distinguish efficiency changes withinthe sector from those associated with electricitygeneration. Since direct use of electricity and thelosses associated with its generation and trans-mission account for more than two-thirds of allbuildings sector energy consumption, efficiency gainsin those areas should be considered in the evalua-tion of overall energy savings.
By fixing end-use efficiency and the ratio of elec-tricity-related losses to delivered electricity at theirrespective 1995 levels, the constant efficiency caseprovides an estimate of the total amount of energyprojected to be saved by efficiency gains in the build-ings sector in the reference case. Figure 17 showsthe relative importance of these efficiency changesin terms of energy consumption avoided in 2015.With no change in the efficiency of electricity gen-eration and distribution, an additional 2.9 quadril-lion Btu of energy would be used to provide thebuildings sector the same amount of electricity need-ed in the reference case in 2015. Within the build-ings sector, efficiency gains in the reference casesave an additional 1.9 quadrillion Btu in 2015.
Carbon emissions associated with energy use in thebuildings sector—mostly attributable to electricitygeneration from coal—are also a significant issue.The Climate Change Action Plan (CCAP) containsnumerous programs aimed at increasing energy effi-ciency and, thereby, reducing carbon emissions.
Examples of CCAP measures affecting the buildingssector are the Rebuild America program, sponsoredby the Department of Energy, and the Green Lightsprogram, sponsored by the Environmental ProtectionAgency (EPA). The goal of these programs is topromote energy efficiency and awareness throughnonregulatory means. Another example of a non-regulatory program is EPA’s Energy Star Financingprogram, which allows prospective home buyers tofinance larger mortgages on homes built to certainenergy-saving specifications.
Figure 18 relates 1995 buildings sector carbonemissions to those projected for 2015 in the constantprice and constant efficiency cases. The AEO97 ref-erence case projects an additional 25 percent (122million metric tons) of carbon emissions from thebuildings sector (including generation losses) in2015, relative to emissions in 1995 (494 millionmetric tons). When efficiency is held constant inboth the buildings and electricity generation sectors,emissions increase by 40 percent (198 million metrictons) over 1995 levels. Conversely, when energyprices are held constant, the increase in carbonemissions between 1995 and 2015 is 13 percent (65million metric tons) lower than in the reference case.
19950
100
200
300
400
500
600
700
800
20151995
No price changeReference caseNo utility efficiency gainsNo utility or buildings efficiency gains
Figure 18. Buildings sector carbon emissionsin alternative price and efficiency cases(million metric tons of carbon)
Effects of Oil and Gas Supply Technologyon Natural Gas and Renewables Markets
In order to explore the impacts of slower and morerapid technological progress than that assumed inthe reference case, AEO97 contains technology casesfor each of the energy-consuming and producing
26 Energy Information Administration/ Annual Energy Outlook 1997

Issues in Focus
sectors. The following discussion focuses on the oiland gas technology cases for two reasons. First,there is considerable uncertainty about the futureprice and supply of natural gas, which are heavilyinfluenced by the rate of technological advances inthe industry and by the uncertainty of the Nation’soil and gas resources. Second, the price of naturalgas is likely to have a significant impact on the con-sumption of gas in both the end-use and electricitygeneration sectors, with resulting impacts on com-peting fuels.
Cases with slower or more rapid technological prog-ress in the oil and gas production sector analyze theimpacts on natural gas prices without feedback fromthe consuming sectors, thus presenting the outerrange of the potential impacts. In addition, becauseof the market impacts of natural gas technology,fully integrated cases with demand feedback are alsopresented.
Within oil and natural gas supply markets, tech-nological progress has historically expanded theeconomically recoverable resource base and reducedeffective exploration and development costs. Overthe past decade, the domestic oil and natural gasmarketplace has seen the introduction and deploy-ment of major new technological advances. Exam-ples include the increased use of advancedcomputer-imaging technologies to provide new per-spectives on resources beneath the ground, theadvancement of offshore drilling in the deeperwaters of the Gulf of Mexico, and recovery ofadditional natural gas from reserves below priordepth frontiers or from shallower geologic structuresusing unconventional recovery techniques. Thefuture pace and extent of such technological prog-ress, however, and its potential effects on naturalgas and other energy markets are uncertain.
The AEO97 forecasts reflect key assumptions aboutthe progress of oil and gas supply technologies,including assumed annual improvement rates for on-shore and offshore drilling, lease equipment, andoperating costs; inferred reserves and undiscoveredresources; and finding and success rates. The refer-ence case, high and low world oil price cases, andhigh and low economic growth cases use a single setof assumptions about these rates, derived from ananalysis of historical trends, which are generally
assumed to continue throughout the forecast. How-ever, the historical rates can be estimated only withconsiderable uncertainty, and changes to theseassumptions—reflective of their uncertainty—mayhave a major impact on the forecasts.
In order to test and quantify the sensitivity of theAEO97 projections to changes in assumptions aboutfuture progress in oil and gas supply technologies,two alternative cases were analyzed, based onassumptions of more rapid and slower technologicalprogress. Whereas the reference case assumes thatthe most likely estimate of this historical influencewill continue throughout the forecast period, therapid technology case assumes a higher estimate,and the slow technology case assumes a lower esti-mate. In addition, both of the alternative cases wererun in two modes: with natural gas demand held atreference case levels (no demand feedback), and withmarket-driven demand-side adjustments in the oiland gas supply sector that cause consumption andproduction to deviate from reference case levels(with demand feedback).
The alternative cases do not address the possibleimpacts of making changes to national levels ofinvestment in technological research, development,or deployment from their historical patterns. Forthis reason, the macroeconomic assumptions usedfor the reference case are also used for the twoalternative oil and gas technology cases. Additionalanalysis and description of the alternative assump-tions can be found in the “Market Trends” section ofthis report (pages 62-63) and in Appendix G.
Impacts on Natural Gas Markets
The impact of changes in technological progressassumptions on projected natural gas prices whenproduction is assumed to remain at reference caselevels is shown in Figure 19. Shortly after the year2000, natural gas prices begin to diverge markedlyfrom their reference case values. By 2015, the aver-age wellhead price is $1.37 per thousand cubic feetin the rapid technology case and $3.48 per thousandcubic feet in the slow technology case—35 percentbelow and 63 percent above the reference case priceof $2.13 per thousand cubic feet, respectively.Compared with historical levels, the 2015 wellheadprice in the slow technology case is below the peak
Energy Information Administration/ Annual Energy Outlook 1997 27

Issues in Focus
wellhead price in 1983. In the rapid technology case,the 2015 wellhead price falls within the range ofprices over the past two decades.
1975 1985 1995 2005 20150
1
2
3
4
5
Reference
Slow technology(no demand feedback)
History Projections
Rapid technology(no demand feedback)
Figure 19. Lower 48 natural gas wellhead pricesin two alternative oil and gas technology cases,1970-2015 (1995 dollars per thousand cubic feet)
When market feedbacks are introduced, the project-ed levels of natural gas production change as shownin Figure 20. Production in 2015 is 6.6 percent high-er in the rapid technology case than in the referencecase and 8.5 percent lower in the slow technologycase. The response is greater in the slow technologycase because reference case natural gas prices arealready very competitive. Consequently, the effectof lower prices on consumption, and therefore onproduction, in the rapid technology case is not asgreat as the effect of higher prices in the slow tech-nology case.
1975 1985 1995 2005 201510
15
20
25
30
Reference
Slow technology(with demand feedback)
History Projections
Rapid technology(with demand feedback)
0
Figure 20. Lower 48 natural gas productionin two alternative oil and gas technology cases,1970-2015 (trillion cubic feet per year)
When market feedbacks are introduced, the effectsof the alternative technology assumptions on naturalgas prices are moderated (Figure 21). In the rapidtechnology case, the lower prices made possible bymore rapid technological progress tend to stimulate
additional natural gas consumption. As a result,higher levels of domestic production are projected,imposing upward pressure on natural gas prices,which partially offsets the price reductions thatresult from improved technology. In the rapid tech-nology case, the demand response eliminates 24 per-cent of the change in the wellhead price in 2015relative to the reference case price. In the slowtechnology case, the demand response eliminates 52percent of the change in the wellhead price in 2015.
1995 2000 2005 2010 2015 20180
1
2
3
4
Reference
Slow technology(no demand feedback)
Rapid technology(no demand feedback)
Slow technology (withdemand feedback)
Rapid technology (withdemand feedback)
Figure 21. Lower 48 natural gas wellhead pricesin alternative oil and gas technology cases,1995-2015 (1995 dollars per thousand cubic feet)
In the alternative technology cases with demandfeedback, changes in projected natural gas prices forconsumers in the industrial sector are accompaniedprimarily by changes in the consumption of steamcoal and electricity. In the slow technology case,industrial coal use and electricity use are slightlyhigher than in the reference case in 2015. Similarly,industrial coal demand and electricity demand areslightly lower in the rapid technology case. Thechanges in projected industrial demand for elec-tricity also affect demand for natural gas in theelectricity generation sector, where 80 percent of theincrease in generation requirements from 1995 to2015 in the reference case is projected to be suppliedby gas-fired capacity.
In 2015, projected natural gas consumption for elec-tric power generation varies from 7.0 trillion cubicfeet per year in the slow technology case to 9.4 tril-lion in the rapid technology case. Most of this con-sumption is utilized by capacity built during theforecast period. Cumulative unplanned additions ofcombined-cycle generating capacity (essentially allnatural gas) vary from 96.5 to 143.0 gigawattsacross the cases in 2015.
28 Energy Information Administration/ Annual Energy Outlook 1997
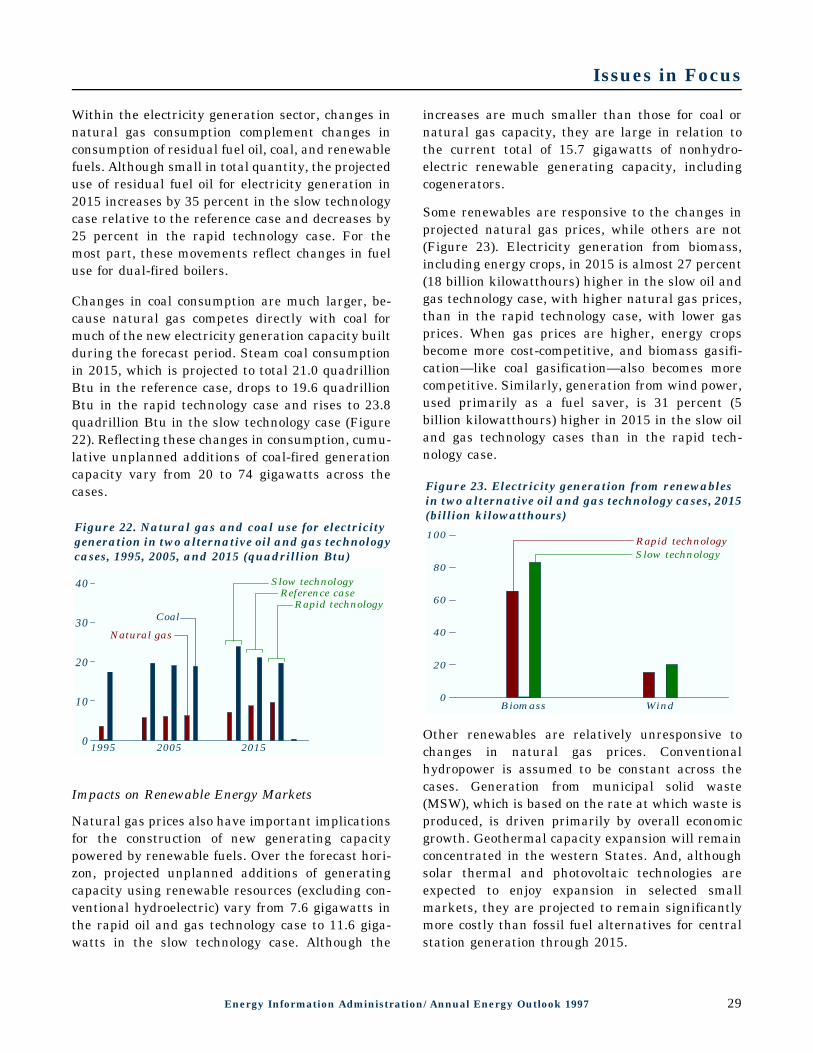
Issues in Focus
Within the electricity generation sector, changes innatural gas consumption complement changes inconsumption of residual fuel oil, coal, and renewablefuels. Although small in total quantity, the projecteduse of residual fuel oil for electricity generation in2015 increases by 35 percent in the slow technologycase relative to the reference case and decreases by25 percent in the rapid technology case. For themost part, these movements reflect changes in fueluse for dual-fired boilers.
Changes in coal consumption are much larger, be-cause natural gas competes directly with coal formuch of the new electricity generation capacity builtduring the forecast period. Steam coal consumptionin 2015, which is projected to total 21.0 quadrillionBtu in the reference case, drops to 19.6 quadrillionBtu in the rapid technology case and rises to 23.8quadrillion Btu in the slow technology case (Figure22). Reflecting these changes in consumption, cumu-lative unplanned additions of coal-fired generationcapacity vary from 20 to 74 gigawatts across thecases.
0
10
20
30
40
Natural gas
Coal
2005
Slow technology
Rapid technologyReference case
1995 2015
Figure 22. Natural gas and coal use for electricitygeneration in two alternative oil and gas technologycases, 1995, 2005, and 2015 (quadrillion Btu)
Impacts on Renewable Energy Markets
Natural gas prices also have important implicationsfor the construction of new generating capacitypowered by renewable fuels. Over the forecast hori-zon, projected unplanned additions of generatingcapacity using renewable resources (excluding con-ventional hydroelectric) vary from 7.6 gigawatts inthe rapid oil and gas technology case to 11.6 giga-watts in the slow technology case. Although the
increases are much smaller than those for coal ornatural gas capacity, they are large in relation tothe current total of 15.7 gigawatts of nonhydro-electric renewable generating capacity, includingcogenerators.
Some renewables are responsive to the changes inprojected natural gas prices, while others are not(Figure 23). Electricity generation from biomass,including energy crops, in 2015 is almost 27 percent(18 billion kilowatthours) higher in the slow oil andgas technology case, with higher natural gas prices,than in the rapid technology case, with lower gasprices. When gas prices are higher, energy cropsbecome more cost-competitive, and biomass gasifi-cation—like coal gasification—also becomes morecompetitive. Similarly, generation from wind power,used primarily as a fuel saver, is 31 percent (5billion kilowatthours) higher in 2015 in the slow oiland gas technology cases than in the rapid tech-nology case.
Biomass Wind0
20
40
60
80
100Rapid technologySlow technology
Figure 23. Electricity generation from renewablesin two alternative oil and gas technology cases, 2015(billion kilowatthours)
Other renewables are relatively unresponsive tochanges in natural gas prices. Conventionalhydropower is assumed to be constant across thecases. Generation from municipal solid waste(MSW), which is based on the rate at which waste isproduced, is driven primarily by overall economicgrowth. Geothermal capacity expansion will remainconcentrated in the western States. And, althoughsolar thermal and photovoltaic technologies areexpected to enjoy expansion in selected smallmarkets, they are projected to remain significantlymore costly than fossil fuel alternatives for centralstation generation through 2015.
Energy Information Administration/ Annual Energy Outlook 1997 29

Market Trends
The projections in AEO97 are not statements ofwhat will happen but of what might happen, giventhe assumptions and methodologies used. The pro-jections are business-as-usual trend forecasts,given known technology and demographic trendsand current laws and regulations, thus providinga policy-neutral reference case that can be used toanalyze policy initiatives. EIA does not propose,advocate, or speculate on future legislative andregulatory changes. All laws are assumed to re-main as currently enacted; however, the impacts ofemerging regulatory changes, when defined, arereflected.
Because energy markets are complex, models aresimplified representations of energy productionand consumption, regulations, and producer andconsumer behavior. The forecasts are highly de-pendent on the data, methodologies, model struc-tures, and assumptions used in their development.
Behavioral characteristics are indicative of real-world tendencies rather than representations ofspecific outcomes.
Energy market projections are subject to muchuncertainty. Many events which shape energymarkets are random and cannot be anticipated,including severe weather, political disruptions,strikes, and technological breakthroughs. Also,assumptions concerning future technology, demo-graphics, and resources cannot be known with anydegree of certainty. Many key uncertainties in theAEO97 projections are addressed through alterna-tive cases.
EIA has endeavored to make these forecasts as ob-jective, reliable, and useful as possible, but theseprojections should serve as an adjunct to, not asubstitute for, the analytical process that should beused to examine policy initiatives.

Trends in Economic Activity
Productivity and Investment LeadProjected Gains in Economic Growth
1995-2000
2000-2005
2005-2010
2010-2015
1995-2015
0.0
0.5
1.0
1.5
2.0
2.5
3.0
ProductivityLabor ForceGDP
Figure 24. Average annual real growth ratesof economic factors, 1995-2015 (percent)
The output of the Nation’s economy, measured bygross domestic product (GDP), is projected to in-crease by 1.9 percent a year between 1995 and 2015(with GDP based on 1992 chain-weighted dollars[20], the revised measure of economic growth by theBureau of Economic Analysis) (Figure 24). In fixed-weight 1987 dollars, GDP grows by 2.2 percent ayear, compared with 2.0 percent in AEO96. The pro-jected rate of growth in GDP slows in the latter halfof the forecast period as the expansion of the laborforce slows, but increases in labor productivitymoderate the effects of lower labor force growth.
The slowing growth in the size of the labor force isa result of slowing population growth after 2000 anda decline after 2005 in the labor force participationrate [21]. Over the forecast period, the labor forceparticipation rate is expected to peak in 2005 andthen decline as “baby boom” cohorts begin to retire.
A key to achieving the 1.9-percent growth rate ismaintaining productivity growth at about 1 percenta year, which results from an increase in the invest-ment share of GDP for the first 12 years of the fore-cast. The robust growth in investment results froma projected decline in the Federal budget deficit,expected to average $76 billion per year between1995 and 2015 (compared with the projected $256billion average in AEO96). Interest rates, both realand nominal, are projected to decline over most ofthe next 20 years, with real long-term interest rates(10-year bond rates) averaging 2.5 percent (com-pared with 3.5 percent in AEO96).
Trade and Service Sectors GrowMore Rapidly Than Manufacturing
GDP
Services
Wholesale
Transportation,
Finance,
Manufacturing
Government
Retail Trade
Construction
Agriculture
Mining
0.0 1.0 2.0 3.0 4.0 5.00.0-1.0-2.0Manufacturing
Electronic EquipmentRubber
Industrial MachineryInstruments
Transportation Equip.Chemicals
PrintingPaper
LumberMisc. Manufacturing
ApparelFurniture
Fabricated MetalsFood
TextilesStone, Clay & Glass
RefiningPrimary Metals
LeatherTobacco
0.0 1.0 2.0 3.0 4.0 5.00.0-1.0-2.0
Wholesale tradeServices
Retail trade
Finance, insurance and real estate
Manufacturing
Construction
Government
Mining
Agriculture
Transportation, communicationand utilities
Gross domestic product
Manufacturing
Electronic equipment
Industrial machineryRubber
Transportation equipment
Furniture
Instruments
PrintingChemicals
Miscellaneous manufacturing
Paper
Stone, clay and glassTextiles
Fabricated metals
Food
Primary metals
Refining
Apparel
Lumber
Tobacco
NonintensiveIntensiveLeather
Figure 25. Sectoral composition of GDP growth,1995-2015 (percent per year)
The projected growth rate for manufacturing produc-tion is 2.1 percent a year, with energy-intensiveindustries growing more slowly than non-energy-intensive industries (1.3 percent and 2.6 percentannual growth, respectively) [22]. The industrialmachinery, electronic equipment, and transportationequipment industries lead the expected growth inmanufacturing (Figure 25). The electronic equipmentindustry is expected to grow twice as fast as manu-facturing industries altogether. Higher growth isprojected for the trade and services sectors than forthe manufacturing sector, as in last year’s forecast.
This year’s industrial forecast uses updated 1987technology estimates and Standard Industrial Code(SIC) definitions. Differences from last year’s indus-trial forecast result from the combination of differentunderlying macroeconomic conditions and differentconfigurations of industry data.
32 Energy Information Administration/ Annual Energy Outlook 1997

Economic Growth Cases
High and Low Economic Growth CasesShow Effects of Different Assumptions
High Reference Low0.0
0.5
1.0
1.5
2.0
2.5
3.0
growth growth
GDP
Labor force
Productivity
Figure 26. Average annual real growth rates ofeconomic factors in three cases, 1995-2015 (percent)
To reflect the uncertainty in forecasts of economicgrowth, AEO97 includes high and low economicgrowth cases in addition to the reference case(Figure 26). The high and low growth cases show theeffects of alternative growth assumptions on energymarkets. All three economic growth cases are basedon macroeconomic forecasts prepared by DRI/McGraw-Hill (DRI) [23]. The DRI forecasts used inAEO97 are the February 1996 trend growth scenarioand the optimistic and pessimistic growth projec-tions. EIA has adjusted DRI’s forecasts to incorpo-rate the world oil price assumptions used in theAEO97 reference case. With this change incorpo-rated, the DRI projections are used as the startingpoint for the macroeconomic forecasts within theNational Energy Modeling System (NEMS) simula-tions for AEO97. The macroeconomic activity modulewithin NEMS incorporates energy price feedbackimpacts on the aggregate economy.
The high economic growth case incorporates highergrowth rates for population, labor force, and laborproductivity. With higher productivity gains, infla-tion and interest rates are lower than in the refer-ence case, and economic output is projected toincrease by 2.4 percent a year. The low economicgrowth case assumes lower growth rates for popula-tion, labor force, and productivity, resulting inhigher prices, higher interest rates, and lowerindustrial output growth. In the low growth case,economic output increases by 1.4 percent a yearfrom 1995 through 2015.
Higher Investment Share Would YieldMore Rapid Economic Growth
1965 1975 1985 1995 2005 2015 10
1
2
3
4
5
Low growth
Reference
History Projections
High growth
Figure 27. Change in annual GDP growth ratefor the preceding 20 years, 1966-2015 (percent)
Figure 27 shows the trend in the moving 20-yearannual growth rate for GDP, including projectionsfor three AEO97 cases. The value for each year iscalculated as the annual growth rate over the pre-ceding 20 years. The pattern for the 20-year averageshows the major long-term trends in GDP growthrates by smoothing the more volatile year-to-yearchanges. The figure highlights two features that areimportant for assessing the uncertainties in futuregrowth. First, the trend is downward. Second, annu-al growth has fluctuated considerably around thetrend. The high and low growth cases are presentedto capture the potential for different paths of long-term output growth in the forecast.
One reason for the variability of the forecasts is thecomposition of the output of the economy, as reflect-ed by the share of GDP devoted to consumption andinvestment. In the reference case, consumption as ashare of GDP remains fairly stable at approximately68 percent, while the share of output devoted to in-vestment is steady at 16 percent. In the high growthcase, a larger share of the output is devoted toinvestment—rising from 16 percent to 17 percent—while the consumption share falls from 68 to 67 per-cent. This shift is small, but it is significant foroverall economic growth. Higher investment rateslead to faster capital accumulation and higher laborproductivity gains, which, coupled with higher popu-lation and labor force growth, yield faster growth inthe aggregate economy than in the reference case.The opposite profile is seen in the low growth case.
Energy Information Administration/ Annual Energy Outlook 1997 33

International Oil Markets
Slow Growth Projected for World OilPrices in the AEO97 Reference Case
1975 1985 1995 2005 20150
10
20
30
40
50
60
70
Reference
Low price
High price
History Projections
38.73
1995 2015
Reference case(nominal dollars)
17.26
Figure 28. World oil prices in three cases, 1970-2015(1995 dollars per barrel)
Just as the historical record shows substantial vari-ability in world oil prices, there is considerableuncertainty about future prices. Three AEO97 caseswith different price paths allow an assessment ofalternative views on the course of future oil prices(Figure 28). For the reference case, prices rise byabout 1.4 percent a year, reaching $21 in constant1995 dollars in 2015. In nominal dollars, the refer-ence case price reaches $39 in 2015. In the high andlow price cases, the 2015 price is about $7.00 higherand lower, respectively, than in the reference case(in 1995 dollars).
The reference case price in 2015 is about $5.00 lowerthan the corresponding price projection in AEO96,reflecting increased optimism about the potential forworldwide petroleum supply, even in the face of thesubstantial expected increase in demand. Productionfrom countries outside OPEC is expected to continueto increase slowly, reaching 44.5 million barrels perday shortly after the turn of the century and declin-ing gradually thereafter, but remaining above the1995 level of 41.6 million barrels per day throughoutthe forecast.
Total worldwide demand for oil is expected to reach103 million barrels per day by 2015. Developingcountries in Asia show the largest growth indemand, averaging 5 percent a year. They couldaccount for one-fourth of total oil consumption in2015, putting their consumption on par with NorthAmerica’s and 10 million barrels per day higherthan Western Europe’s.
Projected OPEC Oil Production Is theKey Determinant of World Oil Prices
1975 1985 1995 2005 20150
10
20
30
40
50
60
70
80
Reference
Low price
High price
History Projections
Figure 29. OPEC oil production in three cases,1970-2015 (million barrels per day)
The three price cases are based on alternativeassumptions about oil production levels in OPECnations: higher production in the low price case andlower production in the high price case. With itsvast store of readily accessible oil reserves, OPEC—primarily the Persian Gulf nations—is expected tobe the principal source of marginal supply to meetfuture incremental demand.
By 2000, OPEC supply in the reference case is 33million barrels per day, consistent with announcedplans for OPEC capacity expansion [24]. By 2015,OPEC production is 60 million barrels per day (morethan twice its production in 1995) in the referencecase, 53 million in the high case, and 71 million inthe low case (Figure 29). Worldwide demand for oilvaries across the price cases in response to thedifferent price paths. Total world demand for oilranges from 110.7 million barrels per day in the lowcase to 97.7 in the high case.
This variation reflects uncertainty about the pros-pects for future production from the Persian Gulfregion. The expansion of productive capacity willrequire major capital investments, which could de-pend on the availability and acceptability of foreigninvestments. Political instability could also limitexpansion of production in the region. Iraq isassumed to resume selling some oil to the worldmarket in 1998 and to increase production gradual-ly, reaching 3.4 million barrels per day in 2000.Thereafter, Iraq’s production expands to 7.2 millionbarrels per day in 2015.
34 Energy Information Administration/ Annual Energy Outlook 1997

International Oil Markets
Continued Competition in Oil MarketsExpected from Non-OPEC Producers
1990 1995 2000 2005 2010 2015 10
10
20
30
40
50
60
70Reference
Reference
Optimisticnon-OPECsupply
OPEC
Non-OPEC
Figure 30. OPEC and non-OPEC oil productionin two cases, 1990-2015 (million barrels per day)
The growth and diversity in non-OPEC oil supplyhas played a significant role in the erosion ofOPEC’s market share over the past two decades.Although OPEC producers will certainly benefitfrom the projected growth in oil demand, significantcompetition is expected from non-OPEC suppliers,who have demonstrated surprising resilience even inthe low price environment of this decade. In thereference case, the OPEC market share of worldwideproduction begins to exceed that of non-OPECsuppliers by the year 2007 (Figure 30). Non-OPECproduction peaks in 1997 and 2002 (44.5 millionbarrels per day) and declines only slightly by theend of the forecast period.
While the oil price cases make alternative assump-tions about OPEC supply, it is also possible thatnon-OPEC supply could expand beyond the levelsassumed for the reference case. In an optimistic non-OPEC supply case—in which one-third of the world’sundiscovered oil is assumed to be economical todevelop over the forecast period at reference caseprices—OPEC would not regain the majority marketshare until 2013 [25]. In this case, non-OPECproduction would increase steadily until 2009, tomore than 50.1 million barrels a day. While signifi-cant production increases are anticipated from theworld’s developing countries (especially those ofLatin America and Asia), much of the increase innon-OPEC supply over the next decade is expectedto come from the former Soviet Union, as the out-look for recovery from the economic problems of thepost-Communist era remains optimistic.
Continued Increase Projected forPersian Gulf Share of Oil Exports
1965 1975 1985 1995 2005 20150
20
40
60
80
100
Optimisticnon-OPECsupply
Low oil price
Reference
History Projections
Figure 31. Persian Gulf share of worldwideoil exports, 1965-2015 (percent)
Considering the world market in oil exports, thehistorical peak for Persian Gulf exports (as apercent of world oil exports) occurred in 1974, whenthey made up more than two-thirds of the oil tradedin world markets (Figure 31). The most recent his-torical low for Persian Gulf oil exports came in 1985as a result of more than a decade of high oil prices,which led to significant reductions in worldwidepetroleum consumption. Less than 40 percent of theoil traded in 1985 came from Persian Gulf suppliers.Following the 1985 oil price collapse, the PersianGulf export percentage has been steadily increasing.For the first time in over a decade, Persian Gulfproducers are expected to account for more than 50percent of worldwide trade in 1996.
In the reference case, the Persian Gulf share of totalexports is expected to exceed 60 percent shortly afterthe turn of the century and gradually increase toover 72 percent by the year 2015. In the AEO97 lowoil price case, the Persian Gulf share of worldwidepetroleum exports is expected to exceed 65 percentshortly after the turn of the century and steadilyincrease to over 82 percent by 2015. In the optimis-tic non-OPEC supply case, the Persian Gulf share ofoil exports is not expected to return to its historicalpeak during the forecast period. While all PersianGulf producers are expected to increase their oil pro-duction capacity significantly over the forecast peri-od, both Saudi Arabia and Iraq are expected to morethan double their current production capacity levels.
Energy Information Administration/ Annual Energy Outlook 1997 35

International Oil Markets
OPEC and Persian Gulf Shares ofU.S. Oil Imports Rise in the Forecast
1995 2000 2005 2010 20150
2
4
6
8
10
12
14
16
CaribbeanEuropeNorthAmerica
Far EastOther
Other OPEC
OPECPersian Gulf}
}}}}
}}
Figure 32. U.S. petroleum imports by source,1995-2015 (million barrels per day)
In the reference case, total U.S. oil imports increasefrom 8.8 million barrels per day in 1995 to 14.4 mil-lion in 2015 (Figure 32). Crude oil accounts for mostof the increase before 2000, whereas imports of pe-troleum products make up a larger share after 2000.Product imports increase more rapidly, as U.S. pro-duction stabilizes and U.S. refineries lack the capac-ity to process a larger quantity of imported crude oil.
By 2000, OPEC accounts for more than one-half oftotal projected U.S. petroleum imports. After 2000,the OPEC share increases steadily, to about 57 per-cent in 2015. The Persian Gulf share of U.S. importsfrom OPEC increases from about 41 percent in 1995to more than 50 percent in 2015. Crude oil importsfrom the North Sea increase slightly through 2000,then decline as North Sea production ebbs. Signifi-cant imports of petroleum from Canada and Mexicocontinue, and West Coast refiners are expected toimport crude oil from the Far East to replace themodest volumes of Alaskan crude oil that will beexported.
Imports of light products are expected to almostdouble by 2015, to nearly 1.6 million barrels perday. Most of the projected increase is from refinersin the Caribbean Basin and the Middle East, whererefining capacity is expected to expand significantly.Vigorous growth in demand for lighter petroleumproducts in developing countries means that U.S.refiners are likely to import smaller volumes oflight, low-sulfur crude oils.
Continued Growth in Oil RefiningCapacity Seen for Asia/Pacific Region
North Central Europe Middle Asia Rest of0
5
10
15
20
25
1996
2015
Total
NorthAmerica
Centraland
SouthAmerica
Europe MiddleEast
Asia/Pacific
Rest ofworld
}
}
Figure 33. Worldwide refining capacity by region,1996 and 2015 (million barrels per day)
Worldwide crude oil distillation capacity was 73 mil-lion barrels per day at the beginning of 1996. Tomeet the growth in international oil demand in thereference case, worldwide refining capacity is expect-ed to increase by nearly a third—to almost 97 mil-lion barrels per day—by 2015. Substantial growth indistillation capacity is expected in the Middle East,Central and South America, and the Asia/Pacific re-gion (Figure 33).
The Asia/Pacific region has been the fastest growingrefining center in the 1990s. It could pass WesternEurope as the world’s second largest refining centerby the end of 1996 and, in terms of distillationcapacity, surpass the United States by 2010. Whilenot adding significantly to their distillation capacity,refiners in the United States and Europe havetended to improve product quality and enhance theusefulness of heavier oils through investment indownstream capacity.
Future investments in the refinery operations ofdeveloping countries must include configurationsthat are more advanced than those currently inoperation. Their refineries will be called upon tomeet increased worldwide demand for lighter prod-ucts, to upgrade residual fuel, to supply trans-portation fuels with reduced lead, and to supplyboth distillate and residual fuels with decreasedsulfur levels. An additional burden on new refinerieswill be the need to supply lighter products fromcrude oils whose quality is expected to deteriorateover the forecast period.
36 Energy Information Administration/ Annual Energy Outlook 1997

Energy Demand
Primary Energy Growth Projected ToStabilize Relative to Delivered Energy
1970 1975 1980 1985 1990 1995 2000 2005 2010 20150
25
50
75
100
DeliveredPrimary
Figure 34. Primary and delivered energyconsumption, excluding transportation use,1970-2015 (quadrillion Btu)
Net energy delivered to consumers represents onlya part of total primary energy consumption. Primaryconsumption includes energy losses associated withthe generation, transmission, and distribution ofelectricity, which are allocated to the end-use sectors(residential, commercial, and industrial) in propor-tion to each sector’s share of electricity use [26].
How energy consumption is measured has becomemore important over time as reliance on electricityhas expanded. In 1970 electricity accounted for only12 percent of energy delivered to the end-use sec-tors, excluding transportation. Since then, growth inelectricity use in applications such as space con-ditioning, consumer appliances, telecommunicationequipment, and industrial machinery have resultedin a far greater divergence between total and de-livered energy consumption estimates (Figure 34).This trend is expected to stabilize over the forecasthorizon, as more efficient generating technologiesoffset increased demand for electricity. Projectedprimary energy consumption grows by 0.8 percent ayear, while delivered energy consumption grows by0.9 percent a year, excluding transportation use.
At the end-use sectoral level, tracking of primaryenergy consumption is necessary to link specificpolicies with overall goals. Carbon emissions, forexample, are closely correlated with total energyconsumption. In developing carbon stabilization poli-cies, growth rates for primary energy consumptionmay be a more important consideration than thosefor delivered energy.
Projected Energy Use Grows MoreSlowly Than Gross Domestic Product
1975 1985 1995 2005 20150.0
0.2
0.4
0.6
0.8
1.0
1.2
Energyuse percapita
Energyuse perdollarof GDP
History Projections
Figure 35. Energy use per capita and per dollar ofgross domestic product, 1970-2015 (index, 1970 = 1)
Energy intensity, as measured by primary energyconsumption per dollar of GDP and on a per capitabasis, declined between 1970 and the mid-1980s(Figure 35). While the overall GDP-based energyintensity of the economy is expected to decreasebetween now and 2015, the rate of decline is ex-pected to diminish, as a result of relatively stableprojected energy prices and increased use of elec-tricity-based energy services. As electricity claims agreater share of energy use, projected consumptionper dollar of GDP declines at a slower rate, becauseelectricity use contributes both end-use consumptionand energy losses to total energy consumption. Be-tween 1995 and 2015, GDP is estimated to increaseby 47 percent, compared with a 22-percent increasein primary energy use.
In the AEO97 forecast, the demand for energy ser-vices increases markedly over current levels. Theaverage home in 2015 is expected to be 4 percentlarger and to rely more heavily on electricity-basedtechnologies. Annual highway travel and air travelper capita in 2015 are expected to be 12 and 76 per-cent higher, respectively, than their current levels.Growth in demand for energy services notwithstand-ing, primary energy intensity on a per capita basiswill remain essentially static through 2015, withefficiency improvements in many end-use energyapplications making it possible to provide higherlevels of service without significant increases inenergy use per capita.
Energy Information Administration/ Annual Energy Outlook 1997 37

Energy Demand
Petroleum, Electricity ClaimLargest Shares of Future Energy Use
1975 1985 1995 2005 20150
10
20
30
40
50
Coal
Natural gas
ElectricityPetroleum
History Projections
Figure 36. Energy use by fuel, 1970-2015(quadrillion Btu)
Petroleum products for transportation claim thegreatest share of total energy consumption in theAEO97 forecast (Figure 36). Growth in energy de-mand in the transportation sector, which averaged2.0 percent a year during the 1970s, was moderatedin the 1980s by rising fuel prices and by new Fed-eral vehicle efficiency standards, which led to anunprecedented 2.1-percent annual increase in aver-age vehicle fuel economy. In the AEO97 forecast,fuel economy gains slow as a result of stable fuelprices and the absence of new legislative mandates.A growing vehicle population and increased travelcause demand increases throughout the forecast.
Increased competition and technological advances inelectricity generation and distribution are expectedto reduce the real cost of electricity. Despite low pro-jected prices, however, growth in electricity use isslower than the rapid growth seen in the 1970s.Demand for natural gas grows at about the samerate as overall energy demand, in contrast to therecent trend of more rapid growth in the use of gasas the industry was deregulated. Natural gas re-tains its share of energy consumption, meeting 20.1percent of energy demand requirements in 2015.
Use of renewable energy from marketed sources(e.g., wood, wood wastes, and ethanol) increases by1.4 percent a year. Use of nonmarketed renewableenergy (geothermal and solar thermal) increases byabout 7 percent a year but does not exceed 1 percentof energy consumption for space and water heatingin the residential and commercial sectors.
Energy Use for Transportation GrowsMore Rapidly Than for Other Sectors
1975 1985 1995 2005 20150
10
20
30
40
50 Residential
IndustrialTransportation
Commercial
Figure 37. Energy use by sector, 1975-2015(quadrillion Btu)
Primary energy use in the reference case is projectedto reach 111 quadrillion Btu by 2015, 22 percenthigher than the 1995 level. In the early 1980s, asenergy prices rose, sectoral energy consumptiongrew relatively little (Figure 37). Between 1985 and1995, however, stable energy prices contributed to amarked increase in sectoral energy consumption.
In the forecast, energy demand in the residentialand commercial sectors grows at about the samerate as population. Demand for energy in the trans-portation sector grows more rapidly, driven by esti-mates of increased per capita travel and modest fuelefficiency gains. Assumed efficiency gains in theindustrial sector are projected to cause the demandfor primary energy to grow more slowly than GDP.
To help bracket the uncertainty inherent in anylong-term forecast, alternative assumptions wereused to highlight the sensitivity of the AEO97forecast to different oil price and economic growthpaths. At the consumer level, oil prices primarilyaffect the demand for transportation fuels. Oil usefor transportation in the high world oil price case is3.1 percent lower than in the low world oil pricecase in 2015, as consumer choices favor more fuel-efficient vehicles and a slightly reduced demand fortravel services. Varying economic growth affectsoverall energy demand in each of the end-use sectorsto a greater extent [27]. By 2015, high economicgrowth assumptions result in a 14-percent increasein total annual energy use over its projected level inthe low growth case.
38 Energy Information Administration/ Annual Energy Outlook 1997

Residential Sector Energy Demand
Increased Electricity Use LeadsResidential Energy Consumption
1975 1985 1995 2005 20150
10
20
30
40
50
60
70 ElectricityHistory Projections
DistillateOther
Naturalgas
Figure 38. Residential total energy consumptionby fuel, 1970-2015 (percent of total)
Total residential energy consumption is projected toincrease by 17 percent overall between 1995 and2015. Most (81 percent) of the growth in total energyuse is related to increased use of electricity. Sus-tained growth in housing in the South, where almostall new homes use central air conditioning, is animportant component of the national trend, alongwith increasing penetration of consumer electronics,such as personal computers and home security sys-tems (Figure 38).
While its share declines slightly, natural gas use inthe residential sector is projected to grow by 0.7 per-cent a year through 2015. Natural gas prices declinein the forecast and are relatively low in comparisonwith other fuel prices. Natural gas heat pumps cap-ture an increasing share of the home heating mar-ket, and the number of homes heated by natural gasis expected to increase more than the number ofhomes heated by electricity and oil. Newly construct-ed homes are, on average, larger than the existingstock, with correspondingly greater needs for heat-ing, cooling, and lighting. Under current buildingcodes and appliance standards, however, energy useper square foot is typically lower for new construc-tion than for the existing stock. Further reductionsin residential energy use per square foot could resultfrom additional gains in end-use efficiency and morestringent building codes that would require more in-sulation, better windows, and more efficient buildingdesign.
Energy Use for Small ElectricAppliances Grows Dramatically
Spaceheating
Spacecooling
Waterheating
Refrig-eration
Lighting Allother
0
2
4
6
8
101987
1995
2015
Figure 39. Residential total energy consumptionby end use, 1987, 1995, and 2015 (quadrillion Btu)
Space heating is the most energy-intensive end useservice in the residential sector (Figure 39). Between1987 and 1995, space heating consumption grew by2 percent a year. Further growth should be tem-pered by increases in equipment efficiency and tight-er building codes. Building shell efficiency gains areprojected to cut space heating demand in new homesby more than 20 percent per household in 2015 rela-tive to the demand in 1995.
A variety of appliances are now subject to minimumefficiency standards, including heat pumps, air con-ditioners, furnaces, refrigerators, and water heaters.The current standards for a typical residential re-frigerator limit electricity consumption to 690 kilo-watthours per year. Energy consumption for refrig-eration has declined by 4 percent annually since1987 and is projected to decline at about 2 percenta year through 2015, as older, less efficient refrig-erators are replaced by newer models.
The “all other” category, which includes smallerappliances such as personal computers, dishwashers,clothes washers, and dryers, has grown by 6 percenta year since 1987 (Figure 39) and now accounts for29 percent of total residential energy use. It is pro-jected to account for 39 percent in 2015, as smallelectric appliances continue to penetrate the market.The promotion of voluntary standards, both withinand outside the appliance industry, is expected toforestall even larger increases. Even so, the “allother” category is expected to exceed other compo-nents of residential demand by 2015.
Energy Information Administration/ Annual Energy Outlook 1997 39

Commercial Sector Energy Demand
Stable Overall Energy ConsumptionProjected for the Commercial Sector
1975 1985 1995 2005 20150
20
40
60
80Electricity
Other
Naturalgas
History Projections
Distillate
Figure 40. Commercial nonrenewable total energyconsumption by fuel, 1970-2015 (percent of total)
Projected energy use trends in the commercial sectordepict stable shares for all fuels, with growth inoverall consumption slowing from its pace over thepast two decades (Figure 40). Slow growth in thecommercial sector (0.7 percent a year) is expected fortwo reasons. Commercial floorspace is projected togrow by only 0.9 percent a year between 1995 and2015, compared with an average increase of 1.5 per-cent a year over the past two decades. Additionally,energy consumption per square foot is projected todecline by 0.2 percent a year. Efficiency standards,voluntary government programs aimed at improvingefficiency, and other technology improvements allcontribute to a decline in commercial energy inten-sity.
Electricity demand accounts for nearly three-fourthsof commercial total energy consumption throughoutthe forecast. Expected efficiency gains in electricequipment are offset by continuing penetration ofnew technologies and greater use of office equip-ment. Natural gas accounts for more than 22 per-cent of commercial energy consumption in 1995 andmaintains that share throughout the forecast. Nofurther declines are expected in the share of dis-tillate fuel oil, which has dropped by more than halfsince 1970. With stable prices projected for conven-tional fuels, no appreciable growth in the share ofrenewable energy in the commercial sector is antici-pated.
Growth in Commercial Energy UseIs Slowed by Efficiency Gains
0
1
2
3
4
5
6
Spaceheating
Cooling LightingWaterheating
1995
OfficePCs
Otheroffice
equipment
Misc.gas
Allother
2015
Figure 41. Commercial total energy consumptionby end use, 1995 and 2015 (quadrillion Btu)
Through 2015, commercial lighting remains themost important individual end use in the commer-cial sector. Energy consumption for lighting isprojected to increase by only 0.1 percent a year inthe forecast, as more energy-efficient equipment andmore efficient generating technologies are adopted.Efficiency gains are also expected for space heating,space cooling, and water heating equipment, moder-ating the growth in overall commercial sector energydemand. Increasing building shell efficiency, whichaffects the energy required for space heating andcooling, also contributes to the trend (Figure 41).
The highest growth rates are expected for end usesthat have not yet saturated the commercial market.Energy use for personal computers grows by 1.3 per-cent annually, and consumption for other officeequipment, such as fax machines and copiers, growsby about 1.5 percent a year. Miscellaneous naturalgas consumption for such uses as cooking, districtheating, and electricity generation is expected togrow by 1.2 percent a year. New telecommunicationstechnologies and medical imaging equipment in-crease the demand for electricity in the “all other”end-use category, which also includes ventilation,refrigeration, minor fuel consumption, and suchvaried uses of energy as service station equipmentand vending machines. Growth in the “all other”category is expected to be especially vigorous duringthe first half of the forecast period and to slowsomewhat in later years as emerging technologiesachieve greater market penetration.
40 Energy Information Administration/ Annual Energy Outlook 1997

Commercial Sector Energy Demand
Average Efficiency of CommercialEquipment Is Expected To Increase
1995 2000 2005 2010 20150.0
0.5
1.0
1.5
2.0
2.5
3.0
3.5
Purchaseaverage
Stock
Highestconsidered
Minimumavailable
Figure 42. Efficiencies of commercial electricwater heaters in the reference case, 1995-2015(index, minimum available in 1995 = 1)
Figure 42 shows the impacts of equipment choiceson the average efficiency of commercial electricwater heating equipment during the forecast. Theaverage efficiency for purchased equipment is ex-pected to rise by 84 percent overall, as the marketpenetration of heat pump water heaters increases.The stock average efficiency, which rises more slow-ly as existing equipment is replaced, is 41 percenthigher than the minimum efficiency available in2015.
Cost, performance, and availability are factors thatdifferentiate the technologies considered for selec-tion. The average stock efficiency at the beginning ofthe forecast period is based on the latest informationavailable for equipment currently in use in the com-mercial sector [28].
Technology choices are based on such considerationsas the type of equipment owned previously and theimportance that consumers place on capital costsrelative to future operating and maintenance costs.Consumers concerned primarily with initial expendi-tures choose appliances that are less costly topurchase and, typically, less energy-efficient. Con-sumers more willing to invest for future energysavings may select appliances that are more expen-sive initially but cost less over the life of the equip-ment. Over the forecast the capital costs of moreefficient appliances decline, increasing the penetra-tion of energy-efficient technologies.
Electricity, Natural Gas, and Oil Useby Industry Are All Expected To Rise
1975 1985 1995 2005 20150
2
4
6
8
10
12
14
NaturalgasOil
Coal
Electricity
History Projections
1970 2015
Total consumption
28.640.5
Figure 43. Industrial total energy consumptionby fuel, 1970-2015 (quadrillion Btu per year)
From 1970 to 1986, changes in the regulation ofnatural gas markets and concern about the environ-mental effects of coal led industry to adopt moreelectricity-intensive processes. Electricity’s share ofindustrial total energy consumption increased from23 percent to 35 percent, natural gas fell from 33percent to 25 percent, and coal fell from 16 percentto 10 percent. After 1986, natural gas began to re-cover its share as end-use regulations were liftedand supplies became more certain and less costly.Over the forecast horizon, expectations of plentifulsupplies and stable prices allow natural gas to re-gain additional ground.
Total energy use in the industrial sector—which in-cludes the agriculture, mining, and construction in-dustries in addition to traditional manufacturing—is projected to increase by 0.9 percent a year overthe forecast (Figure 43). Electricity (for large ma-chine drive requirements) and natural gas, given itsease of handling, are the major energy sources forthe industrial sector. Energy use for electricity inthe industrial sector is projected to increase by 20.3percent by 2015, as increased competition in thegeneration market holds down electricity prices.Relatively low prices are also expected for naturalgas, resulting in consumption that is 19.4 percentover its 1995 level by 2015. Industrial petroleumconsumption grows by 19.9 percent over the sameperiod. Coal consumption grows by only 0.3 percenta year, as new steelmaking technologies continue toreduce the demand for metallurgical coal.
Energy Information Administration/ Annual Energy Outlook 1997 41

Industrial Sector Energy Demand
Little Change Projected for theMix of Industrial Energy Uses
1995 2000 2005 2010 20150
5
10
15
20
25
30
35
40
Feedstocks and miscellaneous
Manufacturing heat and power
Nonmanufacturing heat and power
Figure 44. Industrial primary energy consumptionby industry category, 1995-2015(quadrillion Btu per year)
More than two-thirds of all the energy consumed inthe industrial sector is used to provide heat andpower for manufacturing; the remainder is approxi-mately equally distributed among nonmanufacturingheat and power and consumption as feedstocks (rawmaterials) and other miscellaneous uses (Figure 44).
Petroleum refining, chemicals, and pulp and paperare the largest end-use consumers of energy for heatand power in the manufacturing sector. These threeenergy-intensive industries used 7.7 quadrillion Btuin 1995. The major fuels used in petroleum refin-eries are still gas, natural gas, and petroleum coke,while natural gas accounts for more than half of theenergy consumption for heat and power in the chem-ical industry. The pulp and paper industry consumesthe most renewables, in the form of wood and spentliquor.
A major use of energy in the nonmanufacturing in-dustries is for diesel-powered off-road equipment,such as mine excavation equipment, farm tractors,and bulldozers. The construction industry uses as-phalt and road oil for paving and roofing. By 2015,nonmanufacturing output is expected to be 34.3 per-cent higher and energy consumption 28.6 percenthigher than their 1995 levels. Total feedstock use isexpected to increase by 16.7 percent. Liquid petro-leum gas and petrochemicals are the fastest growingfeedstocks, increasing by 18.0 percent and 20.2 per-cent, respectively, between 1995 and 2015. Theseforecasts reflect strong growth in chemical industryoutput.
Structural Changes, Higher EfficiencySlow Growth in Industrial Energy Use
1995 2000 2005 2010 2015 10.75
0.80
0.85
0.90
0.95
1.00
1.05
Efficiency/otherStructural
Total
Figure 45. Manufacturing energy intensityby component, 1995-2015 (index, 1995 = 1)
Changes in manufacturing energy intensity (con-sumption per unit of output) can be separated intotwo effects. One component reflects underlying in-creases in equipment and production efficiencies; theother arises from structural changes in the composi-tion of manufacturing output. Since 1970, the use ofmore energy-efficient technologies, combined withrelatively low growth in the energy-intensive indus-tries, has moderated growth in industrial energyconsumption. Thus, despite higher industrial output,total energy consumption in the sector has been vir-tually unchanged for the past 20 years. These basictrends are expected to continue.
The share of total manufacturing output attributedto the energy-intensive industries falls from 31 per-cent to 25 percent in the forecast. Thus, even if nospecific industry experienced a decline in intensity,aggregate manufacturing intensity would decline.Figure 45 shows projected changes in energy intensi-ty due to structural effects and efficiency effectsseparately [29]. Over the forecast period, totalmanufacturing intensity drops by 21 percent, andthe changing composition of manufacturing outputalone results in approximately a 12-percent drop.Thus, more than half of the change in total energyintensity for the sector is attributable to structuralshifts and the remainder to changes in energy in-tensity associated with increases in equipment andproduction efficiencies.
42 Energy Information Administration/ Annual Energy Outlook 1997

Transportation Sector Energy Demand
One-Third Increase in Energy Usefor Transportation Projected by 2015
0
4
8
12
16
20
Motorgasoline
Diesel fuel Jet fuel Alternativefuels
1975 2015
Total consumption
18.2
32.3
1975 2015
197519952015
Figure 46. Transportation energy consumptionby fuel, 1975, 1995, and 2015 (quadrillion Btu)
By 2015, total energy demand for transportation isexpected to be 32.3 quadrillion Btu, compared with24.4 quadrillion Btu in 1995 (Figure 46). Petroleumproducts dominate energy use in the sector. Motorgasoline use accounts for more than half of trans-portation energy demand, increasing by 0.8 percenta year in the reference case. Alternative fuels areprojected to displace about 570,000 barrels of oilequivalent a day by 2015, in response to current en-vironmental and energy legislation aimed at reduc-ing oil use. Gasoline’s share of demand is sustained,however, by low projected gasoline prices and aslower pace of fuel efficiency gains in conventionallight-duty vehicles (cars, vans, pickup trucks, andutility vehicles) than was achieved during the 1980s.
Assumed economic growth of 1.9 percent a yearthrough 2015 leads to an increase in freight trans-port, with a corresponding increase in diesel use of1.5 percent a year. Economic growth and low pro-jected jet fuel prices yield a 3.7-percent annualincrease in air travel, causing jet fuel use to increaseby 2.3 percent a year.
In the forecast, energy prices directly affect the levelof oil use through travel costs and average vehiclefuel efficiency. Most of the projected price sensitivityis seen as variations in motor gasoline use in light-duty vehicles, because the stock of light-duty vehi-cles turns over more rapidly than the stock for othermodes of travel. In the high oil price case, gasolineuse increases by only 0.7 percent a year, comparedwith 0.9 percent a year in the low oil price case.
Smaller Gains in Fuel EfficiencyAre Expected for Automobiles
1980 1985 1990 1995 2000 2005 2010 20150.0
0.2
0.4
0.6
0.8
1.0
1.2
1.4
Freighttrucks
CarsAir
History Projections
Figure 47. Transportation stock fuel efficiencyby mode, 1980-2015 (index, 1995 = 1)
Average fuel efficiency is expected to improve at aslower rate through 2015 than during the 1980s(Figure 47). Light-duty vehicle efficiency standardsare assumed to stay at current levels; and increasedsales shares are projected for larger, more powerfulvehicles, such as small light trucks (Table 3), due toprojections of low fuel prices and higher disposablepersonal income [30]. The aging of the car-buyingpopulation will likely moderate this trend in thelatter part of the forecast. Consumer demand causesthe average horsepower for small light trucks, oftenused as passenger vehicles, to grow faster (1.2 per-cent a year) through 2015 than that for other classesof light trucks.
Low fuel prices and slow stock turnover limit effi-ciency gains for freight trucks to 0.4 percent a year.Aircraft efficiency grows by 0.9 percent a year, withincreasing sales of new wide-body aircraft.
Table 3. New car and light truck horsepower ratingsand market shares, 1985, 1995, 2005, and 2015
Cars Light trucks
Year Small Medium Large Small Medium Large
1985Horsepower 98 117 136 104 130 149Sales share 0.56 0.29 0.15 0.35 0.46 0.191995Horsepower 136 165 209 166 168 177Sales share 0.59 0.27 0.14 0.48 0.40 0.122005Horsepower 157 203 273 194 191 204Sales share 0.59 0.26 0.15 0.49 0.39 0.122015Horsepower 170 190 249 213 207 221Sales share 0.58 0.26 0.16 0.49 0.39 0.12
Energy Information Administration/ Annual Energy Outlook 1997 43

Transportation Sector Energy Demand
Projected Low Gasoline Prices SlowSales of Alternative-Fuel Vehicles
1995 2000 2005 2010 20150
200
400
600
800
1,000
EPACTLEVPMarket driven
Figure 48. Alternative-fuel vehicle sales bytype of demand, 1995-2015 (thousand vehicles sold)
Sales of alternative-fuel vehicles (AFVs) as a resultof Federal and State legislative mandates are ex-pected to reach about 700,000 units in 2015 (Figure48). AFV acquisitions mandated for fleets under theEnergy Policy Act of 1992 (EPACT), predominantlyfueled by compressed natural gas (CNG) or liquefiedpetroleum gas, represent the earliest legislatedsales. Vehicles that use gaseous fuels continueto capture the largest share of the AFV marketthrough 2015 (Table 4).
Implementation of the Low Emission Vehicle Pro-gram (LEVP) regulations is assumed to begin inNew York in 1998, with California and Massa-chusetts mandates following in 2003. LEVP legis-lated sales are expected to total approximately291,000 units in 2015, boosting electric and electrichybrid vehicles to about 33 percent of AFV sales.With relatively low gasoline prices and the lack ofan infrastructure to support AFVs, mandated saleswill outpace market-driven sales of AFVs until 2005.
Table 4. Market shares of alternative-fuellight-duty vehicles by technology type, 2015(percent)
TechnologyMarketshare Technology
Marketshare
Dedicatedinternal combustion
Flex fuelinternal combustion
Alcohol 8.9 Alcohol 17.4CNG 15.7 CNG 6.1LPG 12.2 LPG 6.4
Electric 14.4 Electric hybrid 18.8Fuel cell 0.0 Gas turbine 0.1
AFV Market Share Could Approach9 Percent of Vehicle Sales by 2015
1995 2000 2005 2010 20150
200
400
600
800
1,000
1,200
1,400
1,600
Alcohol
Electric
Gaseous}}}
Figure 49. Alternative-fuel light-duty vehicle salesby fuel type, 1995-2015 (thousand vehicles sold)
In the reference case, total AFV sales reach approxi-mately 1.6 million units, or 8.9 percent of all vehiclesales, in 2015 (Figure 49). The use of light-dutyAFVs is expected to displace 389,000 barrels of oilper day in 2015, reducing transportation sector car-bon emissions by 5.2 million metric tons. Vehiclesthat use gaseous fuels—already being sold by manu-facturers at prices $1,000 to $1,500 above those forgasoline vehicles—dominate pre-2000 sales. Theirlimited range (about two-thirds that of gasolinevehicles) makes them good candidates for centrallyfueled fleet applications. Because the large fueltanks required to maintain range restrict both trunkand passenger space, the market potential for gas-eous fuel AFVs for private use is limited.
Electric vehicles are currently being developed byseveral automobile manufacturers, but large num-bers of sales are not expected until LEVP mandatesbegin. Sales of dedicated and hybrid electric vehi-cles—more than half (56.2 percent) of which origi-nate from LEVP mandates—are projected to reach517,000 units in 2015.
“Flex fuel” vehicles, which can use any combinationof ethanol, methanol, and gasoline, are expected tomake up 17.4 percent of AFV sales in 2015. Therange, fuel efficiency, and performance of these ve-hicles are similar to those of conventional gasolinevehicles, and their incremental production cost isexpected to be less than $500 by 2015. Unlike AFVsthat use gaseous fuels, “flex-fuel” vehicles would besuitable for applications in all vehicle size classes.
44 Energy Information Administration/ Annual Energy Outlook 1997

Energy Demand in Alternative Technology Cases
Penetration Rates for More EfficientTechnologies Affect Total Energy Use
2000 2005 2010 2015 2000 2005 2010 2015
0
2
4
0
-2
-4
-6
-8
-10
Industrial
Commercial
Residential
Transportation
1997 technology case
High technology case
}}}}
Figure 50. Variation from reference case primaryenergy use by sector in two alternative technologycases (quadrillion Btu)
The rates at which new, more efficient technologieswill be adopted in the marketplace is uncertain.Alternative cases for each sector (described inAppendix G), based on a range of assumptions aboutfuture technological progress and energy intensities,show the effects of the assumptions (Figure 50). Thealternative technology cases assume that existingequipment and building standards will be met [31];however, they do not include feedback effects oneither energy prices or economic growth.
Three alternative cases are examined for the resi-dential and commercial sectors. The 1997 technologycase holds equipment efficiencies at 1997 levels. Thehigh technology case assumes that consumers willchoose the most energy-efficient technologies avail-able each year, regardless of cost. The advancedtechnology cost reduction case permits choices basedon cost, but over time the costs for the most efficienttechnologies decline from their values in the refer-ence case.
Two alternative cases are presented for the indus-trial and transportation sectors. The 1997 technol-ogy case parallels the buildings sector methodology.The high technology case for the industrial sectorassumes a more rapid decline in industrial energyintensity, resulting in a 1.4-percent annual declinein aggregate industrial energy intensity, comparedwith 1.1 percent in the reference case. The rapidtechnology case for the transportation sector in-cludes reduced costs for advanced technologies andimproved fuel efficiencies.
Residential Energy Use Drops If MostEfficient Technologies Are Chosen
1995 2000 2005 2010 2015 1
0
1
2
0
-1
-2
-3
1997 technology
High technology
Advancedtechnologycost reduction
Reference case
Figure 51. Variation from reference case primaryresidential energy use in three alternative cases,1995-2015 (quadrillion Btu)
The AEO97 reference case forecast includes the pro-jected effects of several different policies aimed atincreasing residential end-use efficiency. Examplesinclude minimum efficiency standards and voluntaryenergy savings programs designed to promote ener-gy efficiency through innovations in manufacturing,building, and mortgage financing. In the 1997 tech-nology case, which assumes no further increases inthe efficiency of equipment or building shells beyondthat available in 1997, 5.5 percent more energywould be required in 2015 (Figure 51).
In the high technology case, assuming that the mostenergy-efficient technology considered is alwayschosen regardless of cost, energy use is 11.8 percentlower than the reference case in 2015. Householdprimary energy use in 2015 is 16.4 percent lower inthis case than in the 1997 technology case.
The advanced technology cost reduction case doesnot constrain consumer choices. Instead, costs forthe most energy-efficient technologies are assumedto decline by as much as 35 percent from referencecase costs by 2015, as manufacturers gain experi-ence. The consumer discount rates used to determinethe purchased efficiency of all residential appliancesin the advanced technology cost reduction case donot vary from those used in the reference case; thatis, consumers value efficiency equally across the twocases. Energy savings in this case relative to thereference case reach 4.3 percent in 2015; however,the savings are not as great as those in the hightechnology case.
Energy Information Administration/ Annual Energy Outlook 1997 45

Energy Demand in Alternative Technology Cases
Higher Equipment Costs AccompanyHigher Residential Efficiency Gains
1995 2000 2005 2010 2015 20190
20
40
60
80
100
Incrementalfuel cost savings
Reference casecapital investment
Reference casefuel costs
Incrementalinvestment
Figure 52. Changes in fuel and capital costsfor selected residential appliances in the hightechnology case, 1995-2015 (billion 1991 dollars)
Relative to the reference case, the use of more effi-cient technologies in the high technology case lowersresidential energy expenditures but costs consumersmore in capital investment (Figures 52 and 53). Anincremental investment of $151 billion [32] would berequired to reduce residential energy use by morethan 1 quadrillion Btu in 2015, saving consumers$120 billion in energy expenditures.
Water heating has the greatest potential for energyexpenditure savings relative to investment. The useof condensing natural gas and electric heat pumpwater heaters in place of conventional technologiescan substantially cut the amount of energy neededto provide the same amount of hot water. The poten-tial fuel expenditure savings for other end uses arenot expected to outweigh the additional capital costsfor the most efficient equipment available.
dd
0 25 50 75 100 125
SavingsInvestment
Spaceconditioning
Cooking
Refrigeratorsand freezers
Clothesdrying
Waterheating
Figure 53. Capital investment and energy costsavings for residential appliances in the hightechnology case, 1995-2015 (billion 1991 dollars)
Lower Costs for Efficient TechnologiesCould Yield Some Energy Savings
1995 2000 2005 2010 2015 2019
0.0
0.5
1.0
0.0
-0.5
-1.0
-1.5
-2.0
High technology
Reference case
1997 technology
Advancedtechnologycost reduction
Figure 54. Variation from reference case primarycommercial energy use in three alternative cases,1995-2015 (quadrillion Btu)
The AEO97 reference case incorporates efficiencyimprovements for commercial equipment and build-ing shells, contributing to a decline in commercialenergy intensity of 0.2 percent a year over the fore-cast. The 1997 technology case assumes that futureequipment and building shells will be no more effi-cient than those available in 1997. In comparison,the high technology case assumes that only the mostefficient technologies considered in AEO97 will bechosen, regardless of cost, and that building shellswill improve at a faster rate than in the referencecase. The advanced technology cost reduction caseassumes the same range of available technologies asin the reference case, but costs for the most energy-efficient technologies are assumed to decline overtime more than they do in the reference case.
Energy use in the 1997 technology case is 2.5 per-cent higher than in the reference case by 2015(Figure 54), with commercial primary energy inten-sity declining by 0.1 percent a year. In the hightechnology case there is an additional 9.2-percentenergy savings in 2015, and primary energy inten-sity falls by 0.7 percent a year from 1995 to 2015.Allowing the cost of efficiency advances to decline inthe advanced technology cost reduction case yieldsenergy use that is 1.3 percent lower than energy usein the reference case by 2015. Commercial primaryenergy intensity declines more slowly in this casethan in the high technology case, by 0.3 percent ayear.
46 Energy Information Administration/ Annual Energy Outlook 1997
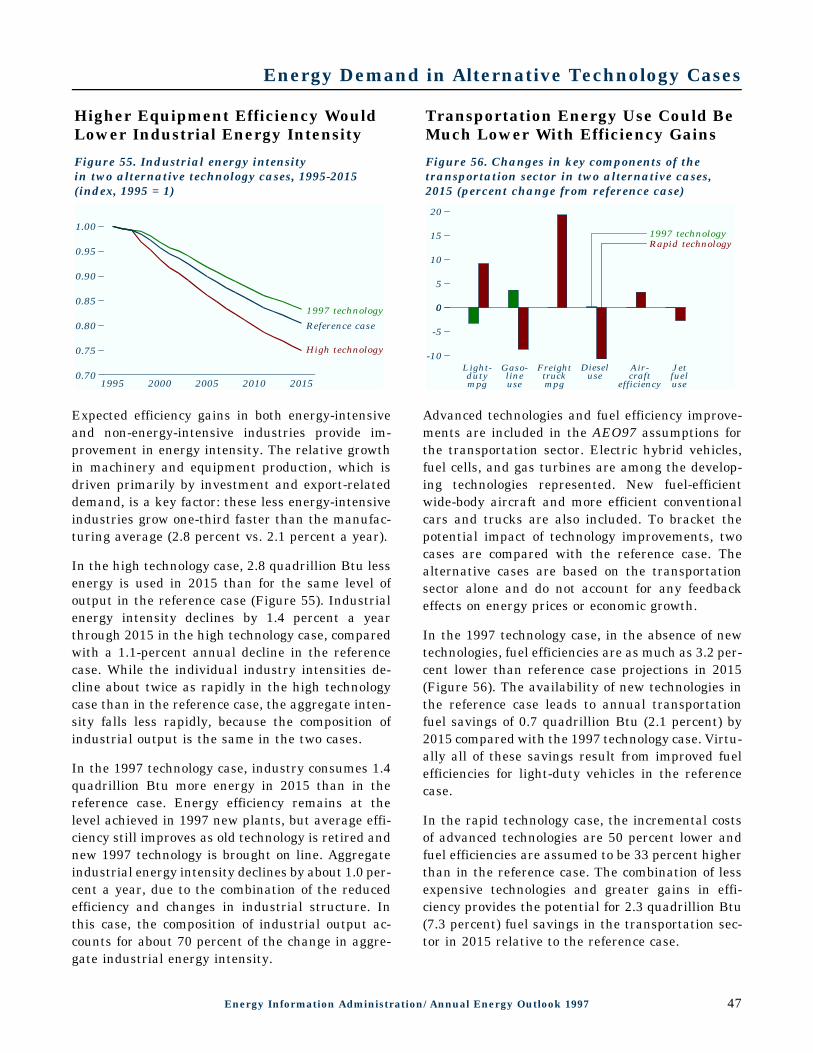
Energy Demand in Alternative Technology Cases
Higher Equipment Efficiency WouldLower Industrial Energy Intensity
1995 2000 2005 2010 2015 20190.70
0.75
0.80
0.85
0.90
0.95
1.00
1997 technology
Reference case
High technology
Figure 55. Industrial energy intensityin two alternative technology cases, 1995-2015(index, 1995 = 1)
Expected efficiency gains in both energy-intensiveand non-energy-intensive industries provide im-provement in energy intensity. The relative growthin machinery and equipment production, which isdriven primarily by investment and export-relateddemand, is a key factor: these less energy-intensiveindustries grow one-third faster than the manufac-turing average (2.8 percent vs. 2.1 percent a year).
In the high technology case, 2.8 quadrillion Btu lessenergy is used in 2015 than for the same level ofoutput in the reference case (Figure 55). Industrialenergy intensity declines by 1.4 percent a yearthrough 2015 in the high technology case, comparedwith a 1.1-percent annual decline in the referencecase. While the individual industry intensities de-cline about twice as rapidly in the high technologycase than in the reference case, the aggregate inten-sity falls less rapidly, because the composition ofindustrial output is the same in the two cases.
In the 1997 technology case, industry consumes 1.4quadrillion Btu more energy in 2015 than in thereference case. Energy efficiency remains at thelevel achieved in 1997 new plants, but average effi-ciency still improves as old technology is retired andnew 1997 technology is brought on line. Aggregateindustrial energy intensity declines by about 1.0 per-cent a year, due to the combination of the reducedefficiency and changes in industrial structure. Inthis case, the composition of industrial output ac-counts for about 70 percent of the change in aggre-gate industrial energy intensity.
Transportation Energy Use Could BeMuch Lower With Efficiency Gains
0
5
10
15
20
0
-5
-10
Rapid technology1997 technology
Light-dutympg
Gaso-lineuse
Freighttruckmpg
Dieseluse
Air-craft
efficiency
Jetfueluse
Figure 56. Changes in key components of thetransportation sector in two alternative cases,2015 (percent change from reference case)
Advanced technologies and fuel efficiency improve-ments are included in the AEO97 assumptions forthe transportation sector. Electric hybrid vehicles,fuel cells, and gas turbines are among the develop-ing technologies represented. New fuel-efficientwide-body aircraft and more efficient conventionalcars and trucks are also included. To bracket thepotential impact of technology improvements, twocases are compared with the reference case. Thealternative cases are based on the transportationsector alone and do not account for any feedbackeffects on energy prices or economic growth.
In the 1997 technology case, in the absence of newtechnologies, fuel efficiencies are as much as 3.2 per-cent lower than reference case projections in 2015(Figure 56). The availability of new technologies inthe reference case leads to annual transportationfuel savings of 0.7 quadrillion Btu (2.1 percent) by2015 compared with the 1997 technology case. Virtu-ally all of these savings result from improved fuelefficiencies for light-duty vehicles in the referencecase.
In the rapid technology case, the incremental costsof advanced technologies are 50 percent lower andfuel efficiencies are assumed to be 33 percent higherthan in the reference case. The combination of lessexpensive technologies and greater gains in effi-ciency provides the potential for 2.3 quadrillion Btu(7.3 percent) fuel savings in the transportation sec-tor in 2015 relative to the reference case.
Energy Information Administration/ Annual Energy Outlook 1997 47

Electricity Sales
Slower Growth Projected forElectricity Demand
1965 1975 1985 1995 2005 2015 10
100
200
300
400
500
600
700 History Projections
Electricitysales
Grossdomesticproduct
Population
Figure 57. Population, gross domestic product,and electricity sales growth, 1960-2015(index, 1960 = 100)
While generators and cogenerators try to adjust tothe evolving structure of the electricity market, theyare also faced with slower growth in demand than inthe past. Historically, the demand for electricity hasbeen related to economic growth. This positive rela-tionship will continue, but the magnitude of theratio is uncertain.
During the 1960s, electricity demand grew by morethan 7 percent a year, nearly twice the rate of eco-nomic growth (Figure 57). In the 1970s and 1980s,however, the ratio of electricity demand growth toeconomic growth declined to 1.5 and 1.0, respective-ly. A continued decline is expected throughout theforecast. Several factors have contributed to thistrend, including increased market saturation of elec-tric appliances; improvements in equipment efficien-cy and utility investments in demand-side manage-ment programs; and legislation establishing morestringent equipment efficiency standards.
Changing consumer markets could mitigate theslowing of electricity demand growth seen in theseprojections. New electric appliances are introducedfrequently. Only a few years ago, no one foresaw thegrowth in home computers, facsimile machines, copi-ers, and security systems, all powered by electricity.If new uses of electricity are more substantial thancurrently expected, they could partially offset futureefficiency gains.
Electricity Sales ProjectedTo Increase in All Sectors
1975 1985 1995 2005 20150
250
500
750
1,000
1,250
1,500
Commercial
ResidentialIndustrial
History Projections
Figure 58. Annual electricity sales by sector,1970-2015 (billion kilowatthours)
With the number of U.S. households projected to riseby 1.1 percent a year between 1995 and 2015, resi-dential demand for electricity grows by 1.6 percentannually (Figure 58). Residential electricity demandchanges as a function of the time of day, week, oryear. During summer, residential demand peaks inthe late afternoon and evening, when householdcooling and lighting needs are highest. This periodi-city increases the peak-to-average load ratio for localutilities, which rely on quick-starting gas turbines orinternal combustion engines to satisfy peak demand.Although many regions currently have surplus base-load capacity, strong growth in the residential sectorwill result in a need for more “peaking” capacity.Between 1995 and 2015, generating capacity fromgas turbines and internal combustion engines isexpected to more than double.
Electricity demand in the commercial and industrialsectors grows by 1.3 and 1.5 percent a year, respec-tively, between 1995 and 2015. Annual commercialfloorspace growth of 0.9 percent and industrial out-put growth of 2.0 percent drive the increase.
In addition to sectoral sales, cogenerators in 1995produced 132 billion kilowatthours for their own usein industrial and commercial processes, such as pe-troleum refining and paper manufacturing. By 2015,these producers are expected to maintain about thesame share of total generation, increasing their own-use generation to 181 billion kilowatthours as de-mand for manufactured products increases.
48 Energy Information Administration/ Annual Energy Outlook 1997

Electricity Generating Capacity
Plant Retirements ExpectedTo Increase New Capacity Needs
1990-1994
1995-2000
2001-2005
2006-2010
2011-2015
0
20
40
60
80
100
120 New capacity
Retirements
Figure 59. New generating capacity andretirements, 1990-2015 (gigawatts)
Despite slower demand growth, 319 gigawatts ofnew generating capacity will be needed by 2015 tomeet growing demand and to replace retiring units.Between 1995 and 2015, 38 gigawatts (38 percent)of current nuclear capacity and 71 gigawatts (16percent) of current fossil-steam capacity are ex-pected to be retired. Of the 83.2 gigawatts of newcapacity needed after 2010 (Figure 59), almost one-third will replace retired nuclear capacity.
The reduction in baseload nuclear capacity has asignificant impact on the electricity outlook after2010. Although 2011 to 2015 represents only 25 per-cent of the projection period, 32 percent of the newcombined-cycle and 42 percent of the new coal ca-pacity projected over the entire forecast are expectedto be brought on line in those 5 years, due to nuclearretirements. Before the advent of natural gas com-bined-cycle plants, fossil-fired baseload capacityadditions were limited primarily to pulverized-coalsteam units. However, efficiencies for combined-cycleunits are approaching 60 percent, as compared with36 percent for coal-steam units, and constructioncosts for combined-cycle units are about one-third ofthose for coal-steam plants.
The AEO97 projections assume that nuclear plantswhose operating and maintenance costs exceed 4.0cents per kilowatthour will be retired before their40-year operating licenses expire. More optimisticassumptions about operating life and costs for nucle-ar units would obviate the need for new fossil-basedcapacity and reduce fossil fuel prices.
Natural Gas Chosen forMost New Capacity Additions
1995-2000
2001-2005
2006-2010
2011-2015
0
20
40
60
80
100 Natural gasCoalRenewables
Figure 60. Electricity generation and cogenerationcapacity additions by fuel type, 1995-2015(gigawatts)
Before building new capacity, utilities are expectedto use other options to meet demand growth—life ex-tension and repowering of existing plants, powerimports from Canada and Mexico, demand-side man-agement, and purchases from cogenerators. Even so,assuming an average plant capacity of 300 mega-watts, a projected 1,063 new plants with a total of319 gigawatts of capacity will be needed by 2015 tomeet growing demand and to offset retirements. Ofthe new capacity, 81 percent is projected to becombined-cycle or combustion turbine technologyfueled by natural gas or both oil and gas (Figure 60).Both technologies are designed primarily to supplypeak and intermediate capacity, but combined-cycletechnology can also be used to meet baseload re-quirements.
In the forecast, utility generators continue to domi-nate capacity ownership, increasing from 703.7 giga-watts in 1995 to 724.4 gigawatts (74.7 percent of thetotal) in 2015. However, cogenerators and other non-utilities significantly increase their share of themarket, accounting for 57.6 percent of new capacityconstruction and 25.3 percent of total capacity by2015. The Public Utility Regulatory Policies Act of1978 (PURPA), which required utilities to purchaseelectricity at “avoided cost” from qualifying non-utilities, spurred investment in alternative energysuppliers and inaugurated the growth of nonutilitycapacity. More recently, the Energy Policy Act of1992 (EPACT) removed constraints (under specificconditions) on utility ownership of significant sharesof nonutility producers.
Energy Information Administration/ Annual Energy Outlook 1997 49
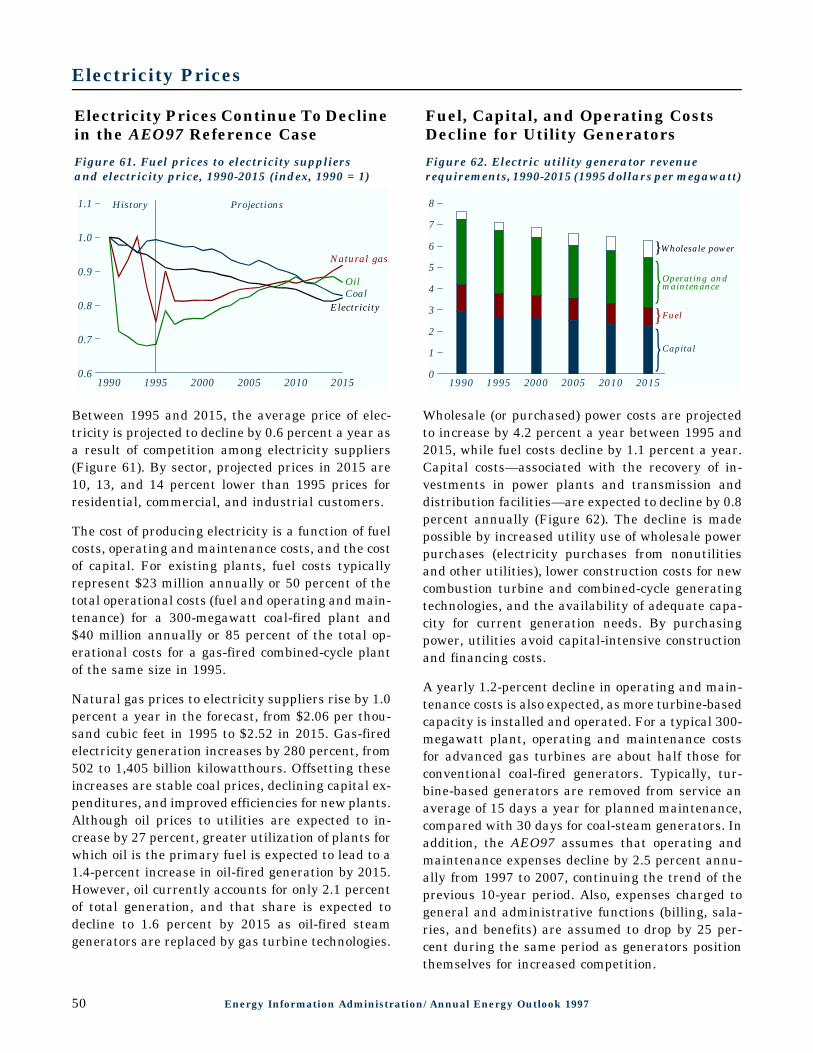
Electricity Prices
Electricity Prices Continue To Declinein the AEO97 Reference Case
1990 1995 2000 2005 2010 20150.6
0.7
0.8
0.9
1.0
1.1
Coal
Natural gas
History Projections
Oil
Electricity
Figure 61. Fuel prices to electricity suppliersand electricity price, 1990-2015 (index, 1990 = 1)
Between 1995 and 2015, the average price of elec-tricity is projected to decline by 0.6 percent a year asa result of competition among electricity suppliers(Figure 61). By sector, projected prices in 2015 are10, 13, and 14 percent lower than 1995 prices forresidential, commercial, and industrial customers.
The cost of producing electricity is a function of fuelcosts, operating and maintenance costs, and the costof capital. For existing plants, fuel costs typicallyrepresent $23 million annually or 50 percent of thetotal operational costs (fuel and operating and main-tenance) for a 300-megawatt coal-fired plant and$40 million annually or 85 percent of the total op-erational costs for a gas-fired combined-cycle plantof the same size in 1995.
Natural gas prices to electricity suppliers rise by 1.0percent a year in the forecast, from $2.06 per thou-sand cubic feet in 1995 to $2.52 in 2015. Gas-firedelectricity generation increases by 280 percent, from502 to 1,405 billion kilowatthours. Offsetting theseincreases are stable coal prices, declining capital ex-penditures, and improved efficiencies for new plants.Although oil prices to utilities are expected to in-crease by 27 percent, greater utilization of plants forwhich oil is the primary fuel is expected to lead to a1.4-percent increase in oil-fired generation by 2015.However, oil currently accounts for only 2.1 percentof total generation, and that share is expected todecline to 1.6 percent by 2015 as oil-fired steamgenerators are replaced by gas turbine technologies.
Fuel, Capital, and Operating CostsDecline for Utility Generators
1990 1995 2000 2005 2010 2015 a0
1
2
3
4
5
6
7
8
Wholesale power
Operating andmaintenance
Capital
Fuel
}
}}}
Figure 62. Electric utility generator revenuerequirements, 1990-2015 (1995 dollars per megawatt)
Wholesale (or purchased) power costs are projectedto increase by 4.2 percent a year between 1995 and2015, while fuel costs decline by 1.1 percent a year.Capital costs—associated with the recovery of in-vestments in power plants and transmission anddistribution facilities—are expected to decline by 0.8percent annually (Figure 62). The decline is madepossible by increased utility use of wholesale powerpurchases (electricity purchases from nonutilitiesand other utilities), lower construction costs for newcombustion turbine and combined-cycle generatingtechnologies, and the availability of adequate capa-city for current generation needs. By purchasingpower, utilities avoid capital-intensive constructionand financing costs.
A yearly 1.2-percent decline in operating and main-tenance costs is also expected, as more turbine-basedcapacity is installed and operated. For a typical 300-megawatt plant, operating and maintenance costsfor advanced gas turbines are about half those forconventional coal-fired generators. Typically, tur-bine-based generators are removed from service anaverage of 15 days a year for planned maintenance,compared with 30 days for coal-steam generators. Inaddition, the AEO97 assumes that operating andmaintenance expenses decline by 2.5 percent annu-ally from 1997 to 2007, continuing the trend of theprevious 10-year period. Also, expenses charged togeneral and administrative functions (billing, sala-ries, and benefits) are assumed to drop by 25 per-cent during the same period as generators positionthemselves for increased competition.
50 Energy Information Administration/ Annual Energy Outlook 1997

Electricity Generation
Lower Capital Costs Contribute to aProjected Drop in Generating Costs
2000 Coal2000 Combined 2015 Coal2015 Combined a0
10
20
30
40
50
Fuel
}
}2015
Coal Combined-cycle
Operating andmaintenance
Capital
Coal Combined-cycle
}
2000
Figure 63. Electricity generation costs,2000 and 2015 (1995 mills per kilowatthour)
Technology choices for new electric generating capa-city are made to minimize cost while meeting localand Federal emissions constraints. The levelized costof electricity production includes the time-discountedcost of construction, fixed and variable operatingand maintenance costs, and fuel costs (Figure 63).The choice of technology for capacity additions isbased on levelized costs.
In the AEO97 forecasts, the capital costs of conven-tional technologies are assumed to be constant. Foradvanced technologies, after an initial upwardadjustment to account for technological optimism,capital costs decline for the first five units as afunction of market penetration. Heat rates for bothadvanced and conventional fossil-fired technologiesdecline annually from 2000 until 2010. In 2015, thelast year of the forecast, levelized costs for gas-firedcombined-cycle capacity are 14.2 percent lower thanthose for coal (Table 5).
Table 5. Costs of producing electricityfrom new plants, 2000 and 2015
2000 2015
Item
Conventionalpulverized
coal
Advancedcombined
cycle
Conventionalpulverized
coal
Advancedcombined
cycle
1995 mills per kilowatthourCapital 25.3 10.6 23.5 6.9O&M 5.6 4.4 5.6 4.4Fuel 14.9 24.8 10.3 23.4
Total 45.8 39.9 39.4 34.5Btu per kilowatthour
Heat rate 9,928 6,985 9,463 5,700
Natural Gas Projected To CaptureLarger Share of Electricity Generation
Coal Nuclear Naturalgas
Renewables Oil0
500
1,000
1,500
2,000
2,500
19952015
Figure 64. Electricity generation by fuel, 1995-2015(billion kilowatthours)
As they have since early in this century, coal-firedpower plants are expected to remain the dominantsource of electricity through 2015 (Figure 64). In1995, coal accounted for 1,714 billion kilowatthoursor 51 percent of total generation. Although coal-firedgeneration is projected to increase to 2,103 billionkilowatthours, increases in natural gas generationwill lower coal’s share to 47 percent in 2015. Con-cerns about the environmental impacts of coalplants, combined with their relatively long construc-tion leadtimes and the availability of economicalnatural gas, make it unlikely that many new coalplants will be built before 2000. Nevertheless, slowdemand growth and the huge investment in existingplants will keep coal in its dominant position.
The large investment in existing plants will alsomake nuclear power an important source of electri-city through 2015. In recent years, the performanceof nuclear power plants has improved substantially.As a result, nuclear generation is projected to in-crease until 2000, then decline as older units areretired.
In percentage terms, generation from gas-fired pow-er plants shows the largest increase in the forecast,growing from 15 percent of generation in 1995 to 31percent in 2015. As a result, by 2015, gas-firedgeneration overtakes nuclear power as the Nation’ssecond-largest source of electricity. Generation fromoil-fired plants remains fairly small throughout theforecast.
Energy Information Administration/ Annual Energy Outlook 1997 51

Nuclear Power
Despite High Capacity Factors,Nuclear Plants Lose Generation Share
1975 1985 1995 2005 20150
20
40
60
80
100 ProjectionsHistory
Figure 65. Nuclear power plant capacity factors,1973-2015 (percent)
The AEO97 reference case forecast assumes thatmost nuclear units will operate to the end of theircurrent 40-year license terms, with 50 units (38 per-cent of current nuclear capacity) retiring between1995 and 2015. Some nuclear units may be retiredbefore their license expiration dates due to highoperation costs, exceeding 4.0 cents per kilowatt-hour. Nearly 70 percent of the projected retirementsoccur in the last 5 years of the forecast. (One newunit, Watts Bar 1, became operable in 1996.) Giventhese assumptions, 59 nuclear units are projected toprovide 10 percent of total electricity generation in2015, down from 20 percent in 1995. No new nuclearunits are expected to become operable by 2015, be-cause natural gas and coal-fired plants are moreeconomical.
Nuclear generation forecasts depend on both operat-ing capacity and assumed capacity factors. Thenational average capacity factor, which was below60 percent in the 1970s and 1980s, has surpassed 70percent since 1991 (Figure 65), increasing to 77 per-cent in 1995. AEO97 assumes that individual reac-tor performance improves for the first 20 or 25 yearsof operation, after which it declines as units age. Asa result, the national average capacity factor staysnear the current level, with a slight decline from2007 through 2012 due to reactor aging, after whichretirements of older reactors bring the average capa-city factor back up.
Nuclear Plant Life Extensions CouldReduce Electricity Carbon Emissions
1995 2000 2005 2010 20150
20
40
60
80
100
Reference case
Low nuclear
High nuclear
0
200
400
600
800 High
Reference
Low
Nuclear generation, 2015(billion kilowatthours)
Figure 66. Operable nuclear capacityin three cases, 1995-2015 (gigawatts)
Two alternative AEO97 analyses—the high and lownuclear cases—show how changing assumptionsabout the operating lifetimes of nuclear plants affectthe reference case forecast of nuclear capacity(Figure 66). The low nuclear case assumes that, onaverage, all units are retired 10 years before the endof their 40-year license periods (93 units by 2015).Early shutdowns could be caused by unfavorableeconomics, waste disposal problems, or physicaldegradation of the units. The high nuclear caseassumes 10 additional years of operation for eachunit (only 4 units retired by 2015), suggesting thatlicense renewals would be permitted. Conditionsfavoring that outcome could include continued per-formance improvements, a solution to the waste dis-posal problem, or stricter limits on emissions fromfossil-fired generating facilities.
In the low nuclear case, more than 100 new fossil-fueled units (assuming an average unit size of 300megawatts) would be built to replace retiring nu-clear units. The new capacity would be split mainlybetween coal-fired (37 percent) and combined-cycle(47 percent) units. The additional fossil-fueled capa-city would produce 43 million metric tons of carbonemissions above those in the AEO97 reference case.Also, 3 gigawatts of additional new renewable andfuel cell capacity would be built. In the high nuclearcase, 32 gigawatts of new capacity additions—mostlyfossil-fueled plants—are avoided, as compared withthose in the AEO97 reference case, and carbon emis-sions are reduced by 29 million metric tons (4 per-cent of total emissions by electricity generators).
52 Energy Information Administration/ Annual Energy Outlook 1997

Electricity: Alternative Cases
Higher Electricity Demand WouldIncrease Coal and Gas Consumption
Reference High demand bb0
20
40
60
80
100
120
140
160
180 Turbines
Fossil steamCombined cycle
Nuclear
RenewablesFuel cell
Figure 67. Cumulative new generating capacityby type in two cases, 1995-2015 (gigawatts)
Electricity consumption grows in the forecast, butthe rate of increase lags behind historical levels asa result of assumptions regarding efficiency im-provements in end-use technologies, demand-sidemanagement programs, and population and eco-nomic growth. Deviations from these assumptionscould result in substantial changes in electricitydemand. For example, if electric vehicles enter themarket faster than expected, the demand for elec-tricity would also increase more rapidly. Lowerelectricity prices due to the effect of competitivemarkets could lead to increased consumption andless concern for conservation. In a high demandcase, electricity demand is assumed to grow by 2.0percent a year between 1995 and 2015, comparableto the annual growth rate of 2.2 percent between1990 and 1995. In the reference case, electricitydemand is projected to grow by 1.5 percent a year.
In the high demand case, 101 gigawatts more newgenerating capacity is built than in the referencecase between 1995 and 2015—equivalent to 336 new300-megawatt generating plants (Figure 67). Theshares of coal- and gas-fired generation (excludingcogeneration) are about the same—50 and 29 per-cent, respectively, in the reference case and 51 and28 percent in the high demand case. Relative to thereference case, there is a 14-percent increase in coalconsumption and an 11-percent increase in naturalgas consumption in the high demand case, and car-bon emissions from electricity generation are 93million metric tons (14 percent) higher.
Small Change in Economic GrowthWould Have Large Effect on Capacity
Low growth Reference High growth bb0
20
40
60
80
100
120
140
160
180 Turbines
Fossil steamCombined cycle
Nuclear
RenewablesFuel cell
Figure 68. Cumulative new generating capacityby type in three cases, 1995-2015 (gigawatts)
From 1995 to 2015, the annual average growth ratefor GDP ranges between 2.4 and 1.4 percent in thehigh and low economic growth cases, respectively.The difference of a percentage point in the economicgrowth rate leads to a 15-percent change in electrici-ty demand in 2015, with a corresponding differenceof 124 gigawatts of new capacity required across thehigh and low economic growth cases. In both cases,utilities are expected to retire 14 percent of currentcapacity, or 1,207 generating plants, by 2015 due toincreased operating costs as a result of aging.
In the reference case, electricity suppliers are ex-pected to add 319 gigawatts of new capacity, equiva-lent to 1,063 new 300-megawatt power plants. Ofthe new capacity, 12 percent is expected to be coal-steam, 81 percent gas turbine and combined-cycle, 4percent renewable technologies, and 1 percent fuelcells (Figure 68). In addition, between 1995 and2015, utilities are expected to repower or life-extend268 gigawatts or 35 percent of current capacity.
Current construction costs for a typical 300-mega-watt plant range from $400 per kilowatt for com-bined-cycle technologies to $1,465 per kilowatt forcoal-steam technologies. These costs, combined withthe difficulty of obtaining permits and developingnew generating sites, make refurbishment of exist-ing power plants (at $260 per kilowatt) a profitableoption for utility resource planners. Between 1995and 2015, utilities are expected to refurbish 770coal-, 172 gas-, and 74 oil-fired generating units.
Energy Information Administration/ Annual Energy Outlook 1997 53

Electricity: Alternative Cases
Capital Costs Are Key to the Use ofAdvanced Generating Technologies
Coal Advancedcoal
Naturalgas
Advancednatural
Renew-ables
0
50
100
150
200
250ReferenceHigh technology
Low technology
gas
Figure 69. Cumulative new electricity generatingcapacity by technology type in three cases, 1995-2015(gigawatts)
In the AEO97 reference case, higher initial capitalcosts are assumed for new, advanced generatingfacilities, to account for both technological optimismand inexperience in constructing new designs. Thecosts are assumed to decline as a function of marketpenetration. To examine the effects of these assump-tions, a high technology case was developed, withcapital cost reductions due to learning effectsassumed to be 50 percent greater than in the refer-ence case, and optimism factors (which increase thecost of the earliest units constructed) assumed to be50 percent lower than in the reference case. As a re-sult of the change in the optimism and learning fac-tors, nth-of-a-kind costs for advanced technologiesare about 12 percent lower in the high technologycase than in the reference case. In a low technologycase, options for capacity expansion included onlythe technologies available in 1996, eliminating ad-vanced fossil, nuclear, and renewable technologies.
Between 1995 and 2015, advanced coal-fired capaci-ty additions are 12.1 gigawatts higher in the hightechnology case than in the low case, and advancedgas-fired capacity additions are 139.8 gigawattshigher (Figure 69), due to a 12-percent difference incapital costs. Conversely, capacity additions for con-ventional coal- and gas-fired technologies are 48.1and 108.2 gigawatts lower, respectively, in the highthan in the low case. The capital costs for first-of-a-kind units using renewable technologies are lower inthe high case than in the low case, and renewablecapacity additions are 8.0 gigawatts higher.
Biomass Expected To Lead Growthin Generation From Renewable Fuels
1995 2000 2005 2010 20150
10
20
30
40
50
60
70
80
Geothermal
Municipal solid waste
Biomass
Figure 70. Grid-connected electricity generationfrom selected renewable fuels, 1995-2015(billion kilowatthours)
Geothermal resources represented in the AEO97projections consist entirely of steam and hot waterin the western United States. Electricity generationfrom geothermal energy facilities grows from nearly15 billion kilowatthours in 1995 to 22 billion in 2015(Figure 70). Growth from new geothermal technolo-gies, which are flash steam and binary cycle units,is expected to be moderate, and some of the growthis offset by retirements of 0.7 gigawatts at TheGeysers site due to depletion of reservoir water.
Generation from biomass (wood, grasses, and resi-dues) grows from nearly 47 billion kilowatthours in1995 to nearly 76 billion in 2015. Cogeneration, pri-marily in the wood and paper industries, accountsfor about 70 percent of biomass generation in 2015.EIA estimates that dedicated energy crops will be-come economical by 2010. As is expected for otherrenewables, penetration of biomass will depend onthe price of conventional fossil fuels and the rolethat future environmental legislation and regula-tions may have in limiting fossil fuel consumptionand promoting the development of renewable fuels.
Municipal solid waste (MSW) generation increasesfrom less than 21 billion kilowatthours in 1995 tomore than 30 billion in 2015 in the reference case,and the share of MSW generation from low-Btu gasextracted from landfills grows from 16 percent towell over 35 percent. Environmental concerns andthe use of other waste management strategies, suchas recycling, composting, and landfilling, are project-ed to limit the growth of MSW combustion.
54 Energy Information Administration/ Annual Energy Outlook 1997

Electricity from Renewable Sources
Growth Expected for Wind Power,But Market Uncertainties Remain
1995 2000 2005 2010 20150
1
2
3
4
5
East of MississippiMid-West/Texas
Mountain/Pacific
Figure 71. Wind-powered electricity generatingcapacity by region, 1995-2015 (gigawatts)
Wind capacity is projected to grow from the 1995level of 1.8 gigawatts nationally to 5.4 gigawatts in2015 (Figure 71), primarily in the West, where re-sources are favorable. Wind energy is considered awell-developed renewable energy technology, and im-provements in both cost and performance have beenseen in recent years; however, competition fromfossil fuel technologies, especially natural gas com-bustion turbines, remains strong. Projections of lowfossil fuel costs increase the uncertainty of windpower’s future, as do the potentially competitiveforces created by the emergence of restructured elec-tricity markets, which tend to favor establishedtechnologies.
Much of the development of wind energy in the nearto medium term will be in Europe, where stricterenvironmental laws, continued government support,and a commitment by the European Union to reachan 8-percent market share for renewables in theelectricity market help the investment climate forwind energy. In the developing world, lack of aninfrastructure provides development opportunitiesfor wind technologies in small-scale, remote villageapplications.
Wind capacity factors are expected to improve andcapital costs to decrease. The next generation ofwind turbines, to be introduced during the 1997-1998 time frame, will have up to 750 kilowatts ofcapacity. The AEO97 forecast assumes that turbinesof about that size will be deployed between 1997 and2000 and will continue to improve until 2005.
Role as Fuel Saver Possible forWind-Powered Electricity Generation
1990 1996 2000 2005 2010 20150
1
2
3
4
5
6
7
8
Upper rangeAEO97Lower range
Figure 72. Levelized costs of electricity from windpower, 1990-2015 (1995 cents per kilowatthour)
Industry targets for wind generation costs below 5cents per kilowatthour appear to have been met(Figure 72). Also, EPACT provides a tax subsidy of1.5 cents per kilowatthour for wind generation, effec-tive for 10 years for wind units built before July1999. Nevertheless, as the market for electricitychanges, these cost levels may no longer be adequateto ensure market penetration. As indicated above,some analysts predict that major technology ad-vances may permit the cost of wind-powered gen-eration to drop below 3 cents, or even below 2 centsper kilowatthour by 2015. Such decreases couldmake wind energy competitive with the variableoperating and fuel costs of some natural gas gen-eration, so that electricity from wind would be cost-effective solely on the basis of its energy value.
Competing as a fuel saver could be important towind power by offsetting the limitations that itsintermittent nature imposes on capacity planningfor individual utilities or for an electricity poolarrangement, such as those proposed under manyrestructuring scenarios. In addition, if a cap oncarbon emissions were implemented, or if a carbontax increased the operating costs of fossil fuelplants, then wind’s economic viability could begreatly improved. Wind energy would also benefitfrom the development of inexpensive energy storage.Many State and national restructuring proposalscontain minimum renewable portfolio provisionsthat could be beneficial to wind development, sincein some regions wind is the most economically viableof the non-hydropower renewable technologies.
Energy Information Administration/ Annual Energy Outlook 1997 55
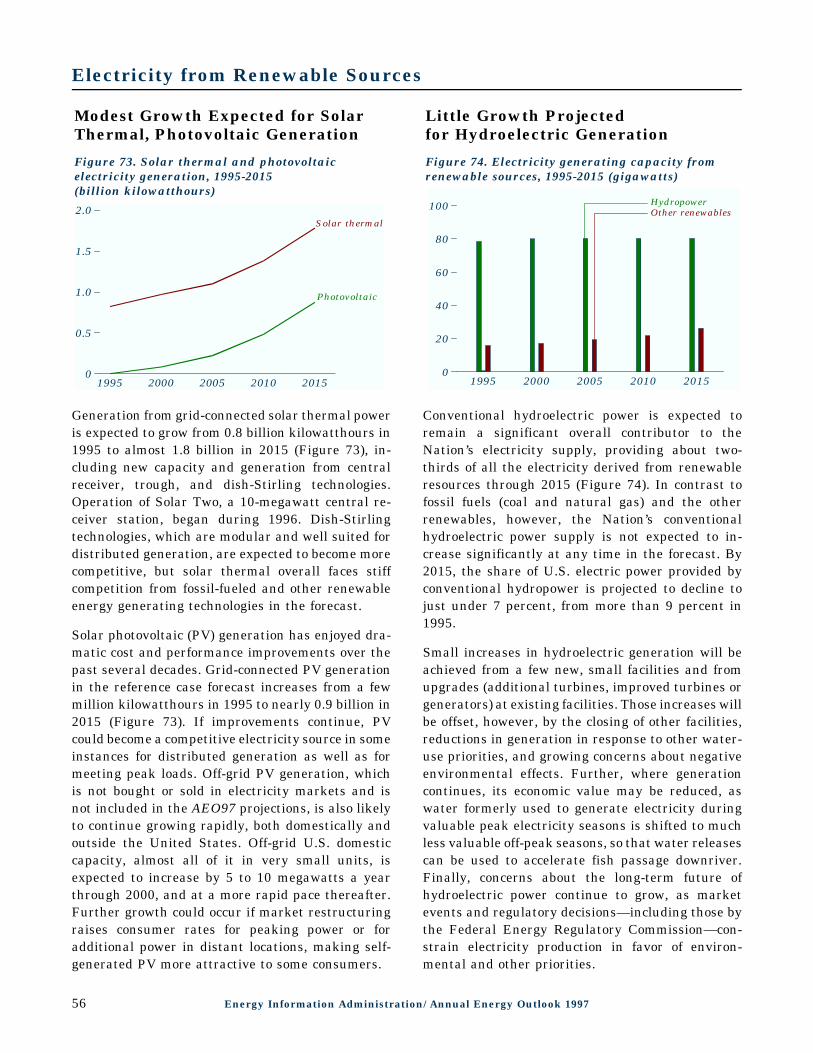
Electricity from Renewable Sources
Modest Growth Expected for SolarThermal, Photovoltaic Generation
1995 2000 2005 2010 2015 10.0
0.5
1.0
1.5
2.0Solar thermal
Photovoltaic
Figure 73. Solar thermal and photovoltaicelectricity generation, 1995-2015(billion kilowatthours)
Generation from grid-connected solar thermal poweris expected to grow from 0.8 billion kilowatthours in1995 to almost 1.8 billion in 2015 (Figure 73), in-cluding new capacity and generation from centralreceiver, trough, and dish-Stirling technologies.Operation of Solar Two, a 10-megawatt central re-ceiver station, began during 1996. Dish-Stirlingtechnologies, which are modular and well suited fordistributed generation, are expected to become morecompetitive, but solar thermal overall faces stiffcompetition from fossil-fueled and other renewableenergy generating technologies in the forecast.
Solar photovoltaic (PV) generation has enjoyed dra-matic cost and performance improvements over thepast several decades. Grid-connected PV generationin the reference case forecast increases from a fewmillion kilowatthours in 1995 to nearly 0.9 billion in2015 (Figure 73). If improvements continue, PVcould become a competitive electricity source in someinstances for distributed generation as well as formeeting peak loads. Off-grid PV generation, whichis not bought or sold in electricity markets and isnot included in the AEO97 projections, is also likelyto continue growing rapidly, both domestically andoutside the United States. Off-grid U.S. domesticcapacity, almost all of it in very small units, isexpected to increase by 5 to 10 megawatts a yearthrough 2000, and at a more rapid pace thereafter.Further growth could occur if market restructuringraises consumer rates for peaking power or foradditional power in distant locations, making self-generated PV more attractive to some consumers.
Little Growth Projectedfor Hydroelectric Generation
1995 2000 2005 2010 20150
20
40
60
80
100Other renewablesHydropower
Figure 74. Electricity generating capacity fromrenewable sources, 1995-2015 (gigawatts)
Conventional hydroelectric power is expected toremain a significant overall contributor to theNation’s electricity supply, providing about two-thirds of all the electricity derived from renewableresources through 2015 (Figure 74). In contrast tofossil fuels (coal and natural gas) and the otherrenewables, however, the Nation’s conventionalhydroelectric power supply is not expected to in-crease significantly at any time in the forecast. By2015, the share of U.S. electric power provided byconventional hydropower is projected to decline tojust under 7 percent, from more than 9 percent in1995.
Small increases in hydroelectric generation will beachieved from a few new, small facilities and fromupgrades (additional turbines, improved turbines orgenerators) at existing facilities. Those increases willbe offset, however, by the closing of other facilities,reductions in generation in response to other water-use priorities, and growing concerns about negativeenvironmental effects. Further, where generationcontinues, its economic value may be reduced, aswater formerly used to generate electricity duringvaluable peak electricity seasons is shifted to muchless valuable off-peak seasons, so that water releasescan be used to accelerate fish passage downriver.Finally, concerns about the long-term future ofhydroelectric power continue to grow, as marketevents and regulatory decisions—including those bythe Federal Energy Regulatory Commission—con-strain electricity production in favor of environ-mental and other priorities.
56 Energy Information Administration/ Annual Energy Outlook 1997

Oil and Gas Prices
AEO97 Reference Case ProjectsStable Oil Prices, Rising Consumption
1975 1985 1995 2005 20150
10
20
30
40
50
60
High price
History Projections
Reference
Low price
Figure 75. Lower 48 crude oil wellhead prices,1970-2015 (1995 dollars per barrel)
From 1995 to 2015, wellhead prices for crude oil inthe lower 48 States are projected to fall by 0.8 per-cent a year in the low world oil price case, and togrow by 1.2 and 2.8 percent a year in the referenceand high price cases, respectively (Figure 75). Thevariation in world oil price assumptions leads tosimilar variation in projected domestic prices, whichare determined largely by the international market.
U.S. petroleum consumption continues to rise in allthe AEO97 cases (Figure 76). Total petroleum prod-uct supplied ranges from 20.6 million barrels perday in the low economic growth case to 23.6 millionin the high growth case, as compared with 17.7 mil-lion in 1995. Petroleum continues as the primarysource of energy in the United States, representingjust under 40 percent of total U.S. energy consump-tion throughout the forecast.
1975 1985 1995 2005 2015 114
16
18
20
22
24
High oil price
Low oil priceHigh growthHistory Projections
Low growth
Reference
0
Figure 76. U.S. petroleum consumptionin five cases, 1970-2015 (million barrels per day)
Only Slight Increase Projected forDomestic Natural Gas Prices
1975 1985 1995 2005 20150
1
2
3
4
Low growth
History Projections
ReferenceHigh growth
Figure 77. Lower 48 natural gas wellhead prices,1970-2015 (1995 dollars per thousand cubic feet)
Wellhead prices for natural gas in the lower 48States increase by 0.6 and 2.2 percent a year in thelow and high economic growth cases, respectively,compared with 1.4-percent annual growth in the ref-erence case (Figure 77). The increases reflect risingdemand for natural gas and its impact on the natu-ral progression of the discovery process from largerand more profitable fields to smaller, less economicalones. Because domestic natural gas prices are lessresponsive than oil prices to world oil prices (oil andgas do not compete directly in most markets), littlevariation is seen across the oil price cases.
Natural gas production can be increased at substan-tially lower cost than was projected in previous AEOforecasts for several reasons, including: an increasein the inferred reserve base, based on a reassess-ment by the U.S. Geological Survey; and a reexami-nation of the impacts of technological progress onthe discovery process, which allows more gas to beproduced from fewer wells (Table 6).
Table 6. Economically recoverable oil and gasresources in 1990, measured under differenttechnology assumptions
Lower 48resources
Crude oil(billion barrels)
Natural gas(trillion cubic feet)
1990 tech-nology
2015 tech-nology
1990 tech-nology
2015 tech-nology
Proved 26 26 169 169Unproved 96 119 936 1,322
Total 122 145 1,105 1,491
Energy Information Administration/ Annual Energy Outlook 1997 57

Oil and Gas Reserve Additions
Small Drilling Increases AccompanyExpanding Markets for Oil and Gas
1975 1985 1995 2005 20150
10
20
30
40
50
60
70
High oil price
History Projections
Reference
Low oil price
Figure 78. Successful new lower 48 natural gasand oil wells in three cases, 1970-2015(thousand successful wells)
Both exploratory and developmental drilling levelsincrease in the forecast (Figure 78). With risingprices and generally declining drilling costs, totalcrude oil and natural gas well completions grow ataverage annual rates of 3.5 and 4.8 percent in thelow and high oil price cases, respectively. Changesin world oil price assumptions have a more pro-nounced effect on projected oil drilling than on gasdrilling (Table 7).
Natural gas drilling is projected to be more produc-tive than oil drilling, because remaining recoverablegas resources are more abundant than oil resources.Over the past two decades, crude oil reserve addi-tions have come primarily from older fields, whereasgas reserve additions have come from discoveries inboth new and old fields. The future productivity ofboth oil and gas drilling is uncertain, however,because the extent of the Nation’s oil and gas re-sources is uncertain [33].
Table 7. Natural gas and crude oil drillingin three cases (thousands of successful wells)
1995 2000 2010 2015
Natural gasLow oil price case 10.0 14.1 17.5Reference case 7.4 11.0 15.5 18.4High oil price case 11.6 17.0 19.8
Crude oilLow oil price case 6.4 7.5 7.9Reference case 6.8 9.1 10.1 9.9High oil price case 12.4 12.8 12.4
Natural Gas Reserve Additions Grow,Oil Additions Stabilize
1975 1985 1995 2005 20150
5
10
15
20
25
30
History Projections
High oil price
Low oil priceReference
Figure 79. Lower 48 natural gas reserve additionsin three cases, 1970-2015 (trillion cubic feet)
Higher drilling levels lead to significant increases inannual reserve additions in the forecast. Lower 48natural gas reserve additions (Figure 79) increase by1.3 and 1.5 percent a year in the low and high oilprice cases, respectively, continuing the trend of thepast two decades. Lower 48 oil reserve additions(Figure 80) decrease by 0.4 percent a year in the lowworld oil price case and increase by 3.1 percent ayear in the high price case.
Natural gas reserve additions exceed productionthrough 2012 in the reference case. Lower 48 re-serves peak at 189.5 trillion cubic feet in 2013, thendecline to 188.4 trillion by 2015, compared with the1995 level of 155.6 trillion cubic feet. Despite a risein oil reserve additions, production exceeds additionsin the reference case, and oil reserves are depletedat a rate of 0.5 percent a year.
1975 1985 1995 2005 20150
1
2
3
4 History Projections
High oil price
Low oil price
Reference
Figure 80. Lower 48 oil reserve additions in threecases, 1970-2015 (billion barrels)
58 Energy Information Administration/ Annual Energy Outlook 1997

Natural Gas Production and Imports
Conventional Onshore ProductionLeads Increase in Natural Gas Supply
1975 1985 1995 2005 20150
5
10
15Lower 48 NAconventional
History Projections
Lower 48 AD
Alaska
Lower 48 NAunconventional
Lower 48offshore
Figure 81. Natural gas production by source,1970-2015 (trillion cubic feet)
The continuing increase in domestic natural gas pro-duction over the forecast comes primarily from lower48 onshore nonassociated (NA) sources (Figure 81).Conventional onshore production, which accountedfor 42.9 percent of total U.S. domestic production in1995, is projected to increase at an average annualrate of 2.6 percent over the 1995-2015 period. Natu-ral gas production from unconventional sources in-creases at an average annual rate of 1.2 percentover the same period. Gas from offshore wells in theGulf of Mexico also contributes significantly to pro-duction. The innovative use of cost-saving technologyand the expected continuation of recent huge finds,particularly in the deep water off the Gulf of Mexico,have encouraged greater interest in this area.
Natural gas production from Alaska rises graduallyin the forecast. Alaskan gas is not projected to betransported to the lower 48 States, however, becauselower 48 prices are not projected to be high enoughto support the required transport system within theforecast period. Expected Alaskan natural gas pro-duction does not include gas from the North Slope,which currently is being reinjected to support oilproduction. In the future, it may also be marketedas liquefied natural gas to Pacific Rim markets [34].
Production of associated/dissolved (AD) natural gasfrom lower 48 crude oil reservoirs generally declines,following the expected pattern of domestic crude oilproduction. AD gas accounts for less than 7.8 per-cent of total lower 48 production in 2015, comparedwith 14.2 percent in 1995.
Natural Gas Imports, Mostly fromCanada, Increase Slightly
1975 1985 1995 2005 201515
20
25
30
35History Projections
High price
High price
Low price
Low price
Reference
Reference
Production
Consumption
Net imports
0
Figure 82. Natural gas production, consumption,and imports, 1970-2015 (trillion cubic feetper year)
Natural gas imports are expected to grow in theforecast in all cases (Figure 82). In the referencecase, net natural gas imports increase from 12.4percent of total gas consumption in 1995 to 14.0percent in 2015. Most of the increase is attributableto imports from Canada, primarily in response toreadily available supplies and a 20.9-percent in-crease in projected pipeline capacity between theUnited States and Canada between 1995 and 2015.
Since 1984, U.S. natural gas trade with Mexico hasconsisted primarily of exports. That trend is expect-ed to continue throughout the forecast, despite theNorth American Free Trade Agreement and the sub-stantial estimated size of the Mexican natural gasresource base. There is significant uncertainty in thedirection and pace of change in the Mexican naturalgas market. Some of the unknowns that may affectthe market include: economic growth and develop-ment, environmental concerns, issues related toPetroleos Mexicano’s (PEMEX’s) monopoly controland budgetary constraints, political and policy risks,and the overabundance of heavy fuel oil in Mexico’spetroleum market.
Another potential source of gas imports is liquefiednatural gas (LNG); however, given the projected lownatural gas prices in the lower 48 markets, LNG isnot expected to become a significant source of U.S.supply. LNG imports are projected to increase overthe forecast at a modest rate, reaching a level of0.36 trillion cubic feet in 2015, compared with 0.02trillion cubic feet in 1995.
Energy Information Administration/ Annual Energy Outlook 1997 59

Natural Gas Consumption
Gas Consumption for ElectricityGeneration Grows Steadily
1975 1985 1995 2005 2015 115
20
25
30
35
High oil price
Low oil price
High growth
History Projections
Low growth
Reference
0
Figure 83. Natural gas consumption in fivecases, 1970-2015 (trillion cubic feet per year)
Natural gas consumption expands from 1995 to 2015in all the AEO97 cases (Figure 83). Domestic con-sumption ranges from 28.4 trillion cubic feet peryear in the low economic growth case to 32.0 trillionin the high growth case in 2015, as compared with21.6 trillion cubic feet in 1995. Growth is seen in allend-use sectors, with highest growth as a result ofrising demand for electricity, including industrialcogeneration. More than half of the variation acrosscases is attributable to differences in gas consump-tion for electricity generation.
Total gas consumption in the electricity generationsector grows steadily throughout the forecast. In thereference case it more than doubles, from 3.5 trillioncubic feet a year in 1995 to 8.5 trillion in 2015.Restructuring of the electric utility industry is ex-pected to open up new opportunities for gas-firedgeneration. In addition, growth is spurred by in-creased utilization of existing gas-fired power plantsin the forecast and the addition of new turbines andcombined-cycle facilities, which are less capital-intensive than coal, nuclear, or renewable electricitygeneration plants. Although projected coal prices tothe electricity generation sector are lower thancurrent prices, the natural gas combined-cycle shareof new capacity is about four times the coal share.Stable fuel costs, lower capital costs, and projectedimprovements in gas turbine heat rates make theoverall cost of gas-generated electricity per kilo-watthour competitive with the cost of electricityfrom new coal-burning generators.
Gas Pipeline and Storage CapacityProjected To Increase
New England
Mid Atlantic
East North Central
West North Central
South Atlantic
East South Central
West South Central
Mountain
Pacific
0 2 4 6 8 10
Entering regionExiting region
Figure 84. Pipeline capacity expansion by Censusdivision, 1995-2015 (billion cubic feet per day)
Although the boom in pipeline and storage construc-tion of the late 1980s and early 1990s has slowed,new capacity will still be required. Pipeline capacityincreases are projected in the reference case, bothentering and exiting key regions (Figure 84). Storagecapacity is also expected to grow in most regions,increasing overall by 54 percent over the forecastperiod. The strongest growth is projected for the first5 years of the forecast, when planned pipeline addi-tions to provide access to new supplies and servicenew markets come on line, and after 2005, whenadditional capacity will be needed to meet increasedconsumption in the eastern half of the UnitedStates. In some regions, growth in new pipeline con-struction is tempered by higher utilization of pipe-line capacity (Figure 85).
New England
West North Central
East South Central
Mountain
Pacific
0 20 40 60 80 100
South Atlantic
East South Central
West South Central
Mountain
0 20 40 60 80 1000 20 40 60 80 100
= 1995= 2015
Entering Census division
Exiting Census division
New England
West North Central
East South Central
Mountain
Pacific
South Atlantic
East South Central
West South Central
Mountain
Figure 85. Pipeline capacity utilization by Censusdivision, 1995 and 2015 (percent)
60 Energy Information Administration/ Annual Energy Outlook 1997

Natural Gas Prices
Lower Prices Projected for Residentialand Commercial Natural Gas Users
1975 1985 1995 2005 20150
2
4
6
8
10
ResidentialCommercial
CNGvehicles
ElectricityIndustrial
Wellhead
History Projections
Figure 86. Natural gas end-use prices by sector,1970-2015 (1995 dollars per thousand cubic feet)
While consumer prices to the industrial, electricity,and transportation sectors generally increasethroughout the forecast period, prices to the resi-dential and commercial sectors show significantdecreases (Figure 86). The decreases in those sectorsare caused primarily by projected reductions in thecost of capital and by efficiency improvements in thetransmission and distribution segments of the indus-try as service providers adapt to a more competitiveregulatory framework. In the industrial and electri-city generation sectors, modest decreases in marginsare overshadowed by increases in wellhead prices,and the overall trend is a slight rise in prices. Thedeclines in margins reflect both Federal and Stateinitiatives that foster an increasingly competitivemarket (see discussion on pages 9-10).
Compared with their rise and decline over the 1970-1995 period, transmission and distribution revenuesin the natural gas industry are relatively stable inthe forecast (Table 8), with declines in marginsbalanced by higher volumes.
Table 8. Transmission and distribution revenuesand margins, 1970, 1985, 1995, and 2015
1970 1985 1995 2015
T&D revenues(billion 1995 dollars) 29.00 47.63 41.11 38.45End-use consumption(trillion cubic feet) 19.02 15.81 19.74 27.60Average margin*(1995 dollars perthousand cubic feet) 1.52 3.01 2.08 1.40*Revenue divided by end-use consumption.
Gas Transmission and DistributionMargins Expected To Decline
1975 1985 1995 2005 20150
20
40
60
80
100
ResidentialCommercial
CNGvehicles
Electricitygeneration
Industrial
History Projections
Figure 87. Wellhead share of natural gas end-useprices by sector, 1970-2015 (percent)
With transmission and distribution margins declin-ing in most sectors, the wellhead shares of end-useprices increase in the forecast (Figure 87). Thegreatest impact is in the residential and commercialmarkets, where most customers rely on firm service.
Changes have been seen historically not only in thewellhead price component of end-use prices but alsoin pipeline and local distribution company (LDC)margins (Table 9). The decline in pipeline marginsresults from continued depreciation of the pipelineinfrastructure, a decline in the AA utility bond rate,increased utilization of pipeline capacity (whichplaces downward pressure on unit costs), and theeffects of a more competitive market resulting fromrestructuring. Although LDC margins in the resi-dential and commercial sectors have increased his-torically, as the impacts of restructuring furtheraffect the transmission segment of the market andbegin to affect the distribution segment, reducedmarkups are projected for these sectors.
Table 9. Components of residential and commercialnatural gas end-use prices, 1985-2015(1995 dollars per thousand cubic feet)
Price Component 1985 1995 2000 2010 2015
Wellhead price 3.46 1.61 1.82 2.01 2.13Citygate price 5.11 2.78 2.78 2.99 3.11Pipeline margin 1.65 1.17 0.96 0.98 0.98LDC margin
Residential 3.23 3.38 2.99 2.42 2.21Commercial 2.39 2.33 2.07 1.66 1.51
End-use priceResidential 8.34 6.18 5.79 5.43 5.33Commercial 7.50 5.10 4.83 4.64 4.61
Energy Information Administration/ Annual Energy Outlook 1997 61

Oil and Gas Alternative Technology Cases
Table 10. Representative average annual rates of technological progress in alternative technology cases(percent)
Technology area
Natural gas Crude oilSlow
technology ReferenceRapid
technologySlow
technology ReferenceRapid
technologyOn-
shoreOff-
shoreOn-
shoreOff-
shoreOn-
shoreOff-
shoreOn-
shoreOff-
shoreOn-
shoreOff-
shoreOn-
shoreOff-
shoreCosts
Drilling 1.6 3.6 2.1 4.2 2.8 4.9 1.6 3.6 2.1 4.2 2.8 4.9Lease equipment 0.7 1.1 1.4 1.9 2.1 2.6 0.7 1.1 1.4 1.9 2.1 2.6Operating 0.0 0.9 0.6 1.2 1.3 1.7 0.0 0.9 0.6 1.2 1.3 1.7
ResourcesInferred reserves 0.0 0.5 0.0 1.0 0.0 1.5 0.0 0.7 0.0 1.0 0.0 1.3Undiscovered 0.6 1.4 1.8 3.0 3.0 4.5 0.5 2.0 1.4 3.0 2.2 3.9
Finding rates 2.4 5.0 4.2 10.2 6.0 15.3 1.8 6.5 3.2 9.6 4.6 12.6Success rates 0.5 0.5 0.5 0.5 0.5 0.5 0.5 0.5 0.5 0.5 0.5 0.5
Slow Economic Growth Would Lead toStable Gas Prices, Higher Production
1995 2000 2005 2010 20150.0
0.2
0.4
0.6
0.8
1.0
1.2
1.4
Price
Production
Figure 88. Lower 48 natural gas production andwellhead prices in the low economic growth case,1995-2015 (index, 1995 = 1)
The potential impact of advances in oil and gas sup-ply technology is most evident in the low economicgrowth case, where production increases by 1.4 per-cent a year with only a small increase in wellheadprices (Figure 88). As seen in the other AEO97cases, achieving greater increases in productionrequires a price stimulus in addition to the assumedreference levels of technological progress.
For parameters affected by technology, historicalrates of change are generally assumed to continuethroughout the forecast period in all the AEO97cases. Rapid and slow technological progress caseswere created to assess the sensitivity of the AEO97projections to changes in the economically recover-able oil and gas resource base, exploration anddevelopment costs, and finding rates as a result oftechnological progress. Representative values for theaffected parameters are presented in Table 10.
Technology Assumptions Have StrongEffects on Gas Price Projections
1975 1985 1995 2005 20150
1
2
3
4
5
Reference
Rapidtechnology
Slowtechnology
History Projections
Figure 89. Lower 48 natural gas wellhead pricesin three cases, 1970-2015 (1995 dollarsper thousand cubic feet)
The two technology cases were run as fully integrat-ed model runs. (Two other runs, with demands heldconstant, were produced to isolate the effects of de-mand feedback [see pages 26-29].) All other param-eters in the model were kept at their reference casevalues, including technology parameters for othermodules, parameters affecting foreign oil supply,and assumptions about gas trade with Mexico.
As shown in Figure 89, natural gas prices are highlysensitive to changes in assumptions about techno-logical progress. For the first decade of the forecast,both price and production levels for lower 48 oil andnatural gas are almost identical in the referencecase and the two technological progress cases. Bythe year 2015, however, natural gas prices are 30percent higher (at $2.77 per thousand cubic feet) inthe slow technology case and 27 percent lower (at$1.55) in the rapid technology case than the refer-ence case price of $2.13 per thousand cubic feet.
62 Energy Information Administration/ Annual Energy Outlook 1997
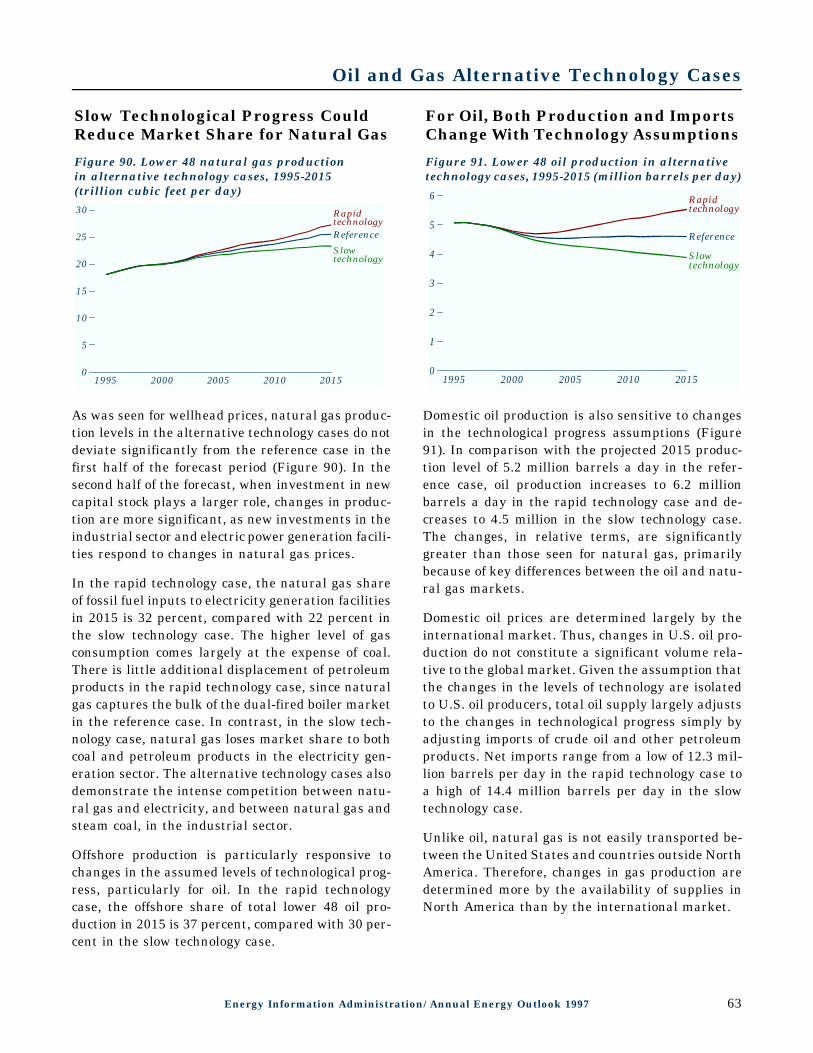
Oil and Gas Alternative Technology Cases
Slow Technological Progress CouldReduce Market Share for Natural Gas
1995 2000 2005 2010 20150
5
10
15
20
25
30
Reference
Rapidtechnology
Slowtechnology
Figure 90. Lower 48 natural gas productionin alternative technology cases, 1995-2015(trillion cubic feet per day)
As was seen for wellhead prices, natural gas produc-tion levels in the alternative technology cases do notdeviate significantly from the reference case in thefirst half of the forecast period (Figure 90). In thesecond half of the forecast, when investment in newcapital stock plays a larger role, changes in produc-tion are more significant, as new investments in theindustrial sector and electric power generation facili-ties respond to changes in natural gas prices.
In the rapid technology case, the natural gas shareof fossil fuel inputs to electricity generation facilitiesin 2015 is 32 percent, compared with 22 percent inthe slow technology case. The higher level of gasconsumption comes largely at the expense of coal.There is little additional displacement of petroleumproducts in the rapid technology case, since naturalgas captures the bulk of the dual-fired boiler marketin the reference case. In contrast, in the slow tech-nology case, natural gas loses market share to bothcoal and petroleum products in the electricity gen-eration sector. The alternative technology cases alsodemonstrate the intense competition between natu-ral gas and electricity, and between natural gas andsteam coal, in the industrial sector.
Offshore production is particularly responsive tochanges in the assumed levels of technological prog-ress, particularly for oil. In the rapid technologycase, the offshore share of total lower 48 oil pro-duction in 2015 is 37 percent, compared with 30 per-cent in the slow technology case.
For Oil, Both Production and ImportsChange With Technology Assumptions
1995 2000 2005 2010 20150
1
2
3
4
5
6
Reference
Rapidtechnology
Slowtechnology
Figure 91. Lower 48 oil production in alternativetechnology cases, 1995-2015 (million barrels per day)
Domestic oil production is also sensitive to changesin the technological progress assumptions (Figure91). In comparison with the projected 2015 produc-tion level of 5.2 million barrels a day in the refer-ence case, oil production increases to 6.2 millionbarrels a day in the rapid technology case and de-creases to 4.5 million in the slow technology case.The changes, in relative terms, are significantlygreater than those seen for natural gas, primarilybecause of key differences between the oil and natu-ral gas markets.
Domestic oil prices are determined largely by theinternational market. Thus, changes in U.S. oil pro-duction do not constitute a significant volume rela-tive to the global market. Given the assumption thatthe changes in the levels of technology are isolatedto U.S. oil producers, total oil supply largely adjuststo the changes in technological progress simply byadjusting imports of crude oil and other petroleumproducts. Net imports range from a low of 12.3 mil-lion barrels per day in the rapid technology case toa high of 14.4 million barrels per day in the slowtechnology case.
Unlike oil, natural gas is not easily transported be-tween the United States and countries outside NorthAmerica. Therefore, changes in gas production aredetermined more by the availability of supplies inNorth America than by the international market.
Energy Information Administration/ Annual Energy Outlook 1997 63

Oil Production and Consumption
AEO97 Projections Include ContinuingDecline in U.S. Oil Production
1975 1985 1995 2005 20150
2
4
6
8
10 History Projections
Lower 48 EORAlaska
Lower 48conventional
Lower 48offshore
Figure 92. Crude oil production by source,1970-2015 (million barrels per day)
Projected domestic crude oil production continues itshistoric decline throughout the forecast (Figure 92),declining by 1.1 percent a year, from 6.6 million bar-rels per day in 1995 to 5.2 million barrels per day in2015 [35]. Conventional onshore production in thelower 48 States, which accounted for 49.4 percent oftotal U.S. crude oil production in 1995, is projectedto decrease at an average annual rate of 1.6 percentover the forecast.
Crude oil production from Alaska is expected todecline at an average annual rate of 4.2 percentbetween 1995 and 2015. The overall decrease inAlaska’s oil production is driven by the continueddecline in production from Prudhoe Bay, the largestproducing field, which historically has accounted formore than 60 percent of total Alaskan production.
Offshore production generally increases in the fore-cast, at an average annual rate of 1.0 percent.Because of technological advances and lower costsassociated with deep exploration and production inthe Gulf of Mexico, several projects are alreadyunderway, and additional projects are in the plan-ning stages.
Increased production from enhanced oil recovery(EOR) slows the overall downward trend of oil pro-duction [36]. As oil prices rise, the expected profit-ability of EOR projects increases, and as a result,EOR production rises at an average annual rate of1.3 percent over the 1995-2015 period.
Gap Between Oil Production andConsumption Widens in All Cases
1975 1985 1995 2005 20150
5
10
15
20
25
Production
Consumption
History Projections
Net imports
High price
Low priceReference
High price
Low priceReference
Figure 93. Petroleum production, consumption, andimports, 1970-2015 (million barrels per day)
U.S. production of oil and natural gas liquids de-clines in all AEO97 cases except the high oil pricecase (Figure 93), as recoverable domestic resourcesare depleted. In the low price case, production dropsfrom its 1995 level of 9.8 million barrels per day to7.3 million barrels per day in 2015. In the high pricecase, increased exploration and drilling bring the2015 production level to 10.5 million barrels per day.
Growth in petroleum consumption is anticipated inall the AEO97 projections. The greatest variation inconsumption levels is seen in the economic growthcases, with an increase of 5.8 million barrels per dayover the 1995 level in the high growth case, as com-pared with an increase of only 2.9 million barrelsper day in the low growth case.
Additional petroleum imports will be needed to fillthe widening gap between production and consump-tion. The projections for net petroleum imports in2015 range from a high of 15.9 million barrels perday in the low oil price case—more than double the1995 level of 7.9 million barrels per day—to a low of10.8 million barrels per day in the high price case.The value of petroleum imports in 2015 ranges from$80.1 billion in the low price case to $116.2 billion inthe high growth case. Total annual U.S. expendi-tures for petroleum imports, which reached a his-torical peak of $75.8 billion in 1980 [37], were $49.4billion in 1995.
64 Energy Information Administration/ Annual Energy Outlook 1997

Petroleum Imports and Refining
AEO97 Projects Growing Reliance onImported Oil and Refined Products
1975 1985 1995 2005 2015 10
20
40
60
80
High oil price
ReferenceLow oil price
History Projections
Figure 94. Share of U.S. petroleum consumptionsupplied by net imports, 1970-2015 (percent)
Net imports of petroleum, which represented 44 per-cent of domestic petroleum consumption in 1995,close to the 1977 record level of 46 percent, areprojected to reach 61 percent in 2015 in the refer-ence case (Figure 94). The corresponding importshares of total consumption in 2015 are 51 percentin the high oil price case and 68 percent in the lowprice case.
Although crude oil is expected to continue as themajor component of petroleum imports, refined prod-ucts represent a growing share. More imports will beneeded as growth in demand for refined products ex-ceeds the expansion of domestic refining capacity.Refined products make up 19 percent of net petrole-um imports in 2015 in the high world oil price caseand 26 percent in the low price case, as comparedwith their 10-percent share in 1995 (Table 11).
Table 11. Petroleum consumption and net imports,1995 and 2015 (million barrels per day)
Year andprojection
Productsupplied
Netimports
Netcrude
imports
Netproductimports
1995 17.7 7.9 7.1 0.8
2015
Reference 22.1 13.5 10.2 3.2
Low oil price 23.3 15.9 11.8 4.1
High oil price 21.3 10.8 8.7 2.1
Low growth 20.6 12.3 9.9 2.5
High growth 23.6 14.6 10.6 3.9
U.S. Refining Capacity Expected ToRise, Despite Lack of New Refineries
1975 1985 1995 2005 2015 112
14
16
18
20
Low growthReferenceHigh growth
History Projections
0
Figure 95. Domestic refining capacity, 1975-2015(million barrels per day)
Falling demand for petroleum and the deregulationof the domestic refining industry in the 1980s led to13 years of decline in U.S. refinery capacity [38].That trend was broken in 1995 by a capacity in-crease of 0.4 million barrels per day over the 1994level. Financial and legal considerations make itunlikely that new refineries will be built in theUnited States, but “capacity creep” at existing re-fineries is expected to increase total U.S. refiningcapacity in all the AEO97 cases (Figure 95).
Distillation capacity is projected to grow from the1995 level of 15.4 million barrels per day to 16.5million in 2015 in the reference case, 16.1 million inthe low economic growth case, and 17.1 million inthe high growth case, as refining capacity returns tothe levels of the late 1970s. Existing refineries willcontinue to be utilized intensively throughout theforecast, in a range from 92 to 94 percent of capac-ity. In comparison, the 1995 utilization rate was 92percent, well above the rates of the 1980s and early1990s.
Ongoing investment in equipment for desulfuriza-tion and fluid catalytic cracking will allow U.S.refineries to handle lower quality crude oils, whichcontain more sulfur. The added flexibility willbecome increasingly valuable as higher quality re-sources are depleted over time.
Energy Information Administration/ Annual Energy Outlook 1997 65

Refined Petroleum Products
Transportation Fuels DriveProjected Growth in Petroleum Use
0
1
2
3
4
5
6
7
Gasoline
Diesel
Other
Lowprice
Total
Reference Highprice
Lowgrowth
Highgrowth
Other distillate
}
}}}
} Jet fuel
} Residual fuel
Figure 96. Change in petroleum products suppliedin five cases, 1995 to 2015 (million barrels per day)
U.S. petroleum consumption is projected to increaseby 4.4 million barrels per day between 1995 and2015 in the reference case, compared with 2.9 mil-lion in the low economic growth case and 5.8 millionin the high growth case (Figure 96). Industry willcontinue to account for about one-fourth of petro-leum consumption, and two-thirds will be used fortransportation.
About 80 percent of the growth in petroleum use inthe forecast is attributable to the transportationsector. In addition, a shift in consumption patternsis expected within the transportation sector. Gaso-line, which represented 66 percent of transportationpetroleum consumption by volume in 1995, shrinksto a 60-percent share in 2015, as alternative fuelspenetrate transportation markets. The share fordiesel rises from 17 percent to 18 percent, and thejet fuel share rises from 13 percent to 16 percent.
In the low oil price case, a shift in petroleum con-sumption patterns is also seen, with residual fueluse rising from the 1995 level of 0.9 million barrelsper day to 1.6 million in 2015. More competitive oilprices in this case cause electric utilities and othergenerators to use more residual fuel to fire boilers,displacing a portion of the natural gas and coal useseen in the other cases.
Crude Oil Costs and Taxes DominateRefined Petroleum Product Prices
1995 2015
0.0
0.2
0.4
0.6
0.8
1.0
1.2
0.0
-0.2
Gasoline
ResidualMarketingcosts
Diesel
Taxes
Processcosts
Crude oilcosts
Heating oil}
}}}
Jet fuel
Figure 97. Components of refined product costs,1995 and 2015 (1995 dollars per gallon)
Refined product prices in the forecast continue to bedominated by crude oil costs (Figure 97). However,changes are projected in refining process costs,marketing costs, and taxes. State motor fuels taxesare assumed to keep up with inflation, as they havein the past. Federal taxes, which have increasedsporadically in the past, are assumed to remain atnominal 1995 levels; the result is a decline ininflation-adjusted Federal taxes, which dampens thegrowth of gasoline and diesel prices. In contrast,Federal taxes on jet fuel show a real increase, witha tax of 4.3 cents per gallon beginning in 1996 asmandated in the Omnibus Budget Reconciliation Actof 1993. A similar tax was levied on other fuels in1993.
The AEO97 projections of product prices reflectinvestments related to compliance with refineryemissions, health, and safety regulations. These in-vestments add 1 to 3 cents to the processing costs oflight products (gasoline, distillate, jet fuel, kerosene,and liquefied petroleum gases).
The marketing cost of heating oil (the difference be-tween wholesale and retail prices) is projected to behigher than in 1995 throughout the forecast. Mar-keting costs, which were at a historical low in 1995,are assumed to return to more normal levels in theforecast.
66 Energy Information Administration/ Annual Energy Outlook 1997
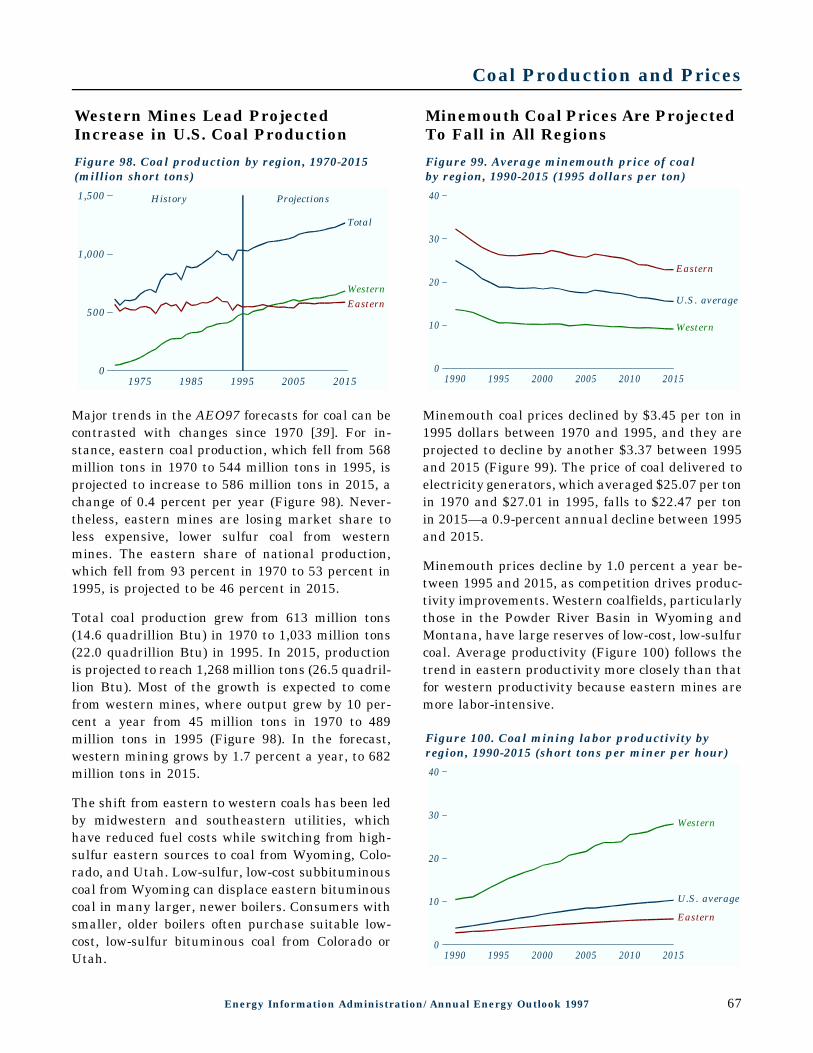
Coal Production and Prices
Western Mines Lead ProjectedIncrease in U.S. Coal Production
1975 1985 1995 2005 20150
500
1,000
1,500
EasternWestern
Total
History Projections
Figure 98. Coal production by region, 1970-2015(million short tons)
Major trends in the AEO97 forecasts for coal can becontrasted with changes since 1970 [39]. For in-stance, eastern coal production, which fell from 568million tons in 1970 to 544 million tons in 1995, isprojected to increase to 586 million tons in 2015, achange of 0.4 percent per year (Figure 98). Never-theless, eastern mines are losing market share toless expensive, lower sulfur coal from westernmines. The eastern share of national production,which fell from 93 percent in 1970 to 53 percent in1995, is projected to be 46 percent in 2015.
Total coal production grew from 613 million tons(14.6 quadrillion Btu) in 1970 to 1,033 million tons(22.0 quadrillion Btu) in 1995. In 2015, productionis projected to reach 1,268 million tons (26.5 quadril-lion Btu). Most of the growth is expected to comefrom western mines, where output grew by 10 per-cent a year from 45 million tons in 1970 to 489million tons in 1995 (Figure 98). In the forecast,western mining grows by 1.7 percent a year, to 682million tons in 2015.
The shift from eastern to western coals has been ledby midwestern and southeastern utilities, whichhave reduced fuel costs while switching from high-sulfur eastern sources to coal from Wyoming, Colo-rado, and Utah. Low-sulfur, low-cost subbituminouscoal from Wyoming can displace eastern bituminouscoal in many larger, newer boilers. Consumers withsmaller, older boilers often purchase suitable low-cost, low-sulfur bituminous coal from Colorado orUtah.
Minemouth Coal Prices Are ProjectedTo Fall in All Regions
1990 1995 2000 2005 2010 20150
10
20
30
40
U.S. average
Western
Eastern
Figure 99. Average minemouth price of coalby region, 1990-2015 (1995 dollars per ton)
Minemouth coal prices declined by $3.45 per ton in1995 dollars between 1970 and 1995, and they areprojected to decline by another $3.37 between 1995and 2015 (Figure 99). The price of coal delivered toelectricity generators, which averaged $25.07 per tonin 1970 and $27.01 in 1995, falls to $22.47 per tonin 2015—a 0.9-percent annual decline between 1995and 2015.
Minemouth prices decline by 1.0 percent a year be-tween 1995 and 2015, as competition drives produc-tivity improvements. Western coalfields, particularlythose in the Powder River Basin in Wyoming andMontana, have large reserves of low-cost, low-sulfurcoal. Average productivity (Figure 100) follows thetrend in eastern productivity more closely than thatfor western productivity because eastern mines aremore labor-intensive.
1990 1995 2000 2005 2010 20150
10
20
30
40
U.S. average
Western
Eastern
Figure 100. Coal mining labor productivity byregion, 1990-2015 (short tons per miner per hour)
Energy Information Administration/ Annual Energy Outlook 1997 67

Coal Mining Labor Productivity
Continuing Increases in ProductivityAre Projected To Reduce Labor Costs
1970 1975 1985 1995 2005 20150
10
20
30
40Coal wagesValue of coal
Figure 101. Labor cost component of minemouthcoal prices, 1970-2015 (billion 1995 dollars)
Gains in coal mine labor productivity will beachieved as a result of technology improvements,economies of scale, and better mine design. At thenational level, however, average labor productivitywill be influenced as much by changing regional pro-duction patterns as by technology advances, as themarket share of more productive western minesgrows. After 2005, the demand for lower sulfur coalwill require mining of thinner, deeper seams in east-ern mines, and productivity improvements in thatregion are expected to slow.
Slower productivity gains in eastern low-sulfur coalmining during the second decade of the forecastcause more consumers to turn to western low-sulfursupplies, except in States separated from westernmines by the coalfields in the Appalachian moun-tains. Eastern seaboard consumers are partially pro-tected from rising prices by their access to importedlow-sulfur coal. Caught between low-cost westernand imported coal supplies, eastern producers mayfind few chances to recoup the investments requiredto open new low-sulfur coal mines.
Wages are assumed to remain flat in 1995 dollars aslabor demand declines. While productivity improvedbetween 1970 and 1995, the number of miners fellby 1.9 percent a year, and a further decline of 2.2percent a year is expected through 2015 (Figure101). Thus, the contribution of wages to minemouthcoal prices is projected to decline to 12 percent in2015, as compared with the historical decline from31 percent to 18 percent between 1970 and 1995.
Labor Productivity Assumptions AreKey to Production, Price Forecasts
1995 2000 2005 2010 2015 10
5
10
15
20
25
Reference caseHigh productivity
Low productivity
Figure 102. Average minemouth coal pricesin three cases, 1995-2015 (1995 dollars per ton)
Assumptions about the rates of labor productivitychange are key determinants of national prices andproduction, particularly as they affect eastern andwestern market shares. Alternative cases were usedto explore the sensitivity of coal prices to changes inwages and in labor productivity improvement rates.
In the reference case, eastern labor productivity in-creases by 2.7 percent a year through 2015 andwestern productivity by 3.5 percent a year (Figure102). In the high productivity case, a 6.7-percentannual improvement is projected, resulting in a2015 national average minemouth price of $14.41per ton (6.8 percent below the reference case price).The low productivity case, which assumes a 0.1-per-cent annual decline in productivity, yields a 2015minemouth price of $18.26 per ton (18.1 percentabove the price in the reference case).
The reference case assumes unchanging wages forminers (in 1995 dollars). For comparison, the highwage case projects a real increase of 0.5 percent ayear and a 2015 minemouth price of $16.44 per ton,6.3 percent above the reference case. In the lowwage case, wages are assumed to fall by 0.5 percenta year, reducing the 2015 minemouth price to $14.55per ton (5.9 percent below wages in the referencecase). Delivered coal prices vary by similar amounts,but distribution patterns are not significantly affect-ed. Domestic demand was held constant in the alter-native cases, but coal exports varied by plus andminus 3 million tons in response to changes in U.S.prices.
68 Energy Information Administration/ Annual Energy Outlook 1997
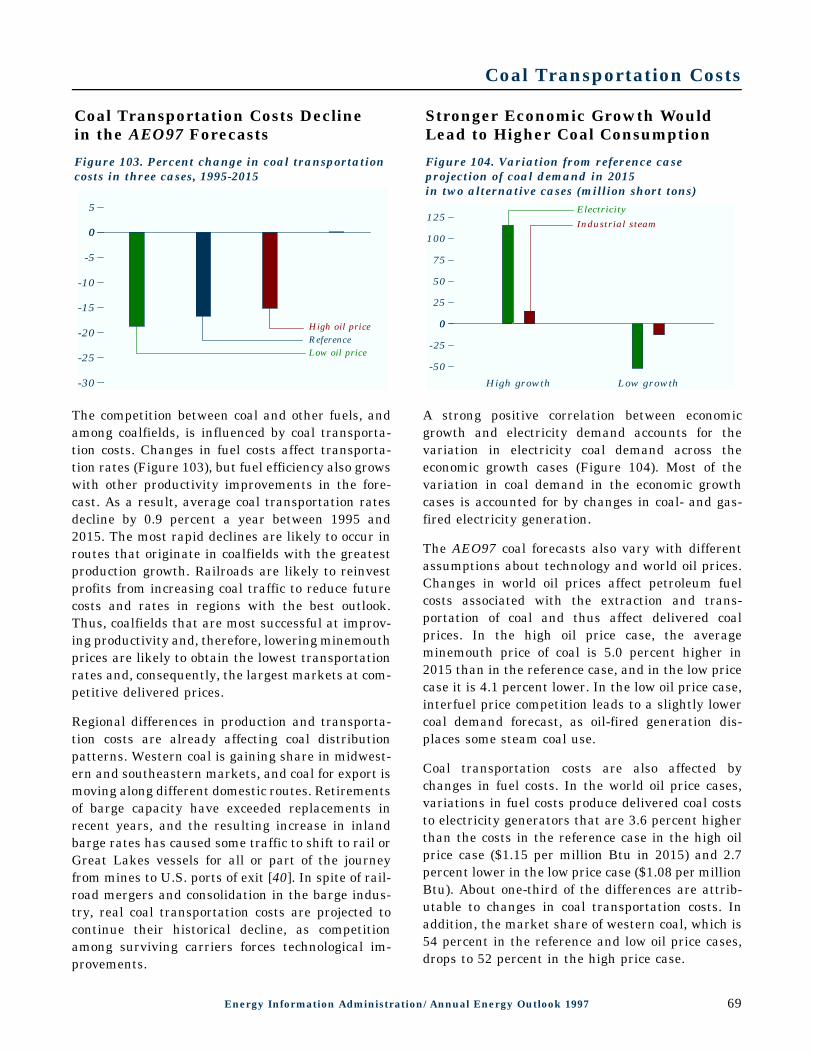
Coal Transportation Costs
Coal Transportation Costs Declinein the AEO97 Forecasts
0
5
0
-5
-10
-15
-20
-25
-30
Low oil priceReferenceHigh oil price
Figure 103. Percent change in coal transportationcosts in three cases, 1995-2015
The competition between coal and other fuels, andamong coalfields, is influenced by coal transporta-tion costs. Changes in fuel costs affect transporta-tion rates (Figure 103), but fuel efficiency also growswith other productivity improvements in the fore-cast. As a result, average coal transportation ratesdecline by 0.9 percent a year between 1995 and2015. The most rapid declines are likely to occur inroutes that originate in coalfields with the greatestproduction growth. Railroads are likely to reinvestprofits from increasing coal traffic to reduce futurecosts and rates in regions with the best outlook.Thus, coalfields that are most successful at improv-ing productivity and, therefore, lowering minemouthprices are likely to obtain the lowest transportationrates and, consequently, the largest markets at com-petitive delivered prices.
Regional differences in production and transporta-tion costs are already affecting coal distributionpatterns. Western coal is gaining share in midwest-ern and southeastern markets, and coal for export ismoving along different domestic routes. Retirementsof barge capacity have exceeded replacements inrecent years, and the resulting increase in inlandbarge rates has caused some traffic to shift to rail orGreat Lakes vessels for all or part of the journeyfrom mines to U.S. ports of exit [40]. In spite of rail-road mergers and consolidation in the barge indus-try, real coal transportation costs are projected tocontinue their historical decline, as competitionamong surviving carriers forces technological im-provements.
Stronger Economic Growth WouldLead to Higher Coal Consumption
High growth Low growth
0
25
50
75
100
125
0
-25
-50
Industrial steam
Electricity
Figure 104. Variation from reference caseprojection of coal demand in 2015in two alternative cases (million short tons)
A strong positive correlation between economicgrowth and electricity demand accounts for thevariation in electricity coal demand across theeconomic growth cases (Figure 104). Most of thevariation in coal demand in the economic growthcases is accounted for by changes in coal- and gas-fired electricity generation.
The AEO97 coal forecasts also vary with differentassumptions about technology and world oil prices.Changes in world oil prices affect petroleum fuelcosts associated with the extraction and trans-portation of coal and thus affect delivered coalprices. In the high oil price case, the averageminemouth price of coal is 5.0 percent higher in2015 than in the reference case, and in the low pricecase it is 4.1 percent lower. In the low oil price case,interfuel price competition leads to a slightly lowercoal demand forecast, as oil-fired generation dis-places some steam coal use.
Coal transportation costs are also affected bychanges in fuel costs. In the world oil price cases,variations in fuel costs produce delivered coal coststo electricity generators that are 3.6 percent higherthan the costs in the reference case in the high oilprice case ($1.15 per million Btu in 2015) and 2.7percent lower in the low price case ($1.08 per millionBtu). About one-third of the differences are attrib-utable to changes in coal transportation costs. Inaddition, the market share of western coal, which is54 percent in the reference and low oil price cases,drops to 52 percent in the high price case.
Energy Information Administration/ Annual Energy Outlook 1997 69

Coal Consumption
Electricity Generation DeterminesProjected Increase in Total Coal Use
1975 1985 1995 2005 20150
300
600
900
1,200
Electricity
Other
TotalHistory Projections
Figure 105. Electricity and other coal consumption,1970-2015 (million short tons per year)
Domestic coal demand rises by 197 million tons inthe forecast, from 959 million tons in 1995 to 1,156million tons in 2015 (Figure 105), because of growthin coal use for electricity generation. Coal demand inother domestic end-use sectors increases by 5 milliontons, as reduced coking coal consumption is offset bycoal demand for industrial cogeneration.
Coal consumption for electricity generation (exclud-ing industrial cogeneration but including indepen-dent power producers) rises from 847 million tons in1995 to 1,039 million tons in 2015, due to increasedutilization of existing generation capacity and, inlater years, additions of new capacity. The averageutilization rate for coal-fired power plants increasesfrom 63 to 74 percent between 1995 and 2015. Coalconsumption (in tons) per kilowatthour of generationis higher for subbituminous and lignite coals thanfor bituminous coal. Thus, the shift to western coalincreases the tonnage per kilowatthour of generationin midwestern and southeastern regions. In theEast, generators shift from higher to lower sulfurAppalachian bituminous coals that contain moreenergy (Btu) per short ton.
Although coal maintains its fuel cost advantage overboth oil and natural gas, gas-fired generation is themost economical choice for new power generationthrough 2010 when capital, operating, and fuel costsare considered. Between 2010 and 2015, rising natu-ral gas costs and nuclear retirements are projectedto cause increasing demand for coal-fired baseloadcapacity.
Offsetting Changes Are Projected forIndustrial Steam and Coking Coal Use
1995 2000 20150
20
40
60
80
100 Industrial
Coking
Residential/commercial
Figure 106. Non-electricity coal consumptionby sector, 1995, 2000, and 2015 (million short tons)
In the non-electricity sectors, an increase of 18million tons in industrial steam coal consumptionbetween 1995 and 2015 (1.1-percent annual growth)is offset by a decrease of 13 million tons in cokingcoal consumption (Figure 106). Increasing consump-tion of industrial steam coal results primarily fromincreased use of coal in the chemical and food-processing industries and from increased use of coalfor cogeneration (the production of both electricityand usable heat for industrial processes).
The projected decline in domestic consumption ofcoking coal results from the displacement of rawsteel production from integrated steel mills (whichuse coal coke for energy and as a material input) byincreased production from minimills (which use elec-tric arc furnaces that require no coal coke) and byincreased imports of semi-finished steels. Theamount of coke required per ton of pig iron producedis also declining, as process efficiency improves andinjection of pulverized steam coal is used increasing-ly in blast furnaces. Domestic consumption of cokingcoal is projected to fall by 2.4 percent a year through2015. Domestic production of coking coal declinesslightly faster, as consumption of imported cokingcoal continues its historical slow increase.
While delivered energy consumption in the residen-tial and commercial sectors grows by 0.8 percent and0.9 percent a year, respectively, most of the growthis captured by electricity and natural gas. Coal con-sumption in these sectors remains constant, account-ing for less than 1 percent of total U.S. coal demand.
70 Energy Information Administration/ Annual Energy Outlook 1997

Coal Exports
U.S. Coal Exports to Europe, Asia, andthe Americas Are Projected To Rise
1995 2000 20150
25
50
75
100
Europe
Asia
Americas
Figure 107. U.S. coal exports by destination,1995, 2000, and 2015 (million short tons)
U.S. coal exports rise in the forecast from 89 milliontons in 1995 to 121 million in 2015 (Figure 107), asa result of higher demand for steam coal imports inEurope. Exports of metallurgical coal remain flatbetween 1995 and 2015, at 52 million tons a year.Metallurgical exports to other regions do not in-crease significantly, since worldwide trade in metal-lurgical coal remains essentially unchanged.
U.S. steam coal exports to Europe increase from 23million tons in 1995 to 47 million in 2015 (3.5-per-cent annual growth). Steam coal imports to Europefrom all sources rise by 1.6 percent a year, from 120million tons in 1995 to 166 million tons in 2015.Reduction of subsidies for European coal producersfosters more imports, but environmental considera-tions restrain growth in electricity sector coal de-mand and, consequently, steam coal imports.
U.S. coal exports to Asia increase by 0.9 percent ayear, from 18 million tons in 1995 to 22 million tonsin 2015, with metallurgical exports decreasing by0.4 percent and steam coal exports rising by 2.3 per-cent annually. Coal imports to Asia from all sourcesrise in the forecast by 2.3 percent a year, from 248million tons in 1995 to 394 million tons in 2015. Theincrease is made up mostly of steam coal exports,which increase by 3.6 percent a year as Pacific Rimnations without indigenous fossil resources baseelectricity generation on imported coal. Most of thegrowth in Asian imports is projected to be suppliedby Australia, South Africa, and Indonesia.
Clean Air Standards PromoteLow-Sulfur Coal Use for Electricity
1995 2000 20150
200
400
600
800
High-sulfur
Low-sulfur
Medium-sulfur
Figure 108. Coal distribution by sulfur content,1995, 2000, and 2015 (million short tons)
Phase 1 of the Clean Air Act Amendments of 1990,which began in 1995, requires that 261 coal-firedgenerators reduce their emissions to about 2.5pounds of sulfur dioxide per million Btu of fuelinput. Beginning on January 1, 2000, Phase 2 im-poses a permanent cap on sulfur dioxide emissions,at an average level of 1.2 pounds per million Btu ofheat input for all units built before 1990.
Generators have five options for bringing coal-firedunits into compliance: (1) retrofitting with flue gasdesulfurization equipment, (2) boiler repoweringwith new technologies that emit less sulfur dioxide,(3) transfer or purchase of emissions allowances, (4)reduction of plant utilization, and (5) full or partialswitching to lower sulfur fuels. Between 1995 and2015, compliance strategies for Phases 1 and 2 areprojected to reduce the composite sulfur content ofall coal produced (Figure 108). While low-sulfur coaldisplaces high-sulfur coal throughout the forecast,high-sulfur coal displaces more expensive medium-sulfur coal as compliance strategies shift from fuelswitching to flue gas desulfurization in Phase 2.
A decision to regulate air toxic emissions couldrequire utilities to install equipment for removingthem from combustion gases. On the supply side,such regulation might result in interregional switch-ing to coals with lower levels of toxic trace elements.Either approach is likely to encourage more inten-sive coal preparation to reduce the content of severalair toxic elements associated with sulfide mineralsin coal ash.
Energy Information Administration/ Annual Energy Outlook 1997 71

Carbon Emissions and Energy Use
Continued Increase Is Projectedfor Overall U.S. Carbon Emissions
1990 1995 2000 2005 2010 2015 00
500
1,000
1,500
2,000
Industrial
Commercial
Residential
Transportation}}}}
Figure 109. Carbon emissions by sector, 1990-2015(million metric tons per year)
Carbon emissions from energy use are projected toincrease by an average of 1.2 percent a year from1995 to 2015, reaching 1,799 million metric tons(Figure 109). This is slightly higher than the AEO96projection, due to higher energy consumption and areduced share of renewable fuels in the projections.
Increasing concentrations of greenhouse gases—carbon dioxide, methane, nitrous oxide, and others—may increase the Earth’s temperature and, in turn,affect the climate. The AEO97 projections includeanalysis of the Climate Change Action Plan (CCAP),developed by the Clinton Administration to stabilizeU.S. greenhouse gas emissions by 2000 at 1990levels. Emissions from fuel combustion, the primarysource of carbon emissions, were about 1,340 millionmetric tons in 1990. The analysis includes only fuelcombustion and does not account for sinks thatabsorb carbon. The analysis does not include the 13CCAP actions that are not related to energy fuels,nor does it include any future mitigation actionsthat may be proposed.
Emissions in the 1990s have grown more rapidlythan projected at the time the plan was formulated,partly due to moderate energy price increases andhigher economic growth, which have led to higherenergy demand. In addition, some CCAP programshave been curtailed. Additional carbon mitigationprograms, technology improvements, or more rapidadoption of voluntary programs could result in loweremissions levels than projected here.
Slower Rise in Per Capita EmissionsFails To Offset Population Growth
1990 1995 2000 2005 2010 20155.0
5.2
5.4
5.6
5.8
6.0
Figure 110. Carbon emissions per capita, 1990-2015(metric tons per person)
U.S. carbon emissions from energy use are projectedto grow at an average annual rate of 1.2 percent;however, per capita emissions grow by only 0.3percent a year (Figure 110). To achieve stabilizationof total emissions, population growth would need tobe offset by reductions in per capita emissions.
Emissions in the residential sector, including emis-sions from the generation of electricity used in thesector, are projected to increase by 1.2 percent ayear, reflecting the ongoing trends of electrificationand penetration of new appliances and services. Sig-nificant growth in office equipment and other usesis also projected in the commercial sector, butgrowth in consumption—and in emissions, whichincrease by 1.0 percent a year—is likely to be mod-erated by slow growth in floorspace, coupled withefficiency standards, voluntary efficiency programs,and technology improvements. Transportation emis-sions grow at an average annual rate of 1.4 percentas a result of increases in vehicle-miles traveled andair travel, combined with slow growth in the averagelight-duty fleet efficiency. Industrial emissions areprojected to grow by only 1.0 percent a year, asshifts to less energy-intensive industries andefficiency gains moderate growth in energy use.
Further reductions in emissions could result fromClimate Wise and Climate Challenge, voluntaryprograms for emissions reductions by industry andelectric utilities, which are cosponsored by the U.S.Environmental Protection Agency (EPA) and theU.S. Department of Energy.
72 Energy Information Administration/ Annual Energy Outlook 1997

Carbon Emissions and Energy Use
Petroleum, Coal Are the LeadingEnergy Sources of Carbon Emissions
1990 1995 2000 2005 2010 20150
500
1,000
1,500
2,000
Coal
Natural gas
Petroleum
}}
}
Figure 111. Carbon emissions by fuel, 1990-2015(million metric tons per year)
Petroleum products are the leading source of carbonemissions from energy use. In 2015, petroleum isprojected to contribute 747 million metric tons ofcarbon to the total 1,799 million tons, a 42-percentshare (Figure 111). Nearly 80 percent (587 millionmetric tons) of the petroleum emissions result fromtransportation use, which could be lower with lesstravel or more rapid development and adoption ofhigher efficiency or alternative-fuel vehicles.
Coal is the second leading source of carbonemissions, projected to produce 607 million metrictons in 2015, or 34 percent of the total. The sharedeclines from 36 percent in 1995 because coalconsumption increases at a slower rate through 2015than consumption of petroleum and natural gas, thesources of virtually all other energy-related carbonemissions. Most of the increases in coal emissionsresult from electricity generation. A slight increasein emissions from industrial steam coal use is offsetby a decline in emissions from coking coal.
In 2015, natural gas use is projected to produce 444million metric tons of carbon emissions, a 25-percentshare. Of the fossil fuels, natural gas consumptionand emissions increase most rapidly through 2015,at an average annual rate of 1.7 percent. However,natural gas produces only about half the carbonemissions of coal per unit of input. Average emis-sions from petroleum use are between those for coaland natural gas. The use of renewable fuels andnuclear generation, which emit little or no carbon,mitigates the growth of emissions.
Coal Is the Main Source of CarbonEmissions from Electricity Generation
1990 1995 2000 2005 2010 20150
100
200
300
400
500
600
700
Coal
Natural gasPetroleum
}}
Figure 112. Carbon emissions from electricitygeneration by fuel, 1990-2015(million metric tons per year)
Electricity use is a major cause of carbon emissions.Although electricity produces no emissions at thepoint of use, its generation currently accounts for 36percent of total carbon emissions, and that share isexpected to increase to 38 percent in 2015. Coal,which accounts for about 50 percent of electricitygeneration in 2015 (excluding cogeneration), pro-duces 80 percent of electricity-related carbon emis-sions (Figure 112). In 2015, gas-fired generationaccounts for 29 percent of total electricity but only18 percent of electricity-related carbon emissions.
Between 1995 and 2015, 38 gigawatts of nuclearcapacity are expected to be retired, resulting in a 33-percent decline in nuclear generation. To compen-sate for the loss of baseload capacity and meet risingdemand, 294 gigawatts of new fossil-fueled capacity(excluding cogeneration) will be needed. Increasedgeneration from fossil fuels will raise carbon emis-sions by 172 million metric tons, or 34 percent, from1995 levels. Although the use of renewable tech-nologies grows, their intermittent nature preventsthem from compensating completely for the losses inbaseload nuclear capacity.
The projections include activities under the ClimateChallenge program, such as fuel switching, repower-ing, life extension, and demand-side management, tothe extent that such plans have been announced,but they do not include offset activities. Additionaluse of lower carbon fuels, reduced electricity demandgrowth, or improved technologies all could contributeto lower emissions than are projected here.
Energy Information Administration/ Annual Energy Outlook 1997 73

Emissions from Electricity Generation
Cap on Electricity Sulfur DioxideEmissions Is Expected To Be Met
1990 1995 2000 2005 2010 20150
2
4
6
8
10
12
14
16
Figure 113. Sulfur dioxide emissions fromelectricity generation, 1990-2015(million tons per year)
CAAA90 calls for emissions of sulfur dioxide (SO2)by electricity generators to be reduced to 12 millionshort tons in 1995 and to 8.9 million tons a year in2000 and thereafter. More than 95 percent of theSO2 produced by generators results from coalcombustion, with the rest from residual oil.
In Phase 1, 261 generating units at 110 plants wereissued tradeable emissions allowances permittingSO2 emissions to reach a fixed amount per year—generally less than the plant’s historical emissions.Allowances may also be banked for use in futureyears. Switching to lower sulfur, subbituminous coalwas the option chosen by more than half of the gen-erators. In Phase 2, beginning in 2000, emissionsconstraints on Phase 1 plants will be tightened, andlimits will be set for the remaining 2,500 boilers at1,000 plants. With allowance banking, emissions areexpected to decline from 10.5 million tons in 1995 to10.3 million in 2000 (Figure 113). Since allowanceprices are projected to increase after 2000, it isexpected that 23 gigawatts of capacity—about 77300-megawatt plants—will be retrofitted withscrubbers to achieve the Phase 2 goal (Table 12).
Table 12. Scrubber retrofits, allowance costs,and banked allowances, 2000-2015
Forecast 2000 2005 2010 2015
Cumulative retrofits from 1995(gigawatts of capacity) 0 0 22.9 22.9
Allowance costs(1995 dollars per ton SO2) 147 212 79 79
Cumulative banked allowances(million tons SO2) 7.5 2.5 0 0
Nitrogen Oxide EmissionsAre Reduced by New Regulations
1995 2000 2005 2010 20150
2
4
6
8
Figure 114. Nitrogen oxide emissions fromelectricity generation, 1995-2015(million tons per year)
CAAA90 also directed the EPA to study and issuestandards for nitrogen oxide (NOx) emissions, whichare precursors to acid rain and ground-level ozone.In response, EPA promulgated regulations that im-pose NOx emissions limits on electricity generators,based on specific boiler technologies. Combined withother NOx reduction programs, such as those formobile sources, the goal of the regulations is toreduce NOx emissions in 2000 by about 2 milliontons from what they would otherwise have been.Under current regulations, NOx emissions by elec-tricity generators are projected to decline by 1.4million tons between 1995 and 2015 (Figure 114).
There are two phases to the program to reduce NOxemissions from coal-fired plants, which produce mostof the NOx from electricity generation. In Phase 1,between 1996 and 1999, NOx emission limits areapplied to dry-bottom wall-fired and tangentially-fired boilers, designated as Group 1 boilers, by usingavailable control technologies. In Phase 2, whichbegins in 2000, the emissions limits on the Group 1boilers will be lowered slightly. In addition, in Phase2, limits will be set for Group 2 boilers, which arecoal-fired boilers that use other technologies.
Additional mitigation strategies could includevoluntary programs or an emissions allowanceprogram similar to that for SO2. Increased use ofother fossil and renewable fuels for generation ortechnology advances that increase efficiency orproduce less emissions could also reduce emissionsfrom those projected here.
74 Energy Information Administration/ Annual Energy Outlook 1997

Forecast Comparisons

Forecast Comparisons
Three other organizations—Data Resources, Inc.(DRI), the WEFA Group (WEFA), and the Gas Re-search Institute (GRI)—also produce comprehensiveenergy projections with a time horizon similar tothat of AEO97. The most recent projections fromthese organizations and others that concentrate onelectricity, petroleum, natural gas, and internationaloil markets are compared to the AEO97 projectionsin this section.
Economic Growth
Differences in long-run economic forecasts can betraced primarily to different views of the majorsupply-side determinants of growth: labor force andproductivity change. Other forecasts are presentedin Table 13. From an energy perspective, other fore-casters also include different views of energy prices:typically, lower energy prices are assumed for theoptimistic growth cases and higher energy prices forthe pessimistic cases. For AEO97, reference caseenergy prices are used for both the high and low eco-nomic growth cases. The WEFA forecast shows thehighest economic growth, including higher growthrates for both labor force participation and pro-ductivity. The AEO97 long-run forecast of economicgrowth is higher than the AEO96 forecast by 0.2percent, when compared on a similar basis, with aprojected annual growth rate for GDP of 1.9 percentfrom 1995 to 2015.
In the 1996 Economic Report of the President, real
Table 13. Forecasts of economic growth, 1995-2015Average annual percentage growth
Forecast Real GDP Labor force ProductivityAEO97
Low growth 1.4 0.7 0.7Reference 1.9 1.0 0.9High growth 2.4 1.2 1.2
DRILow 1.4 0.7 0.7Reference 1.9 1.0 0.9High 2.4 1.2 1.2
WEFAReference 2.2 1.2 1.3
GDP growth of 2.3 percent a year between 1995 and2002 was projected. AEO97 projects annual growthof 2.2 percent over the same period.
World Oil Prices
Comparisons with other oil price forecasts—includ-ing the International Energy Agency (IEA), Petro-
leum Economics Ltd. (PEL), and Petroleum IndustryResearch Associates, Inc. (PIRA)—are shown inTable 14. The range between the AEO97 low andhigh world oil price cases for 2010 and 2015 spansthe range of other published forecasts, and theAEO97 reference case prices are near the middle ofthe range for all the forecasts.
Table 14. Forecasts of world oil prices, 1995-20151995 dollars per barrel
Forecast 1995 2000 2005 2010 2015
AEO97 reference 17.26 18.20 19.72 20.41 20.98AEO97 high price 17.26 21.69 24.13 26.44 28.23AEO97 low price 17.26 14.08 14.08 14.03 13.99DRI 16.80 16.07 18.60 20.96 22.64DRI low 16.80 16.07 16.07 16.07 16.07IEA1 17.00 17.72 25.53 25.53 NAIEA2 17.00 17.72 17.36 17.36 NAPEL 16.75 17.00 20.00 20.00 NAPIRA 18.40 15.97 15.66 NA NAWEFA 17.23 17.96 19.91 22.04 24.14GRI 17.24 16.68 16.68 16.68 16.68
NA = not available.
Total Energy Consumption
The AEO97 forecast of end-use sector energy con-sumption over the next two decades shows far lessvolatility than has occurred historically. Between1974 and 1984, volatile world oil markets dampeneddomestic oil consumption. Consumers switched toelectricity-based technologies in the buildings sector,while in the transportation sector new car fuel effi-ciency nearly doubled. Natural gas use declined asa result of high prices and limitations on new gashookups. Between 1984 and 1995, however, bothpetroleum and natural gas consumption rebounded,bolstered by plentiful supplies and declining realenergy prices. As a consequence, new car fuel effi-ciency in 1995 was less than 2 miles per gallonhigher than in 1984, and natural gas use (residen-tial, commercial, and industrial) was almost 25percent higher than it was in 1984.
Given potentially different assumptions about, forexample, technological developments over the next20 years, the forecasts from DRI, GRI, and WEFAhave remarkable similarities to those in AEO97.Electricity is expected to remain the fastest growingsource of delivered energy (Table 15), although itsrate of growth is down sharply from historical ratesin each of the forecasts, because many traditional
76 Energy Information Administration/ Annual Energy Outlook 1997

Forecast Comparisons
Table 15. Forecasts of average annual growth ratesfor energy consumption (percent)
History Projections
Energy use1974-1984
1984-1995
AEO97(1995-2015)
DRI(1995-2015)
GRI(1995-2015)
WEFA(1995-2013)
Petroleum* -0.1 1.2 1.1 1.0 1.1 1.0Natural gas* -1.7 1.9 0.9 0.9 1.3 0.4Coal* -3.0 -1.4 0.3 0.9 -0.1 0.0Electricity 3.0 2.5 1.5 1.4 1.8 1.8Delivered energy -0.4 2.0 1.1 1.0 1.2 0.9Electricity losses 2.5 1.5 0.7 1.0 1.3 1.2Primary energy 0.2 1.8 1.0 1.0 1.2 1.0*Excludes consumption by electric utilities.
uses of electricity (such as for air conditioning)approach saturation while average equipment effi-ciencies rise. Growth in petroleum and natural gasconsumption also generally slows as overall popu-lation growth declines, the population ages, andeconomic expansion slows.
Residential and Commercial Sectors
Growth rates in energy demand for the residentialand commercial sectors are expected to decrease bymore than 50 percent from the rates between 1984and 1995, largely because of projected lower growthin population, housing starts, and commercial floor-space additions. Other contributing factors includeincreasing energy efficiency due to technical innova-tions and legislated standards; voluntary govern-ment efficiency programs; and reduced opportunitiesfor additional market penetration of such end usesas air conditioning in the residential sector andpersonal computers in the commercial sector, wherethey are already being used extensively.
Differing views on the growth of new uses for energycontribute to variations among the forecasts. Byfuel, electricity (excluding generation and trans-mission losses) remains the fastest growing energysource for both sectors across all forecasts (Table16). Natural gas use also grows but at lower rates,and petroleum use continues to fall.
Industrial Sector
In all the forecasts, the industrial sector showsslower growth in primary energy consumption thanit did between 1984 and 1995 (Table 17). The de-cline is attributable to lower growth for GDP andmanufacturing output. In addition, there has been
Table 16. Forecasts of average annual growth inresidential and commercial energy demand (percent)
History Projections
Forecast1984-1995
AEO97(1995-2015)
DRI(1995-2015)
GRI(1995-2015)
WEFA(1995-2013)
ResidentialPetroleum -0.1 -0.3 -1.0 -1.0 -0.3Natural gas 0.6 0.7 0.6 0.7 0.0Electricity 2.7 1.6 0.9 1.7 2.0Delivered energy 1.7 0.8 0.5 0.7 0.7Electricity losses 2.2 0.8 0.5 1.1 1.2Primary energy 1.9 0.8 0.5 0.9 1.0
CommercialPetroleum -5.1 -0.7 -1.5 -1.7 -0.5Natural gas 1.8 0.7 0.9 0.9 0.3Electricity 3.3 1.3 1.5 1.9 1.7Delivered energy 1.3 0.9 1.0 1.1 0.9Electricity losses 2.8 0.5 1.1 1.3 1.1Primary energy 2.1 0.7 1.1 1.2 1.0
a continuing shift in the industrial output mixtoward less energy-intensive products. The growthrates in the industrial sector for different fuels be-tween 1984 and 1995 reflect a shift from petroleumproducts and coal to a greater reliance on naturalgas and electricity. Natural gas use grows moreslowly than in recent history across the forecasts,because much of the potential for fuel switching wasrealized during the 1980s. A key uncertainty inindustrial coal forecasts is the environmentalacceptability of coal as a boiler fuel.
Table 17. Forecasts of average annual growth inindustrial energy demand (percent)
History Projections
Forecast1984-1995
AEO97(1995-2015)
DRI(1995-2015)
GRI(1995-2015)
WEFA(1995-2013)
Petroleum 0.7 0.9 1.2 1.3 0.7Natural gas 2.7 0.9 0.9 1.5 0.4Coal -1.2 0.3 1.0 0.0 0.0Electricity 1.7 1.5 1.8 2.0 1.6Delivered energy 2.3 1.0 1.1 1.3 0.7Electricity losses 0.7 0.7 1.3 1.4 1.0Primary energy 2.0 0.9 1.1 1.4 0.8
Transportation Sector
Overall fuel consumption in the transportation sec-tor is expected to grow more slowly than in the re-cent past in each of the alternative forecasts (Table18). All the forecasts anticipate continued rapidgrowth in air travel as well as significant increasesin aircraft efficiency, while growth in light-dutyvehicle travel slows considerably.
Energy Information Administration/ Annual Energy Outlook 1997 77

Forecast Comparisons
Table 18. Forecasts of average annual growth intransportation energy demand (percent)
History Projections
Forecast1975-1984
1984-1995
AEO97(1995-2015)
DRI(1995-2015)
GRI(1995-2015)
WEFA(1995-2013)
Consumption
Motor gasoline 0.1 1.4 0.8 0.6 0.6 0.8Diesel fuel 4.5 3.1 1.5 1.5 1.7 1.9Jet fuel 1.9 2.4 2.3 1.7 2.1 1.5Residual fuel 1.4 2.7 2.5 2.7 2.6 2.2All energy 0.9 1.9 1.4 1.2 1.3 1.2
Key indicators
Car and lighttruck travel 2.8 3.1 1.4 1.6 1.5 NAAir travel(revenuepassenger-miles) 7.0 5.6 3.2 4.1 3.1 NAAverage new carfuel efficiency 4.5 0.4 0.9 0.6 0.8 NAGasoline prices 1.8 -3.1 0.1 0.7 0.2 0.8NA = not available.
Electricity
Comparison across forecasts shows considerablevariation in projected electricity sales (Table 19).Sales projections for 2015 range from 1,256 billionkilowatthours (DRI) to 1,489 billion kilowatthours(WEFA) for the residential sector, as compared withthe AEO97 reference case value of 1,421 billion kilo-watthours. The forecasts for total electricity sales in2015 range from 3,989 billion kilowatthours (DRI) to4,342 billion kilowatthours (GRI), compared with4,044 billion kilowatthours in the AEO97 referencecase. Different assumptions governing expected eco-nomic activity, coupled with diversity in the esti-mation of penetration rates of energy-efficienttechnologies, are the primary reasons for variationamong the forecasts.
With the exception of WEFA, all the forecasts com-pared here agree that stable fuel prices and slowgrowth in electricity demand relative to GDP growthwill tend to keep the price of electricity stable—ordeclining in real terms—until 2015.
Both the DRI and GRI forecasts assume that theelectric power industry will be fully restructured,resulting in average electricity prices that approachlong-run marginal costs. AEO97 assumes that com-petitive pressures and FERC Orders 888 and 889will push average costs and prices down somewhat,but not to the extent that would be achieved under
a full restructuring of the industry. AEO97 assumesthat increased competition in the electric powerindustry will lead to lower operating and mainte-nance costs, lower general and administrative costs,lower fossil fuel prices, early retirement of inefficientgenerating units, and other cost reductions. Further,in the DRI forecast, it is assumed that time-of-useelectricity rates will cause some flattening of elec-tricity demand (lower peak period sales relative toaverage sales), resulting in better utilization ofcapacity and capital cost savings.
The distribution of sales among sectors affects themix of capacity types needed to satisfy sectoraldemand. Although the AEO97 mix of capacityamong fuels is similar to those in the other fore-casts, small differences in sectoral demands acrossthe forecasts lead to significant changes in capacitymix. For example, growth in the residential sector,coupled with an oversupply of baseload capacity,results in a need for more peaking and intermediatecapacity than baseload capacity. Consequently,generators are expected to plan for more combustionturbine and fuel cell technology than coal, oil, or gassteam capacity. With a higher projection of residen-tial demand growth than in most of the other fore-casts, AEO97 projects more oil and gas capacity in2015.
Natural Gas
The diversity among published forecasts of naturalgas prices, production, consumption, and imports(Table 20) indicates the uncertainty of future markettrends. The underlying assumptions that shape theforecasts should be considered when different pro-jections are compared. The forecasts for total naturalgas consumption in 2015 vary from a high of 31.95trillion cubic feet in the AEO97 high economicgrowth case to a low of 28.0 trillion cubic feet in theDRI forecast.
Both GRI and the American Gas Association (AGA)show a flat price forecast between 2010 and 2015,whereas the AEO97 reference case shows a slightrise during the same period, from $2.01 per thou-sand cubic feet in 2010 to $2.13 per thousand cubicfeet in 2015.
78 Energy Information Administration/ Annual Energy Outlook 1997

Forecast Comparisons
Table 19. Comparison of electricity forecasts (billion kilowatthours, except where noted)
Projection
AEO97 Other forecasts
ReferenceLow
economicgrowth
Higheconomicgrowth
WEFAa GRI DRI
2010
Average end-use price(1995 cents per kilowatthour) 6.40 6.20 6.60 7.30 5.58 5.30
Residential 7.80 7.50 8.00 8.50 6.75 6.60Commercial 7.20 6.80 7.40 8.00 6.26 5.70Industrial 4.50 4.30 4.60 5.20 3.91 3.90
Net energy for load 4,066 3,879 4,309 4,183 4,417 4,274Coal 1,942 1,881 2,058 2,156 2,248 2,073Oil 58 56 60 89 53 66Natural gas 892 775 1,008 496 538 487Nuclear 614 614 614 656 645 659Hydroelectric/otherb 368 364 375 269 305 306Nonutility sales to gridc 161 158 164 491 548 653Net imports 31 31 31 27 80 31
Electricity sales 3,784 3,611 4,011 3,913 4,073 3,777Residential 1,307 1,251 1,366 1,401 1,351 1,194Commercial/otherd 1,188 1,181 1,235 1,232 1,291 1,206Industrial 1,289 1,181 1,409 1,280 1,432 1,377
Capability (gigawatts)e 921.7 883.6 968.8 994.0 940.4 903.0Coal 313.3 307.4 327.0 443.9 364.0 351.8Oil and gas 394.8 363.5 425.9 333.2 346.5 329.0Nuclear 88.9 88.9 88.9 99.1 101.6 105.3Hydroelectric/otherb 124.8 123.7 127.2 117.8 128.3 116.8
2015
Average end-use price(1995 cents per kilowatthour) 6.30 6.00 6.50 7.30 5.40 5.30
Residential 7.60 7.20 7.80 8.60 6.56 6.60Commercial 6.90 6.50 7.20 8.10 5.99 5.60Industrial 4.30 4.00 4.50 5.30 3.27 3.90
Net energy for load 4,329 4,060 4,677 4,418 4,705 4,511Coal 2,052 1,948 2,287 2,339 2,474 2,269Oil 64 59 73 86 64 79Natural gas 1,184 1,042 1,267 473 599 539Nuclear 448 448 448 656 431 444Hydroelectric/otherb 391 377 407 269 313 307Nonutility sales to gridc 163 159 168 569 744 841Net imports 27 27 27 27 79 32
Electricity sales 4,044 3,793 4,371 4,132 4,342 3,989Residential 1,421 1,339 1,504 1,489 1,448 1,256Commercial/otherd 1,269 1,256 1,340 1,299 1,395 1,307Industrial 1,354 1,198 1,527 1,344 1,499 1,426
Capability (gigawatts)e 969.6 914.8 1,038.3 1,056.3 970.9 938.0Coal 324.9 312.9 359.1 506.6 410.1 388.4Oil and gas 452.6 412.1 482.6 332.8 356.9 361.1Nuclear 62.7 62.7 62.7 99.1 69.1 72.3Hydroelectric/otherb 129.4 127.0 133.9 117.8 134.3 116.3
aWEFA forecasts for 2013 are shown here for the year 2015.b“Other” includes conventional hydroelectric, geothermal, wood, wood waste, municipal solid waste, other biomass, solar and wind power,
plus a small quantity of petroleum coke. For nonutility generators, “other” also includes waste heat, blast furnace gas, and coke oven gas.cFor AEO97, includes only net sales from cogeneration; for the other forecasts, also includes nonutility sales to the grid.d“Other” includes sales of electricity to government, railways, and street lighting authorities.eFor DRI and GRI, “capability” represents nameplate capacity; for the others, “capability” represents net summer capability.Sources: AEO97: AEO97 National Energy Modeling System, runs AEO97B.D100296K (reference case), LMAC97.D100396A (low
economic growth case), and HMAC97.D100296A (high economic growth case). WEFA: The WEFA Group, U.S. Energy Report (Spring-Summer 1996). GRI: Gas Research Institute, GRI Baseline Projection of U.S. Energy Supply and Demand, 1997 Edition (August 1996).DRI: DRI/McGraw-Hill, World Energy Service: U.S. Outlook, Spring-Summer 1996 (April 1996).
Energy Information Administration/ Annual Energy Outlook 1997 79

Forecast Comparisons
Table 20. Comparison of natural gas forecasts (trillion cubic feet, except where noted)
Projection
AEO97 Other forecasts
ReferenceLow
economicgrowth
Higheconomicgrowth
WEFA GRI DRI AGA
2010
Lower 48 wellhead price(1995 dollars per thousand cubic feet) 2.01 1.81 2.23 2.43 1.65 2.22 2.10a
Dry gas production 24.25 22.75 26.00 21.68 24.15 23.39 23.01
Net imports 3.92 3.92 3.92 3.81 3.59 3.65 3.75
Consumption 28.01 26.52 29.75 25.58 28.03 26.69 26.76
Residential 5.42 5.22 5.62 4.75 5.33 5.27 6.07Commercial 3.44 3.41 3.56 3.18 3.49b 3.44 3.50Industrialb 9.56 9.14 10.02 9.76 12.12c 10.71 9.95Electricity generators 6.94 6.23 7.72 4.96 5.72 4.50 4.97Other 2.65c 2.52c 2.83c 2.52c 1.36 2.76c 2.27c
End-use prices(1995 dollars per thousand cubic feet)
Residential 5.43 5.25 5.62 6.97 5.52 6.66 5.71Commercial 4.64 4.42 4.86 5.87 4.56b 5.54 4.78Industrialb 2.69 2.46 2.93 3.76 2.32 3.47d 2.42Electricity generators 2.38 2.17 2.62 2.74 2.03 2.62 2.33Transportation 6.93 6.71 7.17 NA NA NA NA
2015
Lower 48 wellhead price(1995 dollars per thousand cubic feet) 2.13 1.83 2.49 NA 1.65 2.38 2.10a
Dry gas production 26.10 24.29 27.89 NA 26.48 24.54 24.39
Net imports 4.23 4.23 4.23 NA 3.49 3.82 3.75
Consumption 30.16 28.35 31.95 NA 30.16 28.00 28.14
Residential 5.57 5.31 5.83 NA 5.53b 5.48 6.29Commercial 3.55 3.51 3.73 NA 3.69b 3.55 3.51Industrialb 9.65 9.10 10.23 NA 13.00c 11.29 9.73Electricity generators 8.52 7.74 9.11 NA 6.40 4.60 6.09Other 2.86c 2.69c 3.05c NA 1.55 3.08c 2.50c
End-use prices(1995 dollars per thousand cubic feet)
Residential 5.33 5.05 5.64 NA 5.36 6.72 5.54Commercial 4.61 4.27 4.95 NA 4.45b 5.62 4.70Industrialb 2.82 2.48 3.20 NA 2.31 3.62d 2.39Electricity generators 2.52 2.19 2.88 NA 2.01 2.76 2.28Transportation 7.27 6.95 7.63 NA NA NA NA
aAverage acquisition price.bincludes gas consumed in cogeneration.cIncludes lease and plant fuels.dOn-system sales.NA = Not available.Sources: AEO97: AEO97 National Energy Modeling System, runs AEO97B.D100296K (reference case), LMAC97.D100396A (low
economic growth case), and HMAC97.D100296A (high economic growth case). WEFA: The WEFA Group, U.S. Energy Report (Spring-Summer 1996). GRI: Gas Research Institute, GRI Baseline Projection of U.S. Energy Supply and Demand, 1997 Edition (August 1996).DRI: DRI/McGraw-Hill, World Energy Service: U.S. Outlook, Spring-Summer 1996 (April 1996). AGA: American Gas Association, 1996AGA-TERA Base Case (August 1996).
80 Energy Information Administration/ Annual Energy Outlook 1997

Forecast Comparisons
Petroleum
The AEO97 high and low world oil price cases boundthe 2010 and 2015 results of five other petroleumforecasts (Table 21)—the AEO97 reference case,WEFA, GRI, DRI, and Independent Petroleum Asso-ciation of America (IPAA). The AEO97 high pricecase has the highest oil prices and domestic produc-tion in 2015 and the third lowest petroleum demandof the seven forecasts. Conversely, the AEO97 lowprice case has the lowest oil prices and productionand the highest demand.
The percentage of petroleum consumption from im-ports, which is an indicator of the relative directionof production, net imports, and consumption, rangesbetween 53 percent in the high price case and 67percent in the low price case in 2010. The range isbetween 51 percent and 68 percent for the high andlow oil price cases in 2015.
The AEO97 reference case for petroleum is mostsimilar to the DRI projections. The AEO97 referencecase projection shows the percentage of U.S. con-sumption from imports at 60 percent in 2010 and 61percent in 2015, compared with 58 percent and 60percent, respectively, in the DRI forecast. WEFA,which projects lower petroleum demand, shows 62percent of consumption supplied by imports in 2010.The WEFA forecast does not extend to 2015.
Other than the AEO97 high price case, GRI andIPAA project the lowest percentage of imports, withprojections of 57 percent and 56 percent, respective-ly, for 2010 and, in the GRI projections, 55 percentfor 2015. The IPAA forecast ends in 2010. Distin-guishing factors of the GRI forecasts are oil priceslower than those in all but the AEO97 low oil pricecase and domestic production higher than in all butthe AEO97 high price case. The import shares in theIPAA forecast are the result of relatively low petro-leum consumption—similar to that in the AEO97high price case—coupled with domestic productionin the range of the AEO97 reference case and DRI.
Coal
GRI, DRI, and WEFA project coal production in2010 at levels more comparable with that in theAEO97 high growth case than that in the referencecase, primarily due to higher forecasts of electricitysector coal consumption after 2000. In the GRI fore-
cast, the delivered price to electric utilities is $0.01per million Btu lower than that in the AEO97 highgrowth case, while consumption is projected to be 23million tons higher. However, in the DRI forecast,the delivered price to electric utilities is $0.10 permillion Btu lower than in the AEO97 high growthcase, although electricity coal consumption, whenadjusted to include 9 million tons consumed by in-dependent power producers, is 7 million tons lowerthan in the AEO97 high growth case. In the WEFAforecast for 2010, electricity consumption is 111million tons higher than in the AEO97 high growthcase due to projected consumption by nonutility gen-erators of 98 million tons. WEFA’s delivered price tothe electricity sector is $0.19 per million Btu higherthan the price in any other forecast.
All the other forecasts include lower projections ofnet coal exports in 2010 and higher forecasts ofdomestic coking coal consumption due to less rapidretirement of existing coke oven capacity. The threeAEO97 cases nearly bracket the other projectedlevels of industrial/other coal consumption in theother forecasts (after adjusting the DRI forecastdownward to exclude the consumption of indepen-dent power producers).
DRI reports 2015 values with approximately thesame relative differences from the AEO97 highgrowth case forecast as in 2010. DRI’s total produc-tion is slightly higher due to higher electricity con-sumption (again, after transferring 64 million tonsof independent power producer consumption fromthe industrial/ other category), slightly higher cokingcoal and industrial/other consumption and lower netexports. DRI’s projected cost of coal delivered toelectric utilities in 2015 is $0.09 per million Btulower than the cost in the AEO97 high growth case.
The WEFA forecast extends to 2013. Its productionand consumption projections for 2013 are higherthan those in all the AEO97 cases and in the DRIforecast for 2015, with two exceptions: (1) net coalexports total only 88 million tons (less than the 1995historical level), and (2) industrial consumption isonly 84 million tons, comparable with consumptionin the AEO97 low growth case. The higher produc-tion and consumption values are due to combinedutility and nonutility electricity consumption of1,289 million tons. The delivered coal price to theelectricity generation sector is $0.27 to $0.34 per
Energy Information Administration/ Annual Energy Outlook 1997 81

Forecast Comparisons
million Btu higher than that in the AEO97 casesand $0.36 per million Btu higher than that in theDRI forecast for 2015.
The GRI forecast for 2015 projects production simi-lar to the DRI forecast, but is based on higher con-sumption by the electricity generation sector and
lower consumption by industry, combined with thelowest projection for net exports. The GRI deliveredprice to the electricity sector is between the WEFAand DRI projections and slightly lower than theAEO97 values. The minemouth prices reported byGRI are for coal delivered to electric utilities.
Table 21. Comparison of petroleum forecasts (million barrels per day, except where noted)
Projection
AEO97 Other forecasts
ReferenceLow
world oilprice
Highworld oil
priceWEFA GRI DRI IPAA
2010
World oil price(1995 dollars per barrel) 20.41 14.03 26.44 22.04 16.50a 20.95 NA
Crude oil and NGL production 7.67 6.28 8.87 6.51 8.25 7.52 7.58
Crude oil 5.39 4.07 6.53 4.69 6.41 5.57b 5.54Natural gas liquids 2.28 2.21 2.34 1.82 1.84 1.95 2.04
Total net imports 12.90 15.18 11.01 12.82 11.78 12.41 11.83
Petroleum demand 21.60 22.55 20.96 20.73 20.82 21.28 21.02
Motor gasoline 9.17 9.36 9.03 8.73 7.77 9.00 8.99Jet fuel 2.25 2.28 2.23 1.91 2.05 1.97 1.98Distillate fuel 3.99 4.05 3.97 4.07 3.89 3.86 3.95Residual fuel 1.11 1.48 1.02 1.09 1.64 1.02 1.15Other 5.07 5.37 4.72 4.93 5.49 5.44 4.94
Import share of product supplied(percent) 60 67 53 62 57 58 56
2015
World oil price(1995 dollars per barrel) 20.98 13.99 28.23 NA 16.50a 22.63 NA
Crude oil and NGL production 7.67 6.33 9.41 NA 8.87 7.47 NA
Crude oil 5.23 3.97 6.89 NA 7.08 5.44b NANatural gas liquids 2.44 2.36 2.52 NA 1.79 2.03 NA
Total net imports 13.46 15.94 10.83 NA 11.93 13.07 NA
Petroleum demand 22.12 23.28 21.30 NA 21.53 21.95 NA
Motor gasoline 9.19 9.42 9.00 NA 7.62 8.93 NAJet fuel 2.39 2.42 2.36 NA 2.20 2.12 NADistillate fuel 4.12 4.21 4.10 NA 4.14 4.14 NAResidual fuel 1.20 1.64 1.07 NA 1.73 0.99 NAOther 5.21 5.59 4.78 NA 5.84 5.77 NA
Import share of product supplied(percent) 61 68 51 NA 55 60 NA
aComposite of U.S. refiners’ acquisition cost.bIncludes shale and other.NA = Not available.Sources: AEO97: AEO97 National Energy Modeling System, runs AEO97B.D100296K (reference case), LWOP97.D100696A (low world
oil price case), and HWOP97.D100296B (high world oil price case). WEFA: The WEFA Group, U.S. Energy Report (Spring-Summer 1996).GRI: Gas Research Institute, GRI Baseline Projection of U.S. Energy Supply and Demand, 1997 Edition (August 1996). DRI: DRI/McGraw-Hill, World Energy Service: U.S. Outlook, Spring-Summer 1996 (April 1996). IPAA: Independent Petroleum Association of America, IPAASupply and Demand Committee Long-Run Report (April 1996).
82 Energy Information Administration/ Annual Energy Outlook 1997

Forecast Comparisons
Table 22. Comparison of coal forecasts (million short tons, except where noted)
Projection
AEO97 Other forecasts
ReferenceLow
economicgrowth
Higheconomicgrowth
WEFAa GRI DRI
2010
Production 1,201 1,161 1,275 1,351 1,262 1,267
Consumption by sector
Electricity generationb 983 953 1,046 1,157 1,069 1,039Coking plants 23 23 23 32 30 26Industrial/other 93 84 103 84 98 111
Total 1,099 1,060 1,172 1,273 1,197 1,177Net coal exports 103 103 103 84 61 89
Minemouth price
(1995 dollars per short ton) 16.92 16.80 16.64 18.20 NA NA(1995 dollars per million Btu) 0.81 0.80 0.80 0.84 0.63 NA
Average delivered price, electricity
(1995 dollars per short ton) 24.23 23.89 24.19 NA NA 22.65(1995 dollars per million Btu) 1.20 1.18 1.20 1.39 1.17 1.10
2015
Production 1,268 1,197 1,399 1,484 1,415 1,412
Consumption by sector
Electricity generationb 1,039 987 1,155 1,289 1,218 1,177Coking plants 20 20 20 32 29 24Industrial/other 97 84 112 84 97 114
Total 1,156 1,091 1,288 1,405 1,354 1,315Net coal exports 112 112 112 88 62 95
Minemouth price
(1995 dollars per short ton) 15.46 15.32 15.90 18.34 NA NA(1995 dollars per million Btu) 0.74 0.73 0.77 0.85 0.62 NA
Average delivered price, electricity
(1995 dollars per short ton) 22.47 21.92 23.08 NA NA 21.76(1995 dollars per million Btu) 1.11 1.08 1.15 1.42 1.13 1.06
aWEFA forecasts for 2013 are shown here for the year 2015.bThe DRI forecast for electricity generation has been adjusted to include coal consumed by independent power producers, reported by
DRI under industrial/other: 9 million tons in 2010 and 64 million tons in 2015. The WEFA values for electricity coal consumption includenonutility generation consumption of 98 million tons in 2010 and 140 million tons in 2013 (reported under 2015).
NA = Not available.Sources: AEO97: AEO97 National Energy Modeling System, runs AEO97B.D100296K (reference case), LMAC97.D100396A (low
economic growth case), and HMAC97.D100296A (high economic growth case). WEFA: The WEFA Group, U.S. Energy Report (Spring-Summer 1996). GRI: Gas Research Institute, GRI Baseline Projection of U.S. Energy Supply and Demand, 1997 Edition (August 1996).DRI: DRI/McGraw-Hill, World Energy Service: U.S. Outlook, Spring-Summer 1996 (April 1996).
Energy Information Administration/ Annual Energy Outlook 1997 83

List of AcronymsAD Associated-dissolved (natural gas)
AEO Annual Energy Outlook
AEO96 Annual Energy Outlook 1996
AEO97 Annual Energy Outlook 1997
AFV Alternative-fuel vehicle
AGA American Gas Association
BPA Bonneville Power Administration
Btu British thermal unit
CAAA90 Clean Air Act Amendments of 1990
CCAP Climate Change Action Plan
CNG Compressed natural gas
CTC Competitive transition charge
DOE U.S. Department of Energy
DRI Data Resources, Inc./McGraw Hill
EIA Energy Information Administration
EIS Environmental impact statement
EOR Enhanced oil recovery
EPA U.S. Environmental Protection Agency
EPACT Energy Policy Act of 1992
EWG Exempt wholesale generator
FAA Federal Aviation Administration
FERC Federal Energy Regulatory Commission
GDP Gross domestic product
GRI Gas Research Institute
IEA International Energy Agency
IPAA Independent Petroleum Associationof America
IPP Independent power producer
ISO Independent system operator
LDC Local distribution company
LEVP Low Emissions Vehicle Program
LNG Liquefied natural gas
LPG Liquefied petroleum gas
M85 An 85-percent methanol fuel
MPUC Massachusetts Public UtilityCommission
MSW Municipal solid waste
NA Nonassociated (natural gas)
NAECA National Appliance Energy ConservationAct of 1987
NEMS National Energy Modeling System
NERA National Economic Research Associates,Inc.
NERC National Electric Reliability Council
NGL Natural gas liquid
NOPR Notice of Proposed Rulemaking
NRC Natural Resources Canada
NWS NatWest Securities, Ltd.
NYMEX New York Mercantile Exchange
NYPSC New York Public Service Commission
OTAG Ozone Transport Assessment Group
PEL Petroleum Economics, Ltd.
PEMEX Petroleos Mexicano
PIRA Petroleum Industry Research Associates,Inc.
PURPA Public Utility Regulatory Policies Actof 1978
PV Photovoltaic
QF Qualifying facility
RFG Reformulated gasoline
SPR Strategic Petroleum Reserve
STEO Short-Term Energy Outlook
WEFA The WEFA Group (formerly theWharton Econometric ForecastingAssociates)
84 Energy Information Administration/ Annual Energy Outlook 1997
Notes and SourcesText notesPage 5
1. Energy Information Administration, Voluntary Re-porting of Greenhouse Gases 1995, DOE/EIA-0608(95)(Washington, DC, July 1996).
Page 82. The 4.3-cents-per-gallon tax is in nominal terms.3. Energy Information Administration, Voluntary Re-
porting of Greenhouse Gases 1995, DOE/EIA-0608(95)(Washington, DC, July 1996).
Page 94. Significant portions of the material in this discussion
are taken from the EIA report Natural Gas 1996:Issues and Trends, DOE/EIA-0560(96), to be pub-lished in December 1996. The reader is referred tothat report for more in-depth analysis of the issuesdiscussed here.
5. Texas Eastern Transmission Corporation, FERCDocket No. CP95-218 (January 31, 1996).
6. Order 636, issued by the Federal Energy RegulatoryCommission (FERC) on April 8, 1992, has trans-formed the interstate natural gas pipeline industry.Under Order 636, interstate pipeline companies wererestructured and required to separate their merchant(sales of gas) and transportation functions. Althoughpipeline companies still can make gas sales, transpor-tation is now their primary function. Oversight of gassales and marketing activity by FERC has been re-duced significantly, but gas sales by interstate pipe-line companies and interstate transportation of natu-ral gas remain subject to FERC jurisdiction.
Page 107. U.S. Environmental Protection Agency, Nitrogen
Oxide Emission Reduction Program.
Page 128. Federal Energy Regulatory Commission, Promoting
Wholesale Competition Through Open Access Non-Discriminatory Transmission Services by Public Utili-ties and Recovery of Stranded Costs by Public Utilitiesand Transmitting Utilities, Final EnvironmentalImpact Statement, FERC/EIS-0096 (Washington, DC,April 1996).
9. Energy Information Administration, An Analysis ofFERC’s Final Environmental Impact Statement forElectricity Open Access and Recovery of StrandedCosts, SR/OIAF/96-03 (Washington, DC, September1996).
10. Estimated from Energy Information Administration,Form EIA-782C, “Monthly Report of Prime SupplierSales of Petroleum Products Sold for Local Consump-tion” (January-December 1995).
Page 1311. Pursuant to telephone conversation with Mitchell
Baer, Senior Regulatory Analyst, American PetroleumInstitute (September 1996).
12. Senator Thomas Daschle, speech at the World Con-ference on Transportation Fuel Quality (Washington,DC, October 7, 1996).
13. Mary Dade, Chairman of the Ozone TransportationAssessment Group, speech at the World Conferenceon Transportation Fuel Quality (Washington, DC,October 8, 1996).
Page 1814. For a detailed description of the factors influencing
the emergence of a competitive electric power indus-try in the United States, see Energy InformationAdministration, The Changing Structure of the Elec-tric Power Industry: An Update, in preparation.
15. Energy Information Administration, Office of Inte-grated Analysis and Forecasting, Electricity Prices ina Competitive Environment: Determinants and Im-pacts, in preparation.
Page 2216. Federal Highway Administration, Office of Highway
Information Management, Nationwide PersonalTransportation Survey: 1990 NPTS Databook (Wash-ington, DC, November 1993).
Page 2317. The CAFE standard for cars has remained at 27.5
miles per gallon since 1990. The standard for lighttrucks is now 20.5 miles per gallon. The standard hadbeen eased to 26.0 miles per gallon between 1985 and1988 and 26.5 miles per gallon in 1989. See NationalHighway Traffic Safety Administration, Summary ofFuel Economy Performance (Washington, DC, Sep-tember 1994).
18. U.S. Department of Energy, Office of TransportationTechnologies, Transportation Energy Data Book,Edition 15 (Washington, DC, May 1995), pp. 2-52.
Page 2419. U.S. Department of Commerce, Technology Adminis-
tration, PNGV Secretariat, Partnership for a NewGeneration of Vehicles Program Plan (Washington,DC, November 1995).
Page 3220. Since the publication of AEO96, the Bureau of Eco-
nomic Analysis has revised the measurement of realGDP. Previously, GDP calculations were based onfixed-weighted measures of output and prices, and thebase year was updated every 5 years. The weightsused to calculate aggregate GDP from its componentswere the prices prevailing in the base year. Since allcomponents of GDP do not grow at the same rate, abias would occur in the aggregate rate, especially foryears further from the base year. The “chain-weighted” measure now used captures yearly changesin the relative growth of the components of GDP. Thefollowing comparison illustrates the impact of therevised measure: using the old 1987 fixed-weight GDP
Energy Information Administration/ Annual Energy Outlook 1997 85

Notes and Sources
measure, AEO97 has an average annual GDP growthrate of 2.3 percent from 1995 to 2010; however, usingthe 1992 chain-weighted measure yields an annualgrowth rate of 1.9 percent. See Bureau of EconomicAnalysis, “Preview of the Comprehensive Revision ofthe National Income and Product Accounts: BEA’sNew Featured Measures of Output and Prices,”Survey of Current Business (July 1995), p. 31.
21. U.S. Department of Commerce, Bureau of the Census.
22. Only portions of the national economic statistics havebeen converted to 1992 chain-weighted dollars. Be-cause the national input-output matrix for manufac-turing industries, which underlies the projections inFigure 25, is still available only in 1987 fixed-weightdollars, the growth rates shown in the figure arebased on 1987 fixed-weight dollars. The use of fixed-weight dollars is not expected to affect the picture ofrelative growth rates shown in the figure. Similarly,because only a limited set of historical data for GDPand related statistics are available, Figure 27 is basedon fixed-weight dollars to give a longer historicalperspective on the changes in GDP growth rates. Theuse of chain-weighted dollars would change the valuesin the figure slightly but would not affect the overallshape of the curve.
Page 3323. DRI/McGraw-Hill, “Winter Long-Term Forecast,”
Review of the U.S. Economy, February 1996, (Lexing-ton, MA, 1996).
Page 3424. I. Ismail, “Future Growth in OPEC Oil Production
Capacity and the Impact of Environmental Measures,”presented to the Sixth Meeting of the InternationalEnergy Workshop (Vienna, Austria, June 1993).
Page 3525. Energy Information Administration, International
Energy Outlook 1996, DOE/EIA-0484(96) (Washing-ton, DC, May 1996).
Page 3726. The transportation sector has been left out of these
calculations because levels of transportation sectorelectricity use have historically been far less than 1percent of delivered electricity. In the transportationsector, the difference between total and deliveredenergy consumption is also less than 1 percent.
Page 3827. The high and low macroeconomic growth cases are
linked to higher and lower population growth, respec-tively, which affects energy use in all sectors.
Page 4128. Commercial buildings and energy use data from
Energy Information Administration, Form EIA-871A,“Commercial Buildings Energy Consumption Survey”(1992).
Page 4229. The intensities shown were disaggregated using the
divisia index. The divisia index is a weighted sum ofgrowth rates and is separated into a sectoral shift or“output” effect and an energy efficiency or “substitu-tion” effect. It has at least two properties that makeit superior to other indexes. First, it is not sensitive towhere in the time period or in which direction theindex is computed. Second, when the effects are sepa-rated, the individual components have the same mag-nitude, regardless of which is calculated first. SeeEnergy Information Administration, Structural Shiftand Aggregate Energy Efficiency in Manufacturing(unpublished working paper in support of the Nation-al Energy Strategy, May 1990); and Boyd et al., “Sep-arating the Changing Effects of U.S. ManufacturingProduction from Energy Efficiency Improvements,”Energy Journal, Vol. 8, No. 2 (1987).
Page 4330. Small light trucks (compact pickup trucks and com-
pact vans) are used primarily as passenger vehicles,whereas medium light trucks (compact utility trucksand standard vans) and large light trucks (standardutility trucks and standard pickup trucks) are usedmore heavily for commercial purposes. Over the pastdecade, horsepower increases for passenger vehicleshave outpaced those for commercial light-duty ve-hicles. This trend is expected to continue.
Page 4531. For example, Corporate Average Fuel Economy
(CAFE) standards for new vehicles are always met.
Page 4632. Values for incremental investments are given in un-
discounted real dollars.
Page 5833. For example, according to the latest USGS estimates,
the size of the Nation’s technically recoverable undis-covered conventional crude oil resources (in onshoreareas and State waters) is most likely to be 30.3billion barrels—with a 19 in 20 chance of being atleast 23.5 billion barrels and a 1 in 20 chance of beingat least 39.6 billion barrels. The corresponding USGSestimate for the Nation’s natural gas resources is258.7 trillion cubic feet—with a 19 in 20 chance ofbeing at least 207.1 trillion cubic feet and a 1 in 20chance of being at least 329.1 trillion cubic feet.AEO97 does not examine the implications of geologi-cal resource uncertainty. The figures cited above aretaken from U.S. Geological Survey, National Oil andGas Resource Assessment Team, 1995 NationalAssessment of United States Oil and Gas Resources,U.S. Geological Survey Circular 1118 (Washington,DC, 1995), p. 2. The cited numbers exclude naturalgas liquids resources, for which the correspondingUSGS estimates are 7.2, 5.8, and 8.9 billion barrels.
86 Energy Information Administration/ Annual Energy Outlook 1997

Notes and Sources
Page 5934. Substantial uncertainty surrounds the ultimate use of
North Slope gas. However, projected low gas prices inthe lower 48 markets justify the AEO97 perspectivethat does not consider it a significant factor affectingdomestic energy markets, especially natural gas mar-kets.
Page 6435. Greater technological advances can markedly increase
the quantity of economically recoverable resources bydriving down costs, increasing success rates, andincreasing recovery from producing wells. Expectedproduction rate declines could be slowed or evenreversed within the forecast period if faster imple-mentation of advanced technologies is realized.
36. Enhanced oil recovery (EOR) is the extraction of theoil that can be economically produced from a petro-leum reservoir greater than that which can be eco-nomically recovered by conventional primary andsecondary methods. EOR methods usually involveinjecting heated fluids, pressurized gases, or special
chemicals into an oil reservoir in order to produceadditional oil.
37. Energy Information Administration, Monthly EnergyReview, DOE/EIA-0035(96/03) (Washington, DC,March 1996), Table 1.6.
Page 6538. In the 1980s, falling consumption led to surplus refin-
ing capacity, which reduced the need for productimports. See Energy Information Administration, TheU.S. Petroleum Industry: Past as Prologue 1970-1992,DOE/EIA-0572 (Washington, DC, September 1993), p.47.
Page 6739. Historical data from Energy Information Administra-
tion, Annual Energy Review 1995, DOE/EIA-0384(95)(Washington, DC, July 1996).
Page 6940. Energy Information Administration, Quarterly Coal
Report, October-December 1995, DOE/EIA-0121(95/4Q) (Washington, DC, May 1996).
________________________________
Table notes
Note: Tables indicated as sources in these notesrefer to the tables in Appendixes A, B, C, and Fof this report.
Table 1. Summary of results for five cases (page 6):Tables A1, A8, A20, B1, B8, B20, C1, C8, and C20.
Table 2. NOx emissions standards under the CleanAir Act Amendments of 1990 (page 11): U.S. Environ-mental Protection Agency, Nitrogen Oxide Emission Re-duction Program.
Table 3. New car and light truck horsepower ratingsand market shares, 1985, 1995, 2005, and 2015 (page43): 1995: U.S. Department of Transportation, NationalHighway Traffic Safety Administration, Mid-Model YearFuel Economy: Reports From Auto Manufacturers (1995).2005 and 2015: AEO97 National Energy Modeling Sys-tem, run AEO97B.D100296K.
Table 4. Market shares of alternative-fuel light-dutyvehicles by technology type, 2015 (page 44): U.S. De-partment of Energy, Office of Policy, Technical ReportFourteen: Market Potential and Impacts of Alternative FuelUse in Light-Duty Vehicles: A 2000/2010 Analysis (Draft,1995). California Air Resources Board, “ProposedRegulations for Low-Emission Vehicles and Clean Fuels,Staff Report” (Sacramento, CA, August 13, 1990). U.S.Department of Commerce, Bureau of the Census, TruckInventory and Use Survey, 1992, TC92-T-52 (Washington,DC, May 1995). Energy Information Administration, De-scribing Current and Potential Markets for AlternativeFuel Vehicles, DOE/EIA-0604 (Washington, DC, March1996). Energy Information Administration, Alternatives toTraditional Transportation Fuels 1994, Vol. 1, DOE/EIA-
0585(94)/1 (Washington, DC, February 1996). AEO97National Energy Modeling System, run AEO97B.D100296K.
Table 5. Costs of producing electricity from newplants, 2000 and 2015 (page 51): AEO97 National Ener-gy Modeling System, run AEO97B.D100296K.
Table 6. Economically recoverable oil and gas re-sources in 1990, measured under different technologyassumptions (page 57): Energy Information Adminis-tration, Office of Integrated Analysis and Forecasting.
Table 7. Natural gas and crude oil drilling in threecases (page 58): AEO97 National Energy Modeling Sys-tem, runs AEO97B.D100296K, LWOP96.D101995B, andHWOP97.D100296B.
Table 8. Transmission and distribution revenues andmargins, 1970, 1985, 1995, and 2015 (page 61):History: Energy Information Administration, AnnualEnergy Review 1994, DOE/EIA-0384(94) (Washington, DC,July 1995). Projections: AEO97 National Energy Model-ing System, run AEO97B.D100296K. End-use consumptionis net of pipeline and lease and plant fuels.
Table 9. Components of residential and commercialnatural gas end-use prices, 1985-2015 (page 61): His-tory: Energy Information Administration, Annual EnergyReview 1987, DOE/EIA-0384(87) (Washington, DC, July1988); Annual Energy Review 1994, DOE/EIA-0384(94)(Washington, DC, July 1995); and Natural Gas Monthly,June 1995, DOE/EIA-0130(95/06) (Washington, DC, June1995). Projections: AEO97 National Energy ModelingSystem, run AEO97B.D100296K.
Energy Information Administration/ Annual Energy Outlook 1997 87

Notes and Sources
Table 10. Representative average annual rates oftechnological progress in alternative technologycases (page 62): Energy Information Administration,Office of Integrated Analysis and Forecasting.
Table 11. Petroleum consumption and net imports,1995 and 2015 (page 65): 1995: Energy Information Ad-ministration, Petroleum Supply Annual 1995, DOE/EIA-0340(95)/1 (Washington, DC, May 1996). 2015: TablesA11, B11, and C11.
Table 12. Scrubber retrofits, allowance costs, andbanked allowances, 2000-2015 (page 74): AEO97National Energy Modeling System, run AEO97B.D100296K.
Table 13. Forecasts of economic growth, 1995-2015(page 76): AEO97: Table B20. DRI: DRI/McGraw-Hill,Review of the U.S. Economy, February 1996, “Winter LongTerm Forecast” (Lexington, MA, 1996). WEFA: The WEFAGroup, U.S. Long-Term Economic Outlook (SecondQuarter 1996).
Table 14. Forecasts of world oil prices, 1995-2015(page 76): AEO97: Tables A1 and C1. DRI: DRI/McGraw-Hill, World Energy Service: U.S. Outlook, Spring-Summer1996 (April 1996). IEA1: International Energy Agency,World Energy Outlook, 1996: Capacity Constraints Case.IEA2: International Energy Agency, World Energy Out-look, 1996: Energy Savings Case. PEL: Petroleum Eco-nomics, Ltd., Oil and Energy Outlook to 2010 (December1995). (Price is for Brent crude.) WEFA: The WEFAGroup, U.S. Energy Report (Spring-Summer 1996). GRI:Gas Research Institute, GRI Baseline Projection of U.S.Energy Supply and Demand, 1997 Edition (August 1996).
Table 15. Forecasts of average annual growth ratesfor energy consumption (page 77): AEO97: Table A2.DRI: DRI/McGraw Hill, World Energy Service: U.S. Out-look, Spring-Summer 1996 (April 1996). GRI: Gas Re-search Institute, GRI Baseline Projection of U.S. EnergySupply and Demand, 1997 Edition (August 1996). WEFA:The WEFA Group, U.S. Energy Report (Spring-Summer1996). Note: Delivered energy includes petroleum, naturalgas, coal, and electricity (excluding generation and trans-mission losses) consumed in the residential, commercial,industrial, and transportation sectors.
Table 16. Forecasts of average annual growth inresidential and commercial energy demand (page 77):AEO97: Table A2. DRI: DRI/McGraw Hill, World EnergyService: U.S. Outlook, Spring-Summer 1996 (April 1996).GRI: Gas Research Institute, GRI Baseline Projection ofU.S. Energy Supply and Demand, 1997 Edition (August1996). WEFA: The WEFA Group, U.S. Energy Report(Spring-Summer 1996).
Table 17. Forecasts of average annual growth inindustrial energy demand (page 77): AEO97: Table A2.DRI: DRI/McGraw Hill, World Energy Service: U.S. Out-look, Spring-Summer 1996 (April 1996). GRI: Gas Re-search Institute, GRI Baseline Projection of U.S. EnergySupply and Demand, 1997 Edition (August 1996). WEFA:The WEFA Group, U.S. Energy Report (Spring-Summer1996).
Table 18. Forecasts of average annual growth intransportation energy demand (page 78): AEO97: TableA2. DRI: DRI/McGraw Hill, World Energy Service: U.S.Outlook, Spring-Summer 1996 (April 1996). GRI: GasResearch Institute, GRI Baseline Projection of U.S. EnergySupply and Demand, 1997 Edition (August 1996). WEFA:The WEFA Group, U.S. Energy Report (Spring-Summer1996).
Table 19. Comparison of electricity forecasts (page79): AEO97: AEO97 National Energy Modeling System,runs AEO97B.D100296K, LMAC97.D100396A, andHMAC97.D100296A. WEFA: The WEFA Group, U.S.Energy Report (Spring-Summer 1996). GRI: Gas ResearchInstitute, GRI Baseline Projection of U.S. Energy Supplyand Demand, 1997 Edition (August 1996). DRI: DRI/McGraw-Hill, DRI/McGraw-Hill, World Energy Service:U.S. Outlook, Spring-Summer 1996 (April 1996).
Table 20. Comparison of natural gas forecasts (page80): AEO97: Tables B13 and B14. WEFA: The WEFAGroup, U.S. Energy Report (Spring-Summer 1996). GRI:Gas Research Institute, GRI Baseline Projection of U.S.Energy Supply and Demand, 1997 Edition (August 1996).DRI: DRI/McGraw-Hill, World Energy Service: U.S. Out-look, Spring-Summer 1996 (April 1996). AGA: AmericanGas Association, 1996 AGA-TERA Base Case (August1996).
Table 21. Comparison of petroleum forecasts (page82): AEO97: Table C11. WEFA: The WEFA Group, U.S.Energy Report (Spring-Summer 1996). GRI: Gas ResearchInstitute, GRI Baseline Projection of U.S. Energy Supplyand Demand, 1997 Edition (August 1996). DRI: DRI/McGraw-Hill, World Energy Service: U.S. Outlook, Spring-Summer 1996 (April 1996). IPAA: Independent PetroleumAssociation of America, IPAA Supply and Demand Com-mittee Long-Run Report (April 1996).
Table 22. Comparison of coal forecasts (page 83):AEO97: Table B16. WEFA: The WEFA Group, U.S. Ener-gy Report (Spring-Summer 1996). GRI: Gas ResearchInstitute, GRI Baseline Projection of U.S. Energy Supplyand Demand, 1997 Edition (August 1996). DRI: DRI/McGraw-Hill, World Energy Service: U.S. Outlook, Spring-Summer 1996 (April 1996).
________________________________
88 Energy Information Administration/ Annual Energy Outlook 1997

Notes and Sources
Figure notes
Note: Tables indicated as sources in these notesrefer to the tables in Appendixes A, B, C, and Fof this report.
Figure 1. Fuel price projections, 1995-2015: AEO96and AEO97 compared (page 2): AEO96 projections:Energy Information Administration, Annual Energy Out-look 1996, DOE/EIA-0383(96) (Washington, DC, January1996). AEO97 projections: Tables A1 and A8.
Figure 2. Energy production by fuel, 1970-2015 (page2): History: Energy Information Administration, AnnualEnergy Review 1995, DOE/EIA-0384(95) (Washington, DC,July 1996). Projections: Tables A1 and A18. Note: Datafor non-electric utility use of renewable energy were col-lected beginning in 1990.
Figure 3. Net energy imports by fuel, 1970-2015 (page3): History: Energy Information Administration, AnnualEnergy Review 1995, DOE/EIA-0384(95) (Washington, DC,July 1996). Projections: Table A1.
Figure 4. Energy consumption by fuel, 1970-2015 (page3): History: Energy Information Administration, AnnualEnergy Review 1995, DOE/EIA-0384(95) (Washington, DC,July 1996). Projections: Tables A1 and A18. Note: Datafor non-electric utility use of renewable energy werecollected beginning in 1990.
Figure 5. Electricity generation by fuel, 1970-2015(page 4): History: Energy Information Administration,Form EIA-867, “Annual Nonutility Power Producer Re-port”; Energy Information Administration, Annual EnergyReview 1995, DOE/EIA-0384(95) (Washington, DC, July1996); and Edison Electric Institute. Projections: TableA8.
Figure 6. Energy use per capita and per dollar ofgross domestic product, 1970-2015 (page 5): History:Energy Information Administration, Annual Energy Re-view 1995, DOE/EIA-0384(95) (Washington, DC, July1996). Projections: Table A2.
Figure 7. U.S. carbon emissions by sector and fuel,1990-2015 (page 5): History: Energy Information Admin-istration, Emissions of Greenhouse Gases in the UnitedStates 1987-1994, DOE/EIA-0573(94) (Washington, DC,October 1995). Projections: Table A19.
Figure 8. Comparison of average natural gas trans-mission and distribution margins, 1970-2015 (page10): History: Derived from Energy Information Adminis-tration, Annual Energy Review 1995, DOE/EIA-0384(95)(Washington, DC, July 1996). Projections: Table A14.
Figure 9. Nitrogen oxide emissions, 1994-2015 (page11): AEO97 National Energy Modeling System, runAEO97B.D100296K.
Figure 10. Changes in oil consumption for trans-portation and other uses, 1980-2015 (page 22): His-tory: Oak Ridge National Laboratory, TransportationEnergy Data Book, Edition 16 (Oak Ridge, TN, July 1996).
Projections: AEO97 National Energy Modeling System,run AEO97B.D100296K.
Figure 11. Changes in carbon emissions, 1990-2015(page 22): History: Energy Information Administration,Emissions of Greenhouse Gases in the United States 1987-1994, DOE/EIA-0573(94) (Washington, DC, October 1995).Projections: AEO97 National Energy Modeling System,run AEO97B.D100296K.
Figure 12. Trends in automobile fuel efficiency in thereference case, 1978-2015 (page 22): History: Oak RidgeNational Laboratory, Transportation Energy Data Book,Edition 16 (Oak Ridge, TN, July 1996). Projections:AEO97 National Energy Modeling System, run AEO97B.D100296K.
Figure 13. Alternative-fuel vehicle shares of light-duty vehicle stock in two cases (page 23): AEO97National Energy Modeling System, runs AEO97B.D100296K and HITECH.D100896H.
Figure 14. Trends in automobile fuel efficiency in thehigh efficiency case, 1978-2015 (page 24): History: OakRidge National Laboratory, Transportation Energy DataBook, Edition 16 (Oak Ridge, TN, July 1996). Projec-tions: AEO97 National Energy Modeling System, runHITECH.D100896H.
Figure 15. Changes from the reference case, assum-ing no increase in new car horsepower (page 24):AEO97 National Energy Modeling System, runsAEO97B.D100296K and HITECH.D100896H.
Figure 16. Buildings sector energy prices, 1995 and2015 (page 25): Table A3.
Figure 17. Buildings sector energy consumption inalternative price and efficiency cases (page 26):AEO97 National Energy Modeling System, runsAEO97B.D100296K, COMJCZ.D100396A, COMJCZ.D100396D, RSDFLT.D100396A, and RSFRZN.D100896A.
Figure 18. Buildings sector carbon emissions inalternative price and efficiency cases (page 26):AEO97 National Energy Modeling System, runs AEO97B.D100296K, COMJCZ.D100396A, COMJCZ.D100396D,RSDFLT.D100396A, and RSFRZN.D100896A.
Figure 19. Lower 48 natural gas wellhead prices intwo alternative oil and gas technology cases, 1970-2015 (page 27): AEO97 National Energy Modeling System,runs AEO97B.D100296K, LTECOGI.D100896A, andHTECOGI.D100896A.
Figure 20. Lower 48 natural gas production in twoalternative oil and gas technology cases, 1970-2015(page 28): AEO97 National Energy Modeling System, runsAEO97B.D100296K, LTECOGI.D100896A, andHTECOGI.D100896A.
Figure 21. Lower 48 natural gas wellhead prices inalternative oil and gas technology cases, 1995-2015(page 28): AEO97 National Energy Modeling System, runs
Energy Information Administration/ Annual Energy Outlook 1997 89

Notes and Sources
AEO97B.D100296K, LTECOGI.D100896A, HTECOGI.D100896A, LTECOGS.D100896A, and HTECOGS.D100896A.
Figure 22. Natural gas and coal use for electricitygeneration in two alternative oil and gas technologycases, 1995, 2005, and 2015 (page 29): AEO97 NationalEnergy Modeling System, runs LTECOGI.D100896A andHTECOGI.D100896A.
Figure 23. Electricity generation from renewables intwo alternative oil and gas technology cases, 2015(page 29): AEO97 National Energy Modeling System, runsAEO97B.D100296K and HIDEMD.D100596A.
Figure 24. Average annual real growth rates of eco-nomic factors, 1995-2015 (page 32): History: Bureau ofEconomic Analysis, U.S. Department of Commerce. Pro-jections: AEO97 National Energy Modeling System, runAEO97B.D100296K.
Figure 25. Sectoral composition of GDP growth, 1995-2015 (page 32): History: Bureau of Economic Analysis,U.S. Department of Commerce. Projections: AEO97National Energy Modeling System, run AEO97B.D100296K.
Figure 26. Average annual real growth rates of eco-nomic factors in three cases, 1995-2015 (page 33):History: Bureau of Economic Analysis, U.S. Departmentof Commerce. Projections: AEO97 National EnergyModeling System, runs AEO97B.D100296K, HMAC97.D100296A, and LMAC97.D100396A.
Figure 27. Change in annual GDP growth rate forthe preceding 20 years, 1966-2015 (page 33): History:Bureau of Economic Analysis, U.S. Department of Com-merce. Projections: AEO97 National Energy ModelingSystem, runs AEO97B.D100296K, HMAC97.D100296A,and LMAC97.D100396A.
Figure 28. World oil prices in three cases, 1970-2015(page 34): History: Energy Information Administration,Annual Energy Review 1995, DOE/EIA-0384(95) (Wash-ington, DC, July 1996). Projections: Tables A1 and C1.
Figure 29. OPEC oil production in three cases, 1970-2015 (page 34): History: Energy Information Administra-tion, International Petroleum Statistics Report, DOE/EIA-0520(96/09) (Washington, DC, September 1996). Projec-tions: Tables A21 and C21.
Figure 30. OPEC and non-OPEC oil production intwo cases, 1990-2015 (page 35): History: Energy Infor-mation Administration, International Petroleum StatisticsReport, DOE/EIA-0520(96/09) (Washington, DC, Septem-ber 1996). Projections: Table A21 and InternationalEnergy Module, run HIGH.NOPEC.SUPPLY (Petrocon-sultants: DESTINY International Energy Forecast Soft-ware).
Figure 31. Persian Gulf share of worldwide oil ex-ports, 1965-2015 (page 35): History: Energy InformationAdministration, International Petroleum Statistics Report,
DOE/EIA-0520(96/09) (Washington, DC, September 1996).Projections: AEO97 National Energy Modeling System,runs AEO97B.D100296K and LWOP97.D100696A; andWorld Oil, Refining, Logistics, and Demand (WORLD)Model, runs AEO97B and AEO97L.
Figure 32. U.S. petroleum imports by source, 1995-2015 (page 36): AEO97 National Energy Modeling System,run AEO97B.D100296K; and World Oil, Refining,Logistics, and Demand (WORLD) Model, run AEO97B.
Figure 33. Worldwide refining capacity by region,1996 and 2015 (page 36): History: Oil and Gas Journal,Energy Database (January 1996). Projections: AEO97National Energy Modeling System, run AEO97B.D100296K; and World Oil, Refining, Logistics, and De-mand (WORLD) Model, run AEO97B.
Figure 34. Primary and delivered energy consump-tion, excluding transportation use, 1970-2015 (page37): History: Energy Information Administration, AnnualEnergy Review 1995, DOE/EIA-0384(95) (Washington, DC,July 1996). Projections: Table A2.
Figure 35. Energy use per capita and per dollar ofgross domestic product, 1970-2015 (page 37): History:Energy Information Administration, Annual Energy Re-view 1995, DOE/EIA-0384(95) (Washington, DC, July1996). Projections: Table A2.
Figure 36. Energy use by fuel, 1970-2015 (page 38):History: Energy Information Administration, AnnualEnergy Review 1995, DOE/EIA-0384(95) (Washington, DC,July 1996). Projections: Table A2.
Figure 37. Energy use by sector, 1975-2015 (page 38):History: Energy Information Administration, State Ener-gy Data Report 1994, DOE/EIA-0214(94), and preliminary1995 data. Projections: Table A2.
Figure 38. Residential total energy consumption byfuel, 1970-2015 (page 39): History: Energy InformationAdministration, State Energy Data Report 1994, DOE/EIA-0214(94), and preliminary 1995 data. Projections: TableA2.
Figure 39. Residential total energy consumption byend use, 1987, 1995, and 2015 (page 39): History: Ener-gy Information Administration, Residential Energy Con-sumption Survey 1993, DOE/EIA-0321(93) (Washington,DC, October 1995). Projections: Table A4. Note: 1987 isused as the historical year because end-use data are avail-able for that year from EIA’s Residential Energy Con-sumption Survey.
Figure 40. Commercial nonrenewable total energyconsumption by fuel, 1970-2015 (page 40): History:Energy Information Administration, State Energy DataReport 1994, DOE/EIA-0214(94), and preliminary 1995data. Projections: Table A2.
Figure 41. Commercial total energy consumption byend use, 1995 and 2015 (page 40): Table A5.
90 Energy Information Administration/ Annual Energy Outlook 1997

Notes and Sources
Figure 42. Efficiencies of commercial electric waterheaters in the reference case, 1995-2015 (page 41):Minimum available: Commercial module technologydatabase used for the reference case. Highest con-sidered: Commercial module technology database used forthe reference case. Stock: AEO97 National EnergyModeling System, run AEO97B.D100296K. Purchaseaverage: AEO97 National Energy Modeling System, runAEO97B.D100296K.
Figure 43. Industrial total energy consumption byfuel, 1970-2015 (page 41): History: Energy InformationAdministration, State Energy Data Report 1994, DOE/EIA-0214(94). Projections: Table A2.
Figure 44. Industrial primary energy consumption byindustry category, 1995-2015 (page 42): AEO97 NationalEnergy Modeling System, run AEO97B.D100296K.
Figure 45. Manufacturing energy intensity by com-ponent, 1995-2015 (page 42): AEO97 National EnergyModeling System, run AEO97B.D100296K.
Figure 46. Transportation energy consumption byfuel, 1975, 1995, and 2015 (page 43): History: EnergyInformation Administration, Short-Term Energy Outlook,DOE/EIA-0202(96/4Q) (Washington DC, October 1996),and State Energy Data Report 1994, DOE/EIA-0214(93).Projections: Table A2.
Figure 47. Transportation stock fuel efficiency bymode, 1980-2015 (page 43): History: Oak Ridge NationalLaboratory, Transportation Energy Data Book, Edition 16(Oak Ridge, TN, July 1996). Federal Aviation Administra-tion, FAA Aviation Forecasts (Washington, DC, February1995). U.S. Department of Transportation, NationalTransportation Statistics, 1995 (Washington, DC, Novem-ber 1994). Projections: AEO97 National Energy ModelingSystem, run AEO97B.D100296K.
Figure 48. Alternative-fuel vehicle sales by type ofdemand, 1995-2015 (page 44): U.S. Department of Ener-gy, Office of Policy, Technical Report Fourteen: MarketPotential and Impacts of Alternative Fuel Use in Light-Duty Vehicles: A 2000/2010 Analysis (Draft, 1995). Cali-fornia Air Resources Board, “Proposed Regulations forLow-Emission Vehicles and Clean Fuels, Staff Report”(Sacramento, CA, August 13, 1990). U.S. Department ofCommerce, Bureau of the Census, Truck Inventory andUse Survey, 1992, TC92-T-52 (Washington, DC, May1995). Energy Information Administration, DescribingCurrent and Potential Markets for Alternative Fuel Ve-hicles, DOE/EIA-0604 (Washington, DC, March 1996).Energy Information Administration, Alternatives to Tradi-tional Transportation Fuels 1994, Vol. 1, DOE/EIA-0585(94)/1 (Washington, DC, February 1996). AEO97National Energy Modeling System, run AEO97B.D100296K.
Figure 49. Alternative-fuel light-duty vehicle sales byfuel type, 1995-2015 (page 44): U.S. Department of Ener-
gy, Office of Policy, Technical Report Fourteen: MarketPotential and Impacts of Alternative Fuel Use in Light-Duty Vehicles: A 2000/2010 Analysis (Draft, 1995). Cali-fornia Air Resources Board, “Proposed Regulations forLow-Emission Vehicles and Clean Fuels, Staff Report”(Sacramento, CA, August 13, 1990). U.S. Department ofCommerce, Bureau of the Census, Truck Inventory andUse Survey, 1992, TC92-T-52 (Washington, DC, May1995). Energy Information Administration, DescribingCurrent and Potential Markets for Alternative Fuel Ve-hicles, DOE/EIA-0604 (Washington, DC, March 1996).Energy Information Administration, Alternatives to Tradi-tional Transportation Fuels 1994, Vol. 1, DOE/EIA-0585(94)/1 (Washington, DC, February 1996. AEO97 NationalEnergy Modeling System, run AEO97B.D100296K.
Figure 50. Variation from reference case primaryenergy use by sector in two alternative technologycases (page 45): Tables A2, F1, F2, F3, and F4.
Figure 51. Variation from reference case primaryresidential energy use in three alternative cases,1995-2015 (page 45): Tables A2 and F1.
Figure 52. Changes in fuel and capital costs for se-lected residential appliances in the high technologycase, 1995-2015 (page 46): Table A2 and AEO97 NationalEnergy Modeling System, runs AEO97B.D100296K,RSINVS.D100996B, and RSDFLT.D100996B.
Figure 53. Capital investment and energy costsavings for residential appliances in the high tech-nology case, 1995-2015 (page 46): Table A2 and AEO97National Energy Modeling System, runs AEO97B.D100296K, RSINVS.D100996B, and RSDFLT.D100996B.
Figure 54. Variation from reference case primarycommercial energy use in three alternative cases,1995-2015 (page 46): Tables A2 and F2.
Figure 55. Industrial energy intensity in two alterna-tive technology cases, 1995-2015 (page 47): Tables A2and F3.
Figure 56. Changes in key components of the trans-portation sector in two alternative cases, 2015 (page47): Table A2 and AEO97 National Energy Modeling Sys-tem, runs AEO97B.D100296K, FRZNEFF.D100896A, andHITECH.D100896H.
Figure 57. Population, gross domestic product, andelectricity sales growth, 1960-2015 (page 48): History:Energy Information Administration, Annual Energy Re-view 1995, DOE/EIA-0384(95) (Washington, DC, July1996). Projections: Tables A8 and A20.
Figure 58. Annual electricity sales by sector, 1970-2015 (page 48): History: Energy Information Administra-tion, Annual Energy Review 1995, DOE/EIA-0384(95)(Washington, DC, July 1996). Projections: Table A8.
Figure 59. New generating capacity and retirements,1990-2015 (page 49): Table A9.
Energy Information Administration/ Annual Energy Outlook 1997 91

Notes and Sources
Figure 60. Electricity generation and cogenerationcapacity additions by fuel type, 1995-2015 (page 49):Table A9.
Figure 61. Fuel prices to electricity suppliers andelectricity price, 1990-2015 (page 50): History: EnergyInformation Administration, Annual Energy Review 1995,DOE/EIA-0384(95) (Washington, DC, July 1996). Projec-tions: Tables A3 and A8.
Figure 62. Electric utility generator revenue require-ments, 1990-2015 (page 50): History: Energy InformationAdministration, Annual Energy Review 1995, DOE/EIA-0384(95) (Washington, DC, July 1996). Projections: TableA8.
Figure 63. Electricity generation costs, 2000 and 2015(page 51): AEO97 National Energy Modeling System, runAEO97B.D100296K.
Figure 64. Electricity generation by fuel, 1995-2015(page 51): Table A8.
Figure 65. Nuclear power plant capacity factors,1973-2015 (page 52): History: Energy Information Ad-ministration, Annual Energy Review 1995, DOE/EIA-0384(95) (Washington, DC, July 1996). Projections: Tables A8and A9.
Figure 66. Operable nuclear capacity in three cases,1995-2015 (page 52): Table F5.
Figure 67. Cumulative new generating capacity bytype in two cases, 1995-2015 (page 53): Tables A9 andF6.
Figure 68. Cumulative new generating capacity bytype in three cases, 1995-2015 (page 53): Tables A9 andB9.
Figure 69. Cumulative new electricity generatingcapacity by technology type in three cases, 1995-2015(page 54): AEO97 National Energy Modeling System, runsAEO97B.D100296K, HTECEL.D100896A, and LTECEL.D100896A.
Figure 70. Grid-connected electricity generation fromselected renewable fuels, 1995-2015 (page 54): History:Energy Information Administration, Form EIA-860,“Annual Electric Generator Report,” and Form EIA-867,“Annual Nonutility Power Producer Report.” Projections:AEO97 National Energy Modeling System, runAEO97.D100296K.
Figure 71. Wind-powered electricity generatingcapacity by region, 1995-2015 (page 55): History: Ener-gy Information Administration, Form EIA-860, “AnnualElectric Generator Report,” and Form EIA-867, “AnnualNonutility Power Producer Report.” Projections: AEO97National Energy Modeling System, run AEO97.D100296K.
Figure 72. Levelized costs of electricity from windpower, 1990-2015 (page 55): AEO97 National EnergyModeling System, run AEO97.D100296K, high/low range,in consultation with wind energy analysts.
Figure 73. Solar thermal and photovoltaic electricitygeneration, 1995-2015 (page 56): History: Energy Infor-mation Administration, Form EIA-860, “Annual ElectricGenerator Report,” and Form EIA-867, “Annual NonutilityPower Producer Report.” Projections: AEO97 NationalEnergy Modeling System, run AEO97.D100296K.
Figure 74. Electricity generating capacity from re-newable sources, 1995-2015 (page 56): History: EnergyInformation Administration, Form EIA-860, “Annual Elec-tric Generator Report,” and Form EIA-867, “Annual Non-utility Power Producer Report.” Projections: AEO97National Energy Modeling System, run AEO97.D100296K.
Figure 75. Lower 48 crude oil wellhead prices, 1970-2015 (page 57): History: Energy Information Administra-tion, Annual Energy Review 1995, DOE/EIA-0384(95)(Washington, DC, July 1996). Projections: Tables A15and C15.
Figure 76. U.S. petroleum consumption in five cases,1970-2015 (page 57): History: Energy Information Ad-ministration, Annual Energy Review 1995, DOE/EIA-0384(95) (Washington, DC, July 1996). Projections:Tables A11, B11, and C11.
Figure 77. Lower 48 natural gas wellhead prices,1970-2015 (page 57): History: Energy Information Ad-ministration, Annual Energy Review 1995, DOE/EIA-0384(95) (Washington, DC, July 1996). Projections:Tables A1 and B1. Note: Prices are converted to 1995dollars.
Figure 78. Successful new lower 48 natural gas andoil wells in three cases, 1970-2015 (page 58): History:Energy Information Administration, Office of IntegratedAnalysis and Forecasting, computations based on wellreports submitted to the American Petroleum Institute.Projections: AEO97 National Energy Modeling System,runs AEO97B.D100296K, LWOP97.D100696A, andHWOP97.D100296B.
Figure 79. Lower 48 natural gas reserve additions inthree cases, 1970-2015 (page 58): 1970-1976: EnergyInformation Administration, Office of Integrated Analysisand Forecasting, computations based on well reports sub-mitted to the American Petroleum Institute. 1977-1994:Energy Information Administration, U.S. Crude Oil,Natural Gas, and Natural Gas Liquids Reserves, DOE/EIA-0216(94) (Washington, DC, October 1995). 1995:Energy Information Administration, Office of IntegratedAnalysis and Forecasting. Projections: AEO97 NationalEnergy Modeling System, runs AEO97B.D100296K,LWOP97.D100696A, and HWOP97.D100296B.
Figure 80. Lower 48 oil reserve additions in threecases, 1970-2015 (page 58): 1970-1976: Energy Informa-tion Administration, Office of Integrated Analysis andForecasting, computations based on well reports submittedto the American Petroleum Institute. 1977-1994: EnergyInformation Administration, U.S. Crude Oil, Natural Gas,and Natural Gas Liquids Reserves, DOE/EIA-0216(94)
92 Energy Information Administration/ Annual Energy Outlook 1997

Notes and Sources
(Washington, DC, October 1995). 1995: EnergyInformation Administration, Office of Integrated Analysisand Forecasting. Projections: AEO97 National EnergyModeling System, runs AEO97B.D100296K,LWOP97.D100696A, and HWOP97.D100296B.
Figure 81. Natural gas production by source, 1970-2015 (page 59): History: • Total Production, 1970-1991:Energy Information Administration, Annual Energy Re-view 1993, DOE/EIA-0384(93) (Washington, DC, July1994). 1992-1994: Energy Information Administration,Natural Gas Annual 1994, DOE/EIA-0131(94) (Washing-ton, DC, October 1995). 1995: Energy Information Admin-istration, Office of Integrated Analysis and Forecasting.• Alaska, 1970-1984: Energy Information Administration,Natural Gas Annual 1985, DOE/EIA-013(85) (Washington,DC, October 1986). 1985-1989: Energy Information Ad-ministration, Natural Gas Annual 1989, DOE/EIA-0131(89) (Washington, DC, September 1990). 1990-1994:Energy Information Administration, Natural Gas Annual1994, DOE/EIA-0131(94) (Washington, DC, November1995). 1995: Energy Information Administration, Office ofIntegrated Analysis and Forecasting. • Offshore, 1970-1976: Minerals Management Service, Federal OffshoreStatistics: 1991. 1977-1994: Energy Information Adminis-tration, U.S. Crude Oil, Natural Gas, and Natural GasLiquids Reserves, DOE/EIA-216 (annual reports, 1977-1994). 1995: Energy Information Administration, Office ofIntegrated Analysis and Forecasting. • UnconventionalGas, 1978-1986: Energy Information Administration,Drilling and Production Under Title I of the Natural GasPolicy Act, 1978-1986, DOE/EIA-0448 (Washington, DC,January 1989). Preliminary 1987-1995: Energy Informa-tion Administration, Office of Integrated Analysis andForecasting. • Associated-Dissolved and NonassociatedGas, 1970-1976: American Petroleum Institute, Reservesof Crude Oil, Natural Gas Liquids, and Natural Gas inthe United States and Canada (annual reports, 1970-1976). 1977-1994: Energy Information Administration,U.S. Crude Oil, Natural Gas, and Natural Gas LiquidsReserves, DOE/EIA-0216 (annual reports, 1977-1994).1995: Energy Information Administration, Office of Inte-grated Analysis and Forecasting. Projections: AEO97National Energy Modeling System, run AEO97B.D100296K. Note: Unconventional gas recovery consistsprincipally of production from reservoirs with low perme-ability (tight sands) but also includes methane from coalseams and gas from Devonian shales.
Figure 82. Natural gas production, consumption, andimports, 1970-2015 (page 59): History: EnergyInformation Administration, Annual Energy Review 1995,DOE/EIA-0384(95) (Washington, DC, July 1996). Projec-tions: Tables A13 and C13.
Figure 83. Natural gas consumption in five cases,1970-2015 (page 60): History: Energy Information Ad-ministration, Annual Energy Review 1995, DOE/EIA-
0384(95) (Washington, DC, July 1996). Projections:Tables A13, B13, and C13.
Figure 84. Pipeline capacity expansion by Censusdivision, 1995-2015 (page 60): AEO97 National EnergyModeling System, run AEO97B.D100296K.
Figure 85. Pipeline capacity utilization by Censusdivision, 1995 and 2015 (page 60): Note: Only regionswith significant changes between 1994 and 2015 areshown in the graph. Source: AEO97 National EnergyModeling System, run AEO97B.D100296K.
Figure 86. Natural gas end-use prices by sector, 1970-2015 (page 61): History: Energy Information Ad-ministration, Annual Energy Review 1995, DOE/EIA-0384(95) (Washington, DC, July 1996). Projections: TableA14.
Figure 87. Wellhead share of natural gas end-useprices by sector, 1970-2015 (page 61): History: EnergyInformation Administration, Annual Energy Review 1995,DOE/EIA-0384(95) (Washington, DC, July 1996). Projec-tions: AEO97 National Energy Modeling System, runAEO97B.D100296K.
Figure 88. Lower 48 natural gas production andwellhead prices in the low economic growth case,1995-2015 (page 62): Tables B13 and B14.
Figure 89. Lower 48 natural gas wellhead prices inthree cases, 1970-2015 (page 62): History: Energy Infor-mation Administration, Annual Energy Review 1995,DOE/EIA-0384(95) (Washington, DC, July 1996). Projec-tions: Tables A14 and F8. Note: Prices are converted to1995 dollars.
Figure 90. Lower 48 natural gas production in alter-native technology cases, 1995-2015 (page 63): TablesA13 and F8.
Figure 91. Lower 48 oil production in alternativetechnology cases, 1995-2015 (page 63): Tables A11 andF8.
Figure 92. Crude oil production by source, 1970-2015(page 64): History: • Total Production and Alaska, 1970-1992: Energy Information Administration, Annual EnergyReview 1993, DOE/EIA-0384(93) (Washington, DC, July1994). 1993-1995: Energy Information Administration,Petroleum Supply Annual, DOE/EIA-0384(95) (Washing-ton, DC, June 1996). • Lower 48 Offshore, 1970-1985: U.S.Department of the Interior, Federal Offshore Statistics:1985. 1986-1995: Energy Information Administration,Petroleum Supply Annual, DOE/EIA-0340 (annual reports,1986-1995). • Lower 48 Onshore: Energy InformationAdministration, Office of Integrated Analysis and Fore-casting. • Lower 48 Conventional: Energy InformationAdministration, Office of Integrated Analysis and Fore-casting. • Lower 48 Enhanced Oil Recovery: Energy Infor-mation Administration, Office of Integrated Analysis andForecasting. Projections: Table A15.
Energy Information Administration/ Annual Energy Outlook 1997 93

Notes and Sources
Figure 93. Petroleum production, consumption, andimports, 1970-2015 (page 64): History: Energy Informa-tion Administration, Annual Energy Review 1995, DOE/EIA-0384(95) (Washington, DC, July 1996). Projections:Tables A11 and C11. Note: Production includes domesticcrude oil and natural gas plant liquids, other crudesupply, other inputs, and refinery processing gain.
Figure 94. Share of U.S. petroleum consumptionsupplied by net imports, 1970-2015 (page 65): History:Energy Information Administration, Annual Energy Re-view 1995, DOE/EIA-0384(95) (Washington, DC, July1996). Projections: Tables A11 and C11.
Figure 95. Domestic refining capacity, 1975-2015(page 65): History: Energy Information Administration,Annual Energy Review 1995, DOE/EIA-0384(95) (Wash-ington, DC, July 1996). Projections: Tables A11 and B11.
Figure 96. Change in petroleum products supplied infive cases, 1995 to 2015 (page 66): 1995: Energy Infor-mation Administration, Petroleum Supply Annual 1995,DOE/EIA-0340(95)/1 (Washington, DC, May 1996). 2015:AEO97 National Energy Modeling System, runsAEO97B.D100296K, LWOP97.D100696A, HWOP97.D100296B, LMAC97.D100396A, and HMAC97.D100296A.
Figure 97. Components of refined product costs, 1995and 2015 (page 66): Taxes: J.E. Sinor Consultants, Inc.,Clean Fuels Report, Vol. 7, No. 1 (February 1995), andFederal Highway Administration, Monthly Motor FuelsReport by State (Washington, DC, March 1996). 1995:Estimated from Energy Information Administration,Petroleum Marketing Annual 1995, DOE/EIA-0487(95)(Washington, DC, August 1996), Tables 2 and 4. 2015:Estimated from AEO97 National Energy Modeling System,run AEO97B.D100296K.
Figure 98. Coal production by region, 1970-2015 (page67): History: Energy Information Administration, AnnualEnergy Review 1995, DOE/EIA-0384(95) (Washington, DC,July 1996). Projections: Table A16.
Figure 99. Average minemouth price of coal by re-gion, 1990-2015 (page 67): History: Energy InformationAdministration, Coal Industry Annual 1995, DOE/EIA-0584(95) (Washington, DC, November 1996). Projections:AEO97 National Energy Modeling System, run AEO97B.D100296K.
Figure 100. Coal mining labor productivity by region,1990-2015 (page 67): History: Energy InformationAdministration, Coal Industry Annual 1995, DOE/EIA-0584(95) (Washington, DC, November 1996). Projections:AEO97 National Energy Modeling System, run AEO97B.D100296K.
Figure 101. Labor cost component of minemouth coalprices, 1970-2015 (page 68): History: U.S. Departmentof Labor, Bureau of Labor Statistics (1995), and EnergyInformation Administration, Annual Energy Review 1995,DOE/EIA-0384(95) (Washington, DC, July 1996). Projec-tions: AEO97 National Energy Modeling System, runAEO97B.D100296K.
Figure 102. Average minemouth coal prices in threecases, 1995-2015 (page 68): Tables A16 and F10.
Figure 103. Percent change in coal transportationcosts in three cases, 1995-2015 (page 69): AEO97National Energy Modeling System, runs AEO97B.D100296K, LWOP97.D100696A, and HWOP97.D100296B.
Figure 104. Variation from reference case projectionof coal demand in 2015 in two alternative cases (page69): Tables A16 and B16.
Figure 105. Electricity and other coal consumption,1970-2015 (page 70): History: Energy Information Ad-ministration, Annual Energy Review 1995, DOE/EIA-0384(95) (Washington, DC, July 1996), and Short-TermEnergy Outlook, DOE/EIA-0202(96/4Q) (Washington, DC,October 1996). Projections: Table A16.
Figure 106. Non-electricity coal consumption by sec-tor, 1995, 2000, and 2015 (page 70): Table A16.
Figure 107. U.S. coal exports by destination, 1995,2000, and 2015 (page 71): History: U.S. Department ofCommerce, Bureau of the Census, “Monthly Report EM545.” Projections: AEO97 National Energy ModelingSystem, run AEO97B.D100296K.
Figure 108. Coal distribution by sulfur content, 1995,2000, and 2015 (page 71): AEO97 National Energy Mod-eling System, run AEO97B.D100296K.
Figure 109. Carbon emissions by sector, 1990-2015(page 72): History: Energy Information Administration,Emissions of Greenhouse Gases in the United States 1987-1994, DOE/EIA-0573(94) (Washington, DC, October 1995).Projections: Table A19.
Figure 110. Carbon emissions per capita, 1990-2015(page 72): History: Energy Information Administration,Emissions of Greenhouse Gases in the United States 1987-1994, DOE/EIA-0573(94) (Washington, DC, October 1995);and Annual Energy Review 1995, DOE/EIA-0384(95)(Washington, DC, July 1996). Projections: Table A19.
Figure 111. Carbon emissions by fuel, 1990-2015 (page73): History: Energy Information Administration, Emis-sions of Greenhouse Gases in the United States 1987-1994,DOE/EIA-0573(94) (Washington, DC, October 1995). Pro-jections: Table A19.
Figure 112. Carbon emissions from electricity gen-eration by fuel, 1990-2015 (page 73): History: EnergyInformation Administration, Emissions of GreenhouseGases in the United States 1987-1994, DOE/EIA-0573(94)(Washington, DC, October 1995). Projections: Table A19.
Figure 113. Sulfur dioxide emissions from electricitygeneration, 1990-2015 (page 74): History: Energy Infor-mation Administration, Annual Energy Review 1995,DOE/EIA-0384(95) (Washington, DC, July 1996). Projec-tions: AEO97 National Energy Modeling System, runAEO97B.D100296K.
Figure 114. Nitrogen oxide emissions from electricitygeneration, 1995-2015 (page 74): AEO97 National Ener-gy Modeling System, run AEO97B.D100296K.
94 Energy Information Administration/ Annual Energy Outlook 1997

Appendixes
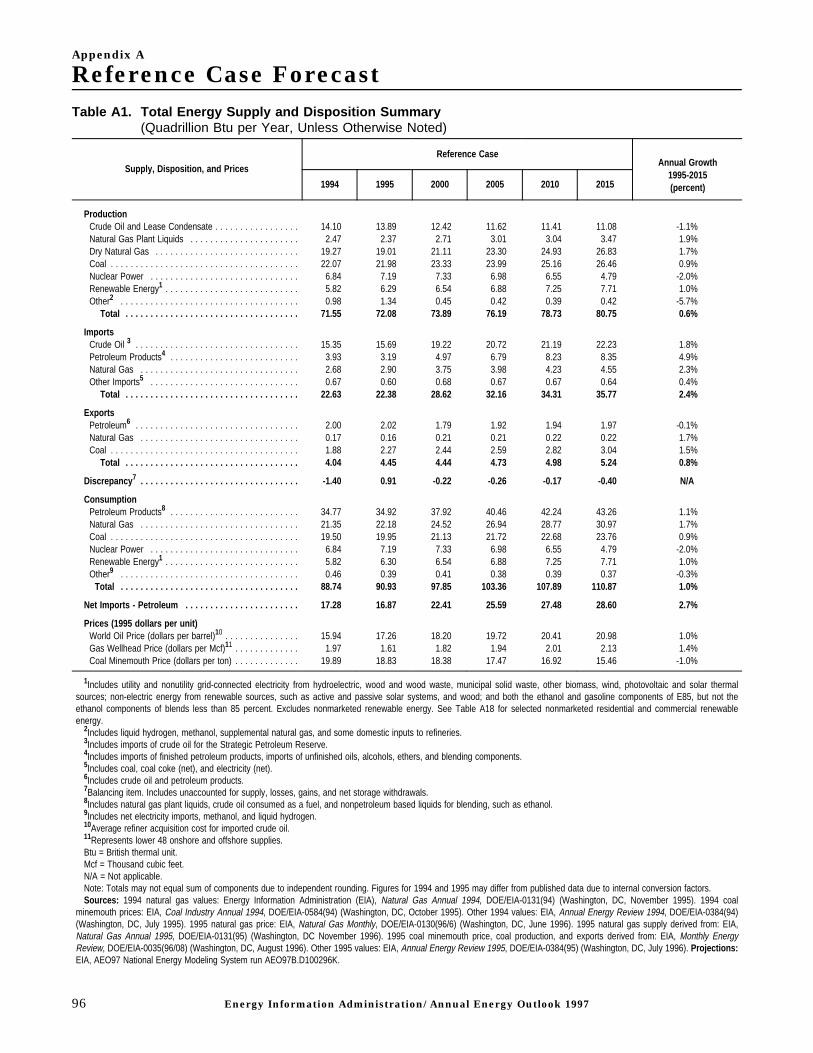
Appendix A
Reference Case ForecastTable A1. Total Energy Supply and Disposition Summary
(Quadrillion Btu per Year, Unless Otherwise Noted)
Supply, Disposition, and Prices
Reference CaseAnnual Growth
1995-2015(percent)1994 1995 2000 2005 2010 2015
ProductionCrude Oil and Lease Condensate . . . . . . . . . . . . . . . . . 14.10 13.89 12.42 11.62 11.41 11.08 -1.1%Natural Gas Plant Liquids . . . . . . . . . . . . . . . . . . . . . . 2.47 2.37 2.71 3.01 3.04 3.47 1.9%Dry Natural Gas . . . . . . . . . . . . . . . . . . . . . . . . . . . . . 19.27 19.01 21.11 23.30 24.93 26.83 1.7%Coal . . . . . . . . . . . . . . . . . . . . . . . . . . . . . . . . . . . . . . 22.07 21.98 23.33 23.99 25.16 26.46 0.9%Nuclear Power . . . . . . . . . . . . . . . . . . . . . . . . . . . . . . 6.84 7.19 7.33 6.98 6.55 4.79 -2.0%Renewable Energy1 . . . . . . . . . . . . . . . . . . . . . . . . . . . 5.82 6.29 6.54 6.88 7.25 7.71 1.0%Other2 . . . . . . . . . . . . . . . . . . . . . . . . . . . . . . . . . . . . 0.98 1.34 0.45 0.42 0.39 0.42 -5.7%
Total . . . . . . . . . . . . . . . . . . . . . . . . . . . . . . . . . . . 71.55 72.08 73.89 76.19 78.73 80.75 0.6%
ImportsCrude Oil 3 . . . . . . . . . . . . . . . . . . . . . . . . . . . . . . . . . 15.35 15.69 19.22 20.72 21.19 22.23 1.8%Petroleum Products4 . . . . . . . . . . . . . . . . . . . . . . . . . . 3.93 3.19 4.97 6.79 8.23 8.35 4.9%Natural Gas . . . . . . . . . . . . . . . . . . . . . . . . . . . . . . . . 2.68 2.90 3.75 3.98 4.23 4.55 2.3%Other Imports5 . . . . . . . . . . . . . . . . . . . . . . . . . . . . . . 0.67 0.60 0.68 0.67 0.67 0.64 0.4%
Total . . . . . . . . . . . . . . . . . . . . . . . . . . . . . . . . . . . 22.63 22.38 28.62 32.16 34.31 35.77 2.4%
ExportsPetroleum6 . . . . . . . . . . . . . . . . . . . . . . . . . . . . . . . . . 2.00 2.02 1.79 1.92 1.94 1.97 -0.1%Natural Gas . . . . . . . . . . . . . . . . . . . . . . . . . . . . . . . . 0.17 0.16 0.21 0.21 0.22 0.22 1.7%Coal . . . . . . . . . . . . . . . . . . . . . . . . . . . . . . . . . . . . . . 1.88 2.27 2.44 2.59 2.82 3.04 1.5%
Total . . . . . . . . . . . . . . . . . . . . . . . . . . . . . . . . . . . 4.04 4.45 4.44 4.73 4.98 5.24 0.8%
Discrepancy 7 . . . . . . . . . . . . . . . . . . . . . . . . . . . . . . . . -1.40 0.91 -0.22 -0.26 -0.17 -0.40 N/A
ConsumptionPetroleum Products8 . . . . . . . . . . . . . . . . . . . . . . . . . . 34.77 34.92 37.92 40.46 42.24 43.26 1.1%Natural Gas . . . . . . . . . . . . . . . . . . . . . . . . . . . . . . . . 21.35 22.18 24.52 26.94 28.77 30.97 1.7%Coal . . . . . . . . . . . . . . . . . . . . . . . . . . . . . . . . . . . . . . 19.50 19.95 21.13 21.72 22.68 23.76 0.9%Nuclear Power . . . . . . . . . . . . . . . . . . . . . . . . . . . . . . 6.84 7.19 7.33 6.98 6.55 4.79 -2.0%Renewable Energy1 . . . . . . . . . . . . . . . . . . . . . . . . . . . 5.82 6.30 6.54 6.88 7.25 7.71 1.0%Other9 . . . . . . . . . . . . . . . . . . . . . . . . . . . . . . . . . . . . 0.46 0.39 0.41 0.38 0.39 0.37 -0.3%
Total . . . . . . . . . . . . . . . . . . . . . . . . . . . . . . . . . . . . 88.74 90.93 97.85 103.36 107.89 110.87 1.0%
Net Imports - Petroleum . . . . . . . . . . . . . . . . . . . . . . . 17.28 16.87 22.41 25.59 27.48 28.60 2.7%
Prices (1995 dollars per unit)World Oil Price (dollars per barrel)10 . . . . . . . . . . . . . . . 15.94 17.26 18.20 19.72 20.41 20.98 1.0%Gas Wellhead Price (dollars per Mcf)11 . . . . . . . . . . . . . 1.97 1.61 1.82 1.94 2.01 2.13 1.4%Coal Minemouth Price (dollars per ton) . . . . . . . . . . . . . 19.89 18.83 18.38 17.47 16.92 15.46 -1.0%
1Includes utility and nonutility grid-connected electricity from hydroelectric, wood and wood waste, municipal solid waste, other biomass, wind, photovoltaic and solar thermalsources; non-electric energy from renewable sources, such as active and passive solar systems, and wood; and both the ethanol and gasoline components of E85, but not theethanol components of blends less than 85 percent. Excludes nonmarketed renewable energy. See Table A18 for selected nonmarketed residential and commercial renewableenergy.
2Includes liquid hydrogen, methanol, supplemental natural gas, and some domestic inputs to refineries.3Includes imports of crude oil for the Strategic Petroleum Reserve.4Includes imports of finished petroleum products, imports of unfinished oils, alcohols, ethers, and blending components.5Includes coal, coal coke (net), and electricity (net).6Includes crude oil and petroleum products.7Balancing item. Includes unaccounted for supply, losses, gains, and net storage withdrawals.8Includes natural gas plant liquids, crude oil consumed as a fuel, and nonpetroleum based liquids for blending, such as ethanol.9Includes net electricity imports, methanol, and liquid hydrogen.10Average refiner acquisition cost for imported crude oil.11Represents lower 48 onshore and offshore supplies.Btu = British thermal unit.Mcf = Thousand cubic feet.N/A = Not applicable.Note: Totals may not equal sum of components due to independent rounding. Figures for 1994 and 1995 may differ from published data due to internal conversion factors.Sources: 1994 natural gas values: Energy Information Administration (EIA), Natural Gas Annual 1994, DOE/EIA-0131(94) (Washington, DC, November 1995). 1994 coal
minemouth prices: EIA, Coal Industry Annual 1994, DOE/EIA-0584(94) (Washington, DC, October 1995). Other 1994 values: EIA, Annual Energy Review 1994, DOE/EIA-0384(94)(Washington, DC, July 1995). 1995 natural gas price: EIA, Natural Gas Monthly, DOE/EIA-0130(96/6) (Washington, DC, June 1996). 1995 natural gas supply derived from: EIA,Natural Gas Annual 1995, DOE/EIA-0131(95) (Washington, DC November 1996). 1995 coal minemouth price, coal production, and exports derived from: EIA, Monthly EnergyReview, DOE/EIA-0035(96/08) (Washington, DC, August 1996). Other 1995 values: EIA, Annual Energy Review 1995, DOE/EIA-0384(95) (Washington, DC, July 1996). Projections:EIA, AEO97 National Energy Modeling System run AEO97B.D100296K.
96 Energy Information Administration/ Annual Energy Outlook 1997
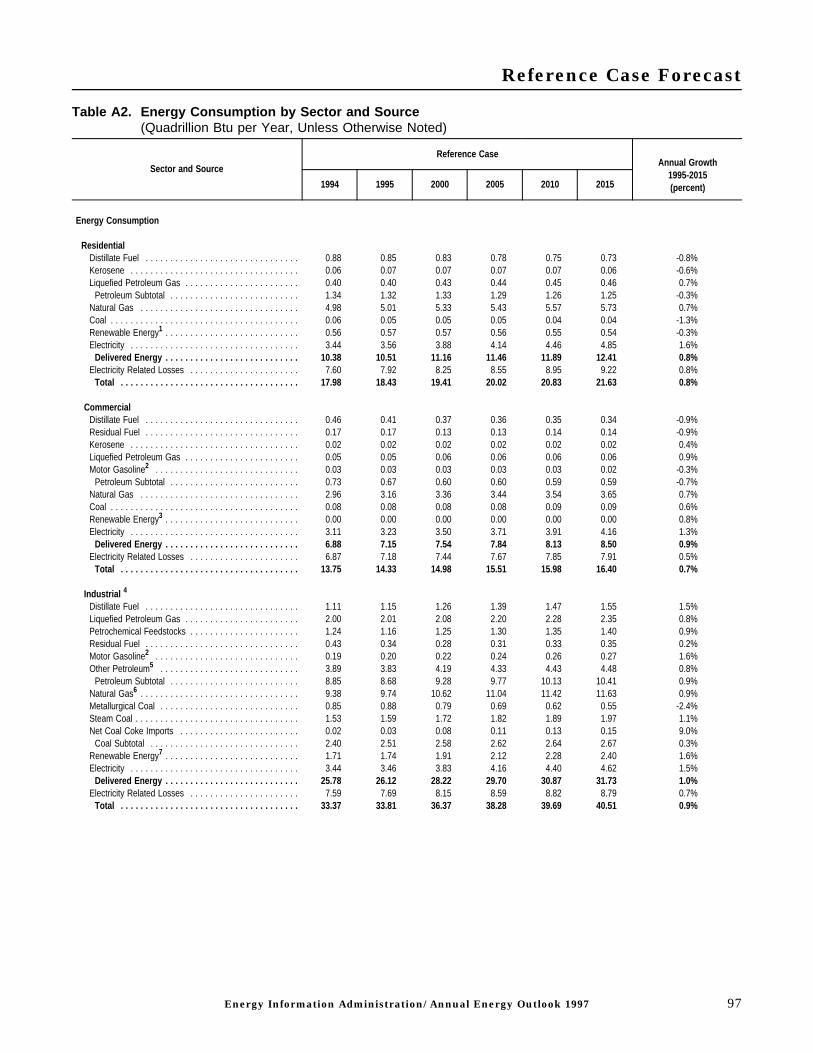
Reference Case Forecast
Table A2. Energy Consumption by Sector and Source(Quadrillion Btu per Year, Unless Otherwise Noted)
Sector and Source
Reference CaseAnnual Growth
1995-2015(percent)1994 1995 2000 2005 2010 2015
Energy Consumption
ResidentialDistillate Fuel . . . . . . . . . . . . . . . . . . . . . . . . . . . . . . . 0.88 0.85 0.83 0.78 0.75 0.73 -0.8%Kerosene . . . . . . . . . . . . . . . . . . . . . . . . . . . . . . . . . . 0.06 0.07 0.07 0.07 0.07 0.06 -0.6%Liquefied Petroleum Gas . . . . . . . . . . . . . . . . . . . . . . . 0.40 0.40 0.43 0.44 0.45 0.46 0.7%
Petroleum Subtotal . . . . . . . . . . . . . . . . . . . . . . . . . . 1.34 1.32 1.33 1.29 1.26 1.25 -0.3%Natural Gas . . . . . . . . . . . . . . . . . . . . . . . . . . . . . . . . 4.98 5.01 5.33 5.43 5.57 5.73 0.7%Coal . . . . . . . . . . . . . . . . . . . . . . . . . . . . . . . . . . . . . . 0.06 0.05 0.05 0.05 0.04 0.04 -1.3%Renewable Energy1 . . . . . . . . . . . . . . . . . . . . . . . . . . . 0.56 0.57 0.57 0.56 0.55 0.54 -0.3%Electricity . . . . . . . . . . . . . . . . . . . . . . . . . . . . . . . . . . 3.44 3.56 3.88 4.14 4.46 4.85 1.6%
Delivered Energy . . . . . . . . . . . . . . . . . . . . . . . . . . . 10.38 10.51 11.16 11.46 11.89 12.41 0.8%Electricity Related Losses . . . . . . . . . . . . . . . . . . . . . . 7.60 7.92 8.25 8.55 8.95 9.22 0.8%
Total . . . . . . . . . . . . . . . . . . . . . . . . . . . . . . . . . . . . 17.98 18.43 19.41 20.02 20.83 21.63 0.8%
CommercialDistillate Fuel . . . . . . . . . . . . . . . . . . . . . . . . . . . . . . . 0.46 0.41 0.37 0.36 0.35 0.34 -0.9%Residual Fuel . . . . . . . . . . . . . . . . . . . . . . . . . . . . . . . 0.17 0.17 0.13 0.13 0.14 0.14 -0.9%Kerosene . . . . . . . . . . . . . . . . . . . . . . . . . . . . . . . . . . 0.02 0.02 0.02 0.02 0.02 0.02 0.4%Liquefied Petroleum Gas . . . . . . . . . . . . . . . . . . . . . . . 0.05 0.05 0.06 0.06 0.06 0.06 0.9%Motor Gasoline2 . . . . . . . . . . . . . . . . . . . . . . . . . . . . . 0.03 0.03 0.03 0.03 0.03 0.02 -0.3%
Petroleum Subtotal . . . . . . . . . . . . . . . . . . . . . . . . . . 0.73 0.67 0.60 0.60 0.59 0.59 -0.7%Natural Gas . . . . . . . . . . . . . . . . . . . . . . . . . . . . . . . . 2.96 3.16 3.36 3.44 3.54 3.65 0.7%Coal . . . . . . . . . . . . . . . . . . . . . . . . . . . . . . . . . . . . . . 0.08 0.08 0.08 0.08 0.09 0.09 0.6%Renewable Energy3 . . . . . . . . . . . . . . . . . . . . . . . . . . . 0.00 0.00 0.00 0.00 0.00 0.00 0.8%Electricity . . . . . . . . . . . . . . . . . . . . . . . . . . . . . . . . . . 3.11 3.23 3.50 3.71 3.91 4.16 1.3%
Delivered Energy . . . . . . . . . . . . . . . . . . . . . . . . . . . 6.88 7.15 7.54 7.84 8.13 8.50 0.9%Electricity Related Losses . . . . . . . . . . . . . . . . . . . . . . 6.87 7.18 7.44 7.67 7.85 7.91 0.5%
Total . . . . . . . . . . . . . . . . . . . . . . . . . . . . . . . . . . . . 13.75 14.33 14.98 15.51 15.98 16.40 0.7%
Industrial 4
Distillate Fuel . . . . . . . . . . . . . . . . . . . . . . . . . . . . . . . 1.11 1.15 1.26 1.39 1.47 1.55 1.5%Liquefied Petroleum Gas . . . . . . . . . . . . . . . . . . . . . . . 2.00 2.01 2.08 2.20 2.28 2.35 0.8%Petrochemical Feedstocks . . . . . . . . . . . . . . . . . . . . . . 1.24 1.16 1.25 1.30 1.35 1.40 0.9%Residual Fuel . . . . . . . . . . . . . . . . . . . . . . . . . . . . . . . 0.43 0.34 0.28 0.31 0.33 0.35 0.2%Motor Gasoline2 . . . . . . . . . . . . . . . . . . . . . . . . . . . . . 0.19 0.20 0.22 0.24 0.26 0.27 1.6%Other Petroleum5 . . . . . . . . . . . . . . . . . . . . . . . . . . . . 3.89 3.83 4.19 4.33 4.43 4.48 0.8%
Petroleum Subtotal . . . . . . . . . . . . . . . . . . . . . . . . . . 8.85 8.68 9.28 9.77 10.13 10.41 0.9%Natural Gas6 . . . . . . . . . . . . . . . . . . . . . . . . . . . . . . . . 9.38 9.74 10.62 11.04 11.42 11.63 0.9%Metallurgical Coal . . . . . . . . . . . . . . . . . . . . . . . . . . . . 0.85 0.88 0.79 0.69 0.62 0.55 -2.4%Steam Coal . . . . . . . . . . . . . . . . . . . . . . . . . . . . . . . . . 1.53 1.59 1.72 1.82 1.89 1.97 1.1%Net Coal Coke Imports . . . . . . . . . . . . . . . . . . . . . . . . 0.02 0.03 0.08 0.11 0.13 0.15 9.0%
Coal Subtotal . . . . . . . . . . . . . . . . . . . . . . . . . . . . . . 2.40 2.51 2.58 2.62 2.64 2.67 0.3%Renewable Energy7 . . . . . . . . . . . . . . . . . . . . . . . . . . . 1.71 1.74 1.91 2.12 2.28 2.40 1.6%Electricity . . . . . . . . . . . . . . . . . . . . . . . . . . . . . . . . . . 3.44 3.46 3.83 4.16 4.40 4.62 1.5%
Delivered Energy . . . . . . . . . . . . . . . . . . . . . . . . . . . 25.78 26.12 28.22 29.70 30.87 31.73 1.0%Electricity Related Losses . . . . . . . . . . . . . . . . . . . . . . 7.59 7.69 8.15 8.59 8.82 8.79 0.7%
Total . . . . . . . . . . . . . . . . . . . . . . . . . . . . . . . . . . . . 33.37 33.81 36.37 38.28 39.69 40.51 0.9%
Energy Information Administration/ Annual Energy Outlook 1997 97

Reference Case Forecast
Table A2. Energy Consumption by Sector and Source (Continued)(Quadrillion Btu per Year, Unless Otherwise Noted)
Sector and Source
Reference CaseAnnual Growth
1995-2015(percent)1994 1995 2000 2005 2010 2015
TransportationDistillate Fuel . . . . . . . . . . . . . . . . . . . . . . . . . . . . . . . 4.18 4.42 4.97 5.46 5.78 6.00 1.5%Jet Fuel 8 . . . . . . . . . . . . . . . . . . . . . . . . . . . . . . . . . . 3.15 3.13 3.83 4.26 4.67 4.95 2.3%Motor Gasoline2 . . . . . . . . . . . . . . . . . . . . . . . . . . . . . 14.36 14.65 15.76 16.61 17.09 17.11 0.8%Residual Fuel . . . . . . . . . . . . . . . . . . . . . . . . . . . . . . . 0.90 1.08 1.29 1.47 1.64 1.78 2.5%Liquefied Petroleum Gas . . . . . . . . . . . . . . . . . . . . . . . 0.03 0.03 0.04 0.11 0.18 0.21 10.7%Other Petroleum9 . . . . . . . . . . . . . . . . . . . . . . . . . . . . 0.25 0.26 0.29 0.31 0.33 0.34 1.4%
Petroleum Subtotal . . . . . . . . . . . . . . . . . . . . . . . . . . 22.86 23.56 26.17 28.22 29.69 30.39 1.3%Pipeline Fuel Natural Gas . . . . . . . . . . . . . . . . . . . . . . 0.70 0.72 0.77 0.84 0.88 0.93 1.3%Compressed Natural Gas . . . . . . . . . . . . . . . . . . . . . . . 0.01 0.01 0.06 0.18 0.26 0.31 18.7%Renewable Energy (E85)10 . . . . . . . . . . . . . . . . . . . . . 0.00 0.00 0.00 0.02 0.07 0.10 22.7%Methanol 11 . . . . . . . . . . . . . . . . . . . . . . . . . . . . . . . . . 0.00 0.00 0.00 0.03 0.07 0.09 22.5%Liquid Hydrogen . . . . . . . . . . . . . . . . . . . . . . . . . . . . . 0.00 0.00 0.00 0.00 0.00 0.00 15.6%Electricity . . . . . . . . . . . . . . . . . . . . . . . . . . . . . . . . . . 0.02 0.02 0.02 0.08 0.14 0.17 11.4%
Delivered Energy . . . . . . . . . . . . . . . . . . . . . . . . . . . 23.60 24.31 27.04 29.38 31.11 31.99 1.4%Electricity Related Losses . . . . . . . . . . . . . . . . . . . . . . 0.04 0.04 0.05 0.17 0.28 0.32 10.5%
Total . . . . . . . . . . . . . . . . . . . . . . . . . . . . . . . . . . . . 23.64 24.36 27.09 29.55 31.39 32.32 1.4%
Delivered Energy Consumption for All SectorsDistillate Fuel . . . . . . . . . . . . . . . . . . . . . . . . . . . . . . . 6.63 6.82 7.43 7.98 8.35 8.62 1.2%Kerosene . . . . . . . . . . . . . . . . . . . . . . . . . . . . . . . . . . 0.10 0.11 0.11 0.11 0.11 0.11 -0.3%Jet Fuel 8 . . . . . . . . . . . . . . . . . . . . . . . . . . . . . . . . . . 3.15 3.13 3.83 4.26 4.67 4.95 2.3%Liquefied Petroleum Gas . . . . . . . . . . . . . . . . . . . . . . . 2.47 2.49 2.61 2.81 2.97 3.09 1.1%Motor Gasoline2 . . . . . . . . . . . . . . . . . . . . . . . . . . . . . 14.57 14.87 16.00 16.88 17.38 17.40 0.8%Petrochemical Feedstocks . . . . . . . . . . . . . . . . . . . . . . 1.24 1.16 1.25 1.30 1.35 1.40 0.9%Residual Fuel . . . . . . . . . . . . . . . . . . . . . . . . . . . . . . . 1.50 1.58 1.71 1.92 2.11 2.27 1.8%Other Petroleum12 . . . . . . . . . . . . . . . . . . . . . . . . . . . . 4.12 4.07 4.46 4.62 4.74 4.80 0.8%
Petroleum Subtotal . . . . . . . . . . . . . . . . . . . . . . . . . . 33.78 34.24 37.39 39.88 41.67 42.63 1.1%Natural Gas6 . . . . . . . . . . . . . . . . . . . . . . . . . . . . . . . . 18.03 18.64 20.13 20.93 21.68 22.26 0.9%Metallurgical Coal . . . . . . . . . . . . . . . . . . . . . . . . . . . . 0.85 0.88 0.79 0.69 0.62 0.55 -2.4%Steam Coal . . . . . . . . . . . . . . . . . . . . . . . . . . . . . . . . . 1.66 1.73 1.85 1.95 2.02 2.10 1.0%Net Coal Coke Imports . . . . . . . . . . . . . . . . . . . . . . . . 0.02 0.03 0.08 0.11 0.13 0.15 9.0%
Coal Subtotal . . . . . . . . . . . . . . . . . . . . . . . . . . . . . . 2.54 2.64 2.71 2.75 2.77 2.80 0.3%Renewable Energy13 . . . . . . . . . . . . . . . . . . . . . . . . . . 2.28 2.31 2.48 2.70 2.90 3.04 1.4%Methanol 11 . . . . . . . . . . . . . . . . . . . . . . . . . . . . . . . . . 0.00 0.00 0.00 0.03 0.07 0.09 22.5%Liquid Hydrogen . . . . . . . . . . . . . . . . . . . . . . . . . . . . . 0.00 0.00 0.00 0.00 0.00 0.00 15.6%Electricity . . . . . . . . . . . . . . . . . . . . . . . . . . . . . . . . . . 10.01 10.26 11.23 12.09 12.91 13.80 1.5%
Delivered Energy . . . . . . . . . . . . . . . . . . . . . . . . . . . 66.63 68.10 73.95 78.38 81.99 84.62 1.1%Electricity Related Losses . . . . . . . . . . . . . . . . . . . . . . 22.11 22.83 23.89 24.98 25.90 26.24 0.7%
Total . . . . . . . . . . . . . . . . . . . . . . . . . . . . . . . . . . . . 88.74 90.93 97.85 103.36 107.89 110.87 1.0%
Electric Generators 14
Distillate Fuel . . . . . . . . . . . . . . . . . . . . . . . . . . . . . . . 0.09 0.08 0.09 0.12 0.14 0.15 3.1%Residual Fuel . . . . . . . . . . . . . . . . . . . . . . . . . . . . . . . 0.90 0.60 0.44 0.46 0.43 0.48 -1.1%
Petroleum Subtotal . . . . . . . . . . . . . . . . . . . . . . . . . . 0.99 0.68 0.53 0.58 0.57 0.63 -0.4%Natural Gas . . . . . . . . . . . . . . . . . . . . . . . . . . . . . . . . 3.32 3.54 4.38 6.01 7.09 8.71 4.6%Steam Coal . . . . . . . . . . . . . . . . . . . . . . . . . . . . . . . . . 16.97 17.31 18.41 18.97 19.91 20.96 1.0%Nuclear Power . . . . . . . . . . . . . . . . . . . . . . . . . . . . . . 6.84 7.19 7.33 6.98 6.55 4.79 -2.0%Renewable Energy15 . . . . . . . . . . . . . . . . . . . . . . . . . . 3.54 3.99 4.05 4.18 4.36 4.67 0.8%Electricity Imports . . . . . . . . . . . . . . . . . . . . . . . . . . . . 0.46 0.39 0.41 0.36 0.32 0.28 -1.7%
Total . . . . . . . . . . . . . . . . . . . . . . . . . . . . . . . . . . . . 32.12 33.10 35.12 37.07 38.81 40.04 1.0%
98 Energy Information Administration/ Annual Energy Outlook 1997

Reference Case Forecast
Table A2. Energy Consumption by Sector and Source (Continued)(Quadrillion Btu per Year, Unless Otherwise Noted)
Sector and Source
Reference CaseAnnual Growth
1995-2015(percent)1994 1995 2000 2005 2010 2015
Total Energy ConsumptionDistillate Fuel . . . . . . . . . . . . . . . . . . . . . . . . . . . . . . . 6.72 6.90 7.51 8.11 8.49 8.77 1.2%Kerosene . . . . . . . . . . . . . . . . . . . . . . . . . . . . . . . . . . 0.10 0.11 0.11 0.11 0.11 0.11 -0.3%Jet Fuel 8 . . . . . . . . . . . . . . . . . . . . . . . . . . . . . . . . . . 3.15 3.13 3.83 4.26 4.67 4.95 2.3%Liquefied Petroleum Gas . . . . . . . . . . . . . . . . . . . . . . . 2.47 2.49 2.61 2.81 2.97 3.09 1.1%Motor Gasoline2 . . . . . . . . . . . . . . . . . . . . . . . . . . . . . 14.57 14.87 16.00 16.88 17.38 17.40 0.8%Petrochemical Feedstocks . . . . . . . . . . . . . . . . . . . . . . 1.24 1.16 1.25 1.30 1.35 1.40 0.9%Residual Fuel . . . . . . . . . . . . . . . . . . . . . . . . . . . . . . . 2.40 2.18 2.15 2.38 2.54 2.75 1.2%Other Petroleum12 . . . . . . . . . . . . . . . . . . . . . . . . . . . . 4.12 4.07 4.46 4.62 4.74 4.80 0.8%
Petroleum Subtotal . . . . . . . . . . . . . . . . . . . . . . . . . . 34.77 34.92 37.92 40.46 42.24 43.26 1.1%Natural Gas . . . . . . . . . . . . . . . . . . . . . . . . . . . . . . . . 21.35 22.18 24.52 26.94 28.77 30.97 1.7%Metallurgical Coal . . . . . . . . . . . . . . . . . . . . . . . . . . . . 0.85 0.88 0.79 0.69 0.62 0.55 -2.4%Steam Coal . . . . . . . . . . . . . . . . . . . . . . . . . . . . . . . . . 18.63 19.04 20.26 20.92 21.94 23.06 1.0%Net Coal Coke Imports . . . . . . . . . . . . . . . . . . . . . . . . 0.02 0.03 0.08 0.11 0.13 0.15 9.0%
Coal Subtotal . . . . . . . . . . . . . . . . . . . . . . . . . . . . . . 19.50 19.95 21.13 21.72 22.68 23.76 0.9%Nuclear Power . . . . . . . . . . . . . . . . . . . . . . . . . . . . . . 6.84 7.19 7.33 6.98 6.55 4.79 -2.0%Renewable Energy16 . . . . . . . . . . . . . . . . . . . . . . . . . . 5.82 6.30 6.54 6.88 7.25 7.71 1.0%Methanol 11 . . . . . . . . . . . . . . . . . . . . . . . . . . . . . . . . . 0.00 0.00 0.00 0.03 0.07 0.09 22.5%Liquid Hydrogen . . . . . . . . . . . . . . . . . . . . . . . . . . . . . 0.00 0.00 0.00 0.00 0.00 0.00 15.6%Electricity Imports . . . . . . . . . . . . . . . . . . . . . . . . . . . . 0.46 0.39 0.41 0.36 0.32 0.28 -1.7%
Total . . . . . . . . . . . . . . . . . . . . . . . . . . . . . . . . . . . . 88.74 90.93 97.85 103.36 107.89 110.87 1.0%
Energy Use and Related Statistics
Delivered Energy Use . . . . . . . . . . . . . . . . . . . . . . . . . . . 66.63 68.10 73.95 78.38 81.99 84.62 1.1%Total Energy Use . . . . . . . . . . . . . . . . . . . . . . . . . . . . . . 88.74 90.93 97.85 103.35 107.87 110.83 1.0%Population (millions) . . . . . . . . . . . . . . . . . . . . . . . . . . . . 261.03 263.58 275.62 287.12 298.92 311.19 0.8%Gross Domestic Product (billion 1992 dollars) . . . . . . . . . . 6604.23 6738.95 7543.85 8389.54 9185.32 9879.75 1.9%
1Includes wood used for residential heating. See Table A18 for estimates of nonmarketed renewable energy consumption for geothermal heat pumps and solar thermal hot waterheating.
2Includes ethanol (blends of 10 percent or less) and ethers blended into gasoline.3Includes commercial sector electricity cogenerated by using wood and wood waste, municipal solid waste, and other biomass. See Table A18 for estimates of nonmarketed
renewable energy consumption for solar thermal hot water heating.4Fuel consumption includes consumption for cogeneration.5Includes petroleum coke, asphalt, road oil, lubricants, still gas, and miscellaneous petroleum products.6Includes lease and plant fuel.7Includes consumption of energy from hydroelectric, wood and wood waste, municipal solid waste, and other biomass.8Includes naphtha and kerosene type.9Includes aviation gas and lubricants.10E85 is 85 percent ethanol (renewable) and 15 percent motor gasoline (nonrenewable).11Only M85 (85 percent methanol).12Includes unfinished oils, natural gasoline, motor gasoline blending compounds, aviation gasoline, lubricants, still gas, asphalt, road oil, petroleum coke, and miscellaneous
petroleum products.13Includes electricity generated for sale to electric utilities and for self use from renewable sources, and non-electric energy from renewable sources. Excludes nonmarketed
renewable energy consumption for geothermal heat pumps and solar thermal hot water heaters.14Includes consumption of energy by all electric power generators for grid-connected power except cogenerators, which produce electricity as a by-product of other processes.15Includes hydroelectric, geothermal, wood and wood waste, municipal solid waste, other biomass, E85, wind, photovoltaic and solar thermal sources.16Includes hydroelectric, geothermal, wood and wood waste, municipal solid waste, other biomass, wind, photovoltaic and solar thermal sources. Includes ethanol components of
E85; excludes ethanol blends (10 percent or less) in motor gasoline. Excludes nonmarketed renewable energy consumption for geothermal heat pumps and solar thermal hot waterheaters.
Btu = British thermal unit.Note: Totals may not equal sum of components due to independent rounding. Figures for 1994 and 1995 may differ from published data due to internal conversion factors.
Consumption values of 0.00 are values that round to 0.00, because they are less than 0.005.Sources: 1994 natural gas lease, plant, and pipeline fuel values: Energy Information Administration (EIA), Natural Gas Annual 1994, DOE/EIA-0131(94) (Washington, DC,
November 1995). 1995 natural gas lease, plant, and pipeline fuel values: EIA, Short-Term Energy Outlook, DOE/EIA-0202(96/4Q) (Washington, DC, October 1996). 1995transportation sector compressed natural gas consumption: EIA, AEO97 National Energy Modeling System run AEO97B.D100296K. 1994 and 1995 electric utility fuel consumption:EIA, Electric Power Annual, Volume I, DOE/EIA-0348(95)/1 (Washington, DC, July 1996). 1994 and 1995 nonutility consumption estimates: EIA Form 867, “Annual Nonutility PowerProducer Report.” Other 1994 values derived from: EIA, State Energy Data Report 1993, DOE/EIA-0214(93) (Washington, DC, July 1995) and Office of Coal, Nuclear, Electric, andAlternative Fuels estimates. Other 1995 values: EIA, Short-Term Energy Outlook, DOE/EIA-0202(96/4Q) (Washington, DC, October 1996). Projections: EIA, AEO97 National EnergyModeling System run AEO97B.D100296K.
Energy Information Administration/ Annual Energy Outlook 1997 99

Reference Case Forecast
Table A3. Energy Prices by Sector and Source(1995 Dollars per Million Btu)
Sector and Source
Reference CaseAnnual Growth
1995-2015(percent)1994 1995 2000 2005 2010 2015
Residential . . . . . . . . . . . . . . . . . . . . . . . . . . . . . . . . . . 13.18 12.87 12.73 12.70 12.61 12.55 -0.1%Primary Energy . . . . . . . . . . . . . . . . . . . . . . . . . . . . . . 6.64 6.28 6.16 6.09 5.95 5.83 -0.4%
Petroleum Products . . . . . . . . . . . . . . . . . . . . . . . . . . 7.76 7.51 8.48 8.75 9.08 8.95 0.9%Distillate Fuel . . . . . . . . . . . . . . . . . . . . . . . . . . . . . 6.49 6.24 7.03 7.28 7.45 7.33 0.8%Liquefied Petroleum Gas . . . . . . . . . . . . . . . . . . . . . 10.63 10.29 11.29 11.40 11.85 11.57 0.6%
Natural Gas . . . . . . . . . . . . . . . . . . . . . . . . . . . . . . . 6.39 6.01 5.63 5.49 5.27 5.18 -0.7%Electricity . . . . . . . . . . . . . . . . . . . . . . . . . . . . . . . . . . 25.29 24.67 24.09 23.49 22.88 22.28 -0.5%
Commercial . . . . . . . . . . . . . . . . . . . . . . . . . . . . . . . . . 13.50 13.12 12.86 12.60 12.48 12.28 -0.3%Primary Energy . . . . . . . . . . . . . . . . . . . . . . . . . . . . . . 5.21 4.82 4.70 4.69 4.59 4.54 -0.3%
Petroleum Products . . . . . . . . . . . . . . . . . . . . . . . . . . 4.59 4.58 5.15 5.34 5.52 5.42 0.8%Distillate Fuel . . . . . . . . . . . . . . . . . . . . . . . . . . . . . 4.54 4.39 5.06 5.28 5.44 5.32 1.0%Residual Fuel . . . . . . . . . . . . . . . . . . . . . . . . . . . . . 2.82 2.99 2.72 2.87 2.98 3.03 0.1%
Natural Gas1 . . . . . . . . . . . . . . . . . . . . . . . . . . . . . . . 5.46 4.96 4.70 4.65 4.51 4.48 -0.5%Electricity . . . . . . . . . . . . . . . . . . . . . . . . . . . . . . . . . . 23.53 23.19 22.29 21.38 20.98 20.35 -0.7%
Industrial 2 . . . . . . . . . . . . . . . . . . . . . . . . . . . . . . . . . . 5.21 5.02 4.87 4.96 5.05 4.99 0.0%Primary Energy . . . . . . . . . . . . . . . . . . . . . . . . . . . . . . 3.47 3.36 3.20 3.34 3.47 3.47 0.2%
Petroleum Products . . . . . . . . . . . . . . . . . . . . . . . . . . 4.70 4.92 4.41 4.60 4.80 4.68 -0.3%Distillate Fuel . . . . . . . . . . . . . . . . . . . . . . . . . . . . . 4.70 4.61 4.97 5.21 5.38 5.29 0.7%Liquefied Petroleum Gas . . . . . . . . . . . . . . . . . . . . . 6.33 6.53 5.98 6.00 6.28 5.95 -0.5%Residual Fuel . . . . . . . . . . . . . . . . . . . . . . . . . . . . . 2.55 2.55 2.73 2.92 3.03 3.01 0.8%
Natural Gas3 . . . . . . . . . . . . . . . . . . . . . . . . . . . . . . . 2.66 2.28 2.42 2.54 2.61 2.74 0.9%Metallurgical Coal . . . . . . . . . . . . . . . . . . . . . . . . . . . 1.78 1.75 1.74 1.72 1.58 1.48 -0.8%Steam Coal . . . . . . . . . . . . . . . . . . . . . . . . . . . . . . . 1.64 1.48 1.49 1.44 1.37 1.30 -0.7%
Electricity . . . . . . . . . . . . . . . . . . . . . . . . . . . . . . . . . . 15.00 14.54 14.10 13.46 13.13 12.56 -0.7%
Transportation . . . . . . . . . . . . . . . . . . . . . . . . . . . . . . . 7.97 7.92 8.39 8.51 8.55 8.21 0.2%Primary Energy . . . . . . . . . . . . . . . . . . . . . . . . . . . . . . 7.96 7.92 8.39 8.49 8.53 8.18 0.2%
Petroleum Products . . . . . . . . . . . . . . . . . . . . . . . . . . 7.96 7.92 8.39 8.51 8.54 8.19 0.2%Distillate Fuel 4 . . . . . . . . . . . . . . . . . . . . . . . . . . . . 8.23 8.03 8.67 8.70 8.68 8.38 0.2%Jet Fuel 5 . . . . . . . . . . . . . . . . . . . . . . . . . . . . . . . . 4.05 3.85 5.13 5.46 5.65 5.45 1.7%Motor Gasoline6 . . . . . . . . . . . . . . . . . . . . . . . . . . . 9.20 9.23 9.65 9.79 9.85 9.49 0.1%Residual Fuel . . . . . . . . . . . . . . . . . . . . . . . . . . . . . 2.08 2.44 2.66 2.90 3.16 3.08 1.2%
Natural Gas7 . . . . . . . . . . . . . . . . . . . . . . . . . . . . . . . 5.77 5.77 5.91 6.20 6.73 7.07 1.0%Electricity . . . . . . . . . . . . . . . . . . . . . . . . . . . . . . . . . . 15.31 15.14 15.01 14.45 14.25 13.85 -0.4%
Total End-Use Energy . . . . . . . . . . . . . . . . . . . . . . . . . 8.39 8.22 8.28 8.31 8.34 8.18 0.0%Primary Energy . . . . . . . . . . . . . . . . . . . . . . . . . . . . . . 7.98 7.82 7.93 7.98 8.01 7.82 0.0%Electricity . . . . . . . . . . . . . . . . . . . . . . . . . . . . . . . . . . 21.19 20.77 20.11 19.33 18.89 18.34 -0.6%
Electric Generators 8
Fossil Fuel Average . . . . . . . . . . . . . . . . . . . . . . . . . . . 1.59 1.48 1.50 1.53 1.54 1.55 0.2%Petroleum Products . . . . . . . . . . . . . . . . . . . . . . . . . . 2.76 2.78 3.09 3.35 3.59 3.52 1.2%
Distillate Fuel . . . . . . . . . . . . . . . . . . . . . . . . . . . . . 4.07 3.94 4.52 4.77 4.92 4.83 1.0%Residual Fuel . . . . . . . . . . . . . . . . . . . . . . . . . . . . . 2.63 2.62 2.81 2.97 3.15 3.11 0.9%
Natural Gas . . . . . . . . . . . . . . . . . . . . . . . . . . . . . . . 2.29 2.01 2.19 2.28 2.32 2.47 1.0%Steam Coal . . . . . . . . . . . . . . . . . . . . . . . . . . . . . . . 1.38 1.32 1.29 1.24 1.20 1.11 -0.9%
100 Energy Information Administration/ Annual Energy Outlook 1997

Reference Case Forecast
Table A3. Energy Prices by Sector and Source (Continued)(1995 Dollars per Million Btu)
Sector and Source
Reference CaseAnnual Growth
1995-2015(percent)1994 1995 2000 2005 2010 2015
Average Price to All Users 9
Petroleum Products . . . . . . . . . . . . . . . . . . . . . . . . . . . 6.98 7.07 7.37 7.52 7.62 7.33 0.2%Distillate Fuel 4 . . . . . . . . . . . . . . . . . . . . . . . . . . . . . 7.11 6.98 7.64 7.75 7.80 7.56 0.4%Jet Fuel . . . . . . . . . . . . . . . . . . . . . . . . . . . . . . . . . . 4.05 3.85 5.13 5.46 5.65 5.45 1.7%Liquefied Petroleum Gas . . . . . . . . . . . . . . . . . . . . . . 7.09 7.20 7.05 7.20 7.61 7.32 0.1%Motor Gasoline6 . . . . . . . . . . . . . . . . . . . . . . . . . . . . 9.20 9.23 9.63 9.77 9.83 9.47 0.1%Residual Fuel . . . . . . . . . . . . . . . . . . . . . . . . . . . . . . 2.43 2.55 2.70 2.91 3.13 3.07 0.9%
Natural Gas . . . . . . . . . . . . . . . . . . . . . . . . . . . . . . . . 3.98 3.57 3.49 3.45 3.39 3.42 -0.2%Coal . . . . . . . . . . . . . . . . . . . . . . . . . . . . . . . . . . . . . . 1.42 1.35 1.31 1.25 1.21 1.13 -0.9%Electricity . . . . . . . . . . . . . . . . . . . . . . . . . . . . . . . . . . 21.19 20.77 20.11 19.33 18.89 18.34 -0.6%
1Excludes independent power producers.2Includes cogenerators.3Excludes uses for lease and plant fuel.4Includes Federal and State taxes on diesel fuel and excludes county and local taxes.5Kerosene-type jet fuel.6Sales weighted-average price for all grades. Includes Federal and State taxes and excludes county and local taxes.7Compressed natural gas used as a vehicle fuel. Price includes estimated motor vehicle fuel taxes.8Includes all electric power generators except cogenerators, which produce electricity as a by-product of other processes.9Weighted averages of end-use fuel prices are derived from the prices shown in each sector and the corresponding sectoral consumption.Btu = British thermal unit.Note: 1994 and 1995 figures may differ from published data due to internal rounding.Sources: 1994 prices for gasoline, distillate, and jet fuel are based on prices in the Energy Information Administration (EIA), Petroleum Marketing Annual 1994, DOE/EIA-0487(94)
(Washington, DC, August 1995). 1995 prices for gasoline, distillate, and jet fuel are based on prices in various 1995 issues of EIA, Petroleum Marketing Monthly, DOE/EIA-0380(95/1-12) (Washington, DC, 1995). 1994 and 1995 prices for all other petroleum products are derived from the EIA, State Energy Price and Expenditure Report 1993, DOE/EIA-0376(93) (Washington, DC, December 1995). 1994 residential, commercial, and transportation natural gas delivered prices: EIA, Natural Gas Annual 1994, DOE/EIA-0131(94)(Washington, DC, November 1995). 1994 electric generators natural gas delivered prices: Form FERC-423, “Monthly Report of Cost and Quality of Fuels for Electric Plants.” 1994and 1995 industrial gas delivered prices are based on EIA, Manufacturing Energy Consumption Survey 1991. 1995 residential and commercial natural gas delivered prices: EIA,Natural Gas Monthly, DOE/EIA-0130(96/6) (Washington, DC, June 1996). Other 1995 natural gas delivered prices: EIA, AEO97 National Energy Modeling System runAEO97B.D100296K. Values for 1994 coal prices have been estimated from EIA, State Energy Price and Expenditure Report 1993, DOE/EIA-0376(93) (Washington, DC, December1995) by use of consumption quantities aggregated from EIA, State Energy Data Report 1993, Consumption Estimates, DOE/EIA-0214(93) (Washington, DC, July 1995). Values for1995 coal prices have been estimated from EIA, State Energy Price and Expenditure Report 1993, DOE/EIA-0376(93) (Washington, DC, December 1995) by use of consumptionquantities aggregated from EIA, State Energy Data Report 1993, Consumption Estimates, DOE/EIA-0214(93) (Washington, DC, July 1995). 1994 residential electricity prices derivedfrom EIA, Short Term Energy Outlook, DOE/EIA-0202(96/4Q) (Washington, DC, October 1996). 1994 and 1995 electricity prices for commercial, industrial, and transportation: EIA,AEO97 National Energy Modeling System run AEO97B.D100296K. Projections: EIA, AEO97 National Energy Modeling System run AEO97B.D100296K.
Energy Information Administration/ Annual Energy Outlook 1997 101

Reference Case Forecast
Table A4. Residential Sector Key Indicators and Consumption(Quadrillion Btu per Year, Unless Otherwise Noted)
Key Indicators and Consumption
Reference CaseAnnual Growth
1995-2015(percent)1994 1995 2000 2005 2010 2015
Household Characteristics
Households (millions)Single-Family . . . . . . . . . . . . . . . . . . . . . . . . . . . . . . . 67.79 68.66 72.62 76.85 80.93 85.07 1.1%Multifamily . . . . . . . . . . . . . . . . . . . . . . . . . . . . . . . . . 24.39 24.56 25.53 26.98 28.67 30.45 1.1%Mobile Homes . . . . . . . . . . . . . . . . . . . . . . . . . . . . . . . 5.69 5.83 6.30 6.64 6.89 7.12 1.0%
Total . . . . . . . . . . . . . . . . . . . . . . . . . . . . . . . . . . . . 97.88 99.06 104.45 110.47 116.49 122.65 1.1%
Housing Starts (millions)Single-Family . . . . . . . . . . . . . . . . . . . . . . . . . . . . . . . 1.19 1.08 1.05 1.08 1.03 1.09 N/AMultifamily . . . . . . . . . . . . . . . . . . . . . . . . . . . . . . . . . 0.25 0.28 0.36 0.42 0.48 0.48 N/AMobile Homes . . . . . . . . . . . . . . . . . . . . . . . . . . . . . . . 0.30 0.34 0.29 0.29 0.28 0.29 N/A
Total . . . . . . . . . . . . . . . . . . . . . . . . . . . . . . . . . . . . 1.75 1.70 1.70 1.80 1.79 1.86 N/A
Average House Square Footage . . . . . . . . . . . . . . . . . 1637 1643 1666 1683 1696 1708 0.2%
Energy Intensity
Million Btu Consumed per HouseholdDelivered Energy Consumption . . . . . . . . . . . . . . . . . . 106.06 106.10 106.81 103.78 102.06 101.19 -0.2%Electricity Related Losses . . . . . . . . . . . . . . . . . . . . . . 77.61 79.94 79.03 77.43 76.80 75.20 -0.3%Total Energy Consumption . . . . . . . . . . . . . . . . . . . . . . 183.67 186.03 185.84 181.21 178.86 176.39 -0.3%
Thousand Btu Consumed per Square FootDelivered Energy Consumption . . . . . . . . . . . . . . . . . . 64.77 64.57 64.13 61.65 60.16 59.26 -0.4%Electricity Related Losses . . . . . . . . . . . . . . . . . . . . . . 47.40 48.65 47.45 46.00 45.27 44.04 -0.5%Total Energy Consumption . . . . . . . . . . . . . . . . . . . . . . 112.17 113.22 111.58 107.64 105.43 103.29 -0.5%
Delivered Energy Consumption by Fuel
DistillateSpace Heating . . . . . . . . . . . . . . . . . . . . . . . . . . . . . . 0.78 0.76 0.73 0.69 0.65 0.63 -0.9%Water Heating . . . . . . . . . . . . . . . . . . . . . . . . . . . . . . . 0.10 0.09 0.10 0.10 0.10 0.10 0.2%Other Uses1 . . . . . . . . . . . . . . . . . . . . . . . . . . . . . . . . 0.00 0.00 0.00 0.00 0.00 0.00 0.5%
Delivered Energy . . . . . . . . . . . . . . . . . . . . . . . . . . . 0.88 0.85 0.83 0.78 0.75 0.73 -0.8%
Liquefied Petroleum GasSpace Heating . . . . . . . . . . . . . . . . . . . . . . . . . . . . . . 0.29 0.30 0.31 0.32 0.32 0.32 0.4%Water Heating . . . . . . . . . . . . . . . . . . . . . . . . . . . . . . . 0.06 0.06 0.08 0.08 0.09 0.09 1.9%Cooking2 . . . . . . . . . . . . . . . . . . . . . . . . . . . . . . . . . . . 0.03 0.03 0.03 0.03 0.03 0.03 -0.2%Other Uses3 . . . . . . . . . . . . . . . . . . . . . . . . . . . . . . . . 0.01 0.01 0.01 0.01 0.01 0.01 1.6%
Delivered Energy . . . . . . . . . . . . . . . . . . . . . . . . . . . 0.40 0.40 0.43 0.44 0.45 0.46 0.7%
Natural GasSpace Heating . . . . . . . . . . . . . . . . . . . . . . . . . . . . . . 3.45 3.48 3.74 3.79 3.88 3.96 0.7%Space Cooling . . . . . . . . . . . . . . . . . . . . . . . . . . . . . . 0.00 0.00 0.01 0.01 0.02 0.02 12.9%Water Heating . . . . . . . . . . . . . . . . . . . . . . . . . . . . . . . 1.25 1.25 1.30 1.34 1.39 1.45 0.7%Cooking2 . . . . . . . . . . . . . . . . . . . . . . . . . . . . . . . . . . . 0.15 0.15 0.14 0.14 0.14 0.14 -0.3%Clothes Dryers . . . . . . . . . . . . . . . . . . . . . . . . . . . . . . 0.04 0.05 0.05 0.05 0.05 0.05 0.6%Other Uses3 . . . . . . . . . . . . . . . . . . . . . . . . . . . . . . . . 0.09 0.09 0.09 0.10 0.10 0.11 1.1%
Delivered Energy . . . . . . . . . . . . . . . . . . . . . . . . . . . 4.98 5.01 5.33 5.43 5.57 5.73 0.7%
ElectricitySpace Heating . . . . . . . . . . . . . . . . . . . . . . . . . . . . . . 0.42 0.43 0.46 0.47 0.48 0.49 0.7%Space Cooling . . . . . . . . . . . . . . . . . . . . . . . . . . . . . . 0.45 0.48 0.47 0.48 0.49 0.51 0.3%Water Heating . . . . . . . . . . . . . . . . . . . . . . . . . . . . . . . 0.35 0.35 0.36 0.37 0.38 0.39 0.5%Refrigeration . . . . . . . . . . . . . . . . . . . . . . . . . . . . . . . . 0.42 0.40 0.35 0.33 0.31 0.31 -1.3%Cooking . . . . . . . . . . . . . . . . . . . . . . . . . . . . . . . . . . . 0.12 0.12 0.13 0.13 0.14 0.14 0.7%Clothes Dryers . . . . . . . . . . . . . . . . . . . . . . . . . . . . . . 0.18 0.18 0.19 0.20 0.21 0.22 0.9%Freezers . . . . . . . . . . . . . . . . . . . . . . . . . . . . . . . . . . . 0.14 0.13 0.11 0.09 0.08 0.08 -2.5%Lighting . . . . . . . . . . . . . . . . . . . . . . . . . . . . . . . . . . . 0.31 0.32 0.33 0.34 0.35 0.36 0.7%Other Uses4 . . . . . . . . . . . . . . . . . . . . . . . . . . . . . . . . 1.06 1.15 1.49 1.73 2.02 2.35 3.7%
Delivered Energy . . . . . . . . . . . . . . . . . . . . . . . . . . . 3.44 3.56 3.88 4.14 4.46 4.85 1.6%
102 Energy Information Administration/ Annual Energy Outlook 1997

Reference Case Forecast
Table A4. Residential Sector Key Indicators and Consumption (Continued)(Quadrillion Btu per Year, Unless Otherwise Noted)
Key Indicators and Consumption
Reference CaseAnnual Growth
1995-2015(percent)1994 1995 2000 2005 2010 2015
Marketed RenewablesWood5 . . . . . . . . . . . . . . . . . . . . . . . . . . . . . . . . . . . . 0.56 0.57 0.57 0.56 0.55 0.54 -0.3%
Delivered Energy . . . . . . . . . . . . . . . . . . . . . . . . . . . 0.56 0.57 0.57 0.56 0.55 0.54 -0.3%
Other Fuels 6 . . . . . . . . . . . . . . . . . . . . . . . . . . . . . . . . 0.12 0.13 0.12 0.11 0.11 0.10 -0.9%
Delivered Energy Consumption by End-UseSpace Heating . . . . . . . . . . . . . . . . . . . . . . . . . . . . . . 5.62 5.65 5.93 5.94 5.99 6.05 0.3%Space Cooling . . . . . . . . . . . . . . . . . . . . . . . . . . . . . . 0.45 0.48 0.47 0.49 0.51 0.53 0.5%Water Heating . . . . . . . . . . . . . . . . . . . . . . . . . . . . . . . 1.76 1.75 1.83 1.88 1.95 2.03 0.7%Refrigeration . . . . . . . . . . . . . . . . . . . . . . . . . . . . . . . . 0.42 0.40 0.35 0.33 0.31 0.31 -1.3%Cooking . . . . . . . . . . . . . . . . . . . . . . . . . . . . . . . . . . . 0.30 0.30 0.30 0.30 0.30 0.31 0.2%Clothes Dryers . . . . . . . . . . . . . . . . . . . . . . . . . . . . . . 0.22 0.23 0.24 0.24 0.26 0.27 0.9%Freezers . . . . . . . . . . . . . . . . . . . . . . . . . . . . . . . . . . . 0.14 0.13 0.11 0.09 0.08 0.08 -2.5%Lighting . . . . . . . . . . . . . . . . . . . . . . . . . . . . . . . . . . . 0.31 0.32 0.33 0.34 0.35 0.36 0.7%Other Uses7 . . . . . . . . . . . . . . . . . . . . . . . . . . . . . . . . 1.15 1.24 1.59 1.84 2.14 2.47 3.5%
Delivered Energy . . . . . . . . . . . . . . . . . . . . . . . . . . . 10.38 10.51 11.16 11.46 11.89 12.41 0.8%
Electricity Related Losses by End-UseSpace Heating . . . . . . . . . . . . . . . . . . . . . . . . . . . . . . 0.92 0.95 0.97 0.97 0.96 0.94 -0.1%Space Cooling . . . . . . . . . . . . . . . . . . . . . . . . . . . . . . 0.99 1.07 0.99 0.99 0.99 0.97 -0.5%Water Heating . . . . . . . . . . . . . . . . . . . . . . . . . . . . . . . 0.78 0.78 0.76 0.76 0.76 0.74 -0.2%Refrigeration . . . . . . . . . . . . . . . . . . . . . . . . . . . . . . . . 0.92 0.90 0.75 0.67 0.62 0.59 -2.1%Cooking . . . . . . . . . . . . . . . . . . . . . . . . . . . . . . . . . . . 0.27 0.27 0.27 0.27 0.28 0.27 0.0%Clothes Dryers . . . . . . . . . . . . . . . . . . . . . . . . . . . . . . 0.40 0.40 0.40 0.41 0.42 0.41 0.2%Freezers . . . . . . . . . . . . . . . . . . . . . . . . . . . . . . . . . . . 0.30 0.29 0.23 0.19 0.16 0.15 -3.3%Lighting . . . . . . . . . . . . . . . . . . . . . . . . . . . . . . . . . . . 0.69 0.70 0.70 0.71 0.71 0.69 -0.1%Other Uses7 . . . . . . . . . . . . . . . . . . . . . . . . . . . . . . . . 2.33 2.55 3.17 3.58 4.05 4.47 2.8%
Total Electricity Related Losses . . . . . . . . . . . . . . . 7.60 7.92 8.25 8.55 8.95 9.22 0.8%
Total Energy Consumption by End-UseSpace Heating . . . . . . . . . . . . . . . . . . . . . . . . . . . . . . 6.54 6.61 6.90 6.91 6.96 6.99 0.3%Space Cooling . . . . . . . . . . . . . . . . . . . . . . . . . . . . . . 1.43 1.56 1.47 1.49 1.49 1.50 -0.2%Water Heating . . . . . . . . . . . . . . . . . . . . . . . . . . . . . . . 2.54 2.53 2.59 2.64 2.71 2.77 0.4%Refrigeration . . . . . . . . . . . . . . . . . . . . . . . . . . . . . . . . 1.34 1.30 1.10 1.00 0.93 0.89 -1.9%Cooking . . . . . . . . . . . . . . . . . . . . . . . . . . . . . . . . . . . 0.58 0.58 0.57 0.57 0.58 0.59 0.1%Clothes Dryers . . . . . . . . . . . . . . . . . . . . . . . . . . . . . . 0.62 0.63 0.64 0.65 0.67 0.68 0.4%Freezers . . . . . . . . . . . . . . . . . . . . . . . . . . . . . . . . . . . 0.44 0.42 0.34 0.28 0.24 0.23 -3.0%Lighting . . . . . . . . . . . . . . . . . . . . . . . . . . . . . . . . . . . 1.00 1.02 1.03 1.05 1.06 1.05 0.2%Other Uses7 . . . . . . . . . . . . . . . . . . . . . . . . . . . . . . . . 3.49 3.79 4.76 5.43 6.19 6.94 3.1%
Total . . . . . . . . . . . . . . . . . . . . . . . . . . . . . . . . . . . . 17.98 18.43 19.41 20.02 20.83 21.63 0.8%
Non-Marketed RenewablesGeothermal 8 . . . . . . . . . . . . . . . . . . . . . . . . . . . . . . . 0.01 0.01 0.02 0.04 0.05 0.07 9.4%Solar9 . . . . . . . . . . . . . . . . . . . . . . . . . . . . . . . . . . . . . 0.01 0.01 0.01 0.01 0.01 0.01 -0.3%
Total . . . . . . . . . . . . . . . . . . . . . . . . . . . . . . . . . . . . 0.02 0.02 0.03 0.05 0.06 0.08 6.5%
1Includes such appliances as swimming pool and hot tub heaters.2Does not include outdoor grills.3Includes such appliances as swimming pool heaters, outdoor grills, and outdoor lighting (natural gas).4Includes such appliances as microwave ovens, television sets, and dishwashers.5Includes wood used for primary and secondary heating in wood stoves or fireplaces as reported in the Residential Energy Consumption Survey 1993.6Includes kerosene and coal.7Includes such appliances as swimming pool heaters, hot tub heaters, outdoor grills, outdoor lighting (natural gas), microwave ovens, television sets, and dishwashers.8Includes primary energy displaced by geothermal heat pumps in space heating and cooling applications.9Includes primary energy displaced by solar thermal water heaters.Btu = British thermal unit.N/A = Not applicable.Note: Totals may not equal sum of components due to independent rounding.Sources: 1994 data derived from: Energy Information Administration (EIA), State Energy Data Report 1993, DOE/EIA-0214(93) (Washington, DC, July 1995). 1995: EIA, Short-
Term Energy Outlook, DOE/EIA-0202(96/4Q) (Washington, DC, October 1996). Projections: EIA, AEO97 National Energy Modeling System run AEO97B.D100296K.
Energy Information Administration/ Annual Energy Outlook 1997 103

Reference Case Forecast
Table A5. Commercial Sector Key Indicators and Consumption(Quadrillion Btu per Year, Unless Otherwise Noted)
Key Indicators and Consumption
Reference CaseAnnual Growth
1995-2015(percent)1994 1995 2000 2005 2010 2015
Key Indicators
Total Floor Space (billion square feet)Surviving . . . . . . . . . . . . . . . . . . . . . . . . . . . . . . . . . . 68.1 68.9 72.8 76.0 79.1 82.5 0.9%New Additions . . . . . . . . . . . . . . . . . . . . . . . . . . . . . . . 1.7 1.7 1.5 1.5 1.6 1.8 0.1%
Total . . . . . . . . . . . . . . . . . . . . . . . . . . . . . . . . . . . . 69.8 70.7 74.3 77.5 80.7 84.2 0.9%
Energy Consumption Intensity(thousand Btu per square foot)
Delivered Energy Consumption . . . . . . . . . . . . . . . . . . 98.6 101.2 101.5 101.1 100.7 100.9 0.0%Electricity Related Losses . . . . . . . . . . . . . . . . . . . . . . 98.4 101.6 100.1 99.0 97.3 93.9 -0.4%Total Energy Consumption . . . . . . . . . . . . . . . . . . . . . . 197.0 202.8 201.6 200.1 198.0 194.8 -0.2%
Delivered Energy Consumption by Fuel
ElectricitySpace Heating . . . . . . . . . . . . . . . . . . . . . . . . . . . . . . 0.11 0.11 0.12 0.12 0.12 0.13 0.7%Space Cooling . . . . . . . . . . . . . . . . . . . . . . . . . . . . . . 0.53 0.58 0.52 0.52 0.52 0.53 -0.4%Water Heating . . . . . . . . . . . . . . . . . . . . . . . . . . . . . . . 0.17 0.17 0.16 0.15 0.14 0.13 -1.5%Ventilation . . . . . . . . . . . . . . . . . . . . . . . . . . . . . . . . . . 0.17 0.17 0.18 0.18 0.19 0.20 0.7%Cooking . . . . . . . . . . . . . . . . . . . . . . . . . . . . . . . . . . . 0.03 0.03 0.03 0.03 0.03 0.03 -1.0%Lighting . . . . . . . . . . . . . . . . . . . . . . . . . . . . . . . . . . . 1.19 1.21 1.30 1.32 1.32 1.36 0.6%Refrigeration . . . . . . . . . . . . . . . . . . . . . . . . . . . . . . . . 0.14 0.14 0.15 0.15 0.16 0.17 1.0%Office Equipment (PC) . . . . . . . . . . . . . . . . . . . . . . . . . 0.07 0.07 0.09 0.09 0.10 0.10 1.9%Office Equipment (non-PC) . . . . . . . . . . . . . . . . . . . . . 0.18 0.18 0.20 0.22 0.25 0.27 2.0%Other Uses1 . . . . . . . . . . . . . . . . . . . . . . . . . . . . . . . . 0.52 0.56 0.75 0.92 1.08 1.24 4.0%
Delivered Energy . . . . . . . . . . . . . . . . . . . . . . . . . . . 3.11 3.23 3.50 3.71 3.91 4.16 1.3%
Natural Gas 2
Space Heating . . . . . . . . . . . . . . . . . . . . . . . . . . . . . . 1.26 1.30 1.33 1.34 1.36 1.38 0.3%Space Cooling . . . . . . . . . . . . . . . . . . . . . . . . . . . . . . 0.02 0.03 0.03 0.03 0.03 0.03 0.8%Water Heating . . . . . . . . . . . . . . . . . . . . . . . . . . . . . . . 0.47 0.48 0.48 0.50 0.52 0.55 0.7%Cooking . . . . . . . . . . . . . . . . . . . . . . . . . . . . . . . . . . . 0.18 0.18 0.20 0.21 0.23 0.25 1.4%Other Uses3 . . . . . . . . . . . . . . . . . . . . . . . . . . . . . . . . 1.02 1.17 1.32 1.36 1.40 1.45 1.1%
Delivered Energy . . . . . . . . . . . . . . . . . . . . . . . . . . . 2.96 3.16 3.36 3.44 3.54 3.65 0.7%
DistillateSpace Heating . . . . . . . . . . . . . . . . . . . . . . . . . . . . . . 0.19 0.20 0.18 0.17 0.16 0.15 -1.2%Water Heating . . . . . . . . . . . . . . . . . . . . . . . . . . . . . . . 0.06 0.06 0.05 0.05 0.05 0.04 -1.2%Other Uses4 . . . . . . . . . . . . . . . . . . . . . . . . . . . . . . . . 0.22 0.15 0.14 0.14 0.14 0.14 -0.4%
Delivered Energy . . . . . . . . . . . . . . . . . . . . . . . . . . . 0.46 0.41 0.37 0.36 0.35 0.34 -0.9%
Other Fuels 5 . . . . . . . . . . . . . . . . . . . . . . . . . . . . . . . . 0.35 0.35 0.32 0.32 0.33 0.34 -0.1%
Marketed Renewable FuelsBiomass . . . . . . . . . . . . . . . . . . . . . . . . . . . . . . . . . . . 0.00 0.00 0.00 0.00 0.00 0.00 0.8%
Delivered Energy . . . . . . . . . . . . . . . . . . . . . . . . . . . 0.00 0.00 0.00 0.00 0.00 0.00 0.8%
Delivered Energy Consumption by End-UseSpace Heating . . . . . . . . . . . . . . . . . . . . . . . . . . . . . . 1.56 1.61 1.63 1.63 1.64 1.66 0.1%Space Cooling . . . . . . . . . . . . . . . . . . . . . . . . . . . . . . 0.56 0.61 0.55 0.55 0.55 0.56 -0.4%Water Heating . . . . . . . . . . . . . . . . . . . . . . . . . . . . . . . 0.70 0.70 0.70 0.70 0.70 0.72 0.1%Ventilation . . . . . . . . . . . . . . . . . . . . . . . . . . . . . . . . . . 0.17 0.17 0.18 0.18 0.19 0.20 0.7%Cooking . . . . . . . . . . . . . . . . . . . . . . . . . . . . . . . . . . . 0.21 0.22 0.23 0.24 0.26 0.27 1.1%Lighting . . . . . . . . . . . . . . . . . . . . . . . . . . . . . . . . . . . 1.19 1.21 1.30 1.32 1.32 1.36 0.6%Refrigeration . . . . . . . . . . . . . . . . . . . . . . . . . . . . . . . . 0.14 0.14 0.15 0.15 0.16 0.17 1.0%Office Equipment (PC) . . . . . . . . . . . . . . . . . . . . . . . . . 0.07 0.07 0.09 0.09 0.10 0.10 1.9%Office Equipment (non-PC) . . . . . . . . . . . . . . . . . . . . . 0.18 0.18 0.20 0.22 0.25 0.27 2.0%Other Uses6 . . . . . . . . . . . . . . . . . . . . . . . . . . . . . . . . 2.11 2.24 2.52 2.75 2.96 3.18 1.8%
Delivered Energy . . . . . . . . . . . . . . . . . . . . . . . . . . . 6.88 7.15 7.54 7.84 8.13 8.50 0.9%
104 Energy Information Administration/ Annual Energy Outlook 1997

Reference Case Forecast
Table A5. Commercial Sector Key Indicators and Consumption (Continued)(Quadrillion Btu per Year, Unless Otherwise Noted)
Key Indicators and Consumption
Reference CaseAnnual Growth
1995-2015(percent)1994 1995 2000 2005 2010 2015
Electricity Related Losses by End-UseSpace Heating . . . . . . . . . . . . . . . . . . . . . . . . . . . . . . 0.25 0.25 0.25 0.25 0.25 0.25 -0.1%Space Cooling . . . . . . . . . . . . . . . . . . . . . . . . . . . . . . 1.18 1.29 1.11 1.07 1.05 1.01 -1.2%Water Heating . . . . . . . . . . . . . . . . . . . . . . . . . . . . . . . 0.38 0.38 0.35 0.31 0.28 0.24 -2.3%Ventilation . . . . . . . . . . . . . . . . . . . . . . . . . . . . . . . . . . 0.37 0.38 0.37 0.37 0.38 0.37 -0.1%Cooking . . . . . . . . . . . . . . . . . . . . . . . . . . . . . . . . . . . 0.07 0.07 0.06 0.06 0.06 0.05 -1.8%Lighting . . . . . . . . . . . . . . . . . . . . . . . . . . . . . . . . . . . 2.63 2.68 2.77 2.72 2.65 2.58 -0.2%Refrigeration . . . . . . . . . . . . . . . . . . . . . . . . . . . . . . . . 0.31 0.31 0.31 0.32 0.33 0.33 0.2%Office Equipment (PC) . . . . . . . . . . . . . . . . . . . . . . . . . 0.15 0.16 0.18 0.19 0.20 0.20 1.1%Office Equipment (non-PC) . . . . . . . . . . . . . . . . . . . . . 0.39 0.40 0.43 0.46 0.49 0.52 1.3%Other Uses6 . . . . . . . . . . . . . . . . . . . . . . . . . . . . . . . . 1.15 1.25 1.60 1.91 2.17 2.35 3.2%
Total Electricity Related Losses . . . . . . . . . . . . . . . 6.87 7.18 7.44 7.67 7.85 7.91 0.5%
Total Energy Consumption by End-UseSpace Heating . . . . . . . . . . . . . . . . . . . . . . . . . . . . . . 1.81 1.87 1.88 1.88 1.89 1.91 0.1%Space Cooling . . . . . . . . . . . . . . . . . . . . . . . . . . . . . . 1.74 1.89 1.66 1.62 1.60 1.58 -0.9%Water Heating . . . . . . . . . . . . . . . . . . . . . . . . . . . . . . . 1.08 1.09 1.04 1.01 0.98 0.96 -0.6%Ventilation . . . . . . . . . . . . . . . . . . . . . . . . . . . . . . . . . . 0.54 0.55 0.55 0.55 0.56 0.57 0.2%Cooking . . . . . . . . . . . . . . . . . . . . . . . . . . . . . . . . . . . 0.28 0.29 0.30 0.30 0.31 0.32 0.6%Lighting . . . . . . . . . . . . . . . . . . . . . . . . . . . . . . . . . . . 3.82 3.89 4.07 4.04 3.97 3.94 0.1%Refrigeration . . . . . . . . . . . . . . . . . . . . . . . . . . . . . . . . 0.45 0.46 0.46 0.47 0.49 0.50 0.5%Office Equipment (PC) . . . . . . . . . . . . . . . . . . . . . . . . . 0.21 0.23 0.27 0.29 0.30 0.30 1.3%Office Equipment (non-PC) . . . . . . . . . . . . . . . . . . . . . 0.57 0.59 0.63 0.68 0.74 0.79 1.5%Other Uses6 . . . . . . . . . . . . . . . . . . . . . . . . . . . . . . . . 3.26 3.49 4.12 4.66 5.14 5.53 2.3%
Total . . . . . . . . . . . . . . . . . . . . . . . . . . . . . . . . . . . . 13.75 14.33 14.98 15.51 15.98 16.40 0.7%
Non-Marketed Renewable FuelsSolar7 . . . . . . . . . . . . . . . . . . . . . . . . . . . . . . . . . . . . . 0.01 0.01 0.02 0.03 0.03 0.04 5.8%
Total . . . . . . . . . . . . . . . . . . . . . . . . . . . . . . . . . . . . 0.01 0.01 0.02 0.03 0.03 0.04 5.8%
1Includes miscellaneous uses, such as service station equipment, district services, automated teller machines, telecommunications equipment, and medical equipment.2Excludes estimated consumption from independent power producers.3Includes miscellaneous uses, such as district services, pumps, lighting, emergency electric generators, and manufacturing performed in commercial buildings.4Includes miscellaneous uses, such as cooking, district services, and emergency electric generators.5Includes residual fuel oil, liquefied petroleum gas, coal, motor gasoline, and kerosene.6Includes miscellaneous uses, such as service station equipment, district services, automated teller machines, telecommunications equipment, medical equipment, pumps, lighting,
emergency electric generators, manufacturing performed in commercial buildings, and cooking (distillate), plus residual fuel oil, liquefied petroleum gas, coal, motor gasoline, andkerosene.
7Includes primary energy displaced by solar thermal water heaters.Btu = British thermal unit.PC = Personal computer.Note: Totals may not equal sum of components due to independent rounding.Sources: 1994 data derived from: Energy Information Administration (EIA), State Energy Data Report 1993, DOE/EIA-0214(93) (Washington, DC, July 1995). 1995: EIA, Short-
Term Energy Outlook, DOE/EIA-0202(96/4Q) (Washington, DC, October 1996). Projections: EIA, AEO97 National Energy Modeling System run AEO97B.D100296K.
Energy Information Administration/ Annual Energy Outlook 1997 105

Reference Case Forecast
Table A6. Industrial Sector Key Indicators and Consumption(Quadrillion Btu per Year, Unless Otherwise Noted)
Key Indicators and Consumption
Reference CaseAnnual Growth
1995-2015(percent)1994 1995 2000 2005 2010 2015
Key Indicators
Value of Gross Output (billion 1987 dollars)Manufacturing . . . . . . . . . . . . . . . . . . . . . . . . . . . . . . . 2826 2907 3280 3709 4117 4441 2.1%Nonmanufacturing . . . . . . . . . . . . . . . . . . . . . . . . . . . . 766 765 847 917 978 1028 1.5%
Total . . . . . . . . . . . . . . . . . . . . . . . . . . . . . . . . . . . . 3592 3672 4127 4626 5095 5469 2.0%
Energy Prices (1995 dollars per million Btu)Electricity . . . . . . . . . . . . . . . . . . . . . . . . . . . . . . . . . . 15.00 14.54 14.10 13.46 13.13 12.56 -0.7%Natural Gas . . . . . . . . . . . . . . . . . . . . . . . . . . . . . . . . 2.66 2.28 2.42 2.54 2.61 2.74 0.9%Steam Coal . . . . . . . . . . . . . . . . . . . . . . . . . . . . . . . . . 1.47 1.48 1.49 1.44 1.37 1.30 -0.7%Residual Oil . . . . . . . . . . . . . . . . . . . . . . . . . . . . . . . . 2.55 2.55 2.73 2.92 3.03 3.01 0.8%Distillate Oil . . . . . . . . . . . . . . . . . . . . . . . . . . . . . . . . 4.70 4.61 4.97 5.21 5.38 5.29 0.7%Liquefied Petroleum Gas . . . . . . . . . . . . . . . . . . . . . . . 6.33 6.53 5.98 6.00 6.28 5.95 -0.5%Motor Gasoline . . . . . . . . . . . . . . . . . . . . . . . . . . . . . . 9.18 9.18 8.34 8.63 8.85 8.65 -0.3%Metallurgical Coal . . . . . . . . . . . . . . . . . . . . . . . . . . . . 1.71 1.75 1.74 1.72 1.58 1.48 -0.8%
Energy Consumption
Consumption 1 (quadrillion Btu per year)Purchased Electricity . . . . . . . . . . . . . . . . . . . . . . . . . . 3.44 3.46 3.83 4.16 4.40 4.62 1.5%Natural Gas2 . . . . . . . . . . . . . . . . . . . . . . . . . . . . . . . . 9.38 9.74 10.62 11.04 11.42 11.63 0.9%Steam Coal . . . . . . . . . . . . . . . . . . . . . . . . . . . . . . . . . 1.53 1.59 1.72 1.82 1.89 1.97 1.1%Metallurgical Coal and Coke3 . . . . . . . . . . . . . . . . . . . . 0.87 0.91 0.87 0.80 0.75 0.70 -1.3%Residual Fuel . . . . . . . . . . . . . . . . . . . . . . . . . . . . . . . 0.43 0.34 0.28 0.31 0.33 0.35 0.2%Distillate . . . . . . . . . . . . . . . . . . . . . . . . . . . . . . . . . . . 1.11 1.15 1.26 1.39 1.47 1.55 1.5%Liquefied Petroleum Gas . . . . . . . . . . . . . . . . . . . . . . . 2.00 2.01 2.08 2.20 2.28 2.35 0.8%Petrochemical Feedstocks . . . . . . . . . . . . . . . . . . . . . . 1.24 1.16 1.25 1.30 1.35 1.40 0.9%Other Petroleum4 . . . . . . . . . . . . . . . . . . . . . . . . . . . . 4.08 4.03 4.41 4.57 4.69 4.75 0.8%Renewables5 . . . . . . . . . . . . . . . . . . . . . . . . . . . . . . . . 1.71 1.74 1.91 2.12 2.28 2.40 1.6%
Delivered Energy . . . . . . . . . . . . . . . . . . . . . . . . . . . 25.78 26.12 28.22 29.70 30.87 31.73 1.0%Electricity Related Losses . . . . . . . . . . . . . . . . . . . . . . 7.59 7.69 8.15 8.59 8.82 8.79 0.7%
Total . . . . . . . . . . . . . . . . . . . . . . . . . . . . . . . . . . . . 33.37 33.81 36.37 38.28 39.69 40.51 0.9%
Consumption per Unit of Output 1
(thousand Btu per 1987 dollar)Purchased Electricity . . . . . . . . . . . . . . . . . . . . . . . . . . 0.96 0.94 0.93 0.90 0.86 0.84 -0.5%Natural Gas2 . . . . . . . . . . . . . . . . . . . . . . . . . . . . . . . . 2.61 2.65 2.57 2.39 2.24 2.13 -1.1%Steam Coal . . . . . . . . . . . . . . . . . . . . . . . . . . . . . . . . . 0.43 0.43 0.42 0.39 0.37 0.36 -0.9%Metallurgical Coal and Coke3 . . . . . . . . . . . . . . . . . . . . 0.24 0.25 0.21 0.17 0.15 0.13 -3.3%Residual Fuel . . . . . . . . . . . . . . . . . . . . . . . . . . . . . . . 0.12 0.09 0.07 0.07 0.06 0.06 -1.8%Distillate . . . . . . . . . . . . . . . . . . . . . . . . . . . . . . . . . . . 0.31 0.31 0.31 0.30 0.29 0.28 -0.5%Liquefied Petroleum Gas . . . . . . . . . . . . . . . . . . . . . . . 0.56 0.55 0.50 0.48 0.45 0.43 -1.2%Petrochemical Feedstocks . . . . . . . . . . . . . . . . . . . . . . 0.34 0.32 0.30 0.28 0.27 0.26 -1.1%Other Petroleum4 . . . . . . . . . . . . . . . . . . . . . . . . . . . . 1.14 1.10 1.07 0.99 0.92 0.87 -1.2%Renewables5 . . . . . . . . . . . . . . . . . . . . . . . . . . . . . . . . 0.48 0.47 0.46 0.46 0.45 0.44 -0.4%
Delivered Energy . . . . . . . . . . . . . . . . . . . . . . . . . . . 7.18 7.11 6.84 6.42 6.06 5.80 -1.0%Electricity Related Losses . . . . . . . . . . . . . . . . . . . . . . 2.11 2.09 1.97 1.86 1.73 1.61 -1.3%
Total . . . . . . . . . . . . . . . . . . . . . . . . . . . . . . . . . . . . 9.29 9.21 8.81 8.28 7.79 7.41 -1.1%
1Fuel consumption includes consumption for cogeneration.2Includes lease and plant fuel.3Includes net coke coal imports.4Includes petroleum coke, asphalt, road oil, lubricants, motor gasoline, still gas, and miscellaneous petroleum products.5Includes consumption of energy from hydroelectric, wood and wood waste, municipal solid waste, and other biomass.Btu = British thermal unit.Note: Totals may not equal sum of components due to independent rounding.Sources: 1994 prices for gasoline and distillate are based on prices in the Energy Information Administration (EIA), Petroleum Marketing Annual 1994, DOE/EIA-0487(94)
(Washington, DC, August 1995). 1995 prices for gasoline and distillate are based on prices in various issues of EIA, Petroleum Marketing Monthly, DOE/EIA-0380(95/3-96/4)(Washington, DC, 1995 - 1996). 1994 and 1995 coal prices: EIA, Monthly Energy Review, DOE/EIA-0035(96/08) (Washington, DC, August 1996). 1994 and 1995 electricity prices:EIA, AEO97 National Energy Modeling System run AEO97B.D100296K. Other 1994 values and 1995 prices derived from EIA, State Energy Data Report 1993, DOE/EIA-0214(93)(Washington, DC, July 1995). Other 1995 values: EIA, Short-Term Energy Outlook, DOE/EIA-0202(96/4Q) (Washington, DC, October 1996). Projections: EIA, AEO97 NationalEnergy Modeling System run AEO97B.D100296K.
106 Energy Information Administration/ Annual Energy Outlook 1997

Reference Case Forecast
Table A7. Transportation Sector Key Indicators and Delivered Energy Consumption
Key Indicators and Consumption
Reference CaseAnnual Growth
1995-2015(percent)1994 1995 2000 2005 2010 2015
Key IndicatorsLevel of Travel (billions)
Light-Duty Vehicles (vehicle miles traveled) . . . . . . . . . . 2200 2209 2375 2574 2767 2924 1.4%Freight Trucks (vehicle miles traveled) . . . . . . . . . . . . . 164 166 193 219 237 250 2.1%Air (seat miles available) . . . . . . . . . . . . . . . . . . . . . . . 946 927 1261 1493 1729 1923 3.7%Rail (ton miles traveled) . . . . . . . . . . . . . . . . . . . . . . . . 1208 1181 1273 1368 1459 1535 1.3%Marine (ton miles traveled) . . . . . . . . . . . . . . . . . . . . . . 820 871 932 989 1047 1099 1.2%
Energy Efficiency IndicatorsNew Car (miles per gallon)1 . . . . . . . . . . . . . . . . . . . . . . 28.0 27.5 28.0 29.8 31.5 32.6 0.9%New Light Truck (miles per gallon)1 . . . . . . . . . . . . . . . . 20.6 20.5 20.5 21.6 22.9 24.2 0.8%Light-Duty Fleet (miles per gallon)2 . . . . . . . . . . . . . . . . . 20.0 19.7 19.6 19.8 20.4 21.3 0.4%Aircraft Efficiency (seat miles per gallon) . . . . . . . . . . . . . 50.4 50.8 53.3 55.8 58.2 60.6 0.9%Freight Truck Efficiency (miles per gallon) . . . . . . . . . . . . 5.5 5.5 5.7 5.9 6.0 6.1 0.4%Rail Efficiency (ton miles per thousand Btu) . . . . . . . . . . 2.6 2.6 2.7 2.9 3.0 3.2 1.0%Domestic Shipping Efficiency(ton miles per thousand Btu) . . . . . . . . . . . . . . . . . . . . . 2.7 2.7 2.8 2.9 2.9 3.0 0.5%
Energy Use by Mode (quadrillion Btu per year)Light-Duty Vehicles . . . . . . . . . . . . . . . . . . . . . . . . . . . . 13.88 14.20 15.37 16.52 17.26 17.43 1.0%Freight Trucks . . . . . . . . . . . . . . . . . . . . . . . . . . . . . . . . 5.26 5.43 5.94 6.47 6.80 7.07 1.3%Air . . . . . . . . . . . . . . . . . . . . . . . . . . . . . . . . . . . . . . . . 3.20 3.18 3.87 4.30 4.71 5.00 2.3%Rail . . . . . . . . . . . . . . . . . . . . . . . . . . . . . . . . . . . . . . . . 0.50 0.48 0.49 0.50 0.51 0.51 0.3%Marine . . . . . . . . . . . . . . . . . . . . . . . . . . . . . . . . . . . . . 1.43 1.63 1.88 2.09 2.30 2.46 2.1%Pipeline Fuel . . . . . . . . . . . . . . . . . . . . . . . . . . . . . . . . . 0.70 0.72 0.77 0.84 0.88 0.93 1.3%Other3 . . . . . . . . . . . . . . . . . . . . . . . . . . . . . . . . . . . . . . 0.20 0.21 0.25 0.27 0.29 0.30 1.6%
Total . . . . . . . . . . . . . . . . . . . . . . . . . . . . . . . . . . . . . 23.60 24.31 27.04 29.38 31.11 31.99 1.4%
1Environmental Protection Agency rated miles per gallon.2Combined car and light truck “on-the-road” estimate.3Includes lubricants and aviation gasoline.Btu = British thermal unit.Note: Totals may not equal sum of components due to independent rounding.Sources: 1994 pipeline fuel consumption: Energy Information Administration (EIA), Natural Gas Annual 1994, DOE/EIA-0131(94) (Washington, DC, November 1995). Other 1994
values: Federal Highway Administration, Highway Statistics 1994 (Washington, DC, 1994); Oak Ridge National Laboratory, Transportation Energy Data Book: 12, 13, 14, and 15,(Oak Ridge, TN, May 1995); Federal Aviation Administration (FAA), FAA Aviation Forecasts Fiscal Years 1993-2004; National Highway Traffic and Safety Administration, Summary ofFuel Economy Performance, (Washington, DC, February 1995); EIA, Residential Transportation Energy Consumption Survey 1991, DOE/EIA-0464(91) (Washington, DC, December1993); U.S. Dept. of Commerce, Bureau of the Census, “Truck Inventory and Use Survey,” TC92-T-52, (Washington D.C., May 1995); EIA, Describing Current and Potential Marketsfor Alternative-Fuel Vehicles, DOE/EIA-0604(96) (Washington, D.C., March 1996); EIA, Alternatives To Traditional Transportation Fuels 1994, DOE/EIA-0585(94) (Washington, DC,February 1996); and EIA, State Energy Data Report 1993, DOE/EIA-0214(93) (Washington, DC, July 1995). 1995: FAA, FAA Aviation Forecasts Fiscal Years 1993-2004,(Washington, DC, February 1994); EIA, Short-Term Energy Outlook, DOE/EIA-0202(96/4Q) (Washington, DC, October 1996); EIA, Fuel Oil and Kerosene Sales 1995, DOE/EIA-0535(95) (Washington, DC, September 1996); and United States Department of Defense, Defense Fuel Supply Center. Projections: EIA, AEO97 National Energy Modeling Systemrun AEO97B.D100296K.
Energy Information Administration/ Annual Energy Outlook 1997 107

Reference Case Forecast
Table A8. Electricity Supply, Disposition, and Prices(Billion Kilowatthours, Unless Otherwise Noted)
Supply, Disposition, and Prices
Reference CaseAnnual Growth
1995-2015(percent)1994 1995 2000 2005 2010 2015
Generation by Fuel TypeElectric Generators 1
Coal . . . . . . . . . . . . . . . . . . . . . . . . . . . . . . . . . . . . . . 1648 1671 1797 1854 1942 2052 1.0%Petroleum . . . . . . . . . . . . . . . . . . . . . . . . . . . . . . . . . . 93 64 53 58 58 64 0.0%Natural Gas . . . . . . . . . . . . . . . . . . . . . . . . . . . . . . . . 303 322 478 705 892 1184 6.7%Nuclear Power . . . . . . . . . . . . . . . . . . . . . . . . . . . . . . 640 673 687 654 614 448 -2.0%Pumped Storage . . . . . . . . . . . . . . . . . . . . . . . . . . . . . -3 -2 -3 -3 -3 -3 3.2%Renewable Sources2 . . . . . . . . . . . . . . . . . . . . . . . . . . 308 354 353 361 371 394 0.5%
Total . . . . . . . . . . . . . . . . . . . . . . . . . . . . . . . . . . . . 2989 3083 3365 3629 3874 4139 1.5%Non-Utility Generation for Own Use . . . . . . . . . . . . . . . 22 22 22 22 22 22 0.0%
Cogenerators 3
Coal . . . . . . . . . . . . . . . . . . . . . . . . . . . . . . . . . . . . . . 47 43 46 48 50 51 0.8%Petroleum . . . . . . . . . . . . . . . . . . . . . . . . . . . . . . . . . . 7 5 5 5 6 6 0.6%Natural Gas . . . . . . . . . . . . . . . . . . . . . . . . . . . . . . . . 171 180 194 205 214 221 1.0%Other Gaseous Fuels4 . . . . . . . . . . . . . . . . . . . . . . . . . 14 7 8 8 8 8 0.6%Renewable Sources2 . . . . . . . . . . . . . . . . . . . . . . . . . . 40 42 44 49 53 55 1.4%Other5 . . . . . . . . . . . . . . . . . . . . . . . . . . . . . . . . . . . . 3 3 3 4 4 4 0.7%
Total . . . . . . . . . . . . . . . . . . . . . . . . . . . . . . . . . . . . 282 279 300 319 333 344 1.0%Sales to Utilities . . . . . . . . . . . . . . . . . . . . . . . . . . . . . 153 148 154 158 161 163 0.5%Generation for Own Use . . . . . . . . . . . . . . . . . . . . . . . 129 132 145 161 172 181 1.6%
Net Imports . . . . . . . . . . . . . . . . . . . . . . . . . . . . . . . . . 45 38 40 35 31 27 -1.7%
Electricity Sales by SectorResidential . . . . . . . . . . . . . . . . . . . . . . . . . . . . . . . . . . 1008 1043 1137 1214 1307 1421 1.6%Commercial . . . . . . . . . . . . . . . . . . . . . . . . . . . . . . . . . . 912 946 1024 1089 1147 1219 1.3%Industrial . . . . . . . . . . . . . . . . . . . . . . . . . . . . . . . . . . . . 1008 1013 1122 1218 1289 1354 1.5%Transportation . . . . . . . . . . . . . . . . . . . . . . . . . . . . . . . . 6 6 7 24 41 50 11.4%
Total . . . . . . . . . . . . . . . . . . . . . . . . . . . . . . . . . . . . . 2935 3008 3290 3545 3784 4044 1.5%
End-Use Prices (1995 cents per kilowatthour) 6
Residential . . . . . . . . . . . . . . . . . . . . . . . . . . . . . . . . . . 8.6 8.4 8.2 8.0 7.8 7.6 -0.5%Commercial . . . . . . . . . . . . . . . . . . . . . . . . . . . . . . . . . . 8.0 7.9 7.6 7.3 7.2 6.9 -0.7%Industrial . . . . . . . . . . . . . . . . . . . . . . . . . . . . . . . . . . . . 5.1 5.0 4.8 4.6 4.5 4.3 -0.7%Transportation . . . . . . . . . . . . . . . . . . . . . . . . . . . . . . . . 5.2 5.2 5.1 4.9 4.9 4.7 -0.4%
All Sectors Average . . . . . . . . . . . . . . . . . . . . . . . . . . 7.2 7.1 6.9 6.6 6.4 6.3 -0.6%
Price Components (1995 cents per kilowatthour)Capital Component . . . . . . . . . . . . . . . . . . . . . . . . . . . . 2.7 2.6 2.6 2.5 2.3 2.2 -0.8%Fuel Component . . . . . . . . . . . . . . . . . . . . . . . . . . . . . . 1.1 1.1 1.1 1.1 1.0 0.9 -1.1%Operation and Maintenance Component . . . . . . . . . . . . . 3.0 3.0 2.7 2.5 2.5 2.3 -1.2%Wholesale Power Cost . . . . . . . . . . . . . . . . . . . . . . . . . . 0.4 0.4 0.5 0.6 0.7 0.8 4.2%
Total . . . . . . . . . . . . . . . . . . . . . . . . . . . . . . . . . . . . . 7.2 7.1 6.9 6.6 6.4 6.3 -0.6%
1Includes grid-connected generation at all utilities and nonutilities except for cogenerators. Includes small power producers, exempt wholesale generators, and generators atindustrial and commercial facilities which provide electricity for on-site use and for sales to utilities.
2Includes conventional hydroelectric, geothermal, wood, wood waste, municipal solid waste, other biomass, solar, and wind power.3Includes cogeneration at facilities whose primary function is not electricity production. Includes sales to utilities and generation for own use.4Other gaseous fuels include refinery and still gas.5Other includes hydrogen, sulfur, batteries, chemicals, fish oil, and spent sulfite liquor.6Prices represent average revenue per kilowatthour.Note: Totals may not equal sum of components due to independent rounding.Sources: 1994 and 1995 commercial and transportation sales derived from: Total transportation plus commercial sales come from Energy Information Administration (EIA), State
Energy Data Report 1993, DOE/EIA-0214(93) (Washington, DC, July 1995), but individual sectors do not match because sales taken from commercial and placed in transportation,according to Oak Ridge National Laboratories, Transportation Energy Data Book 15 (May 1995) which indicates the transportation value should be higher. 1994 and 1995 generationby electric utilities, nonutilities, and cogenerators, net electricity imports, residential sales, and industrial sales: EIA, Annual Energy Review 1995, DOE/EIA-0384(95) (Washington,DC, July 1996). 1994 and 1995 residential electricity prices derived from EIA, Short Term Energy Outlook, DOE/EIA-0202(96/4Q) (Washington, DC, October 1996). 1994 and 1995electricity prices for commercial, industrial, and transportation; price components; and projections: EIA, AEO97 National Energy Modeling System run AEO97B.D100296K.
108 Energy Information Administration/ Annual Energy Outlook 1997

Reference Case Forecast
Table A9. Electricity Generating Capability(Thousand Megawatts)
Net Summer Capability 1Reference Case
Annual Growth1995-2015(percent)1994 1995 2000 2005 2010 2015
Electric Generators 2
CapabilityCoal Steam . . . . . . . . . . . . . . . . . . . . . . . . . . . . . . . . . 303.6 304.9 298.7 298.2 304.0 315.4 0.2%Other Fossil Steam3 . . . . . . . . . . . . . . . . . . . . . . . . . . 141.3 139.6 120.2 102.6 99.9 96.1 -1.9%Combined Cycle . . . . . . . . . . . . . . . . . . . . . . . . . . . . . 13.5 14.7 43.2 73.5 107.5 153.0 12.4%Combustion Turbine/Diesel . . . . . . . . . . . . . . . . . . . . . 52.8 56.0 110.4 134.5 153.1 168.3 5.7%Nuclear Power . . . . . . . . . . . . . . . . . . . . . . . . . . . . . . 99.1 99.2 99.1 94.7 88.9 62.7 -2.3%Pumped Storage . . . . . . . . . . . . . . . . . . . . . . . . . . . . . 19.0 19.9 19.9 19.9 19.9 19.9 N/AFuel Cells . . . . . . . . . . . . . . . . . . . . . . . . . . . . . . . . . . 0.0 0.0 0.0 2.0 2.1 2.1 53.5%Renewable Sources4 . . . . . . . . . . . . . . . . . . . . . . . . . . 87.4 88.0 90.5 92.2 94.1 98.3 0.6%
Total . . . . . . . . . . . . . . . . . . . . . . . . . . . . . . . . . . . . 716.7 722.2 781.9 817.5 869.4 915.8 1.2%
Cumulative Planned Additions 5
Coal Steam . . . . . . . . . . . . . . . . . . . . . . . . . . . . . . . . . 0.1 1.4 3.7 3.7 5.3 5.3 6.8%Other Fossil Steam3 . . . . . . . . . . . . . . . . . . . . . . . . . . 0.0 0.0 0.0 0.0 0.0 0.0 N/ACombined Cycle . . . . . . . . . . . . . . . . . . . . . . . . . . . . . 0.1 1.4 2.0 2.0 2.0 2.0 1.9%Combustion Turbine/Diesel . . . . . . . . . . . . . . . . . . . . . 0.3 3.2 4.5 4.5 4.5 4.5 1.6%Nuclear Power . . . . . . . . . . . . . . . . . . . . . . . . . . . . . . 0.0 0.0 1.2 1.2 1.2 1.2 N/APumped Storage . . . . . . . . . . . . . . . . . . . . . . . . . . . . . 0.3 1.1 1.1 1.1 1.1 1.1 N/AFuel Cells . . . . . . . . . . . . . . . . . . . . . . . . . . . . . . . . . . 0.0 0.0 0.0 0.0 0.0 0.0 N/ARenewable Sources4 . . . . . . . . . . . . . . . . . . . . . . . . . . 0.3 0.7 2.6 2.9 2.9 2.9 7.0%
Total . . . . . . . . . . . . . . . . . . . . . . . . . . . . . . . . . . . . 1.1 8.0 15.2 15.5 17.1 17.1 3.9%
Cumulative Unplanned Additions 5
Coal Steam . . . . . . . . . . . . . . . . . . . . . . . . . . . . . . . . . 0.0 0.0 2.0 9.5 16.4 31.6 N/AOther Fossil Steam3 . . . . . . . . . . . . . . . . . . . . . . . . . . 0.0 0.0 0.0 0.0 0.0 0.0 N/ACombined Cycle . . . . . . . . . . . . . . . . . . . . . . . . . . . . . 0.0 0.0 27.6 58.0 91.9 137.5 N/ACombustion Turbine/Diesel . . . . . . . . . . . . . . . . . . . . . 0.0 0.1 53.5 78.2 97.1 113.5 39.8%Nuclear Power . . . . . . . . . . . . . . . . . . . . . . . . . . . . . . 0.0 0.0 0.0 0.0 0.0 0.0 N/APumped Storage . . . . . . . . . . . . . . . . . . . . . . . . . . . . . 0.0 0.0 0.0 0.0 0.0 0.0 N/AFuel Cells . . . . . . . . . . . . . . . . . . . . . . . . . . . . . . . . . . 0.0 0.0 0.0 2.0 2.1 2.1 N/ARenewable Sources3 . . . . . . . . . . . . . . . . . . . . . . . . . . 0.0 0.0 0.4 1.8 3.9 8.4 N/A
Total . . . . . . . . . . . . . . . . . . . . . . . . . . . . . . . . . . . . 0.0 0.1 83.6 149.5 211.4 293.1 46.6%
Cumulative Total Additions . . . . . . . . . . . . . . . . . . . . . 1.1 8.2 98.8 165.0 228.5 310.2 19.9%
Cumulative Retirements 6 . . . . . . . . . . . . . . . . . . . . . . . 10.1 11.9 43.3 72.1 83.9 119.1 12.2%
Energy Information Administration/ Annual Energy Outlook 1997 109
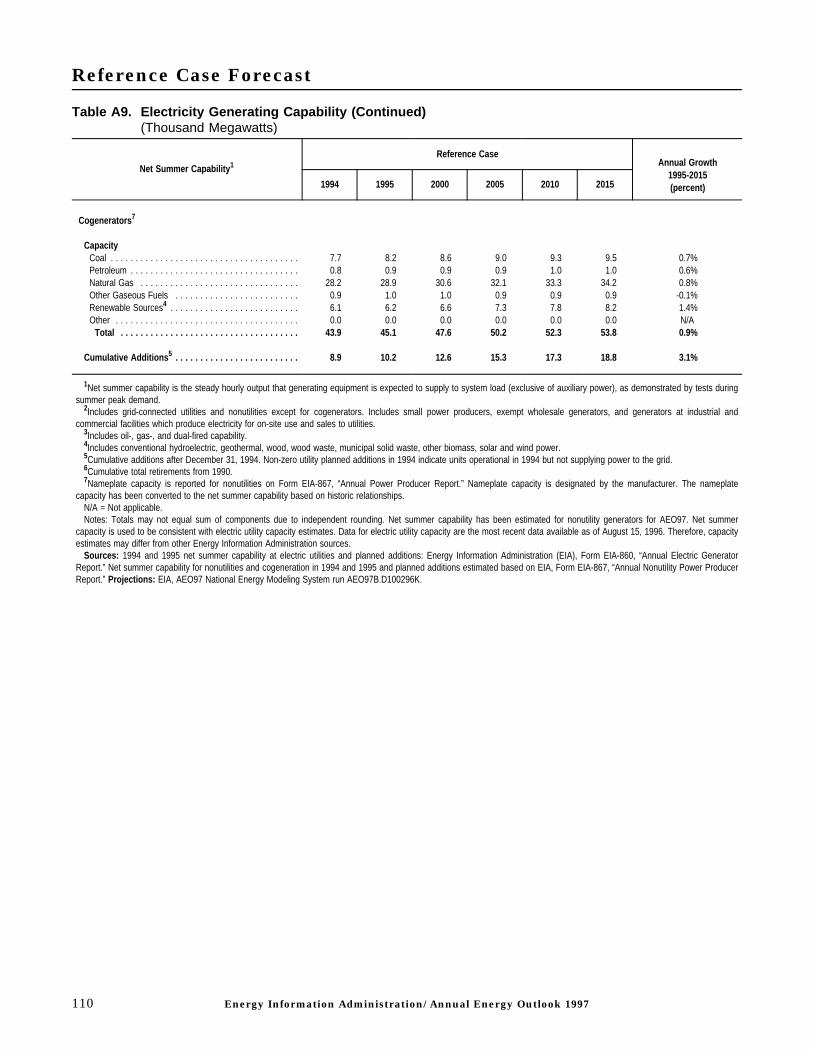
Reference Case Forecast
Table A9. Electricity Generating Capability (Continued)(Thousand Megawatts)
Net Summer Capability 1Reference Case
Annual Growth1995-2015(percent)1994 1995 2000 2005 2010 2015
Cogenerators 7
CapacityCoal . . . . . . . . . . . . . . . . . . . . . . . . . . . . . . . . . . . . . . 7.7 8.2 8.6 9.0 9.3 9.5 0.7%Petroleum . . . . . . . . . . . . . . . . . . . . . . . . . . . . . . . . . . 0.8 0.9 0.9 0.9 1.0 1.0 0.6%Natural Gas . . . . . . . . . . . . . . . . . . . . . . . . . . . . . . . . 28.2 28.9 30.6 32.1 33.3 34.2 0.8%Other Gaseous Fuels . . . . . . . . . . . . . . . . . . . . . . . . . 0.9 1.0 1.0 0.9 0.9 0.9 -0.1%Renewable Sources4 . . . . . . . . . . . . . . . . . . . . . . . . . . 6.1 6.2 6.6 7.3 7.8 8.2 1.4%Other . . . . . . . . . . . . . . . . . . . . . . . . . . . . . . . . . . . . . 0.0 0.0 0.0 0.0 0.0 0.0 N/A
Total . . . . . . . . . . . . . . . . . . . . . . . . . . . . . . . . . . . . 43.9 45.1 47.6 50.2 52.3 53.8 0.9%
Cumulative Additions 5 . . . . . . . . . . . . . . . . . . . . . . . . . 8.9 10.2 12.6 15.3 17.3 18.8 3.1%
1Net summer capability is the steady hourly output that generating equipment is expected to supply to system load (exclusive of auxiliary power), as demonstrated by tests duringsummer peak demand.
2Includes grid-connected utilities and nonutilities except for cogenerators. Includes small power producers, exempt wholesale generators, and generators at industrial andcommercial facilities which produce electricity for on-site use and sales to utilities.
3Includes oil-, gas-, and dual-fired capability.4Includes conventional hydroelectric, geothermal, wood, wood waste, municipal solid waste, other biomass, solar and wind power.5Cumulative additions after December 31, 1994. Non-zero utility planned additions in 1994 indicate units operational in 1994 but not supplying power to the grid.6Cumulative total retirements from 1990.7Nameplate capacity is reported for nonutilities on Form EIA-867, “Annual Power Producer Report.” Nameplate capacity is designated by the manufacturer. The nameplate
capacity has been converted to the net summer capability based on historic relationships.N/A = Not applicable.Notes: Totals may not equal sum of components due to independent rounding. Net summer capability has been estimated for nonutility generators for AEO97. Net summer
capacity is used to be consistent with electric utility capacity estimates. Data for electric utility capacity are the most recent data available as of August 15, 1996. Therefore, capacityestimates may differ from other Energy Information Administration sources.
Sources: 1994 and 1995 net summer capability at electric utilities and planned additions: Energy Information Administration (EIA), Form EIA-860, “Annual Electric GeneratorReport.” Net summer capability for nonutilities and cogeneration in 1994 and 1995 and planned additions estimated based on EIA, Form EIA-867, “Annual Nonutility Power ProducerReport.” Projections: EIA, AEO97 National Energy Modeling System run AEO97B.D100296K.
110 Energy Information Administration/ Annual Energy Outlook 1997

Reference Case Forecast
Table A10. Electricity Trade(Billion Kilowatthours, Unless Otherwise Noted)
Electricity Trade
Reference CaseAnnual Growth
1995-2015(percent)1994 1995 2000 2005 2010 2015
Interregional Electricity Trade
Gross Domestic Firm Power Sales . . . . . . . . . . . . . . . . . 160.4 155.0 149.3 139.2 139.2 139.2 -0.5%Gross Domestic Economy Sales . . . . . . . . . . . . . . . . . . . 73.0 81.6 61.1 61.3 77.6 79.4 -0.1%
Gross Domestic Trade . . . . . . . . . . . . . . . . . . . . . . . . 233.4 236.6 210.4 200.5 216.8 218.6 -0.4%
Gross Domestic Firm Power Sales(million 1995 dollars) . . . . . . . . . . . . . . . . . . . . . . . . . . . 7267.0 7023.5 6767.2 6309.0 6309.0 6309.0 -0.5%Gross Domestic Economy Sales(million 1995 dollars) . . . . . . . . . . . . . . . . . . . . . . . . . . . 1720.4 1958.3 1352.0 1420.8 1753.8 1831.4 -0.3%
Gross Domestic Sales(million 1995 dollars) . . . . . . . . . . . . . . . . . . . . . . . . . 8987.4 8981.7 8119.2 7729.8 8062.8 8140.4 -0.5%
International Electricity Trade
Firm Power Imports From Canada and Mexico . . . . . . . . 34.3 30.2 32.0 19.7 18.6 18.6 -2.4%Economy Imports From Canada and Mexico . . . . . . . . . . 20.7 18.0 22.4 35.2 33.6 29.2 2.4%
Gross Imports From Canada and Mexico . . . . . . . . . 55.0 48.3 54.4 54.8 52.2 47.9 0.0%
Firm Power Exports To Canada and Mexico . . . . . . . . . . 2.6 3.4 8.3 13.4 13.4 13.4 7.0%Economy Exports To Canada and Mexico . . . . . . . . . . . . 7.7 7.2 6.4 7.0 7.7 7.7 0.3%
Gross Exports To Canada and Mexico . . . . . . . . . . . 10.3 10.6 14.7 20.3 21.0 21.0 3.5%
Note: Totals may not equal sum of components due to independent rounding. Firm Power Sales are capacity sales, meaning the delivery of the power is scheduled as part of thenormal operating conditions of the affected electric systems. Economy Sales are subject to curtailment or cessation of delivery by the supplier in accordance with prior agreements orunder specified conditions.
Sources: 1994 and 1995 interregional electricity trade data: Energy Information Administration (EIA), Bulk Power Data System. 1994 and 1995 international electricity trade data:DOE Form FE-718R, “Annual Report of International Electrical Export/Import Data.” Firm/economy share: National Energy Board, Annual Report 1993. Planned interregional andinternational firm power sales: DOE Form IE-411, “Coordinated Bulk Power Supply Program Report” (April 1995). Projections: EIA, AEO97 National Energy Modeling System runAEO97B.D100296K.
Energy Information Administration/ Annual Energy Outlook 1997 111

Reference Case Forecast
Table A11. Petroleum Supply and Disposition Balance(Million Barrels per Day, Unless Otherwise Noted)
Supply and Disposition
Reference CaseAnnual Growth
1995-2015(percent)1994 1995 2000 2005 2010 2015
Crude OilDomestic Crude Production1 . . . . . . . . . . . . . . . . . . . . 6.66 6.56 5.87 5.49 5.39 5.23 -1.1%
Alaska . . . . . . . . . . . . . . . . . . . . . . . . . . . . . . . . . . . 1.56 1.48 1.11 0.94 0.77 0.63 -4.2%Lower 48 States . . . . . . . . . . . . . . . . . . . . . . . . . . . . 5.10 5.08 4.76 4.55 4.62 4.60 -0.5%
Net Imports . . . . . . . . . . . . . . . . . . . . . . . . . . . . . . . . . 6.96 7.14 8.85 9.49 9.76 10.24 1.8%Other Crude Supply2 . . . . . . . . . . . . . . . . . . . . . . . . . . 0.24 0.28 0.00 0.00 0.00 0.00 N/A
Total Crude Supply . . . . . . . . . . . . . . . . . . . . . . . . . . . 13.86 13.97 14.72 14.98 15.15 15.47 0.5%
Natural Gas Plant Liquids . . . . . . . . . . . . . . . . . . . . . . 1.73 1.76 1.96 2.14 2.28 2.44 1.6%
Other Inputs 3 . . . . . . . . . . . . . . . . . . . . . . . . . . . . . . . . 0.27 0.46 0.26 0.24 0.19 0.19 -4.4%Refinery Processing Gain 4 . . . . . . . . . . . . . . . . . . . . . 0.77 0.77 0.79 0.80 0.82 0.77 0.0%
Net Product Imports 5 . . . . . . . . . . . . . . . . . . . . . . . . . . 1.09 0.75 1.63 2.51 3.14 3.22 7.5%
Total Primary Supply 6 . . . . . . . . . . . . . . . . . . . . . . . . . 17.72 17.73 19.36 20.67 21.58 22.10 1.1%
Refined Petroleum Products SuppliedMotor Gasoline7 . . . . . . . . . . . . . . . . . . . . . . . . . . . . . 7.60 7.81 8.44 8.90 9.17 9.19 0.8%Jet Fuel 8 . . . . . . . . . . . . . . . . . . . . . . . . . . . . . . . . . . 1.52 1.51 1.85 2.06 2.25 2.39 2.3%Distillate Fuel 9 . . . . . . . . . . . . . . . . . . . . . . . . . . . . . . 3.16 3.25 3.53 3.81 3.99 4.12 1.2%Residual Fuel . . . . . . . . . . . . . . . . . . . . . . . . . . . . . . . 1.04 0.85 0.94 1.04 1.11 1.20 1.7%Other10 . . . . . . . . . . . . . . . . . . . . . . . . . . . . . . . . . . . . 4.36 4.32 4.62 4.87 5.07 5.21 0.9%
Total . . . . . . . . . . . . . . . . . . . . . . . . . . . . . . . . . . . . 17.69 17.73 19.38 20.68 21.60 22.12 1.1%
Refined Petroleum Products SuppliedResidential and Commercial . . . . . . . . . . . . . . . . . . . . . 1.10 1.07 1.05 1.03 1.02 1.01 -0.3%Industrial 11 . . . . . . . . . . . . . . . . . . . . . . . . . . . . . . . . . 4.65 4.58 4.88 5.13 5.33 5.48 0.9%Transportation . . . . . . . . . . . . . . . . . . . . . . . . . . . . . . . 11.51 11.79 13.22 14.26 15.00 15.35 1.3%Electric Generators12 . . . . . . . . . . . . . . . . . . . . . . . . . . 0.43 0.30 0.23 0.26 0.26 0.28 -0.3%
Total . . . . . . . . . . . . . . . . . . . . . . . . . . . . . . . . . . . . 17.69 17.73 19.38 20.68 21.60 22.12 1.1%
Discrepancy 13 . . . . . . . . . . . . . . . . . . . . . . . . . . . . . . . 0.03 -0.01 -0.02 -0.01 -0.02 -0.02 N/A
World Oil Price (1995 dollars per barrel) 14 . . . . . . . . . . 15.94 17.26 18.20 19.72 20.41 20.98 1.0%Import Share of Product Supplied . . . . . . . . . . . . . . . . 0.46 0.44 0.54 0.58 0.60 0.61 1.6%Expenditures for Imported Crude Oiland Petroleum Products (billion 1995 dollars) . . . . . . . 46.05 49.39 68.56 85.05 95.44 101.18 3.7%Domestic Refinery Distillation Capacity . . . . . . . . . . . . 15.0 15.4 15.8 16.0 16.2 16.5 0.3%Capacity Utilization Rate (percent) . . . . . . . . . . . . . . . 93.0 92.0 93.4 94.1 94.0 94.0 0.1%
1Includes lease condensate.2Strategic petroleum reserve stock additions plus unaccounted for crude oil and crude stock withdrawals minus crude products supplied.3Includes alcohols, ethers, petroleum product stock withdrawals, domestic sources of blending components, and other hydrocarbons.4Represents volumetric gain in refinery distillation and cracking processes.5Includes net imports of finished petroleum products, unfinished oils, other hydrocarbons, alcohols, ethers, and blending components.6Total crude supply plus natural gas plant liquids, other inputs, refinery processing gain, and net petroleum imports.7Includes ethanol and ethers blended into gasoline.8Includes naphtha and kerosene types.9Includes distillate and kerosene.10Includes aviation gasoline, liquefied petroleum gas, petrochemical feedstocks, lubricants, waxes, asphalt, road oil, still gas, special naphthas, petroleum coke, crude oil product
supplied, and miscellaneous petroleum products.11Includes consumption by cogenerators.12Includes all electric power generators except cogenerators, which produce electricity as a by-product of other processes.13Balancing item. Includes unaccounted for supply, losses and gains.14Average refiner acquisition cost for imported crude oil.N/A = Not applicable.Note: Totals may not equal sum of components due to independent rounding.Sources: 1994 and 1995 expenditures for imported crude oil and petroleum products based on internal calculations. Other 1994 data: Energy Information Administration (EIA),
Petroleum Supply Annual 1994, DOE/EIA-0340(94) (Washington, DC, May 1995). Other 1995 data: EIA, Petroleum Supply Annual 1995, DOE/EIA-0340(95) (Washington, DC, May1996). Projections: EIA, AEO97 National Energy Modeling System run AEO97B.D100296K.
112 Energy Information Administration/ Annual Energy Outlook 1997

Reference Case Forecast
Table A12. Petroleum Product Prices(1995 Cents per Gallon, Unless Otherwise Noted)
Sector and Fuel
Reference CaseAnnual Growth
1995-2015(percent)1994 1995 2000 2005 2010 2015
World Oil Price (dollars per barrel) . . . . . . . . . . . . . . . 15.94 17.26 18.20 19.72 20.41 20.98 1.0%
Delivered Sector Product Prices
ResidentialDistillate Fuel . . . . . . . . . . . . . . . . . . . . . . . . . . . . . . . 90.0 86.5 97.6 100.9 103.3 101.7 0.8%Liquefied Petroleum Gas . . . . . . . . . . . . . . . . . . . . . . . 91.8 88.8 97.5 98.4 102.3 99.9 0.6%
CommercialDistillate Fuel . . . . . . . . . . . . . . . . . . . . . . . . . . . . . . . 62.9 60.8 70.1 73.3 75.4 73.7 1.0%Residual Fuel . . . . . . . . . . . . . . . . . . . . . . . . . . . . . . . 42.3 44.7 40.7 42.9 44.6 45.3 0.1%Residual Fuel (dollars per barrel) . . . . . . . . . . . . . . . . . 17.75 18.78 17.10 18.02 18.73 19.02 0.1%
Industrial 1
Distillate Fuel . . . . . . . . . . . . . . . . . . . . . . . . . . . . . . . 65.2 63.9 68.9 72.3 74.6 73.3 0.7%Liquefied Petroleum Gas . . . . . . . . . . . . . . . . . . . . . . . 54.6 56.4 51.6 51.8 54.2 51.4 -0.5%Residual Fuel . . . . . . . . . . . . . . . . . . . . . . . . . . . . . . . 38.2 38.2 40.8 43.7 45.3 45.1 0.8%Residual Fuel (dollars per barrel) . . . . . . . . . . . . . . . . . 16.04 16.06 17.13 18.36 19.04 18.95 0.8%
TransportationDistillate Fuel 2 . . . . . . . . . . . . . . . . . . . . . . . . . . . . . . 114.2 111.4 120.3 120.6 120.4 116.2 0.2%Jet Fuel 3 . . . . . . . . . . . . . . . . . . . . . . . . . . . . . . . . . . 54.6 52.0 69.3 73.7 76.3 73.5 1.7%Motor Gasoline4 . . . . . . . . . . . . . . . . . . . . . . . . . . . . . 115.0 114.8 119.4 121.2 121.8 117.4 0.1%Residual Fuel . . . . . . . . . . . . . . . . . . . . . . . . . . . . . . . 31.1 36.5 39.8 43.4 47.3 46.0 1.2%Residual Fuel (dollars per barrel) . . . . . . . . . . . . . . . . . 13.07 15.32 16.71 18.24 19.86 19.33 1.2%
Electric Generators 5
Distillate Fuel . . . . . . . . . . . . . . . . . . . . . . . . . . . . . . . 56.5 54.7 62.7 66.1 68.3 67.0 1.0%Residual Fuel . . . . . . . . . . . . . . . . . . . . . . . . . . . . . . . 39.4 39.2 42.0 44.4 47.2 46.5 0.9%Residual Fuel (dollars per barrel) . . . . . . . . . . . . . . . . . 16.56 16.45 17.65 18.66 19.82 19.54 0.9%
Refined Petroleum Product Prices 6
Distillate Fuel 2 . . . . . . . . . . . . . . . . . . . . . . . . . . . . . . 98.6 96.8 106.0 107.5 108.2 104.9 0.4%Jet Fuel 3 . . . . . . . . . . . . . . . . . . . . . . . . . . . . . . . . . . 54.6 52.0 69.3 73.7 76.3 73.5 1.7%Liquefied Petroleum Gas . . . . . . . . . . . . . . . . . . . . . . . 61.2 62.2 60.8 62.2 65.6 63.2 0.1%Motor Gasoline4 . . . . . . . . . . . . . . . . . . . . . . . . . . . . . 115.0 114.8 119.2 120.9 121.6 117.2 0.1%Residual Fuel . . . . . . . . . . . . . . . . . . . . . . . . . . . . . . . 36.3 38.1 40.4 43.6 46.9 46.0 0.9%Residual Fuel (dollars per barrel) . . . . . . . . . . . . . . . . . 15.25 16.01 16.98 18.32 19.69 19.31 0.9%
Average . . . . . . . . . . . . . . . . . . . . . . . . . . . . . . . . . . 92.1 92.4 97.6 99.4 100.4 96.4 0.2%
1Includes cogenerators.2Includes Federal and State taxes on diesel fuel and excludes county and local taxes.3Kerosene-type jet fuel.4Sales weighted-average price for all grades. Includes Federal and State taxes and excludes county and local taxes.5Includes all electric power generators except cogenerators, which produce electricity as a by-product of other processes.6Weighted averages of end-use fuel prices are derived from the prices in each sector and the corresponding sectoral consumption.
Sources: 1994 prices for gasoline, distillate, and jet fuel are based on prices in the Energy Information Administration (EIA), Petroleum Marketing Annual 1994, DOE/EIA-0487(94)(Washington, DC, August 1995). 1995 prices for gasoline, distillate, and jet fuel are based on prices in various issues of EIA, Petroleum Marketing Monthly, DOE/EIA-0380(95/3-96/4)(Washington, DC, 1995-1996). 1994 and 1995 prices for all other petroleum products are derived from EIA, State Energy Price and Expenditures Report: 1993, DOE/EIA-0376(93)(Washington, DC, December 1995). Projections: EIA, AEO97 National Energy Modeling System run AEO97B.D100296K.
Energy Information Administration/ Annual Energy Outlook 1997 113

Reference Case Forecast
Table A13. Natural Gas Supply and Disposition(Trillion Cubic Feet per Year)
Supply and Disposition
Reference CaseAnnual Growth
1995-2015(percent)1994 1995 2000 2005 2010 2015
ProductionDry Gas Production1 . . . . . . . . . . . . . . . . . . . . . . . . . . 18.75 18.49 20.54 22.66 24.25 26.10 1.7%Supplemental Natural Gas2 . . . . . . . . . . . . . . . . . . . . . 0.11 0.13 0.08 0.06 0.06 0.06 -3.7%
Net Imports . . . . . . . . . . . . . . . . . . . . . . . . . . . . . . . . . 2.46 2.68 3.46 3.69 3.92 4.23 2.3%Canada . . . . . . . . . . . . . . . . . . . . . . . . . . . . . . . . . . . 2.51 2.79 3.44 3.52 3.74 4.06 1.9%Mexico . . . . . . . . . . . . . . . . . . . . . . . . . . . . . . . . . . . . -0.04 -0.05 -0.10 -0.11 -0.12 -0.12 3.9%Liquefied Natural Gas . . . . . . . . . . . . . . . . . . . . . . . . . -0.01 -0.05 0.12 0.27 0.29 0.29 N/A
Total Supply . . . . . . . . . . . . . . . . . . . . . . . . . . . . . . . . 21.32 21.30 24.09 26.41 28.23 30.39 1.8%
Consumption by SectorResidential . . . . . . . . . . . . . . . . . . . . . . . . . . . . . . . . . 4.84 4.87 5.18 5.27 5.42 5.57 0.7%Commercial . . . . . . . . . . . . . . . . . . . . . . . . . . . . . . . . 2.87 3.07 3.26 3.34 3.44 3.55 0.7%Industrial 3 . . . . . . . . . . . . . . . . . . . . . . . . . . . . . . . . . 7.95 8.33 9.00 9.27 9.56 9.65 0.7%Electric Generators4 . . . . . . . . . . . . . . . . . . . . . . . . . . 3.25 3.46 4.29 5.88 6.94 8.52 4.6%Lease and Plant Fuel 5 . . . . . . . . . . . . . . . . . . . . . . . . 1.16 1.14 1.32 1.45 1.55 1.65 1.9%Pipeline Fuel . . . . . . . . . . . . . . . . . . . . . . . . . . . . . . . . 0.69 0.70 0.75 0.82 0.86 0.91 1.3%Transportation6 . . . . . . . . . . . . . . . . . . . . . . . . . . . . . . 0.01 0.01 0.05 0.18 0.25 0.30 18.7%
Total . . . . . . . . . . . . . . . . . . . . . . . . . . . . . . . . . . . . 20.77 21.58 23.86 26.22 28.01 30.16 1.7%
Discrepancy 7 . . . . . . . . . . . . . . . . . . . . . . . . . . . . . . . . 0.55 -0.28 0.23 0.19 0.22 0.23 N/A
1Marketed production (wet) minus extraction losses.2Synthetic natural gas, propane air, coke oven gas, refinery gas, biomass gas, air injected for Btu stabilization, and manufactured gas commingled and distributed with natural gas.3Includes consumption by cogenerators.4Includes all electric power generators except cogenerators, which produce electricity as a by product of other processes.5Represents natural gas used in the field gathering and processing plant machinery.6Compressed natural gas used as vehicle fuel.7Balancing item. Natural gas lost as a result of converting flow data measured at varying temperatures and pressures to a standard temperature and pressure and the merger of
different data reporting systems which vary in scope, format, definition, and respondent type. In addition, 1994 and 1995 values include net storage injections.Btu = British thermal unit.N/A = Not applicable.Note: Totals may not equal sum of components due to independent rounding. Figures for 1994 and 1995 may differ from published data due to internal conversion factors.Sources: 1994 supply values and consumption as lease, plant, and pipeline fuel: Energy Information Administration (EIA), Natural Gas Annual 1994, DOE/EIA-0131(94)
(Washington, DC, November 1995) with adjustments to end-use sector consumption levels based on Form EIA-867, “Annual Nonutility Power Producer Report.” Other 1994consumption derived from: EIA, State Energy Data Report 1993, DOE/EIA-0214(93) (Washington, DC, July 1995) with adjustments to end-use sector consumption levels based onForm EIA-867, “Annual Nonutility Power Producer Report.” 1995 supplemental natural gas: EIA, Natural Gas Monthly, DOE/EIA-0130(96/6) (Washington, DC, June 1996). 1995imports and dry gas production derived from: EIA, Natural Gas Annual 1995, DOE/EIA-0131(95) (Washington, DC, November 1996). 1995 transportation sector consumption: EIA,AEO97 National Energy Modeling System run AEO97B.D100296K. Other 1995 consumption: EIA, Short-Term Energy Outlook, DOE/EIA-0202(96/4Q) (Washington, DC, October1996) with adjustments to end-use sector consumption levels for consumption of natural gas by electric wholesale generators based on EIA, AEO97 National Energy ModelingSystem run AEO97B.D100296K. Projections: EIA, AEO97 National Energy Modeling System run AEO97B.D100296K.
114 Energy Information Administration/ Annual Energy Outlook 1997

Reference Case Forecast
Table A14. Natural Gas Prices, Margins, and Revenues(1995 Dollars per Thousand Cubic Feet, Unless Otherwise Noted)
Prices, Margins, and Revenue
Reference CaseAnnual Growth
1995-2015(percent)1994 1995 2000 2005 2010 2015
Source PriceAverage Lower 48 Wellhead Price1 . . . . . . . . . . . . . . . 1.97 1.61 1.82 1.94 2.01 2.13 1.4%Average Import Price . . . . . . . . . . . . . . . . . . . . . . . . . . 1.92 1.49 1.70 1.85 1.94 2.06 1.6%
Average 2 . . . . . . . . . . . . . . . . . . . . . . . . . . . . . . . . . 1.96 1.59 1.80 1.93 2.00 2.12 1.4%
Delivered PricesResidential . . . . . . . . . . . . . . . . . . . . . . . . . . . . . . . . . 6.58 6.18 5.79 5.65 5.43 5.33 -0.7%Commercial . . . . . . . . . . . . . . . . . . . . . . . . . . . . . . . . 5.62 5.10 4.83 4.79 4.64 4.61 -0.5%Industrial 3 . . . . . . . . . . . . . . . . . . . . . . . . . . . . . . . . . 2.73 2.35 2.49 2.61 2.69 2.82 0.9%Electric Generators4 . . . . . . . . . . . . . . . . . . . . . . . . . . 2.34 2.06 2.24 2.33 2.38 2.52 1.0%Transportation5 . . . . . . . . . . . . . . . . . . . . . . . . . . . . . . 5.93 5.94 6.08 6.38 6.93 7.27 1.0%
Average 6 . . . . . . . . . . . . . . . . . . . . . . . . . . . . . . . . . 4.09 3.67 3.59 3.55 3.49 3.52 -0.2%
Transmission and Distribution Margins 7
Residential . . . . . . . . . . . . . . . . . . . . . . . . . . . . . . . . . 4.62 4.59 3.98 3.73 3.43 3.21 -1.8%Commercial . . . . . . . . . . . . . . . . . . . . . . . . . . . . . . . . 3.66 3.51 3.03 2.86 2.64 2.49 -1.7%Industrial 3 . . . . . . . . . . . . . . . . . . . . . . . . . . . . . . . . . 0.77 0.76 0.69 0.68 0.69 0.70 -0.4%Electric Generators4 . . . . . . . . . . . . . . . . . . . . . . . . . . 0.38 0.47 0.43 0.41 0.38 0.40 -0.7%Transportation5 . . . . . . . . . . . . . . . . . . . . . . . . . . . . . . 3.97 4.35 4.28 4.45 4.93 5.15 0.9%
Average 6 . . . . . . . . . . . . . . . . . . . . . . . . . . . . . . . . . 2.13 2.08 1.78 1.62 1.49 1.40 -2.0%
Transmission and Distribution Revenue(billion 1995 dollars)
Residential . . . . . . . . . . . . . . . . . . . . . . . . . . . . . . . . . 22.34 22.35 20.64 19.66 18.56 17.91 -1.1%Commercial . . . . . . . . . . . . . . . . . . . . . . . . . . . . . . . . 10.50 10.79 9.89 9.56 9.08 8.85 -1.0%Industrial 3 . . . . . . . . . . . . . . . . . . . . . . . . . . . . . . . . . 6.12 6.31 6.18 6.32 6.57 6.72 0.3%Electric Generators4 . . . . . . . . . . . . . . . . . . . . . . . . . . 1.24 1.61 1.85 2.40 2.61 3.42 3.8%Transportation5 . . . . . . . . . . . . . . . . . . . . . . . . . . . . . . 0.04 0.04 0.23 0.79 1.25 1.56 19.7%
Total . . . . . . . . . . . . . . . . . . . . . . . . . . . . . . . . . . . . 40.23 41.11 38.79 38.73 38.08 38.45 -0.3%
1Represents lower 48 onshore and offshore supplies.2Quantity-weighted average of the average lower 48 wellhead price and the average price of imports at the U.S. border.3Includes consumption by cogenerators.4Includes all electric power generators except cogenerators, which produce electricity as a by product of other processes.5Compressed natural gas used as a vehicle fuel.6Weighted average prices and margins. Weights used are the sectoral consumption values excluding lease, plant, and pipeline fuel.7Within the table, “transmission and distribution” margins equal the difference between the delivered price and the source price (average of the wellhead price and the price of
imports at the U.S. border) of natural gas and, thus, reflect the total cost of bringing natural gas to market. When the term “transmission and distribution” margins is used in today’snatural gas market, it generally does not include the cost of independent natural gas marketers or costs associated with aggregation of supplies, provisions of storage, and otherservices. As used here, the term includes the cost of all services and the cost of pipeline fuel used in compressor stations.
Note: Totals may not equal sum of components due to independent rounding.Sources: 1994 residential, commercial, and transportation delivered prices; average lower 48 wellhead price; and average import price: Energy Information Administration (EIA),
Natural Gas Annual 1994, DOE/EIA-0131(94) (Washington, DC, November 1995). 1994 electric generators delivered price: Form FERC-423, “Monthly Report of Cost and Quality ofFuels for Electric Plants.” 1994 and 1995 industrial delivered prices based on EIA, Manufacturing Energy Consumption Survey 1991. 1995 residential and commercial deliveredprices, average lower 48 wellhead price, and average import price: EIA, Natural Gas Monthly, DOE/EIA-0130(96/6) (Washington, DC, June 1996). Other 1994 values, other 1995values, and projections: EIA, AEO97 National Energy Modeling System run AEO97B.D100296K.
Energy Information Administration/ Annual Energy Outlook 1997 115
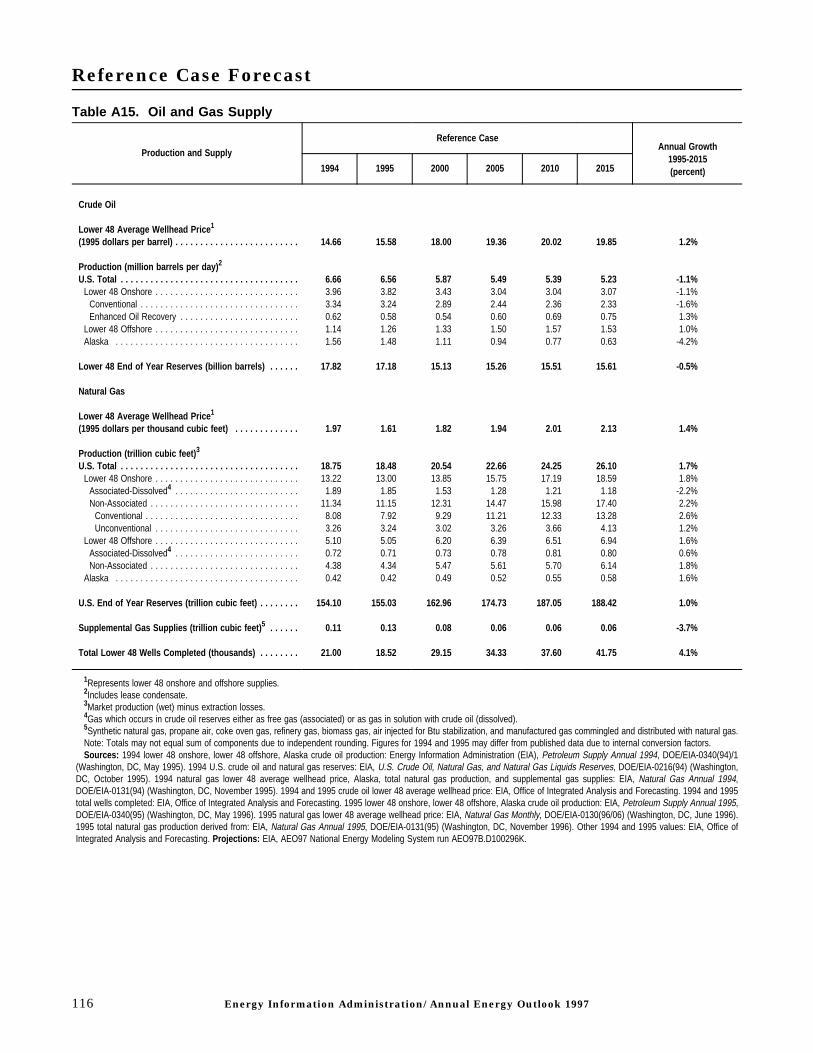
Reference Case Forecast
Table A15. Oil and Gas Supply
Production and Supply
Reference CaseAnnual Growth
1995-2015(percent)1994 1995 2000 2005 2010 2015
Crude Oil
Lower 48 Average Wellhead Price 1
(1995 dollars per barrel) . . . . . . . . . . . . . . . . . . . . . . . . . 14.66 15.58 18.00 19.36 20.02 19.85 1.2%
Production (million barrels per day) 2
U.S. Total . . . . . . . . . . . . . . . . . . . . . . . . . . . . . . . . . . . . 6.66 6.56 5.87 5.49 5.39 5.23 -1.1%Lower 48 Onshore . . . . . . . . . . . . . . . . . . . . . . . . . . . . . 3.96 3.82 3.43 3.04 3.04 3.07 -1.1%
Conventional . . . . . . . . . . . . . . . . . . . . . . . . . . . . . . . . 3.34 3.24 2.89 2.44 2.36 2.33 -1.6%Enhanced Oil Recovery . . . . . . . . . . . . . . . . . . . . . . . . 0.62 0.58 0.54 0.60 0.69 0.75 1.3%
Lower 48 Offshore . . . . . . . . . . . . . . . . . . . . . . . . . . . . . 1.14 1.26 1.33 1.50 1.57 1.53 1.0%Alaska . . . . . . . . . . . . . . . . . . . . . . . . . . . . . . . . . . . . . 1.56 1.48 1.11 0.94 0.77 0.63 -4.2%
Lower 48 End of Year Reserves (billion barrels) . . . . . . 17.82 17.18 15.13 15.26 15.51 15.61 -0.5%
Natural Gas
Lower 48 Average Wellhead Price 1
(1995 dollars per thousand cubic feet) . . . . . . . . . . . . . 1.97 1.61 1.82 1.94 2.01 2.13 1.4%
Production (trillion cubic feet) 3
U.S. Total . . . . . . . . . . . . . . . . . . . . . . . . . . . . . . . . . . . . 18.75 18.48 20.54 22.66 24.25 26.10 1.7%Lower 48 Onshore . . . . . . . . . . . . . . . . . . . . . . . . . . . . . 13.22 13.00 13.85 15.75 17.19 18.59 1.8%
Associated-Dissolved4 . . . . . . . . . . . . . . . . . . . . . . . . . 1.89 1.85 1.53 1.28 1.21 1.18 -2.2%Non-Associated . . . . . . . . . . . . . . . . . . . . . . . . . . . . . . 11.34 11.15 12.31 14.47 15.98 17.40 2.2%
Conventional . . . . . . . . . . . . . . . . . . . . . . . . . . . . . . . 8.08 7.92 9.29 11.21 12.33 13.28 2.6%Unconventional . . . . . . . . . . . . . . . . . . . . . . . . . . . . . 3.26 3.24 3.02 3.26 3.66 4.13 1.2%
Lower 48 Offshore . . . . . . . . . . . . . . . . . . . . . . . . . . . . . 5.10 5.05 6.20 6.39 6.51 6.94 1.6%Associated-Dissolved4 . . . . . . . . . . . . . . . . . . . . . . . . . 0.72 0.71 0.73 0.78 0.81 0.80 0.6%Non-Associated . . . . . . . . . . . . . . . . . . . . . . . . . . . . . . 4.38 4.34 5.47 5.61 5.70 6.14 1.8%
Alaska . . . . . . . . . . . . . . . . . . . . . . . . . . . . . . . . . . . . . 0.42 0.42 0.49 0.52 0.55 0.58 1.6%
U.S. End of Year Reserves (trillion cubic feet) . . . . . . . . 154.10 155.03 162.96 174.73 187.05 188.42 1.0%
Supplemental Gas Supplies (trillion cubic feet) 5 . . . . . . 0.11 0.13 0.08 0.06 0.06 0.06 -3.7%
Total Lower 48 Wells Completed (thousands) . . . . . . . . 21.00 18.52 29.15 34.33 37.60 41.75 4.1%
1Represents lower 48 onshore and offshore supplies.2Includes lease condensate.3Market production (wet) minus extraction losses.4Gas which occurs in crude oil reserves either as free gas (associated) or as gas in solution with crude oil (dissolved).5Synthetic natural gas, propane air, coke oven gas, refinery gas, biomass gas, air injected for Btu stabilization, and manufactured gas commingled and distributed with natural gas.Note: Totals may not equal sum of components due to independent rounding. Figures for 1994 and 1995 may differ from published data due to internal conversion factors.Sources: 1994 lower 48 onshore, lower 48 offshore, Alaska crude oil production: Energy Information Administration (EIA), Petroleum Supply Annual 1994, DOE/EIA-0340(94)/1
(Washington, DC, May 1995). 1994 U.S. crude oil and natural gas reserves: EIA, U.S. Crude Oil, Natural Gas, and Natural Gas Liquids Reserves, DOE/EIA-0216(94) (Washington,DC, October 1995). 1994 natural gas lower 48 average wellhead price, Alaska, total natural gas production, and supplemental gas supplies: EIA, Natural Gas Annual 1994,DOE/EIA-0131(94) (Washington, DC, November 1995). 1994 and 1995 crude oil lower 48 average wellhead price: EIA, Office of Integrated Analysis and Forecasting. 1994 and 1995total wells completed: EIA, Office of Integrated Analysis and Forecasting. 1995 lower 48 onshore, lower 48 offshore, Alaska crude oil production: EIA, Petroleum Supply Annual 1995,DOE/EIA-0340(95) (Washington, DC, May 1996). 1995 natural gas lower 48 average wellhead price: EIA, Natural Gas Monthly, DOE/EIA-0130(96/06) (Washington, DC, June 1996).1995 total natural gas production derived from: EIA, Natural Gas Annual 1995, DOE/EIA-0131(95) (Washington, DC, November 1996). Other 1994 and 1995 values: EIA, Office ofIntegrated Analysis and Forecasting. Projections: EIA, AEO97 National Energy Modeling System run AEO97B.D100296K.
116 Energy Information Administration/ Annual Energy Outlook 1997

Reference Case Forecast
Table A16. Coal Supply, Disposition, and Prices(Million Short Tons per Year, Unless Otherwise Noted)
Supply, Disposition, and Prices
Reference CaseAnnual Growth
1995-2015(percent)1994 1995 2000 2005 2010 2015
Production 1
Appalachia . . . . . . . . . . . . . . . . . . . . . . . . . . . . . . . . . 445 435 452 441 479 494 0.6%Interior . . . . . . . . . . . . . . . . . . . . . . . . . . . . . . . . . . . . 179 169 162 157 165 160 -0.3%West . . . . . . . . . . . . . . . . . . . . . . . . . . . . . . . . . . . . . . 408 429 491 548 557 614 1.8%
East of the Mississippi . . . . . . . . . . . . . . . . . . . . . . . . . 566 544 553 538 579 586 0.4%West of the Mississippi . . . . . . . . . . . . . . . . . . . . . . . . 467 489 552 608 622 682 1.7%
Total . . . . . . . . . . . . . . . . . . . . . . . . . . . . . . . . . . . . 1034 1033 1105 1146 1201 1268 1.0%
Net ImportsImports . . . . . . . . . . . . . . . . . . . . . . . . . . . . . . . . . . . . 8 7 8 8 9 9 0.9%Exports . . . . . . . . . . . . . . . . . . . . . . . . . . . . . . . . . . . . 71 89 96 102 111 121 1.6%
Total . . . . . . . . . . . . . . . . . . . . . . . . . . . . . . . . . . . . -63 -81 -88 -94 -103 -112 1.6%
Total Supply 2 . . . . . . . . . . . . . . . . . . . . . . . . . . . . . . . . 971 951 1017 1052 1098 1156 1.0%
Consumption by SectorResidential and Commercial . . . . . . . . . . . . . . . . . . . . . 6 6 6 6 6 6 0.0%Industrial 3 . . . . . . . . . . . . . . . . . . . . . . . . . . . . . . . . . 75 73 79 84 87 91 1.1%Coke Plants . . . . . . . . . . . . . . . . . . . . . . . . . . . . . . . . 32 33 29 26 23 20 -2.4%Electric Generators4 . . . . . . . . . . . . . . . . . . . . . . . . . . 817 847 903 938 983 1039 1.0%
Total . . . . . . . . . . . . . . . . . . . . . . . . . . . . . . . . . . . . 930 959 1017 1054 1099 1156 0.9%
Discrepancy and Stock Change 5 . . . . . . . . . . . . . . . . . 41 -8 0 -2 -1 -1 N/A
Average Minemouth Price(1995 dollars per short ton) . . . . . . . . . . . . . . . . . . . . . 19.89 18.83 18.38 17.47 16.92 15.46 -1.0%(1995 dollars per million Btu) . . . . . . . . . . . . . . . . . . . . 0.93 0.88 0.87 0.83 0.81 0.74 -0.9%
Delivered Prices (1995 dollars per short ton) 6
Industrial . . . . . . . . . . . . . . . . . . . . . . . . . . . . . . . . . . . 33.34 32.30 32.34 31.18 29.72 28.12 -0.7%Coke Plants . . . . . . . . . . . . . . . . . . . . . . . . . . . . . . . . 47.70 46.94 46.69 46.03 42.32 39.79 -0.8%Electric Generators
(1995 dollars per short ton) . . . . . . . . . . . . . . . . . . . . 28.72 27.01 26.39 24.97 24.23 22.47 -0.9%(1995 dollars per million Btu) . . . . . . . . . . . . . . . . . . . 1.38 1.32 1.29 1.24 1.20 1.11 -0.9%Average . . . . . . . . . . . . . . . . . . . . . . . . . . . . . . . . . . 29.74 28.11 27.45 25.99 25.05 23.23 -0.9%
Exports7 . . . . . . . . . . . . . . . . . . . . . . . . . . . . . . . . . . . 40.91 39.51 39.08 37.96 35.47 32.91 -0.9%
1Includes anthracite, bituminous coal, and lignite.2Production plus net imports and net storage withdrawals.3Includes consumption by cogenerators.4Includes all electric power generators except cogenerators, which produce electricity as a by-product of other processes.5Balancing item: the sum of production, net imports, and net storage minus total consumption.6Sectoral prices weighted by consumption tonnage; weighted average excludes residential/ commercial prices and export free-alongside-ship (f.a.s.) prices.7F.a.s. price at U.S. port of exit.N/A = Not applicable.Btu = British thermal unit.Note: Totals may not equal sum of components due to independent rounding.Sources: 1994: Energy Information Administration (EIA), Coal Industry Annual 1994, DOE/EIA-0584(94) (Washington, DC, October 1995). 1995 data derived from: EIA, Coal
Industry Annual 1994, DOE/EIA-0584(94) (Washington, DC, October 1995). Projections: EIA, AEO97 National Energy Modeling System run AEO97B.D100296K.
Energy Information Administration/ Annual Energy Outlook 1997 117

Reference Case Forecast
Table A17. Renewable Energy Generating Capacity and Generation(Thousand Megawatts, Unless Otherwise Noted)
Capacity and Generation
Reference CaseAnnual Growth
1995-2015(percent)1994 1995 2000 2005 2010 2015
Electric Generators 1
(excluding cogenerators)Capability
Conventional Hydropower . . . . . . . . . . . . . . . . . . . . . . 78.19 78.48 80.05 80.33 80.38 80.38 0.1%Geothermal 2 . . . . . . . . . . . . . . . . . . . . . . . . . . . . . . . 2.97 2.97 3.10 3.04 3.19 3.46 0.8%Municipal Solid Waste . . . . . . . . . . . . . . . . . . . . . . . . . 2.32 2.43 2.85 3.34 3.89 4.19 2.7%Wood and Other Biomass3 . . . . . . . . . . . . . . . . . . . . . 1.78 1.86 1.86 2.00 2.21 3.92 3.8%Solar Thermal . . . . . . . . . . . . . . . . . . . . . . . . . . . . . . . 0.35 0.36 0.38 0.42 0.50 0.63 2.8%Solar Photovoltaic . . . . . . . . . . . . . . . . . . . . . . . . . . . . 0.01 0.01 0.02 0.08 0.19 0.35 18.6%Wind . . . . . . . . . . . . . . . . . . . . . . . . . . . . . . . . . . . . . . 1.79 1.83 2.26 2.97 3.78 5.39 5.6%
Total . . . . . . . . . . . . . . . . . . . . . . . . . . . . . . . . . . . . 87.41 87.95 90.52 92.17 94.14 98.32 0.6%
Generation (billion kilowatthours)Conventional Hydropower . . . . . . . . . . . . . . . . . . . . . . 259.92 309.82 301.51 303.59 304.11 304.21 -0.1%Geothermal 2 . . . . . . . . . . . . . . . . . . . . . . . . . . . . . . . 17.06 14.66 17.70 17.94 19.46 22.04 2.1%Municipal Solid Waste . . . . . . . . . . . . . . . . . . . . . . . . . 17.38 18.69 18.96 22.33 26.12 28.18 2.1%Wood and Other Biomass3 . . . . . . . . . . . . . . . . . . . . . 9.40 7.12 8.61 9.24 10.73 22.72 6.0%Solar Thermal . . . . . . . . . . . . . . . . . . . . . . . . . . . . . . . 0.82 0.82 0.97 1.10 1.38 1.78 3.9%Solar Photovoltaic . . . . . . . . . . . . . . . . . . . . . . . . . . . . 0.00 0.00 0.08 0.22 0.48 0.87 30.9%Wind . . . . . . . . . . . . . . . . . . . . . . . . . . . . . . . . . . . . . . 3.48 3.17 4.93 6.80 9.15 13.80 7.6%
Total . . . . . . . . . . . . . . . . . . . . . . . . . . . . . . . . . . . . 308.07 354.28 352.77 361.21 371.43 393.62 0.5%
Cogenerators 4
CapabilityMunicipal Solid Waste . . . . . . . . . . . . . . . . . . . . . . . . . 0.40 0.41 0.41 0.43 0.44 0.45 0.6%Biomass . . . . . . . . . . . . . . . . . . . . . . . . . . . . . . . . . . . 5.71 5.79 6.17 6.88 7.38 7.75 1.5%
Total . . . . . . . . . . . . . . . . . . . . . . . . . . . . . . . . . . . . 6.11 6.19 6.59 7.31 7.82 8.21 1.4%
Generation (billion kilowatthours)Municipal Solid Waste . . . . . . . . . . . . . . . . . . . . . . . . . 1.93 1.97 2.01 2.08 2.13 2.17 0.5%Biomass . . . . . . . . . . . . . . . . . . . . . . . . . . . . . . . . . . . 37.69 39.58 42.29 47.05 50.37 52.90 1.5%
Total . . . . . . . . . . . . . . . . . . . . . . . . . . . . . . . . . . . . 39.62 41.55 44.30 49.12 52.50 55.07 1.4%
1Includes grid-connected utilities and nonutilities other than cogenerators. These nonutility facilities include small power producers, exempt wholesale generators and generators atindustrial and commercial facilities which do not produce steam for other uses.
2Includes hydrothermal resources only (hot water and steam).3Includes projections for energy crops after 2010.4Cogenerators are facilities whose primary function is not electricity production.Notes: Totals may not equal sum of components due to independent rounding. Net summer capability has been estimated for nonutility generators for AEO97. Net summer
capability is used to be consistent with electric utility capacity estimates. Data for electric utility capacity data are the most recently available data as of August 15, 1996. Additionalretirements are also determined on the basis of the size and age of the units. Therefore, capacity estimates may differ from other Energy Information Administration sources.
Sources: 1994 and 1995 electric utility capability: Energy Information Administration (EIA), Form EIA-860 “Annual Electric Utility Report.” 1994 and 1995 nonutility and cogeneratorcapability: Form EIA-867, “Annual Nonutility Power Producer Report.” 1994 and 1995 generation: EIA, Annual Energy Review 1995, DOE/EIA-0384(95) (Washington, DC, July 1996).Projections: EIA, AEO97 National Energy Modeling System run AEO97B.D100296K.
118 Energy Information Administration/ Annual Energy Outlook 1997

Reference Case Forecast
Table A18. Renewable Energy, Consumption by Sector and Source 1
(Quadrillion Btu per Year)
Sector and Source
Reference CaseAnnual Growth
1995-2015(percent)1994 1995 2000 2005 2010 2015
Marketed Renewable Energy 2
Residential . . . . . . . . . . . . . . . . . . . . . . . . . . . . . . . . . . 0.56 0.57 0.57 0.56 0.55 0.54 -0.3%Wood . . . . . . . . . . . . . . . . . . . . . . . . . . . . . . . . . . . . . 0.56 0.57 0.57 0.56 0.55 0.54 -0.3%
Commercial 3 . . . . . . . . . . . . . . . . . . . . . . . . . . . . . . . . 0.00 0.00 0.00 0.00 0.00 0.00 0.8%Biomass . . . . . . . . . . . . . . . . . . . . . . . . . . . . . . . . . . . 0.00 0.00 0.00 0.00 0.00 0.00 0.8%
Industrial 4 . . . . . . . . . . . . . . . . . . . . . . . . . . . . . . . . . . 1.71 1.74 1.91 2.12 2.28 2.40 1.6%Conventional Hydroelectric . . . . . . . . . . . . . . . . . . . . . . 0.03 0.03 0.03 0.03 0.03 0.03 N/AMunicipal Solid Waste . . . . . . . . . . . . . . . . . . . . . . . . . 0.00 0.00 0.00 0.01 0.01 0.01 1.0%Biomass . . . . . . . . . . . . . . . . . . . . . . . . . . . . . . . . . . . 1.67 1.70 1.87 2.08 2.24 2.36 1.7%
Transportation . . . . . . . . . . . . . . . . . . . . . . . . . . . . . . . 0.09 0.08 0.10 0.10 0.10 0.15 3.5%Ethanol used in E855 . . . . . . . . . . . . . . . . . . . . . . . . . . 0.00 0.00 0.00 0.02 0.06 0.09 22.7%Ethanol used in Gasoline Blending . . . . . . . . . . . . . . . . 0.08 0.08 0.10 0.08 0.04 0.07 -0.7%
Electric Generators 6 . . . . . . . . . . . . . . . . . . . . . . . . . . 3.54 3.99 4.05 4.18 4.36 4.68 0.8%Conventional Hydroelectric . . . . . . . . . . . . . . . . . . . . . . 2.67 3.18 3.10 3.12 3.13 3.13 -0.1%Geothermal . . . . . . . . . . . . . . . . . . . . . . . . . . . . . . . . . 0.45 0.39 0.49 0.52 0.58 0.69 3.0%Municipal Solid Waste . . . . . . . . . . . . . . . . . . . . . . . . . 0.28 0.31 0.31 0.37 0.43 0.46 2.1%Biomass . . . . . . . . . . . . . . . . . . . . . . . . . . . . . . . . . . . 0.10 0.07 0.09 0.10 0.11 0.23 6.0%Solar Thermal . . . . . . . . . . . . . . . . . . . . . . . . . . . . . . . 0.01 0.01 0.01 0.01 0.01 0.02 3.9%Solar Photovoltaic . . . . . . . . . . . . . . . . . . . . . . . . . . . . 0.00 0.00 0.00 0.00 0.00 0.01 30.9%Wind . . . . . . . . . . . . . . . . . . . . . . . . . . . . . . . . . . . . . . 0.04 0.03 0.05 0.07 0.09 0.14 7.6%
Total Marketed Renewable Energy . . . . . . . . . . . . . . . 5.90 6.37 6.64 6.96 7.29 7.77 1.0%
Non-Marketed Renewable Energy 7
Selected Consumption
Residential . . . . . . . . . . . . . . . . . . . . . . . . . . . . . . . . . . 0.02 0.02 0.03 0.05 0.06 0.08 6.5%Solar Hot Water Heating . . . . . . . . . . . . . . . . . . . . . . . 0.01 0.01 0.01 0.01 0.01 0.01 -0.3%Geothermal Heat Pumps . . . . . . . . . . . . . . . . . . . . . . . 0.01 0.01 0.02 0.04 0.05 0.07 9.4%
Commercial . . . . . . . . . . . . . . . . . . . . . . . . . . . . . . . . . 0.01 0.01 0.02 0.03 0.03 0.04 5.8%Solar Thermal . . . . . . . . . . . . . . . . . . . . . . . . . . . . . . . 0.01 0.01 0.02 0.03 0.03 0.04 5.8%
1Actual heat rates used to determine fuel consumption for all renewable fuels except hydropower, solar, and wind. Consumption at hydroelectric, solar, and wind facilitiesdetermined by using the fossil fuel equivalent of 10,280 Btu per kilowatthour.
2Includes nonelectric renewable energy groups for which the energy source is bought and sold in the marketplace, although all transactions may not necessarily be marketed, andmarketed renewable energy inputs for electricity entering the marketplace on the electric power grid.
3Value is less than 0.005 quadrillion Btu per year and rounds to zero.4Includes all electricity production by industrial and other cogenerators for the grid and for own use.5Excludes motor gasoline component of E85.6Includes renewable energy delivered to the grid from electric utilities and nonutilities. Renewable energy used in generating electricity for own use is included in the individual
sectoral electricity energy consumption values.7Includes selected renewable energy consumption data for which the energy is not bought or sold, either directly or indirectly as an input to marketed energy. The Energy
Information Administration does not estimate or project total consumption of nonmarketed renewable energy.N/A = Not available.Btu = British thermal unit.Notes: Totals may not equal sum of components due to independent rounding.Sources: 1994 ethanol: Energy Information Administration (EIA), Annual Energy Review 1994, DOE/EIA-0384(94) (Washington, DC, July 1995). 1994 and 1995 electric
generators: EIA, Form EIA-860, “Annual Electric Utility Report,” and EIA, Form EIA-867, “Annual Nonutility Power Producer Report.” Other 1994: EIA, Office of Integrated Analysisand Forecasting. 1995 ethanol: EIA, Petroleum Supply Annual 1995, DOE/EIA-0340(95/1) (Washington, DC, May 1996). Other 1995: EIA, Office of Integrated Analysis andForecasting. Projections: EIA, AEO97 National Energy Modeling System run AEO97B.D100296K.
Energy Information Administration/ Annual Energy Outlook 1997 119

Reference Case Forecast
Table A19. Carbon Emissions by Sector and Source(Million Metric Tons per Year)
Sector and Source
Reference CaseAnnual Growth
1995-2015(percent)1994 1995 2000 2005 2010 2015
ResidentialPetroleum . . . . . . . . . . . . . . . . . . . . . . . . . . . . . . . . . . 25.3 25.0 25.0 24.3 23.7 23.4 -0.3%Natural Gas . . . . . . . . . . . . . . . . . . . . . . . . . . . . . . . . 71.7 72.1 76.8 78.1 80.3 82.5 0.7%Coal . . . . . . . . . . . . . . . . . . . . . . . . . . . . . . . . . . . . . . 1.4 1.4 1.3 1.2 1.1 1.1 -1.3%Electricity . . . . . . . . . . . . . . . . . . . . . . . . . . . . . . . . . . 172.0 175.6 189.3 201.0 216.4 238.3 1.5%
Total . . . . . . . . . . . . . . . . . . . . . . . . . . . . . . . . . . . . 270.5 274.0 292.4 304.6 321.4 345.3 1.2%
CommercialPetroleum . . . . . . . . . . . . . . . . . . . . . . . . . . . . . . . . . . 14.5 13.4 11.9 11.8 11.7 11.7 -0.7%Natural Gas . . . . . . . . . . . . . . . . . . . . . . . . . . . . . . . . 42.6 45.6 48.4 49.5 50.9 52.6 0.7%Coal . . . . . . . . . . . . . . . . . . . . . . . . . . . . . . . . . . . . . . 2.0 2.0 2.1 2.2 2.3 2.3 0.7%Electricity . . . . . . . . . . . . . . . . . . . . . . . . . . . . . . . . . . 155.6 159.3 170.6 180.2 189.9 204.4 1.3%
Total . . . . . . . . . . . . . . . . . . . . . . . . . . . . . . . . . . . . 214.8 220.3 233.0 243.8 254.7 271.0 1.0%
Industrial 1
Petroleum . . . . . . . . . . . . . . . . . . . . . . . . . . . . . . . . . . 95.6 92.4 99.2 104.9 108.9 111.9 1.0%Natural Gas2 . . . . . . . . . . . . . . . . . . . . . . . . . . . . . . . . 133.3 138.6 151.1 157.1 162.7 165.6 0.9%Coal . . . . . . . . . . . . . . . . . . . . . . . . . . . . . . . . . . . . . . 60.2 62.8 63.4 63.6 63.5 63.8 0.1%Electricity . . . . . . . . . . . . . . . . . . . . . . . . . . . . . . . . . . 172.0 170.5 186.8 201.7 213.4 227.1 1.4%
Total . . . . . . . . . . . . . . . . . . . . . . . . . . . . . . . . . . . . 461.0 464.3 500.6 527.3 548.5 568.4 1.0%
TransportationPetroleum . . . . . . . . . . . . . . . . . . . . . . . . . . . . . . . . . . 439.8 453.5 504.0 544.1 573.4 586.7 1.3%Natural Gas3 . . . . . . . . . . . . . . . . . . . . . . . . . . . . . . . . 10.3 10.5 11.9 14.8 16.5 17.9 2.7%Other4 . . . . . . . . . . . . . . . . . . . . . . . . . . . . . . . . . . . . 0.0 0.0 0.1 0.5 1.2 1.6 22.5%Electricity . . . . . . . . . . . . . . . . . . . . . . . . . . . . . . . . . . 1.0 1.0 1.2 3.9 6.7 8.4 11.3%
Total . . . . . . . . . . . . . . . . . . . . . . . . . . . . . . . . . . . . 451.1 465.1 517.2 563.3 597.7 614.5 1.4%
Total Carbon Emissions 5
Petroleum . . . . . . . . . . . . . . . . . . . . . . . . . . . . . . . . . . 575.2 584.4 640.2 685.1 717.7 733.6 1.1%Natural Gas . . . . . . . . . . . . . . . . . . . . . . . . . . . . . . . . 257.9 266.7 288.1 299.6 310.3 318.7 0.9%Coal . . . . . . . . . . . . . . . . . . . . . . . . . . . . . . . . . . . . . . 63.6 66.2 66.8 67.0 66.9 67.2 0.1%Other4 . . . . . . . . . . . . . . . . . . . . . . . . . . . . . . . . . . . . 0.0 0.0 0.1 0.5 1.2 1.6 22.5%Electricity . . . . . . . . . . . . . . . . . . . . . . . . . . . . . . . . . . 500.6 506.3 547.9 586.9 626.4 678.1 1.5%
Total . . . . . . . . . . . . . . . . . . . . . . . . . . . . . . . . . . . . 1397.4 1423.7 1543.1 1638.9 1722.4 1799.3 1.2%
Electric Generators 6
Petroleum . . . . . . . . . . . . . . . . . . . . . . . . . . . . . . . . . . 20.9 14.4 11.1 12.2 12.0 13.2 -0.4%Natural Gas . . . . . . . . . . . . . . . . . . . . . . . . . . . . . . . . 47.4 50.9 63.1 86.5 102.1 125.4 4.6%Coal . . . . . . . . . . . . . . . . . . . . . . . . . . . . . . . . . . . . . . 432.3 441.1 473.7 488.2 512.3 539.5 1.0%
Total . . . . . . . . . . . . . . . . . . . . . . . . . . . . . . . . . . . . 500.6 506.3 547.9 586.9 626.4 678.1 1.5%
Total Carbon Emissions 7
Petroleum . . . . . . . . . . . . . . . . . . . . . . . . . . . . . . . . . . 596.1 598.7 651.3 697.2 729.7 746.9 1.1%Natural Gas . . . . . . . . . . . . . . . . . . . . . . . . . . . . . . . . 305.3 317.6 351.3 386.1 412.4 444.1 1.7%Coal . . . . . . . . . . . . . . . . . . . . . . . . . . . . . . . . . . . . . . 495.9 507.3 540.5 555.2 579.2 606.7 0.9%Other4 . . . . . . . . . . . . . . . . . . . . . . . . . . . . . . . . . . . . 0.0 0.0 0.1 0.5 1.2 1.6 22.5%
Total . . . . . . . . . . . . . . . . . . . . . . . . . . . . . . . . . . . . 1397.4 1423.7 1543.1 1638.9 1722.4 1799.3 1.2%
Carbon Emissions(tons per person) . . . . . . . . . . . . . . . . . . . . . . . . . . . . . 5.4 5.4 5.6 5.7 5.8 5.8 0.3%
1Includes consumption by cogenerators.2Includes lease and plant fuel.3Includes pipeline fuel natural gas and compressed natural gas used as vehicle fuel.4“Other” includes methanol and liquid hydrogen.5Measured for delivered energy consumption.6Includes all electric power generators except cogenerators, which produce electricity as a by-product of other processes.7Measured for total energy consumption, with emissions for electric power generators distributed to the primary fuels.Note: Totals may not equal sum of components due to independent rounding.Sources: Utility coal carbon emissions from Energy Information Administration (EIA), Emissions of Greenhouse Gases in the United States, 1987-1992, DOE/EIA-0573
(Washington, DC, November 1994). Carbon coefficients from EIA, Emissions of Greenhouse Gases in the United States 1995, DOE/EIA-0573(95) (Washington, DC, October 1996).1994 consumption estimates based on: EIA, State Energy Data Report 1993, DOE/EIA-0214(93) (Washington, DC, July 1995). 1995 consumption estimates based on: EIA, ShortTerm Energy Outlook, DOE/EIA-0202(96/4Q) (Washington, DC, October 1996). Projections: EIA, AEO97 National Energy Modeling System run AEO97B.D100296K.
120 Energy Information Administration/ Annual Energy Outlook 1997

Reference Case Forecast
Table A20. Macroeconomic Indicators(Billion 1992 Chain-Weighted Dollars, Unless Otherwise Noted)
Indicators
Reference CaseAnnual Growth
1995-2015(percent)1994 1995 2000 2005 2010 2015
GDP Implicit Price Deflator(index 1992=1.000) . . . . . . . . . . . . . . . . . . . . . . . . . . . . . 1.049 1.076 1.217 1.411 1.667 1.986 3.1%
Real Gross Domestic Product . . . . . . . . . . . . . . . . . . . . 6604 6739 7544 8390 9185 9880 1.9%Real Consumption . . . . . . . . . . . . . . . . . . . . . . . . . . . . . . 4471 4579 5145 5673 6220 6708 1.9%Real Investment . . . . . . . . . . . . . . . . . . . . . . . . . . . . . . . 980 1011 1212 1366 1487 1592 2.3%Real Government Spending . . . . . . . . . . . . . . . . . . . . . . . 1260 1261 1292 1364 1440 1499 0.9%
Real Exports . . . . . . . . . . . . . . . . . . . . . . . . . . . . . . . . . . 715 775 1062 1395 1723 2037 5.0%Real Imports . . . . . . . . . . . . . . . . . . . . . . . . . . . . . . . . . . 823 889 1166 1395 1661 1921 3.9%Real Gross Domestic Product(1987 fixed-weighted dollars) . . . . . . . . . . . . . . . . . . . . . . 5522 5677 6492 7317 8145 8817 2.2%
Real Disposable Personal Income(1987 fixed-weighted dollars) . . . . . . . . . . . . . . . . . . . . . 3894 4047 4598 5113 5644 6109 2.1%
Index of Manufacturing Gross Output(index 1987=1.000) . . . . . . . . . . . . . . . . . . . . . . . . . . . . . 1.211 1.246 1.406 1.590 1.765 1.904 2.1%
AA Utility Bond Rate (percent) . . . . . . . . . . . . . . . . . . . . . 8.21 7.76 6.83 6.27 6.11 6.16 N/A
90-Day U.S. Government Treasury Bill Rate(percent) . . . . . . . . . . . . . . . . . . . . . . . . . . . . . . . . . . . . . 4.25 5.49 5.02 4.31 4.15 4.04 N/A
Real Yield on Government 10 Year Bonds(percent) . . . . . . . . . . . . . . . . . . . . . . . . . . . . . . . . . . . . . 5.44 5.22 3.34 2.07 1.35 1.24 N/AReal 90-Day U.S. Government Treasury Bill Rate(percent) . . . . . . . . . . . . . . . . . . . . . . . . . . . . . . . . . . . . . 1.98 2.94 2.30 1.10 0.71 0.35 N/AReal Utility Bond Rate (percent) . . . . . . . . . . . . . . . . . . . . 5.94 5.21 4.12 3.06 2.67 2.46 N/A
Delivered Energy Intensity(thousand Btu per 1992 dollar of GDP)
Delivered Energy . . . . . . . . . . . . . . . . . . . . . . . . . . . . . . 10.09 10.11 9.81 9.35 8.94 8.58 -0.8%Total Energy . . . . . . . . . . . . . . . . . . . . . . . . . . . . . . . . . 13.44 13.50 12.98 12.33 11.76 11.23 -0.9%
Consumer Price Index (1982-84=1.00) . . . . . . . . . . . . . . . 1.48 1.52 1.76 2.08 2.49 3.01 3.5%Employment Cost Index (June 1989=1.00) . . . . . . . . . . . . 1.18 1.22 1.42 1.66 1.99 2.39 3.4%
Unemployment Rate (percent) . . . . . . . . . . . . . . . . . . . . . 6.10 5.59 5.25 5.64 5.70 5.67 N/A
Million UnitsTruck Deliveries, Light-Duty . . . . . . . . . . . . . . . . . . . . . . 6.06 6.10 6.81 7.03 7.32 7.73 1.2%Unit Sales of Automobiles . . . . . . . . . . . . . . . . . . . . . . . 8.99 8.67 9.55 10.14 10.07 9.89 0.7%
Millions of PeoplePopulation with Armed Forces Overseas . . . . . . . . . . . . . 261.0 263.6 275.6 287.1 298.9 311.2 0.8%Population (aged 16 and over) . . . . . . . . . . . . . . . . . . . . 200.1 202.1 212.8 223.8 235.4 245.8 1.0%Employment, Non-Agriculture . . . . . . . . . . . . . . . . . . . . . 113.4 116.1 126.5 138.6 149.9 158.6 1.6%Employment, Manufacturing . . . . . . . . . . . . . . . . . . . . . . 18.1 18.2 17.9 18.1 18.0 17.4 -0.2%Labor Force . . . . . . . . . . . . . . . . . . . . . . . . . . . . . . . . . 131.0 132.3 140.4 149.7 157.3 161.1 1.0%
GDP = Gross domestic product.Btu = British thermal unit.N/A = Not available.Sources: 1994 and 1995: Data Resources Incorporated (DRI), DRI Trend0296. Projections: Energy Information Administration, AEO97 National Energy Modeling System run
AEO97B.D100296K.
Energy Information Administration/ Annual Energy Outlook 1997 121

Reference Case Forecast
Table A21. International Petroleum Supply and Disposition Summary(Million Barrels per Day, Unless Otherwise Noted)
Supply and Disposition
Reference CaseAnnual Growth
1995-2015(percent)1994 1995 2000 2005 2010 2015
World Oil Price (1995 dollars per barrel) 1 . . . . . . . . . . . 15.94 17.26 18.20 19.72 20.41 20.98 1.0%
Production 2
OECDU.S. (50 states) . . . . . . . . . . . . . . . . . . . . . . . . . . . . . . 9.34 9.29 8.82 8.67 8.75 8.76 -0.3%Canada . . . . . . . . . . . . . . . . . . . . . . . . . . . . . . . . . . . 2.33 2.44 2.55 2.46 2.35 2.24 -0.4%Mexico . . . . . . . . . . . . . . . . . . . . . . . . . . . . . . . . . . . . 3.18 3.09 3.20 3.13 3.07 3.00 -0.2%OECD Europe3 . . . . . . . . . . . . . . . . . . . . . . . . . . . . . . 6.13 6.55 6.92 6.05 5.20 4.25 -2.1%Other OECD . . . . . . . . . . . . . . . . . . . . . . . . . . . . . . . . 0.73 0.74 0.76 0.71 0.65 0.60 -1.1%
Total OECD . . . . . . . . . . . . . . . . . . . . . . . . . . . . . . . 21.70 22.11 22.25 21.01 20.02 18.84 -0.8%
Developing CountriesOther South & Central America . . . . . . . . . . . . . . . . . . 2.82 3.06 4.06 4.18 3.99 3.81 1.1%Pacific Rim . . . . . . . . . . . . . . . . . . . . . . . . . . . . . . . . . 1.89 2.04 2.12 2.26 2.17 2.02 -0.1%OPEC . . . . . . . . . . . . . . . . . . . . . . . . . . . . . . . . . . . . . 27.50 28.07 33.04 42.10 50.64 60.35 3.9%Other Developing Countries . . . . . . . . . . . . . . . . . . . . . 3.82 4.05 5.11 5.07 4.72 4.28 0.3%
Total Developing Countries . . . . . . . . . . . . . . . . . . . 36.02 37.21 44.33 53.61 61.51 70.45 3.2%
EurasiaFormer Soviet Union . . . . . . . . . . . . . . . . . . . . . . . . . . 7.01 6.96 7.28 8.34 9.43 10.09 1.9%Eastern Europe . . . . . . . . . . . . . . . . . . . . . . . . . . . . . . 0.30 0.31 0.27 0.23 0.21 0.18 -2.7%China . . . . . . . . . . . . . . . . . . . . . . . . . . . . . . . . . . . . . 2.94 3.02 3.14 3.04 3.00 2.94 -0.1%
Total Eurasia . . . . . . . . . . . . . . . . . . . . . . . . . . . . . . 10.25 10.29 10.69 11.62 12.64 13.21 1.3%
Total Production . . . . . . . . . . . . . . . . . . . . . . . . . . . . . . 67.98 69.62 77.27 86.24 94.17 102.50 2.0%
Consumption
OECDU.S. (50 states) . . . . . . . . . . . . . . . . . . . . . . . . . . . . . . 17.72 17.73 19.39 20.68 21.60 22.12 1.1%U.S. Territories . . . . . . . . . . . . . . . . . . . . . . . . . . . . . . 0.24 0.26 0.30 0.35 0.38 0.42 2.4%Canada . . . . . . . . . . . . . . . . . . . . . . . . . . . . . . . . . . . 1.73 1.76 1.88 2.01 2.14 2.29 1.3%Mexico . . . . . . . . . . . . . . . . . . . . . . . . . . . . . . . . . . . . 1.94 1.96 2.12 2.39 2.69 3.02 2.2%Japan . . . . . . . . . . . . . . . . . . . . . . . . . . . . . . . . . . . . . 5.67 5.73 6.37 6.85 7.31 7.78 1.5%Australia and New Zealand . . . . . . . . . . . . . . . . . . . . . 0.92 0.96 1.02 1.10 1.17 1.24 1.3%OECD Europe3 . . . . . . . . . . . . . . . . . . . . . . . . . . . . . . 13.59 13.88 14.29 14.80 15.12 15.41 0.5%
Total OECD . . . . . . . . . . . . . . . . . . . . . . . . . . . . . . . 41.80 42.28 45.38 48.18 50.41 52.28 1.1%
Developing CountriesOther South and Central America . . . . . . . . . . . . . . . . . 3.47 3.58 3.94 4.31 4.62 4.92 1.6%Pacific Rim . . . . . . . . . . . . . . . . . . . . . . . . . . . . . . . . . 4.64 4.87 5.79 7.72 9.07 10.73 4.0%OPEC . . . . . . . . . . . . . . . . . . . . . . . . . . . . . . . . . . . . . 4.74 4.94 5.62 6.30 7.06 7.91 2.4%Other Developing Countries . . . . . . . . . . . . . . . . . . . . . 4.60 4.79 6.05 7.20 7.95 8.75 3.1%
Total Developing Countries . . . . . . . . . . . . . . . . . . . 17.46 18.19 21.42 25.53 28.70 32.31 2.9%
122 Energy Information Administration/ Annual Energy Outlook 1997

Reference Case Forecast
Table A21. International Petroleum Supply and Disposition Summary (Continued)(Million Barrels per Day, Unless Otherwise Noted)
Supply and Disposition
Reference CaseAnnual Growth
1995-2015(percent)1994 1995 2000 2005 2010 2015
EurasiaFormer Soviet Union . . . . . . . . . . . . . . . . . . . . . . . . . . 4.80 4.75 4.88 5.80 6.74 7.65 2.4%Eastern Europe . . . . . . . . . . . . . . . . . . . . . . . . . . . . . . 1.35 1.39 1.49 1.51 1.72 1.96 1.7%China . . . . . . . . . . . . . . . . . . . . . . . . . . . . . . . . . . . . . 3.12 3.31 4.40 5.52 6.89 8.59 4.9%
Total Eurasia . . . . . . . . . . . . . . . . . . . . . . . . . . . . . . 9.28 9.46 10.78 12.84 15.36 18.21 3.3%
Total Consumption . . . . . . . . . . . . . . . . . . . . . . . . . . . . 68.53 69.92 77.57 86.54 94.47 102.80 1.9%
Non-OPEC Production . . . . . . . . . . . . . . . . . . . . . . . . . . . 40.48 41.55 44.23 44.14 43.53 42.15 0.1%Net Eurasia Exports . . . . . . . . . . . . . . . . . . . . . . . . . . . . . 0.97 0.83 -0.09 -1.22 -2.72 -4.99 N/AOPEC Market Share . . . . . . . . . . . . . . . . . . . . . . . . . . . . 0.40 0.40 0.43 0.49 0.54 0.59 1.9%
1Average refiner acquisition cost of imported crude oil.2Includes production of crude oil (including lease condensates), natural gas plant liquids, other hydrogen and hydrocarbons for refinery feedstocks, alcohol, liquids produced from
coal and other sources, and refinery gains.3OECD Europe includes the unified Germany.N/A = Not available.OECD = Organization for Economic Cooperation and Development - Australia, Austria, Belgium, Canada, Denmark, Finland, France, Germany, Greece, Iceland, Ireland, Italy,
Japan, Luxembourg, Mexico, the Netherlands, New Zealand, Norway, Portugal, Spain, Sweden, Switzerland, Turkey, the United Kingdom, and the United States (includingterritories).
Pacific Rim = Hong Kong, Malaysia, Philippines, Singapore, South Korea, Taiwan, and Thailand.OPEC = Organization of Petroleum Exporting Countries - Algeria, Gabon, Indonesia, Iran, Iraq, Kuwait, Libya, Nigeria, Qatar, Saudi Arabia, the United Arab Emirates, and
Venezuela.Eurasia = Albania, Bulgaria, China, Czech Republic, Hungary, Poland, Romania, Slovak Republic, the Former Soviet Union, and the Former Yugoslavia.Note: Totals may not equal sum of components due to independent rounding.Sources: 1994 and 1995 data derived from: Energy Information Administration (EIA), Short-Term Energy Outlook, DOE/EIA-0202(96/4Q) (Washington, DC, October 1996).
Projections: EIA, AEO97 National Energy Modeling System run AEO97B.D100296K.
Energy Information Administration/ Annual Energy Outlook 1997 123

Appendix B
Economic Growth Case ComparisonsTable B1. Total Energy Supply and Disposition Summary
(Quadrillion Btu per Year, Unless Otherwise Noted)
Supply, Disposition, and Prices 1995
Projections
2005 2010 2015
LowEconomic
GrowthReference
HighEconomic
Growth
LowEconomic
GrowthReference
HighEconomic
Growth
LowEconomic
GrowthReference
HighEconomic
Growth
ProductionCrude Oil and Lease Condensate . . . . . . . . . . . . . 13.89 11.46 11.62 11.76 11.18 11.41 11.64 10.80 11.08 11.36Natural Gas Plant Liquids . . . . . . . . . . . . . . . . . . 2.37 2.90 3.01 3.13 2.84 3.04 3.26 3.22 3.47 3.70Dry Natural Gas . . . . . . . . . . . . . . . . . . . . . . . . . 19.01 22.46 23.30 24.19 23.39 24.93 26.73 24.97 26.83 28.68Coal . . . . . . . . . . . . . . . . . . . . . . . . . . . . . . . . . . 21.98 23.42 23.99 25.07 24.35 25.16 26.59 25.07 26.46 29.06Nuclear Power . . . . . . . . . . . . . . . . . . . . . . . . . . 7.19 6.98 6.98 6.98 6.55 6.55 6.55 4.79 4.79 4.79Renewable Energy1 . . . . . . . . . . . . . . . . . . . . . . . 6.29 6.73 6.88 7.04 7.00 7.25 7.51 7.22 7.71 8.18Other2 . . . . . . . . . . . . . . . . . . . . . . . . . . . . . . . . 1.34 0.41 0.42 0.41 0.39 0.39 0.42 0.40 0.42 0.45
Total . . . . . . . . . . . . . . . . . . . . . . . . . . . . . . . 72.08 74.36 76.19 78.58 75.70 78.73 82.69 76.47 80.75 86.21
ImportsCrude Oil 3 . . . . . . . . . . . . . . . . . . . . . . . . . . . . . 15.69 20.16 20.72 21.33 20.94 21.19 22.13 21.39 22.23 23.09Petroleum Products4 . . . . . . . . . . . . . . . . . . . . . . 3.19 6.15 6.79 7.47 6.77 8.23 8.89 6.65 8.35 9.92Natural Gas . . . . . . . . . . . . . . . . . . . . . . . . . . . . 2.90 3.98 3.98 3.98 4.23 4.23 4.23 4.55 4.55 4.55Other Imports5 . . . . . . . . . . . . . . . . . . . . . . . . . . 0.60 0.64 0.67 0.70 0.62 0.67 0.71 0.58 0.64 0.69
Total . . . . . . . . . . . . . . . . . . . . . . . . . . . . . . . 22.38 30.93 32.16 33.49 32.57 34.31 35.96 33.18 35.77 38.25
ExportsPetroleum6 . . . . . . . . . . . . . . . . . . . . . . . . . . . . . 2.02 1.80 1.92 2.16 1.84 1.94 2.01 1.83 1.97 2.09Natural Gas . . . . . . . . . . . . . . . . . . . . . . . . . . . . 0.16 0.21 0.21 0.21 0.22 0.22 0.22 0.22 0.22 0.22Coal . . . . . . . . . . . . . . . . . . . . . . . . . . . . . . . . . . 2.27 2.60 2.59 2.59 2.82 2.82 2.82 3.04 3.04 3.04
Total . . . . . . . . . . . . . . . . . . . . . . . . . . . . . . . 4.45 4.62 4.73 4.96 4.88 4.98 5.05 5.10 5.24 5.36
Discrepancy 7 . . . . . . . . . . . . . . . . . . . . . . . . . . . . 0.91 -0.34 -0.26 -0.27 -0.18 -0.17 -0.20 -0.31 -0.40 -0.42
ConsumptionPetroleum Products8 . . . . . . . . . . . . . . . . . . . . . . 34.92 39.09 40.46 41.77 40.18 42.24 44.27 40.33 43.26 46.11Natural Gas . . . . . . . . . . . . . . . . . . . . . . . . . . . . 22.18 26.11 26.94 27.80 27.25 28.77 30.56 29.12 30.97 32.81Coal . . . . . . . . . . . . . . . . . . . . . . . . . . . . . . . . . . 19.95 21.04 21.72 22.87 21.84 22.68 24.13 22.41 23.76 26.41Nuclear Power . . . . . . . . . . . . . . . . . . . . . . . . . . 7.19 6.98 6.98 6.98 6.55 6.55 6.55 4.79 4.79 4.79Renewable Energy1 . . . . . . . . . . . . . . . . . . . . . . . 6.30 6.73 6.88 7.04 7.00 7.25 7.51 7.23 7.71 8.18Other9 . . . . . . . . . . . . . . . . . . . . . . . . . . . . . . . . 0.39 0.38 0.38 0.38 0.39 0.39 0.39 0.36 0.37 0.38
Total . . . . . . . . . . . . . . . . . . . . . . . . . . . . . . 90.93 100.33 103.36 106.85 103.21 107.89 113.41 104.23 110.87 118.67
Net Imports - Petroleum . . . . . . . . . . . . . . . . . . . 16.87 24.51 25.59 26.65 25.88 27.48 29.01 26.21 28.60 30.92
Prices (1995 dollars per unit)World Oil Price (dollars per barrel)10 . . . . . . . . . . . 17.26 18.93 19.72 20.54 19.43 20.41 21.37 19.78 20.98 22.21Gas Wellhead Price (dollars per Mcf)11 . . . . . . . . . 1.61 1.79 1.94 2.15 1.81 2.01 2.23 1.83 2.13 2.49Coal Minemouth Price (dollars per ton) . . . . . . . . . 18.83 17.19 17.47 17.78 16.80 16.92 16.64 15.32 15.46 15.90
1Includes utility and nonutility grid-connected electricity from hydroelectric, wood and wood waste, municipal solid waste, other biomass, wind, photovoltaic and solar thermalsources; non-electric energy from renewable sources, such as active and passive solar systems, and wood; and both the ethanol and gasoline components of E85, but not theethanol components of blends less than 85 percent. Excludes nonmarketed renewable energy. See Table B18 for selected nonmarketed residential and commercial renewableenergy.
2Includes liquid hydrogen, methanol, supplemental natural gas, and some domestic inputs to refineries.3Includes imports of crude oil for the Strategic Petroleum Reserve.4Includes imports of finished petroleum products, imports of unfinished oils, alcohols, ethers, and blending components.5Includes coal, coal coke (net), and electricity (net).6Includes crude oil and petroleum products.7Balancing item. Includes unaccounted for supply, losses, gains, and net storage withdrawals.8Includes natural gas plant liquids, crude oil consumed as a fuel, and nonpetroleum based liquids for blending, such as ethanol.9Includes net electricity imports, methanol, and liquid hydrogen.10Average refiner acquisition cost for imported crude oil.11Represents lower 48 onshore and offshore supplies.Btu = British thermal unit.Mcf = Thousand cubic feet.Note: Totals may not equal sum of components due to independent rounding. Figures for 1995 may differ from published data due to internal conversion factors.Sources: 1995 natural gas price: Energy Information Administration (EIA), Natural Gas Monthly, DOE/EIA-0130(96/6) (Washington, DC, June 1996). 1995 natural gas supply
derived from: EIA, Natural Gas Annual 1995, DOE/EIA-0131(95) (Washington, DC November 1996). 1995 coal minemouth price, coal production, and exports derived from: EIA,Monthly Energy Review, DOE/EIA-0035(96/08) (Washington, DC, August 1996). Other 1995 values: EIA, Annual Energy Review 1995, DOE/EIA-0384(95) (Washington, DC, July1996). Projections: EIA, AEO97 National Energy Modeling System runs LMAC97.D100396A, AEO97B.D100296K, and HMAC97.D100296A.
124 Energy Information Administration/ Annual Energy Outlook 1997

Economic Growth Case Comparisons
Table B2. Energy Consumption by Sector and Source(Quadrillion Btu per Year, Unless Otherwise Noted)
Sector and Source 1995
Projections
2005 2010 2015
LowEconomic
GrowthReference
HighEconomic
Growth
LowEconomic
GrowthReference
HighEconomic
Growth
LowEconomic
GrowthReference
HighEconomic
Growth
Energy Consumption
ResidentialDistillate Fuel . . . . . . . . . . . . . . . . . . . . . . . . . . . 0.85 0.78 0.78 0.79 0.74 0.75 0.77 0.72 0.73 0.75Kerosene . . . . . . . . . . . . . . . . . . . . . . . . . . . . . . 0.07 0.07 0.07 0.07 0.06 0.07 0.07 0.06 0.06 0.07Liquefied Petroleum Gas . . . . . . . . . . . . . . . . . . . 0.40 0.43 0.44 0.46 0.42 0.45 0.47 0.42 0.46 0.49
Petroleum Subtotal . . . . . . . . . . . . . . . . . . . . . . 1.32 1.27 1.29 1.32 1.23 1.26 1.31 1.20 1.25 1.31Natural Gas . . . . . . . . . . . . . . . . . . . . . . . . . . . . 5.01 5.30 5.43 5.55 5.37 5.57 5.79 5.46 5.73 6.00Coal . . . . . . . . . . . . . . . . . . . . . . . . . . . . . . . . . . 0.05 0.05 0.05 0.05 0.04 0.04 0.04 0.04 0.04 0.04Renewable Energy1 . . . . . . . . . . . . . . . . . . . . . . . 0.57 0.55 0.56 0.57 0.53 0.55 0.56 0.52 0.54 0.56Electricity . . . . . . . . . . . . . . . . . . . . . . . . . . . . . . 3.56 4.02 4.14 4.27 4.27 4.46 4.66 4.57 4.85 5.13
Delivered Energy . . . . . . . . . . . . . . . . . . . . . . . 10.51 11.18 11.46 11.75 11.44 11.89 12.36 11.79 12.41 13.04Electricity Related Losses . . . . . . . . . . . . . . . . . . 7.92 8.35 8.55 8.76 8.68 8.95 9.26 8.83 9.22 9.74
Total . . . . . . . . . . . . . . . . . . . . . . . . . . . . . . . . 18.43 19.54 20.02 20.51 20.12 20.83 21.62 20.63 21.63 22.78
CommercialDistillate Fuel . . . . . . . . . . . . . . . . . . . . . . . . . . . 0.41 0.36 0.36 0.36 0.35 0.35 0.36 0.34 0.34 0.35Residual Fuel . . . . . . . . . . . . . . . . . . . . . . . . . . . 0.17 0.13 0.13 0.14 0.13 0.14 0.14 0.14 0.14 0.15Kerosene . . . . . . . . . . . . . . . . . . . . . . . . . . . . . . 0.02 0.02 0.02 0.02 0.02 0.02 0.02 0.02 0.02 0.02Liquefied Petroleum Gas . . . . . . . . . . . . . . . . . . . 0.05 0.06 0.06 0.06 0.06 0.06 0.06 0.06 0.06 0.07Motor Gasoline2 . . . . . . . . . . . . . . . . . . . . . . . . . 0.03 0.03 0.03 0.03 0.03 0.03 0.03 0.02 0.02 0.02
Petroleum Subtotal . . . . . . . . . . . . . . . . . . . . . . 0.67 0.60 0.60 0.61 0.59 0.59 0.61 0.58 0.59 0.61Natural Gas . . . . . . . . . . . . . . . . . . . . . . . . . . . . 3.16 3.43 3.44 3.52 3.51 3.54 3.67 3.61 3.65 3.83Coal . . . . . . . . . . . . . . . . . . . . . . . . . . . . . . . . . . 0.08 0.08 0.08 0.09 0.09 0.09 0.09 0.09 0.09 0.10Renewable Energy3 . . . . . . . . . . . . . . . . . . . . . . . 0.00 0.00 0.00 0.00 0.00 0.00 0.00 0.00 0.00 0.00Electricity . . . . . . . . . . . . . . . . . . . . . . . . . . . . . . 3.23 3.70 3.71 3.81 3.90 3.91 4.07 4.13 4.16 4.39
Delivered Energy . . . . . . . . . . . . . . . . . . . . . . . 7.15 7.81 7.84 8.02 8.08 8.13 8.44 8.41 8.50 8.94Electricity Related Losses . . . . . . . . . . . . . . . . . . 7.18 7.69 7.67 7.82 7.92 7.85 8.09 7.98 7.91 8.33
Total . . . . . . . . . . . . . . . . . . . . . . . . . . . . . . . . 14.33 15.50 15.51 15.84 16.00 15.98 16.53 16.39 16.40 17.27
Industrial 4
Distillate Fuel . . . . . . . . . . . . . . . . . . . . . . . . . . . 1.15 1.32 1.39 1.46 1.37 1.47 1.58 1.41 1.55 1.69Liquefied Petroleum Gas . . . . . . . . . . . . . . . . . . . 2.01 2.11 2.20 2.29 2.14 2.28 2.43 2.16 2.35 2.55Petrochemical Feedstocks . . . . . . . . . . . . . . . . . . 1.16 1.25 1.30 1.35 1.27 1.35 1.43 1.29 1.40 1.51Residual Fuel . . . . . . . . . . . . . . . . . . . . . . . . . . . 0.34 0.30 0.31 0.33 0.32 0.33 0.33 0.31 0.35 0.35Motor Gasoline2 . . . . . . . . . . . . . . . . . . . . . . . . . 0.20 0.23 0.24 0.25 0.24 0.26 0.28 0.24 0.27 0.30Other Petroleum5 . . . . . . . . . . . . . . . . . . . . . . . . 3.83 4.13 4.33 4.45 4.20 4.43 4.63 4.22 4.48 4.70
Petroleum Subtotal . . . . . . . . . . . . . . . . . . . . . . 8.68 9.33 9.77 10.12 9.54 10.13 10.66 9.62 10.41 11.10Natural Gas6 . . . . . . . . . . . . . . . . . . . . . . . . . . . . 9.74 10.74 11.04 11.34 10.92 11.42 11.99 10.97 11.63 12.33Metallurgical Coal . . . . . . . . . . . . . . . . . . . . . . . . 0.88 0.69 0.69 0.69 0.62 0.62 0.62 0.55 0.55 0.55Steam Coal . . . . . . . . . . . . . . . . . . . . . . . . . . . . . 1.59 1.70 1.82 1.99 1.70 1.89 2.12 1.68 1.97 2.30Net Coal Coke Imports . . . . . . . . . . . . . . . . . . . . 0.03 0.07 0.11 0.14 0.09 0.13 0.18 0.09 0.15 0.20
Coal Subtotal . . . . . . . . . . . . . . . . . . . . . . . . . . 2.51 2.46 2.62 2.82 2.40 2.64 2.91 2.32 2.67 3.05Renewable Energy7 . . . . . . . . . . . . . . . . . . . . . . . 1.74 2.02 2.12 2.21 2.12 2.28 2.43 2.17 2.40 2.62Electricity . . . . . . . . . . . . . . . . . . . . . . . . . . . . . . 3.46 3.93 4.16 4.44 4.03 4.40 4.81 4.09 4.62 5.21
Delivered Energy . . . . . . . . . . . . . . . . . . . . . . . 26.12 28.49 29.70 30.93 29.01 30.87 32.81 29.17 31.73 34.30Electricity Related Losses . . . . . . . . . . . . . . . . . . 7.69 8.17 8.59 9.11 8.20 8.82 9.56 7.90 8.79 9.89
Total . . . . . . . . . . . . . . . . . . . . . . . . . . . . . . . . 33.81 36.66 38.28 40.04 37.20 39.69 42.37 37.07 40.51 44.19
Energy Information Administration/ Annual Energy Outlook 1997 125

Economic Growth Case Comparisons
Table B2. Energy Consumption by Sector and Source (Continued)(Quadrillion Btu per Year, Unless Otherwise Noted)
Sector and Source 1995
Projections
2005 2010 2015
LowEconomic
GrowthReference
HighEconomic
Growth
LowEconomic
GrowthReference
HighEconomic
Growth
LowEconomic
GrowthReference
HighEconomic
Growth
TransportationDistillate Fuel . . . . . . . . . . . . . . . . . . . . . . . . . . . 4.42 5.22 5.46 5.70 5.41 5.78 6.16 5.48 6.00 6.51Jet Fuel 8 . . . . . . . . . . . . . . . . . . . . . . . . . . . . . . 3.13 4.07 4.26 4.45 4.33 4.67 5.00 4.44 4.95 5.43Motor Gasoline2 . . . . . . . . . . . . . . . . . . . . . . . . . 14.65 16.23 16.61 16.98 16.49 17.09 17.67 16.25 17.11 17.92Residual Fuel . . . . . . . . . . . . . . . . . . . . . . . . . . . 1.08 1.42 1.47 1.52 1.56 1.64 1.72 1.66 1.78 1.90Liquefied Petroleum Gas . . . . . . . . . . . . . . . . . . . 0.03 0.11 0.11 0.12 0.16 0.18 0.19 0.20 0.21 0.23Other Petroleum9 . . . . . . . . . . . . . . . . . . . . . . . . 0.26 0.30 0.31 0.32 0.31 0.33 0.35 0.31 0.34 0.37
Petroleum Subtotal . . . . . . . . . . . . . . . . . . . . . . 23.56 27.35 28.22 29.09 28.27 29.69 31.09 28.34 30.39 32.36Pipeline Fuel Natural Gas . . . . . . . . . . . . . . . . . . 0.72 0.82 0.84 0.86 0.84 0.88 0.94 0.88 0.93 1.00Compressed Natural Gas . . . . . . . . . . . . . . . . . . . 0.01 0.18 0.18 0.19 0.24 0.26 0.28 0.28 0.31 0.34Renewable Energy (E85)10 . . . . . . . . . . . . . . . . . 0.00 0.02 0.02 0.03 0.07 0.07 0.08 0.09 0.10 0.11Methanol 11 . . . . . . . . . . . . . . . . . . . . . . . . . . . . . 0.00 0.03 0.03 0.03 0.06 0.07 0.07 0.08 0.09 0.10Liquid Hydrogen . . . . . . . . . . . . . . . . . . . . . . . . . 0.00 0.00 0.00 0.00 0.00 0.00 0.00 0.00 0.00 0.00Electricity . . . . . . . . . . . . . . . . . . . . . . . . . . . . . . 0.02 0.08 0.08 0.08 0.13 0.14 0.14 0.16 0.17 0.18
Delivered Energy . . . . . . . . . . . . . . . . . . . . . . . 24.31 28.47 29.38 30.28 29.61 31.11 32.60 29.84 31.99 34.09Electricity Related Losses . . . . . . . . . . . . . . . . . . 0.04 0.16 0.17 0.17 0.27 0.28 0.29 0.31 0.32 0.34
Total . . . . . . . . . . . . . . . . . . . . . . . . . . . . . . . . 24.36 28.63 29.55 30.45 29.88 31.39 32.88 30.15 32.32 34.43
Delivered Energy Consumption for All SectorsDistillate Fuel . . . . . . . . . . . . . . . . . . . . . . . . . . . 6.82 7.67 7.98 8.31 7.87 8.35 8.86 7.94 8.62 9.31Kerosene . . . . . . . . . . . . . . . . . . . . . . . . . . . . . . 0.11 0.11 0.11 0.11 0.10 0.11 0.11 0.10 0.11 0.11Jet Fuel 8 . . . . . . . . . . . . . . . . . . . . . . . . . . . . . . 3.13 4.07 4.26 4.45 4.33 4.67 5.00 4.44 4.95 5.43Liquefied Petroleum Gas . . . . . . . . . . . . . . . . . . . 2.49 2.70 2.81 2.92 2.79 2.97 3.15 2.84 3.09 3.34Motor Gasoline2 . . . . . . . . . . . . . . . . . . . . . . . . . 14.87 16.48 16.88 17.26 16.76 17.38 17.98 16.52 17.40 18.24Petrochemical Feedstocks . . . . . . . . . . . . . . . . . . 1.16 1.25 1.30 1.35 1.27 1.35 1.43 1.29 1.40 1.51Residual Fuel . . . . . . . . . . . . . . . . . . . . . . . . . . . 1.58 1.86 1.92 1.99 2.02 2.11 2.19 2.11 2.27 2.40Other Petroleum12 . . . . . . . . . . . . . . . . . . . . . . . . 4.07 4.42 4.62 4.75 4.49 4.74 4.96 4.51 4.80 5.05
Petroleum Subtotal . . . . . . . . . . . . . . . . . . . . . . 34.24 38.54 39.88 41.15 39.62 41.67 43.67 39.75 42.63 45.38Natural Gas6 . . . . . . . . . . . . . . . . . . . . . . . . . . . . 18.64 20.46 20.93 21.45 20.88 21.68 22.67 21.20 22.26 23.50Metallurgical Coal . . . . . . . . . . . . . . . . . . . . . . . . 0.88 0.69 0.69 0.69 0.62 0.62 0.62 0.55 0.55 0.55Steam Coal . . . . . . . . . . . . . . . . . . . . . . . . . . . . . 1.73 1.83 1.95 2.12 1.83 2.02 2.25 1.81 2.10 2.44Net Coal Coke Imports . . . . . . . . . . . . . . . . . . . . 0.03 0.07 0.11 0.14 0.09 0.13 0.18 0.09 0.15 0.20
Coal Subtotal . . . . . . . . . . . . . . . . . . . . . . . . . . 2.64 2.59 2.75 2.95 2.53 2.77 3.04 2.45 2.80 3.18Renewable Energy13 . . . . . . . . . . . . . . . . . . . . . . 2.31 2.59 2.70 2.81 2.72 2.90 3.07 2.79 3.04 3.29Methanol 11 . . . . . . . . . . . . . . . . . . . . . . . . . . . . . 0.00 0.03 0.03 0.03 0.06 0.07 0.07 0.08 0.09 0.10Liquid Hydrogen . . . . . . . . . . . . . . . . . . . . . . . . . 0.00 0.00 0.00 0.00 0.00 0.00 0.00 0.00 0.00 0.00Electricity . . . . . . . . . . . . . . . . . . . . . . . . . . . . . . 10.26 11.74 12.09 12.60 12.32 12.91 13.68 12.94 13.80 14.91
Delivered Energy . . . . . . . . . . . . . . . . . . . . . . . 68.10 75.96 78.38 80.98 78.14 81.99 86.20 79.22 84.62 90.37Electricity Related Losses . . . . . . . . . . . . . . . . . . 22.83 24.38 24.98 25.86 25.07 25.90 27.21 25.02 26.24 28.31
Total . . . . . . . . . . . . . . . . . . . . . . . . . . . . . . . . 90.93 100.33 103.36 106.85 103.21 107.89 113.41 104.23 110.87 118.67
Electric Generators 14
Distillate Fuel . . . . . . . . . . . . . . . . . . . . . . . . . . . 0.08 0.11 0.12 0.14 0.12 0.14 0.15 0.15 0.15 0.16Residual Fuel . . . . . . . . . . . . . . . . . . . . . . . . . . . 0.60 0.44 0.46 0.49 0.43 0.43 0.45 0.43 0.48 0.56
Petroleum Subtotal . . . . . . . . . . . . . . . . . . . . . . 0.68 0.55 0.58 0.62 0.56 0.57 0.60 0.58 0.63 0.73Natural Gas . . . . . . . . . . . . . . . . . . . . . . . . . . . . 3.54 5.64 6.01 6.35 6.37 7.09 7.89 7.91 8.71 9.31Steam Coal . . . . . . . . . . . . . . . . . . . . . . . . . . . . . 17.31 18.45 18.97 19.92 19.31 19.91 21.09 19.96 20.96 23.22Nuclear Power . . . . . . . . . . . . . . . . . . . . . . . . . . 7.19 6.98 6.98 6.98 6.55 6.55 6.55 4.79 4.79 4.79Renewable Energy15 . . . . . . . . . . . . . . . . . . . . . . 3.99 4.13 4.18 4.24 4.28 4.36 4.44 4.44 4.67 4.89
Electricity Imports . . . . . . . . . . . . . . . . . . . . . . . . . 0.39 0.36 0.36 0.36 0.32 0.32 0.32 0.28 0.28 0.28Total . . . . . . . . . . . . . . . . . . . . . . . . . . . . . . . . 33.10 36.11 37.07 38.46 37.39 38.81 40.89 37.96 40.04 43.22
126 Energy Information Administration/ Annual Energy Outlook 1997

Economic Growth Case Comparisons
Table B2. Energy Consumption by Sector and Source (Continued)(Quadrillion Btu per Year, Unless Otherwise Noted)
Sector and Source 1995
Projections
2005 2010 2015
LowEconomic
GrowthReference
HighEconomic
Growth
LowEconomic
GrowthReference
HighEconomic
Growth
LowEconomic
GrowthReference
HighEconomic
Growth
Total Energy ConsumptionDistillate Fuel . . . . . . . . . . . . . . . . . . . . . . . . 6.90 7.78 8.11 8.45 7.99 8.49 9.01 8.10 8.77 9.47Kerosene . . . . . . . . . . . . . . . . . . . . . . . . . . . 0.11 0.11 0.11 0.11 0.10 0.11 0.11 0.10 0.11 0.11Jet Fuel 8 . . . . . . . . . . . . . . . . . . . . . . . . . . . 3.13 4.07 4.26 4.45 4.33 4.67 5.00 4.44 4.95 5.43Liquefied Petroleum Gas . . . . . . . . . . . . . . . . 2.49 2.70 2.81 2.92 2.79 2.97 3.15 2.84 3.09 3.34Motor Gasoline2 . . . . . . . . . . . . . . . . . . . . . . 14.87 16.48 16.88 17.26 16.76 17.38 17.98 16.52 17.40 18.24Petrochemical Feedstocks . . . . . . . . . . . . . . . 1.16 1.25 1.30 1.35 1.27 1.35 1.43 1.29 1.40 1.51Residual Fuel . . . . . . . . . . . . . . . . . . . . . . . . 2.18 2.30 2.38 2.47 2.45 2.54 2.64 2.53 2.75 2.96Other Petroleum12 . . . . . . . . . . . . . . . . . . . . . 4.07 4.42 4.62 4.75 4.49 4.74 4.96 4.51 4.80 5.05
Petroleum Subtotal . . . . . . . . . . . . . . . . . . . 34.92 39.09 40.46 41.77 40.18 42.24 44.27 40.33 43.26 46.11Natural Gas . . . . . . . . . . . . . . . . . . . . . . . . . 22.18 26.11 26.94 27.80 27.25 28.77 30.56 29.12 30.97 32.81Metallurgical Coal . . . . . . . . . . . . . . . . . . . . . 0.88 0.69 0.69 0.69 0.62 0.62 0.62 0.55 0.55 0.55Steam Coal . . . . . . . . . . . . . . . . . . . . . . . . . . 19.04 20.28 20.92 22.04 21.14 21.94 23.34 21.77 23.06 25.66Net Coal Coke Imports . . . . . . . . . . . . . . . . . 0.03 0.07 0.11 0.14 0.09 0.13 0.18 0.09 0.15 0.20
Coal Subtotal . . . . . . . . . . . . . . . . . . . . . . . 19.95 21.04 21.72 22.87 21.84 22.68 24.13 22.41 23.76 26.41Nuclear Power . . . . . . . . . . . . . . . . . . . . . . . 7.19 6.98 6.98 6.98 6.55 6.55 6.55 4.79 4.79 4.79Renewable Energy16 . . . . . . . . . . . . . . . . . . . 6.30 6.73 6.88 7.04 7.00 7.25 7.51 7.23 7.71 8.18Methanol 11 . . . . . . . . . . . . . . . . . . . . . . . . . . 0.00 0.03 0.03 0.03 0.06 0.07 0.07 0.08 0.09 0.10Liquid Hydrogen . . . . . . . . . . . . . . . . . . . . . . 0.00 0.00 0.00 0.00 0.00 0.00 0.00 0.00 0.00 0.00Electricity Imports . . . . . . . . . . . . . . . . . . . . . 0.39 0.36 0.36 0.36 0.32 0.32 0.32 0.28 0.28 0.28
Total . . . . . . . . . . . . . . . . . . . . . . . . . . . . . 90.93 100.33 103.36 106.85 103.21 107.89 113.41 104.23 110.87 118.67
Energy Use and Related Statistics
Delivered Energy Use . . . . . . . . . . . . . . . . . . . . 68.10 75.96 78.38 80.98 78.14 81.99 86.20 79.22 84.62 90.37Total Energy Use . . . . . . . . . . . . . . . . . . . . . . . 90.93 100.33 103.35 106.83 103.19 107.87 113.39 104.20 110.83 118.64Population (millions) . . . . . . . . . . . . . . . . . . . . . 263.58 279.92 287.12 293.76 288.32 298.92 308.72 297.04 311.19 324.31Gross Domestic Product (billion 1992 dollars) . . . 6738.95 8013.05 8389.54 8766.55 8561.61 9185.32 9796.51 8981.64 9879.75 10766.37
1Includes wood used for residential heating. See Table B18 for estimates of nonmarketed renewable energy consumption for geothermal heat pumps and solar thermal hot waterheating.
2Includes ethanol (blends of 10 percent or less) and ethers blended into gasoline.3Includes commercial sector electricity cogenerated by using wood and wood waste, municipal solid waste, and other biomass. See Table B18 for estimates of nonmarketed
renewable energy consumption for solar thermal hot water heating.4Fuel consumption includes consumption for cogeneration.5Includes petroleum coke, asphalt, road oil, lubricants, still gas, and miscellaneous petroleum products.6Includes lease and plant fuel.7Includes consumption of energy from hydroelectric, wood and wood waste, municipal solid waste, and other biomass.8Includes naphtha and kerosene type.9Includes aviation gas and lubricants.10E85 is 85 percent ethanol (renewable) and 15 percent motor gasoline (nonrenewable).11Only M85 (85 percent methanol).12Includes unfinished oils, natural gasoline, motor gasoline blending compounds, aviation gasoline, lubricants, still gas, asphalt, road oil, petroleum coke, and miscellaneous
petroleum products.13Includes electricity generated for sale to electric utilities and for self use from renewable sources, and non-electric energy from renewable sources. Excludes nonmarketed
renewable energy consumption for geothermal heat pumps and solar thermal hot water heaters.14Includes consumption of energy by all electric power generators for grid-connected power except cogenerators, which produce electricity as a by-product of other processes.15Includes hydroelectric, geothermal, wood and wood waste, municipal solid waste, other biomass, E85, wind, photovoltaic and solar thermal sources.16Includes hydroelectric, geothermal, wood and wood waste, municipal solid waste, other biomass, wind, photovoltaic and solar thermal sources. Includes ethanol components of
E85; excludes ethanol blends (10 percent or less) in motor gasoline. Excludes nonmarketed renewable energy consumption for geothermal heat pumps and solar thermal hot waterheaters.
Btu = British thermal unit.Note: Totals may not equal sum of components due to independent rounding. Figures for 1995 may differ from published data due to internal conversion factors. Consumption
values of 0.00 are values that round to 0.00, because they are less than 0.005.Sources: 1995 natural gas lease, plant, and pipeline fuel values: Energy Information Administration (EIA), Short-Term Energy Outlook, DOE/EIA-0202(96/4Q) (Washington, DC,
October 1996). 1995 transportation sector compressed natural gas consumption: EIA, AEO97 National Energy Modeling System runs LMAC97.D100396A, AEO97B.D100296K, andHMAC97.D100296A. 1995 electric utility fuel consumption: EIA, Electric Power Annual, Volume I, DOE/EIA-0348(95)/1 (Washington, DC, July 1996). 1995 nonutility consumptionestimates: EIA Form 867, “Annual Nonutility Power Producer Report.” Other 1995 values: EIA, Short-Term Energy Outlook, DOE/EIA-0202(96/4Q) (Washington, DC, October 1996).Projections: EIA, AEO97 National Energy Modeling System runs LMAC97.D100396A, AEO97B.D100296K, and HMAC97.D100296A.
Energy Information Administration/ Annual Energy Outlook 1997 127

Economic Growth Case Comparisons
Table B3. Energy Prices by Sector and Source(1995 Dollars per Million Btu)
Sector and Source 1995
Projections
2005 2010 2015
LowEconomic
GrowthReference
HighEconomic
Growth
LowEconomic
GrowthReference
HighEconomic
Growth
LowEconomic
GrowthReference
HighEconomic
Growth
Residential . . . . . . . . . . . . . . . . . . . . . . . . . . . . . . 12.87 12.26 12.70 13.00 12.08 12.61 12.94 11.86 12.55 13.07Primary Energy . . . . . . . . . . . . . . . . . . . . . . . . . . 6.28 5.96 6.09 6.29 5.75 5.95 6.14 5.54 5.83 6.15
Petroleum Products . . . . . . . . . . . . . . . . . . . . . . 7.51 8.54 8.75 8.99 8.74 9.08 9.27 8.59 8.95 9.35Distillate Fuel . . . . . . . . . . . . . . . . . . . . . . . . . 6.24 7.12 7.28 7.46 7.20 7.45 7.63 7.09 7.33 7.68Liquefied Petroleum Gas . . . . . . . . . . . . . . . . . 10.29 11.15 11.40 11.69 11.47 11.85 11.97 11.17 11.57 11.96
Natural Gas . . . . . . . . . . . . . . . . . . . . . . . . . . . 6.01 5.38 5.49 5.69 5.11 5.27 5.46 4.91 5.18 5.49Electricity . . . . . . . . . . . . . . . . . . . . . . . . . . . . . . 24.67 22.62 23.49 23.89 21.93 22.88 23.37 21.13 22.28 22.98
Commercial . . . . . . . . . . . . . . . . . . . . . . . . . . . . . 13.12 12.16 12.60 12.96 11.94 12.48 12.88 11.55 12.28 12.91Primary Energy . . . . . . . . . . . . . . . . . . . . . . . . . . 4.82 4.54 4.69 4.89 4.38 4.59 4.79 4.23 4.54 4.86
Petroleum Products . . . . . . . . . . . . . . . . . . . . . . 4.58 5.18 5.34 5.52 5.28 5.52 5.69 5.17 5.42 5.73Distillate Fuel . . . . . . . . . . . . . . . . . . . . . . . . . 4.39 5.11 5.28 5.46 5.19 5.44 5.63 5.06 5.32 5.67Residual Fuel . . . . . . . . . . . . . . . . . . . . . . . . . 2.99 2.74 2.87 3.00 2.82 2.98 3.18 2.83 3.03 3.23
Natural Gas1 . . . . . . . . . . . . . . . . . . . . . . . . . . . 4.96 4.50 4.65 4.86 4.30 4.51 4.73 4.15 4.48 4.81Electricity . . . . . . . . . . . . . . . . . . . . . . . . . . . . . . 23.19 20.61 21.38 21.88 20.06 20.98 21.55 19.16 20.35 21.25
Industrial 2 . . . . . . . . . . . . . . . . . . . . . . . . . . . . . . 5.02 4.72 4.96 5.22 4.72 5.05 5.30 4.55 4.99 5.43Primary Energy . . . . . . . . . . . . . . . . . . . . . . . . . . 3.36 3.18 3.34 3.53 3.24 3.47 3.63 3.17 3.47 3.77
Petroleum Products . . . . . . . . . . . . . . . . . . . . . . 4.92 4.42 4.60 4.80 4.53 4.80 4.95 4.34 4.68 5.01Distillate Fuel . . . . . . . . . . . . . . . . . . . . . . . . . 4.61 5.04 5.21 5.40 5.14 5.38 5.58 5.02 5.29 5.66Liquefied Petroleum Gas . . . . . . . . . . . . . . . . . 6.53 5.75 6.00 6.29 5.94 6.28 6.33 5.51 5.95 6.33Residual Fuel . . . . . . . . . . . . . . . . . . . . . . . . . 2.55 2.80 2.92 3.05 2.85 3.03 3.19 2.82 3.01 3.27
Natural Gas3 . . . . . . . . . . . . . . . . . . . . . . . . . . . 2.28 2.37 2.54 2.77 2.39 2.61 2.85 2.41 2.74 3.11Metallurgical Coal . . . . . . . . . . . . . . . . . . . . . . . 1.75 1.69 1.72 1.75 1.54 1.58 1.60 1.43 1.48 1.52Steam Coal . . . . . . . . . . . . . . . . . . . . . . . . . . . 1.48 1.41 1.44 1.47 1.34 1.37 1.39 1.25 1.30 1.33
Electricity . . . . . . . . . . . . . . . . . . . . . . . . . . . . . . 14.54 12.93 13.46 13.82 12.53 13.13 13.52 11.75 12.56 13.20
Transportation . . . . . . . . . . . . . . . . . . . . . . . . . . . 7.92 8.18 8.51 8.83 8.06 8.55 8.89 7.70 8.21 8.71Primary Energy . . . . . . . . . . . . . . . . . . . . . . . . . . 7.92 8.16 8.49 8.81 8.03 8.53 8.87 7.66 8.18 8.68
Petroleum Products . . . . . . . . . . . . . . . . . . . . . . 7.92 8.18 8.51 8.83 8.04 8.54 8.88 7.67 8.19 8.70Distillate Fuel 4 . . . . . . . . . . . . . . . . . . . . . . . . 8.03 8.32 8.70 9.02 8.17 8.68 9.06 7.80 8.38 8.94Jet Fuel 5 . . . . . . . . . . . . . . . . . . . . . . . . . . . . 3.85 5.14 5.46 5.76 5.19 5.65 5.95 4.98 5.45 5.91Motor Gasoline6 . . . . . . . . . . . . . . . . . . . . . . . 9.23 9.42 9.79 10.14 9.27 9.85 10.24 8.89 9.49 10.06Residual Fuel . . . . . . . . . . . . . . . . . . . . . . . . . 2.44 2.76 2.90 3.06 2.96 3.16 3.38 2.85 3.08 3.32
Natural Gas7 . . . . . . . . . . . . . . . . . . . . . . . . . . . 5.77 6.05 6.20 6.44 6.52 6.73 6.97 6.75 7.07 7.41Electricity . . . . . . . . . . . . . . . . . . . . . . . . . . . . . . 15.14 14.08 14.45 14.54 13.85 14.25 14.36 13.37 13.85 14.05
Total End-Use Energy . . . . . . . . . . . . . . . . . . . . . 8.22 8.01 8.31 8.59 7.93 8.34 8.63 7.69 8.18 8.65Primary Energy . . . . . . . . . . . . . . . . . . . . . . . . . . 7.82 7.68 7.98 8.27 7.60 8.01 8.31 7.33 7.82 8.29Electricity . . . . . . . . . . . . . . . . . . . . . . . . . . . . . . 20.77 18.68 19.33 19.67 18.18 18.89 19.27 17.44 18.34 18.95
Electric Generators 8
Fossil Fuel Average . . . . . . . . . . . . . . . . . . . . . . . 1.48 1.47 1.53 1.60 1.46 1.54 1.62 1.43 1.55 1.67Petroleum Products . . . . . . . . . . . . . . . . . . . . . . 2.78 3.19 3.35 3.49 3.35 3.59 3.78 3.36 3.52 3.76
Distillate Fuel . . . . . . . . . . . . . . . . . . . . . . . . . 3.94 4.59 4.77 4.93 4.66 4.92 5.11 4.54 4.83 5.19Residual Fuel . . . . . . . . . . . . . . . . . . . . . . . . . 2.62 2.86 2.97 3.09 2.97 3.15 3.34 2.93 3.11 3.34
Natural Gas . . . . . . . . . . . . . . . . . . . . . . . . . . . 2.01 2.13 2.28 2.48 2.13 2.32 2.57 2.14 2.47 2.82Steam Coal . . . . . . . . . . . . . . . . . . . . . . . . . . . 1.32 1.22 1.24 1.26 1.18 1.20 1.20 1.08 1.11 1.15
128 Energy Information Administration/ Annual Energy Outlook 1997

Economic Growth Case Comparisons
Table B3. Energy Prices by Sector and Source (Continued)(1995 Dollars per Million Btu)
Sector and Source 1995
Projections
2005 2010 2015
LowEconomic
GrowthReference
HighEconomic
Growth
LowEconomic
GrowthReference
HighEconomic
Growth
LowEconomic
GrowthReference
HighEconomic
Growth
Average Price to All Users 9
Petroleum Products . . . . . . . . . . . . . . . . . . . . . . . 7.07 7.25 7.52 7.80 7.19 7.62 7.90 6.88 7.33 7.78Distillate Fuel 4 . . . . . . . . . . . . . . . . . . . . . . . . . 6.98 7.45 7.75 8.03 7.38 7.80 8.13 7.07 7.56 8.07Jet Fuel . . . . . . . . . . . . . . . . . . . . . . . . . . . . . . 3.85 5.14 5.46 5.76 5.19 5.65 5.95 4.98 5.45 5.91Liquefied Petroleum Gas . . . . . . . . . . . . . . . . . . 7.20 6.95 7.20 7.49 7.24 7.61 7.68 6.87 7.32 7.71Motor Gasoline6 . . . . . . . . . . . . . . . . . . . . . . . . 9.23 9.41 9.77 10.12 9.26 9.83 10.22 8.88 9.47 10.04Residual Fuel . . . . . . . . . . . . . . . . . . . . . . . . . . 2.55 2.78 2.91 3.06 2.94 3.13 3.34 2.86 3.07 3.31
Natural Gas . . . . . . . . . . . . . . . . . . . . . . . . . . . . 3.57 3.32 3.45 3.65 3.22 3.39 3.60 3.12 3.42 3.76Coal . . . . . . . . . . . . . . . . . . . . . . . . . . . . . . . . . . 1.35 1.24 1.25 1.28 1.19 1.21 1.22 1.10 1.13 1.17Electricity . . . . . . . . . . . . . . . . . . . . . . . . . . . . . . 20.77 18.68 19.33 19.67 18.18 18.89 19.27 17.44 18.34 18.95
1Excludes independent power producers.2Includes cogenerators.3Excludes uses for lease and plant fuel.4Includes Federal and State taxes on diesel fuel and excludes county and local taxes.5Kerosene-type jet fuel.6Sales weighted-average price for all grades. Includes Federal and State taxes and excludes county and local taxes.7Compressed natural gas used as a vehicle fuel. Price includes estimated motor vehicle fuel taxes.8Includes all electric power generators except cogenerators, which produce electricity as a by-product of other processes.9Weighted averages of end-use fuel prices are derived from the prices shown in each sector and the corresponding sectoral consumption.Btu = British thermal unit.Note: 1995 figures may differ from published data due to internal rounding.Sources: 1995 prices for gasoline, distillate, and jet fuel are based on prices in various 1995 issues of Energy Information Administration (EIA), Petroleum Marketing Monthly,
DOE/EIA-0380(95/1-12) (Washington, DC, 1995). 1995 prices for all other petroleum products are derived from the EIA, State Energy Price and Expenditure Report 1993, DOE/EIA-0376(93) (Washington, DC, December 1995). 1995 industrial gas delivered prices are based on EIA, Manufacturing Energy Consumption Survey 1991. 1995 residential andcommercial natural gas delivered prices: EIA, Natural Gas Monthly, DOE/EIA-0130(96/6) (Washington, DC, June 1996). Other 1995 natural gas delivered prices: EIA, AEO97National Energy Modeling System runs LMAC97.D100396A, AEO97B.D100296K, and HMAC97.D100296A. Values for 1995 coal prices have been estimated from EIA, State EnergyPrice and Expenditure Report 1993, DOE/EIA-0376(93) (Washington, DC, December 1995) by use of consumption quantities aggregated from EIA, State Energy Data Report 1993,Consumption Estimates, DOE/EIA-0214(93) (Washington, DC, July 1995). 1995 electricity prices for commercial, industrial, and transportation: EIA, AEO97 National Energy ModelingSystem runs LMAC97.D100396A, AEO97B.D100296K, and HMAC97.D100296A. Projections: EIA, AEO97 National Energy Modeling System runs LMAC97.D100396A,AEO97B.D100296K, and HMAC97.D100296A.
Energy Information Administration/ Annual Energy Outlook 1997 129

Economic Growth Case Comparisons
Table B4. Residential Sector Key Indicators and Consumption(Quadrillion Btu per Year, Unless Otherwise Noted)
Key Indicators and Consumption 1995
Projections
2005 2010 2015
LowEconomic
GrowthReference
HighEconomic
Growth
LowEconomic
GrowthReference
HighEconomic
Growth
LowEconomic
GrowthReference
HighEconomic
Growth
Household Characteristics
Households (millions)Single-Family . . . . . . . . . . . . . . . . . . . . . . . . . 68.66 74.60 76.85 79.19 77.43 80.93 84.49 80.21 85.07 89.99Multifamily . . . . . . . . . . . . . . . . . . . . . . . . . . . 24.56 26.14 26.98 27.89 27.27 28.67 30.10 28.47 30.45 32.45Mobile Homes . . . . . . . . . . . . . . . . . . . . . . . . . 5.83 6.43 6.64 6.83 6.57 6.89 7.20 6.68 7.12 7.55
Total . . . . . . . . . . . . . . . . . . . . . . . . . . . . . . 99.06 107.17 110.47 113.91 111.27 116.49 121.78 115.36 122.65 130.00
Housing Starts (millions)Single-Family . . . . . . . . . . . . . . . . . . . . . . . . . 1.08 0.83 1.08 1.33 0.77 1.03 1.29 0.80 1.09 1.39Multifamily . . . . . . . . . . . . . . . . . . . . . . . . . . . 0.28 0.31 0.42 0.53 0.36 0.48 0.59 0.35 0.48 0.60Mobile Homes . . . . . . . . . . . . . . . . . . . . . . . . . 0.34 0.26 0.29 0.32 0.24 0.28 0.31 0.25 0.29 0.33
Total . . . . . . . . . . . . . . . . . . . . . . . . . . . . . . 1.70 1.40 1.80 2.18 1.37 1.79 2.19 1.40 1.86 2.32
Average House Square Footage . . . . . . . . . . . 1643 1677 1683 1690 1688 1696 1705 1698 1708 1718
Energy Intensity
Million Btu Consumed per HouseholdDelivered Energy Consumption . . . . . . . . . . . . 106.10 104.36 103.78 103.19 102.82 102.06 101.50 102.22 101.19 100.33Electricity Related Losses . . . . . . . . . . . . . . . . 79.94 77.96 77.43 76.88 78.02 76.80 76.06 76.56 75.20 74.94Total Energy Consumption . . . . . . . . . . . . . . . . 186.03 182.31 181.21 180.07 180.84 178.86 177.57 178.78 176.39 175.27
Thousand Btu Consumed per Square FootDelivered Energy Consumption . . . . . . . . . . . . 64.57 62.23 61.65 61.05 60.90 60.16 59.53 60.21 59.26 58.40Electricity Related Losses . . . . . . . . . . . . . . . . 48.65 46.49 46.00 45.49 46.21 45.27 44.61 45.10 44.04 43.63Total Energy Consumption . . . . . . . . . . . . . . . . 113.22 108.71 107.64 106.54 107.12 105.43 104.14 105.30 103.29 102.03
Delivered Energy Consumption by Fuel
DistillateSpace Heating . . . . . . . . . . . . . . . . . . . . . . . . 0.76 0.68 0.69 0.69 0.64 0.65 0.67 0.62 0.63 0.65Water Heating . . . . . . . . . . . . . . . . . . . . . . . . . 0.09 0.10 0.10 0.10 0.09 0.10 0.10 0.09 0.10 0.10Other Uses1 . . . . . . . . . . . . . . . . . . . . . . . . . . 0.00 0.00 0.00 0.00 0.00 0.00 0.00 0.00 0.00 0.00
Delivered Energy . . . . . . . . . . . . . . . . . . . . . 0.85 0.78 0.78 0.79 0.74 0.75 0.77 0.72 0.73 0.75
Liquefied Petroleum GasSpace Heating . . . . . . . . . . . . . . . . . . . . . . . . 0.30 0.31 0.32 0.33 0.30 0.32 0.34 0.30 0.32 0.34Water Heating . . . . . . . . . . . . . . . . . . . . . . . . . 0.06 0.08 0.08 0.09 0.08 0.09 0.09 0.09 0.09 0.10Cooking2 . . . . . . . . . . . . . . . . . . . . . . . . . . . . . 0.03 0.03 0.03 0.03 0.03 0.03 0.03 0.03 0.03 0.03Other Uses3 . . . . . . . . . . . . . . . . . . . . . . . . . . 0.01 0.01 0.01 0.01 0.01 0.01 0.01 0.01 0.01 0.01
Delivered Energy . . . . . . . . . . . . . . . . . . . . . 0.40 0.43 0.44 0.46 0.42 0.45 0.47 0.42 0.46 0.49
Natural GasSpace Heating . . . . . . . . . . . . . . . . . . . . . . . . 3.48 3.71 3.79 3.87 3.75 3.88 4.02 3.79 3.96 4.13Space Cooling . . . . . . . . . . . . . . . . . . . . . . . . 0.00 0.01 0.01 0.01 0.02 0.02 0.02 0.02 0.02 0.03Water Heating . . . . . . . . . . . . . . . . . . . . . . . . . 1.25 1.30 1.34 1.37 1.33 1.39 1.44 1.37 1.45 1.52Cooking2 . . . . . . . . . . . . . . . . . . . . . . . . . . . . . 0.15 0.13 0.14 0.14 0.13 0.14 0.15 0.13 0.14 0.15Clothes Dryers . . . . . . . . . . . . . . . . . . . . . . . . 0.05 0.05 0.05 0.05 0.05 0.05 0.05 0.05 0.05 0.05Other Uses3 . . . . . . . . . . . . . . . . . . . . . . . . . . 0.09 0.10 0.10 0.10 0.10 0.10 0.11 0.10 0.11 0.11
Delivered Energy . . . . . . . . . . . . . . . . . . . . . 5.01 5.30 5.43 5.55 5.37 5.57 5.79 5.46 5.73 6.00
ElectricitySpace Heating . . . . . . . . . . . . . . . . . . . . . . . . 0.43 0.46 0.47 0.49 0.46 0.48 0.50 0.47 0.49 0.52Space Cooling . . . . . . . . . . . . . . . . . . . . . . . . 0.48 0.47 0.48 0.50 0.47 0.49 0.51 0.48 0.51 0.54Water Heating . . . . . . . . . . . . . . . . . . . . . . . . . 0.35 0.36 0.37 0.37 0.36 0.38 0.39 0.37 0.39 0.41Refrigeration . . . . . . . . . . . . . . . . . . . . . . . . . . 0.40 0.32 0.33 0.33 0.30 0.31 0.32 0.29 0.31 0.33Cooking . . . . . . . . . . . . . . . . . . . . . . . . . . . . . 0.12 0.13 0.13 0.14 0.13 0.14 0.14 0.13 0.14 0.15Clothes Dryers . . . . . . . . . . . . . . . . . . . . . . . . 0.18 0.19 0.20 0.20 0.20 0.21 0.22 0.20 0.22 0.23Freezers . . . . . . . . . . . . . . . . . . . . . . . . . . . . . 0.13 0.09 0.09 0.09 0.08 0.08 0.08 0.07 0.08 0.08Lighting . . . . . . . . . . . . . . . . . . . . . . . . . . . . . 0.32 0.33 0.34 0.36 0.34 0.35 0.37 0.34 0.36 0.39Other Uses4 . . . . . . . . . . . . . . . . . . . . . . . . . . 1.15 1.68 1.73 1.79 1.93 2.02 2.11 2.21 2.35 2.49
Delivered Energy . . . . . . . . . . . . . . . . . . . . . 3.56 4.02 4.14 4.27 4.27 4.46 4.66 4.57 4.85 5.13
130 Energy Information Administration/ Annual Energy Outlook 1997

Economic Growth Case Comparisons
Table B4. Residential Sector Key Indicators and Consumption (Continued)(Quadrillion Btu per Year, Unless Otherwise Noted)
Key Indicators and Consumption 1995
Projections
2005 2010 2015
LowEconomic
GrowthReference
HighEconomic
Growth
LowEconomic
GrowthReference
HighEconomic
Growth
LowEconomic
GrowthReference
HighEconomic
Growth
Marketed RenewablesWood5 . . . . . . . . . . . . . . . . . . . . . . . . . . . . . . . . 0.57 0.55 0.56 0.57 0.53 0.55 0.56 0.52 0.54 0.56
Delivered Energy . . . . . . . . . . . . . . . . . . . . . . . 0.57 0.55 0.56 0.57 0.53 0.55 0.56 0.52 0.54 0.56
Other Fuels 6 . . . . . . . . . . . . . . . . . . . . . . . . . . . . 0.13 0.11 0.11 0.11 0.11 0.11 0.11 0.10 0.10 0.11
Delivered Energy Consumption by End-UseSpace Heating . . . . . . . . . . . . . . . . . . . . . . . . . . 5.65 5.82 5.94 6.07 5.80 5.99 6.20 5.80 6.05 6.32Space Cooling . . . . . . . . . . . . . . . . . . . . . . . . . . 0.48 0.48 0.49 0.51 0.49 0.51 0.53 0.50 0.53 0.56Water Heating . . . . . . . . . . . . . . . . . . . . . . . . . . . 1.75 1.84 1.88 1.93 1.87 1.95 2.02 1.92 2.03 2.13Refrigeration . . . . . . . . . . . . . . . . . . . . . . . . . . . . 0.40 0.32 0.33 0.33 0.30 0.31 0.32 0.29 0.31 0.33Cooking . . . . . . . . . . . . . . . . . . . . . . . . . . . . . . . 0.30 0.29 0.30 0.31 0.29 0.30 0.32 0.29 0.31 0.34Clothes Dryers . . . . . . . . . . . . . . . . . . . . . . . . . . 0.23 0.24 0.24 0.25 0.24 0.26 0.27 0.25 0.27 0.28Freezers . . . . . . . . . . . . . . . . . . . . . . . . . . . . . . . 0.13 0.09 0.09 0.09 0.08 0.08 0.08 0.07 0.08 0.08Lighting . . . . . . . . . . . . . . . . . . . . . . . . . . . . . . . 0.32 0.33 0.34 0.36 0.34 0.35 0.37 0.34 0.36 0.39Other Uses7 . . . . . . . . . . . . . . . . . . . . . . . . . . . . 1.24 1.79 1.84 1.90 2.04 2.14 2.23 2.32 2.47 2.62
Delivered Energy . . . . . . . . . . . . . . . . . . . . . . . 10.51 11.18 11.46 11.75 11.44 11.89 12.36 11.79 12.41 13.04
Electricity Related Losses by End-UseSpace Heating . . . . . . . . . . . . . . . . . . . . . . . . . . 0.95 0.95 0.97 1.00 0.94 0.96 1.00 0.90 0.94 0.99Space Cooling . . . . . . . . . . . . . . . . . . . . . . . . . . 1.07 0.97 0.99 1.02 0.96 0.99 1.02 0.93 0.97 1.02Water Heating . . . . . . . . . . . . . . . . . . . . . . . . . . . 0.78 0.74 0.76 0.77 0.74 0.76 0.78 0.72 0.74 0.77Refrigeration . . . . . . . . . . . . . . . . . . . . . . . . . . . . 0.90 0.66 0.67 0.69 0.60 0.62 0.65 0.56 0.59 0.62Cooking . . . . . . . . . . . . . . . . . . . . . . . . . . . . . . . 0.27 0.27 0.27 0.28 0.27 0.28 0.29 0.26 0.27 0.29Clothes Dryers . . . . . . . . . . . . . . . . . . . . . . . . . . 0.40 0.40 0.41 0.42 0.40 0.42 0.43 0.40 0.41 0.44Freezers . . . . . . . . . . . . . . . . . . . . . . . . . . . . . . . 0.29 0.18 0.19 0.19 0.16 0.16 0.17 0.14 0.15 0.16Lighting . . . . . . . . . . . . . . . . . . . . . . . . . . . . . . . 0.70 0.69 0.71 0.73 0.68 0.71 0.74 0.65 0.69 0.73Other Uses7 . . . . . . . . . . . . . . . . . . . . . . . . . . . . 2.55 3.49 3.58 3.67 3.92 4.05 4.20 4.27 4.47 4.72
Total Electricity Related Losses . . . . . . . . . . . 7.92 8.35 8.55 8.76 8.68 8.95 9.26 8.83 9.22 9.74
Total Energy Consumption by End-UseSpace Heating . . . . . . . . . . . . . . . . . . . . . . . . . . 6.61 6.77 6.91 7.06 6.74 6.96 7.20 6.70 6.99 7.31Space Cooling . . . . . . . . . . . . . . . . . . . . . . . . . . 1.56 1.45 1.49 1.53 1.44 1.49 1.56 1.43 1.50 1.58Water Heating . . . . . . . . . . . . . . . . . . . . . . . . . . . 2.53 2.58 2.64 2.70 2.62 2.71 2.80 2.64 2.77 2.90Refrigeration . . . . . . . . . . . . . . . . . . . . . . . . . . . . 1.30 0.97 1.00 1.02 0.90 0.93 0.97 0.85 0.89 0.95Cooking . . . . . . . . . . . . . . . . . . . . . . . . . . . . . . . 0.58 0.55 0.57 0.59 0.55 0.58 0.60 0.55 0.59 0.62Clothes Dryers . . . . . . . . . . . . . . . . . . . . . . . . . . 0.63 0.63 0.65 0.67 0.65 0.67 0.70 0.65 0.68 0.72Freezers . . . . . . . . . . . . . . . . . . . . . . . . . . . . . . . 0.42 0.27 0.28 0.28 0.24 0.24 0.25 0.22 0.23 0.24Lighting . . . . . . . . . . . . . . . . . . . . . . . . . . . . . . . 1.02 1.02 1.05 1.09 1.02 1.06 1.11 0.99 1.05 1.12Other Uses7 . . . . . . . . . . . . . . . . . . . . . . . . . . . . 3.79 5.28 5.43 5.57 5.97 6.19 6.43 6.60 6.94 7.34
Total . . . . . . . . . . . . . . . . . . . . . . . . . . . . . . . . 18.43 19.54 20.02 20.51 20.12 20.83 21.62 20.63 21.63 22.78
Non-Marketed RenewablesGeothermal 8 . . . . . . . . . . . . . . . . . . . . . . . . . . . 0.01 0.04 0.04 0.04 0.05 0.05 0.05 0.07 0.07 0.08Solar9 . . . . . . . . . . . . . . . . . . . . . . . . . . . . . . . . . 0.01 0.01 0.01 0.01 0.01 0.01 0.01 0.01 0.01 0.01
Total . . . . . . . . . . . . . . . . . . . . . . . . . . . . . . . . 0.02 0.05 0.05 0.05 0.06 0.06 0.07 0.08 0.08 0.09
1Includes such appliances as swimming pool and hot tub heaters.2Does not include outdoor grills.3Includes such appliances as swimming pool heaters, outdoor grills, and outdoor lighting (natural gas).4Includes such appliances as microwave ovens, television sets, and dishwashers.5Includes wood used for primary and secondary heating in wood stoves or fireplaces as reported in the Residential Energy Consumption Survey 1993.6Includes kerosene and coal.7Includes such appliances as swimming pool heaters, hot tub heaters, outdoor grills, outdoor lighting (natural gas), microwave ovens, television sets, and dishwashers.8Includes primary energy displaced by geothermal heat pumps in space heating and cooling applications.9Includes primary energy displaced by solar thermal water heaters.Btu = British thermal unit.Note: Totals may not equal sum of components due to independent rounding.Sources: 1995: Energy Information Administration (EIA), Short-Term Energy Outlook, DOE/EIA-0202(96/4Q) (Washington, DC, October 1996). Projections: EIA, AEO97 National
Energy Modeling System runs LMAC97.D100396A, AEO97B.D100296K, and HMAC97.D100296A.
Energy Information Administration/ Annual Energy Outlook 1997 131

Economic Growth Case Comparisons
Table B5. Commercial Sector Key Indicators and Consumption(Quadrillion Btu per Year, Unless Otherwise Noted)
Key Indicators and Consumption 1995
Projections
2005 2010 2015
LowEconomic
GrowthReference
HighEconomic
Growth
LowEconomic
GrowthReference
HighEconomic
Growth
LowEconomic
GrowthReference
HighEconomic
Growth
Key Indicators
Total Floor Space (billion square feet)Surviving . . . . . . . . . . . . . . . . . . . . . . . . . . . . . . 68.9 75.5 76.0 77.8 78.3 79.1 82.1 81.2 82.5 86.7New Additions . . . . . . . . . . . . . . . . . . . . . . . . . . . 1.7 1.5 1.5 1.7 1.5 1.6 1.8 1.7 1.8 2.0
Total . . . . . . . . . . . . . . . . . . . . . . . . . . . . . . . . 70.7 76.9 77.5 79.6 79.8 80.7 83.9 82.8 84.2 88.7
Energy Consumption Intensity(thousand Btu per square foot)
Delivered Energy Consumption . . . . . . . . . . . . . . 101.2 101.5 101.1 100.8 101.3 100.7 100.6 101.6 100.9 100.8Electricity Related Losses . . . . . . . . . . . . . . . . . . 101.6 99.9 99.0 98.3 99.3 97.3 96.4 96.3 93.9 93.9Total Energy Consumption . . . . . . . . . . . . . . . . . . 202.8 201.4 200.1 199.1 200.6 198.0 197.0 197.9 194.8 194.7
Delivered Energy Consumption by Fuel
ElectricitySpace Heating . . . . . . . . . . . . . . . . . . . . . . . . . . 0.11 0.12 0.12 0.12 0.12 0.12 0.13 0.13 0.13 0.14Space Cooling . . . . . . . . . . . . . . . . . . . . . . . . . . 0.58 0.52 0.52 0.53 0.52 0.52 0.55 0.53 0.53 0.57Water Heating . . . . . . . . . . . . . . . . . . . . . . . . . . . 0.17 0.15 0.15 0.15 0.14 0.14 0.14 0.13 0.13 0.13Ventilation . . . . . . . . . . . . . . . . . . . . . . . . . . . . . . 0.17 0.18 0.18 0.19 0.19 0.19 0.20 0.20 0.20 0.21Cooking . . . . . . . . . . . . . . . . . . . . . . . . . . . . . . . 0.03 0.03 0.03 0.03 0.03 0.03 0.03 0.03 0.03 0.03Lighting . . . . . . . . . . . . . . . . . . . . . . . . . . . . . . . 1.21 1.32 1.32 1.34 1.33 1.32 1.35 1.36 1.36 1.40Refrigeration . . . . . . . . . . . . . . . . . . . . . . . . . . . . 0.14 0.15 0.15 0.16 0.16 0.16 0.17 0.17 0.17 0.19Office Equipment (PC) . . . . . . . . . . . . . . . . . . . . . 0.07 0.09 0.09 0.10 0.10 0.10 0.11 0.10 0.10 0.11Office Equipment (non-PC) . . . . . . . . . . . . . . . . . 0.18 0.22 0.22 0.23 0.24 0.25 0.26 0.27 0.27 0.29Other Uses1 . . . . . . . . . . . . . . . . . . . . . . . . . . . . 0.56 0.91 0.92 0.95 1.07 1.08 1.14 1.21 1.24 1.33
Delivered Energy . . . . . . . . . . . . . . . . . . . . . . . 3.23 3.70 3.71 3.81 3.90 3.91 4.07 4.13 4.16 4.39
Natural Gas 2
Space Heating . . . . . . . . . . . . . . . . . . . . . . . . . . 1.30 1.34 1.34 1.37 1.35 1.36 1.40 1.37 1.38 1.43Space Cooling . . . . . . . . . . . . . . . . . . . . . . . . . . 0.03 0.03 0.03 0.03 0.03 0.03 0.03 0.03 0.03 0.04Water Heating . . . . . . . . . . . . . . . . . . . . . . . . . . . 0.48 0.50 0.50 0.51 0.52 0.52 0.54 0.54 0.55 0.58Cooking . . . . . . . . . . . . . . . . . . . . . . . . . . . . . . . 0.18 0.21 0.21 0.22 0.23 0.23 0.24 0.25 0.25 0.26Other Uses3 . . . . . . . . . . . . . . . . . . . . . . . . . . . . 1.17 1.35 1.36 1.39 1.39 1.40 1.45 1.43 1.45 1.52
Delivered Energy . . . . . . . . . . . . . . . . . . . . . . . 3.16 3.43 3.44 3.52 3.51 3.54 3.67 3.61 3.65 3.83
DistillateSpace Heating . . . . . . . . . . . . . . . . . . . . . . . . . . 0.20 0.17 0.17 0.17 0.16 0.16 0.16 0.15 0.15 0.16Water Heating . . . . . . . . . . . . . . . . . . . . . . . . . . . 0.06 0.05 0.05 0.05 0.05 0.05 0.05 0.04 0.04 0.05Other Uses4 . . . . . . . . . . . . . . . . . . . . . . . . . . . . 0.15 0.14 0.14 0.14 0.14 0.14 0.14 0.14 0.14 0.15
Delivered Energy . . . . . . . . . . . . . . . . . . . . . . . 0.41 0.36 0.36 0.36 0.35 0.35 0.36 0.34 0.34 0.35
Other Fuels 5 . . . . . . . . . . . . . . . . . . . . . . . . . . . . 0.35 0.32 0.32 0.33 0.33 0.33 0.35 0.34 0.34 0.36
Marketed Renewable FuelsBiomass . . . . . . . . . . . . . . . . . . . . . . . . . . . . . . . 0.00 0.00 0.00 0.00 0.00 0.00 0.00 0.00 0.00 0.00
Delivered Energy . . . . . . . . . . . . . . . . . . . . . . . 0.00 0.00 0.00 0.00 0.00 0.00 0.00 0.00 0.00 0.00
Delivered Energy Consumption by End-UseSpace Heating . . . . . . . . . . . . . . . . . . . . . . . . . . 1.61 1.63 1.63 1.66 1.63 1.64 1.69 1.65 1.66 1.72Space Cooling . . . . . . . . . . . . . . . . . . . . . . . . . . 0.61 0.55 0.55 0.57 0.55 0.55 0.58 0.56 0.56 0.60Water Heating . . . . . . . . . . . . . . . . . . . . . . . . . . . 0.70 0.69 0.70 0.71 0.70 0.70 0.73 0.71 0.72 0.76Ventilation . . . . . . . . . . . . . . . . . . . . . . . . . . . . . . 0.17 0.18 0.18 0.19 0.19 0.19 0.20 0.20 0.20 0.21Cooking . . . . . . . . . . . . . . . . . . . . . . . . . . . . . . . 0.22 0.24 0.24 0.25 0.25 0.26 0.27 0.27 0.27 0.29Lighting . . . . . . . . . . . . . . . . . . . . . . . . . . . . . . . 1.21 1.32 1.32 1.34 1.33 1.32 1.35 1.36 1.36 1.40Refrigeration . . . . . . . . . . . . . . . . . . . . . . . . . . . . 0.14 0.15 0.15 0.16 0.16 0.16 0.17 0.17 0.17 0.19Office Equipment (PC) . . . . . . . . . . . . . . . . . . . . . 0.07 0.09 0.09 0.10 0.10 0.10 0.11 0.10 0.10 0.11Office Equipment (non-PC) . . . . . . . . . . . . . . . . . 0.18 0.22 0.22 0.23 0.24 0.25 0.26 0.27 0.27 0.29Other Uses6 . . . . . . . . . . . . . . . . . . . . . . . . . . . . 2.24 2.73 2.75 2.82 2.92 2.96 3.09 3.12 3.18 3.36
Delivered Energy . . . . . . . . . . . . . . . . . . . . . . . 7.15 7.81 7.84 8.02 8.08 8.13 8.44 8.41 8.50 8.94
132 Energy Information Administration/ Annual Energy Outlook 1997

Economic Growth Case Comparisons
Table B5. Commercial Sector Key Indicators and Consumption (Continued)(Quadrillion Btu per Year, Unless Otherwise Noted)
Key Indicators and Consumption 1995
Projections
2005 2010 2015
LowEconomic
GrowthReference
HighEconomic
Growth
LowEconomic
GrowthReference
HighEconomic
Growth
LowEconomic
GrowthReference
HighEconomic
Growth
Electricity Related Losses by End-UseSpace Heating . . . . . . . . . . . . . . . . . . . . . . . . . . 0.25 0.25 0.25 0.25 0.25 0.25 0.26 0.25 0.25 0.26Space Cooling . . . . . . . . . . . . . . . . . . . . . . . . . . 1.29 1.08 1.07 1.10 1.06 1.05 1.09 1.02 1.01 1.08Water Heating . . . . . . . . . . . . . . . . . . . . . . . . . . . 0.38 0.31 0.31 0.32 0.28 0.28 0.28 0.25 0.24 0.25Ventilation . . . . . . . . . . . . . . . . . . . . . . . . . . . . . . 0.38 0.38 0.37 0.38 0.38 0.38 0.39 0.38 0.37 0.40Cooking . . . . . . . . . . . . . . . . . . . . . . . . . . . . . . . 0.07 0.06 0.06 0.06 0.06 0.06 0.06 0.05 0.05 0.05Lighting . . . . . . . . . . . . . . . . . . . . . . . . . . . . . . . 2.68 2.74 2.72 2.75 2.70 2.65 2.68 2.64 2.58 2.65Refrigeration . . . . . . . . . . . . . . . . . . . . . . . . . . . . 0.31 0.32 0.32 0.33 0.33 0.33 0.34 0.33 0.33 0.35Office Equipment (PC) . . . . . . . . . . . . . . . . . . . . . 0.16 0.19 0.19 0.20 0.20 0.20 0.21 0.20 0.20 0.21Office Equipment (non-PC) . . . . . . . . . . . . . . . . . 0.40 0.46 0.46 0.47 0.49 0.49 0.52 0.52 0.52 0.56Other Uses6 . . . . . . . . . . . . . . . . . . . . . . . . . . . . 1.25 1.90 1.91 1.96 2.17 2.17 2.27 2.34 2.35 2.52
Total Electricity Related Losses . . . . . . . . . . . 7.18 7.69 7.67 7.82 7.92 7.85 8.09 7.98 7.91 8.33
Total Energy Consumption by End-UseSpace Heating . . . . . . . . . . . . . . . . . . . . . . . . . . 1.87 1.88 1.88 1.92 1.89 1.89 1.95 1.90 1.91 1.99Space Cooling . . . . . . . . . . . . . . . . . . . . . . . . . . 1.89 1.62 1.62 1.66 1.61 1.60 1.67 1.58 1.58 1.68Water Heating . . . . . . . . . . . . . . . . . . . . . . . . . . . 1.09 1.01 1.01 1.03 0.98 0.98 1.02 0.96 0.96 1.01Ventilation . . . . . . . . . . . . . . . . . . . . . . . . . . . . . . 0.55 0.56 0.55 0.57 0.57 0.56 0.59 0.57 0.57 0.61Cooking . . . . . . . . . . . . . . . . . . . . . . . . . . . . . . . 0.29 0.30 0.30 0.31 0.31 0.31 0.32 0.32 0.32 0.34Lighting . . . . . . . . . . . . . . . . . . . . . . . . . . . . . . . 3.89 4.06 4.04 4.09 4.03 3.97 4.04 4.00 3.94 4.05Refrigeration . . . . . . . . . . . . . . . . . . . . . . . . . . . . 0.46 0.47 0.47 0.49 0.49 0.49 0.51 0.50 0.50 0.54Office Equipment (PC) . . . . . . . . . . . . . . . . . . . . . 0.23 0.29 0.29 0.30 0.30 0.30 0.31 0.30 0.30 0.33Office Equipment (non-PC) . . . . . . . . . . . . . . . . . 0.59 0.68 0.68 0.70 0.74 0.74 0.78 0.79 0.79 0.85Other Uses6 . . . . . . . . . . . . . . . . . . . . . . . . . . . . 3.49 4.63 4.66 4.77 5.10 5.14 5.35 5.46 5.53 5.88
Total . . . . . . . . . . . . . . . . . . . . . . . . . . . . . . . . 14.33 15.50 15.51 15.84 16.00 15.98 16.53 16.39 16.40 17.27
Non-Marketed Renewable FuelsSolar7 . . . . . . . . . . . . . . . . . . . . . . . . . . . . . . . . . 0.01 0.03 0.03 0.03 0.03 0.03 0.03 0.04 0.04 0.04
Total . . . . . . . . . . . . . . . . . . . . . . . . . . . . . . . . 0.01 0.03 0.03 0.03 0.03 0.03 0.03 0.04 0.04 0.04
1Includes miscellaneous uses, such as service station equipment, district services, automated teller machines, telecommunications equipment, and medical equipment.2Excludes estimated consumption from independent power producers.3Includes miscellaneous uses, such as district services, pumps, lighting, emergency electric generators, and manufacturing performed in commercial buildings.4Includes miscellaneous uses, such as cooking, district services, and emergency electric generators.5Includes residual fuel oil, liquefied petroleum gas, coal, motor gasoline, and kerosene.6Includes miscellaneous uses, such as service station equipment, district services, automated teller machines, telecommunications equipment, medical equipment, pumps, lighting,
emergency electric generators, manufacturing performed in commercial buildings, and cooking (distillate), plus residual fuel oil, liquefied petroleum gas, coal, motor gasoline, andkerosene.
7Includes primary energy displaced by solar thermal water heaters.Btu = British thermal unit.PC = Personal computer.Note: Totals may not equal sum of components due to independent rounding.Sources: 1995: Energy Information Administration (EIA), Short-Term Energy Outlook, DOE/EIA-0202(96/4Q) (Washington, DC, October 1996). Projections: EIA, AEO97 National
Energy Modeling System runs LMAC97.D100396A, AEO97B.D100296K, and HMAC97.D100296A.
Energy Information Administration/ Annual Energy Outlook 1997 133

Economic Growth Case Comparisons
Table B6. Industrial Sector Key Indicators and Consumption(Quadrillion Btu per Year, Unless Otherwise Noted)
Key Indicators and Consumption 1995
Projections
2005 2010 2015
LowEconomic
GrowthReference
HighEconomic
Growth
LowEconomic
GrowthReference
HighEconomic
Growth
LowEconomic
GrowthReference
HighEconomic
Growth
Key Indicators
Value of Gross Output (billion 1987 dollars)Manufacturing . . . . . . . . . . . . . . . . . . . . . . . . . . . 2907 3519 3709 3902 3806 4117 4437 3986 4441 4905Nonmanufacturing . . . . . . . . . . . . . . . . . . . . . . . . 765 864 917 972 901 978 1056 925 1028 1135
Total . . . . . . . . . . . . . . . . . . . . . . . . . . . . . . . . 3672 4383 4626 4874 4707 5095 5494 4911 5469 6039
Energy Prices (1995 dollars per million Btu)Electricity . . . . . . . . . . . . . . . . . . . . . . . . . . . . . . 14.54 12.93 13.46 13.82 12.53 13.13 13.52 11.75 12.56 13.20Natural Gas . . . . . . . . . . . . . . . . . . . . . . . . . . . . 2.28 2.37 2.54 2.77 2.39 2.61 2.85 2.41 2.74 3.11Steam Coal . . . . . . . . . . . . . . . . . . . . . . . . . . . . . 1.48 1.41 1.44 1.47 1.34 1.37 1.39 1.25 1.30 1.33Residual Oil . . . . . . . . . . . . . . . . . . . . . . . . . . . . 2.55 2.80 2.92 3.05 2.85 3.03 3.19 2.82 3.01 3.27Distillate Oil . . . . . . . . . . . . . . . . . . . . . . . . . . . . 4.61 5.04 5.21 5.40 5.14 5.38 5.58 5.02 5.29 5.66Liquefied Petroleum Gas . . . . . . . . . . . . . . . . . . . 6.53 5.75 6.00 6.29 5.94 6.28 6.33 5.51 5.95 6.33Motor Gasoline . . . . . . . . . . . . . . . . . . . . . . . . . . 9.18 8.44 8.63 8.89 8.50 8.85 9.11 8.28 8.65 9.06Metallurgical Coal . . . . . . . . . . . . . . . . . . . . . . . . 1.75 1.69 1.72 1.75 1.54 1.58 1.60 1.43 1.48 1.52
Energy Consumption
Consumption 1 (quadrillion Btu per year)Purchased Electricity . . . . . . . . . . . . . . . . . . . . . . 3.46 3.93 4.16 4.44 4.03 4.40 4.81 4.09 4.62 5.21Natural Gas2 . . . . . . . . . . . . . . . . . . . . . . . . . . . . 9.74 10.74 11.04 11.34 10.92 11.42 11.99 10.97 11.63 12.33Steam Coal . . . . . . . . . . . . . . . . . . . . . . . . . . . . . 1.59 1.70 1.82 1.99 1.70 1.89 2.12 1.68 1.97 2.30Metallurgical Coal and Coke3 . . . . . . . . . . . . . . . . 0.91 0.76 0.80 0.83 0.70 0.75 0.79 0.64 0.70 0.75Residual Fuel . . . . . . . . . . . . . . . . . . . . . . . . . . . 0.34 0.30 0.31 0.33 0.32 0.33 0.33 0.31 0.35 0.35Distillate . . . . . . . . . . . . . . . . . . . . . . . . . . . . . . . 1.15 1.32 1.39 1.46 1.37 1.47 1.58 1.41 1.55 1.69Liquefied Petroleum Gas . . . . . . . . . . . . . . . . . . . 2.01 2.11 2.20 2.29 2.14 2.28 2.43 2.16 2.35 2.55Petrochemical Feedstocks . . . . . . . . . . . . . . . . . . 1.16 1.25 1.30 1.35 1.27 1.35 1.43 1.29 1.40 1.51Other Petroleum4 . . . . . . . . . . . . . . . . . . . . . . . . 4.03 4.36 4.57 4.70 4.44 4.69 4.90 4.47 4.75 4.99Renewables5 . . . . . . . . . . . . . . . . . . . . . . . . . . . . 1.74 2.02 2.12 2.21 2.12 2.28 2.43 2.17 2.40 2.62
Delivered Energy . . . . . . . . . . . . . . . . . . . . . . . 26.12 28.49 29.70 30.93 29.01 30.87 32.81 29.17 31.73 34.30Electricity Related Losses . . . . . . . . . . . . . . . . . . 7.69 8.17 8.59 9.11 8.20 8.82 9.56 7.90 8.79 9.89
Total . . . . . . . . . . . . . . . . . . . . . . . . . . . . . . . . 33.81 36.66 38.28 40.04 37.20 39.69 42.37 37.07 40.51 44.19
Consumption per Unit of Output 1
(thousand Btu per 1987 dollar)Purchased Electricity . . . . . . . . . . . . . . . . . . . . . . 0.94 0.90 0.90 0.91 0.86 0.86 0.88 0.83 0.84 0.86Natural Gas2 . . . . . . . . . . . . . . . . . . . . . . . . . . . . 2.65 2.45 2.39 2.33 2.32 2.24 2.18 2.23 2.13 2.04Steam Coal . . . . . . . . . . . . . . . . . . . . . . . . . . . . . 0.43 0.39 0.39 0.41 0.36 0.37 0.39 0.34 0.36 0.38Metallurgical Coal and Coke3 . . . . . . . . . . . . . . . . 0.25 0.17 0.17 0.17 0.15 0.15 0.14 0.13 0.13 0.12Residual Fuel . . . . . . . . . . . . . . . . . . . . . . . . . . . 0.09 0.07 0.07 0.07 0.07 0.06 0.06 0.06 0.06 0.06Distillate . . . . . . . . . . . . . . . . . . . . . . . . . . . . . . . 0.31 0.30 0.30 0.30 0.29 0.29 0.29 0.29 0.28 0.28Liquefied Petroleum Gas . . . . . . . . . . . . . . . . . . . 0.55 0.48 0.48 0.47 0.46 0.45 0.44 0.44 0.43 0.42Petrochemical Feedstocks . . . . . . . . . . . . . . . . . . 0.32 0.28 0.28 0.28 0.27 0.27 0.26 0.26 0.26 0.25Other Petroleum4 . . . . . . . . . . . . . . . . . . . . . . . . 1.10 0.99 0.99 0.96 0.94 0.92 0.89 0.91 0.87 0.83Renewables5 . . . . . . . . . . . . . . . . . . . . . . . . . . . . 0.47 0.46 0.46 0.45 0.45 0.45 0.44 0.44 0.44 0.43
Delivered Energy . . . . . . . . . . . . . . . . . . . . . . . 7.11 6.50 6.42 6.35 6.16 6.06 5.97 5.94 5.80 5.68Electricity Related Losses . . . . . . . . . . . . . . . . . . 2.09 1.86 1.86 1.87 1.74 1.73 1.74 1.61 1.61 1.64
Total . . . . . . . . . . . . . . . . . . . . . . . . . . . . . . . . 9.21 8.36 8.28 8.22 7.90 7.79 7.71 7.55 7.41 7.32
1Fuel consumption includes consumption for cogeneration.2Includes lease and plant fuel.3Includes net coke coal imports.4Includes petroleum coke, asphalt, road oil, lubricants, motor gasoline, still gas, and miscellaneous petroleum products.5Includes consumption of energy from hydroelectric, wood and wood waste, municipal solid waste, and other biomass.Btu = British thermal unit.Note: Totals may not equal sum of components due to independent rounding.Sources: 1995 prices for gasoline and distillate are based on prices in various issues of Energy Information Administration (EIA), Petroleum Marketing Monthly, DOE/EIA-
0380(95/3-96/4) (Washington, DC, 1995 - 1996). 1995 coal prices: EIA, Monthly Energy Review, DOE/EIA-0035(96/08) (Washington, DC, August 1996). 1995 electricity prices: EIA,AEO97 National Energy Modeling System runs LMAC97.D100396A, AEO97B.D100296K, and HMAC97.D100296A. 1995 prices derived from EIA, State Energy Data Report 1993,DOE/EIA-0214(93) (Washington, DC, July 1995). Other 1995 values: EIA, Short-Term Energy Outlook, DOE/EIA-0202(96/4Q) (Washington, DC, October 1996). Projections: EIA,AEO97 National Energy Modeling System runs LMAC97.D100396A, AEO97B.D100296K, and HMAC97.D100296A.
134 Energy Information Administration/ Annual Energy Outlook 1997

Economic Growth Case Comparisons
Table B7. Transportation Sector Key Indicators and Delivered Energy Consumption
Key Indicators and Consumption 1995
Projections
2005 2010 2015
LowEconomic
GrowthReference
HighEconomic
Growth
LowEconomic
GrowthReference
HighEconomic
Growth
LowEconomic
GrowthReference
HighEconomic
Growth
Key IndicatorsLevel of Travel (billions)
Light-Duty Vehicles (vehicle miles traveled) . . . . . . 2209 2510 2574 2634 2663 2767 2867 2769 2924 3069Freight Trucks (vehicle miles traveled) . . . . . . . . . 166 208 219 230 220 237 254 226 250 274Air (seat miles available) . . . . . . . . . . . . . . . . . . . 927 1419 1493 1568 1590 1729 1865 1706 1923 2134Rail (ton miles traveled) . . . . . . . . . . . . . . . . . . . . 1181 1313 1368 1431 1370 1459 1560 1410 1535 1672Marine (ton miles traveled) . . . . . . . . . . . . . . . . . . 871 951 989 1035 986 1047 1120 1015 1099 1196
Energy Efficiency IndicatorsNew Car (miles per gallon)1 . . . . . . . . . . . . . . . . . . 27.5 29.7 29.8 29.9 31.4 31.5 31.6 32.6 32.6 32.5New Light Truck (miles per gallon)1 . . . . . . . . . . . . 20.5 21.5 21.6 21.6 22.9 22.9 22.9 24.2 24.2 24.2Light-Duty Fleet (miles per gallon)2 . . . . . . . . . . . . . 19.7 19.8 19.8 19.8 20.3 20.4 20.4 21.3 21.3 21.3Aircraft Efficiency (seat miles per gallon) . . . . . . . . . 50.8 55.6 55.8 56.0 57.9 58.2 58.5 60.2 60.6 61.0Freight Truck Efficiency (miles per gallon) . . . . . . . . 5.5 5.8 5.9 5.9 5.9 6.0 6.0 6.0 6.1 6.1Rail Efficiency (ton miles per thousand Btu) . . . . . . 2.6 2.9 2.9 2.9 3.0 3.0 3.0 3.2 3.2 3.2Domestic Shipping Efficiency(ton miles per thousand Btu) . . . . . . . . . . . . . . . . . 2.7 2.9 2.9 2.9 2.9 2.9 2.9 3.0 3.0 3.0
Energy Use by Mode (quadrillion Btu per year)Light-Duty Vehicles . . . . . . . . . . . . . . . . . . . . . . . . 14.20 16.13 16.52 16.90 16.64 17.26 17.87 16.53 17.43 18.28Freight Trucks . . . . . . . . . . . . . . . . . . . . . . . . . . . . 5.43 6.23 6.47 6.70 6.45 6.80 7.16 6.58 7.07 7.56Air . . . . . . . . . . . . . . . . . . . . . . . . . . . . . . . . . . . . 3.18 4.11 4.30 4.48 4.38 4.71 5.04 4.50 5.00 5.48Rail . . . . . . . . . . . . . . . . . . . . . . . . . . . . . . . . . . . . 0.48 0.48 0.50 0.52 0.48 0.51 0.54 0.47 0.51 0.55Marine . . . . . . . . . . . . . . . . . . . . . . . . . . . . . . . . . 1.63 2.03 2.09 2.16 2.19 2.30 2.41 2.31 2.46 2.62Pipeline Fuel . . . . . . . . . . . . . . . . . . . . . . . . . . . . . 0.72 0.82 0.84 0.86 0.84 0.88 0.94 0.88 0.93 1.00Other3 . . . . . . . . . . . . . . . . . . . . . . . . . . . . . . . . . . 0.21 0.26 0.27 0.28 0.27 0.29 0.31 0.26 0.30 0.33
Total . . . . . . . . . . . . . . . . . . . . . . . . . . . . . . . . . 24.31 28.47 29.38 30.28 29.61 31.11 32.60 29.84 31.99 34.09
1Environmental Protection Agency rated miles per gallon.2Combined car and light truck “on-the-road” estimate.3Includes lubricants and aviation gasoline.Btu = British thermal unit.Note: Totals may not equal sum of components due to independent rounding.Sources: 1995: Federal Aviation Administration (FAA), FAA Aviation Forecasts Fiscal Years 1993-2004, (Washington, DC, February 1994); Energy Information Administration
(EIA), Short-Term Energy Outlook, DOE/EIA-0202(96/4Q) (Washington, DC, October 1996); EIA, Fuel Oil and Kerosene Sales 1995, DOE/EIA-0535(95) (Washington, DC, September1996); and United States Department of Defense, Defense Fuel Supply Center. Projections: EIA, AEO97 National Energy Modeling System runs LMAC97.D100396A,AEO97B.D100296K, and HMAC97.D100296A.
Energy Information Administration/ Annual Energy Outlook 1997 135

Economic Growth Case Comparisons
Table B8. Electricity Supply, Disposition, and Prices(Billion Kilowatthours, Unless Otherwise Noted)
Supply, Disposition, and Prices 1995
Projections
2005 2010 2015
LowEconomic
GrowthReference
HighEconomic
Growth
LowEconomic
GrowthReference
HighEconomic
Growth
LowEconomic
GrowthReference
HighEconomic
Growth
Generation by Fuel TypeElectric Generators 1
Coal . . . . . . . . . . . . . . . . . . . . . . . . . . . . . . . . . . 1671 1801 1854 1946 1881 1942 2058 1948 2052 2287Petroleum . . . . . . . . . . . . . . . . . . . . . . . . . . . . . . 64 55 58 63 56 58 60 59 64 73Natural Gas . . . . . . . . . . . . . . . . . . . . . . . . . . . . 322 652 705 766 775 892 1008 1042 1184 1267Nuclear Power . . . . . . . . . . . . . . . . . . . . . . . . . . 673 654 654 654 614 614 614 448 448 448Pumped Storage . . . . . . . . . . . . . . . . . . . . . . . . . -2 -3 -3 -3 -3 -3 -3 -3 -3 -3Renewable Sources2 . . . . . . . . . . . . . . . . . . . . . . 354 359 361 363 367 371 378 380 394 410
Total . . . . . . . . . . . . . . . . . . . . . . . . . . . . . . . . 3083 3518 3629 3789 3690 3874 4114 3874 4139 4482Non-Utility Generation for Own Use . . . . . . . . . . . 22 22 22 22 22 22 22 22 22 22
Cogenerators 3
Coal . . . . . . . . . . . . . . . . . . . . . . . . . . . . . . . . . . 43 47 48 49 48 50 51 49 51 53Petroleum . . . . . . . . . . . . . . . . . . . . . . . . . . . . . . 5 5 5 6 5 6 6 5 6 6Natural Gas . . . . . . . . . . . . . . . . . . . . . . . . . . . . 180 202 205 208 208 214 220 212 221 230Other Gaseous Fuels4 . . . . . . . . . . . . . . . . . . . . . 7 8 8 8 8 8 8 8 8 8Renewable Sources2 . . . . . . . . . . . . . . . . . . . . . . 42 48 49 51 49 53 56 50 55 60Other5 . . . . . . . . . . . . . . . . . . . . . . . . . . . . . . . . 3 3 4 4 3 4 4 3 4 4
Total . . . . . . . . . . . . . . . . . . . . . . . . . . . . . . . . 279 313 319 324 322 333 345 327 344 361Sales to Utilities . . . . . . . . . . . . . . . . . . . . . . . . . 148 157 158 160 158 161 164 159 163 168Generation for Own Use . . . . . . . . . . . . . . . . . . . 132 156 161 165 164 172 181 168 181 194
Net Imports . . . . . . . . . . . . . . . . . . . . . . . . . . . . . 38 35 35 35 31 31 31 27 27 27
Electricity Sales by SectorResidential . . . . . . . . . . . . . . . . . . . . . . . . . . . . . . 1043 1179 1214 1250 1251 1307 1366 1339 1421 1504Commercial . . . . . . . . . . . . . . . . . . . . . . . . . . . . . . 946 1085 1089 1116 1142 1147 1193 1209 1219 1287Industrial . . . . . . . . . . . . . . . . . . . . . . . . . . . . . . . . 1013 1153 1218 1301 1181 1289 1409 1198 1354 1527Transportation . . . . . . . . . . . . . . . . . . . . . . . . . . . . 6 23 24 25 39 41 42 47 50 53
Total . . . . . . . . . . . . . . . . . . . . . . . . . . . . . . . . . 3008 3440 3545 3693 3611 3784 4011 3793 4044 4371
End-Use Prices (1995 cents per kilowatthour) 6
Residential . . . . . . . . . . . . . . . . . . . . . . . . . . . . . . 8.4 7.7 8.0 8.1 7.5 7.8 8.0 7.2 7.6 7.8Commercial . . . . . . . . . . . . . . . . . . . . . . . . . . . . . . 7.9 7.0 7.3 7.5 6.8 7.2 7.4 6.5 6.9 7.2Industrial . . . . . . . . . . . . . . . . . . . . . . . . . . . . . . . . 5.0 4.4 4.6 4.7 4.3 4.5 4.6 4.0 4.3 4.5Transportation . . . . . . . . . . . . . . . . . . . . . . . . . . . . 5.2 4.8 4.9 5.0 4.7 4.9 4.9 4.6 4.7 4.8
All Sectors Average . . . . . . . . . . . . . . . . . . . . . . 7.1 6.4 6.6 6.7 6.2 6.4 6.6 6.0 6.3 6.5
Price Components (1995 cents per kilowatthour)Capital Component . . . . . . . . . . . . . . . . . . . . . . . . 2.6 2.4 2.5 2.5 2.2 2.3 2.4 2.1 2.2 2.3Fuel Component . . . . . . . . . . . . . . . . . . . . . . . . . . 1.1 1.0 1.1 1.1 1.0 1.0 1.0 0.9 0.9 0.9Operation and Maintenance Component . . . . . . . . . 3.0 2.5 2.5 2.5 2.5 2.5 2.5 2.3 2.3 2.3Wholesale Power Cost . . . . . . . . . . . . . . . . . . . . . . 0.4 0.5 0.6 0.7 0.5 0.7 0.8 0.6 0.8 0.9
Total . . . . . . . . . . . . . . . . . . . . . . . . . . . . . . . . . 7.1 6.4 6.6 6.7 6.2 6.4 6.6 6.0 6.3 6.5
1Includes grid-connected generation at all utilities and nonutilities except for cogenerators. Includes small power producers, exempt wholesale generators, and generators atindustrial and commercial facilities which provide electricity for on-site use and for sales to utilities.
2Includes conventional hydroelectric, geothermal, wood, wood waste, municipal solid waste, other biomass, solar, and wind power.3Includes cogeneration at facilities whose primary function is not electricity production. Includes sales to utilities and generation for own use.4Other gaseous fuels include refinery and still gas.5Other includes hydrogen, sulfur, batteries, chemicals, fish oil, and spent sulfite liquor.6Prices represent average revenue per kilowatthour.Note: Totals may not equal sum of components due to independent rounding.Sources: 1995 commercial and transportation sales derived from: Total transportation plus commercial sales come from Energy Information Administration (EIA), State Energy
Data Report 1993, DOE/EIA-0214(93) (Washington, DC, July 1995), but individual sectors do not match because sales taken from commercial and placed in transportation, accordingto Oak Ridge National Laboratories, Transportation Energy Data Book 15 (May 1995) which indicates the transportation value should be higher. 1995 generation by electric utilities,nonutilities, and cogenerators, net electricity imports, residential sales, and industrial sales: EIA, Annual Energy Review 1995, DOE/EIA-0384(95) (Washington, DC, July 1996). 1995residential electricity prices derived from EIA, Short Term Energy Outlook, DOE/EIA-0202(96/4Q) (Washington, DC, October 1996). 1995 electricity prices for commercial,industrial, and transportation; price components; and projections: EIA, AEO97 National Energy Modeling System runs LMAC97.D100396A, AEO97B.D100296K, andHMAC97.D100296A.
136 Energy Information Administration/ Annual Energy Outlook 1997

Economic Growth Case Comparisons
Table B9. Electricity Generating Capability(Thousand Megawatts)
Net Summer Capability 1 1995
Projections
2005 2010 2015
LowEconomic
GrowthReference
HighEconomic
Growth
LowEconomic
GrowthReference
HighEconomic
Growth
LowEconomic
GrowthReference
HighEconomic
Growth
Electric Generators 2
CapabilityCoal Steam . . . . . . . . . . . . . . . . . . . . . . . . . . . . . 304.9 294.5 298.2 306.8 298.4 304.0 317.5 303.8 315.4 349.2Other Fossil Steam3 . . . . . . . . . . . . . . . . . . . . . . 139.6 102.6 102.6 102.6 99.9 99.9 99.9 96.1 96.1 96.1Combined Cycle . . . . . . . . . . . . . . . . . . . . . . . . . 14.7 66.0 73.5 88.8 87.2 107.5 126.0 125.0 153.0 166.4Combustion Turbine/Diesel . . . . . . . . . . . . . . . . . 56.0 126.3 134.5 151.0 143.0 153.1 164.8 157.2 168.3 183.6Nuclear Power . . . . . . . . . . . . . . . . . . . . . . . . . . 99.2 94.7 94.7 94.7 88.9 88.9 88.9 62.7 62.7 62.7Pumped Storage . . . . . . . . . . . . . . . . . . . . . . . . . 19.9 19.9 19.9 19.9 19.9 19.9 19.9 19.9 19.9 19.9Fuel Cells . . . . . . . . . . . . . . . . . . . . . . . . . . . . . . 0.0 0.6 2.0 2.2 2.1 2.1 2.8 2.2 2.1 2.9Renewable Sources4 . . . . . . . . . . . . . . . . . . . . . . 88.0 91.5 92.2 92.5 93.5 94.1 95.2 96.5 98.3 101.2
Total . . . . . . . . . . . . . . . . . . . . . . . . . . . . . . . . 722.2 796.1 817.5 858.4 832.9 869.4 914.9 863.4 915.8 982.0
Cumulative Planned Additions 5
Coal Steam . . . . . . . . . . . . . . . . . . . . . . . . . . . . . 1.4 3.7 3.7 3.7 5.3 5.3 5.3 5.3 5.3 5.3Other Fossil Steam3 . . . . . . . . . . . . . . . . . . . . . . 0.0 0.0 0.0 0.0 0.0 0.0 0.0 0.0 0.0 0.0Combined Cycle . . . . . . . . . . . . . . . . . . . . . . . . . 1.4 2.0 2.0 2.0 2.0 2.0 2.0 2.0 2.0 2.0Combustion Turbine/Diesel . . . . . . . . . . . . . . . . . 3.2 4.5 4.5 4.5 4.5 4.5 4.5 4.5 4.5 4.5Nuclear Power . . . . . . . . . . . . . . . . . . . . . . . . . . 0.0 1.2 1.2 1.2 1.2 1.2 1.2 1.2 1.2 1.2Pumped Storage . . . . . . . . . . . . . . . . . . . . . . . . . 1.1 1.1 1.1 1.1 1.1 1.1 1.1 1.1 1.1 1.1Fuel Cells . . . . . . . . . . . . . . . . . . . . . . . . . . . . . . 0.0 0.0 0.0 0.0 0.0 0.0 0.0 0.0 0.0 0.0Renewable Sources4 . . . . . . . . . . . . . . . . . . . . . . 0.7 2.9 2.9 2.9 2.9 2.9 2.9 2.9 2.9 2.9
Total . . . . . . . . . . . . . . . . . . . . . . . . . . . . . . . . 8.0 15.5 15.5 15.5 17.1 17.1 17.1 17.1 17.1 17.1
Cumulative Unplanned Additions 5
Coal Steam . . . . . . . . . . . . . . . . . . . . . . . . . . . . . 0.0 5.8 9.5 18.1 10.7 16.4 29.8 20.0 31.6 65.4Other Fossil Steam3 . . . . . . . . . . . . . . . . . . . . . . 0.0 0.0 0.0 0.0 0.0 0.0 0.0 0.0 0.0 0.0Combined Cycle . . . . . . . . . . . . . . . . . . . . . . . . . 0.0 50.5 58.0 73.3 71.7 91.9 110.5 109.5 137.5 150.9Combustion Turbine/Diesel . . . . . . . . . . . . . . . . . 0.1 70.0 78.2 94.7 87.1 97.1 108.8 102.3 113.5 128.7Nuclear Power . . . . . . . . . . . . . . . . . . . . . . . . . . 0.0 0.0 0.0 0.0 0.0 0.0 0.0 0.0 0.0 0.0Pumped Storage . . . . . . . . . . . . . . . . . . . . . . . . . 0.0 0.0 0.0 0.0 0.0 0.0 0.0 0.0 0.0 0.0Fuel Cells . . . . . . . . . . . . . . . . . . . . . . . . . . . . . . 0.0 0.6 2.0 2.2 2.1 2.1 2.8 2.2 2.1 2.9Renewable Sources3 . . . . . . . . . . . . . . . . . . . . . . 0.0 1.1 1.8 2.1 3.3 3.9 5.0 6.6 8.4 11.3
Total . . . . . . . . . . . . . . . . . . . . . . . . . . . . . . . . 0.1 128.0 149.5 190.3 174.9 211.4 256.9 240.6 293.1 359.2
Cumulative Total Additions . . . . . . . . . . . . . . . . . 8.2 143.5 165.0 205.9 192.0 228.5 274.0 257.7 310.2 376.3
Cumulative Retirements 6 . . . . . . . . . . . . . . . . . . . 11.9 72.1 72.1 72.1 83.9 83.9 83.9 119.1 119.1 119.1
Energy Information Administration/ Annual Energy Outlook 1997 137

Economic Growth Case Comparisons
Table B9. Electricity Generating Capability (Continued)(Thousand Megawatts)
Net Summer Capability 1 1995
Projections
2005 2010 2015
LowEconomic
GrowthReference
HighEconomic
Growth
LowEconomic
GrowthReference
HighEconomic
Growth
LowEconomic
GrowthReference
HighEconomic
Growth
Cogenerators 7
CapacityCoal . . . . . . . . . . . . . . . . . . . . . . . . . . . . . . . . . . 8.2 8.8 9.0 9.1 9.0 9.3 9.5 9.1 9.5 9.9Petroleum . . . . . . . . . . . . . . . . . . . . . . . . . . . . . . 0.9 0.9 0.9 0.9 0.9 1.0 1.0 0.9 1.0 1.0Natural Gas . . . . . . . . . . . . . . . . . . . . . . . . . . . . 28.9 31.6 32.1 32.5 32.5 33.3 34.2 32.9 34.2 35.5Other Gaseous Fuels . . . . . . . . . . . . . . . . . . . . . 1.0 0.9 0.9 1.0 0.9 0.9 1.0 0.9 0.9 1.0Renewable Sources4 . . . . . . . . . . . . . . . . . . . . . . 6.2 7.1 7.3 7.5 7.3 7.8 8.3 7.5 8.2 8.9Other . . . . . . . . . . . . . . . . . . . . . . . . . . . . . . . . . 0.0 0.0 0.0 0.0 0.0 0.0 0.0 0.0 0.0 0.0
Total . . . . . . . . . . . . . . . . . . . . . . . . . . . . . . . . 45.1 49.4 50.2 51.1 50.7 52.3 53.9 51.4 53.8 56.3
Cumulative Additions 5 . . . . . . . . . . . . . . . . . . . . . 10.2 14.4 15.3 16.1 15.7 17.3 18.9 16.4 18.8 21.3
1Net summer capability is the steady hourly output that generating equipment is expected to supply to system load (exclusive of auxiliary power), as demonstrated by tests duringsummer peak demand.
2Includes grid-connected utilities and nonutilities except for cogenerators. Includes small power producers, exempt wholesale generators, and generators at industrial andcommercial facilities which produce electricity for on-site use and sales to utilities.
3Includes oil-, gas-, and dual-fired capability.4Includes conventional hydroelectric, geothermal, wood, wood waste, municipal solid waste, other biomass, solar and wind power.5Cumulative additions after December 31, 1994.6Cumulative total retirements from 1990.7Nameplate capacity is reported for nonutilities on Form EIA-867, “Annual Power Producer Report.” Nameplate capacity is designated by the manufacturer. The nameplate capacity
has been converted to the net summer capability based on historic relationships.Notes: Totals may not equal sum of components due to independent rounding. Net summer capability has been estimated for nonutility generators for AEO97. Net summer
capacity is used to be consistent with electric utility capacity estimates. Data for electric utility capacity are the most recent data available as of August 15, 1996. Therefore, capacityestimates may differ from other Energy Information Administration sources.
Sources: 1995 net summer capability at electric utilities and planned additions: Energy Information Administration (EIA), Form EIA-860, “Annual Electric Generator Report.” Netsummer capability for nonutilities and cogeneration in 1995 and planned additions estimated based on EIA, Form EIA-867, “Annual Nonutility Power Producer Report.” Projections:EIA, AEO97 National Energy Modeling System runs LMAC97.D100396A, AEO97B.D100296K, and HMAC97.D100296A.
138 Energy Information Administration/ Annual Energy Outlook 1997

Economic Growth Case Comparisons
Table B10. Electricity Trade(Billion Kilowatthours, Unless Otherwise Noted)
Electricity Trade 1995
Projections
2005 2010 2015
LowEconomic
GrowthReference
HighEconomic
Growth
LowEconomic
GrowthReference
HighEconomic
Growth
LowEconomic
GrowthReference
HighEconomic
Growth
Interregional Electricity Trade
Gross Domestic Firm Power Sales . . . . . . . . . . . 155.0 139.2 139.2 139.2 139.2 139.2 139.2 139.2 139.2 139.2Gross Domestic Economy Sales . . . . . . . . . . . . . 81.6 64.9 61.3 69.4 66.8 77.6 85.2 74.4 79.4 78.1
Gross Domestic Trade . . . . . . . . . . . . . . . . . . 236.6 204.1 200.5 208.7 206.0 216.8 224.4 213.6 218.6 217.3
Gross Domestic Firm Power Sales(million 1995 dollars) . . . . . . . . . . . . . . . . . . . . . 7023.5 6309.0 6309.0 6309.0 6309.0 6309.0 6309.0 6309.0 6309.0 6309.0Gross Domestic Economy Sales(million 1995 dollars) . . . . . . . . . . . . . . . . . . . . . 1958.3 1467.0 1420.8 1696.9 1450.1 1753.8 2111.5 1627.0 1831.4 2086.9
Gross Domestic Sales(million 1995 dollars) . . . . . . . . . . . . . . . . . . . 8981.7 7776.0 7729.8 8005.9 7759.1 8062.8 8420.5 7936.0 8140.4 8395.9
International Electricity Trade
Firm Power Imports From Canada and Mexico . . 30.2 19.7 19.7 19.7 18.6 18.6 18.6 18.6 18.6 18.6Economy Imports From Canada and Mexico . . . . 18.0 35.2 35.2 35.2 33.6 33.6 33.6 29.2 29.2 29.2
Gross Imports From Canada and Mexico . . . 48.3 54.9 54.8 54.8 52.2 52.2 52.2 47.9 47.9 47.9
Firm Power Exports To Canada and Mexico . . . . 3.4 13.4 13.4 13.4 13.4 13.4 13.4 13.4 13.4 13.4Economy Exports To Canada and Mexico . . . . . . 7.2 7.0 7.0 7.0 7.7 7.7 7.7 7.7 7.7 7.7
Gross Exports To Canada and Mexico . . . . . 10.6 20.3 20.3 20.3 21.0 21.0 21.0 21.0 21.0 21.0
Note: Totals may not equal sum of components due to independent rounding. Firm Power Sales are capacity sales, meaning the delivery of the power is scheduled as part of thenormal operating conditions of the affected electric systems. Economy Sales are subject to curtailment or cessation of delivery by the supplier in accordance with prior agreements orunder specified conditions.
Sources: 1995 interregional electricity trade data: Energy Information Administration (EIA), Bulk Power Data System. 1995 international electricity trade data: DOE Form FE-718R,“Annual Report of International Electrical Export/Import Data.” Firm/economy share: National Energy Board, Annual Report 1993. Planned interregional and international firm powersales: DOE Form IE-411, “Coordinated Bulk Power Supply Program Report” (April 1995). Projections: EIA, AEO97 National Energy Modeling System runs LMAC97.D100396A,AEO97B.D100296K, and HMAC97.D100296A.
Energy Information Administration/ Annual Energy Outlook 1997 139

Economic Growth Case Comparisons
Table B11. Petroleum Supply and Disposition Balance(Million Barrels per Day, Unless Otherwise Noted)
Supply and Disposition 1995
Projections
2005 2010 2015
LowEconomic
GrowthReference
HighEconomic
Growth
LowEconomic
GrowthReference
HighEconomic
Growth
LowEconomic
GrowthReference
HighEconomic
Growth
Crude OilDomestic Crude Production1 . . . . . . . . . . . . . . . . 6.56 5.42 5.49 5.56 5.28 5.39 5.50 5.10 5.23 5.36
Alaska . . . . . . . . . . . . . . . . . . . . . . . . . . . . . . . 1.48 0.94 0.94 0.94 0.77 0.77 0.77 0.63 0.63 0.64Lower 48 States . . . . . . . . . . . . . . . . . . . . . . . . 5.08 4.47 4.55 4.61 4.51 4.62 4.72 4.47 4.60 4.73
Net Imports . . . . . . . . . . . . . . . . . . . . . . . . . . . . . 7.14 9.29 9.49 9.68 9.65 9.76 10.19 9.85 10.24 10.64Other Crude Supply2 . . . . . . . . . . . . . . . . . . . . . . 0.28 0.00 0.00 0.00 0.00 0.00 0.00 0.00 0.00 0.00
Total Crude Supply . . . . . . . . . . . . . . . . . . . . . . . 13.97 14.70 14.98 15.24 14.93 15.15 15.69 14.96 15.47 16.00
Natural Gas Plant Liquids . . . . . . . . . . . . . . . . . . 1.76 2.07 2.14 2.22 2.14 2.28 2.44 2.27 2.44 2.61
Other Inputs 3 . . . . . . . . . . . . . . . . . . . . . . . . . . . . 0.46 0.24 0.24 0.24 0.19 0.19 0.21 0.18 0.19 0.21Refinery Processing Gain 4 . . . . . . . . . . . . . . . . . 0.77 0.76 0.80 0.84 0.78 0.82 0.87 0.73 0.77 0.82
Net Product Imports 5 . . . . . . . . . . . . . . . . . . . . . . 0.75 2.21 2.51 2.80 2.49 3.14 3.41 2.46 3.22 3.92
Total Primary Supply 6 . . . . . . . . . . . . . . . . . . . . . 17.73 19.98 20.67 21.34 20.53 21.58 22.62 20.60 22.10 23.56
Refined Petroleum Products SuppliedMotor Gasoline7 . . . . . . . . . . . . . . . . . . . . . . . . . 7.81 8.69 8.90 9.10 8.84 9.17 9.49 8.73 9.19 9.63Jet Fuel 8 . . . . . . . . . . . . . . . . . . . . . . . . . . . . . . 1.51 1.97 2.06 2.15 2.09 2.25 2.41 2.15 2.39 2.63Distillate Fuel 9 . . . . . . . . . . . . . . . . . . . . . . . . . . 3.25 3.66 3.81 3.97 3.76 3.99 4.24 3.81 4.12 4.46Residual Fuel . . . . . . . . . . . . . . . . . . . . . . . . . . . 0.85 1.00 1.04 1.08 1.07 1.11 1.15 1.10 1.20 1.29Other10 . . . . . . . . . . . . . . . . . . . . . . . . . . . . . . . . 4.32 4.67 4.87 5.04 4.78 5.07 5.34 4.83 5.21 5.56
Total . . . . . . . . . . . . . . . . . . . . . . . . . . . . . . . . 17.73 19.98 20.68 21.34 20.54 21.60 22.63 20.62 22.12 23.57
Refined Petroleum Products SuppliedResidential and Commercial . . . . . . . . . . . . . . . . . 1.07 1.01 1.03 1.05 0.99 1.02 1.05 0.98 1.01 1.06Industrial 11 . . . . . . . . . . . . . . . . . . . . . . . . . . . . . 4.58 4.91 5.13 5.33 5.01 5.33 5.62 5.06 5.48 5.86Transportation . . . . . . . . . . . . . . . . . . . . . . . . . . . 11.79 13.82 14.26 14.69 14.29 15.00 15.70 14.33 15.35 16.33Electric Generators12 . . . . . . . . . . . . . . . . . . . . . . 0.30 0.24 0.26 0.28 0.25 0.26 0.27 0.26 0.28 0.32
Total . . . . . . . . . . . . . . . . . . . . . . . . . . . . . . . . 17.73 19.98 20.68 21.34 20.54 21.60 22.63 20.62 22.12 23.57
Discrepancy 13 . . . . . . . . . . . . . . . . . . . . . . . . . . . -0.01 -0.01 -0.01 0.00 -0.01 -0.02 -0.01 -0.02 -0.02 -0.01
World Oil Price (1995 dollars per barrel) 14 . . . . . . 17.26 18.93 19.72 20.54 19.43 20.41 21.37 19.78 20.98 22.21Import Share of Product Supplied . . . . . . . . . . . . 0.44 0.58 0.58 0.59 0.59 0.60 0.60 0.60 0.61 0.62Expenditures for Imported Crude Oiland Petroleum Products (billion 1995 dollars) . . . 49.39 77.98 85.05 92.73 84.96 95.44 105.63 86.65 101.18 116.22Domestic Refinery Distillation Capacity . . . . . . . . 15.4 15.6 16.0 16.3 15.9 16.2 16.8 16.1 16.5 17.1Capacity Utilization Rate (percent) . . . . . . . . . . . 92.0 94.1 94.1 94.0 94.1 94.0 94.0 93.3 94.0 94.0
1Includes lease condensate.2Strategic petroleum reserve stock additions plus unaccounted for crude oil and crude stock withdrawals minus crude products supplied.3Includes alcohols, ethers, petroleum product stock withdrawals, domestic sources of blending components, and other hydrocarbons.4Represents volumetric gain in refinery distillation and cracking processes.5Includes net imports of finished petroleum products, unfinished oils, other hydrocarbons, alcohols, ethers, and blending components.6Total crude supply plus natural gas plant liquids, other inputs, refinery processing gain, and net petroleum imports.7Includes ethanol and ethers blended into gasoline.8Includes naphtha and kerosene types.9Includes distillate and kerosene.10Includes aviation gasoline, liquefied petroleum gas, petrochemical feedstocks, lubricants, waxes, asphalt, road oil, still gas, special naphthas, petroleum coke, crude oil product
supplied, and miscellaneous petroleum products.11Includes consumption by cogenerators.12Includes all electric power generators except cogenerators, which produce electricity as a by-product of other processes.13Balancing item. Includes unaccounted for supply, losses and gains.14Average refiner acquisition cost for imported crude oil.Note: Totals may not equal sum of components due to independent rounding.Sources: 1995 expenditures for imported crude oil and petroleum products based on internal calculations. Other 1995 data: Energy Information Administration (EIA), Petroleum
Supply Annual 1995, DOE/EIA-0340(95) (Washington, DC, May 1996). Projections: EIA, AEO97 National Energy Modeling System runs LMAC97.D100396A, AEO97B.D100296K,and HMAC97.D100296A.
140 Energy Information Administration/ Annual Energy Outlook 1997

Economic Growth Case Comparisons
Table B12. Petroleum Product Prices(1995 Cents per Gallon, Unless Otherwise Noted)
Sector and Fuel 1995
Projections
2005 2010 2015
LowEconomic
GrowthReference
HighEconomic
Growth
LowEconomic
GrowthReference
HighEconomic
Growth
LowEconomic
GrowthReference
HighEconomic
Growth
World Oil Price (dollars per barrel) . . . . . . . . . . . 17.26 18.93 19.72 20.54 19.43 20.41 21.37 19.78 20.98 22.21
Delivered Sector Product Prices
ResidentialDistillate Fuel . . . . . . . . . . . . . . . . . . . . . . . . . . . 86.5 98.7 100.9 103.4 99.9 103.3 105.8 98.3 101.7 106.5Liquefied Petroleum Gas . . . . . . . . . . . . . . . . . . . 88.8 96.2 98.4 100.9 99.0 102.3 103.3 96.4 99.9 103.2
CommercialDistillate Fuel . . . . . . . . . . . . . . . . . . . . . . . . . . . 60.8 70.9 73.3 75.8 71.9 75.4 78.0 70.2 73.7 78.6Residual Fuel . . . . . . . . . . . . . . . . . . . . . . . . . . . 44.7 41.0 42.9 44.9 42.2 44.6 47.7 42.4 45.3 48.4Residual Fuel (dollars per barrel) . . . . . . . . . . . . . 18.78 17.21 18.02 18.86 17.71 18.73 20.02 17.82 19.02 20.33
Industrial 1
Distillate Fuel . . . . . . . . . . . . . . . . . . . . . . . . . . . 63.9 69.8 72.3 74.9 71.2 74.6 77.4 69.6 73.3 78.5Liquefied Petroleum Gas . . . . . . . . . . . . . . . . . . . 56.4 49.6 51.8 54.3 51.3 54.2 54.7 47.5 51.4 54.7Residual Fuel . . . . . . . . . . . . . . . . . . . . . . . . . . . 38.2 42.0 43.7 45.7 42.7 45.3 47.8 42.1 45.1 49.0Residual Fuel (dollars per barrel) . . . . . . . . . . . . . 16.06 17.62 18.36 19.18 17.93 19.04 20.07 17.70 18.95 20.57
TransportationDistillate Fuel 2 . . . . . . . . . . . . . . . . . . . . . . . . . . 111.4 115.5 120.6 125.1 113.3 120.4 125.6 108.1 116.2 124.0Jet Fuel 3 . . . . . . . . . . . . . . . . . . . . . . . . . . . . . . 52.0 69.4 73.7 77.8 70.1 76.3 80.4 67.2 73.5 79.8Motor Gasoline4 . . . . . . . . . . . . . . . . . . . . . . . . . 114.8 116.7 121.2 125.6 114.7 121.8 126.6 110.0 117.4 124.4Residual Fuel . . . . . . . . . . . . . . . . . . . . . . . . . . . 36.5 41.3 43.4 45.8 44.2 47.3 50.6 42.7 46.0 49.7Residual Fuel (dollars per barrel) . . . . . . . . . . . . . 15.32 17.37 18.24 19.24 18.58 19.86 21.24 17.94 19.33 20.88
Electric Generators 5
Distillate Fuel . . . . . . . . . . . . . . . . . . . . . . . . . . . 54.7 63.7 66.1 68.4 64.6 68.3 70.9 63.0 67.0 72.0Residual Fuel . . . . . . . . . . . . . . . . . . . . . . . . . . . 39.2 42.8 44.4 46.3 44.5 47.2 49.9 43.9 46.5 50.0Residual Fuel (dollars per barrel) . . . . . . . . . . . . . 16.45 17.96 18.66 19.43 18.70 19.82 20.97 18.44 19.54 20.99
Refined Petroleum Product Prices 6
Distillate Fuel 2 . . . . . . . . . . . . . . . . . . . . . . . . . . 96.8 103.3 107.5 111.4 102.3 108.2 112.7 98.1 104.9 111.9Jet Fuel 3 . . . . . . . . . . . . . . . . . . . . . . . . . . . . . . 52.0 69.4 73.7 77.8 70.1 76.3 80.4 67.2 73.5 79.8Liquefied Petroleum Gas . . . . . . . . . . . . . . . . . . . 62.2 60.0 62.2 64.7 62.5 65.6 66.3 59.3 63.2 66.5Motor Gasoline4 . . . . . . . . . . . . . . . . . . . . . . . . . 114.8 116.5 120.9 125.3 114.6 121.6 126.4 109.8 117.2 124.2Residual Fuel . . . . . . . . . . . . . . . . . . . . . . . . . . . 38.1 41.7 43.6 45.8 44.0 46.9 50.0 42.8 46.0 49.6Residual Fuel (dollars per barrel) . . . . . . . . . . . . . 16.01 17.50 18.32 19.25 18.47 19.69 20.99 17.99 19.31 20.83
Average . . . . . . . . . . . . . . . . . . . . . . . . . . . . . . 92.4 95.6 99.4 103.0 94.7 100.4 104.1 90.4 96.4 102.2
1Includes cogenerators.2Includes Federal and State taxes on diesel fuel and excludes county and local taxes.3Kerosene-type jet fuel.4Sales weighted-average price for all grades. Includes Federal and State taxes and excludes county and local taxes.5Includes all electric power generators except cogenerators, which produce electricity as a by-product of other processes.6Weighted averages of end-use fuel prices are derived from the prices in each sector and the corresponding sectoral consumption.
Sources: 1995 prices for gasoline, distillate, and jet fuel are based on prices in various issues of Energy Information Administration (EIA), Petroleum Marketing Monthly, DOE/EIA-0380(95/3-96/4) (Washington, DC, 1995-1996). 1995 prices for all other petroleum products are derived from EIA, State Energy Price and Expenditures Report: 1993, DOE/EIA-0376(93) (Washington, DC, December 1995). Projections: EIA, AEO97 National Energy Modeling System runs LMAC97.D100396A, AEO97B.D100296K, and HMAC97.D100296A.
Energy Information Administration/ Annual Energy Outlook 1997 141

Economic Growth Case Comparisons
Table B13. Natural Gas Supply and Disposition(Trillion Cubic Feet per Year)
Supply and Disposition 1995
Projections
2005 2010 2015
LowEconomic
GrowthReference
HighEconomic
Growth
LowEconomic
GrowthReference
HighEconomic
Growth
LowEconomic
GrowthReference
HighEconomic
Growth
ProductionDry Gas Production1 . . . . . . . . . . . . . . . . . . . . . . 18.49 21.85 22.66 23.53 22.75 24.25 26.00 24.29 26.10 27.89Supplemental Natural Gas2 . . . . . . . . . . . . . . . . . 0.13 0.06 0.06 0.06 0.06 0.06 0.06 0.06 0.06 0.06
Net Imports . . . . . . . . . . . . . . . . . . . . . . . . . . . . . 2.68 3.69 3.69 3.69 3.92 3.92 3.92 4.23 4.23 4.23Canada . . . . . . . . . . . . . . . . . . . . . . . . . . . . . . . 2.79 3.52 3.52 3.52 3.74 3.74 3.74 4.06 4.06 4.06Mexico . . . . . . . . . . . . . . . . . . . . . . . . . . . . . . . . -0.05 -0.11 -0.11 -0.11 -0.12 -0.12 -0.12 -0.12 -0.12 -0.12Liquefied Natural Gas . . . . . . . . . . . . . . . . . . . . . -0.05 0.27 0.27 0.27 0.29 0.29 0.29 0.29 0.29 0.29
Total Supply . . . . . . . . . . . . . . . . . . . . . . . . . . . . 21.30 25.60 26.41 27.28 26.73 28.23 29.98 28.58 30.39 32.19
Consumption by SectorResidential . . . . . . . . . . . . . . . . . . . . . . . . . . . . . 4.87 5.15 5.27 5.40 5.22 5.42 5.62 5.31 5.57 5.83Commercial . . . . . . . . . . . . . . . . . . . . . . . . . . . . 3.07 3.33 3.34 3.42 3.41 3.44 3.56 3.51 3.55 3.73Industrial 3 . . . . . . . . . . . . . . . . . . . . . . . . . . . . . 8.33 9.03 9.27 9.52 9.14 9.56 10.02 9.10 9.65 10.23Electric Generators4 . . . . . . . . . . . . . . . . . . . . . . 3.46 5.52 5.88 6.21 6.23 6.94 7.72 7.74 8.52 9.11Lease and Plant Fuel 5 . . . . . . . . . . . . . . . . . . . . 1.14 1.41 1.45 1.50 1.47 1.55 1.64 1.56 1.65 1.75Pipeline Fuel . . . . . . . . . . . . . . . . . . . . . . . . . . . . 0.70 0.80 0.82 0.83 0.82 0.86 0.92 0.85 0.91 0.97Transportation6 . . . . . . . . . . . . . . . . . . . . . . . . . . 0.01 0.17 0.18 0.18 0.24 0.25 0.27 0.27 0.30 0.33
Total . . . . . . . . . . . . . . . . . . . . . . . . . . . . . . . . 21.58 25.41 26.22 27.06 26.52 28.01 29.75 28.35 30.16 31.95
Discrepancy 7 . . . . . . . . . . . . . . . . . . . . . . . . . . . . -0.28 0.19 0.19 0.21 0.20 0.22 0.23 0.23 0.23 0.23
1Marketed production (wet) minus extraction losses.2Synthetic natural gas, propane air, coke oven gas, refinery gas, biomass gas, air injected for Btu stabilization, and manufactured gas commingled and distributed with natural gas.3Includes consumption by cogenerators.4Includes all electric power generators except cogenerators, which produce electricity as a by product of other processes.5Represents natural gas used in the field gathering and processing plant machinery.6Compressed natural gas used as vehicle fuel.7Balancing item. Natural gas lost as a result of converting flow data measured at varying temperatures and pressures to a standard temperature and pressure and the merger of
different data reporting systems which vary in scope, format, definition, and respondent type. In addition, 1995 values include net storage injections.Btu = British thermal unit.Note: Totals may not equal sum of components due to independent rounding. Figures for 1995 may differ from published data due to internal conversion factors.Sources: 1995 supplemental natural gas: Energy Information Administration (EIA), Natural Gas Monthly, DOE/EIA-0130(96/6) (Washington, DC, June 1996). 1995 imports and dry
gas production derived from: EIA, Natural Gas Annual 1995, DOE/EIA-0131(95) (Washington, DC, November 1996). 1995 transportation sector consumption: EIA, AEO97 NationalEnergy Modeling System runs LMAC97.D100396A, AEO97B.D100296K, and HMAC97.D100296A. Other 1995 consumption: EIA, Short-Term Energy Outlook, DOE/EIA-0202(96/4Q)(Washington, DC, October 1996) with adjustments to end-use sector consumption levels for consumption of natural gas by electric wholesale generators based on EIA, AEO97National Energy Modeling System runs LMAC97.D100396A, AEO97B.D100296K, and HMAC97.D100296A. Projections: EIA, AEO97 National Energy Modeling System runsLMAC97.D100396A, AEO97B.D100296K, and HMAC97.D100296A.
142 Energy Information Administration/ Annual Energy Outlook 1997

Economic Growth Case Comparisons
Table B14. Natural Gas Prices, Margins, and Revenues(1995 Dollars per Thousand Cubic Feet, Unless Otherwise Noted)
Prices, Margins, and Revenue 1995
Projections
2005 2010 2015
LowEconomic
GrowthReference
HighEconomic
Growth
LowEconomic
GrowthReference
HighEconomic
Growth
LowEconomic
GrowthReference
HighEconomic
Growth
Source PriceAverage Lower 48 Wellhead Price1 . . . . . . . . . . . 1.61 1.79 1.94 2.15 1.81 2.01 2.23 1.83 2.13 2.49Average Import Price . . . . . . . . . . . . . . . . . . . . . . 1.49 1.73 1.85 2.12 1.77 1.94 2.23 1.78 2.06 2.43
Average 2 . . . . . . . . . . . . . . . . . . . . . . . . . . . . . 1.59 1.78 1.93 2.15 1.81 2.00 2.23 1.82 2.12 2.48
Delivered PricesResidential . . . . . . . . . . . . . . . . . . . . . . . . . . . . . 6.18 5.53 5.65 5.85 5.25 5.43 5.62 5.05 5.33 5.64Commercial . . . . . . . . . . . . . . . . . . . . . . . . . . . . 5.10 4.63 4.79 5.00 4.42 4.64 4.86 4.27 4.61 4.95Industrial 3 . . . . . . . . . . . . . . . . . . . . . . . . . . . . . 2.35 2.44 2.61 2.85 2.46 2.69 2.93 2.48 2.82 3.20Electric Generators4 . . . . . . . . . . . . . . . . . . . . . . 2.06 2.18 2.33 2.53 2.17 2.38 2.62 2.19 2.52 2.88Transportation5 . . . . . . . . . . . . . . . . . . . . . . . . . . 5.94 6.22 6.38 6.62 6.71 6.93 7.17 6.95 7.27 7.63
Average 6 . . . . . . . . . . . . . . . . . . . . . . . . . . . . . 3.67 3.41 3.55 3.75 3.31 3.49 3.70 3.21 3.52 3.87
Transmission and Distribution Margins 7
Residential . . . . . . . . . . . . . . . . . . . . . . . . . . . . . 4.59 3.75 3.73 3.70 3.45 3.43 3.39 3.23 3.21 3.16Commercial . . . . . . . . . . . . . . . . . . . . . . . . . . . . 3.51 2.85 2.86 2.85 2.62 2.64 2.63 2.45 2.49 2.47Industrial 3 . . . . . . . . . . . . . . . . . . . . . . . . . . . . . 0.76 0.66 0.68 0.70 0.65 0.69 0.70 0.66 0.70 0.72Electric Generators4 . . . . . . . . . . . . . . . . . . . . . . 0.47 0.40 0.41 0.38 0.37 0.38 0.39 0.37 0.40 0.40Transportation5 . . . . . . . . . . . . . . . . . . . . . . . . . . 4.35 4.44 4.45 4.47 4.90 4.93 4.94 5.13 5.15 5.15
Average 6 . . . . . . . . . . . . . . . . . . . . . . . . . . . . . 2.08 1.63 1.62 1.60 1.50 1.49 1.47 1.39 1.40 1.38
Transmission and Distribution Revenue(billion 1995 dollars)
Residential . . . . . . . . . . . . . . . . . . . . . . . . . . . . . 22.35 19.31 19.66 19.99 17.99 18.56 19.06 17.15 17.91 18.44Commercial . . . . . . . . . . . . . . . . . . . . . . . . . . . . 10.79 9.48 9.56 9.74 8.92 9.08 9.37 8.60 8.85 9.18Industrial 3 . . . . . . . . . . . . . . . . . . . . . . . . . . . . . 6.31 5.95 6.32 6.63 5.98 6.57 7.00 5.99 6.72 7.33Electric Generators4 . . . . . . . . . . . . . . . . . . . . . . 1.61 2.21 2.40 2.38 2.29 2.61 3.02 2.88 3.42 3.62Transportation5 . . . . . . . . . . . . . . . . . . . . . . . . . . 0.04 0.76 0.79 0.83 1.16 1.25 1.33 1.41 1.56 1.69
Total . . . . . . . . . . . . . . . . . . . . . . . . . . . . . . . . 41.11 37.71 38.73 39.58 36.34 38.08 39.78 36.02 38.45 40.27
1Represents lower 48 onshore and offshore supplies.2Quantity-weighted average of the average lower 48 wellhead price and the average price of imports at the U.S. border.3Includes consumption by cogenerators.4Includes all electric power generators except cogenerators, which produce electricity as a by product of other processes.5Compressed natural gas used as a vehicle fuel.6Weighted average prices and margins. Weights used are the sectoral consumption values excluding lease, plant, and pipeline fuel.7Within the table, “transmission and distribution” margins equal the difference between the delivered price and the source price (average of the wellhead price and the price of
imports at the U.S. border) of natural gas and, thus, reflect the total cost of bringing natural gas to market. When the term “transmission and distribution” margins is used in today’snatural gas market, it generally does not include the cost of independent natural gas marketers or costs associated with aggregation of supplies, provisions of storage, and otherservices. As used here, the term includes the cost of all services and the cost of pipeline fuel used in compressor stations.
Note: Totals may not equal sum of components due to independent rounding.Sources: 1995 industrial delivered prices based on Energy Information Administration (EIA), Manufacturing Energy Consumption Survey 1991. 1995 residential and commercial
delivered prices, average lower 48 wellhead price, and average import price: EIA, Natural Gas Monthly, DOE/EIA-0130(96/6) (Washington, DC, June 1996). Other 1995 values, andprojections: EIA, AEO97 National Energy Modeling System runs LMAC97.D100396A, AEO97B.D100296K, and HMAC97.D100296A.
Energy Information Administration/ Annual Energy Outlook 1997 143

Economic Growth Case Comparisons
Table B15. Oil and Gas Supply
Production and Supply 1995
Projections
2005 2010 2015
LowEconomic
GrowthReference
HighEconomic
Growth
LowEconomic
GrowthReference
HighEconomic
Growth
LowEconomic
GrowthReference
HighEconomic
Growth
Crude Oil
Lower 48 Average Wellhead Price 1
(1995 dollars per barrel) . . . . . . . . . . . . . . . . . . . . . 15.58 18.61 19.36 20.23 19.09 20.02 20.97 18.68 19.85 21.06
Production (million barrels per day) 2
U.S. Total . . . . . . . . . . . . . . . . . . . . . . . . . . . . . . . . 6.56 5.42 5.49 5.56 5.28 5.39 5.50 5.10 5.23 5.36Lower 48 Onshore . . . . . . . . . . . . . . . . . . . . . . . . . 3.82 2.98 3.04 3.11 2.96 3.04 3.14 2.96 3.07 3.19
Conventional . . . . . . . . . . . . . . . . . . . . . . . . . . . . 3.24 2.40 2.44 2.49 2.30 2.36 2.41 2.26 2.33 2.38Enhanced Oil Recovery . . . . . . . . . . . . . . . . . . . . 0.58 0.58 0.60 0.62 0.66 0.69 0.73 0.70 0.75 0.81
Lower 48 Offshore . . . . . . . . . . . . . . . . . . . . . . . . . 1.26 1.49 1.50 1.51 1.56 1.57 1.58 1.51 1.53 1.54Alaska . . . . . . . . . . . . . . . . . . . . . . . . . . . . . . . . . 1.48 0.94 0.94 0.94 0.77 0.77 0.77 0.63 0.63 0.64
Lower 48 End of Year Reserves (billion barrels) . . 17.18 14.99 15.26 15.51 15.14 15.51 15.92 15.12 15.61 16.14
Natural Gas
Lower 48 Average Wellhead Price 1
(1995 dollars per thousand cubic feet) . . . . . . . . . 1.61 1.79 1.94 2.15 1.81 2.01 2.23 1.83 2.13 2.49
Production (trillion cubic feet) 3
U.S. Total . . . . . . . . . . . . . . . . . . . . . . . . . . . . . . . . 18.48 21.85 22.66 23.53 22.75 24.25 26.00 24.29 26.10 27.89Lower 48 Onshore . . . . . . . . . . . . . . . . . . . . . . . . . 13.00 15.03 15.75 16.59 15.93 17.19 18.61 16.97 18.59 20.13
Associated-Dissolved4 . . . . . . . . . . . . . . . . . . . . . 1.85 1.27 1.28 1.30 1.20 1.21 1.23 1.17 1.18 1.20Non-Associated . . . . . . . . . . . . . . . . . . . . . . . . . . 11.15 13.77 14.47 15.29 14.74 15.98 17.38 15.81 17.40 18.93
Conventional . . . . . . . . . . . . . . . . . . . . . . . . . . . 7.92 10.65 11.21 11.84 11.35 12.33 13.54 12.20 13.28 14.30Unconventional . . . . . . . . . . . . . . . . . . . . . . . . . 3.24 3.12 3.26 3.45 3.39 3.66 3.84 3.61 4.13 4.63
Lower 48 Offshore . . . . . . . . . . . . . . . . . . . . . . . . . 5.05 6.30 6.39 6.42 6.27 6.51 6.83 6.74 6.94 7.18Associated-Dissolved4 . . . . . . . . . . . . . . . . . . . . . 0.71 0.78 0.78 0.78 0.80 0.81 0.81 0.79 0.80 0.80Non-Associated . . . . . . . . . . . . . . . . . . . . . . . . . . 4.34 5.52 5.61 5.64 5.47 5.70 6.03 5.95 6.14 6.38
Alaska . . . . . . . . . . . . . . . . . . . . . . . . . . . . . . . . . 0.42 0.52 0.52 0.53 0.55 0.55 0.56 0.57 0.58 0.59
U.S. End of Year Reserves (trillion cubic feet) . . . . 155.03 169.88 174.73 184.20 178.44 187.05 197.89 178.91 188.42 196.73
Supplemental Gas Supplies (trillion cubic feet) 5 . . 0.13 0.06 0.06 0.06 0.06 0.06 0.06 0.06 0.06 0.06
Total Lower 48 Wells Completed (thousands) . . . . 18.52 31.61 34.33 37.82 34.41 37.60 40.95 36.79 41.75 47.64
1Represents lower 48 onshore and offshore supplies.2Includes lease condensate.3Market production (wet) minus extraction losses.4Gas which occurs in crude oil reserves either as free gas (associated) or as gas in solution with crude oil (dissolved).5Synthetic natural gas, propane air, coke oven gas, refinery gas, biomass gas, air injected for Btu stabilization, and manufactured gas commingled and distributed with natural gas.Note: Totals may not equal sum of components due to independent rounding. Figures for 1995 may differ from published data due to internal conversion factors.Sources: 1995 crude oil lower 48 average wellhead price: Energy Information Administration (EIA), Office of Integrated Analysis and Forecasting. 1995 total wells completed: EIA,
Office of Integrated Analysis and Forecasting. 1995 lower 48 onshore, lower 48 offshore, Alaska crude oil production: EIA, Petroleum Supply Annual 1995, DOE/EIA-0340(95)(Washington, DC, May 1996). 1995 natural gas lower 48 average wellhead price: EIA, Natural Gas Monthly, DOE/EIA-0130(96/06) (Washington, DC, June 1996). 1995 total naturalgas production derived from: EIA, Natural Gas Annual 1995, DOE/EIA-0131(95) (Washington, DC, November 1996). Other 1995 values: EIA, Office of Integrated Analysis andForecasting. Projections: EIA, AEO97 National Energy Modeling System runs LMAC97.D100396A, AEO97B.D100296K, and HMAC97.D100296A.
144 Energy Information Administration/ Annual Energy Outlook 1997
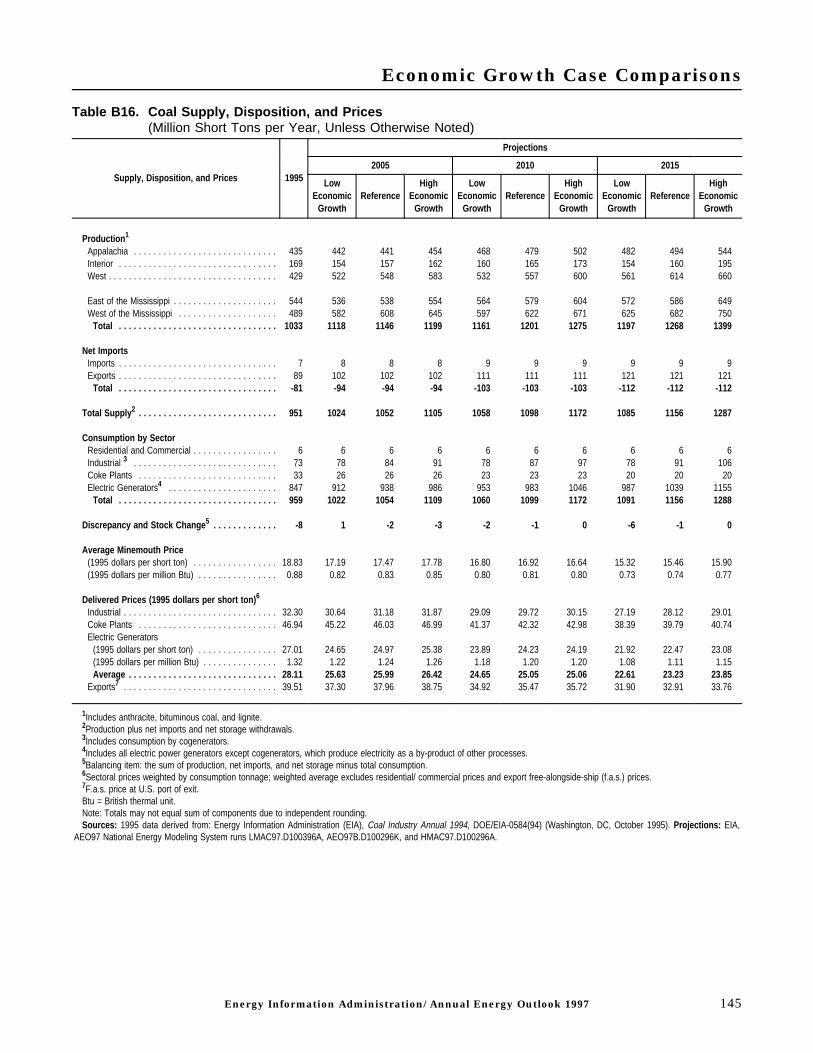
Economic Growth Case Comparisons
Table B16. Coal Supply, Disposition, and Prices(Million Short Tons per Year, Unless Otherwise Noted)
Supply, Disposition, and Prices 1995
Projections
2005 2010 2015
LowEconomic
GrowthReference
HighEconomic
Growth
LowEconomic
GrowthReference
HighEconomic
Growth
LowEconomic
GrowthReference
HighEconomic
Growth
Production 1
Appalachia . . . . . . . . . . . . . . . . . . . . . . . . . . . . . 435 442 441 454 468 479 502 482 494 544Interior . . . . . . . . . . . . . . . . . . . . . . . . . . . . . . . . 169 154 157 162 160 165 173 154 160 195West . . . . . . . . . . . . . . . . . . . . . . . . . . . . . . . . . . 429 522 548 583 532 557 600 561 614 660
East of the Mississippi . . . . . . . . . . . . . . . . . . . . . 544 536 538 554 564 579 604 572 586 649West of the Mississippi . . . . . . . . . . . . . . . . . . . . 489 582 608 645 597 622 671 625 682 750
Total . . . . . . . . . . . . . . . . . . . . . . . . . . . . . . . . 1033 1118 1146 1199 1161 1201 1275 1197 1268 1399
Net ImportsImports . . . . . . . . . . . . . . . . . . . . . . . . . . . . . . . . 7 8 8 8 9 9 9 9 9 9Exports . . . . . . . . . . . . . . . . . . . . . . . . . . . . . . . . 89 102 102 102 111 111 111 121 121 121
Total . . . . . . . . . . . . . . . . . . . . . . . . . . . . . . . . -81 -94 -94 -94 -103 -103 -103 -112 -112 -112
Total Supply 2 . . . . . . . . . . . . . . . . . . . . . . . . . . . . 951 1024 1052 1105 1058 1098 1172 1085 1156 1287
Consumption by SectorResidential and Commercial . . . . . . . . . . . . . . . . . 6 6 6 6 6 6 6 6 6 6Industrial 3 . . . . . . . . . . . . . . . . . . . . . . . . . . . . . 73 78 84 91 78 87 97 78 91 106Coke Plants . . . . . . . . . . . . . . . . . . . . . . . . . . . . 33 26 26 26 23 23 23 20 20 20Electric Generators4 . . . . . . . . . . . . . . . . . . . . . . 847 912 938 986 953 983 1046 987 1039 1155
Total . . . . . . . . . . . . . . . . . . . . . . . . . . . . . . . . 959 1022 1054 1109 1060 1099 1172 1091 1156 1288
Discrepancy and Stock Change 5 . . . . . . . . . . . . . -8 1 -2 -3 -2 -1 0 -6 -1 0
Average Minemouth Price(1995 dollars per short ton) . . . . . . . . . . . . . . . . . 18.83 17.19 17.47 17.78 16.80 16.92 16.64 15.32 15.46 15.90(1995 dollars per million Btu) . . . . . . . . . . . . . . . . 0.88 0.82 0.83 0.85 0.80 0.81 0.80 0.73 0.74 0.77
Delivered Prices (1995 dollars per short ton) 6
Industrial . . . . . . . . . . . . . . . . . . . . . . . . . . . . . . . 32.30 30.64 31.18 31.87 29.09 29.72 30.15 27.19 28.12 29.01Coke Plants . . . . . . . . . . . . . . . . . . . . . . . . . . . . 46.94 45.22 46.03 46.99 41.37 42.32 42.98 38.39 39.79 40.74Electric Generators
(1995 dollars per short ton) . . . . . . . . . . . . . . . . 27.01 24.65 24.97 25.38 23.89 24.23 24.19 21.92 22.47 23.08(1995 dollars per million Btu) . . . . . . . . . . . . . . . 1.32 1.22 1.24 1.26 1.18 1.20 1.20 1.08 1.11 1.15Average . . . . . . . . . . . . . . . . . . . . . . . . . . . . . . 28.11 25.63 25.99 26.42 24.65 25.05 25.06 22.61 23.23 23.85
Exports7 . . . . . . . . . . . . . . . . . . . . . . . . . . . . . . . 39.51 37.30 37.96 38.75 34.92 35.47 35.72 31.90 32.91 33.76
1Includes anthracite, bituminous coal, and lignite.2Production plus net imports and net storage withdrawals.3Includes consumption by cogenerators.4Includes all electric power generators except cogenerators, which produce electricity as a by-product of other processes.5Balancing item: the sum of production, net imports, and net storage minus total consumption.6Sectoral prices weighted by consumption tonnage; weighted average excludes residential/ commercial prices and export free-alongside-ship (f.a.s.) prices.7F.a.s. price at U.S. port of exit.Btu = British thermal unit.Note: Totals may not equal sum of components due to independent rounding.Sources: 1995 data derived from: Energy Information Administration (EIA), Coal Industry Annual 1994, DOE/EIA-0584(94) (Washington, DC, October 1995). Projections: EIA,
AEO97 National Energy Modeling System runs LMAC97.D100396A, AEO97B.D100296K, and HMAC97.D100296A.
Energy Information Administration/ Annual Energy Outlook 1997 145

Economic Growth Case Comparisons
Table B17. Renewable Energy Generating Capacity and Generation(Thousand Megawatts, Unless Otherwise Noted)
Capacity and Generation 1995
Projections
2005 2010 2015
LowEconomic
GrowthReference
HighEconomic
Growth
LowEconomic
GrowthReference
HighEconomic
Growth
LowEconomic
GrowthReference
HighEconomic
Growth
Electric Generators 1
(excluding cogenerators)Capability
Conventional Hydropower . . . . . . . . . . . . . . . . . . 78.48 80.33 80.33 80.33 80.38 80.38 80.38 80.38 80.38 80.38Geothermal 2 . . . . . . . . . . . . . . . . . . . . . . . . . . . 2.97 2.93 3.04 3.24 2.95 3.19 3.32 2.99 3.46 3.82Municipal Solid Waste . . . . . . . . . . . . . . . . . . . . . 2.43 3.29 3.34 3.39 3.76 3.89 4.01 3.99 4.19 4.37Wood and Other Biomass3 . . . . . . . . . . . . . . . . . 1.86 1.99 2.00 1.99 2.04 2.21 2.66 2.46 3.92 5.25Solar Thermal . . . . . . . . . . . . . . . . . . . . . . . . . . . 0.36 0.42 0.42 0.42 0.50 0.50 0.50 0.63 0.63 0.63Solar Photovoltaic . . . . . . . . . . . . . . . . . . . . . . . . 0.01 0.08 0.08 0.08 0.19 0.19 0.19 0.35 0.35 0.35Wind . . . . . . . . . . . . . . . . . . . . . . . . . . . . . . . . . . 1.83 2.47 2.97 3.06 3.69 3.78 4.12 5.75 5.39 6.41
Total . . . . . . . . . . . . . . . . . . . . . . . . . . . . . . . . 87.95 91.49 92.17 92.51 93.52 94.14 95.19 96.54 98.32 101.23
Generation (billion kilowatthours)Conventional Hydropower . . . . . . . . . . . . . . . . . . 309.82 303.54 303.59 303.65 304.04 304.11 304.21 304.11 304.21 304.36Geothermal 2 . . . . . . . . . . . . . . . . . . . . . . . . . . . 14.66 17.16 17.94 19.40 17.77 19.46 20.39 18.67 22.04 24.59Municipal Solid Waste . . . . . . . . . . . . . . . . . . . . . 18.69 21.98 22.33 22.68 25.21 26.12 27.02 26.83 28.18 29.51Wood and Other Biomass3 . . . . . . . . . . . . . . . . . 7.12 9.15 9.24 9.15 9.55 10.73 13.89 12.46 22.72 32.02Solar Thermal . . . . . . . . . . . . . . . . . . . . . . . . . . . 0.82 1.10 1.10 1.10 1.38 1.38 1.38 1.78 1.78 1.78Solar Photovoltaic . . . . . . . . . . . . . . . . . . . . . . . . 0.00 0.22 0.22 0.22 0.48 0.48 0.48 0.87 0.87 0.87Wind . . . . . . . . . . . . . . . . . . . . . . . . . . . . . . . . . . 3.17 5.47 6.80 7.12 9.03 9.15 10.19 14.83 13.80 16.72
Total . . . . . . . . . . . . . . . . . . . . . . . . . . . . . . . . 354.28 358.63 361.21 363.33 367.45 371.43 377.55 379.56 393.62 409.86
Cogenerators 4
CapabilityMunicipal Solid Waste . . . . . . . . . . . . . . . . . . . . . 0.41 0.43 0.43 0.44 0.43 0.44 0.45 0.44 0.45 0.47Biomass . . . . . . . . . . . . . . . . . . . . . . . . . . . . . . . 5.79 6.65 6.88 7.11 6.91 7.38 7.83 7.03 7.75 8.48
Total . . . . . . . . . . . . . . . . . . . . . . . . . . . . . . . . 6.19 7.07 7.31 7.54 7.34 7.82 8.28 7.47 8.21 8.95
Generation (billion kilowatthours)Municipal Solid Waste . . . . . . . . . . . . . . . . . . . . . 1.97 2.05 2.08 2.10 2.09 2.13 2.17 2.11 2.17 2.23Biomass . . . . . . . . . . . . . . . . . . . . . . . . . . . . . . . 39.58 45.49 47.05 48.56 47.25 50.37 53.41 48.07 52.90 57.76
Total . . . . . . . . . . . . . . . . . . . . . . . . . . . . . . . . 41.55 47.54 49.12 50.66 49.34 52.50 55.58 50.18 55.07 59.99
1Includes grid-connected utilities and nonutilities other than cogenerators. These nonutility facilities include small power producers, exempt wholesale generators and generators atindustrial and commercial facilities which do not produce steam for other uses.
2Includes hydrothermal resources only (hot water and steam).3Includes projections for energy crops after 2010.4Cogenerators are facilities whose primary function is not electricity production.Notes: Totals may not equal sum of components due to independent rounding. Net summer capability has been estimated for nonutility generators for AEO97. Net summer
capability is used to be consistent with electric utility capacity estimates. Data for electric utility capacity data are the most recently available data as of August 15, 1996. Additionalretirements are also determined on the basis of the size and age of the units. Therefore, capacity estimates may differ from other Energy Information Administration sources.
Sources: 1995 electric utility capability: Energy Information Administration (EIA), Form EIA-860 “Annual Electric Utility Report.” 1995 nonutility and cogenerator capability: FormEIA-867, “Annual Nonutility Power Producer Report.” 1995 generation: EIA, Annual Energy Review 1995, DOE/EIA-0384(95) (Washington, DC, July 1996). Projections: EIA, AEO97National Energy Modeling System runs LMAC97.D100396A, AEO97B.D100296K, and HMAC97.D100296A.
146 Energy Information Administration/ Annual Energy Outlook 1997

Economic Growth Case Comparisons
Table B18. Renewable Energy, Consumption by Sector and Source 1
(Quadrillion Btu per Year)
Sector and Source 1995
Projections
2005 2010 2015
LowEconomic
GrowthReference
HighEconomic
Growth
LowEconomic
GrowthReference
HighEconomic
Growth
LowEconomic
GrowthReference
HighEconomic
Growth
Marketed Renewable Energy 2
Residential . . . . . . . . . . . . . . . . . . . . . . . . . . . . . . 0.57 0.55 0.56 0.57 0.53 0.55 0.56 0.52 0.54 0.56Wood . . . . . . . . . . . . . . . . . . . . . . . . . . . . . . . . . 0.57 0.55 0.56 0.57 0.53 0.55 0.56 0.52 0.54 0.56
Commercial 3 . . . . . . . . . . . . . . . . . . . . . . . . . . . . 0.00 0.00 0.00 0.00 0.00 0.00 0.00 0.00 0.00 0.00Biomass . . . . . . . . . . . . . . . . . . . . . . . . . . . . . . . 0.00 0.00 0.00 0.00 0.00 0.00 0.00 0.00 0.00 0.00
Industrial 4 . . . . . . . . . . . . . . . . . . . . . . . . . . . . . . 1.74 2.02 2.12 2.21 2.12 2.28 2.43 2.17 2.40 2.62Conventional Hydroelectric . . . . . . . . . . . . . . . . . . 0.03 0.03 0.03 0.03 0.03 0.03 0.03 0.03 0.03 0.03Municipal Solid Waste . . . . . . . . . . . . . . . . . . . . . 0.00 0.01 0.01 0.01 0.01 0.01 0.01 0.01 0.01 0.01Biomass . . . . . . . . . . . . . . . . . . . . . . . . . . . . . . . 1.70 1.98 2.08 2.17 2.08 2.24 2.39 2.13 2.36 2.58
Transportation . . . . . . . . . . . . . . . . . . . . . . . . . . . 0.08 0.10 0.10 0.10 0.10 0.10 0.14 0.13 0.15 0.20Ethanol used in E855 . . . . . . . . . . . . . . . . . . . . . . 0.00 0.02 0.02 0.02 0.06 0.06 0.06 0.08 0.09 0.09Ethanol used in Gasoline Blending . . . . . . . . . . . . 0.08 0.08 0.08 0.08 0.05 0.04 0.07 0.05 0.07 0.11
Electric Generators 6 . . . . . . . . . . . . . . . . . . . . . . 3.99 4.14 4.18 4.24 4.28 4.36 4.45 4.45 4.68 4.90Conventional Hydroelectric . . . . . . . . . . . . . . . . . . 3.18 3.12 3.12 3.12 3.13 3.13 3.13 3.13 3.13 3.13Geothermal . . . . . . . . . . . . . . . . . . . . . . . . . . . . . 0.39 0.49 0.52 0.56 0.53 0.58 0.61 0.58 0.69 0.76Municipal Solid Waste . . . . . . . . . . . . . . . . . . . . . 0.31 0.36 0.37 0.37 0.41 0.43 0.44 0.44 0.46 0.48Biomass . . . . . . . . . . . . . . . . . . . . . . . . . . . . . . . 0.07 0.09 0.10 0.09 0.10 0.11 0.14 0.13 0.23 0.33Solar Thermal . . . . . . . . . . . . . . . . . . . . . . . . . . . 0.01 0.01 0.01 0.01 0.01 0.01 0.01 0.02 0.02 0.02Solar Photovoltaic . . . . . . . . . . . . . . . . . . . . . . . . 0.00 0.00 0.00 0.00 0.00 0.00 0.00 0.01 0.01 0.01Wind . . . . . . . . . . . . . . . . . . . . . . . . . . . . . . . . . . 0.03 0.06 0.07 0.07 0.09 0.09 0.10 0.15 0.14 0.17
Total Marketed Renewable Energy . . . . . . . . . . . 6.37 6.81 6.96 7.12 7.04 7.29 7.58 7.28 7.77 8.28
Non-Marketed Renewable Energy 7
Selected Consumption
Residential . . . . . . . . . . . . . . . . . . . . . . . . . . . . . . 0.02 0.05 0.05 0.05 0.06 0.06 0.07 0.08 0.08 0.09Solar Hot Water Heating . . . . . . . . . . . . . . . . . . . 0.01 0.01 0.01 0.01 0.01 0.01 0.01 0.01 0.01 0.01Geothermal Heat Pumps . . . . . . . . . . . . . . . . . . . 0.01 0.04 0.04 0.04 0.05 0.05 0.05 0.07 0.07 0.08
Commercial . . . . . . . . . . . . . . . . . . . . . . . . . . . . . 0.01 0.03 0.03 0.03 0.03 0.03 0.03 0.04 0.04 0.04Solar Thermal . . . . . . . . . . . . . . . . . . . . . . . . . . . 0.01 0.03 0.03 0.03 0.03 0.03 0.03 0.04 0.04 0.04
1Actual heat rates used to determine fuel consumption for all renewable fuels except hydropower, solar, and wind. Consumption at hydroelectric, solar, and wind facilitiesdetermined by using the fossil fuel equivalent of 10,280 Btu per kilowatthour.
2Includes nonelectric renewable energy groups for which the energy source is bought and sold in the marketplace, although all transactions may not necessarily be marketed, andmarketed renewable energy inputs for electricity entering the marketplace on the electric power grid.
3Value is less than 0.005 quadrillion Btu per year and rounds to zero.4Includes all electricity production by industrial and other cogenerators for the grid and for own use.5Excludes motor gasoline component of E85.6Includes renewable energy delivered to the grid from electric utilities and nonutilities. Renewable energy used in generating electricity for own use is included in the individual
sectoral electricity energy consumption values.7Includes selected renewable energy consumption data for which the energy is not bought or sold, either directly or indirectly as an input to marketed energy. The Energy
Information Administration does not estimate or project total consumption of nonmarketed renewable energy.Btu = British thermal unit.Notes: Totals may not equal sum of components due to independent rounding.Sources: 1995 electric generators: Energy Information Administration (EIA), Form EIA-860, “Annual Electric Utility Report,” and EIA, Form EIA-867, “Annual Nonutility Power
Producer Report.” 1995 ethanol: EIA, Petroleum Supply Annual 1995, DOE/EIA-0340(95/1) (Washington, DC, May 1996). Other 1995: EIA, Office of Integrated Analysis andForecasting. Projections: EIA, AEO97 National Energy Modeling System runs LMAC97.D100396A, AEO97B.D100296K, and HMAC97.D100296A.
Energy Information Administration/ Annual Energy Outlook 1997 147
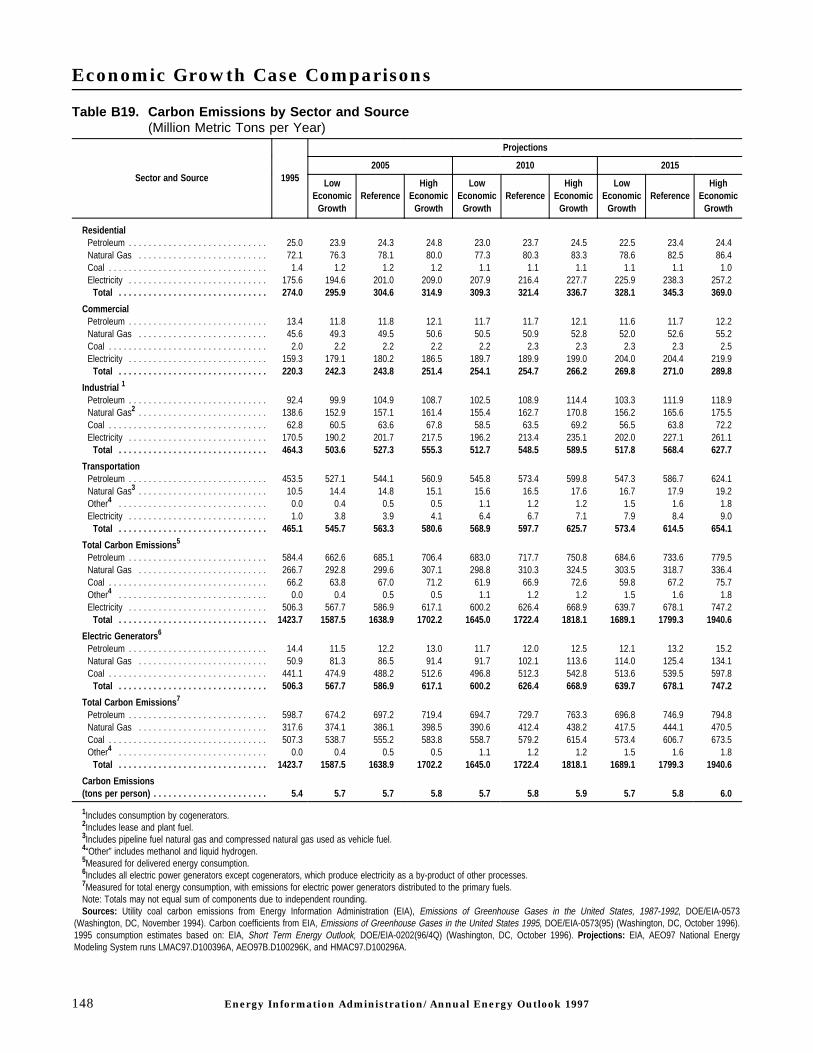
Economic Growth Case Comparisons
Table B19. Carbon Emissions by Sector and Source(Million Metric Tons per Year)
Sector and Source 1995
Projections
2005 2010 2015
LowEconomic
GrowthReference
HighEconomic
Growth
LowEconomic
GrowthReference
HighEconomic
Growth
LowEconomic
GrowthReference
HighEconomic
Growth
ResidentialPetroleum . . . . . . . . . . . . . . . . . . . . . . . . . . . . 25.0 23.9 24.3 24.8 23.0 23.7 24.5 22.5 23.4 24.4Natural Gas . . . . . . . . . . . . . . . . . . . . . . . . . . 72.1 76.3 78.1 80.0 77.3 80.3 83.3 78.6 82.5 86.4Coal . . . . . . . . . . . . . . . . . . . . . . . . . . . . . . . . 1.4 1.2 1.2 1.2 1.1 1.1 1.1 1.1 1.1 1.0Electricity . . . . . . . . . . . . . . . . . . . . . . . . . . . . 175.6 194.6 201.0 209.0 207.9 216.4 227.7 225.9 238.3 257.2
Total . . . . . . . . . . . . . . . . . . . . . . . . . . . . . . 274.0 295.9 304.6 314.9 309.3 321.4 336.7 328.1 345.3 369.0
CommercialPetroleum . . . . . . . . . . . . . . . . . . . . . . . . . . . . 13.4 11.8 11.8 12.1 11.7 11.7 12.1 11.6 11.7 12.2Natural Gas . . . . . . . . . . . . . . . . . . . . . . . . . . 45.6 49.3 49.5 50.6 50.5 50.9 52.8 52.0 52.6 55.2Coal . . . . . . . . . . . . . . . . . . . . . . . . . . . . . . . . 2.0 2.2 2.2 2.2 2.2 2.3 2.3 2.3 2.3 2.5Electricity . . . . . . . . . . . . . . . . . . . . . . . . . . . . 159.3 179.1 180.2 186.5 189.7 189.9 199.0 204.0 204.4 219.9
Total . . . . . . . . . . . . . . . . . . . . . . . . . . . . . . 220.3 242.3 243.8 251.4 254.1 254.7 266.2 269.8 271.0 289.8
Industrial 1
Petroleum . . . . . . . . . . . . . . . . . . . . . . . . . . . . 92.4 99.9 104.9 108.7 102.5 108.9 114.4 103.3 111.9 118.9Natural Gas2 . . . . . . . . . . . . . . . . . . . . . . . . . . 138.6 152.9 157.1 161.4 155.4 162.7 170.8 156.2 165.6 175.5Coal . . . . . . . . . . . . . . . . . . . . . . . . . . . . . . . . 62.8 60.5 63.6 67.8 58.5 63.5 69.2 56.5 63.8 72.2Electricity . . . . . . . . . . . . . . . . . . . . . . . . . . . . 170.5 190.2 201.7 217.5 196.2 213.4 235.1 202.0 227.1 261.1
Total . . . . . . . . . . . . . . . . . . . . . . . . . . . . . . 464.3 503.6 527.3 555.3 512.7 548.5 589.5 517.8 568.4 627.7
TransportationPetroleum . . . . . . . . . . . . . . . . . . . . . . . . . . . . 453.5 527.1 544.1 560.9 545.8 573.4 599.8 547.3 586.7 624.1Natural Gas3 . . . . . . . . . . . . . . . . . . . . . . . . . . 10.5 14.4 14.8 15.1 15.6 16.5 17.6 16.7 17.9 19.2Other4 . . . . . . . . . . . . . . . . . . . . . . . . . . . . . . 0.0 0.4 0.5 0.5 1.1 1.2 1.2 1.5 1.6 1.8Electricity . . . . . . . . . . . . . . . . . . . . . . . . . . . . 1.0 3.8 3.9 4.1 6.4 6.7 7.1 7.9 8.4 9.0
Total . . . . . . . . . . . . . . . . . . . . . . . . . . . . . . 465.1 545.7 563.3 580.6 568.9 597.7 625.7 573.4 614.5 654.1
Total Carbon Emissions 5
Petroleum . . . . . . . . . . . . . . . . . . . . . . . . . . . . 584.4 662.6 685.1 706.4 683.0 717.7 750.8 684.6 733.6 779.5Natural Gas . . . . . . . . . . . . . . . . . . . . . . . . . . 266.7 292.8 299.6 307.1 298.8 310.3 324.5 303.5 318.7 336.4Coal . . . . . . . . . . . . . . . . . . . . . . . . . . . . . . . . 66.2 63.8 67.0 71.2 61.9 66.9 72.6 59.8 67.2 75.7Other4 . . . . . . . . . . . . . . . . . . . . . . . . . . . . . . 0.0 0.4 0.5 0.5 1.1 1.2 1.2 1.5 1.6 1.8Electricity . . . . . . . . . . . . . . . . . . . . . . . . . . . . 506.3 567.7 586.9 617.1 600.2 626.4 668.9 639.7 678.1 747.2
Total . . . . . . . . . . . . . . . . . . . . . . . . . . . . . . 1423.7 1587.5 1638.9 1702.2 1645.0 1722.4 1818.1 1689.1 1799.3 1940.6
Electric Generators 6
Petroleum . . . . . . . . . . . . . . . . . . . . . . . . . . . . 14.4 11.5 12.2 13.0 11.7 12.0 12.5 12.1 13.2 15.2Natural Gas . . . . . . . . . . . . . . . . . . . . . . . . . . 50.9 81.3 86.5 91.4 91.7 102.1 113.6 114.0 125.4 134.1Coal . . . . . . . . . . . . . . . . . . . . . . . . . . . . . . . . 441.1 474.9 488.2 512.6 496.8 512.3 542.8 513.6 539.5 597.8
Total . . . . . . . . . . . . . . . . . . . . . . . . . . . . . . 506.3 567.7 586.9 617.1 600.2 626.4 668.9 639.7 678.1 747.2
Total Carbon Emissions 7
Petroleum . . . . . . . . . . . . . . . . . . . . . . . . . . . . 598.7 674.2 697.2 719.4 694.7 729.7 763.3 696.8 746.9 794.8Natural Gas . . . . . . . . . . . . . . . . . . . . . . . . . . 317.6 374.1 386.1 398.5 390.6 412.4 438.2 417.5 444.1 470.5Coal . . . . . . . . . . . . . . . . . . . . . . . . . . . . . . . . 507.3 538.7 555.2 583.8 558.7 579.2 615.4 573.4 606.7 673.5Other4 . . . . . . . . . . . . . . . . . . . . . . . . . . . . . . 0.0 0.4 0.5 0.5 1.1 1.2 1.2 1.5 1.6 1.8
Total . . . . . . . . . . . . . . . . . . . . . . . . . . . . . . 1423.7 1587.5 1638.9 1702.2 1645.0 1722.4 1818.1 1689.1 1799.3 1940.6
Carbon Emissions(tons per person) . . . . . . . . . . . . . . . . . . . . . . . 5.4 5.7 5.7 5.8 5.7 5.8 5.9 5.7 5.8 6.0
1Includes consumption by cogenerators.2Includes lease and plant fuel.3Includes pipeline fuel natural gas and compressed natural gas used as vehicle fuel.4“Other” includes methanol and liquid hydrogen.5Measured for delivered energy consumption.6Includes all electric power generators except cogenerators, which produce electricity as a by-product of other processes.7Measured for total energy consumption, with emissions for electric power generators distributed to the primary fuels.Note: Totals may not equal sum of components due to independent rounding.Sources: Utility coal carbon emissions from Energy Information Administration (EIA), Emissions of Greenhouse Gases in the United States, 1987-1992, DOE/EIA-0573
(Washington, DC, November 1994). Carbon coefficients from EIA, Emissions of Greenhouse Gases in the United States 1995, DOE/EIA-0573(95) (Washington, DC, October 1996).1995 consumption estimates based on: EIA, Short Term Energy Outlook, DOE/EIA-0202(96/4Q) (Washington, DC, October 1996). Projections: EIA, AEO97 National EnergyModeling System runs LMAC97.D100396A, AEO97B.D100296K, and HMAC97.D100296A.
148 Energy Information Administration/ Annual Energy Outlook 1997

Economic Growth Case Comparisons
Table B20. Macroeconomic Indicators(Billion 1992 Chain-Weighted Dollars, Unless Otherwise Noted)
Indicators 1995
Projections
2005 2010 2015
LowEconomic
GrowthReference
HighEconomic
Growth
LowEconomic
GrowthReference
HighEconomic
Growth
LowEconomic
GrowthReference
HighEconomic
Growth
GDP Implicit Price Deflator(index 1992=1.000) . . . . . . . . . . . . . . . . . . . . . . . . . 1.076 1.653 1.411 1.314 2.136 1.667 1.479 2.779 1.986 1.675
Real Gross Domestic Product . . . . . . . . . . . . . . . . 6739 8013 8390 8767 8562 9185 9797 8982 9880 10766Real Consumption . . . . . . . . . . . . . . . . . . . . . . . . . . 4579 5483 5673 5861 5873 6220 6551 6188 6708 7208Real Investment . . . . . . . . . . . . . . . . . . . . . . . . . . . 1011 1226 1366 1502 1292 1487 1676 1333 1592 1846Real Government Spending . . . . . . . . . . . . . . . . . . . 1261 1320 1364 1409 1367 1440 1512 1395 1499 1600
Real Exports . . . . . . . . . . . . . . . . . . . . . . . . . . . . . . 775 1308 1395 1484 1560 1723 1884 1779 2037 2290Real Imports . . . . . . . . . . . . . . . . . . . . . . . . . . . . . . 889 1315 1395 1472 1519 1661 1796 1700 1921 2130Real Gross Domestic Product(1987 fixed-weighted dollars) . . . . . . . . . . . . . . . . . . 5677 6968 7317 7662 7553 8145 8719 7951 8817 9657
Real Disposable Personal Income(1987 fixed-weighted dollars) . . . . . . . . . . . . . . . . . 4047 4947 5113 5280 5332 5644 5950 5614 6109 6585
Index of Manufacturing Gross Output(index 1987=1.000) . . . . . . . . . . . . . . . . . . . . . . . . . 1.246 1.508 1.590 1.673 1.631 1.765 1.902 1.709 1.904 2.102
AA Utility Bond Rate (percent) . . . . . . . . . . . . . . . . . 7.76 8.40 6.27 4.71 8.25 6.11 4.56 8.31 6.16 4.56
90-Day U.S. Government Treasury Bill Rate(percent) . . . . . . . . . . . . . . . . . . . . . . . . . . . . . . . . . 5.49 5.77 4.31 3.23 5.64 4.15 3.01 5.56 4.04 2.82
Real Yield on Government 10 Year Bonds(percent) . . . . . . . . . . . . . . . . . . . . . . . . . . . . . . . . . 5.22 2.07 2.07 1.68 1.46 1.35 0.96 1.45 1.24 0.85Real 90-Day U.S. Government Treasury Bill Rate(percent) . . . . . . . . . . . . . . . . . . . . . . . . . . . . . . . . . 2.94 0.66 1.10 0.97 0.33 0.71 0.60 0.05 0.35 0.21Real Utility Bond Rate (percent) . . . . . . . . . . . . . . . . 5.21 3.28 3.06 2.45 2.93 2.67 2.15 2.80 2.46 1.96
Delivered Energy Intensity(thousand Btu per 1992 dollar of GDP)
Delivered Energy . . . . . . . . . . . . . . . . . . . . . . . . . . 10.11 9.49 9.35 9.25 9.14 8.94 8.81 8.83 8.58 8.40Total Energy . . . . . . . . . . . . . . . . . . . . . . . . . . . . . 13.50 12.53 12.33 12.20 12.07 11.76 11.59 11.62 11.23 11.03
Consumer Price Index (1982-84=1.00) . . . . . . . . . . . 1.52 2.43 2.08 1.94 3.19 2.49 2.21 4.20 3.01 2.54Employment Cost Index (June 1989=1.00) . . . . . . . . 1.22 1.95 1.66 1.56 2.51 1.99 1.81 3.24 2.39 2.09
Unemployment Rate (percent) . . . . . . . . . . . . . . . . . 5.59 5.71 5.64 5.57 5.74 5.70 5.75 5.70 5.67 5.71
Million UnitsTruck Deliveries, Light-Duty . . . . . . . . . . . . . . . . . . 6.10 6.75 7.03 7.29 6.80 7.32 7.78 6.96 7.73 8.45Unit Sales of Automobiles . . . . . . . . . . . . . . . . . . . 8.67 9.49 10.14 10.72 8.99 10.07 11.05 8.40 9.89 11.26
Millions of PeoplePopulation with Armed Forces Overseas . . . . . . . . . 263.6 279.9 287.1 293.8 288.3 298.9 308.7 297.0 311.2 324.3Population (aged 16 and over) . . . . . . . . . . . . . . . . 202.1 218.4 223.8 228.6 227.7 235.4 242.5 235.4 245.8 255.4Employment, Non-Agriculture . . . . . . . . . . . . . . . . . 116.1 134.4 138.6 142.4 143.4 149.9 155.7 149.6 158.6 166.8Employment, Manufacturing . . . . . . . . . . . . . . . . . . 18.2 17.5 18.1 18.8 17.0 18.0 18.8 16.2 17.4 18.5Labor Force . . . . . . . . . . . . . . . . . . . . . . . . . . . . . 132.3 145.9 149.7 153.5 151.8 157.3 162.8 153.6 161.1 168.6
GDP = Gross domestic product.Btu = British thermal unit.Sources: 1995: Data Resources Incorporated (DRI), DRI Trend0296. Projections: Energy Information Administration, AEO97 National Energy Modeling System runs
LMAC97.D100396A, AEO97B.D100296K, and HMAC97.D100296A.
Energy Information Administration/ Annual Energy Outlook 1997 149
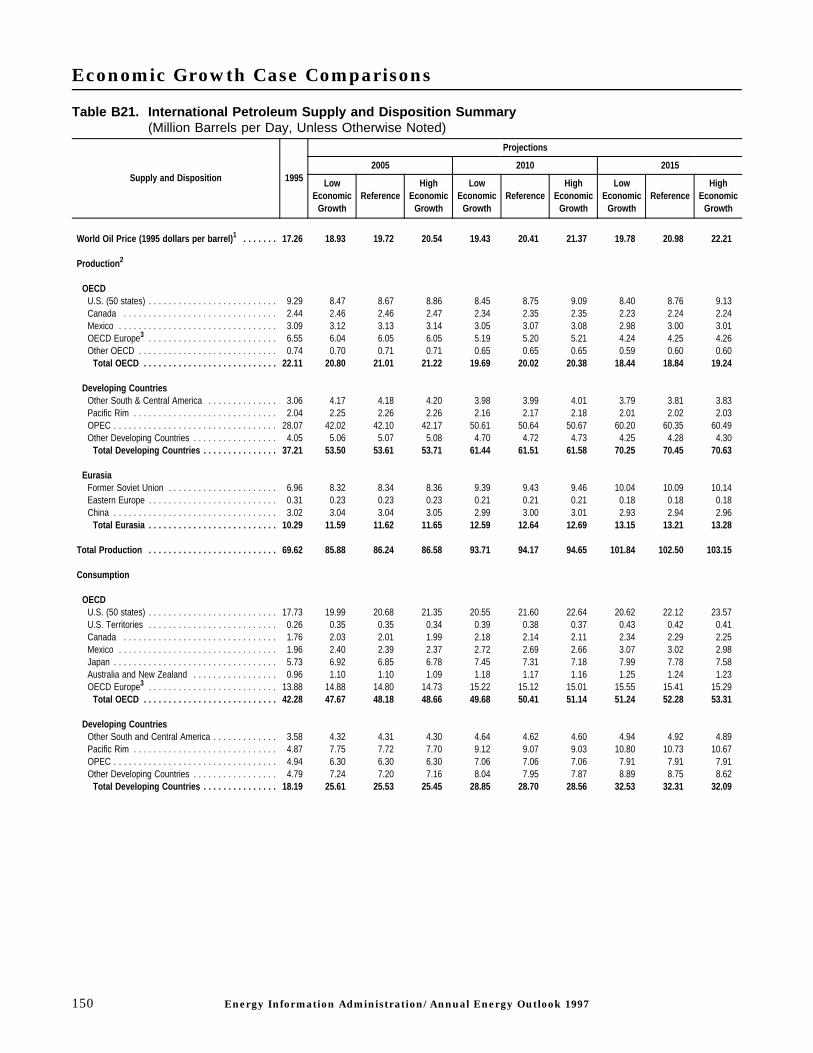
Economic Growth Case Comparisons
Table B21. International Petroleum Supply and Disposition Summary(Million Barrels per Day, Unless Otherwise Noted)
Supply and Disposition 1995
Projections
2005 2010 2015
LowEconomic
GrowthReference
HighEconomic
Growth
LowEconomic
GrowthReference
HighEconomic
Growth
LowEconomic
GrowthReference
HighEconomic
Growth
World Oil Price (1995 dollars per barrel) 1 . . . . . . . 17.26 18.93 19.72 20.54 19.43 20.41 21.37 19.78 20.98 22.21
Production 2
OECDU.S. (50 states) . . . . . . . . . . . . . . . . . . . . . . . . . . 9.29 8.47 8.67 8.86 8.45 8.75 9.09 8.40 8.76 9.13Canada . . . . . . . . . . . . . . . . . . . . . . . . . . . . . . . 2.44 2.46 2.46 2.47 2.34 2.35 2.35 2.23 2.24 2.24Mexico . . . . . . . . . . . . . . . . . . . . . . . . . . . . . . . . 3.09 3.12 3.13 3.14 3.05 3.07 3.08 2.98 3.00 3.01OECD Europe3 . . . . . . . . . . . . . . . . . . . . . . . . . . 6.55 6.04 6.05 6.05 5.19 5.20 5.21 4.24 4.25 4.26Other OECD . . . . . . . . . . . . . . . . . . . . . . . . . . . . 0.74 0.70 0.71 0.71 0.65 0.65 0.65 0.59 0.60 0.60
Total OECD . . . . . . . . . . . . . . . . . . . . . . . . . . . 22.11 20.80 21.01 21.22 19.69 20.02 20.38 18.44 18.84 19.24
Developing CountriesOther South & Central America . . . . . . . . . . . . . . 3.06 4.17 4.18 4.20 3.98 3.99 4.01 3.79 3.81 3.83Pacific Rim . . . . . . . . . . . . . . . . . . . . . . . . . . . . . 2.04 2.25 2.26 2.26 2.16 2.17 2.18 2.01 2.02 2.03OPEC . . . . . . . . . . . . . . . . . . . . . . . . . . . . . . . . . 28.07 42.02 42.10 42.17 50.61 50.64 50.67 60.20 60.35 60.49Other Developing Countries . . . . . . . . . . . . . . . . . 4.05 5.06 5.07 5.08 4.70 4.72 4.73 4.25 4.28 4.30
Total Developing Countries . . . . . . . . . . . . . . . 37.21 53.50 53.61 53.71 61.44 61.51 61.58 70.25 70.45 70.63
EurasiaFormer Soviet Union . . . . . . . . . . . . . . . . . . . . . . 6.96 8.32 8.34 8.36 9.39 9.43 9.46 10.04 10.09 10.14Eastern Europe . . . . . . . . . . . . . . . . . . . . . . . . . . 0.31 0.23 0.23 0.23 0.21 0.21 0.21 0.18 0.18 0.18China . . . . . . . . . . . . . . . . . . . . . . . . . . . . . . . . . 3.02 3.04 3.04 3.05 2.99 3.00 3.01 2.93 2.94 2.96
Total Eurasia . . . . . . . . . . . . . . . . . . . . . . . . . . 10.29 11.59 11.62 11.65 12.59 12.64 12.69 13.15 13.21 13.28
Total Production . . . . . . . . . . . . . . . . . . . . . . . . . . 69.62 85.88 86.24 86.58 93.71 94.17 94.65 101.84 102.50 103.15
Consumption
OECDU.S. (50 states) . . . . . . . . . . . . . . . . . . . . . . . . . . 17.73 19.99 20.68 21.35 20.55 21.60 22.64 20.62 22.12 23.57U.S. Territories . . . . . . . . . . . . . . . . . . . . . . . . . . 0.26 0.35 0.35 0.34 0.39 0.38 0.37 0.43 0.42 0.41Canada . . . . . . . . . . . . . . . . . . . . . . . . . . . . . . . 1.76 2.03 2.01 1.99 2.18 2.14 2.11 2.34 2.29 2.25Mexico . . . . . . . . . . . . . . . . . . . . . . . . . . . . . . . . 1.96 2.40 2.39 2.37 2.72 2.69 2.66 3.07 3.02 2.98Japan . . . . . . . . . . . . . . . . . . . . . . . . . . . . . . . . . 5.73 6.92 6.85 6.78 7.45 7.31 7.18 7.99 7.78 7.58Australia and New Zealand . . . . . . . . . . . . . . . . . 0.96 1.10 1.10 1.09 1.18 1.17 1.16 1.25 1.24 1.23OECD Europe3 . . . . . . . . . . . . . . . . . . . . . . . . . . 13.88 14.88 14.80 14.73 15.22 15.12 15.01 15.55 15.41 15.29
Total OECD . . . . . . . . . . . . . . . . . . . . . . . . . . . 42.28 47.67 48.18 48.66 49.68 50.41 51.14 51.24 52.28 53.31
Developing CountriesOther South and Central America . . . . . . . . . . . . . 3.58 4.32 4.31 4.30 4.64 4.62 4.60 4.94 4.92 4.89Pacific Rim . . . . . . . . . . . . . . . . . . . . . . . . . . . . . 4.87 7.75 7.72 7.70 9.12 9.07 9.03 10.80 10.73 10.67OPEC . . . . . . . . . . . . . . . . . . . . . . . . . . . . . . . . . 4.94 6.30 6.30 6.30 7.06 7.06 7.06 7.91 7.91 7.91Other Developing Countries . . . . . . . . . . . . . . . . . 4.79 7.24 7.20 7.16 8.04 7.95 7.87 8.89 8.75 8.62
Total Developing Countries . . . . . . . . . . . . . . . 18.19 25.61 25.53 25.45 28.85 28.70 28.56 32.53 32.31 32.09
150 Energy Information Administration/ Annual Energy Outlook 1997

Economic Growth Case Comparisons
Table B21. International Petroleum Supply and Disposition Summary (Continued)(Million Barrels per Day, Unless Otherwise Noted)
Supply and Disposition 1995
Projections
2005 2010 2015
LowEconomic
GrowthReference
HighEconomic
Growth
LowEconomic
GrowthReference
HighEconomic
Growth
LowEconomic
GrowthReference
HighEconomic
Growth
EurasiaFormer Soviet Union . . . . . . . . . . . . . . . . . . . . . . 4.75 5.82 5.80 5.78 6.78 6.74 6.70 7.71 7.65 7.60Eastern Europe . . . . . . . . . . . . . . . . . . . . . . . . . . 1.39 1.52 1.51 1.51 1.73 1.72 1.72 1.97 1.96 1.96China . . . . . . . . . . . . . . . . . . . . . . . . . . . . . . . . . 3.31 5.56 5.52 5.48 6.96 6.89 6.83 8.70 8.59 8.49
Total Eurasia . . . . . . . . . . . . . . . . . . . . . . . . . . 9.46 12.90 12.84 12.77 15.47 15.36 15.25 18.37 18.21 18.05
Total Consumption . . . . . . . . . . . . . . . . . . . . . . . . 69.92 86.18 86.54 86.88 94.01 94.47 94.95 102.14 102.80 103.45
Non-OPEC Production . . . . . . . . . . . . . . . . . . . . . . . 41.55 43.87 44.14 44.41 43.10 43.53 43.98 41.64 42.15 42.67Net Eurasia Exports . . . . . . . . . . . . . . . . . . . . . . . . . 0.83 -1.31 -1.22 -1.12 -2.88 -2.72 -2.56 -5.23 -4.99 -4.77OPEC Market Share . . . . . . . . . . . . . . . . . . . . . . . . 0.40 0.49 0.49 0.49 0.54 0.54 0.54 0.59 0.59 0.59
1Average refiner acquisition cost of imported crude oil.2Includes production of crude oil (including lease condensates), natural gas plant liquids, other hydrogen and hydrocarbons for refinery feedstocks, alcohol, liquids produced from
coal and other sources, and refinery gains.3OECD Europe includes the unified Germany.OECD = Organization for Economic Cooperation and Development - Australia, Austria, Belgium, Canada, Denmark, Finland, France, Germany, Greece, Iceland, Ireland, Italy,
Japan, Luxembourg, Mexico, the Netherlands, New Zealand, Norway, Portugal, Spain, Sweden, Switzerland, Turkey, the United Kingdom, and the United States (including territories).Pacific Rim = Hong Kong, Malaysia, Philippines, Singapore, South Korea, Taiwan, and Thailand.OPEC = Organization of Petroleum Exporting Countries - Algeria, Gabon, Indonesia, Iran, Iraq, Kuwait, Libya, Nigeria, Qatar, Saudi Arabia, the United Arab Emirates, and
Venezuela.Eurasia = Albania, Bulgaria, China, Czech Republic, Hungary, Poland, Romania, Slovak Republic, the Former Soviet Union, and the Former Yugoslavia.Note: Totals may not equal sum of components due to independent rounding.Sources: 1995 data derived from: Energy Information Administration (EIA), Short-Term Energy Outlook, DOE/EIA-0202(96/4Q) (Washington, DC, October 1996). Projections: EIA,
AEO97 National Energy Modeling System runs LMAC97.D100396A, AEO97B.D100296K, and HMAC97.D100296A.
Energy Information Administration/ Annual Energy Outlook 1997 151

Appendix C
Oil Price Case ComparisonsTable C1. Total Energy Supply and Disposition Summary
(Quadrillion Btu per Year, Unless Otherwise Noted)
Supply, Disposition, and Prices 1995
Projections
2005 2010 2015
LowWorld Oil
PriceReference
HighWorld Oil
Price
LowWorld Oil
PriceReference
HighWorld Oil
Price
LowWorld Oil
PriceReference
HighWorld Oil
Price
ProductionCrude Oil and Lease Condensate . . . . . . . . . . . . . 13.89 9.36 11.62 13.56 8.62 11.41 13.82 8.40 11.08 14.59Natural Gas Plant Liquids . . . . . . . . . . . . . . . . . . 2.37 2.90 3.01 3.06 3.12 3.04 3.30 3.34 3.47 3.57Dry Natural Gas . . . . . . . . . . . . . . . . . . . . . . . . . 19.01 22.46 23.30 23.75 24.12 24.93 25.61 25.92 26.83 27.68Coal . . . . . . . . . . . . . . . . . . . . . . . . . . . . . . . . . . 21.98 24.11 23.99 24.17 25.07 25.16 25.30 26.18 26.46 26.60Nuclear Power . . . . . . . . . . . . . . . . . . . . . . . . . . 7.19 6.98 6.98 6.98 6.55 6.55 6.55 4.79 4.79 4.79Renewable Energy1 . . . . . . . . . . . . . . . . . . . . . . . 6.29 6.88 6.88 6.87 7.20 7.25 7.25 7.56 7.71 7.78Other2 . . . . . . . . . . . . . . . . . . . . . . . . . . . . . . . . 1.34 0.40 0.42 0.43 0.41 0.39 0.44 0.43 0.42 0.48
Total . . . . . . . . . . . . . . . . . . . . . . . . . . . . . . . 72.08 73.10 76.19 78.82 75.10 78.73 82.28 76.62 80.75 85.49
ImportsCrude Oil 3 . . . . . . . . . . . . . . . . . . . . . . . . . . . . . 15.69 24.46 20.72 19.20 25.35 21.19 19.39 25.61 22.23 19.26Petroleum Products4 . . . . . . . . . . . . . . . . . . . . . . 3.19 7.44 6.79 5.62 9.46 8.23 6.55 10.77 8.35 6.31Natural Gas . . . . . . . . . . . . . . . . . . . . . . . . . . . . 2.90 3.98 3.98 3.98 4.23 4.23 4.23 4.55 4.55 4.55Other Imports5 . . . . . . . . . . . . . . . . . . . . . . . . . . 0.60 0.65 0.67 0.65 0.67 0.67 0.67 0.64 0.64 0.64
Total . . . . . . . . . . . . . . . . . . . . . . . . . . . . . . . 22.38 36.53 32.16 29.45 39.71 34.31 30.83 41.57 35.77 30.76
ExportsPetroleum6 . . . . . . . . . . . . . . . . . . . . . . . . . . . . . 2.02 2.22 1.92 2.11 2.29 1.94 2.23 2.22 1.97 2.25Natural Gas . . . . . . . . . . . . . . . . . . . . . . . . . . . . 0.16 0.21 0.21 0.21 0.22 0.22 0.22 0.22 0.22 0.22Coal . . . . . . . . . . . . . . . . . . . . . . . . . . . . . . . . . . 2.27 2.60 2.59 2.59 2.86 2.82 2.82 3.04 3.04 3.04
Total . . . . . . . . . . . . . . . . . . . . . . . . . . . . . . . 4.45 5.03 4.73 4.92 5.38 4.98 5.27 5.49 5.24 5.51
Discrepancy 7 . . . . . . . . . . . . . . . . . . . . . . . . . . . . 0.91 -0.51 -0.26 -0.25 -0.59 -0.17 -0.39 -0.77 -0.40 -0.40
ConsumptionPetroleum Products8 . . . . . . . . . . . . . . . . . . . . . . 34.92 41.94 40.46 39.58 44.19 42.24 40.98 45.66 43.26 41.65Natural Gas . . . . . . . . . . . . . . . . . . . . . . . . . . . . 22.18 26.09 26.94 27.39 27.92 28.77 29.46 30.04 30.97 31.84Coal . . . . . . . . . . . . . . . . . . . . . . . . . . . . . . . . . . 19.95 21.82 21.72 21.93 22.57 22.68 22.81 23.51 23.76 23.92Nuclear Power . . . . . . . . . . . . . . . . . . . . . . . . . . 7.19 6.98 6.98 6.98 6.55 6.55 6.55 4.79 4.79 4.79Renewable Energy1 . . . . . . . . . . . . . . . . . . . . . . . 6.30 6.89 6.88 6.88 7.21 7.25 7.26 7.56 7.71 7.78Other9 . . . . . . . . . . . . . . . . . . . . . . . . . . . . . . . . 0.39 0.36 0.38 0.36 0.39 0.39 0.39 0.37 0.37 0.37
Total . . . . . . . . . . . . . . . . . . . . . . . . . . . . . . . . 90.93 104.09 103.36 103.11 108.84 107.89 107.44 111.93 110.87 110.35
Net Imports - Petroleum . . . . . . . . . . . . . . . . . . . 16.87 29.68 25.59 22.70 32.52 27.48 23.70 34.16 28.60 23.33
Prices (1995 dollars per unit)World Oil Price (dollars per barrel)10 . . . . . . . . . . . 17.26 14.08 19.72 24.13 14.03 20.41 26.44 13.99 20.98 28.23Gas Wellhead Price (dollars per Mcf)11 . . . . . . . . . 1.61 1.86 1.94 2.02 1.92 2.01 2.07 2.12 2.13 2.16Coal Minemouth Price (dollars per ton) . . . . . . . . . 18.83 16.94 17.47 17.98 16.15 16.92 17.48 14.82 15.46 16.24
1Includes utility and nonutility grid-connected electricity from hydroelectric, wood and wood waste, municipal solid waste, other biomass, wind, photovoltaic and solar thermalsources; non-electric energy from renewable sources, such as active and passive solar systems, and wood; and both the ethanol and gasoline components of E85, but not theethanol components of blends less than 85 percent. Excludes nonmarketed renewable energy. See Table C18 for selected nonmarketed residential and commercial renewableenergy.
2Includes liquid hydrogen, methanol, supplemental natural gas, and some domestic inputs to refineries.3Includes imports of crude oil for the Strategic Petroleum Reserve.4Includes imports of finished petroleum products, imports of unfinished oils, alcohols, ethers, and blending components.5Includes coal, coal coke (net), and electricity (net).6Includes crude oil and petroleum products.7Balancing item. Includes unaccounted for supply, losses, gains, and net storage withdrawals.8Includes natural gas plant liquids, crude oil consumed as a fuel, and nonpetroleum based liquids for blending, such as ethanol.9Includes net electricity imports, methanol, and liquid hydrogen.10Average refiner acquisition cost for imported crude oil.11Represents lower 48 onshore and offshore supplies.Btu = British thermal unit.Mcf = Thousand cubic feet.Note: Totals may not equal sum of components due to independent rounding. Figures for 1995 may differ from published data due to internal conversion factors.Sources: 1995 natural gas price: Energy Information Administration (EIA), Natural Gas Monthly, DOE/EIA-0130(96/6) (Washington, DC, June 1996). 1995 natural gas supply
derived from: EIA, Natural Gas Annual 1995, DOE/EIA-0131(95) (Washington, DC November 1996). 1995 coal minemouth price, coal production, and exports derived from: EIA,Monthly Energy Review, DOE/EIA-0035(96/08) (Washington, DC, August 1996). Other 1995 values: EIA, Annual Energy Review 1995, DOE/EIA-0384(95) (Washington, DC, July1996). Projections: EIA, AEO97 National Energy Modeling System runs LWOP97.D100696A, AEO97B.D100296K, and HWOP97.D100296B.
152 Energy Information Administration/ Annual Energy Outlook 1997

Oil Price Case Comparisons
Table C2. Energy Consumption by Sector and Source(Quadrillion Btu per Year, Unless Otherwise Noted)
Sector and Source 1995
Projections
2005 2010 2015
LowWorld Oil
PriceReference
HighWorld Oil
Price
LowWorld Oil
PriceReference
HighWorld Oil
Price
LowWorld Oil
PriceReference
HighWorld Oil
Price
Energy Consumption
ResidentialDistillate Fuel . . . . . . . . . . . . . . . . . . . . . . . . . . . 0.85 0.81 0.78 0.76 0.78 0.75 0.72 0.76 0.73 0.70Kerosene . . . . . . . . . . . . . . . . . . . . . . . . . . . . . . 0.07 0.07 0.07 0.07 0.07 0.07 0.06 0.07 0.06 0.06Liquefied Petroleum Gas . . . . . . . . . . . . . . . . . . . 0.40 0.45 0.44 0.43 0.46 0.45 0.44 0.46 0.46 0.44
Petroleum Subtotal . . . . . . . . . . . . . . . . . . . . . . 1.32 1.33 1.29 1.26 1.30 1.26 1.22 1.29 1.25 1.20Natural Gas . . . . . . . . . . . . . . . . . . . . . . . . . . . . 5.01 5.46 5.43 5.41 5.61 5.57 5.55 5.75 5.73 5.72Coal . . . . . . . . . . . . . . . . . . . . . . . . . . . . . . . . . . 0.05 0.05 0.05 0.05 0.04 0.04 0.04 0.04 0.04 0.04Renewable Energy1 . . . . . . . . . . . . . . . . . . . . . . . 0.57 0.56 0.56 0.56 0.55 0.55 0.55 0.54 0.54 0.54Electricity . . . . . . . . . . . . . . . . . . . . . . . . . . . . . . 3.56 4.15 4.14 4.14 4.46 4.46 4.46 4.86 4.85 4.84
Delivered Energy . . . . . . . . . . . . . . . . . . . . . . . 10.51 11.54 11.46 11.41 11.97 11.89 11.82 12.48 12.41 12.34Electricity Related Losses . . . . . . . . . . . . . . . . . . 7.92 8.74 8.55 8.53 9.17 8.95 8.93 9.44 9.22 9.22
Total . . . . . . . . . . . . . . . . . . . . . . . . . . . . . . . . 18.43 20.27 20.02 19.94 21.14 20.83 20.75 21.92 21.63 21.56
CommercialDistillate Fuel . . . . . . . . . . . . . . . . . . . . . . . . . . . 0.41 0.38 0.36 0.35 0.38 0.35 0.34 0.38 0.34 0.33Residual Fuel . . . . . . . . . . . . . . . . . . . . . . . . . . . 0.17 0.13 0.13 0.13 0.14 0.14 0.14 0.14 0.14 0.14Kerosene . . . . . . . . . . . . . . . . . . . . . . . . . . . . . . 0.02 0.02 0.02 0.02 0.02 0.02 0.02 0.02 0.02 0.02Liquefied Petroleum Gas . . . . . . . . . . . . . . . . . . . 0.05 0.06 0.06 0.06 0.06 0.06 0.06 0.06 0.06 0.06Motor Gasoline2 . . . . . . . . . . . . . . . . . . . . . . . . . 0.03 0.03 0.03 0.03 0.03 0.03 0.03 0.02 0.02 0.02
Petroleum Subtotal . . . . . . . . . . . . . . . . . . . . . . 0.67 0.62 0.60 0.59 0.62 0.59 0.58 0.63 0.59 0.58Natural Gas . . . . . . . . . . . . . . . . . . . . . . . . . . . . 3.16 3.43 3.44 3.44 3.52 3.54 3.53 3.62 3.65 3.65Coal . . . . . . . . . . . . . . . . . . . . . . . . . . . . . . . . . . 0.08 0.08 0.08 0.08 0.09 0.09 0.09 0.09 0.09 0.09Renewable Energy3 . . . . . . . . . . . . . . . . . . . . . . . 0.00 0.00 0.00 0.00 0.00 0.00 0.00 0.00 0.00 0.00Electricity . . . . . . . . . . . . . . . . . . . . . . . . . . . . . . 3.23 3.72 3.71 3.71 3.92 3.91 3.91 4.17 4.16 4.15
Delivered Energy . . . . . . . . . . . . . . . . . . . . . . . 7.15 7.86 7.84 7.82 8.16 8.13 8.11 8.52 8.50 8.48Electricity Related Losses . . . . . . . . . . . . . . . . . . 7.18 7.84 7.67 7.64 8.05 7.85 7.83 8.11 7.91 7.90
Total . . . . . . . . . . . . . . . . . . . . . . . . . . . . . . . . 14.33 15.70 15.51 15.47 16.21 15.98 15.94 16.62 16.40 16.39
Industrial 4
Distillate Fuel . . . . . . . . . . . . . . . . . . . . . . . . . . . 1.15 1.39 1.39 1.38 1.48 1.47 1.47 1.56 1.55 1.55Liquefied Petroleum Gas . . . . . . . . . . . . . . . . . . . 2.01 2.30 2.20 2.11 2.41 2.28 2.16 2.52 2.35 2.20Petrochemical Feedstocks . . . . . . . . . . . . . . . . . . 1.16 1.36 1.30 1.24 1.43 1.35 1.27 1.50 1.40 1.29Residual Fuel . . . . . . . . . . . . . . . . . . . . . . . . . . . 0.34 0.43 0.31 0.27 0.48 0.33 0.26 0.51 0.35 0.25Motor Gasoline2 . . . . . . . . . . . . . . . . . . . . . . . . . 0.20 0.24 0.24 0.24 0.26 0.26 0.26 0.27 0.27 0.27Other Petroleum5 . . . . . . . . . . . . . . . . . . . . . . . . 3.83 4.66 4.33 3.98 4.78 4.43 3.97 4.93 4.48 3.93
Petroleum Subtotal . . . . . . . . . . . . . . . . . . . . . . 8.68 10.37 9.77 9.22 10.85 10.13 9.39 11.30 10.41 9.50Natural Gas6 . . . . . . . . . . . . . . . . . . . . . . . . . . . . 9.74 10.56 11.04 11.45 10.84 11.42 12.00 10.89 11.63 12.33Metallurgical Coal . . . . . . . . . . . . . . . . . . . . . . . . 0.88 0.69 0.69 0.69 0.62 0.62 0.62 0.55 0.55 0.55Steam Coal . . . . . . . . . . . . . . . . . . . . . . . . . . . . . 1.59 1.75 1.82 1.87 1.81 1.89 1.93 1.89 1.97 2.01Net Coal Coke Imports . . . . . . . . . . . . . . . . . . . . 0.03 0.11 0.11 0.11 0.13 0.13 0.13 0.15 0.15 0.15
Coal Subtotal . . . . . . . . . . . . . . . . . . . . . . . . . . 2.51 2.55 2.62 2.67 2.56 2.64 2.67 2.59 2.67 2.70Renewable Energy7 . . . . . . . . . . . . . . . . . . . . . . . 1.74 2.13 2.12 2.11 2.29 2.28 2.26 2.41 2.40 2.38Electricity . . . . . . . . . . . . . . . . . . . . . . . . . . . . . . 3.46 4.08 4.16 4.21 4.30 4.40 4.46 4.53 4.62 4.69
Delivered Energy . . . . . . . . . . . . . . . . . . . . . . . 26.12 29.68 29.70 29.67 30.84 30.87 30.78 31.72 31.73 31.60Electricity Related Losses . . . . . . . . . . . . . . . . . . 7.69 8.60 8.59 8.69 8.83 8.82 8.93 8.82 8.79 8.92
Total . . . . . . . . . . . . . . . . . . . . . . . . . . . . . . . . 33.81 38.28 38.28 38.35 39.66 39.69 39.71 40.54 40.51 40.52
Energy Information Administration/ Annual Energy Outlook 1997 153

Oil Price Case Comparisons
Table C2. Energy Consumption by Sector and Source (Continued)(Quadrillion Btu per Year, Unless Otherwise Noted)
Sector and Source 1995
Projections
2005 2010 2015
LowWorld Oil
PriceReference
HighWorld Oil
Price
LowWorld Oil
PriceReference
HighWorld Oil
Price
LowWorld Oil
PriceReference
HighWorld Oil
Price
TransportationDistillate Fuel . . . . . . . . . . . . . . . . . . . . . . . . . . . 4.42 5.47 5.46 5.45 5.80 5.78 5.76 6.03 6.00 5.97Jet Fuel 8 . . . . . . . . . . . . . . . . . . . . . . . . . . . . . . 3.13 4.30 4.26 4.23 4.72 4.67 4.62 5.00 4.95 4.89Motor Gasoline2 . . . . . . . . . . . . . . . . . . . . . . . . . 14.65 16.85 16.61 16.44 17.44 17.09 16.82 17.52 17.11 16.75Residual Fuel . . . . . . . . . . . . . . . . . . . . . . . . . . . 1.08 1.47 1.47 1.47 1.65 1.64 1.64 1.79 1.78 1.78Liquefied Petroleum Gas . . . . . . . . . . . . . . . . . . . 0.03 0.11 0.11 0.11 0.18 0.18 0.17 0.22 0.21 0.21Other Petroleum9 . . . . . . . . . . . . . . . . . . . . . . . . 0.26 0.31 0.31 0.31 0.33 0.33 0.33 0.34 0.34 0.34
Petroleum Subtotal . . . . . . . . . . . . . . . . . . . . . . 23.56 28.52 28.22 28.01 30.12 29.69 29.34 30.90 30.39 29.93Pipeline Fuel Natural Gas . . . . . . . . . . . . . . . . . . 0.72 0.83 0.84 0.85 0.88 0.88 0.89 0.93 0.93 0.96Compressed Natural Gas . . . . . . . . . . . . . . . . . . . 0.01 0.19 0.18 0.18 0.26 0.26 0.26 0.31 0.31 0.31Renewable Energy (E85)10 . . . . . . . . . . . . . . . . . 0.00 0.02 0.02 0.02 0.07 0.07 0.07 0.11 0.10 0.10Methanol 11 . . . . . . . . . . . . . . . . . . . . . . . . . . . . . 0.00 0.03 0.03 0.03 0.07 0.07 0.06 0.10 0.09 0.09Liquid Hydrogen . . . . . . . . . . . . . . . . . . . . . . . . . 0.00 0.00 0.00 0.00 0.00 0.00 0.00 0.00 0.00 0.00Electricity . . . . . . . . . . . . . . . . . . . . . . . . . . . . . . 0.02 0.08 0.08 0.08 0.14 0.14 0.14 0.17 0.17 0.17
Delivered Energy . . . . . . . . . . . . . . . . . . . . . . . 24.31 29.66 29.38 29.18 31.54 31.11 30.76 32.52 31.99 31.56Electricity Related Losses . . . . . . . . . . . . . . . . . . 0.04 0.17 0.17 0.17 0.29 0.28 0.28 0.33 0.32 0.32
Total . . . . . . . . . . . . . . . . . . . . . . . . . . . . . . . . 24.36 29.84 29.55 29.35 31.83 31.39 31.03 32.85 32.32 31.88
Delivered Energy Consumption for All SectorsDistillate Fuel . . . . . . . . . . . . . . . . . . . . . . . . . . . 6.82 8.05 7.98 7.95 8.44 8.35 8.29 8.74 8.62 8.55Kerosene . . . . . . . . . . . . . . . . . . . . . . . . . . . . . . 0.11 0.11 0.11 0.11 0.11 0.11 0.10 0.11 0.11 0.10Jet Fuel 8 . . . . . . . . . . . . . . . . . . . . . . . . . . . . . . 3.13 4.30 4.26 4.23 4.72 4.67 4.62 5.00 4.95 4.89Liquefied Petroleum Gas . . . . . . . . . . . . . . . . . . . 2.49 2.92 2.81 2.71 3.11 2.97 2.83 3.27 3.09 2.92Motor Gasoline2 . . . . . . . . . . . . . . . . . . . . . . . . . 14.87 17.11 16.88 16.71 17.72 17.38 17.11 17.82 17.40 17.04Petrochemical Feedstocks . . . . . . . . . . . . . . . . . . 1.16 1.36 1.30 1.24 1.43 1.35 1.27 1.50 1.40 1.29Residual Fuel . . . . . . . . . . . . . . . . . . . . . . . . . . . 1.58 2.04 1.92 1.87 2.27 2.11 2.04 2.44 2.27 2.17Other Petroleum12 . . . . . . . . . . . . . . . . . . . . . . . . 4.07 4.95 4.62 4.28 5.09 4.74 4.28 5.25 4.80 4.24
Petroleum Subtotal . . . . . . . . . . . . . . . . . . . . . . 34.24 40.84 39.88 39.09 42.89 41.67 40.54 44.12 42.63 41.21Natural Gas6 . . . . . . . . . . . . . . . . . . . . . . . . . . . . 18.64 20.46 20.93 21.33 21.12 21.68 22.23 21.51 22.26 22.97Metallurgical Coal . . . . . . . . . . . . . . . . . . . . . . . . 0.88 0.69 0.69 0.69 0.62 0.62 0.62 0.55 0.55 0.55Steam Coal . . . . . . . . . . . . . . . . . . . . . . . . . . . . . 1.73 1.88 1.95 2.00 1.95 2.02 2.06 2.02 2.10 2.14Net Coal Coke Imports . . . . . . . . . . . . . . . . . . . . 0.03 0.11 0.11 0.11 0.13 0.13 0.13 0.15 0.15 0.15
Coal Subtotal . . . . . . . . . . . . . . . . . . . . . . . . . . 2.64 2.68 2.75 2.80 2.69 2.77 2.80 2.72 2.80 2.84Renewable Energy13 . . . . . . . . . . . . . . . . . . . . . . 2.31 2.71 2.70 2.69 2.91 2.90 2.88 3.05 3.04 3.02Methanol 11 . . . . . . . . . . . . . . . . . . . . . . . . . . . . . 0.00 0.03 0.03 0.03 0.07 0.07 0.06 0.10 0.09 0.09Liquid Hydrogen . . . . . . . . . . . . . . . . . . . . . . . . . 0.00 0.00 0.00 0.00 0.00 0.00 0.00 0.00 0.00 0.00Electricity . . . . . . . . . . . . . . . . . . . . . . . . . . . . . . 10.26 12.03 12.09 12.14 12.82 12.91 12.96 13.73 13.80 13.85
Delivered Energy . . . . . . . . . . . . . . . . . . . . . . . 68.10 78.74 78.38 78.08 82.51 81.99 81.47 85.23 84.62 83.98Electricity Related Losses . . . . . . . . . . . . . . . . . . 22.83 25.35 24.98 25.03 26.33 25.90 25.97 26.70 26.24 26.37
Total . . . . . . . . . . . . . . . . . . . . . . . . . . . . . . . . 90.93 104.09 103.36 103.11 108.84 107.89 107.44 111.93 110.87 110.35
Electric Generators 14
Distillate Fuel . . . . . . . . . . . . . . . . . . . . . . . . . . . 0.08 0.14 0.12 0.13 0.18 0.14 0.14 0.22 0.15 0.16Residual Fuel . . . . . . . . . . . . . . . . . . . . . . . . . . . 0.60 0.97 0.46 0.36 1.13 0.43 0.30 1.32 0.48 0.28
Petroleum Subtotal . . . . . . . . . . . . . . . . . . . . . . 0.68 1.10 0.58 0.49 1.30 0.57 0.44 1.54 0.63 0.44Natural Gas . . . . . . . . . . . . . . . . . . . . . . . . . . . . 3.54 5.63 6.01 6.05 6.80 7.09 7.23 8.53 8.71 8.86Steam Coal . . . . . . . . . . . . . . . . . . . . . . . . . . . . . 17.31 19.15 18.97 19.13 19.88 19.91 20.01 20.79 20.96 21.08Nuclear Power . . . . . . . . . . . . . . . . . . . . . . . . . . 7.19 6.98 6.98 6.98 6.55 6.55 6.55 4.79 4.79 4.79Renewable Energy15 . . . . . . . . . . . . . . . . . . . . . . 3.99 4.18 4.18 4.19 4.30 4.36 4.37 4.51 4.67 4.76Electricity Imports . . . . . . . . . . . . . . . . . . . . . . . . 0.39 0.34 0.36 0.34 0.32 0.32 0.32 0.28 0.28 0.28
Total . . . . . . . . . . . . . . . . . . . . . . . . . . . . . . . . 33.10 37.37 37.07 37.18 39.15 38.81 38.92 40.43 40.04 40.22
154 Energy Information Administration/ Annual Energy Outlook 1997

Oil Price Case Comparisons
Table C2. Energy Consumption by Sector and Source (Continued)(Quadrillion Btu per Year, Unless Otherwise Noted)
Sector and Source 1995
Projections
2005 2010 2015
LowWorld Oil
PriceReference
HighWorld Oil
Price
LowWorld Oil
PriceReference
HighWorld Oil
Price
LowWorld Oil
PriceReference
HighWorld Oil
Price
Total Energy ConsumptionDistillate Fuel . . . . . . . . . . . . . . . . . . . . . . . . 6.90 8.19 8.11 8.07 8.62 8.49 8.43 8.96 8.77 8.71Kerosene . . . . . . . . . . . . . . . . . . . . . . . . . . . 0.11 0.11 0.11 0.11 0.11 0.11 0.10 0.11 0.11 0.10Jet Fuel 8 . . . . . . . . . . . . . . . . . . . . . . . . . . . 3.13 4.30 4.26 4.23 4.72 4.67 4.62 5.00 4.95 4.89Liquefied Petroleum Gas . . . . . . . . . . . . . . . . 2.49 2.92 2.81 2.71 3.11 2.97 2.83 3.27 3.09 2.92Motor Gasoline2 . . . . . . . . . . . . . . . . . . . . . . 14.87 17.11 16.88 16.71 17.72 17.38 17.11 17.82 17.40 17.04Petrochemical Feedstocks . . . . . . . . . . . . . . . 1.16 1.36 1.30 1.24 1.43 1.35 1.27 1.50 1.40 1.29Residual Fuel . . . . . . . . . . . . . . . . . . . . . . . . 2.18 3.00 2.38 2.23 3.39 2.54 2.34 3.76 2.75 2.45Other Petroleum12 . . . . . . . . . . . . . . . . . . . . . 4.07 4.95 4.62 4.28 5.09 4.74 4.28 5.25 4.80 4.24
Petroleum Subtotal . . . . . . . . . . . . . . . . . . . 34.92 41.94 40.46 39.58 44.19 42.24 40.98 45.66 43.26 41.65Natural Gas . . . . . . . . . . . . . . . . . . . . . . . . . 22.18 26.09 26.94 27.39 27.92 28.77 29.46 30.04 30.97 31.84Metallurgical Coal . . . . . . . . . . . . . . . . . . . . . 0.88 0.69 0.69 0.69 0.62 0.62 0.62 0.55 0.55 0.55Steam Coal . . . . . . . . . . . . . . . . . . . . . . . . . . 19.04 21.02 20.92 21.13 21.82 21.94 22.06 22.81 23.06 23.22Net Coal Coke Imports . . . . . . . . . . . . . . . . . 0.03 0.11 0.11 0.11 0.13 0.13 0.13 0.15 0.15 0.15
Coal Subtotal . . . . . . . . . . . . . . . . . . . . . . . 19.95 21.82 21.72 21.93 22.57 22.68 22.81 23.51 23.76 23.92Nuclear Power . . . . . . . . . . . . . . . . . . . . . . . 7.19 6.98 6.98 6.98 6.55 6.55 6.55 4.79 4.79 4.79Renewable Energy16 . . . . . . . . . . . . . . . . . . . 6.30 6.89 6.88 6.88 7.21 7.25 7.26 7.56 7.71 7.78Methanol 11 . . . . . . . . . . . . . . . . . . . . . . . . . . 0.00 0.03 0.03 0.03 0.07 0.07 0.06 0.10 0.09 0.09Liquid Hydrogen . . . . . . . . . . . . . . . . . . . . . . 0.00 0.00 0.00 0.00 0.00 0.00 0.00 0.00 0.00 0.00Electricity Imports . . . . . . . . . . . . . . . . . . . . . 0.39 0.34 0.36 0.34 0.32 0.32 0.32 0.28 0.28 0.28
Total . . . . . . . . . . . . . . . . . . . . . . . . . . . . . 90.93 104.09 103.36 103.11 108.84 107.89 107.44 111.93 110.87 110.35
Energy Use and Related Statistics
Delivered Energy Use . . . . . . . . . . . . . . . . . . . . 68.10 78.74 78.38 78.08 82.51 81.99 81.47 85.23 84.62 83.98Total Energy Use . . . . . . . . . . . . . . . . . . . . . . . 90.93 104.08 103.35 103.10 108.82 107.87 107.42 111.90 110.83 110.31Population (millions) . . . . . . . . . . . . . . . . . . . . . 263.58 287.12 287.12 287.12 298.92 298.92 298.92 311.19 311.19 311.19Gross Domestic Product (billion 1992 dollars) . . . 6738.95 8418.14 8389.54 8368.88 9215.68 9185.32 9150.11 9919.12 9879.75 9835.54
1Includes wood used for residential heating. See Table C18 for estimates of nonmarketed renewable energy consumption for geothermal heat pumps and solar thermal hot waterheating.
2Includes ethanol (blends of 10 percent or less) and ethers blended into gasoline.3Includes commercial sector electricity cogenerated by using wood and wood waste, municipal solid waste, and other biomass. See Table C18 for estimates of nonmarketed
renewable energy consumption for solar thermal hot water heating.4Fuel consumption includes consumption for cogeneration.5Includes petroleum coke, asphalt, road oil, lubricants, still gas, and miscellaneous petroleum products.6Includes lease and plant fuel.7Includes consumption of energy from hydroelectric, wood and wood waste, municipal solid waste, and other biomass.8Includes naphtha and kerosene type.9Includes aviation gas and lubricants.10E85 is 85 percent ethanol (renewable) and 15 percent motor gasoline (nonrenewable).11Only M85 (85 percent methanol).12Includes unfinished oils, natural gasoline, motor gasoline blending compounds, aviation gasoline, lubricants, still gas, asphalt, road oil, petroleum coke, and miscellaneous
petroleum products.13Includes electricity generated for sale to electric utilities and for self use from renewable sources, and non-electric energy from renewable sources. Excludes nonmarketed
renewable energy consumption for geothermal heat pumps and solar thermal hot water heaters.14Includes consumption of energy by all electric power generators for grid-connected power except cogenerators, which produce electricity as a by-product of other processes.15Includes hydroelectric, geothermal, wood and wood waste, municipal solid waste, other biomass, E85, wind, photovoltaic and solar thermal sources.16Includes hydroelectric, geothermal, wood and wood waste, municipal solid waste, other biomass, wind, photovoltaic and solar thermal sources. Includes ethanol components of
E85; excludes ethanol blends (10 percent or less) in motor gasoline. Excludes nonmarketed renewable energy consumption for geothermal heat pumps and solar thermal hot waterheaters.
Btu = British thermal unit.Note: Totals may not equal sum of components due to independent rounding. Figures for 1995 may differ from published data due to internal conversion factors. Consumption
values of 0.00 are values that round to 0.00, because they are less than 0.005.Sources: 1995 natural gas lease, plant, and pipeline fuel values: Energy Information Administration (EIA), Short-Term Energy Outlook, DOE/EIA-0202(96/4Q) (Washington, DC,
October 1996). 1995 transportation sector compressed natural gas consumption: EIA, AEO97 National Energy Modeling System runs LWOP97.D100696A, AEO97B.D100296K, andHWOP97.D100296B. 1995 electric utility fuel consumption: EIA, Electric Power Annual, Volume I, DOE/EIA-0348(95)/1 (Washington, DC, July 1996). 1995 nonutility consumptionestimates: EIA Form 867, “Annual Nonutility Power Producer Report.” Other 1995 values: EIA, Short-Term Energy Outlook, DOE/EIA-0202(96/4Q) (Washington, DC, October 1996).Projections: EIA, AEO97 National Energy Modeling System runs LWOP97.D100696A, AEO97B.D100296K, and HWOP97.D100296B.
Energy Information Administration/ Annual Energy Outlook 1997 155

Oil Price Case Comparisons
Table C3. Energy Prices by Sector and Source(1995 Dollars per Million Btu)
Sector and Source 1995
Projections
2005 2010 2015
LowWorld Oil
PriceReference
HighWorld Oil
Price
LowWorld Oil
PriceReference
HighWorld Oil
Price
LowWorld Oil
PriceReference
HighWorld Oil
Price
Residential . . . . . . . . . . . . . . . . . . . . . . . . . . . . . . 12.87 12.40 12.70 12.92 12.29 12.61 12.89 12.30 12.55 12.81Primary Energy . . . . . . . . . . . . . . . . . . . . . . . . . . 6.28 5.81 6.09 6.31 5.63 5.95 6.19 5.61 5.83 6.07
Petroleum Products . . . . . . . . . . . . . . . . . . . . . . 7.51 7.85 8.75 9.55 8.02 9.08 10.07 7.90 8.95 10.22Distillate Fuel . . . . . . . . . . . . . . . . . . . . . . . . . 6.24 6.29 7.28 7.99 6.39 7.45 8.37 6.21 7.33 8.50Liquefied Petroleum Gas . . . . . . . . . . . . . . . . . 10.29 10.72 11.40 12.33 10.87 11.85 12.95 10.74 11.57 13.00
Natural Gas . . . . . . . . . . . . . . . . . . . . . . . . . . . 6.01 5.35 5.49 5.59 5.11 5.27 5.37 5.12 5.18 5.23Electricity . . . . . . . . . . . . . . . . . . . . . . . . . . . . . . 24.67 23.26 23.49 23.65 22.67 22.88 23.15 22.06 22.28 22.51
Commercial . . . . . . . . . . . . . . . . . . . . . . . . . . . . . 13.12 12.36 12.60 12.81 12.20 12.48 12.72 12.06 12.28 12.51Primary Energy . . . . . . . . . . . . . . . . . . . . . . . . . . 4.82 4.44 4.69 4.87 4.32 4.59 4.79 4.35 4.54 4.74
Petroleum Products . . . . . . . . . . . . . . . . . . . . . . 4.58 4.41 5.34 6.07 4.48 5.52 6.47 4.31 5.42 6.60Distillate Fuel . . . . . . . . . . . . . . . . . . . . . . . . . 4.39 4.28 5.28 6.00 4.35 5.44 6.37 4.15 5.32 6.49Residual Fuel . . . . . . . . . . . . . . . . . . . . . . . . . 2.99 2.06 2.87 3.51 2.07 2.98 3.88 2.00 3.03 4.11
Natural Gas1 . . . . . . . . . . . . . . . . . . . . . . . . . . . 4.96 4.52 4.65 4.74 4.36 4.51 4.60 4.44 4.48 4.53Electricity . . . . . . . . . . . . . . . . . . . . . . . . . . . . . . 23.19 21.18 21.38 21.63 20.71 20.98 21.26 20.09 20.35 20.60
Industrial 2 . . . . . . . . . . . . . . . . . . . . . . . . . . . . . . 5.02 4.55 4.96 5.28 4.57 5.05 5.43 4.54 4.99 5.44Primary Energy . . . . . . . . . . . . . . . . . . . . . . . . . . 3.36 2.93 3.34 3.66 2.99 3.47 3.86 3.00 3.47 3.93
Petroleum Products . . . . . . . . . . . . . . . . . . . . . . 4.92 3.68 4.60 5.39 3.74 4.80 5.83 3.59 4.68 5.93Distillate Fuel . . . . . . . . . . . . . . . . . . . . . . . . . 4.61 4.22 5.21 5.93 4.32 5.38 6.33 4.15 5.29 6.45Liquefied Petroleum Gas . . . . . . . . . . . . . . . . . 6.53 5.35 6.00 6.84 5.43 6.28 7.38 5.23 5.95 7.30Residual Fuel . . . . . . . . . . . . . . . . . . . . . . . . . 2.55 1.96 2.92 3.56 1.95 3.03 3.88 1.83 3.01 4.10
Natural Gas3 . . . . . . . . . . . . . . . . . . . . . . . . . . . 2.28 2.46 2.54 2.60 2.53 2.61 2.66 2.73 2.74 2.76Metallurgical Coal . . . . . . . . . . . . . . . . . . . . . . . 1.75 1.66 1.72 1.75 1.52 1.58 1.62 1.44 1.48 1.53Steam Coal . . . . . . . . . . . . . . . . . . . . . . . . . . . 1.48 1.39 1.44 1.47 1.31 1.37 1.41 1.25 1.30 1.34
Electricity . . . . . . . . . . . . . . . . . . . . . . . . . . . . . . 14.54 13.30 13.46 13.63 12.92 13.13 13.31 12.35 12.56 12.73
Transportation . . . . . . . . . . . . . . . . . . . . . . . . . . . 7.92 7.43 8.51 9.28 7.34 8.55 9.61 6.96 8.21 9.49Primary Energy . . . . . . . . . . . . . . . . . . . . . . . . . . 7.92 7.41 8.49 9.26 7.30 8.53 9.59 6.93 8.18 9.47
Petroleum Products . . . . . . . . . . . . . . . . . . . . . . 7.92 7.42 8.51 9.28 7.31 8.54 9.61 6.93 8.19 9.49Distillate Fuel 4 . . . . . . . . . . . . . . . . . . . . . . . . 8.03 7.73 8.70 9.37 7.59 8.68 9.63 7.23 8.38 9.58Jet Fuel 5 . . . . . . . . . . . . . . . . . . . . . . . . . . . . 3.85 4.34 5.46 6.12 4.42 5.65 6.75 4.17 5.45 6.74Motor Gasoline6 . . . . . . . . . . . . . . . . . . . . . . . 9.23 8.64 9.79 10.64 8.53 9.85 10.98 8.14 9.49 10.87Residual Fuel . . . . . . . . . . . . . . . . . . . . . . . . . 2.44 2.03 2.90 3.57 2.13 3.16 4.14 1.98 3.08 4.19
Natural Gas7 . . . . . . . . . . . . . . . . . . . . . . . . . . . 5.77 6.00 6.20 6.29 6.39 6.73 6.83 6.75 7.07 7.18Electricity . . . . . . . . . . . . . . . . . . . . . . . . . . . . . . 15.14 14.42 14.45 14.52 14.16 14.25 14.36 13.68 13.85 13.92
Total End-Use Energy . . . . . . . . . . . . . . . . . . . . . 8.22 7.68 8.31 8.78 7.62 8.34 8.96 7.47 8.18 8.90Primary Energy . . . . . . . . . . . . . . . . . . . . . . . . . . 7.82 7.29 7.98 8.49 7.22 8.01 8.69 7.03 7.82 8.63Electricity . . . . . . . . . . . . . . . . . . . . . . . . . . . . . . 20.77 19.18 19.33 19.50 18.71 18.89 19.10 18.15 18.34 18.52
Electric Generators 8
Fossil Fuel Average . . . . . . . . . . . . . . . . . . . . . . . 1.48 1.47 1.53 1.58 1.48 1.54 1.59 1.52 1.55 1.61Petroleum Products . . . . . . . . . . . . . . . . . . . . . . 2.78 2.19 3.35 4.12 2.29 3.59 4.69 2.24 3.52 4.94
Distillate Fuel . . . . . . . . . . . . . . . . . . . . . . . . . 3.94 3.78 4.77 5.48 3.85 4.92 5.86 3.68 4.83 5.99Residual Fuel . . . . . . . . . . . . . . . . . . . . . . . . . 2.62 1.97 2.97 3.64 2.05 3.15 4.14 2.00 3.11 4.33
Natural Gas . . . . . . . . . . . . . . . . . . . . . . . . . . . 2.01 2.22 2.28 2.35 2.26 2.32 2.41 2.47 2.47 2.52Steam Coal . . . . . . . . . . . . . . . . . . . . . . . . . . . 1.32 1.20 1.24 1.27 1.15 1.20 1.23 1.08 1.11 1.15
156 Energy Information Administration/ Annual Energy Outlook 1997

Oil Price Case Comparisons
Table C3. Energy Prices by Sector and Source (Continued)(1995 Dollars per Million Btu)
Sector and Source 1995
Projections
2005 2010 2015
LowWorld Oil
PriceReference
HighWorld Oil
Price
LowWorld Oil
PriceReference
HighWorld Oil
Price
LowWorld Oil
PriceReference
HighWorld Oil
Price
Average Price to All Users 9
Petroleum Products . . . . . . . . . . . . . . . . . . . . . . . 7.07 6.40 7.52 8.34 6.34 7.62 8.72 6.01 7.33 8.67Distillate Fuel 4 . . . . . . . . . . . . . . . . . . . . . . . . . 6.98 6.76 7.75 8.44 6.70 7.80 8.75 6.39 7.56 8.75Jet Fuel . . . . . . . . . . . . . . . . . . . . . . . . . . . . . . 3.85 4.34 5.46 6.12 4.42 5.65 6.75 4.17 5.45 6.74Liquefied Petroleum Gas . . . . . . . . . . . . . . . . . . 7.20 6.52 7.20 8.09 6.69 7.61 8.74 6.52 7.32 8.72Motor Gasoline6 . . . . . . . . . . . . . . . . . . . . . . . . 9.23 8.63 9.77 10.62 8.52 9.83 10.96 8.13 9.47 10.85Residual Fuel . . . . . . . . . . . . . . . . . . . . . . . . . . 2.55 2.00 2.91 3.58 2.07 3.13 4.10 1.97 3.07 4.19
Natural Gas . . . . . . . . . . . . . . . . . . . . . . . . . . . . 3.57 3.39 3.45 3.51 3.32 3.39 3.45 3.42 3.42 3.44Coal . . . . . . . . . . . . . . . . . . . . . . . . . . . . . . . . . . 1.35 1.22 1.25 1.29 1.17 1.21 1.25 1.09 1.13 1.17Electricity . . . . . . . . . . . . . . . . . . . . . . . . . . . . . . 20.77 19.18 19.33 19.50 18.71 18.89 19.10 18.15 18.34 18.52
1Excludes independent power producers.2Includes cogenerators.3Excludes uses for lease and plant fuel.4Includes Federal and State taxes on diesel fuel and excludes county and local taxes.5Kerosene-type jet fuel.6Sales weighted-average price for all grades. Includes Federal and State taxes and excludes county and local taxes.7Compressed natural gas used as a vehicle fuel. Price includes estimated motor vehicle fuel taxes.8Includes all electric power generators except cogenerators, which produce electricity as a by-product of other processes.9Weighted averages of end-use fuel prices are derived from the prices shown in each sector and the corresponding sectoral consumption.Btu = British thermal unit.Note: 1995 figures may differ from published data due to internal rounding.Sources: 1995 prices for gasoline, distillate, and jet fuel are based on prices in various 1995 issues of Energy Information Administration (EIA), Petroleum Marketing Monthly,
DOE/EIA-0380(95/1-12) (Washington, DC, 1995). 1995 prices for all other petroleum products are derived from the EIA, State Energy Price and Expenditure Report 1993, DOE/EIA-0376(93) (Washington, DC, December 1995). 1995 industrial gas delivered prices are based on EIA, Manufacturing Energy Consumption Survey 1991. 1995 residential andcommercial natural gas delivered prices: EIA, Natural Gas Monthly, DOE/EIA-0130(96/6) (Washington, DC, June 1996). Other 1995 natural gas delivered prices: EIA, AEO97National Energy Modeling System runs LWOP97.D100696A, AEO97B.D100296K, and HWOP97.D100296B. Values for 1995 coal prices have been estimated from EIA, State EnergyPrice and Expenditure Report 1993, DOE/EIA-0376(93) (Washington, DC, December 1995) by use of consumption quantities aggregated from EIA, State Energy Data Report 1993,Consumption Estimates, DOE/EIA-0214(93) (Washington, DC, July 1995). 1995 electricity prices for commercial, industrial, and transportation: EIA, AEO97 National Energy ModelingSystem runs LWOP97.D100696A, AEO97B.D100296K, and HWOP97.D100296B. Projections: EIA, AEO97 National Energy Modeling System runs LWOP97.D100696A,AEO97B.D100296K, and HWOP97.D100296B.
Energy Information Administration/ Annual Energy Outlook 1997 157

Oil Price Case Comparisons
Table C4. Residential Sector Key Indicators and Consumption(Quadrillion Btu per Year, Unless Otherwise Noted)
Key Indicators and Consumption 1995
Projections
2005 2010 2015
LowWorld Oil
PriceReference
HighWorld Oil
Price
LowWorld Oil
PriceReference
HighWorld Oil
Price
LowWorld Oil
PriceReference
HighWorld Oil
Price
Household Characteristics
Households (millions)Single-Family . . . . . . . . . . . . . . . . . . . . . . . . . 68.66 76.88 76.85 76.84 80.95 80.93 80.90 85.09 85.07 85.05Multifamily . . . . . . . . . . . . . . . . . . . . . . . . . . . 24.56 27.02 26.98 26.95 28.70 28.67 28.63 30.49 30.45 30.41Mobile Homes . . . . . . . . . . . . . . . . . . . . . . . . . 5.83 6.64 6.64 6.64 6.89 6.89 6.89 7.12 7.12 7.13
Total . . . . . . . . . . . . . . . . . . . . . . . . . . . . . . 99.06 110.53 110.47 110.43 116.54 116.49 116.43 122.70 122.65 122.58
Housing Starts (millions)Single-Family . . . . . . . . . . . . . . . . . . . . . . . . . 1.08 1.08 1.08 1.08 1.03 1.03 1.03 1.09 1.09 1.09Multifamily . . . . . . . . . . . . . . . . . . . . . . . . . . . 0.28 0.43 0.42 0.42 0.48 0.48 0.48 0.48 0.48 0.48Mobile Homes . . . . . . . . . . . . . . . . . . . . . . . . . 0.34 0.29 0.29 0.29 0.28 0.28 0.28 0.29 0.29 0.29
Total . . . . . . . . . . . . . . . . . . . . . . . . . . . . . . 1.70 1.80 1.80 1.80 1.79 1.79 1.79 1.86 1.86 1.86
Average House Square Footage . . . . . . . . . . . 1643 1683 1683 1683 1696 1696 1697 1708 1708 1708
Energy Intensity
Million Btu Consumed per HouseholdDelivered Energy Consumption . . . . . . . . . . . . 106.10 104.38 103.78 103.32 102.74 102.06 101.55 101.68 101.19 100.71Electricity Related Losses . . . . . . . . . . . . . . . . 79.94 79.04 77.43 77.28 78.65 76.80 76.70 76.97 75.20 75.21Total Energy Consumption . . . . . . . . . . . . . . . . 186.03 183.41 181.21 180.60 181.38 178.86 178.24 178.65 176.39 175.92
Thousand Btu Consumed per Square FootDelivered Energy Consumption . . . . . . . . . . . . 64.57 62.01 61.65 61.37 60.57 60.16 59.86 59.55 59.26 58.97Electricity Related Losses . . . . . . . . . . . . . . . . 48.65 46.95 46.00 45.91 46.36 45.27 45.21 45.08 44.04 44.04Total Energy Consumption . . . . . . . . . . . . . . . . 113.22 108.96 107.64 107.28 106.93 105.43 105.07 104.63 103.29 103.01
Delivered Energy Consumption by Fuel
DistillateSpace Heating . . . . . . . . . . . . . . . . . . . . . . . . 0.76 0.71 0.69 0.66 0.68 0.65 0.62 0.67 0.63 0.60Water Heating . . . . . . . . . . . . . . . . . . . . . . . . . 0.09 0.10 0.10 0.10 0.10 0.10 0.10 0.10 0.10 0.10Other Uses1 . . . . . . . . . . . . . . . . . . . . . . . . . . 0.00 0.00 0.00 0.00 0.00 0.00 0.00 0.00 0.00 0.00
Delivered Energy . . . . . . . . . . . . . . . . . . . . . 0.85 0.81 0.78 0.76 0.78 0.75 0.72 0.76 0.73 0.70
Liquefied Petroleum GasSpace Heating . . . . . . . . . . . . . . . . . . . . . . . . 0.30 0.33 0.32 0.31 0.33 0.32 0.31 0.33 0.32 0.31Water Heating . . . . . . . . . . . . . . . . . . . . . . . . . 0.06 0.08 0.08 0.08 0.09 0.09 0.09 0.10 0.09 0.09Cooking2 . . . . . . . . . . . . . . . . . . . . . . . . . . . . . 0.03 0.03 0.03 0.03 0.03 0.03 0.03 0.03 0.03 0.03Other Uses3 . . . . . . . . . . . . . . . . . . . . . . . . . . 0.01 0.01 0.01 0.01 0.01 0.01 0.01 0.01 0.01 0.01
Delivered Energy . . . . . . . . . . . . . . . . . . . . . 0.40 0.45 0.44 0.43 0.46 0.45 0.44 0.46 0.46 0.44
Natural GasSpace Heating . . . . . . . . . . . . . . . . . . . . . . . . 3.48 3.83 3.79 3.78 3.92 3.88 3.86 3.98 3.96 3.96Space Cooling . . . . . . . . . . . . . . . . . . . . . . . . 0.00 0.01 0.01 0.01 0.02 0.02 0.02 0.02 0.02 0.02Water Heating . . . . . . . . . . . . . . . . . . . . . . . . . 1.25 1.34 1.34 1.34 1.39 1.39 1.39 1.45 1.45 1.45Cooking2 . . . . . . . . . . . . . . . . . . . . . . . . . . . . . 0.15 0.14 0.14 0.14 0.14 0.14 0.14 0.14 0.14 0.14Clothes Dryers . . . . . . . . . . . . . . . . . . . . . . . . 0.05 0.05 0.05 0.05 0.05 0.05 0.05 0.05 0.05 0.05Other Uses3 . . . . . . . . . . . . . . . . . . . . . . . . . . 0.09 0.10 0.10 0.10 0.10 0.10 0.10 0.11 0.11 0.11
Delivered Energy . . . . . . . . . . . . . . . . . . . . . 5.01 5.46 5.43 5.41 5.61 5.57 5.55 5.75 5.73 5.72
ElectricitySpace Heating . . . . . . . . . . . . . . . . . . . . . . . . 0.43 0.47 0.47 0.47 0.48 0.48 0.48 0.49 0.49 0.49Space Cooling . . . . . . . . . . . . . . . . . . . . . . . . 0.48 0.48 0.48 0.48 0.49 0.49 0.49 0.51 0.51 0.51Water Heating . . . . . . . . . . . . . . . . . . . . . . . . . 0.35 0.37 0.37 0.37 0.38 0.38 0.38 0.39 0.39 0.39Refrigeration . . . . . . . . . . . . . . . . . . . . . . . . . . 0.40 0.33 0.33 0.33 0.31 0.31 0.31 0.31 0.31 0.31Cooking . . . . . . . . . . . . . . . . . . . . . . . . . . . . . 0.12 0.13 0.13 0.13 0.14 0.14 0.14 0.14 0.14 0.14Clothes Dryers . . . . . . . . . . . . . . . . . . . . . . . . 0.18 0.20 0.20 0.20 0.21 0.21 0.21 0.22 0.22 0.22Freezers . . . . . . . . . . . . . . . . . . . . . . . . . . . . . 0.13 0.09 0.09 0.09 0.08 0.08 0.08 0.08 0.08 0.08Lighting . . . . . . . . . . . . . . . . . . . . . . . . . . . . . 0.32 0.34 0.34 0.34 0.35 0.35 0.35 0.36 0.36 0.36Other Uses4 . . . . . . . . . . . . . . . . . . . . . . . . . . 1.15 1.74 1.73 1.73 2.02 2.02 2.02 2.35 2.35 2.35
Delivered Energy . . . . . . . . . . . . . . . . . . . . . 3.56 4.15 4.14 4.14 4.46 4.46 4.46 4.86 4.85 4.84
158 Energy Information Administration/ Annual Energy Outlook 1997

Oil Price Case Comparisons
Table C4. Residential Sector Key Indicators and Consumption (Continued)(Quadrillion Btu per Year, Unless Otherwise Noted)
Key Indicators and Consumption 1995
Projections
2005 2010 2015
LowWorld Oil
PriceReference
HighWorld Oil
Price
LowWorld Oil
PriceReference
HighWorld Oil
Price
LowWorld Oil
PriceReference
HighWorld Oil
Price
Marketed RenewablesWood5 . . . . . . . . . . . . . . . . . . . . . . . . . . . . . . . . 0.57 0.56 0.56 0.56 0.55 0.55 0.55 0.54 0.54 0.54
Delivered Energy . . . . . . . . . . . . . . . . . . . . . . . 0.57 0.56 0.56 0.56 0.55 0.55 0.55 0.54 0.54 0.54
Other Fuels 6 . . . . . . . . . . . . . . . . . . . . . . . . . . . . 0.13 0.12 0.11 0.11 0.11 0.11 0.11 0.11 0.10 0.10
Delivered Energy Consumption by End-UseSpace Heating . . . . . . . . . . . . . . . . . . . . . . . . . . 5.65 6.01 5.94 5.89 6.07 5.99 5.93 6.11 6.05 5.99Space Cooling . . . . . . . . . . . . . . . . . . . . . . . . . . 0.48 0.49 0.49 0.49 0.51 0.51 0.51 0.53 0.53 0.53Water Heating . . . . . . . . . . . . . . . . . . . . . . . . . . . 1.75 1.88 1.88 1.88 1.95 1.95 1.95 2.03 2.03 2.02Refrigeration . . . . . . . . . . . . . . . . . . . . . . . . . . . . 0.40 0.33 0.33 0.33 0.31 0.31 0.31 0.31 0.31 0.31Cooking . . . . . . . . . . . . . . . . . . . . . . . . . . . . . . . 0.30 0.30 0.30 0.30 0.30 0.30 0.30 0.31 0.31 0.31Clothes Dryers . . . . . . . . . . . . . . . . . . . . . . . . . . 0.23 0.24 0.24 0.24 0.26 0.26 0.26 0.27 0.27 0.27Freezers . . . . . . . . . . . . . . . . . . . . . . . . . . . . . . . 0.13 0.09 0.09 0.09 0.08 0.08 0.08 0.08 0.08 0.08Lighting . . . . . . . . . . . . . . . . . . . . . . . . . . . . . . . 0.32 0.34 0.34 0.34 0.35 0.35 0.35 0.36 0.36 0.36Other Uses7 . . . . . . . . . . . . . . . . . . . . . . . . . . . . 1.24 1.85 1.84 1.84 2.14 2.14 2.13 2.47 2.47 2.47
Delivered Energy . . . . . . . . . . . . . . . . . . . . . . . 10.51 11.54 11.46 11.41 11.97 11.89 11.82 12.48 12.41 12.34
Electricity Related Losses by End-UseSpace Heating . . . . . . . . . . . . . . . . . . . . . . . . . . 0.95 0.99 0.97 0.97 0.99 0.96 0.96 0.96 0.94 0.93Space Cooling . . . . . . . . . . . . . . . . . . . . . . . . . . 1.07 1.02 0.99 0.99 1.01 0.99 0.98 0.99 0.97 0.96Water Heating . . . . . . . . . . . . . . . . . . . . . . . . . . . 0.78 0.77 0.76 0.76 0.78 0.76 0.76 0.76 0.74 0.74Refrigeration . . . . . . . . . . . . . . . . . . . . . . . . . . . . 0.90 0.69 0.67 0.67 0.64 0.62 0.62 0.60 0.59 0.59Cooking . . . . . . . . . . . . . . . . . . . . . . . . . . . . . . . 0.27 0.28 0.27 0.27 0.28 0.28 0.28 0.28 0.27 0.27Clothes Dryers . . . . . . . . . . . . . . . . . . . . . . . . . . 0.40 0.42 0.41 0.41 0.43 0.42 0.41 0.42 0.41 0.42Freezers . . . . . . . . . . . . . . . . . . . . . . . . . . . . . . . 0.29 0.19 0.19 0.19 0.17 0.16 0.16 0.15 0.15 0.15Lighting . . . . . . . . . . . . . . . . . . . . . . . . . . . . . . . 0.70 0.73 0.71 0.71 0.73 0.71 0.71 0.70 0.69 0.69Other Uses7 . . . . . . . . . . . . . . . . . . . . . . . . . . . . 2.55 3.66 3.58 3.57 4.15 4.05 4.05 4.57 4.47 4.47
Total Electricity Related Losses . . . . . . . . . . . 7.92 8.74 8.55 8.53 9.17 8.95 8.93 9.44 9.22 9.22
Total Energy Consumption by End-UseSpace Heating . . . . . . . . . . . . . . . . . . . . . . . . . . 6.61 7.00 6.91 6.86 7.06 6.96 6.89 7.07 6.99 6.93Space Cooling . . . . . . . . . . . . . . . . . . . . . . . . . . 1.56 1.51 1.49 1.48 1.52 1.49 1.49 1.53 1.50 1.49Water Heating . . . . . . . . . . . . . . . . . . . . . . . . . . . 2.53 2.66 2.64 2.64 2.73 2.71 2.70 2.79 2.77 2.77Refrigeration . . . . . . . . . . . . . . . . . . . . . . . . . . . . 1.30 1.01 1.00 1.00 0.95 0.93 0.93 0.91 0.89 0.89Cooking . . . . . . . . . . . . . . . . . . . . . . . . . . . . . . . 0.58 0.58 0.57 0.57 0.58 0.58 0.58 0.59 0.59 0.59Clothes Dryers . . . . . . . . . . . . . . . . . . . . . . . . . . 0.63 0.66 0.65 0.65 0.68 0.67 0.67 0.69 0.68 0.68Freezers . . . . . . . . . . . . . . . . . . . . . . . . . . . . . . . 0.42 0.28 0.28 0.28 0.25 0.24 0.24 0.23 0.23 0.23Lighting . . . . . . . . . . . . . . . . . . . . . . . . . . . . . . . 1.02 1.07 1.05 1.05 1.08 1.06 1.06 1.07 1.05 1.05Other Uses7 . . . . . . . . . . . . . . . . . . . . . . . . . . . . 3.79 5.50 5.43 5.42 6.29 6.19 6.18 7.04 6.94 6.94
Total . . . . . . . . . . . . . . . . . . . . . . . . . . . . . . . . 18.43 20.27 20.02 19.94 21.14 20.83 20.75 21.92 21.63 21.56
Non-Marketed RenewablesGeothermal 8 . . . . . . . . . . . . . . . . . . . . . . . . . . . 0.01 0.04 0.04 0.04 0.05 0.05 0.05 0.07 0.07 0.07Solar9 . . . . . . . . . . . . . . . . . . . . . . . . . . . . . . . . . 0.01 0.01 0.01 0.01 0.01 0.01 0.01 0.01 0.01 0.01
Total . . . . . . . . . . . . . . . . . . . . . . . . . . . . . . . . 0.02 0.05 0.05 0.05 0.06 0.06 0.06 0.08 0.08 0.08
1Includes such appliances as swimming pool and hot tub heaters.2Does not include outdoor grills.3Includes such appliances as swimming pool heaters, outdoor grills, and outdoor lighting (natural gas).4Includes such appliances as microwave ovens, television sets, and dishwashers.5Includes wood used for primary and secondary heating in wood stoves or fireplaces as reported in the Residential Energy Consumption Survey 1993.6Includes kerosene and coal.7Includes such appliances as swimming pool heaters, hot tub heaters, outdoor grills, outdoor lighting (natural gas), microwave ovens, television sets, and dishwashers.8Includes primary energy displaced by geothermal heat pumps in space heating and cooling applications.9Includes primary energy displaced by solar thermal water heaters.Btu = British thermal unit.Note: Totals may not equal sum of components due to independent rounding.Sources: 1995: Energy Information Administration (EIA), Short-Term Energy Outlook, DOE/EIA-0202(96/4Q) (Washington, DC, October 1996). Projections: EIA, AEO97 National
Energy Modeling System runs LWOP97.D100696A, AEO97B.D100296K, and HWOP97.D100296B.
Energy Information Administration/ Annual Energy Outlook 1997 159

Oil Price Case Comparisons
Table C5. Commercial Sector Key Indicators and Consumption(Quadrillion Btu per Year, Unless Otherwise Noted)
Key Indicators and Consumption 1995
Projections
2005 2010 2015
LowWorld Oil
PriceReference
HighWorld Oil
Price
LowWorld Oil
PriceReference
HighWorld Oil
Price
LowWorld Oil
PriceReference
HighWorld Oil
Price
Key Indicators
Total Floor Space (billion square feet)Surviving . . . . . . . . . . . . . . . . . . . . . . . . . . . . . . 68.9 76.0 76.0 76.0 79.1 79.1 79.1 82.5 82.5 82.5New Additions . . . . . . . . . . . . . . . . . . . . . . . . . . . 1.7 1.5 1.5 1.5 1.6 1.6 1.6 1.8 1.8 1.8
Total . . . . . . . . . . . . . . . . . . . . . . . . . . . . . . . . 70.7 77.5 77.5 77.5 80.7 80.7 80.7 84.2 84.2 84.2
Energy Consumption Intensity(thousand Btu per square foot)
Delivered Energy Consumption . . . . . . . . . . . . . . 101.2 101.4 101.1 100.9 101.0 100.7 100.5 101.1 100.9 100.7Electricity Related Losses . . . . . . . . . . . . . . . . . . 101.6 101.1 99.0 98.6 99.7 97.3 97.0 96.3 93.9 93.9Total Energy Consumption . . . . . . . . . . . . . . . . . . 202.8 202.5 200.1 199.6 200.8 198.0 197.5 197.4 194.8 194.6
Delivered Energy Consumption by Fuel
ElectricitySpace Heating . . . . . . . . . . . . . . . . . . . . . . . . . . 0.11 0.12 0.12 0.12 0.12 0.12 0.12 0.13 0.13 0.13Space Cooling . . . . . . . . . . . . . . . . . . . . . . . . . . 0.58 0.52 0.52 0.52 0.52 0.52 0.52 0.53 0.53 0.53Water Heating . . . . . . . . . . . . . . . . . . . . . . . . . . . 0.17 0.15 0.15 0.15 0.14 0.14 0.14 0.13 0.13 0.13Ventilation . . . . . . . . . . . . . . . . . . . . . . . . . . . . . . 0.17 0.18 0.18 0.18 0.19 0.19 0.19 0.20 0.20 0.20Cooking . . . . . . . . . . . . . . . . . . . . . . . . . . . . . . . 0.03 0.03 0.03 0.03 0.03 0.03 0.03 0.03 0.03 0.03Lighting . . . . . . . . . . . . . . . . . . . . . . . . . . . . . . . 1.21 1.32 1.32 1.31 1.33 1.32 1.32 1.36 1.36 1.35Refrigeration . . . . . . . . . . . . . . . . . . . . . . . . . . . . 0.14 0.15 0.15 0.15 0.16 0.16 0.16 0.17 0.17 0.17Office Equipment (PC) . . . . . . . . . . . . . . . . . . . . . 0.07 0.09 0.09 0.09 0.10 0.10 0.10 0.10 0.10 0.10Office Equipment (non-PC) . . . . . . . . . . . . . . . . . 0.18 0.22 0.22 0.22 0.25 0.25 0.25 0.27 0.27 0.27Other Uses1 . . . . . . . . . . . . . . . . . . . . . . . . . . . . 0.56 0.92 0.92 0.92 1.08 1.08 1.08 1.24 1.24 1.24
Delivered Energy . . . . . . . . . . . . . . . . . . . . . . . 3.23 3.72 3.71 3.71 3.92 3.91 3.91 4.17 4.16 4.15
Natural Gas 2
Space Heating . . . . . . . . . . . . . . . . . . . . . . . . . . 1.30 1.33 1.34 1.34 1.34 1.36 1.36 1.34 1.38 1.38Space Cooling . . . . . . . . . . . . . . . . . . . . . . . . . . 0.03 0.03 0.03 0.03 0.03 0.03 0.03 0.03 0.03 0.03Water Heating . . . . . . . . . . . . . . . . . . . . . . . . . . . 0.48 0.50 0.50 0.50 0.52 0.52 0.52 0.55 0.55 0.55Cooking . . . . . . . . . . . . . . . . . . . . . . . . . . . . . . . 0.18 0.21 0.21 0.21 0.23 0.23 0.23 0.25 0.25 0.25Other Uses3 . . . . . . . . . . . . . . . . . . . . . . . . . . . . 1.17 1.36 1.36 1.36 1.40 1.40 1.40 1.45 1.45 1.45
Delivered Energy . . . . . . . . . . . . . . . . . . . . . . . 3.16 3.43 3.44 3.44 3.52 3.54 3.53 3.62 3.65 3.65
DistillateSpace Heating . . . . . . . . . . . . . . . . . . . . . . . . . . 0.20 0.20 0.17 0.16 0.19 0.16 0.15 0.20 0.15 0.14Water Heating . . . . . . . . . . . . . . . . . . . . . . . . . . . 0.06 0.05 0.05 0.05 0.05 0.05 0.04 0.05 0.04 0.04Other Uses4 . . . . . . . . . . . . . . . . . . . . . . . . . . . . 0.15 0.14 0.14 0.14 0.14 0.14 0.14 0.14 0.14 0.14
Delivered Energy . . . . . . . . . . . . . . . . . . . . . . . 0.41 0.38 0.36 0.35 0.38 0.35 0.34 0.38 0.34 0.33
Other Fuels 5 . . . . . . . . . . . . . . . . . . . . . . . . . . . . 0.35 0.32 0.32 0.32 0.33 0.33 0.33 0.34 0.34 0.34
Marketed Renewable FuelsBiomass . . . . . . . . . . . . . . . . . . . . . . . . . . . . . . . 0.00 0.00 0.00 0.00 0.00 0.00 0.00 0.00 0.00 0.00
Delivered Energy . . . . . . . . . . . . . . . . . . . . . . . 0.00 0.00 0.00 0.00 0.00 0.00 0.00 0.00 0.00 0.00
Delivered Energy Consumption by End-UseSpace Heating . . . . . . . . . . . . . . . . . . . . . . . . . . 1.61 1.64 1.63 1.62 1.65 1.64 1.63 1.67 1.66 1.65Space Cooling . . . . . . . . . . . . . . . . . . . . . . . . . . 0.61 0.55 0.55 0.55 0.55 0.55 0.55 0.57 0.56 0.56Water Heating . . . . . . . . . . . . . . . . . . . . . . . . . . . 0.70 0.70 0.70 0.69 0.71 0.70 0.70 0.72 0.72 0.72Ventilation . . . . . . . . . . . . . . . . . . . . . . . . . . . . . . 0.17 0.18 0.18 0.18 0.19 0.19 0.19 0.20 0.20 0.20Cooking . . . . . . . . . . . . . . . . . . . . . . . . . . . . . . . 0.22 0.24 0.24 0.24 0.26 0.26 0.26 0.27 0.27 0.27Lighting . . . . . . . . . . . . . . . . . . . . . . . . . . . . . . . 1.21 1.32 1.32 1.31 1.33 1.32 1.32 1.36 1.36 1.35Refrigeration . . . . . . . . . . . . . . . . . . . . . . . . . . . . 0.14 0.15 0.15 0.15 0.16 0.16 0.16 0.17 0.17 0.17Office Equipment (PC) . . . . . . . . . . . . . . . . . . . . . 0.07 0.09 0.09 0.09 0.10 0.10 0.10 0.10 0.10 0.10Office Equipment (non-PC) . . . . . . . . . . . . . . . . . 0.18 0.22 0.22 0.22 0.25 0.25 0.25 0.27 0.27 0.27Other Uses6 . . . . . . . . . . . . . . . . . . . . . . . . . . . . 2.24 2.75 2.75 2.75 2.96 2.96 2.97 3.17 3.18 3.18
Delivered Energy . . . . . . . . . . . . . . . . . . . . . . . 7.15 7.86 7.84 7.82 8.16 8.13 8.11 8.52 8.50 8.48
160 Energy Information Administration/ Annual Energy Outlook 1997

Oil Price Case Comparisons
Table C5. Commercial Sector Key Indicators and Consumption (Continued)(Quadrillion Btu per Year, Unless Otherwise Noted)
Key Indicators and Consumption 1995
Projections
2005 2010 2015
LowWorld Oil
PriceReference
HighWorld Oil
Price
LowWorld Oil
PriceReference
HighWorld Oil
Price
LowWorld Oil
PriceReference
HighWorld Oil
Price
Electricity Related Losses by End-UseSpace Heating . . . . . . . . . . . . . . . . . . . . . . . . . . 0.25 0.25 0.25 0.25 0.26 0.25 0.25 0.25 0.25 0.25Space Cooling . . . . . . . . . . . . . . . . . . . . . . . . . . 1.29 1.10 1.07 1.07 1.07 1.05 1.05 1.04 1.01 1.01Water Heating . . . . . . . . . . . . . . . . . . . . . . . . . . . 0.38 0.32 0.31 0.31 0.28 0.28 0.28 0.25 0.24 0.24Ventilation . . . . . . . . . . . . . . . . . . . . . . . . . . . . . . 0.38 0.38 0.37 0.37 0.39 0.38 0.37 0.38 0.37 0.37Cooking . . . . . . . . . . . . . . . . . . . . . . . . . . . . . . . 0.07 0.06 0.06 0.06 0.06 0.06 0.06 0.05 0.05 0.05Lighting . . . . . . . . . . . . . . . . . . . . . . . . . . . . . . . 2.68 2.79 2.72 2.71 2.73 2.65 2.64 2.65 2.58 2.58Refrigeration . . . . . . . . . . . . . . . . . . . . . . . . . . . . 0.31 0.33 0.32 0.32 0.33 0.33 0.33 0.34 0.33 0.33Office Equipment (PC) . . . . . . . . . . . . . . . . . . . . . 0.16 0.20 0.19 0.19 0.20 0.20 0.20 0.20 0.20 0.20Office Equipment (non-PC) . . . . . . . . . . . . . . . . . 0.40 0.47 0.46 0.46 0.50 0.49 0.49 0.53 0.52 0.52Other Uses6 . . . . . . . . . . . . . . . . . . . . . . . . . . . . 1.25 1.95 1.91 1.91 2.23 2.17 2.17 2.41 2.35 2.36
Total Electricity Related Losses . . . . . . . . . . . 7.18 7.84 7.67 7.64 8.05 7.85 7.83 8.11 7.91 7.90
Total Energy Consumption by End-UseSpace Heating . . . . . . . . . . . . . . . . . . . . . . . . . . 1.87 1.90 1.88 1.87 1.91 1.89 1.88 1.92 1.91 1.90Space Cooling . . . . . . . . . . . . . . . . . . . . . . . . . . 1.89 1.64 1.62 1.62 1.63 1.60 1.60 1.60 1.58 1.58Water Heating . . . . . . . . . . . . . . . . . . . . . . . . . . . 1.09 1.02 1.01 1.00 0.99 0.98 0.98 0.97 0.96 0.96Ventilation . . . . . . . . . . . . . . . . . . . . . . . . . . . . . . 0.55 0.56 0.55 0.55 0.57 0.56 0.56 0.58 0.57 0.57Cooking . . . . . . . . . . . . . . . . . . . . . . . . . . . . . . . 0.29 0.30 0.30 0.30 0.31 0.31 0.31 0.33 0.32 0.32Lighting . . . . . . . . . . . . . . . . . . . . . . . . . . . . . . . 3.89 4.11 4.04 4.02 4.06 3.97 3.95 4.02 3.94 3.93Refrigeration . . . . . . . . . . . . . . . . . . . . . . . . . . . . 0.46 0.48 0.47 0.47 0.50 0.49 0.49 0.51 0.50 0.50Office Equipment (PC) . . . . . . . . . . . . . . . . . . . . . 0.23 0.29 0.29 0.29 0.30 0.30 0.30 0.31 0.30 0.30Office Equipment (non-PC) . . . . . . . . . . . . . . . . . 0.59 0.69 0.68 0.68 0.75 0.74 0.74 0.80 0.79 0.79Other Uses6 . . . . . . . . . . . . . . . . . . . . . . . . . . . . 3.49 4.69 4.66 4.66 5.19 5.14 5.14 5.58 5.53 5.54
Total . . . . . . . . . . . . . . . . . . . . . . . . . . . . . . . . 14.33 15.70 15.51 15.47 16.21 15.98 15.94 16.62 16.40 16.39
Non-Marketed Renewable FuelsSolar7 . . . . . . . . . . . . . . . . . . . . . . . . . . . . . . . . . 0.01 0.03 0.03 0.03 0.03 0.03 0.03 0.04 0.04 0.04
Total . . . . . . . . . . . . . . . . . . . . . . . . . . . . . . . . 0.01 0.03 0.03 0.03 0.03 0.03 0.03 0.04 0.04 0.04
1Includes miscellaneous uses, such as service station equipment, district services, automated teller machines, telecommunications equipment, and medical equipment.2Excludes estimated consumption from independent power producers.3Includes miscellaneous uses, such as district services, pumps, lighting, emergency electric generators, and manufacturing performed in commercial buildings.4Includes miscellaneous uses, such as cooking, district services, and emergency electric generators.5Includes residual fuel oil, liquefied petroleum gas, coal, motor gasoline, and kerosene.6Includes miscellaneous uses, such as service station equipment, district services, automated teller machines, telecommunications equipment, medical equipment, pumps, lighting,
emergency electric generators, manufacturing performed in commercial buildings, and cooking (distillate), plus residual fuel oil, liquefied petroleum gas, coal, motor gasoline, andkerosene.
7Includes primary energy displaced by solar thermal water heaters.Btu = British thermal unit.PC = Personal computer.Note: Totals may not equal sum of components due to independent rounding.Sources: 1995: Energy Information Administration (EIA), Short-Term Energy Outlook, DOE/EIA-0202(96/4Q) (Washington, DC, October 1996). Projections: EIA, AEO97 National
Energy Modeling System runs LWOP97.D100696A, AEO97B.D100296K, and HWOP97.D100296B.
Energy Information Administration/ Annual Energy Outlook 1997 161

Oil Price Case Comparisons
Table C6. Industrial Sector Key Indicators and Consumption(Quadrillion Btu per Year, Unless Otherwise Noted)
Key Indicators and Consumption 1995
Projections
2005 2010 2015
LowWorld Oil
PriceReference
HighWorld Oil
Price
LowWorld Oil
PriceReference
HighWorld Oil
Price
LowWorld Oil
PriceReference
HighWorld Oil
Price
Key Indicators
Value of Gross Output (billion 1987 dollars)Manufacturing . . . . . . . . . . . . . . . . . . . . . . . . . . . 2907 3727 3709 3695 4138 4117 4096 4463 4441 4416Nonmanufacturing . . . . . . . . . . . . . . . . . . . . . . . . 765 911 917 922 971 978 982 1020 1028 1037
Total . . . . . . . . . . . . . . . . . . . . . . . . . . . . . . . . 3672 4638 4626 4618 5109 5095 5078 5483 5469 5453
Energy Prices (1995 dollars per million Btu)Electricity . . . . . . . . . . . . . . . . . . . . . . . . . . . . . . 14.54 13.30 13.46 13.63 12.92 13.13 13.31 12.35 12.56 12.73Natural Gas . . . . . . . . . . . . . . . . . . . . . . . . . . . . 2.28 2.46 2.54 2.60 2.53 2.61 2.66 2.73 2.74 2.76Steam Coal . . . . . . . . . . . . . . . . . . . . . . . . . . . . . 1.48 1.39 1.44 1.47 1.31 1.37 1.41 1.25 1.30 1.34Residual Oil . . . . . . . . . . . . . . . . . . . . . . . . . . . . 2.55 1.96 2.92 3.56 1.95 3.03 3.88 1.83 3.01 4.10Distillate Oil . . . . . . . . . . . . . . . . . . . . . . . . . . . . 4.61 4.22 5.21 5.93 4.32 5.38 6.33 4.15 5.29 6.45Liquefied Petroleum Gas . . . . . . . . . . . . . . . . . . . 6.53 5.35 6.00 6.84 5.43 6.28 7.38 5.23 5.95 7.30Motor Gasoline . . . . . . . . . . . . . . . . . . . . . . . . . . 9.18 7.51 8.63 9.49 7.56 8.85 9.96 7.33 8.65 10.00Metallurgical Coal . . . . . . . . . . . . . . . . . . . . . . . . 1.75 1.66 1.72 1.75 1.52 1.58 1.62 1.44 1.48 1.53
Energy Consumption
Consumption 1 (quadrillion Btu per year)Purchased Electricity . . . . . . . . . . . . . . . . . . . . . . 3.46 4.08 4.16 4.21 4.30 4.40 4.46 4.53 4.62 4.69Natural Gas2 . . . . . . . . . . . . . . . . . . . . . . . . . . . . 9.74 10.56 11.04 11.45 10.84 11.42 12.00 10.89 11.63 12.33Steam Coal . . . . . . . . . . . . . . . . . . . . . . . . . . . . . 1.59 1.75 1.82 1.87 1.81 1.89 1.93 1.89 1.97 2.01Metallurgical Coal and Coke3 . . . . . . . . . . . . . . . . 0.91 0.80 0.80 0.80 0.75 0.75 0.75 0.70 0.70 0.70Residual Fuel . . . . . . . . . . . . . . . . . . . . . . . . . . . 0.34 0.43 0.31 0.27 0.48 0.33 0.26 0.51 0.35 0.25Distillate . . . . . . . . . . . . . . . . . . . . . . . . . . . . . . . 1.15 1.39 1.39 1.38 1.48 1.47 1.47 1.56 1.55 1.55Liquefied Petroleum Gas . . . . . . . . . . . . . . . . . . . 2.01 2.30 2.20 2.11 2.41 2.28 2.16 2.52 2.35 2.20Petrochemical Feedstocks . . . . . . . . . . . . . . . . . . 1.16 1.36 1.30 1.24 1.43 1.35 1.27 1.50 1.40 1.29Other Petroleum4 . . . . . . . . . . . . . . . . . . . . . . . . 4.03 4.90 4.57 4.23 5.03 4.69 4.23 5.20 4.75 4.20Renewables5 . . . . . . . . . . . . . . . . . . . . . . . . . . . . 1.74 2.13 2.12 2.11 2.29 2.28 2.26 2.41 2.40 2.38
Delivered Energy . . . . . . . . . . . . . . . . . . . . . . . 26.12 29.68 29.70 29.67 30.84 30.87 30.78 31.72 31.73 31.60Electricity Related Losses . . . . . . . . . . . . . . . . . . 7.69 8.60 8.59 8.69 8.83 8.82 8.93 8.82 8.79 8.92
Total . . . . . . . . . . . . . . . . . . . . . . . . . . . . . . . . 33.81 38.28 38.28 38.35 39.66 39.69 39.71 40.54 40.51 40.52
Consumption per Unit of Output 1
(thousand Btu per 1987 dollar)Purchased Electricity . . . . . . . . . . . . . . . . . . . . . . 0.94 0.88 0.90 0.91 0.84 0.86 0.88 0.83 0.84 0.86Natural Gas2 . . . . . . . . . . . . . . . . . . . . . . . . . . . . 2.65 2.28 2.39 2.48 2.12 2.24 2.36 1.99 2.13 2.26Steam Coal . . . . . . . . . . . . . . . . . . . . . . . . . . . . . 0.43 0.38 0.39 0.41 0.35 0.37 0.38 0.34 0.36 0.37Metallurgical Coal and Coke3 . . . . . . . . . . . . . . . . 0.25 0.17 0.17 0.17 0.15 0.15 0.15 0.13 0.13 0.13Residual Fuel . . . . . . . . . . . . . . . . . . . . . . . . . . . 0.09 0.09 0.07 0.06 0.09 0.06 0.05 0.09 0.06 0.05Distillate . . . . . . . . . . . . . . . . . . . . . . . . . . . . . . . 0.31 0.30 0.30 0.30 0.29 0.29 0.29 0.29 0.28 0.28Liquefied Petroleum Gas . . . . . . . . . . . . . . . . . . . 0.55 0.50 0.48 0.46 0.47 0.45 0.43 0.46 0.43 0.40Petrochemical Feedstocks . . . . . . . . . . . . . . . . . . 0.32 0.29 0.28 0.27 0.28 0.27 0.25 0.27 0.26 0.24Other Petroleum4 . . . . . . . . . . . . . . . . . . . . . . . . 1.10 1.06 0.99 0.92 0.99 0.92 0.83 0.95 0.87 0.77Renewables5 . . . . . . . . . . . . . . . . . . . . . . . . . . . . 0.47 0.46 0.46 0.46 0.45 0.45 0.45 0.44 0.44 0.44
Delivered Energy . . . . . . . . . . . . . . . . . . . . . . . 7.11 6.40 6.42 6.42 6.04 6.06 6.06 5.78 5.80 5.79Electricity Related Losses . . . . . . . . . . . . . . . . . . 2.09 1.85 1.86 1.88 1.73 1.73 1.76 1.61 1.61 1.64
Total . . . . . . . . . . . . . . . . . . . . . . . . . . . . . . . . 9.21 8.25 8.28 8.31 7.76 7.79 7.82 7.39 7.41 7.43
1Fuel consumption includes consumption for cogeneration.2Includes lease and plant fuel.3Includes net coke coal imports.4Includes petroleum coke, asphalt, road oil, lubricants, motor gasoline, still gas, and miscellaneous petroleum products.5Includes consumption of energy from hydroelectric, wood and wood waste, municipal solid waste, and other biomass.Btu = British thermal unit.Note: Totals may not equal sum of components due to independent rounding.Sources: 1995 prices for gasoline and distillate are based on prices in various issues of Energy Information Administration (EIA), Petroleum Marketing Monthly, DOE/EIA-
0380(95/3-96/4) (Washington, DC, 1995 - 1996). 1995 coal prices: EIA, Monthly Energy Review, DOE/EIA-0035(96/08) (Washington, DC, August 1996). 1995 electricity prices: EIA,AEO97 National Energy Modeling System runs LWOP97.D100696A, AEO97B.D100296K, and HWOP97.D100296B. 1995 prices derived from EIA, State Energy Data Report 1993,DOE/EIA-0214(93) (Washington, DC, July 1995). Other 1995 values: EIA, Short-Term Energy Outlook, DOE/EIA-0202(96/4Q) (Washington, DC, October 1996). Projections: EIA,AEO97 National Energy Modeling System runs LWOP97.D100696A, AEO97B.D100296K, and HWOP97.D100296B.
162 Energy Information Administration/ Annual Energy Outlook 1997

Oil Price Case Comparisons
Table C7. Transportation Sector Key Indicators and Delivered Energy Consumption
Key Indicators and Consumption 1995
Projections
2005 2010 2015
LowWorld Oil
PriceReference
HighWorld Oil
Price
LowWorld Oil
PriceReference
HighWorld Oil
Price
LowWorld Oil
PriceReference
HighWorld Oil
Price
Key IndicatorsLevel of Travel (billions)
Light-Duty Vehicles (vehicle miles traveled) . . . . . . 2209 2591 2574 2561 2787 2767 2750 2944 2924 2903Freight Trucks (vehicle miles traveled) . . . . . . . . . 166 219 219 218 238 237 236 251 250 249Air (seat miles available) . . . . . . . . . . . . . . . . . . . 927 1512 1493 1480 1751 1729 1707 1947 1923 1897Rail (ton miles traveled) . . . . . . . . . . . . . . . . . . . . 1181 1343 1368 1388 1429 1459 1485 1503 1535 1572Marine (ton miles traveled) . . . . . . . . . . . . . . . . . . 871 962 989 1011 1015 1047 1075 1065 1099 1139
Energy Efficiency IndicatorsNew Car (miles per gallon)1 . . . . . . . . . . . . . . . . . . 27.5 29.2 29.8 30.3 30.6 31.5 32.3 31.6 32.6 33.5New Light Truck (miles per gallon)1 . . . . . . . . . . . . 20.5 21.3 21.6 21.7 22.6 22.9 23.2 23.8 24.2 24.7Light-Duty Fleet (miles per gallon)2 . . . . . . . . . . . . . 19.7 19.7 19.8 19.9 20.1 20.4 20.6 20.9 21.3 21.6Aircraft Efficiency (seat miles per gallon) . . . . . . . . . 50.8 55.8 55.8 55.8 58.3 58.2 58.2 60.7 60.6 60.6Freight Truck Efficiency (miles per gallon) . . . . . . . . 5.5 5.8 5.9 5.9 5.9 6.0 6.0 6.0 6.1 6.1Rail Efficiency (ton miles per thousand Btu) . . . . . . 2.6 2.9 2.9 2.9 3.0 3.0 3.0 3.2 3.2 3.2Domestic Shipping Efficiency(ton miles per thousand Btu) . . . . . . . . . . . . . . . . . 2.7 2.9 2.9 2.9 2.9 2.9 2.9 3.0 3.0 3.0
Energy Use by Mode (quadrillion Btu per year)Light-Duty Vehicles . . . . . . . . . . . . . . . . . . . . . . . . 14.20 16.76 16.52 16.35 17.62 17.26 16.98 17.86 17.43 17.05Freight Trucks . . . . . . . . . . . . . . . . . . . . . . . . . . . . 5.43 6.49 6.47 6.45 6.84 6.80 6.77 7.11 7.07 7.03Air . . . . . . . . . . . . . . . . . . . . . . . . . . . . . . . . . . . . 3.18 4.34 4.30 4.27 4.76 4.71 4.66 5.05 5.00 4.94Rail . . . . . . . . . . . . . . . . . . . . . . . . . . . . . . . . . . . . 0.48 0.49 0.50 0.51 0.50 0.51 0.52 0.50 0.51 0.52Marine . . . . . . . . . . . . . . . . . . . . . . . . . . . . . . . . . 1.63 2.09 2.09 2.10 2.30 2.30 2.30 2.46 2.46 2.47Pipeline Fuel . . . . . . . . . . . . . . . . . . . . . . . . . . . . . 0.72 0.83 0.84 0.85 0.88 0.88 0.89 0.93 0.93 0.96Other3 . . . . . . . . . . . . . . . . . . . . . . . . . . . . . . . . . . 0.21 0.27 0.27 0.27 0.29 0.29 0.29 0.30 0.30 0.29
Total . . . . . . . . . . . . . . . . . . . . . . . . . . . . . . . . . 24.31 29.66 29.38 29.18 31.54 31.11 30.76 32.52 31.99 31.56
1Environmental Protection Agency rated miles per gallon.2Combined car and light truck “on-the-road” estimate.3Includes lubricants and aviation gasoline.Btu = British thermal unit.Note: Totals may not equal sum of components due to independent rounding.Sources: 1995: Federal Aviation Administration (FAA), FAA Aviation Forecasts Fiscal Years 1993-2004, (Washington, DC, February 1994); Energy Information Administration
(EIA), Short-Term Energy Outlook, DOE/EIA-0202(96/4Q) (Washington, DC, October 1996); EIA, Fuel Oil and Kerosene Sales 1995, DOE/EIA-0535(95) (Washington, DC, September1996); and United States Department of Defense, Defense Fuel Supply Center. Projections: EIA, AEO97 National Energy Modeling System runs LWOP97.D100696A,AEO97B.D100296K, and HWOP97.D100296B.
Energy Information Administration/ Annual Energy Outlook 1997 163

Oil Price Case Comparisons
Table C8. Electricity Supply, Disposition, and Prices(Billion Kilowatthours, Unless Otherwise Noted)
Supply, Disposition, and Prices 1995
Projections
2005 2010 2015
LowWorld Oil
PriceReference
HighWorld Oil
Price
LowWorld Oil
PriceReference
HighWorld Oil
Price
LowWorld Oil
PriceReference
HighWorld Oil
Price
Generation by Fuel TypeElectric Generators 1
Coal . . . . . . . . . . . . . . . . . . . . . . . . . . . . . . . . . . 1671 1867 1854 1871 1936 1942 1952 2031 2052 2066Petroleum . . . . . . . . . . . . . . . . . . . . . . . . . . . . . . 64 109 58 49 128 58 44 151 64 45Natural Gas . . . . . . . . . . . . . . . . . . . . . . . . . . . . 322 623 705 713 808 892 907 1109 1184 1194Nuclear Power . . . . . . . . . . . . . . . . . . . . . . . . . . 673 654 654 654 614 614 614 448 448 448Pumped Storage . . . . . . . . . . . . . . . . . . . . . . . . . -2 -3 -3 -3 -3 -3 -3 -3 -3 -3Renewable Sources2 . . . . . . . . . . . . . . . . . . . . . . 354 360 361 361 369 371 372 383 394 402
Total . . . . . . . . . . . . . . . . . . . . . . . . . . . . . . . . 3083 3610 3629 3645 3851 3874 3886 4120 4139 4152Non-Utility Generation for Own Use . . . . . . . . . . . 22 22 22 22 22 22 22 22 22 22
Cogenerators 3
Coal . . . . . . . . . . . . . . . . . . . . . . . . . . . . . . . . . . 43 48 48 48 50 50 50 51 51 51Petroleum . . . . . . . . . . . . . . . . . . . . . . . . . . . . . . 5 6 5 5 6 6 6 6 6 6Natural Gas . . . . . . . . . . . . . . . . . . . . . . . . . . . . 180 195 205 212 199 214 224 204 221 230Other Gaseous Fuels4 . . . . . . . . . . . . . . . . . . . . . 7 8 8 8 8 8 8 8 8 8Renewable Sources2 . . . . . . . . . . . . . . . . . . . . . . 42 49 49 49 53 53 52 55 55 55Other5 . . . . . . . . . . . . . . . . . . . . . . . . . . . . . . . . 3 4 4 3 4 4 4 4 4 4
Total . . . . . . . . . . . . . . . . . . . . . . . . . . . . . . . . 279 309 319 326 319 333 343 328 344 353Sales to Utilities . . . . . . . . . . . . . . . . . . . . . . . . . 148 157 158 159 159 161 162 161 163 164Generation for Own Use . . . . . . . . . . . . . . . . . . . 132 152 161 167 160 172 181 166 181 188
Net Imports . . . . . . . . . . . . . . . . . . . . . . . . . . . . . 38 33 35 33 31 31 31 27 27 27
Electricity Sales by SectorResidential . . . . . . . . . . . . . . . . . . . . . . . . . . . . . . 1043 1215 1214 1213 1308 1307 1306 1423 1421 1419Commercial . . . . . . . . . . . . . . . . . . . . . . . . . . . . . . 946 1090 1089 1087 1149 1147 1145 1221 1219 1217Industrial . . . . . . . . . . . . . . . . . . . . . . . . . . . . . . . . 1013 1196 1218 1235 1260 1289 1306 1329 1354 1374Transportation . . . . . . . . . . . . . . . . . . . . . . . . . . . . 6 24 24 24 41 41 40 50 50 49
Total . . . . . . . . . . . . . . . . . . . . . . . . . . . . . . . . . 3008 3525 3545 3558 3758 3784 3797 4024 4044 4059
End-Use Prices (1995 cents per kilowatthour) 6
Residential . . . . . . . . . . . . . . . . . . . . . . . . . . . . . . 8.4 7.9 8.0 8.1 7.7 7.8 7.9 7.5 7.6 7.7Commercial . . . . . . . . . . . . . . . . . . . . . . . . . . . . . . 7.9 7.2 7.3 7.4 7.1 7.2 7.3 6.9 6.9 7.0Industrial . . . . . . . . . . . . . . . . . . . . . . . . . . . . . . . . 5.0 4.5 4.6 4.6 4.4 4.5 4.5 4.2 4.3 4.3Transportation . . . . . . . . . . . . . . . . . . . . . . . . . . . . 5.2 4.9 4.9 5.0 4.8 4.9 4.9 4.7 4.7 4.7
All Sectors Average . . . . . . . . . . . . . . . . . . . . . . 7.1 6.5 6.6 6.7 6.4 6.4 6.5 6.2 6.3 6.3
Price Components (1995 cents per kilowatthour)Capital Component . . . . . . . . . . . . . . . . . . . . . . . . 2.6 2.5 2.5 2.5 2.3 2.3 2.4 2.2 2.2 2.3Fuel Component . . . . . . . . . . . . . . . . . . . . . . . . . . 1.1 1.1 1.1 1.1 1.0 1.0 1.0 0.9 0.9 0.9Operation and Maintenance Component . . . . . . . . . 3.0 2.5 2.5 2.5 2.5 2.5 2.5 2.3 2.3 2.3Wholesale Power Cost . . . . . . . . . . . . . . . . . . . . . . 0.4 0.5 0.6 0.6 0.6 0.7 0.7 0.8 0.8 0.8
Total . . . . . . . . . . . . . . . . . . . . . . . . . . . . . . . . . 7.1 6.5 6.6 6.7 6.4 6.4 6.5 6.2 6.3 6.3
1Includes grid-connected generation at all utilities and nonutilities except for cogenerators. Includes small power producers, exempt wholesale generators, and generators atindustrial and commercial facilities which provide electricity for on-site use and for sales to utilities.
2Includes conventional hydroelectric, geothermal, wood, wood waste, municipal solid waste, other biomass, solar, and wind power.3Includes cogeneration at facilities whose primary function is not electricity production. Includes sales to utilities and generation for own use.4Other gaseous fuels include refinery and still gas.5Other includes hydrogen, sulfur, batteries, chemicals, fish oil, and spent sulfite liquor.6Prices represent average revenue per kilowatthour.Note: Totals may not equal sum of components due to independent rounding.Sources: 1995 commercial and transportation sales derived from: Total transportation plus commercial sales come from Energy Information Administration (EIA), State Energy
Data Report 1993, DOE/EIA-0214(93) (Washington, DC, July 1995), but individual sectors do not match because sales taken from commercial and placed in transportation, accordingto Oak Ridge National Laboratories, Transportation Energy Data Book 15 (May 1995) which indicates the transportation value should be higher. 1995 generation by electric utilities,nonutilities, and cogenerators, net electricity imports, residential sales, and industrial sales: EIA, Annual Energy Review 1995, DOE/EIA-0384(95) (Washington, DC, July 1996). 1995residential electricity prices derived from EIA, Short Term Energy Outlook, DOE/EIA-0202(96/4Q) (Washington, DC, October 1996). 1995 electricity prices for commercial,industrial, and transportation; price components; and projections: EIA, AEO97 National Energy Modeling System runs LWOP97.D100696A, AEO97B.D100296K, andHWOP97.D100296B.
164 Energy Information Administration/ Annual Energy Outlook 1997

Oil Price Case Comparisons
Table C9. Electricity Generating Capability(Thousand Megawatts)
Net Summer Capability 1 1995
Projections
2005 2010 2015
LowWorld Oil
PriceReference
HighWorld Oil
Price
LowWorld Oil
PriceReference
HighWorld Oil
Price
LowWorld Oil
PriceReference
HighWorld Oil
Price
Electric Generators 2
CapabilityCoal Steam . . . . . . . . . . . . . . . . . . . . . . . . . . . . . 304.9 298.5 298.2 300.9 303.2 304.0 305.4 311.7 315.4 318.3Other Fossil Steam3 . . . . . . . . . . . . . . . . . . . . . . 139.6 102.6 102.6 102.6 99.9 99.9 99.9 96.1 96.1 96.1Combined Cycle . . . . . . . . . . . . . . . . . . . . . . . . . 14.7 50.6 73.5 75.4 77.4 107.5 107.3 120.8 153.0 149.4Combustion Turbine/Diesel . . . . . . . . . . . . . . . . . 56.0 150.7 134.5 134.6 174.8 153.1 151.6 198.2 168.3 168.3Nuclear Power . . . . . . . . . . . . . . . . . . . . . . . . . . 99.2 94.7 94.7 94.7 88.9 88.9 88.9 62.7 62.7 62.7Pumped Storage . . . . . . . . . . . . . . . . . . . . . . . . . 19.9 19.9 19.9 19.9 19.9 19.9 19.9 19.9 19.9 19.9Fuel Cells . . . . . . . . . . . . . . . . . . . . . . . . . . . . . . 0.0 1.7 2.0 2.2 1.8 2.1 3.2 1.9 2.1 3.3Renewable Sources4 . . . . . . . . . . . . . . . . . . . . . . 88.0 91.8 92.2 91.9 93.6 94.1 94.2 97.0 98.3 100.5
Total . . . . . . . . . . . . . . . . . . . . . . . . . . . . . . . . 722.2 810.4 817.5 822.1 859.5 869.4 870.4 908.4 915.8 918.6
Cumulative Planned Additions 5
Coal Steam . . . . . . . . . . . . . . . . . . . . . . . . . . . . . 1.4 3.7 3.7 3.7 5.3 5.3 5.3 5.3 5.3 5.3Other Fossil Steam3 . . . . . . . . . . . . . . . . . . . . . . 0.0 0.0 0.0 0.0 0.0 0.0 0.0 0.0 0.0 0.0Combined Cycle . . . . . . . . . . . . . . . . . . . . . . . . . 1.4 2.0 2.0 2.0 2.0 2.0 2.0 2.0 2.0 2.0Combustion Turbine/Diesel . . . . . . . . . . . . . . . . . 3.2 4.5 4.5 4.5 4.5 4.5 4.5 4.5 4.5 4.5Nuclear Power . . . . . . . . . . . . . . . . . . . . . . . . . . 0.0 1.2 1.2 1.2 1.2 1.2 1.2 1.2 1.2 1.2Pumped Storage . . . . . . . . . . . . . . . . . . . . . . . . . 1.1 1.1 1.1 1.1 1.1 1.1 1.1 1.1 1.1 1.1Fuel Cells . . . . . . . . . . . . . . . . . . . . . . . . . . . . . . 0.0 0.0 0.0 0.0 0.0 0.0 0.0 0.0 0.0 0.0Renewable Sources4 . . . . . . . . . . . . . . . . . . . . . . 0.7 2.9 2.9 2.9 2.9 2.9 2.9 2.9 2.9 2.9
Total . . . . . . . . . . . . . . . . . . . . . . . . . . . . . . . . 8.0 15.5 15.5 15.5 17.1 17.1 17.1 17.1 17.1 17.1
Cumulative Unplanned Additions 5
Coal Steam . . . . . . . . . . . . . . . . . . . . . . . . . . . . . 0.0 9.7 9.5 12.2 15.6 16.4 17.8 27.9 31.6 34.5Other Fossil Steam3 . . . . . . . . . . . . . . . . . . . . . . 0.0 0.0 0.0 0.0 0.0 0.0 0.0 0.0 0.0 0.0Combined Cycle . . . . . . . . . . . . . . . . . . . . . . . . . 0.0 35.1 58.0 59.9 61.9 91.9 91.8 105.3 137.5 133.9Combustion Turbine/Diesel . . . . . . . . . . . . . . . . . 0.1 94.4 78.2 78.3 118.9 97.1 95.7 143.4 113.5 113.5Nuclear Power . . . . . . . . . . . . . . . . . . . . . . . . . . 0.0 0.0 0.0 0.0 0.0 0.0 0.0 0.0 0.0 0.0Pumped Storage . . . . . . . . . . . . . . . . . . . . . . . . . 0.0 0.0 0.0 0.0 0.0 0.0 0.0 0.0 0.0 0.0Fuel Cells . . . . . . . . . . . . . . . . . . . . . . . . . . . . . . 0.0 1.7 2.0 2.2 1.8 2.1 3.2 1.9 2.1 3.3Renewable Sources3 . . . . . . . . . . . . . . . . . . . . . . 0.0 1.4 1.8 1.6 3.4 3.9 4.0 7.1 8.4 10.6
Total . . . . . . . . . . . . . . . . . . . . . . . . . . . . . . . . 0.1 142.4 149.5 154.0 201.5 211.4 212.4 285.6 293.1 295.8
Cumulative Total Additions . . . . . . . . . . . . . . . . . 8.2 157.9 165.0 169.5 218.6 228.5 229.5 302.7 310.2 312.9
Cumulative Retirements 6 . . . . . . . . . . . . . . . . . . . 11.9 72.1 72.1 72.1 83.9 83.9 83.9 119.1 119.1 119.1
Energy Information Administration/ Annual Energy Outlook 1997 165

Oil Price Case Comparisons
Table C9. Electricity Generating Capability (Continued)(Thousand Megawatts)
Net Summer Capability 1 1995
Projections
2005 2010 2015
LowWorld Oil
PriceReference
HighWorld Oil
Price
LowWorld Oil
PriceReference
HighWorld Oil
Price
LowWorld Oil
PriceReference
HighWorld Oil
Price
Cogenerators 7
CapacityCoal . . . . . . . . . . . . . . . . . . . . . . . . . . . . . . . . . . 8.2 9.0 9.0 8.9 9.3 9.3 9.2 9.5 9.5 9.4Petroleum . . . . . . . . . . . . . . . . . . . . . . . . . . . . . . 0.9 0.9 0.9 0.9 1.0 1.0 1.0 1.0 1.0 1.0Natural Gas . . . . . . . . . . . . . . . . . . . . . . . . . . . . 28.9 30.9 32.1 33.0 31.5 33.3 34.6 32.1 34.2 35.3Other Gaseous Fuels . . . . . . . . . . . . . . . . . . . . . 1.0 0.9 0.9 0.9 0.9 0.9 0.9 0.9 0.9 0.9Renewable Sources4 . . . . . . . . . . . . . . . . . . . . . . 6.2 7.3 7.3 7.3 7.8 7.8 7.8 8.2 8.2 8.2Other . . . . . . . . . . . . . . . . . . . . . . . . . . . . . . . . . 0.0 0.0 0.0 0.0 0.0 0.0 0.0 0.0 0.0 0.0
Total . . . . . . . . . . . . . . . . . . . . . . . . . . . . . . . . 45.1 49.0 50.2 51.1 50.5 52.3 53.5 51.8 53.8 54.8
Cumulative Additions 5 . . . . . . . . . . . . . . . . . . . . . 10.2 14.1 15.3 16.2 15.6 17.3 18.5 16.8 18.8 19.9
1Net summer capability is the steady hourly output that generating equipment is expected to supply to system load (exclusive of auxiliary power), as demonstrated by tests duringsummer peak demand.
2Includes grid-connected utilities and nonutilities except for cogenerators. Includes small power producers, exempt wholesale generators, and generators at industrial andcommercial facilities which produce electricity for on-site use and sales to utilities.
3Includes oil-, gas-, and dual-fired capability.4Includes conventional hydroelectric, geothermal, wood, wood waste, municipal solid waste, other biomass, solar and wind power.5Cumulative additions after December 31, 1994.6Cumulative total retirements from 1990.7Nameplate capacity is reported for nonutilities on Form EIA-867, “Annual Power Producer Report.” Nameplate capacity is designated by the manufacturer. The nameplate capacity
has been converted to the net summer capability based on historic relationships.Notes: Totals may not equal sum of components due to independent rounding. Net summer capability has been estimated for nonutility generators for AEO97. Net summer
capacity is used to be consistent with electric utility capacity estimates. Data for electric utility capacity are the most recent data available as of August 15, 1996. Therefore, capacityestimates may differ from other Energy Information Administration sources.
Sources: 1995 net summer capability at electric utilities and planned additions: Energy Information Administration (EIA), Form EIA-860, “Annual Electric Generator Report.” Netsummer capability for nonutilities and cogeneration in 1995 and planned additions estimated based on EIA, Form EIA-867, “Annual Nonutility Power Producer Report.” Projections:EIA, AEO97 National Energy Modeling System runs LWOP97.D100696A, AEO97B.D100296K, and HWOP97.D100296B.
166 Energy Information Administration/ Annual Energy Outlook 1997

Oil Price Case Comparisons
Table C10. Electricity Trade(Billion Kilowatthours, Unless Otherwise Noted)
Electricity Trade 1995
Projections
2005 2010 2015
LowWorld Oil
PriceReference
HighWorld Oil
Price
LowWorld Oil
PriceReference
HighWorld Oil
Price
LowWorld Oil
PriceReference
HighWorld Oil
Price
Interregional Electricity Trade
Gross Domestic Firm Power Sales . . . . . . . . . . . 155.0 139.2 139.2 139.2 139.2 139.2 139.2 139.2 139.2 139.2Gross Domestic Economy Sales . . . . . . . . . . . . . 81.6 66.5 61.3 69.6 68.1 77.6 83.2 69.5 79.4 79.6
Gross Domestic Trade . . . . . . . . . . . . . . . . . . 236.6 205.7 200.5 208.9 207.3 216.8 222.4 208.7 218.6 218.8
Gross Domestic Firm Power Sales(million 1995 dollars) . . . . . . . . . . . . . . . . . . . . . 7023.5 6309.0 6309.0 6309.0 6309.0 6309.0 6309.0 6309.0 6309.0 6309.0Gross Domestic Economy Sales(million 1995 dollars) . . . . . . . . . . . . . . . . . . . . . 1958.3 1439.9 1420.8 1743.5 1452.4 1753.8 2014.1 1598.1 1831.4 2020.9
Gross Domestic Sales(million 1995 dollars) . . . . . . . . . . . . . . . . . . . 8981.7 7748.9 7729.8 8052.5 7761.4 8062.8 8323.1 7907.1 8140.4 8329.9
International Electricity Trade
Firm Power Imports From Canada and Mexico . . 30.2 17.8 19.7 17.8 18.6 18.6 18.6 18.6 18.6 18.6Economy Imports From Canada and Mexico . . . . 18.0 35.2 35.2 35.2 33.6 33.6 33.6 29.2 29.2 29.2
Gross Imports From Canada and Mexico . . . 48.3 52.9 54.8 52.9 52.2 52.2 52.2 47.9 47.9 47.9
Firm Power Exports To Canada and Mexico . . . . 3.4 13.4 13.4 13.4 13.4 13.4 13.4 13.4 13.4 13.4Economy Exports To Canada and Mexico . . . . . . 7.2 7.0 7.0 7.0 7.7 7.7 7.7 7.7 7.7 7.7
Gross Exports To Canada and Mexico . . . . . 10.6 20.3 20.3 20.3 21.0 21.0 21.0 21.0 21.0 21.0
Note: Totals may not equal sum of components due to independent rounding. Firm Power Sales are capacity sales, meaning the delivery of the power is scheduled as part of thenormal operating conditions of the affected electric systems. Economy Sales are subject to curtailment or cessation of delivery by the supplier in accordance with prior agreements orunder specified conditions.
Sources: 1995 interregional electricity trade data: Energy Information Administration (EIA), Bulk Power Data System. 1995 international electricity trade data: DOE Form FE-718R,“Annual Report of International Electrical Export/Import Data.” Firm/economy share: National Energy Board, Annual Report 1993. Planned interregional and international firm powersales: DOE Form IE-411, “Coordinated Bulk Power Supply Program Report” (April 1995). Projections: EIA, AEO97 National Energy Modeling System runs LWOP97.D100696A,AEO97B.D100296K, and HWOP97.D100296B.
Energy Information Administration/ Annual Energy Outlook 1997 167
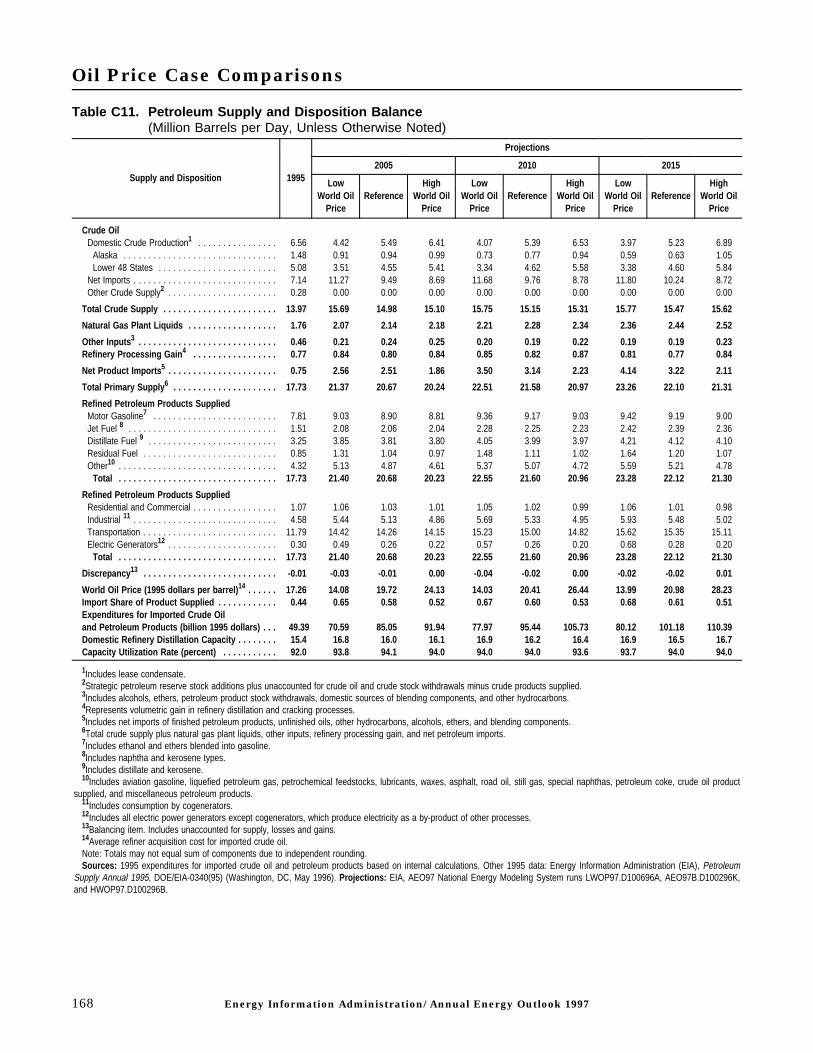
Oil Price Case Comparisons
Table C11. Petroleum Supply and Disposition Balance(Million Barrels per Day, Unless Otherwise Noted)
Supply and Disposition 1995
Projections
2005 2010 2015
LowWorld Oil
PriceReference
HighWorld Oil
Price
LowWorld Oil
PriceReference
HighWorld Oil
Price
LowWorld Oil
PriceReference
HighWorld Oil
Price
Crude OilDomestic Crude Production1 . . . . . . . . . . . . . . . . 6.56 4.42 5.49 6.41 4.07 5.39 6.53 3.97 5.23 6.89
Alaska . . . . . . . . . . . . . . . . . . . . . . . . . . . . . . . 1.48 0.91 0.94 0.99 0.73 0.77 0.94 0.59 0.63 1.05Lower 48 States . . . . . . . . . . . . . . . . . . . . . . . . 5.08 3.51 4.55 5.41 3.34 4.62 5.58 3.38 4.60 5.84
Net Imports . . . . . . . . . . . . . . . . . . . . . . . . . . . . . 7.14 11.27 9.49 8.69 11.68 9.76 8.78 11.80 10.24 8.72Other Crude Supply2 . . . . . . . . . . . . . . . . . . . . . . 0.28 0.00 0.00 0.00 0.00 0.00 0.00 0.00 0.00 0.00
Total Crude Supply . . . . . . . . . . . . . . . . . . . . . . . 13.97 15.69 14.98 15.10 15.75 15.15 15.31 15.77 15.47 15.62
Natural Gas Plant Liquids . . . . . . . . . . . . . . . . . . 1.76 2.07 2.14 2.18 2.21 2.28 2.34 2.36 2.44 2.52
Other Inputs 3 . . . . . . . . . . . . . . . . . . . . . . . . . . . . 0.46 0.21 0.24 0.25 0.20 0.19 0.22 0.19 0.19 0.23Refinery Processing Gain 4 . . . . . . . . . . . . . . . . . 0.77 0.84 0.80 0.84 0.85 0.82 0.87 0.81 0.77 0.84
Net Product Imports 5 . . . . . . . . . . . . . . . . . . . . . . 0.75 2.56 2.51 1.86 3.50 3.14 2.23 4.14 3.22 2.11
Total Primary Supply 6 . . . . . . . . . . . . . . . . . . . . . 17.73 21.37 20.67 20.24 22.51 21.58 20.97 23.26 22.10 21.31
Refined Petroleum Products SuppliedMotor Gasoline7 . . . . . . . . . . . . . . . . . . . . . . . . . 7.81 9.03 8.90 8.81 9.36 9.17 9.03 9.42 9.19 9.00Jet Fuel 8 . . . . . . . . . . . . . . . . . . . . . . . . . . . . . . 1.51 2.08 2.06 2.04 2.28 2.25 2.23 2.42 2.39 2.36Distillate Fuel 9 . . . . . . . . . . . . . . . . . . . . . . . . . . 3.25 3.85 3.81 3.80 4.05 3.99 3.97 4.21 4.12 4.10Residual Fuel . . . . . . . . . . . . . . . . . . . . . . . . . . . 0.85 1.31 1.04 0.97 1.48 1.11 1.02 1.64 1.20 1.07Other10 . . . . . . . . . . . . . . . . . . . . . . . . . . . . . . . . 4.32 5.13 4.87 4.61 5.37 5.07 4.72 5.59 5.21 4.78
Total . . . . . . . . . . . . . . . . . . . . . . . . . . . . . . . . 17.73 21.40 20.68 20.23 22.55 21.60 20.96 23.28 22.12 21.30
Refined Petroleum Products SuppliedResidential and Commercial . . . . . . . . . . . . . . . . . 1.07 1.06 1.03 1.01 1.05 1.02 0.99 1.06 1.01 0.98Industrial 11 . . . . . . . . . . . . . . . . . . . . . . . . . . . . . 4.58 5.44 5.13 4.86 5.69 5.33 4.95 5.93 5.48 5.02Transportation . . . . . . . . . . . . . . . . . . . . . . . . . . . 11.79 14.42 14.26 14.15 15.23 15.00 14.82 15.62 15.35 15.11Electric Generators12 . . . . . . . . . . . . . . . . . . . . . . 0.30 0.49 0.26 0.22 0.57 0.26 0.20 0.68 0.28 0.20
Total . . . . . . . . . . . . . . . . . . . . . . . . . . . . . . . . 17.73 21.40 20.68 20.23 22.55 21.60 20.96 23.28 22.12 21.30
Discrepancy 13 . . . . . . . . . . . . . . . . . . . . . . . . . . . -0.01 -0.03 -0.01 0.00 -0.04 -0.02 0.00 -0.02 -0.02 0.01
World Oil Price (1995 dollars per barrel) 14 . . . . . . 17.26 14.08 19.72 24.13 14.03 20.41 26.44 13.99 20.98 28.23Import Share of Product Supplied . . . . . . . . . . . . 0.44 0.65 0.58 0.52 0.67 0.60 0.53 0.68 0.61 0.51Expenditures for Imported Crude Oiland Petroleum Products (billion 1995 dollars) . . . 49.39 70.59 85.05 91.94 77.97 95.44 105.73 80.12 101.18 110.39Domestic Refinery Distillation Capacity . . . . . . . . 15.4 16.8 16.0 16.1 16.9 16.2 16.4 16.9 16.5 16.7Capacity Utilization Rate (percent) . . . . . . . . . . . 92.0 93.8 94.1 94.0 94.0 94.0 93.6 93.7 94.0 94.0
1Includes lease condensate.2Strategic petroleum reserve stock additions plus unaccounted for crude oil and crude stock withdrawals minus crude products supplied.3Includes alcohols, ethers, petroleum product stock withdrawals, domestic sources of blending components, and other hydrocarbons.4Represents volumetric gain in refinery distillation and cracking processes.5Includes net imports of finished petroleum products, unfinished oils, other hydrocarbons, alcohols, ethers, and blending components.6Total crude supply plus natural gas plant liquids, other inputs, refinery processing gain, and net petroleum imports.7Includes ethanol and ethers blended into gasoline.8Includes naphtha and kerosene types.9Includes distillate and kerosene.10Includes aviation gasoline, liquefied petroleum gas, petrochemical feedstocks, lubricants, waxes, asphalt, road oil, still gas, special naphthas, petroleum coke, crude oil product
supplied, and miscellaneous petroleum products.11Includes consumption by cogenerators.12Includes all electric power generators except cogenerators, which produce electricity as a by-product of other processes.13Balancing item. Includes unaccounted for supply, losses and gains.14Average refiner acquisition cost for imported crude oil.Note: Totals may not equal sum of components due to independent rounding.Sources: 1995 expenditures for imported crude oil and petroleum products based on internal calculations. Other 1995 data: Energy Information Administration (EIA), Petroleum
Supply Annual 1995, DOE/EIA-0340(95) (Washington, DC, May 1996). Projections: EIA, AEO97 National Energy Modeling System runs LWOP97.D100696A, AEO97B.D100296K,and HWOP97.D100296B.
168 Energy Information Administration/ Annual Energy Outlook 1997

Oil Price Case Comparisons
Table C12. Petroleum Product Prices(1995 Cents per Gallon, Unless Otherwise Noted)
Sector and Fuel 1995
Projections
2005 2010 2015
LowWorld Oil
PriceReference
HighWorld Oil
Price
LowWorld Oil
PriceReference
HighWorld Oil
Price
LowWorld Oil
PriceReference
HighWorld Oil
Price
World Oil Price (dollars per barrel) . . . . . . . . . . . 17.26 14.08 19.72 24.13 14.03 20.41 26.44 13.99 20.98 28.23
Delivered Sector Product Prices
ResidentialDistillate Fuel . . . . . . . . . . . . . . . . . . . . . . . . . . . 86.5 87.2 100.9 110.8 88.6 103.3 116.0 86.1 101.7 117.9Liquefied Petroleum Gas . . . . . . . . . . . . . . . . . . . 88.8 92.5 98.4 106.5 93.8 102.3 111.8 92.7 99.9 112.2
CommercialDistillate Fuel . . . . . . . . . . . . . . . . . . . . . . . . . . . 60.8 59.3 73.3 83.2 60.4 75.4 88.4 57.6 73.7 90.0Residual Fuel . . . . . . . . . . . . . . . . . . . . . . . . . . . 44.7 30.8 42.9 52.6 31.0 44.6 58.0 30.0 45.3 61.5Residual Fuel (dollars per barrel) . . . . . . . . . . . . . 18.78 12.94 18.02 22.08 13.00 18.73 24.38 12.58 19.02 25.82
Industrial 1
Distillate Fuel . . . . . . . . . . . . . . . . . . . . . . . . . . . 63.9 58.5 72.3 82.2 59.9 74.6 87.8 57.5 73.3 89.5Liquefied Petroleum Gas . . . . . . . . . . . . . . . . . . . 56.4 46.2 51.8 59.1 46.9 54.2 63.7 45.1 51.4 63.0Residual Fuel . . . . . . . . . . . . . . . . . . . . . . . . . . . 38.2 29.4 43.7 53.3 29.2 45.3 58.1 27.3 45.1 61.4Residual Fuel (dollars per barrel) . . . . . . . . . . . . . 16.06 12.34 18.36 22.39 12.27 19.04 24.40 11.48 18.95 25.78
TransportationDistillate Fuel 2 . . . . . . . . . . . . . . . . . . . . . . . . . . 111.4 107.2 120.6 130.0 105.3 120.4 133.5 100.3 116.2 132.8Jet Fuel 3 . . . . . . . . . . . . . . . . . . . . . . . . . . . . . . 52.0 58.6 73.7 82.6 59.7 76.3 91.2 56.3 73.5 91.0Motor Gasoline4 . . . . . . . . . . . . . . . . . . . . . . . . . 114.8 106.9 121.2 131.7 105.4 121.8 135.8 100.6 117.4 134.5Residual Fuel . . . . . . . . . . . . . . . . . . . . . . . . . . . 36.5 30.4 43.4 53.4 31.9 47.3 62.0 29.7 46.0 62.7Residual Fuel (dollars per barrel) . . . . . . . . . . . . . 15.32 12.78 18.24 22.45 13.38 19.86 26.02 12.46 19.33 26.32
Electric Generators 5
Distillate Fuel . . . . . . . . . . . . . . . . . . . . . . . . . . . 54.7 52.4 66.1 76.0 53.4 68.3 81.2 51.0 67.0 83.1Residual Fuel . . . . . . . . . . . . . . . . . . . . . . . . . . . 39.2 29.5 44.4 54.5 30.6 47.2 61.9 29.9 46.5 64.9Residual Fuel (dollars per barrel) . . . . . . . . . . . . . 16.45 12.38 18.66 22.90 12.86 19.82 26.01 12.56 19.54 27.25
Refined Petroleum Product Prices 6
Distillate Fuel 2 . . . . . . . . . . . . . . . . . . . . . . . . . . 96.8 93.8 107.5 117.1 92.9 108.2 121.3 88.6 104.9 121.4Jet Fuel 3 . . . . . . . . . . . . . . . . . . . . . . . . . . . . . . 52.0 58.6 73.7 82.6 59.7 76.3 91.2 56.3 73.5 91.0Liquefied Petroleum Gas . . . . . . . . . . . . . . . . . . . 62.2 56.3 62.2 69.8 57.7 65.6 75.4 56.3 63.2 75.3Motor Gasoline4 . . . . . . . . . . . . . . . . . . . . . . . . . 114.8 106.7 120.9 131.5 105.3 121.6 135.6 100.5 117.2 134.3Residual Fuel . . . . . . . . . . . . . . . . . . . . . . . . . . . 38.1 30.0 43.6 53.5 31.0 46.9 61.3 29.4 46.0 62.7Residual Fuel (dollars per barrel) . . . . . . . . . . . . . 16.01 12.59 18.32 22.49 13.03 19.69 25.75 12.36 19.31 26.34
Average . . . . . . . . . . . . . . . . . . . . . . . . . . . . . . 92.4 85.3 99.4 109.5 84.2 100.4 114.2 79.8 96.4 113.2
1Includes cogenerators.2Includes Federal and State taxes on diesel fuel and excludes county and local taxes.3Kerosene-type jet fuel.4Sales weighted-average price for all grades. Includes Federal and State taxes and excludes county and local taxes.5Includes all electric power generators except cogenerators, which produce electricity as a by-product of other processes.6Weighted averages of end-use fuel prices are derived from the prices in each sector and the corresponding sectoral consumption.
Sources: 1995 prices for gasoline, distillate, and jet fuel are based on prices in various issues of Energy Information Administration (EIA), Petroleum Marketing Monthly, DOE/EIA-0380(95/3-96/4) (Washington, DC, 1995-1996). 1995 prices for all other petroleum products are derived from EIA, State Energy Price and Expenditures Report: 1993, DOE/EIA-0376(93) (Washington, DC, December 1995). Projections: EIA, AEO97 National Energy Modeling System runs LWOP97.D100696A, AEO97B.D100296K, and HWOP97.D100296B.
Energy Information Administration/ Annual Energy Outlook 1997 169

Oil Price Case Comparisons
Table C13. Natural Gas Supply and Disposition(Trillion Cubic Feet per Year)
Supply and Disposition 1995
Projections
2005 2010 2015
LowWorld Oil
PriceReference
HighWorld Oil
Price
LowWorld Oil
PriceReference
HighWorld Oil
Price
LowWorld Oil
PriceReference
HighWorld Oil
Price
ProductionDry Gas Production1 . . . . . . . . . . . . . . . . . . . . . . 18.49 21.85 22.66 23.10 23.46 24.25 24.92 25.22 26.10 26.93Supplemental Natural Gas2 . . . . . . . . . . . . . . . . . 0.13 0.06 0.06 0.06 0.06 0.06 0.06 0.06 0.06 0.06
Net Imports . . . . . . . . . . . . . . . . . . . . . . . . . . . . . 2.68 3.69 3.69 3.69 3.92 3.92 3.92 4.23 4.23 4.23Canada . . . . . . . . . . . . . . . . . . . . . . . . . . . . . . . 2.79 3.52 3.52 3.52 3.74 3.74 3.74 4.06 4.06 4.06Mexico . . . . . . . . . . . . . . . . . . . . . . . . . . . . . . . . -0.05 -0.11 -0.11 -0.11 -0.12 -0.12 -0.12 -0.12 -0.12 -0.12Liquefied Natural Gas . . . . . . . . . . . . . . . . . . . . . -0.05 0.27 0.27 0.27 0.29 0.29 0.29 0.29 0.29 0.29
Total Supply . . . . . . . . . . . . . . . . . . . . . . . . . . . . 21.30 25.60 26.41 26.85 27.44 28.23 28.89 29.51 30.39 31.22
Consumption by SectorResidential . . . . . . . . . . . . . . . . . . . . . . . . . . . . . 4.87 5.31 5.27 5.26 5.45 5.42 5.40 5.58 5.57 5.56Commercial . . . . . . . . . . . . . . . . . . . . . . . . . . . . 3.07 3.33 3.34 3.34 3.42 3.44 3.43 3.52 3.55 3.55Industrial 3 . . . . . . . . . . . . . . . . . . . . . . . . . . . . . 8.33 8.85 9.27 9.65 9.03 9.56 10.08 8.98 9.65 10.28Electric Generators4 . . . . . . . . . . . . . . . . . . . . . . 3.46 5.51 5.88 5.92 6.65 6.94 7.07 8.34 8.52 8.67Lease and Plant Fuel 5 . . . . . . . . . . . . . . . . . . . . 1.14 1.41 1.45 1.48 1.51 1.55 1.58 1.61 1.65 1.70Pipeline Fuel . . . . . . . . . . . . . . . . . . . . . . . . . . . . 0.70 0.80 0.82 0.83 0.86 0.86 0.86 0.91 0.91 0.93Transportation6 . . . . . . . . . . . . . . . . . . . . . . . . . . 0.01 0.18 0.18 0.18 0.26 0.25 0.25 0.31 0.30 0.30
Total . . . . . . . . . . . . . . . . . . . . . . . . . . . . . . . . 21.58 25.39 26.22 26.66 27.18 28.01 28.68 29.25 30.16 31.00
Discrepancy 7 . . . . . . . . . . . . . . . . . . . . . . . . . . . . -0.28 0.21 0.19 0.19 0.26 0.22 0.21 0.26 0.23 0.22
1Marketed production (wet) minus extraction losses.2Synthetic natural gas, propane air, coke oven gas, refinery gas, biomass gas, air injected for Btu stabilization, and manufactured gas commingled and distributed with natural gas.3Includes consumption by cogenerators.4Includes all electric power generators except cogenerators, which produce electricity as a by product of other processes.5Represents natural gas used in the field gathering and processing plant machinery.6Compressed natural gas used as vehicle fuel.7Balancing item. Natural gas lost as a result of converting flow data measured at varying temperatures and pressures to a standard temperature and pressure and the merger of
different data reporting systems which vary in scope, format, definition, and respondent type. In addition, 1995 values include net storage injections.Btu = British thermal unit.Note: Totals may not equal sum of components due to independent rounding. Figures for 1995 may differ from published data due to internal conversion factors.Sources: 1995 supplemental natural gas: Energy Information Administration (EIA), Natural Gas Monthly, DOE/EIA-0130(96/6) (Washington, DC, June 1996). 1995 imports and dry
gas production derived from: EIA, Natural Gas Annual 1995, DOE/EIA-0131(95) (Washington, DC, November 1996). 1995 transportation sector consumption: EIA, AEO97 NationalEnergy Modeling System runs LWOP97.D100696A, AEO97B.D100296K, and HWOP97.D100296B. Other 1995 consumption: EIA, Short-Term Energy Outlook, DOE/EIA-0202(96/4Q)(Washington, DC, October 1996) with adjustments to end-use sector consumption levels for consumption of natural gas by electric wholesale generators based on EIA, AEO97National Energy Modeling System runs LWOP97.D100696A, AEO97B.D100296K, and HWOP97.D100296B. Projections: EIA, AEO97 National Energy Modeling System runsLWOP97.D100696A, AEO97B.D100296K, and HWOP97.D100296B.
170 Energy Information Administration/ Annual Energy Outlook 1997
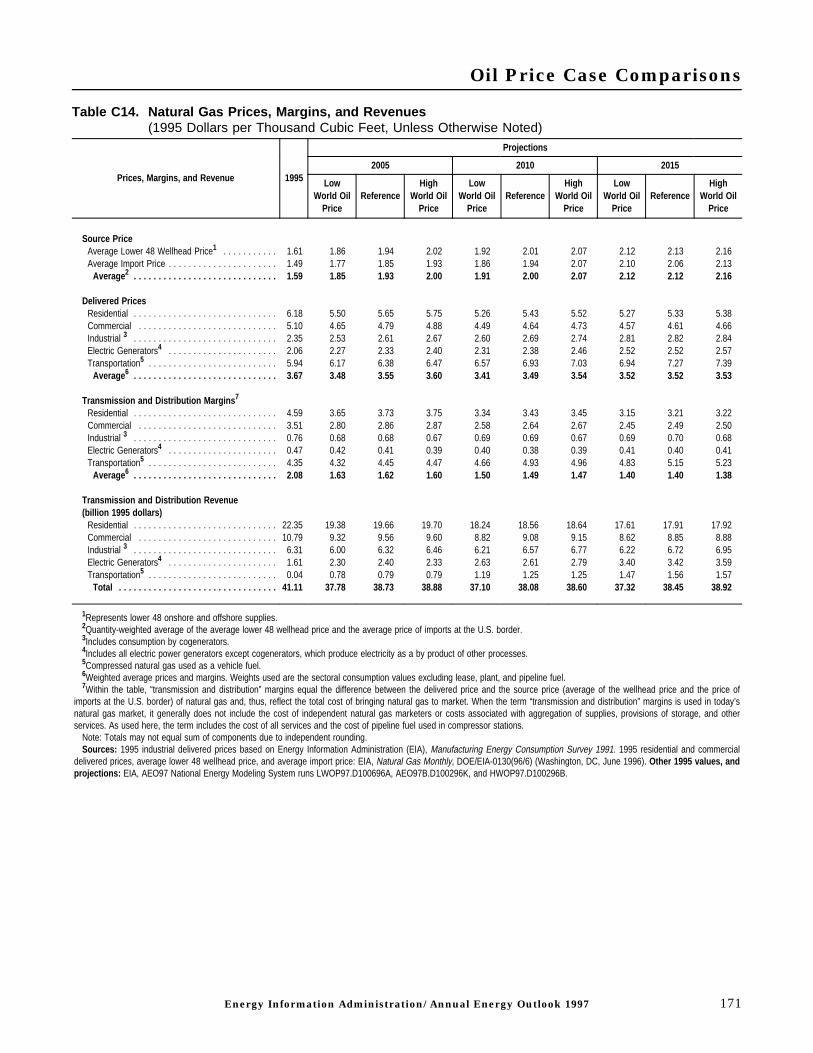
Oil Price Case Comparisons
Table C14. Natural Gas Prices, Margins, and Revenues(1995 Dollars per Thousand Cubic Feet, Unless Otherwise Noted)
Prices, Margins, and Revenue 1995
Projections
2005 2010 2015
LowWorld Oil
PriceReference
HighWorld Oil
Price
LowWorld Oil
PriceReference
HighWorld Oil
Price
LowWorld Oil
PriceReference
HighWorld Oil
Price
Source PriceAverage Lower 48 Wellhead Price1 . . . . . . . . . . . 1.61 1.86 1.94 2.02 1.92 2.01 2.07 2.12 2.13 2.16Average Import Price . . . . . . . . . . . . . . . . . . . . . . 1.49 1.77 1.85 1.93 1.86 1.94 2.07 2.10 2.06 2.13
Average 2 . . . . . . . . . . . . . . . . . . . . . . . . . . . . . 1.59 1.85 1.93 2.00 1.91 2.00 2.07 2.12 2.12 2.16
Delivered PricesResidential . . . . . . . . . . . . . . . . . . . . . . . . . . . . . 6.18 5.50 5.65 5.75 5.26 5.43 5.52 5.27 5.33 5.38Commercial . . . . . . . . . . . . . . . . . . . . . . . . . . . . 5.10 4.65 4.79 4.88 4.49 4.64 4.73 4.57 4.61 4.66Industrial 3 . . . . . . . . . . . . . . . . . . . . . . . . . . . . . 2.35 2.53 2.61 2.67 2.60 2.69 2.74 2.81 2.82 2.84Electric Generators4 . . . . . . . . . . . . . . . . . . . . . . 2.06 2.27 2.33 2.40 2.31 2.38 2.46 2.52 2.52 2.57Transportation5 . . . . . . . . . . . . . . . . . . . . . . . . . . 5.94 6.17 6.38 6.47 6.57 6.93 7.03 6.94 7.27 7.39
Average 6 . . . . . . . . . . . . . . . . . . . . . . . . . . . . . 3.67 3.48 3.55 3.60 3.41 3.49 3.54 3.52 3.52 3.53
Transmission and Distribution Margins 7
Residential . . . . . . . . . . . . . . . . . . . . . . . . . . . . . 4.59 3.65 3.73 3.75 3.34 3.43 3.45 3.15 3.21 3.22Commercial . . . . . . . . . . . . . . . . . . . . . . . . . . . . 3.51 2.80 2.86 2.87 2.58 2.64 2.67 2.45 2.49 2.50Industrial 3 . . . . . . . . . . . . . . . . . . . . . . . . . . . . . 0.76 0.68 0.68 0.67 0.69 0.69 0.67 0.69 0.70 0.68Electric Generators4 . . . . . . . . . . . . . . . . . . . . . . 0.47 0.42 0.41 0.39 0.40 0.38 0.39 0.41 0.40 0.41Transportation5 . . . . . . . . . . . . . . . . . . . . . . . . . . 4.35 4.32 4.45 4.47 4.66 4.93 4.96 4.83 5.15 5.23
Average 6 . . . . . . . . . . . . . . . . . . . . . . . . . . . . . 2.08 1.63 1.62 1.60 1.50 1.49 1.47 1.40 1.40 1.38
Transmission and Distribution Revenue(billion 1995 dollars)
Residential . . . . . . . . . . . . . . . . . . . . . . . . . . . . . 22.35 19.38 19.66 19.70 18.24 18.56 18.64 17.61 17.91 17.92Commercial . . . . . . . . . . . . . . . . . . . . . . . . . . . . 10.79 9.32 9.56 9.60 8.82 9.08 9.15 8.62 8.85 8.88Industrial 3 . . . . . . . . . . . . . . . . . . . . . . . . . . . . . 6.31 6.00 6.32 6.46 6.21 6.57 6.77 6.22 6.72 6.95Electric Generators4 . . . . . . . . . . . . . . . . . . . . . . 1.61 2.30 2.40 2.33 2.63 2.61 2.79 3.40 3.42 3.59Transportation5 . . . . . . . . . . . . . . . . . . . . . . . . . . 0.04 0.78 0.79 0.79 1.19 1.25 1.25 1.47 1.56 1.57
Total . . . . . . . . . . . . . . . . . . . . . . . . . . . . . . . . 41.11 37.78 38.73 38.88 37.10 38.08 38.60 37.32 38.45 38.92
1Represents lower 48 onshore and offshore supplies.2Quantity-weighted average of the average lower 48 wellhead price and the average price of imports at the U.S. border.3Includes consumption by cogenerators.4Includes all electric power generators except cogenerators, which produce electricity as a by product of other processes.5Compressed natural gas used as a vehicle fuel.6Weighted average prices and margins. Weights used are the sectoral consumption values excluding lease, plant, and pipeline fuel.7Within the table, “transmission and distribution” margins equal the difference between the delivered price and the source price (average of the wellhead price and the price of
imports at the U.S. border) of natural gas and, thus, reflect the total cost of bringing natural gas to market. When the term “transmission and distribution” margins is used in today’snatural gas market, it generally does not include the cost of independent natural gas marketers or costs associated with aggregation of supplies, provisions of storage, and otherservices. As used here, the term includes the cost of all services and the cost of pipeline fuel used in compressor stations.
Note: Totals may not equal sum of components due to independent rounding.Sources: 1995 industrial delivered prices based on Energy Information Administration (EIA), Manufacturing Energy Consumption Survey 1991. 1995 residential and commercial
delivered prices, average lower 48 wellhead price, and average import price: EIA, Natural Gas Monthly, DOE/EIA-0130(96/6) (Washington, DC, June 1996). Other 1995 values, andprojections: EIA, AEO97 National Energy Modeling System runs LWOP97.D100696A, AEO97B.D100296K, and HWOP97.D100296B.
Energy Information Administration/ Annual Energy Outlook 1997 171

Oil Price Case Comparisons
Table C15. Oil and Gas Supply
Production and Supply 1995
Projections
2005 2010 2015
LowWorld Oil
PriceReference
HighWorld Oil
Price
LowWorld Oil
PriceReference
HighWorld Oil
Price
LowWorld Oil
PriceReference
HighWorld Oil
Price
Crude Oil
Lower 48 Average Wellhead Price 1
(1995 dollars per barrel) . . . . . . . . . . . . . . . . . . . . . 15.58 13.95 19.36 23.63 14.01 20.02 25.85 13.35 19.85 26.82
Production (million barrels per day) 2
U.S. Total . . . . . . . . . . . . . . . . . . . . . . . . . . . . . . . . 6.56 4.42 5.49 6.41 4.07 5.39 6.53 3.97 5.23 6.89Lower 48 Onshore . . . . . . . . . . . . . . . . . . . . . . . . . 3.82 2.30 3.04 3.60 2.09 3.04 3.74 2.13 3.07 3.82
Conventional . . . . . . . . . . . . . . . . . . . . . . . . . . . . 3.24 1.89 2.44 2.83 1.70 2.36 2.77 1.73 2.33 2.74Enhanced Oil Recovery . . . . . . . . . . . . . . . . . . . . 0.58 0.41 0.60 0.76 0.40 0.69 0.97 0.39 0.75 1.09
Lower 48 Offshore . . . . . . . . . . . . . . . . . . . . . . . . . 1.26 1.21 1.50 1.82 1.25 1.57 1.84 1.25 1.53 2.02Alaska . . . . . . . . . . . . . . . . . . . . . . . . . . . . . . . . . 1.48 0.91 0.94 0.99 0.73 0.77 0.94 0.59 0.63 1.05
Lower 48 End of Year Reserves (billion barrels) . . 17.18 11.55 15.26 18.39 11.24 15.51 19.33 11.21 15.61 20.39
Natural Gas
Lower 48 Average Wellhead Price 1
(1995 dollars per thousand cubic feet) . . . . . . . . . 1.61 1.86 1.94 2.02 1.92 2.01 2.07 2.12 2.13 2.16
Production (trillion cubic feet) 3
U.S. Total . . . . . . . . . . . . . . . . . . . . . . . . . . . . . . . . 18.48 21.85 22.66 23.10 23.46 24.25 24.92 25.22 26.10 26.93Lower 48 Onshore . . . . . . . . . . . . . . . . . . . . . . . . . 13.00 14.97 15.75 16.31 16.35 17.19 18.12 17.74 18.59 19.48
Associated-Dissolved4 . . . . . . . . . . . . . . . . . . . . . 1.85 1.15 1.28 1.39 1.05 1.21 1.31 1.03 1.18 1.27Non-Associated . . . . . . . . . . . . . . . . . . . . . . . . . . 11.15 13.81 14.47 14.92 15.30 15.98 16.82 16.71 17.40 18.20
Conventional . . . . . . . . . . . . . . . . . . . . . . . . . . . 7.92 10.86 11.21 11.57 12.08 12.33 12.81 13.02 13.28 13.58Unconventional . . . . . . . . . . . . . . . . . . . . . . . . . 3.24 2.95 3.26 3.35 3.23 3.66 4.01 3.69 4.13 4.63
Lower 48 Offshore . . . . . . . . . . . . . . . . . . . . . . . . . 5.05 6.36 6.39 6.27 6.56 6.51 6.24 6.91 6.94 6.88Associated-Dissolved4 . . . . . . . . . . . . . . . . . . . . . 0.71 0.72 0.78 0.84 0.73 0.81 0.85 0.74 0.80 0.88Non-Associated . . . . . . . . . . . . . . . . . . . . . . . . . . 4.34 5.64 5.61 5.43 5.83 5.70 5.39 6.17 6.14 5.99
Alaska . . . . . . . . . . . . . . . . . . . . . . . . . . . . . . . . . 0.42 0.52 0.52 0.52 0.55 0.55 0.55 0.58 0.58 0.58
U.S. End of Year Reserves (trillion cubic feet) . . . . 155.03 169.02 174.73 181.77 177.70 187.05 196.18 178.46 188.42 197.90
Supplemental Gas Supplies (trillion cubic feet) 5 . . 0.13 0.06 0.06 0.06 0.06 0.06 0.06 0.06 0.06 0.06
Total Lower 48 Wells Completed (thousands) . . . . 18.52 27.43 34.33 39.71 31.45 37.60 43.54 36.90 41.75 47.16
1Represents lower 48 onshore and offshore supplies.2Includes lease condensate.3Market production (wet) minus extraction losses.4Gas which occurs in crude oil reserves either as free gas (associated) or as gas in solution with crude oil (dissolved).5Synthetic natural gas, propane air, coke oven gas, refinery gas, biomass gas, air injected for Btu stabilization, and manufactured gas commingled and distributed with natural gas.Note: Totals may not equal sum of components due to independent rounding. Figures for 1995 may differ from published data due to internal conversion factors.Sources: 1995 crude oil lower 48 average wellhead price: Energy Information Administration (EIA), Office of Integrated Analysis and Forecasting. 1995 total wells completed: EIA,
Office of Integrated Analysis and Forecasting. 1995 lower 48 onshore, lower 48 offshore, Alaska crude oil production: EIA, Petroleum Supply Annual 1995, DOE/EIA-0340(95)(Washington, DC, May 1996). 1995 natural gas lower 48 average wellhead price: EIA, Natural Gas Monthly, DOE/EIA-0130(96/06) (Washington, DC, June 1996). 1995 total naturalgas production derived from: EIA, Natural Gas Annual 1995, DOE/EIA-0131(95) (Washington, DC, November 1996). Other 1995 values: EIA, Office of Integrated Analysis andForecasting. Projections: EIA, AEO97 National Energy Modeling System runs LWOP97.D100696A, AEO97B.D100296K, and HWOP97.D100296B.
172 Energy Information Administration/ Annual Energy Outlook 1997

Oil Price Case Comparisons
Table C16. Coal Supply, Disposition, and Prices(Million Short Tons per Year, Unless Otherwise Noted)
Supply, Disposition, and Prices 1995
Projections
2005 2010 2015
LowWorld Oil
PriceReference
HighWorld Oil
Price
LowWorld Oil
PriceReference
HighWorld Oil
Price
LowWorld Oil
PriceReference
HighWorld Oil
Price
Production 1
Appalachia . . . . . . . . . . . . . . . . . . . . . . . . . . . . . 435 441 441 444 478 479 484 482 494 509Interior . . . . . . . . . . . . . . . . . . . . . . . . . . . . . . . . 169 165 157 158 169 165 169 167 160 170West . . . . . . . . . . . . . . . . . . . . . . . . . . . . . . . . . . 429 546 548 553 550 557 556 607 614 594
East of the Mississippi . . . . . . . . . . . . . . . . . . . . . 544 544 538 542 576 579 586 575 586 607West of the Mississippi . . . . . . . . . . . . . . . . . . . . 489 608 608 613 620 622 622 680 682 666
Total . . . . . . . . . . . . . . . . . . . . . . . . . . . . . . . . 1033 1151 1146 1155 1196 1201 1208 1255 1268 1273
Net ImportsImports . . . . . . . . . . . . . . . . . . . . . . . . . . . . . . . . 7 8 8 8 9 9 9 9 9 9Exports . . . . . . . . . . . . . . . . . . . . . . . . . . . . . . . . 89 102 102 102 113 111 111 121 121 121
Total . . . . . . . . . . . . . . . . . . . . . . . . . . . . . . . . -81 -94 -94 -94 -105 -103 -103 -112 -112 -112
Total Supply 2 . . . . . . . . . . . . . . . . . . . . . . . . . . . . 951 1057 1052 1061 1092 1098 1105 1143 1156 1161
Consumption by SectorResidential and Commercial . . . . . . . . . . . . . . . . . 6 6 6 6 6 6 6 6 6 6Industrial 3 . . . . . . . . . . . . . . . . . . . . . . . . . . . . . 73 80 84 86 84 87 89 87 91 92Coke Plants . . . . . . . . . . . . . . . . . . . . . . . . . . . . 33 26 26 26 23 23 23 20 20 20Electric Generators4 . . . . . . . . . . . . . . . . . . . . . . 847 947 938 947 981 983 989 1032 1039 1044
Total . . . . . . . . . . . . . . . . . . . . . . . . . . . . . . . . 959 1059 1054 1065 1094 1099 1106 1145 1156 1162
Discrepancy and Stock Change 5 . . . . . . . . . . . . . -8 -1 -2 -3 -2 -1 -1 -2 -1 -1
Average Minemouth Price(1995 dollars per short ton) . . . . . . . . . . . . . . . . . 18.83 16.94 17.47 17.98 16.15 16.92 17.48 14.82 15.46 16.24(1995 dollars per million Btu) . . . . . . . . . . . . . . . . 0.88 0.81 0.83 0.86 0.77 0.81 0.83 0.71 0.74 0.78
Delivered Prices (1995 dollars per short ton) 6
Industrial . . . . . . . . . . . . . . . . . . . . . . . . . . . . . . . 32.30 30.22 31.18 31.90 28.43 29.72 30.65 27.07 28.12 29.06Coke Plants . . . . . . . . . . . . . . . . . . . . . . . . . . . . 46.94 44.51 46.03 46.95 40.68 42.32 43.51 38.66 39.79 40.93Electric Generators
(1995 dollars per short ton) . . . . . . . . . . . . . . . . 27.01 24.36 24.97 25.65 23.35 24.23 24.91 21.71 22.47 23.29(1995 dollars per million Btu) . . . . . . . . . . . . . . . 1.32 1.20 1.24 1.27 1.15 1.20 1.23 1.08 1.11 1.15Average . . . . . . . . . . . . . . . . . . . . . . . . . . . . . . 28.11 25.30 25.99 26.67 24.11 25.05 25.76 22.42 23.23 24.07
Exports7 . . . . . . . . . . . . . . . . . . . . . . . . . . . . . . . 39.51 36.82 37.96 38.73 34.08 35.47 36.40 31.86 32.91 33.78
1Includes anthracite, bituminous coal, and lignite.2Production plus net imports and net storage withdrawals.3Includes consumption by cogenerators.4Includes all electric power generators except cogenerators, which produce electricity as a by-product of other processes.5Balancing item: the sum of production, net imports, and net storage minus total consumption.6Sectoral prices weighted by consumption tonnage; weighted average excludes residential/ commercial prices and export free-alongside-ship (f.a.s.) prices.7F.a.s. price at U.S. port of exit.Btu = British thermal unit.Note: Totals may not equal sum of components due to independent rounding.Sources: 1995 data derived from: Energy Information Administration (EIA), Coal Industry Annual 1994, DOE/EIA-0584(94) (Washington, DC, October 1995). Projections: EIA,
AEO97 National Energy Modeling System runs LWOP97.D100696A, AEO97B.D100296K, and HWOP97.D100296B.
Energy Information Administration/ Annual Energy Outlook 1997 173

Oil Price Case Comparisons
Table C17. Renewable Energy Generating Capacity and Generation(Thousand Megawatts, Unless Otherwise Noted)
Capacity and Generation 1995
Projections
2005 2010 2015
LowWorld Oil
PriceReference
HighWorld Oil
Price
LowWorld Oil
PriceReference
HighWorld Oil
Price
LowWorld Oil
PriceReference
HighWorld Oil
Price
Electric Generators 1
(excluding cogenerators)Capability
Conventional Hydropower . . . . . . . . . . . . . . . . . . 78.48 80.33 80.33 80.33 80.38 80.38 80.38 80.38 80.38 80.38Geothermal 2 . . . . . . . . . . . . . . . . . . . . . . . . . . . 2.97 3.08 3.04 3.10 3.00 3.19 3.21 3.14 3.46 3.49Municipal Solid Waste . . . . . . . . . . . . . . . . . . . . . 2.43 3.34 3.34 3.33 3.89 3.89 3.88 4.19 4.19 4.17Wood and Other Biomass3 . . . . . . . . . . . . . . . . . 1.86 1.99 2.00 2.01 2.05 2.21 2.36 2.62 3.92 4.46Solar Thermal . . . . . . . . . . . . . . . . . . . . . . . . . . . 0.36 0.42 0.42 0.42 0.50 0.50 0.50 0.63 0.63 0.63Solar Photovoltaic . . . . . . . . . . . . . . . . . . . . . . . . 0.01 0.08 0.08 0.08 0.19 0.19 0.19 0.35 0.35 0.35Wind . . . . . . . . . . . . . . . . . . . . . . . . . . . . . . . . . . 1.83 2.58 2.97 2.68 3.61 3.78 3.70 5.71 5.39 7.01
Total . . . . . . . . . . . . . . . . . . . . . . . . . . . . . . . . 87.95 91.80 92.17 91.95 93.63 94.14 94.23 97.02 98.32 100.49
Generation (billion kilowatthours)Conventional Hydropower . . . . . . . . . . . . . . . . . . 309.82 303.58 303.59 303.59 304.10 304.11 304.11 304.21 304.21 304.22Geothermal 2 . . . . . . . . . . . . . . . . . . . . . . . . . . . 14.66 18.21 17.94 18.41 18.16 19.46 19.64 19.77 22.04 22.20Municipal Solid Waste . . . . . . . . . . . . . . . . . . . . . 18.69 22.36 22.33 22.30 26.15 26.12 26.08 28.24 28.18 28.11Wood and Other Biomass3 . . . . . . . . . . . . . . . . . 7.12 9.15 9.24 9.31 9.63 10.73 11.76 13.56 22.72 26.47Solar Thermal . . . . . . . . . . . . . . . . . . . . . . . . . . . 0.82 1.10 1.10 1.10 1.38 1.38 1.38 1.78 1.78 1.78Solar Photovoltaic . . . . . . . . . . . . . . . . . . . . . . . . 0.00 0.22 0.22 0.22 0.48 0.48 0.48 0.87 0.87 0.87Wind . . . . . . . . . . . . . . . . . . . . . . . . . . . . . . . . . . 3.17 5.72 6.80 6.05 8.75 9.15 8.97 14.96 13.80 18.04
Total . . . . . . . . . . . . . . . . . . . . . . . . . . . . . . . . 354.28 360.34 361.21 360.98 368.64 371.43 372.41 383.38 393.62 401.70
Cogenerators 4
CapabilityMunicipal Solid Waste . . . . . . . . . . . . . . . . . . . . . 0.41 0.43 0.43 0.43 0.44 0.44 0.44 0.45 0.45 0.45Biomass . . . . . . . . . . . . . . . . . . . . . . . . . . . . . . . 5.79 6.89 6.88 6.87 7.40 7.38 7.35 7.78 7.75 7.72
Total . . . . . . . . . . . . . . . . . . . . . . . . . . . . . . . . 6.19 7.32 7.31 7.30 7.84 7.82 7.80 8.24 8.21 8.17
Generation (billion kilowatthours)Municipal Solid Waste . . . . . . . . . . . . . . . . . . . . . 1.97 2.08 2.08 2.08 2.13 2.13 2.13 2.17 2.17 2.17Biomass . . . . . . . . . . . . . . . . . . . . . . . . . . . . . . . 39.58 47.12 47.05 46.96 50.50 50.37 50.21 53.10 52.90 52.67
Total . . . . . . . . . . . . . . . . . . . . . . . . . . . . . . . . 41.55 49.19 49.12 49.03 52.64 52.50 52.34 55.27 55.07 54.84
1Includes grid-connected utilities and nonutilities other than cogenerators. These nonutility facilities include small power producers, exempt wholesale generators and generators atindustrial and commercial facilities which do not produce steam for other uses.
2Includes hydrothermal resources only (hot water and steam).3Includes projections for energy crops after 2010.4Cogenerators are facilities whose primary function is not electricity production.Notes: Totals may not equal sum of components due to independent rounding. Net summer capability has been estimated for nonutility generators for AEO97. Net summer
capability is used to be consistent with electric utility capacity estimates. Data for electric utility capacity data are the most recently available data as of August 15, 1996. Additionalretirements are also determined on the basis of the size and age of the units. Therefore, capacity estimates may differ from other Energy Information Administration sources.
Sources: 1995 electric utility capability: Energy Information Administration (EIA), Form EIA-860 “Annual Electric Utility Report.” 1995 nonutility and cogenerator capability: FormEIA-867, “Annual Nonutility Power Producer Report.” 1995 generation: EIA, Annual Energy Review 1995, DOE/EIA-0384(95) (Washington, DC, July 1996). Projections: EIA, AEO97National Energy Modeling System runs LWOP97.D100696A, AEO97B.D100296K, and HWOP97.D100296B.
174 Energy Information Administration/ Annual Energy Outlook 1997

Oil Price Case Comparisons
Table C18. Renewable Energy, Consumption by Sector and Source 1
(Quadrillion Btu per Year)
Sector and Source 1995
Projections
2005 2010 2015
LowWorld Oil
PriceReference
HighWorld Oil
Price
LowWorld Oil
PriceReference
HighWorld Oil
Price
LowWorld Oil
PriceReference
HighWorld Oil
Price
Marketed Renewable Energy 2
Residential . . . . . . . . . . . . . . . . . . . . . . . . . . . . . . 0.57 0.56 0.56 0.56 0.55 0.55 0.55 0.54 0.54 0.54Wood . . . . . . . . . . . . . . . . . . . . . . . . . . . . . . . . . 0.57 0.56 0.56 0.56 0.55 0.55 0.55 0.54 0.54 0.54
Commercial 3 . . . . . . . . . . . . . . . . . . . . . . . . . . . . 0.00 0.00 0.00 0.00 0.00 0.00 0.00 0.00 0.00 0.00Biomass . . . . . . . . . . . . . . . . . . . . . . . . . . . . . . . 0.00 0.00 0.00 0.00 0.00 0.00 0.00 0.00 0.00 0.00
Industrial 4 . . . . . . . . . . . . . . . . . . . . . . . . . . . . . . 1.74 2.13 2.12 2.11 2.29 2.28 2.26 2.41 2.40 2.38Conventional Hydroelectric . . . . . . . . . . . . . . . . . . 0.03 0.03 0.03 0.03 0.03 0.03 0.03 0.03 0.03 0.03Municipal Solid Waste . . . . . . . . . . . . . . . . . . . . . 0.00 0.01 0.01 0.01 0.01 0.01 0.01 0.01 0.01 0.01Biomass . . . . . . . . . . . . . . . . . . . . . . . . . . . . . . . 1.70 2.09 2.08 2.07 2.25 2.24 2.23 2.37 2.36 2.34
Transportation . . . . . . . . . . . . . . . . . . . . . . . . . . . 0.08 0.07 0.10 0.10 0.10 0.10 0.12 0.15 0.15 0.20Ethanol used in E855 . . . . . . . . . . . . . . . . . . . . . . 0.00 0.02 0.02 0.02 0.06 0.06 0.06 0.09 0.09 0.08Ethanol used in Gasoline Blending . . . . . . . . . . . . 0.08 0.04 0.08 0.08 0.04 0.04 0.06 0.06 0.07 0.11
Electric Generators 6 . . . . . . . . . . . . . . . . . . . . . . 3.99 4.18 4.18 4.19 4.30 4.36 4.38 4.52 4.68 4.77Conventional Hydroelectric . . . . . . . . . . . . . . . . . . 3.18 3.12 3.12 3.12 3.13 3.13 3.13 3.13 3.13 3.13Geothermal . . . . . . . . . . . . . . . . . . . . . . . . . . . . . 0.39 0.52 0.52 0.53 0.54 0.58 0.59 0.61 0.69 0.70Municipal Solid Waste . . . . . . . . . . . . . . . . . . . . . 0.31 0.37 0.37 0.37 0.43 0.43 0.43 0.46 0.46 0.46Biomass . . . . . . . . . . . . . . . . . . . . . . . . . . . . . . . 0.07 0.09 0.10 0.10 0.10 0.11 0.12 0.14 0.23 0.27Solar Thermal . . . . . . . . . . . . . . . . . . . . . . . . . . . 0.01 0.01 0.01 0.01 0.01 0.01 0.01 0.02 0.02 0.02Solar Photovoltaic . . . . . . . . . . . . . . . . . . . . . . . . 0.00 0.00 0.00 0.00 0.00 0.00 0.00 0.01 0.01 0.01Wind . . . . . . . . . . . . . . . . . . . . . . . . . . . . . . . . . . 0.03 0.06 0.07 0.06 0.09 0.09 0.09 0.15 0.14 0.19
Total Marketed Renewable Energy . . . . . . . . . . . 6.37 6.93 6.96 6.96 7.24 7.29 7.31 7.62 7.77 7.89
Non-Marketed Renewable Energy 7
Selected Consumption
Residential . . . . . . . . . . . . . . . . . . . . . . . . . . . . . . 0.02 0.05 0.05 0.05 0.06 0.06 0.06 0.08 0.08 0.08Solar Hot Water Heating . . . . . . . . . . . . . . . . . . . 0.01 0.01 0.01 0.01 0.01 0.01 0.01 0.01 0.01 0.01Geothermal Heat Pumps . . . . . . . . . . . . . . . . . . . 0.01 0.04 0.04 0.04 0.05 0.05 0.05 0.07 0.07 0.07
Commercial . . . . . . . . . . . . . . . . . . . . . . . . . . . . . 0.01 0.03 0.03 0.03 0.03 0.03 0.03 0.04 0.04 0.04Solar Thermal . . . . . . . . . . . . . . . . . . . . . . . . . . . 0.01 0.03 0.03 0.03 0.03 0.03 0.03 0.04 0.04 0.04
1Actual heat rates used to determine fuel consumption for all renewable fuels except hydropower, solar, and wind. Consumption at hydroelectric, solar, and wind facilitiesdetermined by using the fossil fuel equivalent of 10,280 Btu per kilowatthour.
2Includes nonelectric renewable energy groups for which the energy source is bought and sold in the marketplace, although all transactions may not necessarily be marketed, andmarketed renewable energy inputs for electricity entering the marketplace on the electric power grid.
3Value is less than 0.005 quadrillion Btu per year and rounds to zero.4Includes all electricity production by industrial and other cogenerators for the grid and for own use.5Excludes motor gasoline component of E85.6Includes renewable energy delivered to the grid from electric utilities and nonutilities. Renewable energy used in generating electricity for own use is included in the individual
sectoral electricity energy consumption values.7Includes selected renewable energy consumption data for which the energy is not bought or sold, either directly or indirectly as an input to marketed energy. The Energy
Information Administration does not estimate or project total consumption of nonmarketed renewable energy.Btu = British thermal unit.Notes: Totals may not equal sum of components due to independent rounding.Sources: 1995 electric generators: Energy Information Administration (EIA), Form EIA-860, “Annual Electric Utility Report,” and EIA, Form EIA-867, “Annual Nonutility Power
Producer Report.” 1995 ethanol: EIA, Petroleum Supply Annual 1995, DOE/EIA-0340(95/1) (Washington, DC, May 1996). Other 1995: EIA, Office of Integrated Analysis andForecasting. Projections: EIA, AEO97 National Energy Modeling System runs LWOP97.D100696A, AEO97B.D100296K, and HWOP97.D100296B.
Energy Information Administration/ Annual Energy Outlook 1997 175

Oil Price Case Comparisons
Table C19. Carbon Emissions by Sector and Source(Million Metric Tons per Year)
Sector and Source 1995
Projections
2005 2010 2015
LowWorld Oil
PriceReference
HighWorld Oil
Price
LowWorld Oil
PriceReference
HighWorld Oil
Price
LowWorld Oil
PriceReference
HighWorld Oil
Price
ResidentialPetroleum . . . . . . . . . . . . . . . . . . . . . . . . . . . . 25.0 24.9 24.3 23.7 24.4 23.7 22.9 24.2 23.4 22.5Natural Gas . . . . . . . . . . . . . . . . . . . . . . . . . . 72.1 78.6 78.1 77.9 80.8 80.3 80.0 82.7 82.5 82.4Coal . . . . . . . . . . . . . . . . . . . . . . . . . . . . . . . . 1.4 1.2 1.2 1.2 1.1 1.1 1.1 1.1 1.1 1.0Electricity . . . . . . . . . . . . . . . . . . . . . . . . . . . . 175.6 205.8 201.0 201.0 221.7 216.4 216.0 244.1 238.3 237.6
Total . . . . . . . . . . . . . . . . . . . . . . . . . . . . . . 274.0 310.5 304.6 303.8 328.1 321.4 320.0 352.2 345.3 343.5
CommercialPetroleum . . . . . . . . . . . . . . . . . . . . . . . . . . . . 13.4 12.3 11.8 11.7 12.3 11.7 11.6 12.5 11.7 11.5Natural Gas . . . . . . . . . . . . . . . . . . . . . . . . . . 45.6 49.4 49.5 49.5 50.7 50.9 50.9 52.2 52.6 52.6Coal . . . . . . . . . . . . . . . . . . . . . . . . . . . . . . . . 2.0 2.2 2.2 2.2 2.3 2.3 2.3 2.3 2.3 2.3Electricity . . . . . . . . . . . . . . . . . . . . . . . . . . . . 159.3 184.6 180.2 180.1 194.7 189.9 189.3 209.5 204.4 203.7
Total . . . . . . . . . . . . . . . . . . . . . . . . . . . . . . 220.3 248.5 243.8 243.5 260.0 254.7 254.0 276.6 271.0 270.1
Industrial 1
Petroleum . . . . . . . . . . . . . . . . . . . . . . . . . . . . 92.4 112.8 104.9 98.4 117.4 108.9 100.2 122.3 111.9 101.2Natural Gas2 . . . . . . . . . . . . . . . . . . . . . . . . . . 138.6 150.2 157.1 163.0 154.3 162.7 170.8 155.0 165.6 175.5Coal . . . . . . . . . . . . . . . . . . . . . . . . . . . . . . . . 62.8 61.7 63.6 64.8 61.5 63.5 64.3 61.7 63.8 64.7Electricity . . . . . . . . . . . . . . . . . . . . . . . . . . . . 170.5 202.5 201.7 204.7 213.5 213.4 216.1 228.0 227.1 229.9
Total . . . . . . . . . . . . . . . . . . . . . . . . . . . . . . 464.3 527.2 527.3 530.9 546.7 548.5 551.4 567.0 568.4 571.3
TransportationPetroleum . . . . . . . . . . . . . . . . . . . . . . . . . . . . 453.5 550.5 544.1 540.0 581.6 573.4 566.3 596.5 586.7 577.0Natural Gas3 . . . . . . . . . . . . . . . . . . . . . . . . . . 10.5 14.6 14.8 14.9 16.5 16.5 16.5 18.0 17.9 18.3Other4 . . . . . . . . . . . . . . . . . . . . . . . . . . . . . . 0.0 0.5 0.5 0.5 1.2 1.2 1.1 1.7 1.6 1.6Electricity . . . . . . . . . . . . . . . . . . . . . . . . . . . . 1.0 4.1 3.9 3.9 6.9 6.7 6.7 8.7 8.4 8.2
Total . . . . . . . . . . . . . . . . . . . . . . . . . . . . . . 465.1 569.6 563.3 559.3 606.2 597.7 590.6 624.8 614.5 605.1
Total Carbon Emissions 5
Petroleum . . . . . . . . . . . . . . . . . . . . . . . . . . . . 584.4 700.5 685.1 673.8 735.8 717.7 701.0 755.5 733.6 712.1Natural Gas . . . . . . . . . . . . . . . . . . . . . . . . . . 266.7 292.8 299.6 305.3 302.3 310.3 318.2 307.9 318.7 328.8Coal . . . . . . . . . . . . . . . . . . . . . . . . . . . . . . . . 66.2 65.0 67.0 68.2 64.9 66.9 67.7 65.1 67.2 68.1Other4 . . . . . . . . . . . . . . . . . . . . . . . . . . . . . . 0.0 0.5 0.5 0.5 1.2 1.2 1.1 1.7 1.6 1.6Electricity . . . . . . . . . . . . . . . . . . . . . . . . . . . . 506.3 597.0 586.9 589.8 636.7 626.4 628.0 690.3 678.1 679.4
Total . . . . . . . . . . . . . . . . . . . . . . . . . . . . . . 1423.7 1655.9 1638.9 1637.5 1741.0 1722.4 1715.9 1820.6 1799.3 1790.0
Electric Generators 6
Petroleum . . . . . . . . . . . . . . . . . . . . . . . . . . . . 14.4 23.3 12.2 10.1 27.5 12.0 9.2 32.4 13.2 9.2Natural Gas . . . . . . . . . . . . . . . . . . . . . . . . . . 50.9 81.0 86.5 87.2 97.9 102.1 104.1 122.8 125.4 127.7Coal . . . . . . . . . . . . . . . . . . . . . . . . . . . . . . . . 441.1 492.7 488.2 492.5 511.3 512.3 514.8 535.1 539.5 542.6
Total . . . . . . . . . . . . . . . . . . . . . . . . . . . . . . 506.3 597.0 586.9 589.8 636.7 626.4 628.0 690.3 678.1 679.4
Total Carbon Emissions 7
Petroleum . . . . . . . . . . . . . . . . . . . . . . . . . . . . 598.7 723.8 697.2 683.9 763.3 729.7 710.1 788.0 746.9 721.3Natural Gas . . . . . . . . . . . . . . . . . . . . . . . . . . 317.6 373.9 386.1 392.5 400.3 412.4 422.3 430.7 444.1 456.5Coal . . . . . . . . . . . . . . . . . . . . . . . . . . . . . . . . 507.3 557.7 555.2 560.7 576.2 579.2 582.4 600.2 606.7 610.7Other4 . . . . . . . . . . . . . . . . . . . . . . . . . . . . . . 0.0 0.5 0.5 0.5 1.2 1.2 1.1 1.7 1.6 1.6
Total . . . . . . . . . . . . . . . . . . . . . . . . . . . . . . 1423.7 1655.9 1638.9 1637.5 1741.0 1722.4 1715.9 1820.6 1799.3 1790.0
Carbon Emissions(tons per person) . . . . . . . . . . . . . . . . . . . . . . . 5.4 5.8 5.7 5.7 5.8 5.8 5.7 5.9 5.8 5.8
1Includes consumption by cogenerators.2Includes lease and plant fuel.3Includes pipeline fuel natural gas and compressed natural gas used as vehicle fuel.4“Other” includes methanol and liquid hydrogen.5Measured for delivered energy consumption.6Includes all electric power generators except cogenerators, which produce electricity as a by-product of other processes.7Measured for total energy consumption, with emissions for electric power generators distributed to the primary fuels.Note: Totals may not equal sum of components due to independent rounding.Sources: Utility coal carbon emissions from Energy Information Administration (EIA), Emissions of Greenhouse Gases in the United States, 1987-1992, DOE/EIA-0573
(Washington, DC, November 1994). Carbon coefficients from EIA, Emissions of Greenhouse Gases in the United States 1995, DOE/EIA-0573(95) (Washington, DC, October 1996).1995 consumption estimates based on: EIA, Short Term Energy Outlook, DOE/EIA-0202(96/4Q) (Washington, DC, October 1996). Projections: EIA, AEO97 National EnergyModeling System runs LWOP97.D100696A, AEO97B.D100296K, and HWOP97.D100296B.
176 Energy Information Administration/ Annual Energy Outlook 1997
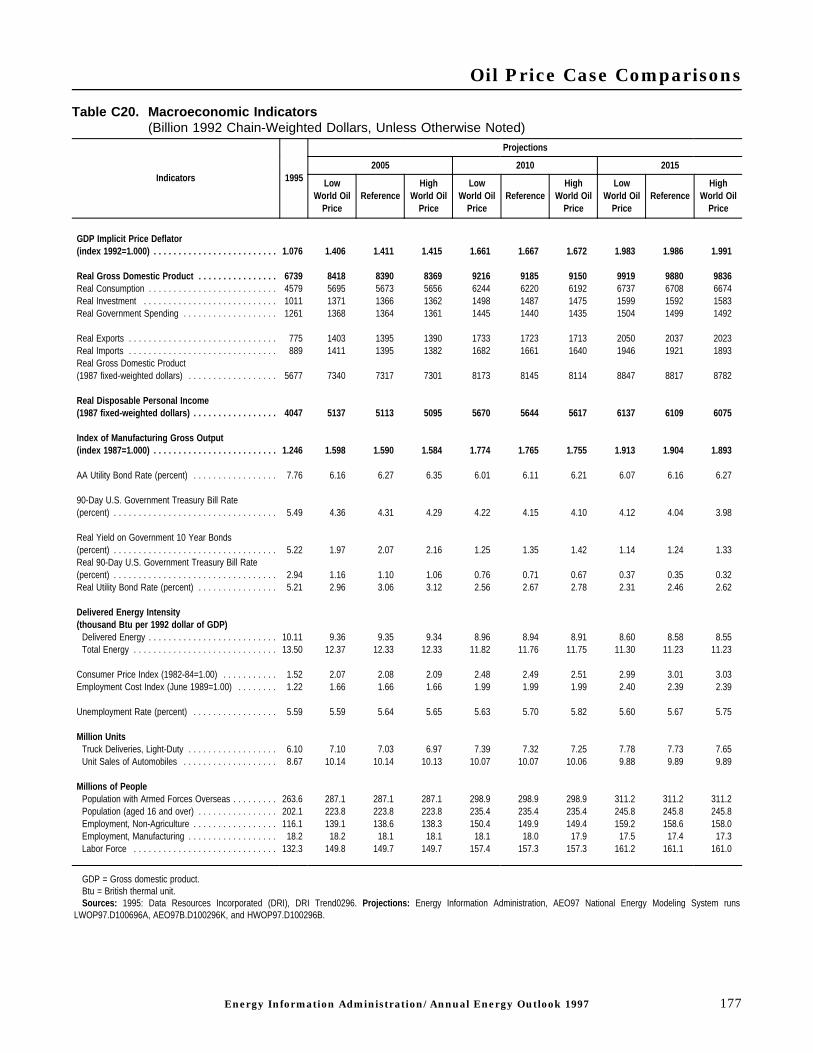
Oil Price Case Comparisons
Table C20. Macroeconomic Indicators(Billion 1992 Chain-Weighted Dollars, Unless Otherwise Noted)
Indicators 1995
Projections
2005 2010 2015
LowWorld Oil
PriceReference
HighWorld Oil
Price
LowWorld Oil
PriceReference
HighWorld Oil
Price
LowWorld Oil
PriceReference
HighWorld Oil
Price
GDP Implicit Price Deflator(index 1992=1.000) . . . . . . . . . . . . . . . . . . . . . . . . . 1.076 1.406 1.411 1.415 1.661 1.667 1.672 1.983 1.986 1.991
Real Gross Domestic Product . . . . . . . . . . . . . . . . 6739 8418 8390 8369 9216 9185 9150 9919 9880 9836Real Consumption . . . . . . . . . . . . . . . . . . . . . . . . . . 4579 5695 5673 5656 6244 6220 6192 6737 6708 6674Real Investment . . . . . . . . . . . . . . . . . . . . . . . . . . . 1011 1371 1366 1362 1498 1487 1475 1599 1592 1583Real Government Spending . . . . . . . . . . . . . . . . . . . 1261 1368 1364 1361 1445 1440 1435 1504 1499 1492
Real Exports . . . . . . . . . . . . . . . . . . . . . . . . . . . . . . 775 1403 1395 1390 1733 1723 1713 2050 2037 2023Real Imports . . . . . . . . . . . . . . . . . . . . . . . . . . . . . . 889 1411 1395 1382 1682 1661 1640 1946 1921 1893Real Gross Domestic Product(1987 fixed-weighted dollars) . . . . . . . . . . . . . . . . . . 5677 7340 7317 7301 8173 8145 8114 8847 8817 8782
Real Disposable Personal Income(1987 fixed-weighted dollars) . . . . . . . . . . . . . . . . . 4047 5137 5113 5095 5670 5644 5617 6137 6109 6075
Index of Manufacturing Gross Output(index 1987=1.000) . . . . . . . . . . . . . . . . . . . . . . . . . 1.246 1.598 1.590 1.584 1.774 1.765 1.755 1.913 1.904 1.893
AA Utility Bond Rate (percent) . . . . . . . . . . . . . . . . . 7.76 6.16 6.27 6.35 6.01 6.11 6.21 6.07 6.16 6.27
90-Day U.S. Government Treasury Bill Rate(percent) . . . . . . . . . . . . . . . . . . . . . . . . . . . . . . . . . 5.49 4.36 4.31 4.29 4.22 4.15 4.10 4.12 4.04 3.98
Real Yield on Government 10 Year Bonds(percent) . . . . . . . . . . . . . . . . . . . . . . . . . . . . . . . . . 5.22 1.97 2.07 2.16 1.25 1.35 1.42 1.14 1.24 1.33Real 90-Day U.S. Government Treasury Bill Rate(percent) . . . . . . . . . . . . . . . . . . . . . . . . . . . . . . . . . 2.94 1.16 1.10 1.06 0.76 0.71 0.67 0.37 0.35 0.32Real Utility Bond Rate (percent) . . . . . . . . . . . . . . . . 5.21 2.96 3.06 3.12 2.56 2.67 2.78 2.31 2.46 2.62
Delivered Energy Intensity(thousand Btu per 1992 dollar of GDP)
Delivered Energy . . . . . . . . . . . . . . . . . . . . . . . . . . 10.11 9.36 9.35 9.34 8.96 8.94 8.91 8.60 8.58 8.55Total Energy . . . . . . . . . . . . . . . . . . . . . . . . . . . . . 13.50 12.37 12.33 12.33 11.82 11.76 11.75 11.30 11.23 11.23
Consumer Price Index (1982-84=1.00) . . . . . . . . . . . 1.52 2.07 2.08 2.09 2.48 2.49 2.51 2.99 3.01 3.03Employment Cost Index (June 1989=1.00) . . . . . . . . 1.22 1.66 1.66 1.66 1.99 1.99 1.99 2.40 2.39 2.39
Unemployment Rate (percent) . . . . . . . . . . . . . . . . . 5.59 5.59 5.64 5.65 5.63 5.70 5.82 5.60 5.67 5.75
Million UnitsTruck Deliveries, Light-Duty . . . . . . . . . . . . . . . . . . 6.10 7.10 7.03 6.97 7.39 7.32 7.25 7.78 7.73 7.65Unit Sales of Automobiles . . . . . . . . . . . . . . . . . . . 8.67 10.14 10.14 10.13 10.07 10.07 10.06 9.88 9.89 9.89
Millions of PeoplePopulation with Armed Forces Overseas . . . . . . . . . 263.6 287.1 287.1 287.1 298.9 298.9 298.9 311.2 311.2 311.2Population (aged 16 and over) . . . . . . . . . . . . . . . . 202.1 223.8 223.8 223.8 235.4 235.4 235.4 245.8 245.8 245.8Employment, Non-Agriculture . . . . . . . . . . . . . . . . . 116.1 139.1 138.6 138.3 150.4 149.9 149.4 159.2 158.6 158.0Employment, Manufacturing . . . . . . . . . . . . . . . . . . 18.2 18.2 18.1 18.1 18.1 18.0 17.9 17.5 17.4 17.3Labor Force . . . . . . . . . . . . . . . . . . . . . . . . . . . . . 132.3 149.8 149.7 149.7 157.4 157.3 157.3 161.2 161.1 161.0
GDP = Gross domestic product.Btu = British thermal unit.Sources: 1995: Data Resources Incorporated (DRI), DRI Trend0296. Projections: Energy Information Administration, AEO97 National Energy Modeling System runs
LWOP97.D100696A, AEO97B.D100296K, and HWOP97.D100296B.
Energy Information Administration/ Annual Energy Outlook 1997 177

Oil Price Case Comparisons
Table C21. International Petroleum Supply and Disposition Summary(Million Barrels per Day, Unless Otherwise Noted)
Supply and Disposition 1995
Projections
2005 2010 2015
LowWorld Oil
PriceReference
HighWorld Oil
Price
LowWorld Oil
PriceReference
HighWorld Oil
Price
LowWorld Oil
PriceReference
HighWorld Oil
Price
World Oil Price (1995 dollars per barrel) 1 . . . . . . . 17.26 14.08 19.72 24.13 14.03 20.41 26.44 13.99 20.98 28.23
Production 2
OECDU.S. (50 states) . . . . . . . . . . . . . . . . . . . . . . . . . . 9.29 7.52 8.67 9.69 7.39 8.75 10.01 7.45 8.76 10.59Canada . . . . . . . . . . . . . . . . . . . . . . . . . . . . . . . 2.44 2.43 2.46 2.49 2.30 2.35 2.38 2.18 2.24 2.27Mexico . . . . . . . . . . . . . . . . . . . . . . . . . . . . . . . . 3.09 3.05 3.13 3.18 2.97 3.07 3.13 2.89 3.00 3.08OECD Europe3 . . . . . . . . . . . . . . . . . . . . . . . . . . 6.55 5.97 6.05 6.09 5.12 5.20 5.26 4.17 4.25 4.30Other OECD . . . . . . . . . . . . . . . . . . . . . . . . . . . . 0.74 0.69 0.71 0.72 0.62 0.65 0.67 0.57 0.60 0.62
Total OECD . . . . . . . . . . . . . . . . . . . . . . . . . . . 22.11 19.66 21.01 22.16 18.40 20.02 21.44 17.25 18.84 20.87
Developing CountriesOther South & Central America . . . . . . . . . . . . . . 3.06 4.08 4.18 4.25 3.86 3.99 4.08 3.67 3.81 3.91Pacific Rim . . . . . . . . . . . . . . . . . . . . . . . . . . . . . 2.04 2.20 2.26 2.29 2.10 2.17 2.21 1.94 2.02 2.07OPEC . . . . . . . . . . . . . . . . . . . . . . . . . . . . . . . . . 28.07 48.17 42.10 38.17 59.08 50.64 44.98 70.71 60.35 52.61Other Developing Countries . . . . . . . . . . . . . . . . . 4.05 4.94 5.07 5.15 4.56 4.72 4.82 4.12 4.28 4.39
Total Developing Countries . . . . . . . . . . . . . . . 37.21 59.40 53.61 49.86 69.61 61.51 56.09 80.44 70.45 62.98
EurasiaFormer Soviet Union . . . . . . . . . . . . . . . . . . . . . . 6.96 8.13 8.34 8.47 9.12 9.43 9.63 9.72 10.09 10.36Eastern Europe . . . . . . . . . . . . . . . . . . . . . . . . . . 0.31 0.23 0.23 0.24 0.20 0.21 0.22 0.17 0.18 0.19China . . . . . . . . . . . . . . . . . . . . . . . . . . . . . . . . . 3.02 2.97 3.04 3.09 2.90 3.00 3.06 2.84 2.94 3.02
Total Eurasia . . . . . . . . . . . . . . . . . . . . . . . . . . 10.29 11.33 11.62 11.80 12.23 12.64 12.91 12.73 13.21 13.57
Total Production . . . . . . . . . . . . . . . . . . . . . . . . . . 69.62 90.38 86.24 83.82 100.24 94.17 90.45 110.42 102.50 97.41
Consumption
OECDU.S. (50 states) . . . . . . . . . . . . . . . . . . . . . . . . . . 17.73 21.41 20.68 20.24 22.55 21.60 20.96 23.29 22.12 21.31U.S. Territories . . . . . . . . . . . . . . . . . . . . . . . . . . 0.26 0.39 0.35 0.32 0.44 0.38 0.35 0.49 0.42 0.37Canada . . . . . . . . . . . . . . . . . . . . . . . . . . . . . . . 1.76 2.22 2.01 1.89 2.43 2.14 1.97 2.64 2.29 2.07Mexico . . . . . . . . . . . . . . . . . . . . . . . . . . . . . . . . 1.96 2.55 2.39 2.29 2.95 2.69 2.53 3.38 3.02 2.79Japan . . . . . . . . . . . . . . . . . . . . . . . . . . . . . . . . . 5.73 7.65 6.85 6.40 8.63 7.31 6.57 9.60 7.78 6.73Australia and New Zealand . . . . . . . . . . . . . . . . . 0.96 1.14 1.10 1.07 1.23 1.17 1.13 1.31 1.24 1.20OECD Europe3 . . . . . . . . . . . . . . . . . . . . . . . . . . 13.88 15.51 14.80 14.39 16.01 15.12 14.56 16.43 15.41 14.73
Total OECD . . . . . . . . . . . . . . . . . . . . . . . . . . . 42.28 50.87 48.18 46.60 54.24 50.41 48.07 57.14 52.28 49.20
Developing CountriesOther South and Central America . . . . . . . . . . . . . 3.58 4.43 4.31 4.24 4.78 4.62 4.52 5.10 4.92 4.79Pacific Rim . . . . . . . . . . . . . . . . . . . . . . . . . . . . . 4.87 7.97 7.72 7.58 9.43 9.07 8.84 11.21 10.73 10.40OPEC . . . . . . . . . . . . . . . . . . . . . . . . . . . . . . . . . 4.94 6.30 6.30 6.30 7.06 7.06 7.06 7.91 7.91 7.91Other Developing Countries . . . . . . . . . . . . . . . . . 4.79 7.65 7.20 6.93 8.75 7.95 7.48 9.91 8.75 8.04
Total Developing Countries . . . . . . . . . . . . . . . 18.19 26.35 25.53 25.04 30.02 28.70 27.90 34.13 32.31 31.14
178 Energy Information Administration/ Annual Energy Outlook 1997

Oil Price Case Comparisons
Table C21. International Petroleum Supply and Disposition Summary (Continued)(Million Barrels per Day, Unless Otherwise Noted)
Supply and Disposition 1995
Projections
2005 2010 2015
LowWorld Oil
PriceReference
HighWorld Oil
Price
LowWorld Oil
PriceReference
HighWorld Oil
Price
LowWorld Oil
PriceReference
HighWorld Oil
Price
EurasiaFormer Soviet Union . . . . . . . . . . . . . . . . . . . . . . 4.75 6.02 5.80 5.67 7.05 6.74 6.54 8.05 7.65 7.38Eastern Europe . . . . . . . . . . . . . . . . . . . . . . . . . . 1.39 1.55 1.51 1.49 1.77 1.72 1.69 2.03 1.96 1.92China . . . . . . . . . . . . . . . . . . . . . . . . . . . . . . . . . 3.31 5.89 5.52 5.31 7.46 6.89 6.55 9.37 8.59 8.07
Total Eurasia . . . . . . . . . . . . . . . . . . . . . . . . . . 9.46 13.46 12.84 12.47 16.28 15.36 14.78 19.45 18.21 17.38
Total Consumption . . . . . . . . . . . . . . . . . . . . . . . . 69.92 90.68 86.54 84.12 100.54 94.47 90.75 110.72 102.80 97.71
Non-OPEC Production . . . . . . . . . . . . . . . . . . . . . . . 41.55 42.21 44.14 45.65 41.15 43.53 45.46 39.71 42.15 44.80Net Eurasia Exports . . . . . . . . . . . . . . . . . . . . . . . . . 0.83 -2.13 -1.22 -0.67 -4.05 -2.72 -1.87 -6.72 -4.99 -3.81OPEC Market Share . . . . . . . . . . . . . . . . . . . . . . . . 0.40 0.53 0.49 0.46 0.59 0.54 0.50 0.64 0.59 0.54
1Average refiner acquisition cost of imported crude oil.2Includes production of crude oil (including lease condensates), natural gas plant liquids, other hydrogen and hydrocarbons for refinery feedstocks, alcohol, liquids produced from
coal and other sources, and refinery gains.3OECD Europe includes the unified Germany.OECD = Organization for Economic Cooperation and Development - Australia, Austria, Belgium, Canada, Denmark, Finland, France, Germany, Greece, Iceland, Ireland, Italy,
Japan, Luxembourg, Mexico, the Netherlands, New Zealand, Norway, Portugal, Spain, Sweden, Switzerland, Turkey, the United Kingdom, and the United States (including territories).Pacific Rim = Hong Kong, Malaysia, Philippines, Singapore, South Korea, Taiwan, and Thailand.OPEC = Organization of Petroleum Exporting Countries - Algeria, Gabon, Indonesia, Iran, Iraq, Kuwait, Libya, Nigeria, Qatar, Saudi Arabia, the United Arab Emirates, and
Venezuela.Eurasia = Albania, Bulgaria, China, Czech Republic, Hungary, Poland, Romania, Slovak Republic, the Former Soviet Union, and the Former Yugoslavia.Note: Totals may not equal sum of components due to independent rounding.Sources: 1995 data derived from: Energy Information Administration (EIA), Short-Term Energy Outlook, DOE/EIA-0202(96/4Q) (Washington, DC, October 1996). Projections: EIA,
AEO97 National Energy Modeling System runs LWOP97.D100696A, AEO97B.D100296K, and HWOP97.D100296B.
Energy Information Administration/ Annual Energy Outlook 1997 179

Appendix D
Crude Oil Equivalency SummaryTable D1. Total Energy Supply and Disposition Crude Oil Equivalency Summary
(Million Barrels per Day, Unless Otherwise Noted)
Supply, Disposition, and PricesReference Case Annual Growth
1995-2015(percent)1994 1995 2000 2005 2010 2015
ProductionCrude Oil and Lease Condensate . . . . . . . . . . . . . . . 6.66 6.56 5.87 5.49 5.39 5.23 -1.1%Natural Gas Plant Liquids . . . . . . . . . . . . . . . . . . . . . 1.17 1.12 1.28 1.42 1.44 1.64 1.9%Dry Natural Gas . . . . . . . . . . . . . . . . . . . . . . . . . . . . 9.10 8.98 9.95 11.00 11.78 12.67 1.7%Coal . . . . . . . . . . . . . . . . . . . . . . . . . . . . . . . . . . . . 10.43 10.38 10.99 11.33 11.88 12.50 0.9%Nuclear Power . . . . . . . . . . . . . . . . . . . . . . . . . . . . . 3.23 3.40 3.45 3.30 3.10 2.26 -2.0%Renewable Energy1 . . . . . . . . . . . . . . . . . . . . . . . . . 2.75 2.97 3.08 3.25 3.42 3.64 1.0%Other2 . . . . . . . . . . . . . . . . . . . . . . . . . . . . . . . . . . . 0.46 0.64 0.21 0.20 0.19 0.20 -5.7%
Total . . . . . . . . . . . . . . . . . . . . . . . . . . . . . . . . . . . 33.80 34.05 34.83 35.99 37.19 38.14 0.6%
ImportsCrude Oil 3 . . . . . . . . . . . . . . . . . . . . . . . . . . . . . . . . 7.07 7.23 8.85 9.54 9.76 10.24 1.8%Petroleum Products4 . . . . . . . . . . . . . . . . . . . . . . . . . 1.86 1.51 2.35 3.21 3.89 3.94 4.9%Natural Gas . . . . . . . . . . . . . . . . . . . . . . . . . . . . . . . 1.27 1.37 1.76 1.88 2.00 2.15 2.3%Other Imports5 . . . . . . . . . . . . . . . . . . . . . . . . . . . . . 0.32 0.28 0.32 0.32 0.32 0.30 0.4%
Total . . . . . . . . . . . . . . . . . . . . . . . . . . . . . . . . . . . 10.51 10.39 13.29 14.95 15.96 16.63 2.4%
ExportsPetroleum6 . . . . . . . . . . . . . . . . . . . . . . . . . . . . . . . . 0.94 0.95 0.85 0.91 0.92 0.93 -0.1%Natural Gas . . . . . . . . . . . . . . . . . . . . . . . . . . . . . . . 0.08 0.08 0.10 0.10 0.10 0.11 1.7%Coal . . . . . . . . . . . . . . . . . . . . . . . . . . . . . . . . . . . . 0.89 1.07 1.15 1.23 1.33 1.44 1.5%
Total . . . . . . . . . . . . . . . . . . . . . . . . . . . . . . . . . . . 1.91 2.10 2.09 2.23 2.35 2.48 0.8%
Discrepancy 7 . . . . . . . . . . . . . . . . . . . . . . . . . . . . . . . -0.49 0.60 0.04 0.07 0.11 0.00 N/A
ConsumptionPetroleum Products8 . . . . . . . . . . . . . . . . . . . . . . . . . 16.42 16.50 17.86 19.11 19.95 20.44 1.1%Natural Gas . . . . . . . . . . . . . . . . . . . . . . . . . . . . . . . 10.08 10.48 11.55 12.72 13.59 14.63 1.7%Coal . . . . . . . . . . . . . . . . . . . . . . . . . . . . . . . . . . . . 9.20 9.41 9.92 10.21 10.65 11.15 0.9%Nuclear Power . . . . . . . . . . . . . . . . . . . . . . . . . . . . . 3.23 3.40 3.45 3.30 3.10 2.26 -2.0%Renewable Energy1 . . . . . . . . . . . . . . . . . . . . . . . . . 2.75 2.97 3.08 3.25 3.43 3.64 1.0%Other9 . . . . . . . . . . . . . . . . . . . . . . . . . . . . . . . . . . . 0.22 0.18 0.20 0.18 0.18 0.17 -0.3%
Total . . . . . . . . . . . . . . . . . . . . . . . . . . . . . . . . . . . 41.91 42.94 46.06 48.77 50.90 52.30 1.0%
Net Imports - Petroleum . . . . . . . . . . . . . . . . . . . . . . 7.98 7.78 10.36 11.84 12.73 13.25 2.7%
Prices (1995 dollars per unit)World Oil Price (dollars per barrel)10 . . . . . . . . . . . . . 15.94 17.26 18.20 19.72 20.41 20.98 1.0%Gas Wellhead Price (dollars per Mcf)11 . . . . . . . . . . . 1.97 1.61 1.82 1.94 2.01 2.13 1.4%Coal Minemouth Price (dollars per ton) . . . . . . . . . . . 19.89 18.83 18.38 17.47 16.92 15.46 -1.0%
1Includes utility and nonutility grid connected electricity from hydroelectric, wood and wood waste, municipal solid waste, other biomass, wind, photovoltaic and solar thermalsources; non-electric energy from renewable sources, such as active and passive solar systems, and wood; and both the ethanol and gasoline components of E85, but not theethanol components of blends less than 85 percent. Excludes nonmarketed renewable energy.
2Includes liquid hydrogen, methanol, supplemental natural gas, and some domestic inputs to refineries.3Includes imports of crude oil for the Strategic Petroleum Reserve.4Includes imports of finished petroleum products, imports of unfinished oils, alcohols, ethers, and blending components.5Includes coal, coal coke (net), and electricity (net).6Includes crude oil and petroleum products.7Balancing item. Includes unaccounted for supply, losses, gains, and net storage withdraws.8Includes natural gas plant liquids, crude oil consumed as a fuel, and nonpetroleum based liquids for blending, such as ethanol.9Includes net electricity imports, methanol, and liquid hydrogen.10Average refiner acquisition cost for imported crude oil.11Represents lower 48 onshore and offshore supplies.Btu = British thermal unit.Mcf = Thousand cubic feet.N/A = Not applicable.Note: Totals may not equal sum of components due to independent rounding. Figures for 1994 and 1995 may differ from published data due to internal conversion factors.Sources: 1994 natural gas values: Energy Information Administration (EIA), Natural Gas Annual 1994, DOE/EIA-0131(94) (Washington, DC, November 1995). 1994 coal
minemouth prices: EIA, Coal Industry Annual 1994, DOE/EIA-0584(94) (Washington, DC, October 1995). Other 1994 values: EIA, Annual Energy Review 1994, DOE/EIA-0384(94)(Washington, DC, July 1995). 1995 natural gas price: EIA, Natural Gas Monthly, DOE/EIA-0130(96/6) (Washington, DC, June 1996). 1995 natural gas supply derived from: EIA,Natural Gas Annual 1995, DOE/EIA-0131(95)/1 (Washington, DC October 1996). 1995 coal minemouth price, coal production, and exports derived from: EIA, Monthly EnergyReview, DOE/EIA-0035(96/08) (Washington, DC, August 1996). Other 1995 values: EIA, Annual Energy Review 1995, DOE/EIA-0384(95) (Washington, DC, July 1996).Projections: EIA, AEO97 National Energy Modeling System run AEO97B.D100296K.
180 Energy Information Administration/ Annual Energy Outlook 1997
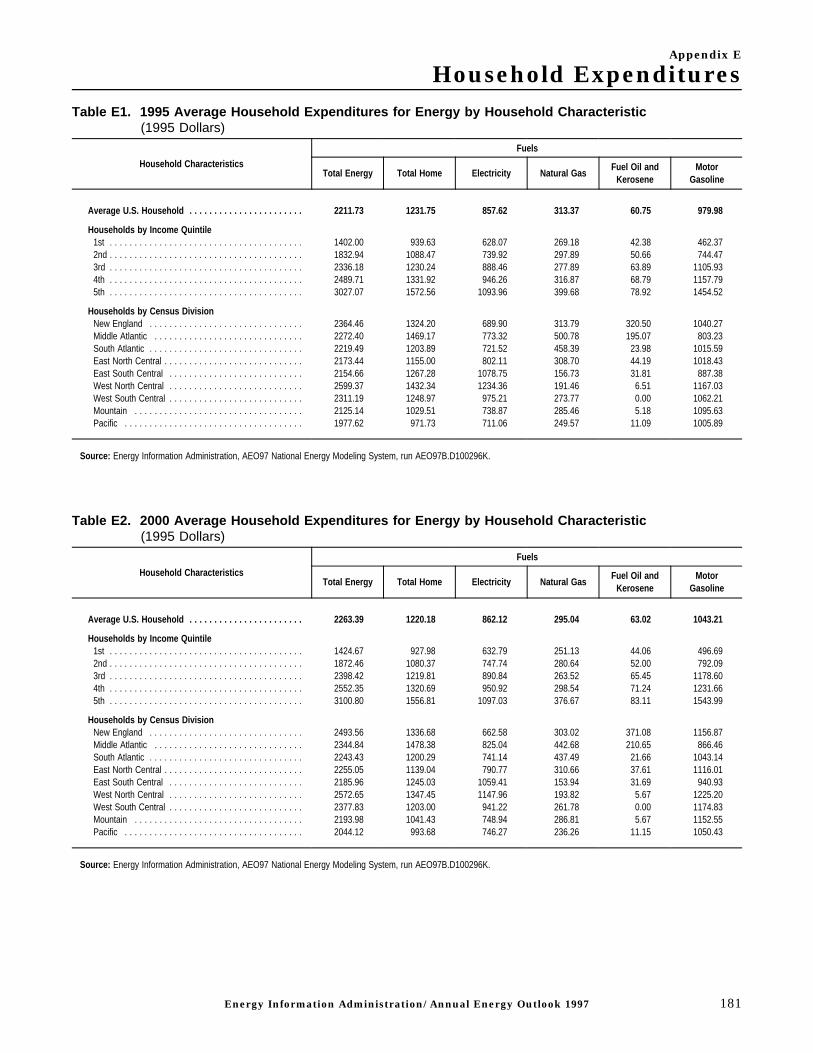
Appendix E
Household ExpendituresTable E1. 1995 Average Household Expenditures for Energy by Household Characteristic
(1995 Dollars)
Household Characteristics
Fuels
Total Energy Total Home Electricity Natural GasFuel Oil and
KeroseneMotor
Gasoline
Average U.S. Household . . . . . . . . . . . . . . . . . . . . . . . 2211.73 1231.75 857.62 313.37 60.75 979.98
Households by Income Quintile1st . . . . . . . . . . . . . . . . . . . . . . . . . . . . . . . . . . . . . . . 1402.00 939.63 628.07 269.18 42.38 462.372nd . . . . . . . . . . . . . . . . . . . . . . . . . . . . . . . . . . . . . . . 1832.94 1088.47 739.92 297.89 50.66 744.473rd . . . . . . . . . . . . . . . . . . . . . . . . . . . . . . . . . . . . . . . 2336.18 1230.24 888.46 277.89 63.89 1105.934th . . . . . . . . . . . . . . . . . . . . . . . . . . . . . . . . . . . . . . . 2489.71 1331.92 946.26 316.87 68.79 1157.795th . . . . . . . . . . . . . . . . . . . . . . . . . . . . . . . . . . . . . . . 3027.07 1572.56 1093.96 399.68 78.92 1454.52
Households by Census DivisionNew England . . . . . . . . . . . . . . . . . . . . . . . . . . . . . . . 2364.46 1324.20 689.90 313.79 320.50 1040.27Middle Atlantic . . . . . . . . . . . . . . . . . . . . . . . . . . . . . . 2272.40 1469.17 773.32 500.78 195.07 803.23South Atlantic . . . . . . . . . . . . . . . . . . . . . . . . . . . . . . . 2219.49 1203.89 721.52 458.39 23.98 1015.59East North Central . . . . . . . . . . . . . . . . . . . . . . . . . . . . 2173.44 1155.00 802.11 308.70 44.19 1018.43East South Central . . . . . . . . . . . . . . . . . . . . . . . . . . . 2154.66 1267.28 1078.75 156.73 31.81 887.38West North Central . . . . . . . . . . . . . . . . . . . . . . . . . . . 2599.37 1432.34 1234.36 191.46 6.51 1167.03West South Central . . . . . . . . . . . . . . . . . . . . . . . . . . . 2311.19 1248.97 975.21 273.77 0.00 1062.21Mountain . . . . . . . . . . . . . . . . . . . . . . . . . . . . . . . . . . 2125.14 1029.51 738.87 285.46 5.18 1095.63Pacific . . . . . . . . . . . . . . . . . . . . . . . . . . . . . . . . . . . . 1977.62 971.73 711.06 249.57 11.09 1005.89
Source: Energy Information Administration, AEO97 National Energy Modeling System, run AEO97B.D100296K.
Table E2. 2000 Average Household Expenditures for Energy by Household Characteristic(1995 Dollars)
Household Characteristics
Fuels
Total Energy Total Home Electricity Natural GasFuel Oil and
KeroseneMotor
Gasoline
Average U.S. Household . . . . . . . . . . . . . . . . . . . . . . . 2263.39 1220.18 862.12 295.04 63.02 1043.21
Households by Income Quintile1st . . . . . . . . . . . . . . . . . . . . . . . . . . . . . . . . . . . . . . . 1424.67 927.98 632.79 251.13 44.06 496.692nd . . . . . . . . . . . . . . . . . . . . . . . . . . . . . . . . . . . . . . . 1872.46 1080.37 747.74 280.64 52.00 792.093rd . . . . . . . . . . . . . . . . . . . . . . . . . . . . . . . . . . . . . . . 2398.42 1219.81 890.84 263.52 65.45 1178.604th . . . . . . . . . . . . . . . . . . . . . . . . . . . . . . . . . . . . . . . 2552.35 1320.69 950.92 298.54 71.24 1231.665th . . . . . . . . . . . . . . . . . . . . . . . . . . . . . . . . . . . . . . . 3100.80 1556.81 1097.03 376.67 83.11 1543.99
Households by Census DivisionNew England . . . . . . . . . . . . . . . . . . . . . . . . . . . . . . . 2493.56 1336.68 662.58 303.02 371.08 1156.87Middle Atlantic . . . . . . . . . . . . . . . . . . . . . . . . . . . . . . 2344.84 1478.38 825.04 442.68 210.65 866.46South Atlantic . . . . . . . . . . . . . . . . . . . . . . . . . . . . . . . 2243.43 1200.29 741.14 437.49 21.66 1043.14East North Central . . . . . . . . . . . . . . . . . . . . . . . . . . . . 2255.05 1139.04 790.77 310.66 37.61 1116.01East South Central . . . . . . . . . . . . . . . . . . . . . . . . . . . 2185.96 1245.03 1059.41 153.94 31.69 940.93West North Central . . . . . . . . . . . . . . . . . . . . . . . . . . . 2572.65 1347.45 1147.96 193.82 5.67 1225.20West South Central . . . . . . . . . . . . . . . . . . . . . . . . . . . 2377.83 1203.00 941.22 261.78 0.00 1174.83Mountain . . . . . . . . . . . . . . . . . . . . . . . . . . . . . . . . . . 2193.98 1041.43 748.94 286.81 5.67 1152.55Pacific . . . . . . . . . . . . . . . . . . . . . . . . . . . . . . . . . . . . 2044.12 993.68 746.27 236.26 11.15 1050.43
Source: Energy Information Administration, AEO97 National Energy Modeling System, run AEO97B.D100296K.
Energy Information Administration/ Annual Energy Outlook 1997 181

Household Expenditures
Table E3. 2005 Average Household Expenditures for Energy by Household Characteristic(1995 Dollars)
Household Characteristics
Fuels
Total Energy Total Home Electricity Natural GasFuel Oil and
KeroseneMotor
Gasoline
Average U.S. Household . . . . . . . . . . . . . . . . . . . . . . . 2240.21 1186.20 849.77 278.08 58.35 1054.01
Households by Income Quintile1st . . . . . . . . . . . . . . . . . . . . . . . . . . . . . . . . . . . . . . . 1400.84 898.99 622.90 235.48 40.61 501.852nd . . . . . . . . . . . . . . . . . . . . . . . . . . . . . . . . . . . . . . . 1849.71 1051.47 738.99 264.32 48.16 798.233rd . . . . . . . . . . . . . . . . . . . . . . . . . . . . . . . . . . . . . . . 2375.94 1186.13 876.38 249.16 60.60 1189.814th . . . . . . . . . . . . . . . . . . . . . . . . . . . . . . . . . . . . . . . 2532.90 1286.31 938.35 281.92 66.04 1246.595th . . . . . . . . . . . . . . . . . . . . . . . . . . . . . . . . . . . . . . . 3076.84 1514.25 1081.69 355.44 77.11 1562.59
Households by Census DivisionNew England . . . . . . . . . . . . . . . . . . . . . . . . . . . . . . . 2518.75 1323.19 676.72 283.59 362.88 1195.57Middle Atlantic . . . . . . . . . . . . . . . . . . . . . . . . . . . . . . 2342.88 1453.04 839.12 413.43 200.48 889.84South Atlantic . . . . . . . . . . . . . . . . . . . . . . . . . . . . . . . 2221.93 1173.36 741.08 412.05 20.23 1048.57East North Central . . . . . . . . . . . . . . . . . . . . . . . . . . . . 2249.88 1118.18 784.97 298.81 34.40 1131.70East South Central . . . . . . . . . . . . . . . . . . . . . . . . . . . 2119.18 1188.12 1013.34 146.93 27.84 931.06West North Central . . . . . . . . . . . . . . . . . . . . . . . . . . . 2480.27 1274.83 1081.01 188.24 5.59 1205.43West South Central . . . . . . . . . . . . . . . . . . . . . . . . . . . 2343.38 1170.88 916.24 254.65 0.00 1172.49Mountain . . . . . . . . . . . . . . . . . . . . . . . . . . . . . . . . . . 2179.96 1039.65 755.72 278.54 5.39 1140.31Pacific . . . . . . . . . . . . . . . . . . . . . . . . . . . . . . . . . . . . 2074.66 973.91 738.58 224.33 11.01 1100.75
Source: Energy Information Administration, AEO97 National Energy Modeling System, run AEO97B.D100296K.
Table E4. 2010 Average Household Expenditures for Energy by Household Characteristic(1995 Dollars)
Household Characteristics
Fuels
Total Energy Total Home Electricity Natural GasFuel Oil and
KeroseneMotor
Gasoline
Average U.S. Household . . . . . . . . . . . . . . . . . . . . . . . 2192.34 1158.35 844.41 259.78 54.16 1033.99
Households by Income Quintile1st . . . . . . . . . . . . . . . . . . . . . . . . . . . . . . . . . . . . . . . 1366.97 875.29 618.82 219.00 37.47 491.672nd . . . . . . . . . . . . . . . . . . . . . . . . . . . . . . . . . . . . . . . 1809.16 1026.86 735.36 246.85 44.66 782.303rd . . . . . . . . . . . . . . . . . . . . . . . . . . . . . . . . . . . . . . . 2326.40 1159.32 869.46 233.56 56.30 1167.074th . . . . . . . . . . . . . . . . . . . . . . . . . . . . . . . . . . . . . . . 2484.33 1259.23 933.94 263.87 61.42 1225.095th . . . . . . . . . . . . . . . . . . . . . . . . . . . . . . . . . . . . . . . 3014.94 1479.39 1075.32 332.29 71.79 1535.55
Households by Census DivisionNew England . . . . . . . . . . . . . . . . . . . . . . . . . . . . . . . 2496.76 1300.84 687.41 262.37 351.05 1195.92Middle Atlantic . . . . . . . . . . . . . . . . . . . . . . . . . . . . . . 2325.11 1437.53 862.46 383.59 191.47 887.59South Atlantic . . . . . . . . . . . . . . . . . . . . . . . . . . . . . . . 2177.96 1145.22 735.13 390.86 19.23 1032.74East North Central . . . . . . . . . . . . . . . . . . . . . . . . . . . . 2220.28 1104.32 788.38 284.29 31.64 1115.97East South Central . . . . . . . . . . . . . . . . . . . . . . . . . . . 2057.01 1151.67 988.14 138.97 24.56 905.34West North Central . . . . . . . . . . . . . . . . . . . . . . . . . . . 2383.06 1226.08 1039.67 180.84 5.57 1156.98West South Central . . . . . . . . . . . . . . . . . . . . . . . . . . . 2297.44 1154.53 913.62 240.92 0.00 1142.91Mountain . . . . . . . . . . . . . . . . . . . . . . . . . . . . . . . . . . 2122.25 1018.68 748.38 265.08 5.22 1103.57Pacific . . . . . . . . . . . . . . . . . . . . . . . . . . . . . . . . . . . . 2032.77 947.52 729.81 207.08 10.63 1085.24
Source: Energy Information Administration, AEO97 National Energy Modeling System, run AEO97B.D100296K.
182 Energy Information Administration/ Annual Energy Outlook 1997

Household Expenditures
Table E5. 2015 Average Household Expenditures for Energy by Household Characteristic(1995 Dollars)
Household Characteristics
Fuels
Total Energy Total Home Electricity Natural GasFuel Oil and
KeroseneMotor
Gasoline
Average U.S. Household . . . . . . . . . . . . . . . . . . . . . . . 2092.96 1146.33 847.70 249.36 49.28 946.63
Households by Income Quintile1st . . . . . . . . . . . . . . . . . . . . . . . . . . . . . . . . . . . . . . . 1313.77 864.30 620.85 209.58 33.87 449.472nd . . . . . . . . . . . . . . . . . . . . . . . . . . . . . . . . . . . . . . . 1731.18 1015.70 738.42 236.73 40.55 715.493rd . . . . . . . . . . . . . . . . . . . . . . . . . . . . . . . . . . . . . . . 2215.53 1147.15 871.07 224.88 51.19 1068.384th . . . . . . . . . . . . . . . . . . . . . . . . . . . . . . . . . . . . . . . 2372.11 1248.46 938.75 253.73 55.99 1123.655th . . . . . . . . . . . . . . . . . . . . . . . . . . . . . . . . . . . . . . . 2874.72 1466.38 1081.64 319.08 65.66 1408.34
Households by Census DivisionNew England . . . . . . . . . . . . . . . . . . . . . . . . . . . . . . . 2408.58 1289.31 704.96 250.31 334.04 1119.27Middle Atlantic . . . . . . . . . . . . . . . . . . . . . . . . . . . . . . 2265.50 1441.07 894.59 367.50 178.97 824.43South Atlantic . . . . . . . . . . . . . . . . . . . . . . . . . . . . . . . 2073.69 1125.08 725.67 381.77 17.64 948.61East North Central . . . . . . . . . . . . . . . . . . . . . . . . . . . . 2138.96 1115.45 809.79 277.79 27.87 1023.51East South Central . . . . . . . . . . . . . . . . . . . . . . . . . . . 1955.94 1131.06 973.98 135.70 21.38 824.88West North Central . . . . . . . . . . . . . . . . . . . . . . . . . . . 2237.13 1199.36 1015.45 178.51 5.40 1037.77West South Central . . . . . . . . . . . . . . . . . . . . . . . . . . . 2169.83 1128.38 896.47 231.91 0.00 1041.45Mountain . . . . . . . . . . . . . . . . . . . . . . . . . . . . . . . . . . 1989.12 992.22 732.20 255.12 4.91 996.90Pacific . . . . . . . . . . . . . . . . . . . . . . . . . . . . . . . . . . . . 1962.62 966.15 761.41 194.88 9.85 996.48
Source: Energy Information Administration, AEO97 National Energy Modeling System, run AEO97B.D100296K.
Energy Information Administration/ Annual Energy Outlook 1997 183

Appendix F
Results from Side CasesTable F1. Key Results for Residential Sector Technology Cases
Energy Consumption 1995
Projections
2000 2005
1997Technology
ReferenceCase
AdvancedTechnology
CostReduction
HighTechnology
1997Technology
ReferenceCase
AdvancedTechnology
CostReduction
HighTechnology
Energy Consumption(quadrillion Btu)
Distillate Fuel . . . . . . . . . . . . . . . . . . . . . . . . . 0.85 0.84 0.83 0.82 0.81 0.82 0.78 0.78 0.75Kerosene . . . . . . . . . . . . . . . . . . . . . . . . . . . . 0.07 0.07 0.07 0.07 0.07 0.07 0.07 0.07 0.06Liquefied Petroleum Gas . . . . . . . . . . . . . . . . . 0.40 0.44 0.43 0.43 0.42 0.46 0.44 0.43 0.42
Petroleum Subtotal . . . . . . . . . . . . . . . . . . . 1.32 1.35 1.33 1.32 1.30 1.35 1.29 1.28 1.23Natural Gas . . . . . . . . . . . . . . . . . . . . . . . . . . 5.01 5.35 5.33 5.24 5.24 5.57 5.43 5.29 5.18Coal . . . . . . . . . . . . . . . . . . . . . . . . . . . . . . . 0.05 0.05 0.05 0.05 0.05 0.05 0.05 0.04 0.04Renewable Energy . . . . . . . . . . . . . . . . . . . . . 0.57 0.57 0.57 0.56 0.56 0.57 0.56 0.54 0.54Electricity . . . . . . . . . . . . . . . . . . . . . . . . . . . . 3.56 3.90 3.88 3.85 3.77 4.20 4.14 4.08 3.87
Delivered Energy . . . . . . . . . . . . . . . . . . . 10.51 11.23 11.16 11.01 10.92 11.74 11.46 11.23 10.88Electricity Related Losses . . . . . . . . . . . . . . . . 7.92 8.31 8.25 8.20 8.03 8.68 8.55 8.43 8.00
Total . . . . . . . . . . . . . . . . . . . . . . . . . . . . . 18.43 19.53 19.41 19.21 18.95 20.42 20.02 19.65 18.88
Delivered Energy Consumptionper Household (million Btu per year) . . . . . . . . 106.10 107.49 106.81 105.41 104.54 106.29 103.78 101.63 98.46
Table F2. Key Results for Commercial Sector Technology Cases
Energy Consumption 1995
Projections
2000 2005
1997Technology
ReferenceCase
AdvancedTechnology
CostReduction
HighTechnology
1997Technology
ReferenceCase
AdvancedTechnology
CostReduction
HighTechnology
Energy Consumption(quadrillion Btu)
Distillate Fuel . . . . . . . . . . . . . . . . . . . . . . . . . 0.41 0.37 0.37 0.37 0.37 0.36 0.36 0.36 0.35Residual Fuel . . . . . . . . . . . . . . . . . . . . . . . . . 0.17 0.13 0.13 0.13 0.13 0.13 0.13 0.13 0.13Kerosene . . . . . . . . . . . . . . . . . . . . . . . . . . . . 0.02 0.02 0.02 0.02 0.02 0.02 0.02 0.02 0.02Liquefied Petroleum Gas . . . . . . . . . . . . . . . . . 0.05 0.06 0.06 0.06 0.06 0.06 0.06 0.06 0.06Motor Gasoline . . . . . . . . . . . . . . . . . . . . . . . . 0.03 0.03 0.03 0.03 0.03 0.03 0.03 0.03 0.03
Petroleum Subtotal . . . . . . . . . . . . . . . . . . . 0.67 0.60 0.60 0.60 0.60 0.60 0.60 0.60 0.59Natural Gas . . . . . . . . . . . . . . . . . . . . . . . . . . 3.16 3.37 3.36 3.35 3.31 3.46 3.44 3.43 3.32Coal . . . . . . . . . . . . . . . . . . . . . . . . . . . . . . . 0.08 0.08 0.08 0.08 0.08 0.08 0.08 0.08 0.08Renewable Energy . . . . . . . . . . . . . . . . . . . . . 0.00 0.00 0.00 0.00 0.00 0.00 0.00 0.00 0.00Electricity . . . . . . . . . . . . . . . . . . . . . . . . . . . . 3.23 3.50 3.50 3.50 3.34 3.76 3.71 3.69 3.43
Delivered Energy . . . . . . . . . . . . . . . . . . . 7.15 7.56 7.54 7.54 7.33 7.91 7.84 7.81 7.43Electricity Related Losses . . . . . . . . . . . . . . . . 7.18 7.46 7.44 7.44 7.12 7.77 7.67 7.63 7.08
Total . . . . . . . . . . . . . . . . . . . . . . . . . . . . . 14.33 15.01 14.98 14.98 14.45 15.68 15.51 15.44 14.51
Delivered Energy Consumptionper Square Foot (thousand Btu per year) . . . . . 101.17 101.72 101.49 101.45 98.72 102.04 101.13 100.72 95.81
184 Energy Information Administration/ Annual Energy Outlook 1997

Side Cases
Table F1. Key Results for Residential Sector Technology Cases (Continued)Projections
2010 2015 Annual Growth 1995-2015 (percent)
1997Technology
ReferenceCase
AdvancedTechnology
CostReduction
HighTechnology
1997Technology
ReferenceCase
AdvancedTechnology
CostReduction
HighTechnology
1997Technology
ReferenceCase
AdvancedTechnology
CostReduction
HighTechnology
0.80 0.75 0.74 0.70 0.80 0.73 0.71 0.67 -0.3% -0.8% -0.9% -1.2%0.07 0.07 0.06 0.06 0.07 0.06 0.06 0.06 -0.2% -0.6% -0.8% -1.2%0.48 0.45 0.44 0.41 0.51 0.46 0.44 0.40 1.2% 0.7% 0.5% 0.0%1.36 1.26 1.24 1.17 1.38 1.25 1.22 1.12 0.2% -0.3% -0.4% -0.8%5.85 5.57 5.37 5.03 6.17 5.73 5.47 4.93 1.0% 0.7% 0.4% -0.1%0.05 0.04 0.04 0.04 0.04 0.04 0.04 0.04 -0.9% -1.3% -1.6% -1.7%0.57 0.55 0.52 0.52 0.58 0.54 0.50 0.51 0.1% -0.3% -0.6% -0.6%4.58 4.46 4.33 4.04 5.05 4.85 4.64 4.30 1.8% 1.6% 1.3% 0.9%
12.41 11.89 11.50 10.80 13.22 12.41 11.87 10.90 1.2% 0.8% 0.6% 0.2%9.20 8.95 8.68 8.10 9.60 9.22 8.83 8.17 1.0% 0.8% 0.5% 0.2%
21.61 20.83 20.18 18.90 22.81 21.63 20.70 19.07 1.1% 0.8% 0.6% 0.2%
106.57 102.06 98.75 92.72 107.77 101.19 96.80 88.83 0.1% -0.2% -0.5% -0.9%
Btu = British thermal unit.Note: Side cases were run without the fully integrated modeling system, so not all feedbacks are captured.Source: AEO97 National Energy Modeling System runs RSFRZN.D100896A, AEO97B.D100296K, BLGATCR.D100396E, and RSBEST.D100896A.
Table F2. Key Results for Commercial Sector Technology Cases (Continued)Projections
2010 2015 Annual Growth 1995-2015 (percent)
1997Technology
ReferenceCase
AdvancedTechnology
CostReduction
HighTechnology
1997Technology
ReferenceCase
AdvancedTechnology
CostReduction
HighTechnology
1997Technology
ReferenceCase
AdvancedTechnology
CostReduction
HighTechnology
0.35 0.35 0.34 0.34 0.35 0.34 0.34 0.33 -0.8% -0.9% -0.9% -1.0%0.14 0.14 0.14 0.14 0.14 0.14 0.14 0.14 -0.9% -0.9% -0.9% -0.9%0.02 0.02 0.02 0.02 0.02 0.02 0.02 0.02 0.4% 0.4% 0.4% 0.4%0.06 0.06 0.06 0.06 0.06 0.06 0.06 0.06 0.9% 0.9% 0.9% 0.9%0.03 0.03 0.03 0.03 0.02 0.02 0.02 0.02 -0.3% -0.3% -0.3% -0.3%0.60 0.59 0.59 0.59 0.60 0.59 0.59 0.59 -0.6% -0.7% -0.7% -0.7%3.58 3.54 3.52 3.34 3.72 3.65 3.63 3.40 0.8% 0.7% 0.7% 0.4%0.09 0.09 0.09 0.09 0.09 0.09 0.09 0.09 0.6% 0.6% 0.6% 0.6%0.00 0.00 0.00 0.00 0.00 0.00 0.00 0.00 0.8% 0.8% 0.8% 0.8%4.00 3.91 3.87 3.54 4.27 4.16 4.09 3.72 1.4% 1.3% 1.2% 0.7%8.27 8.13 8.07 7.56 8.68 8.50 8.40 7.81 1.0% 0.9% 0.8% 0.4%8.02 7.85 7.76 7.10 8.13 7.91 7.79 7.08 0.6% 0.5% 0.4% -0.1%
16.29 15.98 15.82 14.66 16.81 16.40 16.19 14.89 0.8% 0.7% 0.6% 0.2%
102.40 100.72 99.93 93.65 103.08 100.88 99.80 92.68 0.1% 0.0% -0.1% -0.4%
Btu = British thermal unit.Note: Side cases were run without the fully integrated modeling system, so not all feedbacks are captured.Source: AEO97 National Energy Modeling System runs TK1997.D101696A, AEO97B.D100296K, BLDGATCR.D100396E, and COMHGH.D100396A.
Energy Information Administration/ Annual Energy Outlook 1997 185

Side Cases
Table F3. Key Results for Industrial Sector Technology Cases
Energy Consumption 1995
Projections
2000 2010 2015
1997Technology
ReferenceCase
HighTechnology
1997Technology
ReferenceCase
HighTechnology
1997Technology
ReferenceCase
HighTechnology
Energy Consumption (quadrillion Btu)Distillate Fuel . . . . . . . . . . . . . . . . . . . . . 1.15 1.27 1.26 1.25 1.48 1.47 1.41 1.56 1.55 1.45Liquefied Petroleum Gas . . . . . . . . . . . . . 2.01 2.12 2.08 2.03 2.38 2.28 2.14 2.47 2.35 2.17Petrochemical Feedstocks . . . . . . . . . . . 1.16 1.27 1.25 1.21 1.42 1.35 1.26 1.48 1.40 1.28Residual Fuel . . . . . . . . . . . . . . . . . . . . . 0.34 0.28 0.28 0.26 0.33 0.33 0.27 0.37 0.35 0.29Motor Gasoline . . . . . . . . . . . . . . . . . . . . 0.20 0.22 0.22 0.22 0.26 0.26 0.24 0.27 0.27 0.25Other Petroleum . . . . . . . . . . . . . . . . . . . 3.83 4.25 4.19 4.12 4.68 4.43 4.28 4.79 4.48 4.28
Petroleum Subtotal . . . . . . . . . . . . . . . 8.68 9.41 9.28 9.09 10.54 10.13 9.60 10.93 10.41 9.73Natural Gas . . . . . . . . . . . . . . . . . . . . . . 9.74 10.75 10.62 10.34 11.74 11.42 10.82 12.01 11.63 10.93Metallurgical Coal . . . . . . . . . . . . . . . . . . 0.88 0.79 0.79 0.79 0.62 0.62 0.62 0.55 0.55 0.55Steam Coal . . . . . . . . . . . . . . . . . . . . . . 1.59 1.74 1.72 1.62 1.97 1.89 1.66 2.07 1.97 1.66Net Coal Coke Imports . . . . . . . . . . . . . . 0.03 0.08 0.08 0.08 0.14 0.13 0.13 0.15 0.15 0.15
Coal Subtotal . . . . . . . . . . . . . . . . . . . 2.51 2.61 2.58 2.49 2.72 2.64 2.40 2.77 2.67 2.36Renewable Energy . . . . . . . . . . . . . . . . . 1.74 1.91 1.91 1.90 2.29 2.28 2.26 2.42 2.40 2.37Electricity . . . . . . . . . . . . . . . . . . . . . . . . 3.46 3.87 3.83 3.72 4.50 4.40 4.12 4.76 4.62 4.25
Delivered Energy . . . . . . . . . . . . . . . 26.12 28.56 28.22 27.55 31.79 30.87 29.20 32.88 31.73 29.64Electricity Related Losses . . . . . . . . . . . . 7.69 8.23 8.15 7.93 9.03 8.82 8.26 9.05 8.79 8.09
Total . . . . . . . . . . . . . . . . . . . . . . . . . 33.81 36.79 36.37 35.47 40.82 39.69 37.46 41.94 40.51 37.73
Energy Use per Dollar of Output(thousand Btu per 1987 dollar)
Delivered Energy . . . . . . . . . . . . . . . 7.11 6.92 6.84 6.67 6.24 6.06 5.73 6.01 5.80 5.42Total Energy . . . . . . . . . . . . . . . . . . . 9.21 8.91 8.81 8.60 8.01 7.79 7.35 7.67 7.41 6.90
Btu = British thermal unit.Note: Side cases were run without the fully integrated modeling system, so not all potential feedbacks were captured.Source: AEO97 National Energy Modeling System runs FRZTECH.D102396A, AEO97B.D100296K, and HITECH.D101896B.
Table F4. Key Results for Transportation Sector Technology Cases
Energy Consumption 1995
Projections
2000 2010 2015
1997Technology
ReferenceCase
RapidTechnology
1997Technology
ReferenceCase
RapidTechnology
1997Technology
ReferenceCase
RapidTechnology
Energy Consumption (quadrillion Btu)Distillate Fuel . . . . . . . . . . . . . . . . . . . . . 4.42 4.96 4.96 4.88 5.78 5.78 5.32 6.00 6.00 5.35Jet Fuel . . . . . . . . . . . . . . . . . . . . . . . . . 3.13 3.83 3.83 3.83 4.66 4.67 4.59 4.95 4.95 4.81Motor Gasoline . . . . . . . . . . . . . . . . . . . . 14.65 15.76 15.76 15.74 17.25 17.09 16.15 17.72 17.11 15.62Residual Fuel . . . . . . . . . . . . . . . . . . . . . 1.08 1.29 1.29 1.29 1.64 1.64 1.64 1.78 1.78 1.78Liquefied Petroleum Gas . . . . . . . . . . . . . 0.03 0.04 0.04 0.04 0.18 0.18 0.16 0.22 0.21 0.19Other Petroleum . . . . . . . . . . . . . . . . . . . 0.26 0.29 0.29 0.29 0.33 0.33 0.33 0.34 0.34 0.34Pipeline Fuel Natural Gas . . . . . . . . . . . . 0.72 0.77 0.77 0.77 0.88 0.88 0.88 0.94 0.93 0.94Compressed Natural Gas . . . . . . . . . . . . 0.01 0.06 0.06 0.06 0.26 0.26 0.24 0.32 0.31 0.28Renewables (Ethanol) . . . . . . . . . . . . . . . 0.00 0.00 0.00 0.00 0.07 0.07 0.07 0.11 0.1 0.09Liquid Hydrogen . . . . . . . . . . . . . . . . . . . 0.00 0.00 0.00 0.00 0.00 0.00 0.00 0.00 0.00 0.00Methanol . . . . . . . . . . . . . . . . . . . . . . . . 0.00 0.00 0.00 0.00 0.07 0.07 0.06 0.1 0.09 0.09Electricity . . . . . . . . . . . . . . . . . . . . . . . . 0.02 0.02 0.02 0.02 0.14 0.14 0.13 0.17 0.17 0.16
Total . . . . . . . . . . . . . . . . . . . . . . . . . 24.31 27.04 27.04 26.93 31.27 31.11 29.58 32.66 31.99 29.66
Light-Duty Fleet (miles per gallon) . . . . . . 19.7 19.6 19.6 19.7 20.2 20.4 21.5 20.6 21.3 23.3
Btu = British thermal unit.Note: Side cases were run without the fully integrated modeling system, so not all potential feedbacks were captured.Source: AEO97 National Energy Modeling System runs FRZNEFF.D100896A, AEO97B.D100296K, and HITECH.D100896H.
186 Energy Information Administration/ Annual Energy Outlook 1997

Side Cases
Table F5. Key Results for Nuclear Retirement Cases(Thousand Megawatts)
Net Summer Capability 1995
Projections
2005 2010 2015
LowNuclear
ReferenceCase
HighNuclear
LowNuclear
ReferenceCase
HighNuclear
LowNuclear
ReferenceCase
HighNuclear
Electric Generators
CapabilityCoal Steam . . . . . . . . . . . . . . . . . . . . . . . . . . . . . 304.9 303.6 298.2 297.5 310.8 304.0 303.2 328.2 315.4 310.3Other Fossil Steam . . . . . . . . . . . . . . . . . . . . . . . 139.6 102.6 102.6 102.6 99.9 99.9 99.9 96.1 96.1 96.1Combined Cycle . . . . . . . . . . . . . . . . . . . . . . . . . 14.7 89.3 73.5 70.5 132.9 107.5 99.5 169.1 153.0 131.2Combustion Turbine/Diesel . . . . . . . . . . . . . . . . . 56.0 145.8 134.5 133.9 160.0 153.1 153.1 171.2 168.3 163.3Nuclear Power . . . . . . . . . . . . . . . . . . . . . . . . . . 99.2 62.7 94.7 100.4 48.9 88.9 99.1 22.1 62.7 94.7Pumped Storage . . . . . . . . . . . . . . . . . . . . . . . . . 19.9 19.9 19.9 19.9 19.9 19.9 19.9 19.9 19.9 19.9Fuel Cells . . . . . . . . . . . . . . . . . . . . . . . . . . . . . . 0.0 2.6 2.0 1.7 3.1 2.1 2.0 3.1 2.1 2.0Renewable Sources . . . . . . . . . . . . . . . . . . . . . . 88.0 92.4 92.2 92.0 94.6 94.1 94.4 100.0 98.3 98.2
Total . . . . . . . . . . . . . . . . . . . . . . . . . . . . . . . . 722.2 818.7 817.5 818.4 870.1 869.4 871.2 909.6 915.8 915.7
Cumulative Planned AdditionsCoal Steam . . . . . . . . . . . . . . . . . . . . . . . . . . . . . 1.4 3.7 3.7 3.7 5.3 5.3 5.3 5.3 5.3 5.3Other Fossil Steam . . . . . . . . . . . . . . . . . . . . . . . 0.0 0.0 0.0 0.0 0.0 0.0 0.0 0.0 0.0 0.0Combined Cycle . . . . . . . . . . . . . . . . . . . . . . . . . 1.4 2.0 2.0 2.0 2.0 2.0 2.0 2.0 2.0 2.0Combustion Turbine/Diesel . . . . . . . . . . . . . . . . . 3.2 4.5 4.5 4.5 4.5 4.5 4.5 4.5 4.5 4.5Nuclear Power . . . . . . . . . . . . . . . . . . . . . . . . . . 0.0 1.2 1.2 1.2 1.2 1.2 1.2 1.2 1.2 1.2Pumped Storage . . . . . . . . . . . . . . . . . . . . . . . . . 1.1 1.1 1.1 1.1 1.1 1.1 1.1 1.1 1.1 1.1Fuel Cells . . . . . . . . . . . . . . . . . . . . . . . . . . . . . . 0.0 0.0 0.0 0.0 0.0 0.0 0.0 0.0 0.0 0.0Renewable Sources . . . . . . . . . . . . . . . . . . . . . . 0.7 2.9 2.9 2.9 2.9 2.9 2.9 2.9 2.9 2.9
Total . . . . . . . . . . . . . . . . . . . . . . . . . . . . . . . . 8.0 15.5 15.5 15.5 17.1 17.1 17.1 17.1 17.1 17.1
Cumulative Unplanned AdditionsCoal Steam . . . . . . . . . . . . . . . . . . . . . . . . . . . . . 0.0 14.8 9.5 8.7 23.1 16.4 15.6 44.4 31.6 26.5Other Fossil Steam . . . . . . . . . . . . . . . . . . . . . . . 0.0 0.0 0.0 0.0 0.0 0.0 0.0 0.0 0.0 0.0Combined Cycle . . . . . . . . . . . . . . . . . . . . . . . . . 0.0 73.7 58.0 55.0 117.4 91.9 84.0 153.6 137.5 115.7Combustion Turbine/Diesel . . . . . . . . . . . . . . . . . 0.1 89.5 78.2 77.6 104.0 97.1 97.2 116.3 113.5 108.5Nuclear Power . . . . . . . . . . . . . . . . . . . . . . . . . . 0.0 0.0 0.0 0.0 0.0 0.0 0.0 0.0 0.0 0.0Pumped Storage . . . . . . . . . . . . . . . . . . . . . . . . . 0.0 0.0 0.0 0.0 0.0 0.0 0.0 0.0 0.0 0.0Fuel Cells . . . . . . . . . . . . . . . . . . . . . . . . . . . . . . 0.0 2.5 2.0 1.7 3.1 2.1 2.0 3.1 2.1 2.0Renewable Sources . . . . . . . . . . . . . . . . . . . . . . 0.0 2.0 1.8 1.6 4.4 3.9 4.2 10.1 8.4 8.3
Total . . . . . . . . . . . . . . . . . . . . . . . . . . . . . . . . 0.1 182.6 149.5 144.7 252.0 211.4 203.0 327.5 293.1 260.9
Cumulative Total Additions . . . . . . . . . . . . . . . . . 8.2 198.1 165.0 160.2 269.2 228.5 220.1 344.7 310.2 278.1
Cumulative Retirements . . . . . . . . . . . . . . . . . . . 11.9 104.9 72.1 67.3 124.6 83.9 74.5 159.7 119.1 87.1
Cogenerators
CapacityCoal . . . . . . . . . . . . . . . . . . . . . . . . . . . . . . . . . . 8.2 9.0 9.0 9.0 9.3 9.3 9.3 9.5 9.5 9.5Petroleum . . . . . . . . . . . . . . . . . . . . . . . . . . . . . . 0.9 0.9 0.9 0.9 1.0 1.0 1.0 1.0 1.0 1.0Natural Gas . . . . . . . . . . . . . . . . . . . . . . . . . . . . 28.9 32.1 32.1 32.1 33.3 33.3 33.3 34.2 34.2 34.2Other Gaseous Fuels . . . . . . . . . . . . . . . . . . . . . 1.0 0.9 0.9 0.9 0.9 0.9 0.9 0.9 0.9 0.9Renewable Sources . . . . . . . . . . . . . . . . . . . . . . 6.2 7.3 7.3 7.3 7.8 7.8 7.8 8.2 8.2 8.2Other . . . . . . . . . . . . . . . . . . . . . . . . . . . . . . . . . 0.0 0.0 0.0 0.0 0.0 0.0 0.0 0.0 0.0 0.0
Total . . . . . . . . . . . . . . . . . . . . . . . . . . . . . . . . 45.1 50.2 50.2 50.2 52.3 52.3 52.2 53.8 53.8 53.8
Cumulative Additions . . . . . . . . . . . . . . . . . . . . . . 10.2 15.3 15.3 15.3 17.3 17.3 17.3 18.8 18.8 18.8
Notes: Totals may not equal sum of components due to independent rounding. Net summer capability has been estimated for nonutility generators for AEO97. Net summercapacity is used to be consistent with electric utility capacity estimates. Data for electric utility capacity are the most recent data available as of August 15, 1996. Therefore, capacityestimates may differ from other Energy Information Administration sources.
Source: Energy Information Administration, AEO97 National Energy Modeling System runs LNUC97.D100796B, AEO97B.D100296K, and HNUC97.D100796B.
Energy Information Administration/ Annual Energy Outlook 1997 187

Side Cases
Table F6. Key Results for Electricity Demand Cases
Electricity Supply and Demand 1995
Projections
2000 2010 2015Annual Growth 1995-2015
(percent)
ReferenceCase
HighDemand
ReferenceCase
HighDemand
ReferenceCase
HighDemand
ReferenceCase
HighDemand
Electricity Sales (billion kilowatthours) . . . . . . . . . 3008 3290 3543 3784 4228 4044 4474 1.50% 2.00%Net Imports (billion kilowatthours) . . . . . . . . . . . . 38 40 40 31 39 27 33 -1.70% -0.60%Electricity Prices (1995 cents per kilowatthour) . . . 7.1 6.9 7.3 6.4 7.1 6.3 6.8 -0.60% -0.20%
Generation by Fuel (billion kilowatthours)Coal . . . . . . . . . . . . . . . . . . . . . . . . . . . . . . . 1714 1843 1926 1992 2195 2103 2412 13.01% 12.08%Natural Gas . . . . . . . . . . . . . . . . . . . . . . . . . . 502 672 815 1106 1333 1405 1508 11.81% 9.65%Renewables . . . . . . . . . . . . . . . . . . . . . . . . . . 396 397 397 424 436 449 472 7.63% 4.68%Other . . . . . . . . . . . . . . . . . . . . . . . . . . . . . . . 750 753 795 685 710 526 541 3.55% 3.70%
Total . . . . . . . . . . . . . . . . . . . . . . . . . . . . . 3362 3665 3933 4207 4674 4483 4933 1.38% 1.42%
Generating Capacity (gigawatts)Coal . . . . . . . . . . . . . . . . . . . . . . . . . . . . . . . 304.9 298.7 301.1 304.0 329.7 315.4 362.1 0.20% 0.90%Combined-Cycle/Combustion Turbine . . . . . . . 70.7 153.6 167.4 260.6 334.3 321.3 369.3 8.11% 5.70%Renewables . . . . . . . . . . . . . . . . . . . . . . . . . . 88.0 90.5 90.6 94.1 96.6 98.3 103.1 0.60% 0.80%Nuclear Power . . . . . . . . . . . . . . . . . . . . . . . . 99.2 99.1 99.1 88.9 88.9 62.7 62.7 -2.30% -2.30%Cogenerators . . . . . . . . . . . . . . . . . . . . . . . . . 45.1 47.6 47.6 52.3 52.3 53.8 53.8 0.90% 0.90%Other . . . . . . . . . . . . . . . . . . . . . . . . . . . . . . . 159.4 140.0 140.1 121.8 124.3 118.1 119.5 3.00% 3.54%
Total . . . . . . . . . . . . . . . . . . . . . . . . . . . . . 767.3 829.5 845.9 921.7 1026.1 969.6 1070.5 1.12% 1.22%
Energy ProductionCoal (million short tons) . . . . . . . . . . . . . . . . . 1031 1105 1144 1201 1306 1268 1410 1.00% 1.60%Natural Gas (trillion cubic feet) . . . . . . . . . . . . 18.48 20.54 22.00 24.25 25.98 26.10 27.12 1.70% 1.90%Carbon Emissions (million metric tons) . . . . . . 1423.7 1543.1 1599.1 1722.4 1805.7 1799.3 1892.7 1.20% 1.40%
Prices to Utilities (1995 dollars per million Btu)Coal . . . . . . . . . . . . . . . . . . . . . . . . . . . . . . . 1.34 1.29 1.34 1.20 1.21 1.11 1.15 -0.90% -0.80%Natural Gas . . . . . . . . . . . . . . . . . . . . . . . . . . 2.01 2.19 2.57 2.32 2.60 2.47 2.54 1.00% 1.20%
Btu = British thermal unit.Note: Other includes non-coal fossil steam, pumped storage, methane, propane, and blast furnace gas.Source: AEO97 National Energy Modeling System runs HIDEMD.D100596A and AEO97B.D100296K.
188 Energy Information Administration/ Annual Energy Outlook 1997

Side Cases
Table F7. Key Results for Electricity Generation Sector Technology Cases(Thousand Megawatts)
Net Summer Capability 1995
Projections
2005 2010 2015
LowTechnology
ReferenceCase
HighTechnology
LowTechnology
ReferenceCase
HighTechnology
LowTechnology
ReferenceCase
HighTechnology
Electric Generators
CapabilityCoal Steam . . . . . . . . . . . . . . . . . . . . . . 304.9 301.9 298.2 297.0 317.8 304.0 303.0 353.0 315.4 317.1Other Fossil Steam . . . . . . . . . . . . . . . . 139.6 102.6 102.6 102.6 99.9 99.9 99.9 96.1 96.1 96.1Combined Cycle . . . . . . . . . . . . . . . . . . 14.7 70.4 73.5 73.7 91.7 107.5 105.7 107.6 153.0 143.6Combustion Turbine/Diesel . . . . . . . . . . 56.0 135.8 134.5 136.5 153.3 153.1 153.5 178.5 168.3 174.0Nuclear Power . . . . . . . . . . . . . . . . . . . 99.2 94.7 94.7 94.7 88.9 88.9 88.9 62.7 62.7 62.7Pumped Storage . . . . . . . . . . . . . . . . . . 19.9 19.9 19.9 19.9 19.9 19.9 19.9 19.9 19.9 19.9Fuel Cells . . . . . . . . . . . . . . . . . . . . . . . 0.0 0.0 2.0 1.4 0.0 2.1 2.4 0.0 2.1 2.7Renewable Sources . . . . . . . . . . . . . . . 88.0 91.8 92.2 92.8 92.9 94.1 96.1 95.0 98.3 103.0
Total . . . . . . . . . . . . . . . . . . . . . . . . . 722.2 817.0 817.5 818.5 864.4 869.4 869.3 912.8 915.8 919.2
Cumulative Planned AdditionsCoal Steam . . . . . . . . . . . . . . . . . . . . . . 1.4 3.7 3.7 3.7 5.3 5.3 5.3 5.3 5.3 5.3Other Fossil Steam . . . . . . . . . . . . . . . . 0.0 0.0 0.0 0.0 0.0 0.0 0.0 0.0 0.0 0.0Combined Cycle . . . . . . . . . . . . . . . . . . 1.4 2.0 2.0 2.0 2.0 2.0 2.0 2.0 2.0 2.0Combustion Turbine/Diesel . . . . . . . . . . 3.2 4.5 4.5 4.5 4.5 4.5 4.5 4.5 4.5 4.5Nuclear Power . . . . . . . . . . . . . . . . . . . 0.0 1.2 1.2 1.2 1.2 1.2 1.2 1.2 1.2 1.2Pumped Storage . . . . . . . . . . . . . . . . . . 1.1 1.1 1.1 1.1 1.1 1.1 1.1 1.1 1.1 1.1Fuel Cells . . . . . . . . . . . . . . . . . . . . . . . 0.0 0.0 0.0 0.0 0.0 0.0 0.0 0.0 0.0 0.0Renewable Sources . . . . . . . . . . . . . . . 0.7 2.9 2.9 2.9 2.9 2.9 2.9 2.9 2.9 2.9
Total . . . . . . . . . . . . . . . . . . . . . . . . . 8.0 15.5 15.5 15.5 17.1 17.1 17.1 17.1 17.1 17.1
Cumulative Unplanned AdditionsCoal Steam . . . . . . . . . . . . . . . . . . . . . . 0.0 13.2 9.5 8.3 30.2 16.4 15.4 69.2 31.6 33.3Other Fossil Steam . . . . . . . . . . . . . . . . 0.0 0.0 0.0 0.0 0.0 0.0 0.0 0.0 0.0 0.0Combined Cycle . . . . . . . . . . . . . . . . . . 0.0 54.9 58.0 58.1 76.2 91.9 90.1 92.0 137.5 128.1Combustion Turbine/Diesel . . . . . . . . . . 0.1 79.5 78.2 80.2 97.3 97.1 97.6 123.7 113.5 119.2Nuclear Power . . . . . . . . . . . . . . . . . . . 0.0 0.0 0.0 0.0 0.0 0.0 0.0 0.0 0.0 0.0Pumped Storage . . . . . . . . . . . . . . . . . . 0.0 0.0 0.0 0.0 0.0 0.0 0.0 0.0 0.0 0.0Fuel Cells . . . . . . . . . . . . . . . . . . . . . . . 0.0 0.0 2.0 1.4 0.0 2.1 2.4 0.0 2.1 2.7Renewable Sources . . . . . . . . . . . . . . . 0.0 1.4 1.8 2.5 2.7 3.9 5.8 5.0 8.4 13.1
Total . . . . . . . . . . . . . . . . . . . . . . . . . 0.1 149.0 149.5 150.5 206.4 211.4 211.3 290.0 293.1 296.4
Cumulative Total Additions . . . . . . . . . . 8.2 164.5 165.0 166.0 223.5 228.5 228.4 307.1 310.2 313.5
Cumulative Retirements . . . . . . . . . . . . 11.9 72.1 72.1 72.1 83.9 83.9 83.9 119.1 119.1 119.1
Cogenerators
CapacityCoal . . . . . . . . . . . . . . . . . . . . . . . . . . . 8.2 9.0 9.0 9.0 9.3 9.3 9.3 9.5 9.5 9.5Petroleum . . . . . . . . . . . . . . . . . . . . . . . 0.9 0.9 0.9 0.9 1.0 1.0 1.0 1.0 1.0 1.0Natural Gas . . . . . . . . . . . . . . . . . . . . . 28.9 32.1 32.1 32.1 33.3 33.3 33.3 34.2 34.2 34.2Other Gaseous Fuels . . . . . . . . . . . . . . 1.0 0.9 0.9 0.9 0.9 0.9 0.9 0.9 0.9 0.9Renewable Sources . . . . . . . . . . . . . . . 6.2 7.3 7.3 7.3 7.8 7.8 7.8 8.2 8.2 8.2Other . . . . . . . . . . . . . . . . . . . . . . . . . . 0.0 0.0 0.0 0.0 0.0 0.0 0.0 0.0 0.0 0.0
Total . . . . . . . . . . . . . . . . . . . . . . . . . 45.1 50.2 50.2 50.2 52.3 52.3 52.3 53.8 53.8 53.8
Cumulative Additions . . . . . . . . . . . . . . . 10.2 15.3 15.3 15.3 17.3 17.3 17.3 18.8 18.8 18.8
Notes: Totals may not equal sum of components due to independent rounding. Net summer capability has been estimated for nonutility generators for AEO97. Net summercapacity is used to be consistent with electric utility capacity estimates. Data for electric utility capacity are the most recent data available as of August 15, 1996. Therefore, capacityestimates may differ from other Energy Information Administration sources.
Source: Energy Information Administration, AEO97 National Energy Modeling System runs LTECEL.D100896A, AEO97B.D100296K, and HTECEL.D100896A.
Energy Information Administration/ Annual Energy Outlook 1997 189

Side Cases
Table F8. Key Results for Oil and Gas Technological Progress Cases Including Market Feedback(Quadrillion Btu per Year, Unless Otherwise Noted)
Supply, Disposition, and Prices 1995
Projections
2005 2010 2015
SlowTechnology
Progress
ReferenceCase
RapidTechnology
Progress
SlowTechnology
Progress
ReferenceCase
RapidTechnology
Progress
SlowTechnology
Progress
ReferenceCase
RapidTechnology
Progress
Total Energy Supplyand Disposition Summary
ProductionCrude Oil and Lease Condensate . . . . . . 13.89 11.08 11.62 12.21 10.29 11.41 12.66 9.56 11.08 13.05Natural Gas Plant Liquids . . . . . . . . . . . 2.37 2.95 3.01 3.05 2.90 3.04 3.12 3.18 3.47 3.68Dry Natural Gas . . . . . . . . . . . . . . . . . . 19.01 22.84 23.30 23.67 23.81 24.93 25.67 24.56 26.83 28.60Coal . . . . . . . . . . . . . . . . . . . . . . . . . . . 21.98 24.67 23.99 23.75 26.67 25.16 24.54 29.48 26.46 24.78Nuclear Power . . . . . . . . . . . . . . . . . . . 7.19 6.98 6.98 6.98 6.55 6.55 6.55 4.79 4.79 4.79Renewable Energy . . . . . . . . . . . . . . . . 6.29 6.88 6.88 6.89 7.27 7.25 7.29 7.82 7.71 7.63Other . . . . . . . . . . . . . . . . . . . . . . . . . . 1.34 0.42 0.42 0.41 0.40 0.39 0.39 0.43 0.42 0.41
Total . . . . . . . . . . . . . . . . . . . . . . . . 72.08 75.82 76.19 76.97 77.89 78.73 80.22 79.82 80.75 82.93
ImportsCrude Oil . . . . . . . . . . . . . . . . . . . . . . . 15.69 21.27 20.72 20.11 22.35 21.19 20.07 23.92 22.23 20.26Petroleum Products . . . . . . . . . . . . . . . . 3.19 6.87 6.79 6.75 8.44 8.23 8.07 8.75 8.35 8.05Natural Gas . . . . . . . . . . . . . . . . . . . . . 2.90 3.97 3.98 3.99 4.12 4.23 4.28 4.37 4.55 4.64Other Imports . . . . . . . . . . . . . . . . . . . . 0.60 0.65 0.67 0.67 0.67 0.67 0.67 0.64 0.64 0.64
Total . . . . . . . . . . . . . . . . . . . . . . . . 22.38 32.77 32.16 31.53 35.58 34.31 33.09 37.69 35.77 33.59
ExportsPetroleum . . . . . . . . . . . . . . . . . . . . . . . 2.02 1.92 1.92 1.92 1.92 1.94 2.10 2.10 1.97 2.08Natural Gas . . . . . . . . . . . . . . . . . . . . . 0.16 0.21 0.21 0.21 0.22 0.22 0.22 0.22 0.22 0.22Coal . . . . . . . . . . . . . . . . . . . . . . . . . . . 2.27 2.59 2.59 2.60 2.82 2.82 2.85 2.98 3.04 3.04
Total . . . . . . . . . . . . . . . . . . . . . . . . 4.45 4.73 4.73 4.73 4.96 4.98 5.17 5.30 5.24 5.35
Discrepancy . . . . . . . . . . . . . . . . . . . . . . 0.91 -0.30 -0.26 -0.24 -0.23 -0.17 -0.19 -0.45 -0.40 -0.33
ConsumptionPetroleum Products . . . . . . . . . . . . . . . . 34.92 40.50 40.46 40.46 42.36 42.24 42.14 43.38 43.26 43.09Natural Gas . . . . . . . . . . . . . . . . . . . . . 22.18 26.46 26.94 27.32 27.55 28.77 29.57 28.54 30.97 32.84Coal . . . . . . . . . . . . . . . . . . . . . . . . . . . 19.95 22.39 21.72 21.49 24.15 22.68 22.00 26.86 23.76 22.11Nuclear Power . . . . . . . . . . . . . . . . . . . 7.19 6.98 6.98 6.98 6.55 6.55 6.55 4.79 4.79 4.79Renewable Energy . . . . . . . . . . . . . . . . 6.30 6.88 6.88 6.89 7.28 7.25 7.29 7.83 7.71 7.64Other . . . . . . . . . . . . . . . . . . . . . . . . . . 0.39 0.36 0.38 0.38 0.39 0.39 0.39 0.37 0.37 0.37
Total . . . . . . . . . . . . . . . . . . . . . . . . . 90.93 103.57 103.36 103.53 108.28 107.89 107.95 111.76 110.87 110.85
Net Imports - Petroleum . . . . . . . . . . . . . 16.87 26.22 25.59 24.95 28.87 27.48 26.05 30.58 28.60 26.23
Prices (1995 dollars per unit)World Oil Price (dollars per barrel) . . . . . . 17.26 20.14 19.72 19.32 21.37 20.41 19.47 22.24 20.98 19.65Gas Wellhead Price (dollars per Mcf) . . . . 1.61 2.05 1.94 1.86 2.37 2.01 1.70 2.77 2.13 1.55Coal Minemouth Price (dollars per ton) . . . 18.98 17.69 17.47 17.33 17.00 16.92 16.49 16.33 15.46 14.51
Natural Gas Supply, Disposition,and Delivered Prices
Production (trillion cubic feet)Dry Gas Production . . . . . . . . . . . . . . . . 18.49 22.22 22.66 23.02 23.16 24.25 24.97 23.89 26.10 27.82Supplemental Natural Gas . . . . . . . . . . . 0.13 0.06 0.06 0.06 0.06 0.06 0.06 0.06 0.06 0.06
Net Imports (trillion cubic feet) . . . . . . . 2.68 3.68 3.69 3.69 3.82 3.92 3.97 4.06 4.23 4.32Canada . . . . . . . . . . . . . . . . . . . . . . . . 2.79 3.51 3.52 3.53 3.64 3.74 3.79 3.88 4.06 4.15Mexico . . . . . . . . . . . . . . . . . . . . . . . . . -0.05 -0.11 -0.11 -0.11 -0.12 -0.12 -0.12 -0.12 -0.12 -0.12Liquefied Natural Gas . . . . . . . . . . . . . . -0.05 0.27 0.27 0.27 0.29 0.29 0.29 0.29 0.29 0.29
Total Supply (trillion cubic feet) . . . . . . 21.30 25.96 26.41 26.78 27.04 28.23 29.00 28.01 30.39 32.20
Consumption by Sector(trillion cubic feet)
Residential . . . . . . . . . . . . . . . . . . . . . . 4.87 5.25 5.27 5.29 5.34 5.42 5.46 5.44 5.57 5.69Commercial . . . . . . . . . . . . . . . . . . . . . 3.07 3.33 3.34 3.35 3.41 3.44 3.45 3.50 3.55 3.59Industrial . . . . . . . . . . . . . . . . . . . . . . . . 8.33 9.19 9.27 9.36 9.27 9.56 9.90 9.20 9.65 10.28Electric Generators . . . . . . . . . . . . . . . . 3.46 5.58 5.88 6.10 6.25 6.94 7.25 6.96 8.52 9.38Lease and Plant Fuel . . . . . . . . . . . . . . 1.14 1.43 1.45 1.47 1.49 1.55 1.58 1.54 1.65 1.74Pipeline Fuel . . . . . . . . . . . . . . . . . . . . . 0.70 0.79 0.82 0.85 0.81 0.86 0.89 0.83 0.91 0.99Transportation . . . . . . . . . . . . . . . . . . . . 0.01 0.18 0.18 0.18 0.25 0.25 0.25 0.30 0.30 0.30
Total . . . . . . . . . . . . . . . . . . . . . . . . . 21.58 25.75 26.22 26.60 26.81 28.01 28.79 27.78 30.16 31.99
190 Energy Information Administration/ Annual Energy Outlook 1997

Side Cases
Table F8. Key Results for Oil and Gas Technological Progress Cases Including Market Feedback(Continued)(Quadrillion Btu per Year, Unless Otherwise Noted)
Supply, Disposition, and Prices 1995
Projections
2005 2010 2015
SlowTechnology
Progress
ReferenceCase
RapidTechnology
Progress
SlowTechnology
Progress
ReferenceCase
RapidTechnology
Progress
SlowTechnology
Progress
ReferenceCase
RapidTechnology
Progress
Natural Gas Supply, Disposition,and Delivered Prices (Continued)
Discrepancy (trillion cubic feet) . . . . . . . . . -0.28 0.20 0.19 0.18 0.22 0.22 0.21 0.23 0.23 0.22
Delivered Prices(1995 dollars per thousand cubic feet)
Residential . . . . . . . . . . . . . . . . . . . . . . . . 6.18 5.81 5.65 5.60 5.85 5.43 5.17 6.02 5.33 4.77Commercial . . . . . . . . . . . . . . . . . . . . . . . 5.10 4.94 4.79 4.73 5.05 4.64 4.39 5.28 4.61 4.08Industrial . . . . . . . . . . . . . . . . . . . . . . . . . . 2.35 2.74 2.61 2.52 3.06 2.69 2.35 3.47 2.82 2.20Electric Generators . . . . . . . . . . . . . . . . . . 2.06 2.46 2.33 2.27 2.76 2.38 2.09 3.15 2.52 2.05Transportation . . . . . . . . . . . . . . . . . . . . . . 5.94 6.52 6.38 6.33 7.30 6.93 6.68 7.85 7.27 6.83
Average . . . . . . . . . . . . . . . . . . . . . . . . . 3.67 3.70 3.55 3.46 3.92 3.49 3.18 4.23 3.52 2.93
Crude Oil Supply
Lower 48 Average Wellhead Price(1995 dollars per barrel) . . . . . . . . . . . . . . . . 15.58 19.87 19.36 18.87 21.10 20.02 18.88 21.39 19.85 18.49
Production (million barrels per day)U.S. Total . . . . . . . . . . . . . . . . . . . . . . . . . . . 6.56 5.23 5.49 5.77 4.86 5.39 5.98 4.52 5.23 6.16
Lower 48 Onshore . . . . . . . . . . . . . . . . . . . . 3.82 2.91 3.04 3.17 2.79 3.04 3.32 2.70 3.07 3.50Conventional . . . . . . . . . . . . . . . . . . . . . . . 3.24 2.34 2.44 2.54 2.13 2.36 2.59 1.98 2.33 2.72Enhanced Oil Recovery . . . . . . . . . . . . . . . 0.58 0.57 0.60 0.63 0.66 0.69 0.73 0.72 0.75 0.79
Lower 48 Offshore . . . . . . . . . . . . . . . . . . . . 1.26 1.38 1.50 1.65 1.30 1.57 1.89 1.18 1.53 2.03Alaska . . . . . . . . . . . . . . . . . . . . . . . . . . . . 1.48 0.94 0.94 0.94 0.77 0.77 0.77 0.64 0.63 0.63
Lower 48 End of Year Reserves(billion barrels) . . . . . . . . . . . . . . . . . . . . . . 17.18 14.24 15.26 16.40 13.71 15.51 17.54 13.24 15.61 18.69
Natural Gas Supply
Lower 48 Average Wellhead Price(1995 dollars per thousand cubic feet) . . . . 1.61 2.05 1.94 1.86 2.37 2.01 1.70 2.77 2.13 1.55
Production (trillion cubic feet)U.S. Total . . . . . . . . . . . . . . . . . . . . . . . . . . . 18.48 22.22 22.66 23.02 23.16 24.25 24.97 23.89 26.10 27.82
Lower 48 Onshore . . . . . . . . . . . . . . . . . . . . 13.00 16.08 15.75 15.31 17.58 17.19 16.25 18.48 18.59 17.69Associated-Dissolved . . . . . . . . . . . . . . . . . 1.85 1.26 1.28 1.30 1.16 1.21 1.27 1.11 1.18 1.27Non-Associated . . . . . . . . . . . . . . . . . . . . . 11.15 14.83 14.47 14.01 16.42 15.98 14.98 17.37 17.40 16.42
Conventional . . . . . . . . . . . . . . . . . . . . . . 7.92 11.38 11.21 10.92 12.63 12.33 11.66 13.13 13.28 12.72Unconventional . . . . . . . . . . . . . . . . . . . . 3.24 3.45 3.26 3.09 3.79 3.66 3.32 4.25 4.13 3.70
Lower 48 Offshore . . . . . . . . . . . . . . . . . . . . 5.05 5.62 6.39 7.19 5.02 6.51 8.17 4.84 6.94 9.55Associated-Dissolved . . . . . . . . . . . . . . . . . 0.71 0.76 0.78 0.80 0.75 0.81 0.86 0.72 0.80 0.88Non-Associated . . . . . . . . . . . . . . . . . . . . . 4.34 4.86 5.61 6.38 4.27 5.70 7.31 4.11 6.14 8.67
Alaska . . . . . . . . . . . . . . . . . . . . . . . . . . . . 0.42 0.52 0.52 0.52 0.55 0.55 0.55 0.58 0.58 0.58
U.S. End of Year Reserves(trillion cubic feet) . . . . . . . . . . . . . . . . . . . . 155.03 168.12 174.73 181.92 176.31 187.05 201.69 173.97 188.42 201.03
Supplemental Gas Supplies
(trillion cubic feet) . . . . . . . . . . . . . . . . . . . . 0.13 0.06 0.06 0.06 0.06 0.06 0.06 0.06 0.06 0.06
Total Lower 48 Wells Completed(thousands) . . . . . . . . . . . . . . . . . . . . . . . . . 18.52 34.61 34.33 34.17 39.72 37.60 35.28 45.96 41.75 36.74
Btu = British thermal unit.Mcf = Thousand cubic feet.Note: Totals may not equal sum of components due to independent rounding. Figures for 1995 may differ from published data due to internal conversion factors.Source: Energy Information Administration, AEO97 National Energy Modeling System runs LTECOGI.D100896A, AEO97B.D100296K, and HTECOGI.D100896A.
Energy Information Administration/ Annual Energy Outlook 1997 191

Side Cases
Table F9. Key Results for Oil and Gas Technological Progress Cases Assuming No Market Feedback
Production and Supply 1995
Projections
2005 2010 2015
SlowTechnology
Progress
ReferenceCase
RapidTechnology
Progress
SlowTechnology
Progress
ReferenceCase
RapidTechnology
Progress
SlowTechnology
Progress
ReferenceCase
RapidTechnology
Progress
Crude Oil Supply
Lower 48 Average Wellhead Price(1995 dollars per barrel) . . . . . . . . . . . . . . . . 15.58 19.45 19.36 19.27 20.13 20.02 19.81 20.16 19.85 19.83
Production (million barrels per day)U.S. Total . . . . . . . . . . . . . . . . . . . . . . . . . . . 6.56 5.20 5.49 5.80 4.75 5.39 6.11 4.32 5.23 6.38
Lower 48 Onshore . . . . . . . . . . . . . . . . . . . . 3.82 2.89 3.04 3.20 2.72 3.04 3.40 2.58 3.07 3.64Conventional . . . . . . . . . . . . . . . . . . . . . . . 3.24 2.33 2.44 2.56 2.08 2.36 2.65 1.91 2.33 2.82Enhanced Oil Recovery . . . . . . . . . . . . . . . 0.58 0.56 0.60 0.64 0.63 0.69 0.76 0.67 0.75 0.82
Lower 48 Offshore . . . . . . . . . . . . . . . . . . . . 1.26 1.36 1.50 1.66 1.26 1.57 1.94 1.10 1.53 2.11Alaska . . . . . . . . . . . . . . . . . . . . . . . . . . . . 1.48 0.94 0.94 0.94 0.77 0.77 0.77 0.63 0.63 0.63
Lower 48 End of Year Reserves(billion barrels) . . . . . . . . . . . . . . . . . . . . . . 17.18 14.09 15.26 16.54 13.28 15.51 18.07 12.52 15.61 19.52
Natural Gas Supply
Lower 48 Average Wellhead Price(1995 dollars per thousand cubic feet) . . . . 1.61 2.14 1.94 1.85 2.62 2.01 1.58 3.48 2.13 1.37
Production (trillion cubic feet)U.S. Total . . . . . . . . . . . . . . . . . . . . . . . . . . . 18.48 22.71 22.66 22.74 24.26 24.25 24.31 26.09 26.10 26.15
Lower 48 Onshore . . . . . . . . . . . . . . . . . . . . 13.00 16.50 15.75 15.20 18.54 17.19 15.88 20.41 18.59 16.54Associated-Dissolved . . . . . . . . . . . . . . . . . 1.85 1.25 1.28 1.31 1.15 1.21 1.28 1.09 1.18 1.29Non-Associated . . . . . . . . . . . . . . . . . . . . . 11.15 15.25 14.47 13.89 17.39 15.98 14.59 19.32 17.40 15.25
Conventional . . . . . . . . . . . . . . . . . . . . . . 7.92 11.67 11.21 10.74 13.47 12.33 11.25 14.64 13.28 11.58Unconventional . . . . . . . . . . . . . . . . . . . . 3.24 3.58 3.26 3.16 3.92 3.66 3.34 4.68 4.13 3.67
Lower 48 Offshore . . . . . . . . . . . . . . . . . . . . 5.05 5.69 6.39 7.02 5.17 6.51 7.88 5.10 6.94 9.03Associated-Dissolved . . . . . . . . . . . . . . . . . 0.71 0.76 0.78 0.80 0.75 0.81 0.87 0.71 0.80 0.90Non-Associated . . . . . . . . . . . . . . . . . . . . . 4.34 4.93 5.61 6.21 4.42 5.70 7.02 4.39 6.14 8.14
Alaska . . . . . . . . . . . . . . . . . . . . . . . . . . . . 0.42 0.52 0.52 0.52 0.55 0.55 0.55 0.58 0.58 0.58
U.S. End of Year Reserves(trillion cubic feet) . . . . . . . . . . . . . . . . . . . . 155.03 171.42 174.73 183.72 181.90 187.05 198.48 181.36 188.42 194.65
Supplemental Gas Supplies
(trillion cubic feet) . . . . . . . . . . . . . . . . . . . . 0.13 0.06 0.06 0.06 0.06 0.06 0.06 0.07 0.06 0.06
Total Lower 48 Wells Completed(thousands) . . . . . . . . . . . . . . . . . . . . . . . . . 18.52 35.23 34.33 34.56 41.88 37.60 34.47 54.03 41.75 35.37
Note: Totals may not equal sum of components due to independent rounding. Figures for 1995 may differ from published data due to internal conversion factors. For natural gasproduction and consumption, the slight difference between the slow and rapid technological progress cases without market feedback and the reference case (with market feedback)are artifacts of the modeling methodology that are considered insignificant.
Source: Energy Information Administration, AEO97 National Energy Modeling System runs LTECOGS.D100896A, AEO97B.D100296K, and HTECOGS.D100896A.
192 Energy Information Administration/ Annual Energy Outlook 1997

Side Cases
Table F10. Key Results for Coal Labor Productivity Cases
Prices and Labor Productivity 1995
Projections
2000 2010 2015
LowProductivity
ReferenceCase
HighProductivity
LowProductivity
ReferenceCase
HighProductivity
LowProductivity
ReferenceCase
HighProductivity
Minemouth Price(1995 dollars per short ton) . . . . . . 18.83 19.06 18.38 18.20 18.87 16.92 15.22 18.26 15.46 14.41
Delivered Priceto Electric Generators(1995 dollars per million Btu) . . . . . 1.32 1.32 1.29 1.28 1.30 1.20 1.12 1.26 1.11 1.05
Labor Productivity(short tons per miner per hour) . . . 5.38 6.28 7.01 7.86 5.88 9.37 15.30 5.27 10.27 19.69
Labor Productivity(average annual growthfrom 1995) . . . . . . . . . . . . . . . . . . N/A 3.1 5.4 7.9 0.6 3.8 7.2 -0.1 3.3 6.7
Btu = British thermal unit.N/A = Not Applicable.Note: Side cases were run without the fully integrated modeling system, so not all potential feedbacks are captured.Source: Energy Information Administration, AEO97 National Energy Modeling System runs LPROD.D100496B, AEO97B.D100296K, and HPROD.D100496B.
Table F11. Key Results for Coal Miner Wage Cases
Prices and Miner Wages 1995
Projections
2000 2010 2015
LowWage
ReferenceCase
HighWage
LowWage
ReferenceCase
HighWage
LowWage
ReferenceCase
HighWage
Minemouth Price(1995 dollars per short ton) . . . . . . . . . . . . . 18.83 18.32 18.38 18.96 15.44 16.92 17.45 14.55 15.46 16.44
Delivered Priceto Electric Generators(1995 dollars per million Btu) . . . . . . . . . . . . 1.32 1.29 1.29 1.32 1.13 1.20 1.22 1.07 1.11 1.16
Average Coal Miner Wage(short tons per miner per hour) . . . . . . . . . . 18.44 17.98 18.44 18.91 17.10 18.44 19.87 16.68 18.44 20.37
Average Coal Miner Wage(average annual growthfrom 1995) . . . . . . . . . . . . . . . . . . . . . . . . . N/A -0.5 0.0 0.5 -0.5 0.0 0.5 -0.5 0.0 0.5
Btu = British thermal unit.N/A = Not Applicable.Note: Side cases were run without the fully integrated modeling system, so not all potential feedbacks are captured.Source: Energy Information Administration, AEO97 National Energy Modeling System runs LWAG.D100396A, AEO97B.D100296K, and HWAG.D100396A.
Energy Information Administration/ Annual Energy Outlook 1997 193

Appendix G
Major Assumptions for the ForecastsThe National Energy Modeling System
The projections in the Annual Energy Outlook 1997(AEO97) are generated with the National EnergyModeling System (NEMS), developed and main-tained by the Office of Integrated Analysis andForecasting of the Energy Information Administra-tion (EIA). In addition to its use in the developmentof the AEO projections, NEMS is also used inanalytical studies for the U.S. Congress and otheroffices within the Department of Energy. The AEOforecasts are also used by analysts and planners inother government agencies and outside organiza-tions.
The projections in NEMS are developed with the useof a market-based approach to energy analysis. Foreach fuel and consuming sector, NEMS balances theenergy supply and demand, accounting for theeconomic competition between the various energyfuels and sources. The time horizon of NEMS is themidterm period, 20 years in the future. In order torepresent the regional differences in energy markets,the component models of NEMS function at theregional level: the 9 Census divisions for the end-usedemand models; production regions specific to oil,gas, and coal supply and distribution; the NorthAmerican Electric Reliability Council regions andsubregions for electricity; and the PetroleumAdministration for Defense Districts for refineries.
NEMS is organized and implemented as a modularsystem. The modules represent each of the fuelsupply markets, conversion sectors, and end-useconsumption sectors of the energy system. NEMSalso includes macroeconomic and internationalmodules. The primary flows of information betweeneach of these modules are the delivered prices ofenergy to the end user and the quantities consumedby product, region, and sector. The delivered pricesof fuel encompass all the activities necessary toproduce, import, and transport fuels to the end user.The information flows also include other data onsuch areas as economic activity, domestic productionactivity, and international petroleum supply avail-ability.
The integrating module controls the execution ofeach of the component modules. To facilitatemodularity, the components do not pass informationto each other directly but communicate through a
central data file. This modular design provides thecapability to execute modules individually, thusallowing decentralized development of the systemand independent analysis and testing of individualmodules. This modularity allows the use of themethodology and level of detail most appropriate foreach energy sector. NEMS calls each supply, conver-sion, and end-use demand module in sequence untilthe delivered prices of energy and the quantitiesdemanded have converged within tolerance, thusachieving an economic equilibrium of supply anddemand in the consuming sectors. Solution isreached annually through the midterm horizon.Other variables are also evaluated for convergence,such as petroleum product imports, crude oil im-ports, and several macroeconomic indicators.
Each NEMS component also represents the impactand cost of legislation and environmental regula-tions that affect that sector and reports key emis-sions. NEMS represents all current legislation andenvironmental regulations, such as the Clean AirAct Amendments of 1990 (CAAA90) and the costs ofcompliance with other regulations.
In general, the AEO97 projections were prepared byusing the most current data available as of July 31,1996. At that time, most 1995 data were available,but only partial 1996 data were available. Carbonemissions were calculated by using carbon coeffi-cients from the EIA report, Emissions of GreenhouseGases in the United States 1995, published in Octo-ber 1996 [1].
Historical numbers are presented for comparisononly and may be estimates. Source documentsshould be consulted for the official data values.Some definitional adjustments were made to EIAdata for the forecasts. For example, the transporta-tion demand sector in AEO97 includes electricityused by railroads, which is included in the commer-cial sector in EIA’s consumption data publications.Also, the State Energy Data Report classifies energyconsumed by independent power producers, exemptwholesale generators, and cogenerators as industrialconsumption, whereas AEO97 includes cogenerationin the industrial sector and other nonutility genera-tors in the electricity sector. Footnotes in the appen-dix tables of this report indicate the definitions andsources of all historical data.
194 Energy Information Administration/ Annual Energy Outlook 1997

Major Assumptions for the Forecasts
The AEO97 projections for 1996 and 1997 incorpo-rate the short-term projections from EIA’s Short-Term Energy Outlook (STEO), Fourth Quarter 1996[2], published in October 1996. For short-term ener-gy projections, readers are referred to that STEO orlater editions, which are available quarterly.
Component modules
The component modules of NEMS represent theindividual supply, demand, and conversion sectors ofdomestic energy markets and also include inter-national and macroeconomic modules. In general,the modules interact through values representingthe prices of energy delivered to the consumingsectors and the quantities of end-use energy con-sumption.
Macroeconomic Activity Module
The Macroeconomic Activity Module provides a setof essential macroeconomic drivers to the energymodules, macroeconomic feedback mechanism withinNEMS, and a mechanism to evaluate detailedmacroeconomic and interindustry impacts associatedwith energy events. Key macroeconomic variablesinclude Gross Domestic Product (GDP), interestrates, disposable income, and employment. Industri-al drivers are calculated for 35 industrial sectors.This module is a response surface representation ofthe Data Resources, Inc., Quarterly Model of theU.S. Economy.
International Module
The International Module represents the world oilmarkets, calculating the average world oil price andcomputing supply curves for 5 categories of importedcrude oil for the Petroleum Market Module ofNEMS, in response to changes in U.S. import re-quirements. International petroleum product supplycurves, including curves for oxygenates, are alsocalculated.
Household Expenditures Module
The Household Expenditures Module provides esti-mates of average household direct expenditures forenergy used in the home and in private motor vehi-cle transportation. The forecasts of expendituresreflect the projections from NEMS for the residentialand transportation sectors. The projected household
energy expenditures incorporate the changes inresidential energy prices and motor gasoline pricedetermined in NEMS, as well as the changes in theefficiency of energy use for residential end-uses andin light-duty vehicle fuel efficiency. Average expen-ditures estimates are provided for households byincome group and Census division.
Residential and Commercial Demand Modules
The Residential Demand Module forecasts consump-tion of residential sector energy by housing type andend use, subject to delivered energy prices, availabil-ity of renewable sources of energy, and housingstarts. The Commercial Demand Module forecastsconsumption of commercial sector energy by buildingtypes and nonbuilding uses of energy and by cate-gory of end use, subject to delivered prices of energy,availability of renewable sources of energy, andmacroeconomic variables representing interest ratesand floorspace construction. Both modules estimatethe equipment stock for the major end-use services,incorporating assessments of advanced technologies,including representations of renewable energy tech-nologies and effects of both building shell and appli-ance standards.
Industrial Demand Module
The Industrial Demand Module forecasts the con-sumption of energy for heat and power and for feed-stocks and raw materials in each of 16 industrygroups, subject to the delivered prices of energy andmacroeconomic variables representing employmentand the value of output for each industry. The in-dustries are classified into three groups—energy-intensive, non-energy-intensive, and nonmanufactur-ing. Of the 8 energy-intensive industries, 7 aremodeled in the Industrial Demand Module withcomponents for boiler/steam/cogeneration, buildings,and process/assembly use of energy. A representa-tion of cogeneration and a recycling component arealso included. The use of energy for petroleum refin-ing is modeled in the Petroleum Market Module, andthe projected consumption is included in the indus-trial totals.
Transportation Demand Module
The Transportation Demand Module forecasts con-sumption of transportation sector fuels, including
Energy Information Administration/ Annual Energy Outlook 1997 195

Major Assumptions for the Forecasts
petroleum products, electricity, methanol, ethanol,and compressed natural gas by transportation mode,vehicle vintage, and size class, subject to deliveredprices of energy fuels and macroeconomic variablesrepresenting disposable personal income, GDP, pop-ulation, interest rates, and the value of output forindustries in the freight sector. Fleet vehicles arerepresented separately to allow analysis of CAAA90and other legislative proposals, and the moduleincludes a component to explicitly assess the pene-tration of alternatively-fueled vehicles.
Electricity Market Module
The Electricity Market Module represents genera-tion, transmission, and pricing of electricity, subjectto delivered prices for coal, petroleum products, andnatural gas; costs of generation by centralized re-newables; macroeconomic variables for costs of capi-tal and domestic investment; and electricity loadshapes and demand. There are four primary sub-modules—capacity planning, fuel dispatching, fi-nance and pricing, and load and demand-side man-agement. Nonutility generation and transmissionand trade are represented in the planning and dis-patching submodules. The levelized fuel cost of ura-nium fuel for nuclear generation is directly incorpo-rated into the Electricity Market Module. AllCAAA90 compliance options are explicitly represent-ed in the capacity expansion and dispatch decisions.Both new generating technologies and renewabletechnologies compete directly in these decisions. Inaddition, several options for wholesale pricing areincluded.
Renewable Fuels Module
The Renewable Fuels Module includes submodulesthat provide explicit representation of the supply ofwood, municipal solid waste, wind energy, solarthermal electric and photovoltaic energy, and geo-thermal energy. It provides cost and performancecriteria to the Electricity Market Module. The Elec-tricity Market Module represents market penetra-tion of renewable technologies used for centralizedelectricity generation, and the end-use demand mod-ules incorporate market penetration of selected off-grid electric and nonmarketed nonelectric renew-ables.
Oil and Gas Supply Module
The Oil and Gas Supply Module represents domesticcrude oil and natural gas supply within an inte-grated framework that captures the interrelation-ships between the various sources of supply: on-shore, offshore, and Alaska by both conventional andnonconventional techniques, including enhanced oilrecovery and unconventional gas recovery from tightgas formations, Devonian shale, and coalbeds. Thisframework analyzes cash flow and profitability tocompute investment and drilling in each of the sup-ply sources, subject to the prices for crude oil andnatural gas, the domestic recoverable resource base,and technology. Oil and gas production functions arecomputed at a level of 12 supply regions, including3 offshore and 3 Alaskan regions. This module alsorepresents foreign sources of natural gas, includingpipeline imports and exports with Canada and Mexi-co and liquefied natural gas imports and exports.The crude oil supply curves are input to the Petro-leum Market Module in NEMS for conversion andblending into refined petroleum products. The sup-ply curves for natural gas are input to the NaturalGas Transmission and Distribution Module.
Natural Gas Transmission and Distribution Module
The Natural Gas Transmission and DistributionModule represents the transmission, distribution,and pricing of natural gas, subject to end-use de-mand for natural gas and the availability of domes-tic natural gas and natural gas traded on the inter-national market. The module tracks the flows ofnatural gas in an aggregate, domestic pipeline net-work, connecting the domestic and foreign supplyregions with 12 demand regions. This capabilityallows the analysis of impacts of regional capacityconstraints in the interstate natural gas pipelinenetwork and the identification of pipeline capacityexpansion requirements. Core and noncore marketsare explicitly represented for natural gas transmis-sion. Key components of pipeline and distributortariffs are included in the pricing algorithms.
Petroleum Market Module
The Petroleum Market Module forecasts prices ofpetroleum products, crude oil and product importactivity, and domestic refinery operations, including
196 Energy Information Administration/ Annual Energy Outlook 1997

Major Assumptions for the Forecasts
fuel consumption, subject to the demand for petro-leum products, availability and price of importedpetroleum, and domestic production of crude oil,natural gas liquids, and alcohol fuels. The modulerepresents refining activities for the 5 PetroleumAdministration for Defense Districts, using the samecrude oil types as the International Module. It ex-plicitly models the requirements of CAAA90 and thecosts of new automotive fuels, such as oxygenatedand reformulated gasoline, and includes oxygenateproduction and blending for reformulated gasoline.Costs include capacity expansion for refinery pro-cessing units. End-use prices are based on the mar-ginal costs of production, plus markups representingproduct distribution costs, State and Federal taxes,and environmental costs.
Coal Market Module
The Coal Market Module simulates mining, trans-portation, and pricing of coal, subject to the end-usedemand for coal differentiated by physical character-istics, such as the heat and sulfur content. The coalsupply curves include a response to capacity utiliza-tion and fuel costs, as well as reserve depletion,labor productivity, and factor input costs. Thirteencoal types are represented, differentiated by coalrank, sulfur content, and mining process. Productionand distribution are computed for 11 supply and 13demand regions, using imputed coal transportationcosts and trends in factor input costs. The CoalMarket Module also forecasts the requirements forU.S. coal exports and imports. The international coalmarket component of the module computes trade in4 types of coal for 16 export and 20 import regions.Both the domestic and international coal marketsare simulated in a linear program.
Major assumptions for theAnnual Energy Outlook 1997
Table G1 provides a summary of the cases used toderive the AEO97 forecasts. For each case, the tablegives the name used in this report, a brief descrip-tion of the major assumptions underlying the projec-tions, a designation of the mode in which the casewas run in the NEMS model (either fully integrated,partially integrated, or standalone), and a referenceto the pages in the body of the report and in thisappendix where the case is discussed.
Assumptions on world oil markets and domesticmacroeconomic activity are primary drivers to theforecasts presented in AEO97. These assumptionsare presented in the “Market Trends” section. Thefollowing section describes the key regulatory, pro-grammatic, and resource assumptions that factorinto the projections. More detailed assumptions foreach sector will be available via the EIA Home Pageon the Internet and on the EIA CD-ROM, along withregional results and other details of the projections.
Building sector assumptions
The buildings sector includes both residential andcommercial structures. Both the National ApplianceEnergy Conservation Act of 1987 (NAECA), theEnergy Policy Act of 1992 (EPACT), and the ClimateChange Action Plan (CCAP) contain provisionswhich impact future buildings sector energy use.The provisions with the most significant effect areminimum equipment efficiency standards. Thesestandards require that new heating, cooling, andother specified energy-using equipment meet mini-mum energy efficiency levels which change overtime. The manufacture of equipment that does notmeet the standards is prohibited.
Residential assumptions. The NAECA minimumstandards [3] for the major types of equipment inthe residential sector are:
• Heat pumps—a 10.0 minimum seasonal energyefficiency ratio for 1992
• Room air conditioners—an 8.6 energy efficiencyratio in 1990
• Gas/oil furnaces—a 0.78 annual fuel utilizationefficiency in 1992
• Refrigerators—a standard of 976 kilowatthoursper year in 1990, decreasing to 691 kilowatt-hours per year in 1993
• Electric water heaters—a 0.88 energy factor in1990
• Natural gas water heaters—a 0.54 energy factorin 1990.
Improvements to existing building shells are basedon both energy prices and assumed annual efficiencyincreases. New building shell efficiencies relative toexisting construction vary by main heating fuel andassumed annual increases. The effects of shell im-provements are modeled differentially for heating
Energy Information Administration/ Annual Energy Outlook 1997 197

Major Assumptions for the Forecasts
Table G1. Summary of the AEO97 cases
Case name DescriptionIntegration
modeReference
in textReference inAppendix G
Reference Baseline economic growth, world oil price, andtechnology assumptions
Fullyintegrated
Low Economic Growth Gross domestic product grows at an average annual rateof 1.4 percent, compared to the reference case growth of1.9 percent.
Fullyintegrated
p. 33
High Economic Growth Gross domestic product grows at an average annual rateof 2.4 percent, compared to the reference case growth of1.9 percent.
Fullyintegrated
p. 33
Low World Oil Price World oil prices are $14 per barrel in 2015, compared to$21 per barrel in the reference case.
Fullyintegrated
p. 34
High World Oil Price World oil prices are $28 per barrel in 2015, compared to$21 per barrel in the reference case.
Fullyintegrated
p. 34
Residential:1997 Technology
Future equipment purchases based on equipmentavailable in 1997. Building shell efficiencies fixed at 1997levels.
Standalone p. 45 p. 199
Residential:Advanced TechnologyCost Reduction
Cost of best technologies reduced by 35 percent.Building shell efficiencies increase by 50 percent fromreference values by 2015.
Standalone p. 45 p. 200
Residential:High Technology
Future equipment purchases based on most efficienttechnologies available. Building shell efficienciesincrease by 50 percent from reference values by 2015.
Standalone p. 45 p. 200
Commercial:1997 Technology
Future equipment purchases based on equipmentavailable in 1997. Building shell efficiencies fixed at 1997levels.
Standalone p. 46 p. 200
Commercial:Advanced TechnologyCost Reduction
Cost of best technologies reduced by 35 percent.Building shell efficiencies increase by 50 percent fromreference values by 2015.
Standalone p. 46 p. 200
Commercial:High Technology
Future equipment purchases based on most efficienttechnologies available. Building shell efficienciesincrease by 50 percent from reference values by 2015.
Standalone p. 46 p. 200
Industrial:1997 Technology
Efficiency of plant and equipment fixed at 1997 levels. Standalone p. 47 p. 201
Industrial:High Technology
Energy intensity declines at an annual rate of 1.4percent, compared to 0.9 percent in the reference case.
Standalone p. 47 p. 201
Transportation:1997 Technology
Menu of fuel saving technologies fixed at 1997availability.
Standalone p. 47 p. 202
Transportation:Rapid Technology
Efficiency improvements from new technology are 33percent higher at 50 percent lower cost from referencevalues.
Standalone p. 47 p. 202
Electricity:Low Nuclear
All reactors retire 10 years earlier than in the referencecase.
Fullyintegrated
p. 52 p. 203
Electricity:High Nuclear
All reactors operate 10 years longer than in thereference case.
Fullyintegrated
p. 52 p. 203
198 Energy Information Administration/ Annual Energy Outlook 1997

Major Assumptions for the Forecasts
and cooling. For space heating, existing and new
Table G1. Summary of the AEO97 cases (continued)
Case name DescriptionIntegration
modeReference
in textReference inAppendix G
Electricity:High Demand
Electricity demand increases at an annual rate of 2.0percent, compared to 1.5 in the reference case.
Partiallyintegrated
p. 53 p. 204
Electricity:Low Technology
Menu of technologies fixed at the 1996 availability. Partiallyintegrated
p. 54 p. 205
Electricity:High Technology
Advanced generating technologies reach fullcommercialization cost earlier than in the reference case.
Partiallyintegrated
p. 54 p. 205
Oil and Gas:Slow Technology,Integrated
Cost, finding rate, and resource base growth parametersadjusted for slower improvement.
Fullyintegrated
p. 26p. 62
p. 206
Oil and Gas:Rapid Technology,Integrated
Cost, finding rate, and resource base growth parametersadjusted for more rapid improvement.
Fullyintegrated
p. 26p. 62
p. 206
Oil and Gas:Slow Technology,Standalone
Cost, finding rate, and resource base growth parametersadjusted for slower improvement.
Standalone p. 22 p. 206
Oil and Gas:Rapid Technology,Standalone
Cost, finding rate, and resource base growth parametersadjusted for more rapid improvement.
Standalone p. 26 p. 206
Coal: Low Productivity Productivity declines at an annual rate of 0.1 percent,compared to the reference case growth of 3.3 percent.
Standalone p. 68 p. 208
Coal: High Productivity Productivity grows at an annual rate of 6.7 percent,compared to the reference case growth of 3.3 percent.
Standalone p. 68 p. 208
Coal: Low Wage Labor wage rates decline by 0.5 percent annually. Standalone p. 68 p. 208
Coal: High Wage Labor wage rates increase by 0.5 percent annually. Standalone p. 68 p. 208
shells improve by 11 percent and 29 percent, respec-tively, by 2015 relative to the 1993 stock average.For space cooling, the corresponding increases are 10percent and 24 percent for existing and new build-ings. Building codes relevant to CCAP are represent-ed by an increase in the shell integrity of new con-struction over time.
Other CCAP programs which could have a majorimpact on residential energy consumption are theEnvironmental Protection Agency’s (EPA) GreenPrograms. These programs, which are cooperativeefforts between the EPA and home builders andenergy appliance manufacturers, encourage thedevelopment and production of highly energy-effi-cient housing and equipment. One of the best knownexamples of these programs is the “golden carrotrefrigerator,” a very efficient design that is projectedto be widely available by 1998 and to consume less
than two-thirds of the energy specified in the 1993NAECA standard. At fully funded levels, residentialCCAP programs are estimated by program sponsorsto reduce carbon emissions by nearly 9 million met-ric tons by the year 2000. For the reference case,carbon reductions are estimated to be 4.3 millionmetric tons, primarily because of differences in theestimated penetration of energy-saving technologies.
In addition to the AEO97 reference case, three casesusing only the residential module of NEMS weredeveloped to examine the effects of equipment andbuilding shell efficiencies on residential sector ener-gy use:
• The 1997 technology case assumes that all futureequipment purchases are based only on therange of equipment available in 1997. Buildingshell efficiencies are assumed to be fixed at 1997levels.
Energy Information Administration/ Annual Energy Outlook 1997 199

Major Assumptions for the Forecasts
• The high technology case assumes that all futureequipment purchases are made from a menu oftechnologies that includes only the most efficientmodels available in a particular year, regardlessof cost. Building shell efficiencies are assumed toincrease by 50 percent over the reference caselevel by 2015.
• The advanced technology cost reduction caseassumes that the best technology within a givenend use and fuel combination will experience a35-percent reduction in purchase costs. Most ofthe decline will occur within the 10-year periodfollowing a technology’s introduction. Buildingshells will be at high technology case levels.
Commercial assumptions. Minimum equipment effi-ciency standards for the commercial sector are man-dated in the EPACT legislation [4]. Minimum stand-ards for representative equipment types are:
• Central air-conditioning heat pumps—a 9.7 sea-sonal energy efficiency rating (January 1994)
• Gas-fired forced-air furnaces—a 0.8 annual fuelutilization efficiency standard (January 1994)
• Fluorescent lamps—a 75.0 lumens per wattlighting efficacy standard for 4-foot F40T12lamps (November 1995) and a 80.0 lumens perwatt efficiency standard for 8-foot F96T12 lamps(May 1994).
Improvements to existing building shells are basedon assumed annual efficiency increases. New build-ing shell efficiencies relative to existing constructionvary for each of the 11 building types. The effects ofshell improvements are modeled differentially forheating and cooling. For space heating, existing andnew shells improve by 5 percent and 8 percent, re-spectively, by 2015 relative to the 1992 averages.
The CCAP programs recognized in the AEO97 refer-ence case include the expansion of the EPA GreenLights and Energy Star Buildings programs andimprovements to building shells from advancedinsulation methods and technologies. The EPA greenprograms are designed to facilitate cost-effectiveretrofitting of equipment by providing participantswith information and analysis as well as participa-tion recognition. Retrofitting behavior is captured inthe commercial module via discount parameters forcontrolling cost-based equipment retrofit decisions
for various market segments. To model programssuch as Green Lights, which target particular enduses, the AEO97 version of the commercial moduleincludes end-use-specific segmentation of discountrates. At fully funded levels, commercial CCAP pro-grams are estimated by program sponsors to reducecarbon emissions by nearly 6 million metric tons bythe year 2000. For the reference case, carbon reduc-tions are estimated to be just over 4.1 million metrictons in 2000, primarily because of differences in theestimated penetration of energy-saving technologies.
In addition to the AEO97 reference case, three casesusing only the commercial module of NEMS weredeveloped to examine the effects of equipment andbuilding shell efficiencies on commercial sector ener-gy use:
• The 1997 technology case assumes that all futureequipment purchases are based only on therange of equipment available in 1997. Buildingshell efficiencies are assumed to be fixed at 1997levels.
• The high technology case assumes that all futureequipment purchases are made from a menu oftechnologies that includes only the most efficientmodels available in a particular year, regardlessof cost. Building shell efficiencies are assumed toincrease by 50 percent over the reference caselevel by 2015.
• The advanced technology cost reduction caseassumes that the two best technologies within agiven end use and fuel combination will experi-ence a 35-percent reduction in purchase costs.Most of the decline will occur within the 10-yearperiod following a technology’s introduction.Building shells will be at high technology caselevels.
Industrial sector assumptions
Compared to the building sector, there are relativelyfew regulations which target industrial sector ener-gy use. The electric motor standards in EPACTrequire a 10-percent increase in efficiency above1992 efficiency levels for motors sold after 1997 [5].These standards have been incorporated into theIndustrial Demand Module through the analysis ofprocess efficiencies for new industrial processes.These standards are expected to lead to significantimprovements in efficiency since it has been estimat-
200 Energy Information Administration/ Annual Energy Outlook 1997
Major Assumptions for the Forecasts
ed that electric motors account for about 60 percentof industrial process electricity use.
Climate Change Action Plan. Several programs in-cluded in the CCAP target the industrial sector.Note that the potential impacts of the Climate WiseProgram are also included in the CCAP impacts.The intent of these programs is to reduce green-house gas emissions by lowering industrial energyconsumption. The program offices estimated that fullimplementation of these programs would reduce in-dustrial electricity consumption by 29 billion kilo-watthours and non-electric consumption by 383 tril-lion Btu by 2000. However, since the energy savingsassociated with the voluntary programs in the CCAPare, to a large extent, already contained in theAEO97 baseline, total CCAP energy savings werereduced. Consequently, CCAP reduces electricityconsumption by 16 billion kilowatthours and non-electric energy consumption by 90 trillion Btu. Thenon-electric energy is assumed to be steam coal.
For 2010, the program offices estimated electricitysavings of 81 billion kilowatthours and fossil fuelsavings of 650 trillion Btu. For the reason citedabove, these estimates were revised to 47 billionkilowatthours for electricity and 190 trillion Btu forfossil fuels. In this situation, carbon emissions wouldbe reduced by about 10 million metric tons (2 per-cent) in 2010.
High technology and 1997 technology cases. From1960 to 1994, the decline in the 10-year movingaverage for aggregate industrial energy intensitywas 1.2 percent, with a standard deviation of 1.1percent. Thus, a change of 1 standard deviationwould approximately double the decline in intensity.The high technology case emulates this result byapproximately doubling the projected rates of declinein energy intensity for the energy-intensive indus-tries. Changes in aggregate energy intensity resultboth from changing equipment and production effi-ciency and from changing composition of industrialoutput. Since the composition of industrial outputremains the same as in the reference case, aggregateintensity falls by only 1.4 percent annually.
The 1997 technology case holds the energy efficiencyof plant and equipment constant at the 1997 levelover the forecast.
Both cases were run with only the Industrial De-mand Module rather than as a fully integratedNEMS run. Consequently, no potential feedbackeffects from energy market interactions were cap-tured.
Transportation sector assumptions
The transportation sector accounts for the two-thirdsof the Nation’s oil use and has been subject to regu-lations for many years. The Corporate Average FuelEconomy (CAFE) standards, which mandate averagemiles-per-gallon standards for manufacturers, con-tinue to be widely debated. The projections appear-ing in this report assume that there will be no fur-ther increase in the CAFE standards from the cur-rent 27.5 miles per gallon standard. Thisassumption is consistent with the overall policy thatonly current legislation is assumed. Furthermore,compliance with the CAFE standards is assumed inall years.
EPACT requires that centrally-fueled automobilefleet operators—Federal, State, and local govern-ments, and fuel providers (e.g., gas and electricutilities)—purchase a minimum fraction of alterna-tive-fuel vehicles [6]. Federal fleet purchases of al-ternative-fuel vehicles must reach 50 percent oftheir total vehicle purchases by 1998 and 75 percentby 1999. Purchases of alternative-fuel vehicles byState governments must realize 25 percent of totalpurchases by 1998 and 75 percent by 2000. Privatefuel-provider companies are required to purchase 50percent alternative-fuel vehicles in 1997, increasingto 90 percent by 1999. Fuel provider exemptions forelectric utilities are assumed to follow the electricutility provisions beginning in 1998 at 30 percentand reaching 90 percent by 2001. It is assumed thatthe municipal and private business fleet mandatesbegin in 2002 at 20 percent and scale up to 70 per-cent by 2005.
In addition to these requirements, the State of Cali-fornia has delayed the Low Emission Vehicle Pro-gram, which now requires that 10 percent of all newvehicles sold by 2003 meet the “zero emissions re-quirements.” At present, only electric-dedicatedvehicles meet these requirements. Originally, Mass-achusetts and New York adopted this program. Theprojections currently assume that only California
Energy Information Administration/ Annual Energy Outlook 1997 201

Major Assumptions for the Forecasts
and Massachusetts have formally delayed the LowEmission Vehicle Program.
The projections assume that these regulations repre-sent minimum requirements for alternative-fuelvehicle sales; consumers are allowed to purchasemore of these vehicles, should vehicle cost, fuel effi-ciency, range, and performance characteristics makethem desirable. In fact, the projections indicate thatmore than the minimum will be purchased, asshown in Figure 48.
Projections for both vehicle-miles traveled [7] andton-miles traveled [8] are calculated endogenouslyand are based on the assumption that modal shares,for example, personal automobile travel versus masstransit, remain stable over the forecast and trackrecent historical patterns. Other important factorsaffecting the forecast of vehicle-miles traveled arepersonal disposable income per capita; the ratio ofmiles driven by females to males in the total drivingpopulation, which increases from 56 percent in 1990to 80 percent by 2015; and the aging of the largestsegment of the age distribution of the population,which will slow the growth in vehicle-miles traveled.
Climate Change Action Plan. There are four CCAPprograms that focus on transportation energy use:(1) reform Federal subsidy for employer-providedparking; (2) adopt a transportation system efficiencystrategy; (3) promote telecommuting; and (4) developfuel economy labels for tires. The combined assumedeffect of the Federal subsidy, system efficiency, andtelecommuting policies in the AEO97 reference caseis a 1.1-percent reduction in vehicle-miles traveled(194 trillion Btu). The fuel economy tire labelingprogram improved new fuel efficiency by 4 percentamong vehicles that switched to low rolling re-sistance tires, and resulted in a reduction in fuelconsumption of 40 trillion Btu.
Rapid technology and 1997 technology cases. In therapid technology case, fuel efficiency improvementsfrom new technology over the forecast were set at33-percent higher incremental technology fuel effi-ciency improvement levels and at 50 percent of thereference case technology cost levels for light-dutyvehicles. Similar fuel saving technology efficiencyimprovements and cost reductions were applied toboth air and freight truck sectors. The 1997 tech-nology case assumes that the list of available fuel
saving technologies is held constant throughout theforecast at the 1997 level of availability for light-duty vehicles, air, and freight truck modes. The1997 technology case and the reference case resultin similar consumption levels for both the air andfreight truck modes because of the lack of low-costtechnology availability and the high capital cost forthe available fuel-saving technologies in the air andfreight truck modes.
Both cases were run with only the TransportationDemand Module rather than as a fully integratedNEMS run. Consequently, no potential macro-economic feedback on travel demand was captured.
Electricity assumptions
Characteristics of generating technologies. The costsand performance of new generating technologies areimportant factors in determining the future mix ofcapacity. There are 26 fossil, renewable, and nucleargenerating technologies included in these projec-tions. Technologies represented include those cur-rently available as well as those that are assumed tobe commercially available within the horizon of theforecast. Capital cost estimates and operationalcharacteristics, such as efficiency of electricity pro-duction, are used for decisionmaking where it isassumed that the selection of new plants to be builtis based on least cost subject to environmental con-straints. The levelized lifetime cost, including fuelcosts, is evaluated and is used as the basis for se-lecting plants to be built. Details about each of thegenerating plant options are described in the de-tailed assumptions, which will be available via theEIA Home Page on the Internet and on the EIACD-ROM.
Regulation of electricity markets. It is assumed thatelectricity producers comply with CAAA90, whichmandates a limit of 8.95 million short tons of sulfurdioxide emissions by 2000. Utilities are assumed tocomply with the limits on sulfur emissions by retro-fitting units with flue gas desulfurization (FGD)equipment, transferring or purchasing sulfur emis-sion allowances, operating high-sulfur coal units ata lower capacity utilization rate, or switching to low-sulfur fuels. The costs for FGD equipment averageapproximately $187 per kilowatt, in 1995 dollars,although the costs vary widely across the regions. Itis also assumed that the market for trading emis-
202 Energy Information Administration/ Annual Energy Outlook 1997

Major Assumptions for the Forecasts
sion allowances is allowed to operate without regula-tion and that the States do not further regulate theselection of coal to be used.
The provisions of EPACT include revised licensingprocedures for nuclear plants and the creation ofexempt wholesale generators [9]. These entities areincluded among nonutility producers and areassumed to have a capital structure which is highlyleveraged, compared with that of investor-ownedregulated utilities.
Prices for electricity are assumed to be regulated atthe State level. Prices for the residential, commer-cial, industrial, and transportation sectors are devel-oped by classifying costs into four categories: fuel(including wholesale power purchases), fixed opera-tion and maintenance, variable operation and main-tenance, and capital. These costs are allocated toeach of the four customer classes by using the pro-portion of sales to the class and the contribution ofeach class to system peak load requirements. Theseallocated costs are divided by the sales to each sec-tor to obtain electricity prices to the sector.
Energy efficiency and demand-side management.Improvements in energy efficiency induced by grow-ing energy prices, new appliance standards, andutility demand-side management programs are rep-resented in the end-use demand models. Appliancechoice decisions are a function of the relative costsand performance characteristics of a menu of tech-nology options. Utilities have reported plans tospend more than $2.4 billion per year by 1999.
Representation of utility Climate Challenge partici-pation agreements. As a result of the Climate Chal-lenge Program, many utilities have announcedefforts to voluntarily reduce their greenhouse gasemissions between now and 2000. These effortscover a wide variety of programs, including increas-ing demand-side management (DSM) investments,repowering (fuel-switching) fossil plants, restartingnuclear plants that have been out-of-service, plant-ing trees, and purchasing emission offsets frominternational sources. To the degree possible, eachone of the participation agreements was examined todetermine if the commitments made were addressedin the normal reference case assumptions or wheth-er they were addressable in NEMS. Programs liketree planting and emission offset purchasing are not
addressable in NEMS. With regard to the otherprograms, they are, for the most part, captured inNEMS. For example, utilities annually report to EIAtheir plans (over the next 10 years) to bring a plantback on line, repower a plant, life extend a plant,cancel a previously planned plant, build a newplant, or switch fuel at a plant. These data are in-puts to NEMS. Thus, programs that would affectthese areas are reflected in NEMS input data. How-ever, because many of the agreements do not identi-fy the specific plants where action is planned, it isnot possible to determine which of the specifiedactions, together with their greenhouse gas emis-sions savings, should be attributed to the ClimateChallenge Program and which are the result of nor-mal business operations.
Nuclear power. One nuclear unit, Watts Bar 1,owned by the Tennessee Valley Authority, receivedits operating license in 1996. No additional units areactively under construction; therefore, no newplanned units are assumed to come into serviceduring the forecast.
In the reference case, nuclear units are assumed tooperate until their license expiration dates, unlesscurrent operating costs exceed 4 cents per kilowatt-hour. Nuclear units with higher operating costs areassumed to be retired 10 years before their licenseexpiration dates. Two standalone side cases weredeveloped with alternate retirement dates for nucle-ar units. The low nuclear case assumes that allreactors retire 10 years earlier than the referencecase retirement dates, while the high nuclear caseassumes 10 additional years of operation.
The average nuclear capacity factor is currently 77percent and is expected to remain between 76 and79 percent throughout the forecast. Capacity factorassumptions are developed at the unit level, andimprovements and losses are forecast based on theage of the reactor. Unit level projections are aggre-gated to the regional level for use in the model.
Fossil-steam retirement assumptions. Using currentand historical data from FERC Form 1, existingplants whose combined operating and fuel costsexceed 4 cents per kilowatthour are identified forretirement. These plants are then retired annuallyin equal numbers between 1998 and 2003. After2003, only units reported by utilities as candidates
Energy Information Administration/ Annual Energy Outlook 1997 203

Major Assumptions for the Forecasts
for retirement are retired. No nonutility or cogenera-tion plants are assumed to retire during the projec-tion period.
High electricity demand case. The high electricitydemand case, which is a standalone case, assumesthat the demand for electricity grows by 2.0 percentannually between 1995 and 2015, compared with 1.5percent in the reference case. No attempt was madeto determine the changes necessary in the end-usesectors needed to result in the stronger demandgrowth. The high electricity demand case is a par-tially integrated run, i.e., the Macroeconomic Activi-ty, Petroleum Marketing, International Energy, andend-use demand modules use the reference casevalues and are not effected by the higher electricitydemand growth. Conversely, the Oil and Gas, Natu-ral Gas Transmission and Distribution, Coal Mar-ket, and Renewable Fuels Modules are allowed tointeract with the Electricity Market Module in thehigh electricity demand case.
High and low technology cases. The high technologycase assumes that the advanced generating tech-nologies will reach their full commercialization costsooner than in the reference case. Input for eachtechnology is an nth-of-a-kind cost, which occurswhen plant cost estimates approach actual costs andthe effects of “learning by doing” are no longer ob-served. To get the current overnight cost, the nth-of-a-kind cost is multiplied by an optimism factor anda learning factor.
The optimism factor is a measure of the project riskfor the first commercialization of a new technology.In the reference case, this factor decreases linearlyover the first four plants. For the high technologycase, this factor is halved.
The learning factor captures the decrease in coststhat occurs from “learning by doing.” The learningfunction is a log-linear function which decreases theplant cost by a learning factor for each doubling ofcapacity. In the reference case, learning occurs forthe first five units. In the high technology case, costreductions due to learning increase by 50 percentrelative to learning in the reference case. In the lowtechnology case, only those technologies that areavailable in 1996 are considered as new capacityoptions for the entire projection period.
This is a partially integrated run of the ElectricityMarket, Oil and Gas Supply, Natural Gas Trans-mission and Distribution, Petroleum Market, andCoal Market Modules.
Renewable fuels assumptions
Energy Policy Act of 1992. The Renewable FuelsModule incorporates the provisions of EPACT thatsupport the development of renewable energy forms.EPACT provides a renewable electricity productioncredit of 1.5 cents per kilowatthour for electricityproduced by wind, applied to plants that becomeoperational between January 1, 1994, and June 30,1999 [10]. The credit extends for 10 years after thedate of initial operation. EPACT also includes provi-sions that allow an investment tax credit of 10 per-cent for solar and geothermal technologies that gen-erate electric power [11]. This credit is included asa 10-percent reduction to the capital costs.
Supplemental Additions. AEO97 includes 1,521megawatts of assumed new generating capacityusing renewable resources, including 946 megawattsof planned new capacity additions not reportedamong EIA data collections and 575 megawattsassumed by EIA to be built for reasons not incorpo-rated in NEMS modeling (such as for testing, invest-ment, and for distributed applications). Total supple-mentals include 110 megawatts of geothermal, 670megawatts of wind, 41 megawatts of solar, and 125megawatts of biomass. These supplementals include536 megawatts of mandated new capacity, 525 ofwhich are in Minnesota (400 megawatts of wind-powered capacity and 125 megawatts of biomass).Floors include 320 megawatts of new capacity usingphotovoltaics (PV) and 255 megawatts of solar ther-mal, representing central receiver, dish Stirling, andtrough technologies.
Renewable resources. The major source of renewableenergy for electricity generation is hydroelectricpower. Environmental and other restrictions areassumed to limit the growth of hydroelectric power,which grows slightly. The total resources for mostother renewables are theoretically large, for exam-ple, the amount of sunlight. However, total resourcesare not always the relevant measure. Regional char-acterization is required in order to properly repre-sent the resource. For example, while the capability
204 Energy Information Administration/ Annual Energy Outlook 1997

Major Assumptions for the Forecasts
to produce solar thermal energy is present in allregions of the United States, it is assumed that solarthermal energy technologies will penetrate first inthose regions where its economics are most favor-able. Wind energy resource potential, while large, isconstrained by land-use and environmental factorsthat result in the exclusion of some land area withinsuitable wind classes. The geographic distribution ofavailable wind resources is based on a resourceassessment study by the Pacific Northwest Labora-tory as revised in 1992 [12]. Geothermal energy islimited geographically to regions in the westernUnited States with hydrothermal resources of hotwater and steam. Although the potential for biomassis large, transportation costs limit the amount of theresource that is economically producible, since bio-mass fuels have a low thermal conversion factor(Btu content per weight of fuel). Municipal solidwaste resources are limited by the amount of thewaste that is managed by other methods, such asrecycling or landfills, and by the impact of wasteminimization as a strategy for addressing the wasteproblem.
Non-electric renewable energy. The forecast for woodconsumption in the residential sector is based on theResidential Energy Consumption Survey [13](RECS) and data from the Characteristics of NewHousing: 1993, published by the Bureau of the Cen-sus [14]. The RECS data provide a benchmark forBtu of wood use in 1993. The Census data are usedto develop the forecasts of new housing units utiliz-ing wood. Wood consumption is then computed bymultiplying the number of homes that use wood formain and secondary space heating by the amount ofwood used. Ground source (geothermal) heat pumpconsumption is also based on the latest RECS andCensus data; however, the measure of geothermalenergy consumption is represented by the amount ofprimary energy displaced by using a geothermalheat pump in place of an electric resistance furnace.Solar thermal consumption for water heating is alsorepresented by displaced primary energy relative toan electric water heater.
Exogenous projections of active and passive solartechnologies and geothermal heat pumps in thecommercial sector are based on projections from theNational Renewable Energy Laboratory [15]. Indus-trial use of renewable energy is primarily the use ofwood and wood byproducts in the paper and lumber
industries as well as a small amount of hydropowerfor electricity generation.
Oil and gas supply assumptions
Domestic oil and gas economically recoverable re-sources. The assumed resource levels are based onanalyses of estimates of the economically recoverableresource base from the U.S. Geological Survey(USGS) and the Minerals Management Service(MMS) of the Department of the Interior and theNational Petroleum Council (NPC) [16]. The valuesare given as beginning-of-the-year 1990, becausethat is the initial year of the model execution. Theyhave been derived from estimates based in otheryears (USGS, 1/1/94; MMS, 1/1/95; NPC, 1/1/91) byadjusting for reserve additions in the interveningyears.
Economically recoverable resources are those vol-umes considered to be of sufficient size and qualityfor their production to be commercially profitable bycurrent conventional or nonconventional techniques,under specified economic conditions. Estimates weredeveloped on a regional basis. Total lower 48 un-proved oil resources are assumed to be 96 billionbarrels with 1990 technology and 119 billion barrelswith 2015 technology. Total lower 48 unproved gasresources are assumed to be 936 trillion cubic feetwith 1990 technology and 1,322 trillion cubic feetwith 2015 technology. Unproved resources compriseinferred reserves and undiscovered resources. In-ferred reserves are that part of expected ultimaterecovery from known fields in excess of cumulativeproduction plus current reserves. Undiscovered re-sources are located outside oil and gas fields inwhich the presence of resources has been confirmedby exploratory drilling.
The assumed lower 48 unproved resource levels with2015 technology in AEO97 are somewhat lower thanin AEO96—approximately 16 percent and 19 percentlower for oil and gas, respectively. This is largelydue to a reassessment of the limits of technologicalexpansion. In addition, the assumed unproved oilresources with 1990 technology are lower in AEO97(by approximately 10 percent) than in AEO96. Thisis due primarily to the incorporation of undiscoveredeconomically recoverable resource estimates fromthe U.S. Geological Survey, which for oil are signifi-cantly lower than assumed in AEO96.
Energy Information Administration/ Annual Energy Outlook 1997 205

Major Assumptions for the Forecasts
Climate Change Action Plan (CCAP). The CCAP in-cludes a program promoting the capture of methanefrom coal mining activities to reduce carbon emis-sions. The methane would be marketed as part ofthe domestic natural gas supply. This programbegan in 1995. The AEO97 assumption is that itreaches a maximum annual production level of 19.1billion cubic feet by 2000.
Technological improvements affecting recovery andcosts. Productivity improvements are simulated byassuming that the undiscovered recoverable resourcetarget will expand and the effective cost of supplyactivities will be reduced. The total volumes of un-discovered economically recoverable domestic oil andnatural gas resources are assumed to increase overthe 1990-2015 period in response to technologicalinnovation, as indicated by the volumes cited above.The increase is due to the development and deploy-ment of new technologies, such as three-dimensionalseismology and horizontal drilling and completiontechniques. Drilling, operating, and lease equipmentcosts are expected to decline due to technologicalprogress, at econometrically estimated rates thatvary somewhat by cost and fuel categories, rangingfrom roughly 1 to 4 percent, most of them generallynear 2 percent. These technological impacts workagainst increases in costs associated with drilling togreater depths and higher drilling activity levels.
Rapid and slow technology cases. Two alternativecases were created to assess the sensitivity of theprojections to changes in the assumed rates of prog-ress in oil and natural gas supply technologies. Tocreate these cases, oil and natural gas reference caseparameters for the effects of technological progresson finding rates, drilling, lease equipment and oper-ating costs, and growth in the undiscovered econom-ic resource base were adjusted. The two cases werecreated by varying parameters that represent theeffects of technological progress on U.S. drillinglease equipment and operating costs from theirstatistically estimated values by one standarddeviation (based on the standard error associatedwith each estimated parameter).
Statistically estimated values for U.S. finding rateswere similarly varied (although additional trans-formations of these statistically estimated values,based on analyst judgment, were subsequently re-quired prior to their use as parameters within the
AEO97 analytic framework). Parameters for growthin the U.S. undiscovered economic resource base(which are not statistically derived) were alsovaried, in proportion to the changes in the tech-nological progress parameters affecting finding rates(reserves found per well).
Assumptions relating to natural gas trade withCanada were also adjusted. Similar to the UnitedStates, adjustments were made to costs, resources,and finding rates used in deriving the Canadiannatural gas supply curves to reflect different rates oftechnological progress. Additionally, exogenouslydetermined pipeline capacities at the U.S.-Canadaborder were adjusted to allow import volumes tochange across the cases. Upper bounds on capacitieswere changed to give import volumes the same mar-ket share they achieved in the reference case.
All other parameters in the model were kept at theirreference case values, including success rates, tech-nology parameters for other modules, parametersaffecting foreign oil supply, and assumptions aboutimports and exports of liquefied natural gas (LNG)and natural gas trade between the United Statesand Mexico. Specific detail by region and resourcecategory is presented in the supplementary tables tothe Annual Energy Outlook 1997, which will beavailable in January 1997 on the EIA FTP site (ftp://ftp.eia.doe.gov/pub/forecasting/aeo97/tables).
Leasing and drilling restrictions. The projections ofcrude oil and natural gas supply assume that cur-rent restrictions on leasing and drilling will continueto be enforced throughout the forecast period. Atpresent, drilling is prohibited along the entire EastCoast, the west coast of Florida, and the West Coastexcept for the area off Southern California. In Alas-ka, drilling is prohibited in a number of areas, in-cluding the Arctic National Wildlife Refuge. Theprojections also assume that coastal drilling activi-ties will be reduced in response to the restrictions ofCAAA90, which requires that offshore drilling siteswithin 25 miles of the coast, with the exception ofareas off Texas, Louisiana, Mississippi, and Ala-bama, meet the same clean air requirements asonshore drilling sites.
Gas supply from Alaska and LNG imports. TheAlaska Natural Gas Transportation System isassumed to come on line no earlier than 2005 and
206 Energy Information Administration/ Annual Energy Outlook 1997

Major Assumptions for the Forecasts
only after the U.S.-Canada border price reaches$3.74, in 1995 dollars per thousand cubic feet. Theliquefied natural gas facilities at Everett, Massachu-setts, and Lake Charles, Louisiana (the only onescurrently in operation) have an operating capacity of311 billion cubic feet. The facilities at Cove Point,Maryland, and Elba Island, Georgia, are assumed toreopen when economically justified, but not before1998. Should these facilities reopen, total liquefiednatural gas operating capacity would increase to 794billion cubic feet.
Natural gas transmission and distribution assump-tions. Consistent with industry restructuring, themethodology employed in solving for the marketequilibrium assumes that marginal costs are thebasis for determining market-clearing prices fornoncore markets. Core market prices are based onaverage cost of service rates minus a credit (to ac-count for capacity release) that credits a share of therevenue from interruptible and release capacityservices to holders of firm capacity should thoserevenues exceed costs.
Firm transportation rates for pipeline services arecalculated with the assumption that the costs of newpipeline capacity will be rolled into the existing ratebase (the test for determining whether or not tobuild new capacity is based on incremental rates,however). Although distribution markups to firmservice customers are based on historical data, theyalso respond to changes in consumption levels, costof capital, and assumed industry efficiency improve-ments. It is assumed that, independent of changes incosts related to the cost of capital and consumptionlevels, distributor costs for firm service customerswill decline by 1 percent per year.
In determining interstate pipeline tariffs, capitalexpenditures for refurbishment over and above thatincluded in operations and maintenance costs arenot considered, nor are potential future expendituresfor pipeline safety. (Refurbishment costs include anyexpenditures for repair and/or replacement of exist-ing pipe.) Reductions in operations and maintenancecosts and total administrative and general costs asa result of efficiency improvements are accounted foron the basis of historical trends.
The vehicle natural gas (VNG) sector is divided intofleet and non-fleet vehicles. The end-use price of
natural gas to fleet vehicles is based on EIA’s Natu-ral Gas Annual historical tariffs plus Federal andState VNG taxes. The price to non-fleet vehicles isbased on the industrial sector firm price plus anassumed $3 (1987 dollars) dispensing charge plustaxes. Federal taxes of $0.50 (1994 dollars) per thou-sand cubic feet plus corresponding State taxes arelevied starting in 1994.
CCAP initiatives to increase the natural gas shareof total energy use through Federal regulatory re-form (Action 23) are reflected in the new methodolo-gy for the pricing of pipeline services. This method-ology is consistent with recent signals from FERCthat show receptivity to alternative ratemaking anda desire to provide an atmosphere that fosters effi-cient capacity release. Provisions of the CCAP toexpand the Natural Gas Star program (Action 32)are assumed to recover 35 billion cubic feet of natu-ral gas per year by the year 2000 that otherwisemight be lost to fugitive emissions. This is phased inby recovering an additional 7 billion cubic feet peryear from 1996 through 2000, and by recovering thefull 35 billion cubic feet from 2000 through the endof the forecast period.
Petroleum market assumptions
The petroleum refining and marketing industry isassumed to incur large environmental costs to com-ply with CAAA90 and other regulations. Invest-ments related to reducing emissions at refineries arerepresented as an average annualized expenditure.Costs identified by the National Petroleum Council[17] are allocated among the prices of liquefied pe-troleum gases, gasoline, distillate, and jet fuel,assuming they are recovered in the prices of lightproducts. The lighter products, such as gasoline anddistillate, are assumed to bear a greater amount ofthese costs because demand for these products isless price-responsive than for the heavier products.
Petroleum product prices also include additionalcosts resulting from requirements for new fuels,including oxygenated and reformulated gasolinesand low-sulfur diesel. These additional costs aredetermined in the representation of refinery opera-tions by incorporating specifications and demandsfor these fuels. Demands for traditional, reformulat-ed, and oxygenated gasolines are disaggregated fromcomposite gasoline consumption based on market
Energy Information Administration/ Annual Energy Outlook 1997 207
Major Assumptions for the Forecasts
share assumptions for each Census Division. Theexpected oxygenated gasoline market shares assumewintertime participation of carbon monoxide non-attainment areas and year-round participation ofMinnesota beginning in 1995.
Starting in 1995, reformulated gasoline is assumedto be consumed in the nine serious ozone nonattain-ment areas required by CAAA90 and in areas in 12States and the District of Columbia that voluntarilyopted into the program [18]. The reformulated gaso-line is assumed to account for about 36 percent ofannual gasoline sales throughout the AEO97 fore-cast
Reformulated gasoline reflects the “Complex Model”definition as required by the EPA. AEO97 projec-tions also reflect California’s statewide requirementfor severely reformulated gasoline beginning in1996. Throughout the forecast, traditional gasolineis blended according to 1990 baseline specifications,to reflect CAAA90 “antidumping” requirementsaimed at preventing traditional gasoline from be-coming more polluting.
AEO97 assumes that the 54 cent per gallon taxcredit for gasoline blended with ethanol will notexpire in 2000 and will remain at 54 cents per gal-lon throughout the forecast.
AEO97 assumes that State taxes on gasoline, diesel,jet fuel, M85, and E85 increase with inflation, asthey have tended to in the past. Federal taxes whichhave increased sporadically in the past are assumedto stay at 1996 nominal levels (a decline in realterms).
Coal market assumptions
Resource base. Estimates of recoverable coal reservesare based on the EIA Demonstrated Reserve Base(DRB) of in-ground coal resources of the UnitedStates. Resource estimates from the DRB are corre-lated with coal quality data from other sources tocreate a Coal Reserves Data Base. Estimates aredeveloped on a regionally disaggregated basis.
In certain coal-producing regions, the DRB estimateshave been augmented by a proration of inferredresources. The extent of augmentation varies byState and coal type, based on the currency of DRB
estimates and the amount of inferred coal thatmeets criteria related to seam thickness, depth, andoverburden. The purpose of this change is to repre-sent expected additions to demonstrated reservesthat would occur in later years of the forecast. Theeffect of the change is to reduce somewhat mine-mouth and delivered prices in that period.
Productivity. Technological advances in the coalindustry, such as continuous mining, contribute toincreases in productivity, as measured in averagetons of coal per miner per hour. Productivity im-provements are assumed to continue but to declinein magnitude over the forecast horizon. Differentrates of improvement are assumed by region and bymine type, surface and deep. On a national basis,labor productivity is assumed to improve at a rate of3.3 percent per year, declining from an annual rateof 8.0 percent in 1995 to approximately 2 percentover the 2010 to 2015 period. In the alternativecases that were run to examine the impacts of differ-ent labor productivity assumptions, the annualgrowth rates for productivity were increased anddecreased by region and mine type, based on histori-cal variations in labor productivity. The rapid andslow productivity cases were developed by adjustingthe AEO97 reference case productivity path by 2standard deviations, although productivity growthrates were adjusted gradually with full variationfrom the reference case phased in by 2000. Theresulting national average productivities attained in2015 (in short tons per hour) were 19.69 in the highproductivity case and 5.27 in the low productivitycase, compared with 10.27 in the reference case.
In the reference case, labor wage rates for coal mineproduction workers are assumed to remain constantin real terms over the forecast period. In the alter-native low wage case and high wage case that wererun to examine the effects of different labor costescalation rates, wages were assumed to decline andincrease by 0.5 percent per year in real terms, re-spectively.
The productivity and wage cases were run withoutallowing demands to shift in response to changingprices. If demands had been allowed to shift, theprice changes would be smaller, since minemouthprices vary with the levels of capacity utilizationrequired to meet demand.
208 Energy Information Administration/ Annual Energy Outlook 1997
Major Assumptions for the Forecasts
Notes
[1] Energy Information Administration, Emissions ofGreenhouse Gases in the United States 1995, DOE/EIA-0573(95) (Washington, DC, October 1996).
[2] Energy Information Administration, Short-Term Ener-gy Outlook, DOE/EIA-0202(96/4Q) (Washington, DC,October 1996).
[3] Lawrence Berkeley Laboratory, U.S. Residential Ap-pliance Energy Efficiency: Present Status and FutureDirection.
[4] National Energy Policy Act of 1992, P.L. 102-486,Title I, Subtitle C, Sections 122 and 124.
[5] National Energy Policy Act of 1992, P.L. 102-486,Title II, Subtitle C, Section 342.
[6] National Energy Policy Act of 1992, P.L. 102-486,Title III, Section 303, and Title V, Sections 501 and507.
[7] Vehicle-miles traveled are the miles traveled yearlyby light-duty vehicles.
[8] Ton-miles traveled are the miles traveled and theircorresponding tonnage for freight modes, such astrucks, rail, air, and shipping.
[9] National Energy Policy Act of 1992, P.L. 102-486,Title VII, Subtitle A, Section 711, and Title XXVIII,Sections 2801 and 2802.
[10] National Energy Policy Act of 1992, P.L. 102-486,Title XIX, Section 1914.
[11] National Energy Policy Act of 1992, P.L. 102-486,Title XIX, Section 1916.
[12] Pacific Northwest Laboratory, An Assessment of theAvailable Windy Land Area and Wind Energy Poten-tial in the Contiguous United States, PNL-7789, pre-pared for the U.S. Department of Energy under Con-tract DE-AC06-76RLO 1830 (August 1991), andSchwartz, M.N.; Elliott, O.L.; and Gower, G.L.:Gridded State Maps of Wind Electric Potential. Pro-ceedings Wind Power 1992, October 19-23, 1992,Seattle.
[13] Energy Information Administration, Household Ener-gy Consumption and Expenditures 1993, DOE/ EIA-0321(93) (Washington, DC, 1995).
[14] U.S. Bureau of the Census, U.S. Department of Com-merce, Current Construction Reports, Series C25Characteristics of New Housing: 1993 (Washington,DC, 1994).
[15] National Renewable Energy Laboratory, “BaselineProjections of Renewables Use in the Buildings Sec-tor,” prepared for the U.S. Department of Energyunder Contract DE-AC02-83CH10093 (December1992).
[16] Goutier, Donald L., et al., U.S. Department of theInterior, U.S. Geological Survey, 1995 National As-sessment of the United States Oil and Gas Resources(Washington, DC, 1995); U.S. Department of theInterior, Minerals Management Service, An Assess-ment of the Undiscovered Hydrocarbon Potential of theNation’s Outer Continental Shelf, OCS Report MMS96-0034 (Washington, DC, June 1996); Cooke, LarryW., U.S. Department of the Interior, MineralsManagement Service, Estimates of Undiscovered, Eco-nomically Recoverable Oil and Gas Resources for theOuter Continental Shelf, Revised as of January 1990,OCS Report MMS 91-0051 (July 1991); NationalPetroleum Council, Committee on Natural Gas, ThePotential for Natural Gas in the United States,Volume II, Source and Supply (Washington, DC,December 1992).
[17] Estimated from National Petroleum Council, U.S.Petroleum Refining—Meeting Requirements for Clean-er Fuels and Refineries, Volume I (Washington, DC,August 1993). Excludes operation and maintenancebase cost prior to 1996.
[18] Required areas: Baltimore, Chicago, Hartford, Hous-ton, Los Angeles, Milwaukee, New York City, Phila-delphia, San Diego, and Sacramento. Opt-in areas arein the following States: Connecticut, Delaware, Ken-tucky, Maine, Massachusetts, Maryland, New Hamp-shire, New Jersey, New York, Rhode Island, Texas,Virginia, and the District of Columbia. Excludes areasthat “opted-out” prior to June 1996.
Energy Information Administration/ Annual Energy Outlook 1997 209
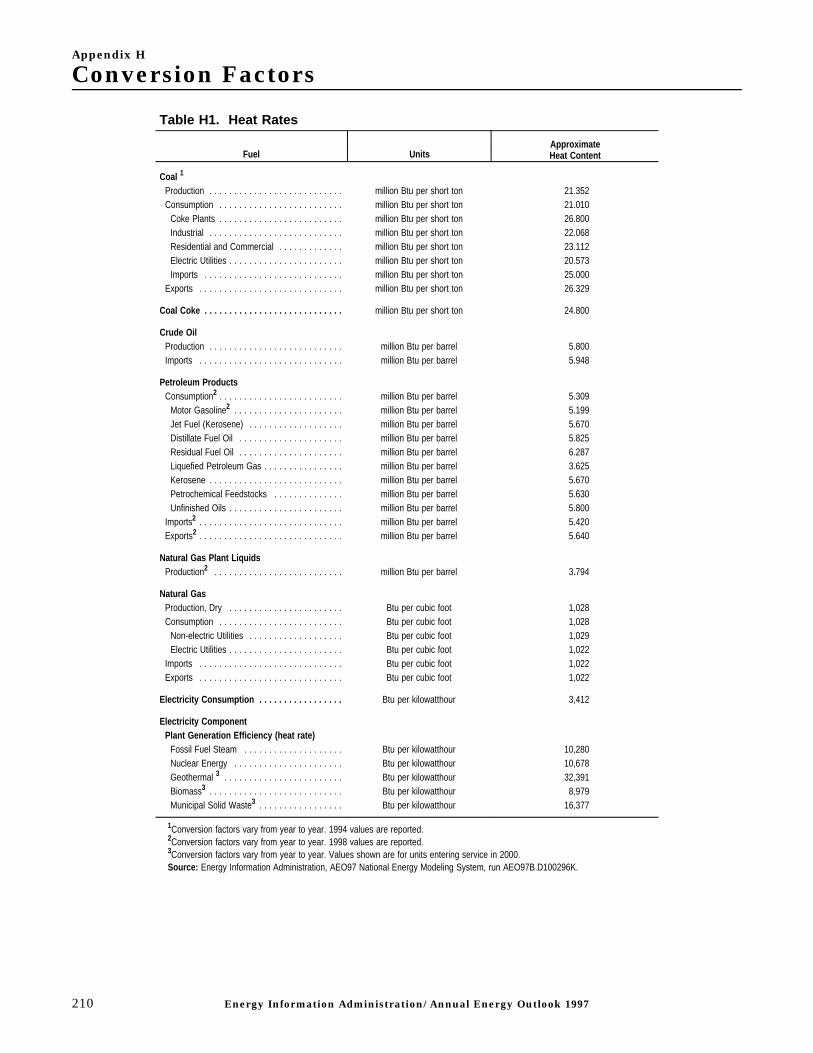
Appendix H
Conversion Factors
Table H1. Heat Rates
Fuel UnitsApproximateHeat Content
Coal 1
Production . . . . . . . . . . . . . . . . . . . . . . . . . . . million Btu per short ton 21.352Consumption . . . . . . . . . . . . . . . . . . . . . . . . . million Btu per short ton 21.010
Coke Plants . . . . . . . . . . . . . . . . . . . . . . . . . million Btu per short ton 26.800Industrial . . . . . . . . . . . . . . . . . . . . . . . . . . . million Btu per short ton 22.068Residential and Commercial . . . . . . . . . . . . . million Btu per short ton 23.112Electric Utilities . . . . . . . . . . . . . . . . . . . . . . . million Btu per short ton 20.573Imports . . . . . . . . . . . . . . . . . . . . . . . . . . . . million Btu per short ton 25.000
Exports . . . . . . . . . . . . . . . . . . . . . . . . . . . . . million Btu per short ton 26.329
Coal Coke . . . . . . . . . . . . . . . . . . . . . . . . . . . . million Btu per short ton 24.800
Crude OilProduction . . . . . . . . . . . . . . . . . . . . . . . . . . . million Btu per barrel 5.800Imports . . . . . . . . . . . . . . . . . . . . . . . . . . . . . million Btu per barrel 5.948
Petroleum ProductsConsumption2 . . . . . . . . . . . . . . . . . . . . . . . . . million Btu per barrel 5.309
Motor Gasoline2 . . . . . . . . . . . . . . . . . . . . . . million Btu per barrel 5.199Jet Fuel (Kerosene) . . . . . . . . . . . . . . . . . . . million Btu per barrel 5.670Distillate Fuel Oil . . . . . . . . . . . . . . . . . . . . . million Btu per barrel 5.825Residual Fuel Oil . . . . . . . . . . . . . . . . . . . . . million Btu per barrel 6.287Liquefied Petroleum Gas . . . . . . . . . . . . . . . . million Btu per barrel 3.625Kerosene . . . . . . . . . . . . . . . . . . . . . . . . . . . million Btu per barrel 5.670Petrochemical Feedstocks . . . . . . . . . . . . . . million Btu per barrel 5.630Unfinished Oils . . . . . . . . . . . . . . . . . . . . . . . million Btu per barrel 5.800
Imports2 . . . . . . . . . . . . . . . . . . . . . . . . . . . . . million Btu per barrel 5.420Exports2 . . . . . . . . . . . . . . . . . . . . . . . . . . . . . million Btu per barrel 5.640
Natural Gas Plant LiquidsProduction2 . . . . . . . . . . . . . . . . . . . . . . . . . . million Btu per barrel 3.794
Natural GasProduction, Dry . . . . . . . . . . . . . . . . . . . . . . . Btu per cubic foot 1,028Consumption . . . . . . . . . . . . . . . . . . . . . . . . . Btu per cubic foot 1,028
Non-electric Utilities . . . . . . . . . . . . . . . . . . . Btu per cubic foot 1,029Electric Utilities . . . . . . . . . . . . . . . . . . . . . . . Btu per cubic foot 1,022
Imports . . . . . . . . . . . . . . . . . . . . . . . . . . . . . Btu per cubic foot 1,022Exports . . . . . . . . . . . . . . . . . . . . . . . . . . . . . Btu per cubic foot 1,022
Electricity Consumption . . . . . . . . . . . . . . . . . Btu per kilowatthour 3,412
Electricity ComponentPlant Generation Efficiency (heat rate)
Fossil Fuel Steam . . . . . . . . . . . . . . . . . . . . Btu per kilowatthour 10,280Nuclear Energy . . . . . . . . . . . . . . . . . . . . . . Btu per kilowatthour 10,678Geothermal 3 . . . . . . . . . . . . . . . . . . . . . . . . Btu per kilowatthour 32,391Biomass3 . . . . . . . . . . . . . . . . . . . . . . . . . . . Btu per kilowatthour 8,979Municipal Solid Waste3 . . . . . . . . . . . . . . . . . Btu per kilowatthour 16,377
1Conversion factors vary from year to year. 1994 values are reported.2Conversion factors vary from year to year. 1998 values are reported.3Conversion factors vary from year to year. Values shown are for units entering service in 2000.Source: Energy Information Administration, AEO97 National Energy Modeling System, run AEO97B.D100296K.
210 Energy Information Administration/ Annual Energy Outlook 1997

Conversion Factors
Table H2. Metric Conversion Factors
United States Unit multiplied by Conversion Factor equals Metric Unit
MassPounds (lb) X 0.453 592 37 = kilograms (kg)Short tons (2000 lb) X 0.907 184 7 = metric tons (t)
DistanceMiles X 1.609 344 = kilometers (km)
EnergyBritish thermal unit (Btu)1 X 1055.056 = joules (J)Kilowatthours X 3.6 = megajoules (MJ)
VolumeBarrels of oil (bbl) X 0.158 987 3 = cubic meters (m3)Cubic feet (ft3) X 0.028 316 85 = cubic meters (m3)Gallons (gal) X 3.785 412 = liters (L)
AreaSquare feet (ft2) X 0.092 903 04 = square meters (m2)
1The Btu used in this table is the International Table Btu adopted by the Fifth InternationalConference on Properties of Steam (London, UK, 1956).
Note: Spaces have been inserted after every third digit to the right of the decimal for ease of reading.Source: Energy Information Administration, Annual Energy Review 1995, DOE/EIA-0384(95) (Wash-
ington DC, July 1996), Table B1.
Table H3. Metric Prefixes
Unit Multiple Prefix Symbol
103 kilo k
106 mega M
109 giga G
1012 tera T
1015 peta P
1018 exa E
Source: Energy Information Administration, Annual Energy Review1995, DOE/EIA-0384(95) (Washington, DC, July 1996), Table B2, andEIA, Office of Statistical Standards.
Energy Information Administration/ Annual Energy Outlook 1997 211

Appendix I
Fax-On-DemandData tables for the reference case of AEO97 areavailable via Fax-On-Demand, with data for 1994 to2015. Supplementary tables providing regional andother detail from the AEO97 reference case will beavailable by January 31, 1997. To obtain documentnumbers for supplementary tables, follow the direc-tions below and request document 101.
To use the EIA’s Fax-On-Demand system, dial (202)586-3550. All international customers must phone infrom a fax machine. A voice will guide you throughthe system. When prompted for a document number,enter the document number of the table you want.
DocumentNumber
Description/Source Pages
101 Directory of all EIA documents in the Fax-On-Demand System multi
383001 Total Energy Supply and Distribution Summary from AEO97, Table A1 2
383002 Energy Consumption by Sector and Source from AEO97, Table A2 6
383003 Energy Prices by Sector and Source from AEO97, Table A3 4
383004 Residential Sector Key Indicators and Consumption from AEO97, Table A4 4
383005 Commercial Sector Key Indicators and Consumption from AEO97, Table A5 4
383006 Industrial Sector Key Indicators and Consumption from AEO97, Table A6 2
383007 Transportation Sector Key Indicators and Delivered Energy Consumption fromAEO97, Table A7
2
383008 Electricity Supply, Disposition, and Prices from AEO97, Table A8 2
383009 Electricity Generating Capability from AEO97, Table A9 4
383010 Electricity Trade from AEO97, Table A10 2
383011 Petroleum Supply and Disposition Balance from AEO97, Table A11 2
383012 Petroleum Product Prices from AEO97, Table A12 2
383013 Natural Gas Supply and Disposition from AEO97, Table A13 2
383014 Natural Gas Prices, Margins, and Revenues from AEO97, Table A14 2
383015 Oil and Gas Supply from AEO97, Table A15 2
383016 Coal Supply, Disposition, and Prices from AEO97, Table A16 2
383017 Renewable Energy Generating Capacity and Generation from AEO97, Table A17 2
383018 Renewable Energy Consumption by Sector and Source from AEO97, Table A18 2
383019 Carbon Emissions by Sector and Source from AEO97, Table A19 2
383020 Macroeconomic Indicators from AEO97, Table A20 2
383021 International Petroleum Supply and Disposition Summary from AEO97,Table A21
4
212 Energy Information Administration/ Annual Energy Outlook 1997