Embed Size (px)
Citation preview

ANNUAL ENERGY REPORT 2014

2
EXECUTIVE SUMMARY
SAVINGS
ENERGY REDUCTION
USAGE AND COSTS
FLEET
CHANGING THE ENERGY CULTURE
METHODOLOGY
3
6
7
8
10
12
13
TABLE OF CONTENTS

3
EXECUTIVE SUMMARY
Since April 2011, when Mayor Dwight C. Jones issued the Green Government Order as part of the Green Richmond Initiative, city agencies and
employees have strived to create more efficiency and less waste in city government and to reduce greenhouse gas emissions from city govern-
ment operations.
Every city department is responsible for implementing the provisions of the Order. To assist departments in this effort, the Sustainability Office
has championed the implementation of the Green Government Order and provided guidance and technical assistance.
City of Richmond Goals:
• Reduce the city’s annual electricity consumption by at least 1% per calendar year using the City’s 2008 Greenhouse Gas Inventory as the
benchmark (except where other benchmarks may be required by operational necessity)
• Reduce the city’s annual vehicle fuel consumption by at least 1% per calendar year using the City’s 2008 Greenhouse Gas Inventory as the
benchmark
The results of the city’s efforts are outlined in this report reflecting the time period from 2008 through 2013 adjusted for weather and avoided
costs.
Major Accomplishments:
Energy Savings
2010-2013 cumulative savings $3.1 million dollars
Continuous Annual savings* $1.1 million dollars
Electricity Consumption Reduction
2008-2013 cumulative electricity reduction Goal in KWh 9 million kWh or equivalent of 1% per year
2008-2013 (adjusted) cumulative electricity reduction accomplishment in kWh 26 million kWh or equivalent of 2.9% annual reduction
Electricity Expense
2008 total electricity expense $14,146,090
2013 (adjusted) total electricity expense $14,158,996
Increase in expenses since 2008 $12,906
*savings from one time energy efficiency upgrades that will continue annually into the future

4
EXECUTIVE SUMMARY
Energy Management Excellence:
City government is constantly growing and changing to meet the needs of our residents and customers. The ultimate goal of an energy manage-
ment program is to keep the rate of increase in energy consumption to a level that will enable the local entity to absorb these changes in growth
without increasing consumption and overall expense. This is extremely difficult to accomplish over a five year period.
From 2008-2013, city government experienced many changes that helped the city better serve its residents and customers. However, these
changes caused city government to consume 13.7 million in new kWh of electricity during this period. Virtually all of the additional electricity
consumption was offset by the city’s excellent energy management program and energy conservation accomplishments.
Changes that added to the city’s electricity consumption from 2008-2013:
• 69 new electricity accounts added
• 4th precinct Police station
• New Fire Station 17
• Department of Environmental Quality (DEQ) required the Department of Public Utilities (DPU) to upgrade Brander Street Waste Water
Treatment plant to meet new environmental standards set by DEQ - The upgrade includes ultraviolet (UV) sterilization lights to eliminate
chemicals in the processing of waste, added two final sediment tanks, upgraded UV building, added methanol building and updated facility
fermentation process along with other upgrades to meet DEQ requirements
• Absorbed a Dominion Virginia Power Rate increase of approximately 15% during this period
5
EXECUTIVE SUMMARY
Energy Management Excellence:
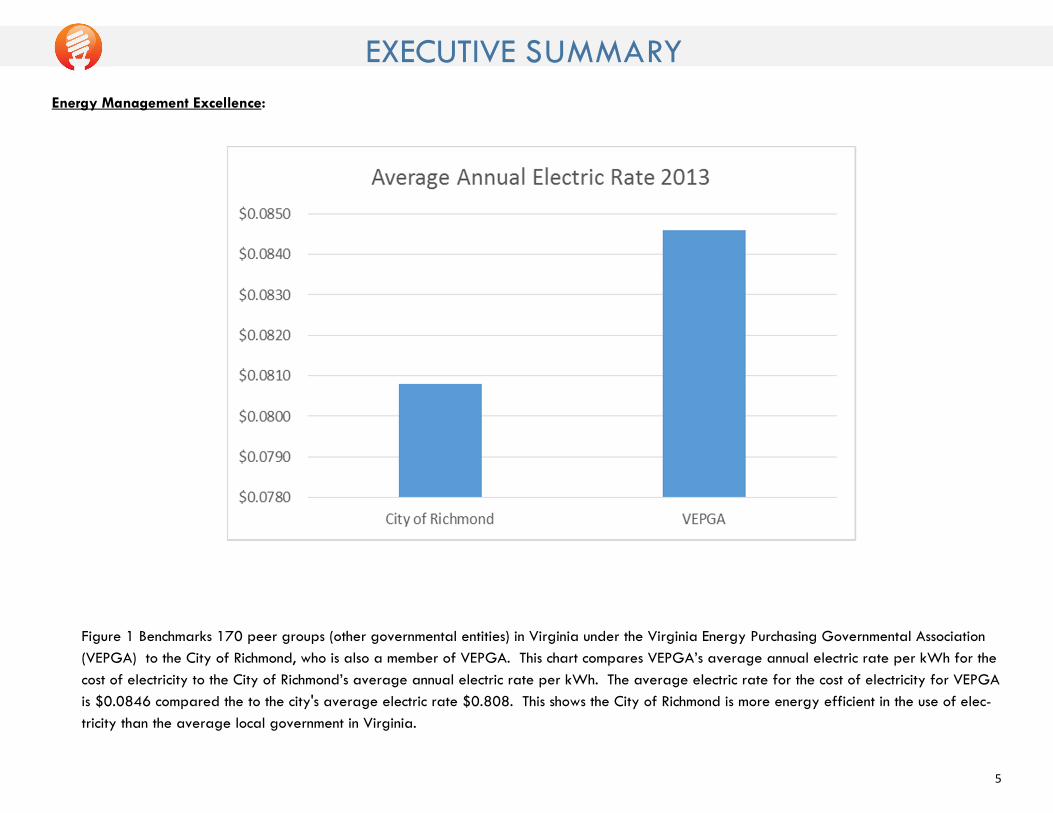
Figure 1 Benchmarks 170 peer groups (other governmental entities) in Virginia under the Virginia Energy Purchasing Governmental Association
(VEPGA) to the City of Richmond, who is also a member of VEPGA. This chart compares VEPGA’s average annual electric rate per kWh for the
cost of electricity to the City of Richmond’s average annual electric rate per kWh. The average electric rate for the cost of electricity for VEPGA
is $0.0846 compared the to the city's average electric rate $0.808. This shows the City of Richmond is more energy efficient in the use of elec-
tricity than the average local government in Virginia.

6
SAVINGS Verified savings from 2010-2013 are $3.1 million dollars (m). Continuous annual savings are $1.1 million dollars, i.e. savings from one
time energy efficiency upgrades that will continue annually into the future.
Figure 2— Long term savings impact of implementing Energy Conservation
Measures (ECMs). If no ECMs were implemented, the City would be spend-
ing $3.1 m dollars more in 2013 and continue to spend this every year.
Figure 3— Energy Savings in Dollars, 2010-2013
Total Cumulative Savings $3,073,213

7
ENERGY REDUCTION Electric Consumption Reduction Goal
Goal: Reduce the City’s annual electricity consumption by at least 1% per year (1.79 million kWh) using the city’s 2008 Greenhouse Gas Inventory as the benchmark
(except where other benchmarks may be an operational necessity)
Goal: 2008-2013 cumulative reduction = 8.95 million kWh
Achievement: 2008-2013 cumulative reduction = 26 million kWh or 5.2 million kWh per year
Achievement
Figure 4—Energy Reduction When comparing 2008 electricity usage to 2013 using measured and validated savings, there has been a total reduction of 20.9 million kWh. When savings is adjusted for weather and avoided electric con-sumption, the total measured and validated savings increases to 26 million kWh resulting in a 14.5% overall electricity reduction (orange line in Figure 4). Data excludes RRHA and Richmond Public Schools, which are not within the city’s operational control.
Figure 5 — The annual reduction by department provides trending data to help
each department understand electric consumption when compared to the City’s 1%
annual reduction goal.

8
USAGE AND COSTS Overall Utility Costs Utility costs and other energy expenditures are a significant, but necessary portion of business costs. Energy usage is also the primary contributor to Greenhouse Gas (GHG) Emissions. While it is not possible to eliminate these costs, it is possible to reduce them through changes in organizational culture and strategic invest-ments in energy conservation. RVAgreen Government Teams work in each department to facilitate these changes. Going forward Natural Gas and Water will be included in departmental goals.
Figure 7 - Overall energy expense - not adjusted for weather/avoided costs
The chart shows historical expense for electric, natural gas, water and fleet fuel
back to 2008 based on the best information currently available. This graph pro-
vides energy expense data to support expanding the City’s goals to include natu-
ral gas and water. Adding these two energy expenses to energy efficiency and
conservation measure will provide additional future savings opportunities.
Figure 8– Provides energy usage (consumption) trending (unadjusted) for electric,
natural gas, fleet fuel and water beginning in 2008 (benchmarked at 100%) com-
pared to current usage levels in 2013. Natural gas consumption is increasing and
reflects a business decision to move to a cheaper and cleaner energy choice. Elec-
tricity decreased until 2011 when the city added 69 new electric accounts and
Brander Street Waste Water Treatment Plant upgrades began consuming electric-
ity. Water increased until 2012 when the Sustainability Office began monitoring
and controlling usage levels. Future conservation goals will include natural gas
and water as a reflection of the city's desire to become a well managed city.

9
USAGE AND COSTS
Figure 9
The average electric rate for the cost of electricity increased between 2010 and 2012. Between 2008 and 2013, Dominion increased electric rates to the city through the Virginia Energy Purchasing Governmental Association (VEPGA) by approximately 15%. However, the city ab-sorbed this rate increase with minimal increase in electric expense through the city's energy conservation and efficiency initiatives. A good ba-rometer on how efficient the city is using electricity is the average electric rate for each kWh consumed by the city. A decrease in the average electric rate price of 9.5% between 2012 and 2013 shows energy efficiency measures are beginning to reflect in the overall average electric rate.

10
FLEET
REDUCTION GOAL
Reduce the City’s annual fuel consumption by at least 1% per year (140,948 gallons average) using the city’s 2008 Greenhouse Gas Inventory as the
benchmark (except where other benchmarks may be an operational necessity)
2008-2013 cumulative reduction goal = 704,740 gallons Actual Achievement
2008-2013 cumulative reduction = 1,291,510 gallons (258,302 gallons per year average)
Figure 10 - Fleet Fuel Usage Figure 11– Fuel usage by Department
Financial Savings Fleet fuel expense for 2013 was $3.3M. Comparing 2008-2013, actual fuel costs were reduced by $1 million. Each department will continue to find ways to
reduce the overall expense to the city. Total avoided fuel costs total$2.2M between 2008-2013. These savings were achieved through CNG conversion, fleet
right-sizing, a more energy efficient fleet, and optimized usage.
Gallons of fuel (including fuel equivalent gallons for CNG) increased in 2013 with Compressed Natural Gas (CNG) refuse haulers and CNG vans being includ-
ed in the fleet fuel mix. CNG fuel equivalent gallons increases the gallons used because CNG vehicles use more fuel per mile than diesel or gas because of the
lower BTU value of CNG vs. diesel. However cost savings significantly override the usage increases and the city still made the reduction in fuel usage goal.
Even with the significant drop in oil prices in 2014, CNG vehicles in the long run will be competitive and more environmentally favorable.

11
FLEET
MAJOR ACCOMPLISHMENTS FOR FLEET
The City has aggressively pursued the conversion of its fleet to Compressed Natural Gas (CNG).
• The City’s fleet totals approximately 1,902 vehicles. At the current rate of replacement to CNG fuel, approximately 800 vehicles will be re-
placed by 2020.
• In 2011, the city replaced 37 diesel garbage trucks with 25 new CNG garbage trucks saving over $577,000 in the last four years.
• As of 2014, a total of 76 CNG vehicles are now in the city’s fleet
• The City’s transportation sources are on average replacing approximately 74,000 Diesel Gallon Equivalents (DGE) of fuel per month which
eliminates approximately 412 tons of greenhouse gas from the City’s environment every month.

12
CHANGING THE ENERGY CULTURE
Objective
Implement a global approach to include employee participation, provide energy tools and resources to become more energy sustainable in City Government.
Outcomes
Comprehensive Energy Management Plan entitled “Roadmap to Well-Managed Energy” completed and implemented on January 1, 2012.
EnergyCAP Energy Management Database implemented and currently tracking over 4 million pieces of electric, gas and water energy data. The system is being distributed to
green team members. On-site training will follow.
Training
Leadership in Energy Efficient Design (LEED) provided to 166 city employees.
Team RVAgreen Government training provided to 70 city employees.
Team RVAgreen Government Departments
Department of Public Utilities, Department of Public Works and Department of Parks and Recreation
27 employees are currently on the RVAgreen Government team
VML Green Government Challenge Awards
2014- Platinum Certificate – highest level
2013- Platinum Certificate – highest level
2012- Platinum Certificate – highest level
2011- Gold Certificate
2010- Silver Certificate
OTHER AWARDS
2012 Best Green Organization
2010 Green Giant Award – Sierra Club
2009 Certified Green Government Certificate –Virginia Sustainability Building Network

13
METHODOLOGY
Purpose
Measure and validate each department’s energy reduction performance benchmarked against 2008 energy consumption levels.
Benchmark
2008 Greenhouse Gas Inventory. City of Richmond Government Operations excludes Richmond Public Schools and Richmond Redevelopment and Housing Authority (RRHA).
Data
Actual electrical energy consumption data provided by Dominion Virginia Power
Sustainability Office parsed the data to establish the amount of energy consumed by each department
Energy reduction performance goals were determined based on the Mayor’s Green Government Order and presented to the departments.