Embed Size (px)
Citation preview
Annual Financial Report 2018
For the Year Ended March 31, 2018
Financial Summary P1
Management's Discussion and Analysis of Financial Condition and Results of Operations
P3
Consolidated Statement of Financial Position P11
Consolidated Statement of Profit or Loss P13
Consolidated Statement of Comprehensive Income P14
Consolidated Statement of Changes in Equity P15
Consolidated Statement of Cash Flows P17
Notes to Consolidated Financial Statements P19
Report of Independent Auditors P92
TOYOTA INDUSTRIES CORPORATION
― 1 ―
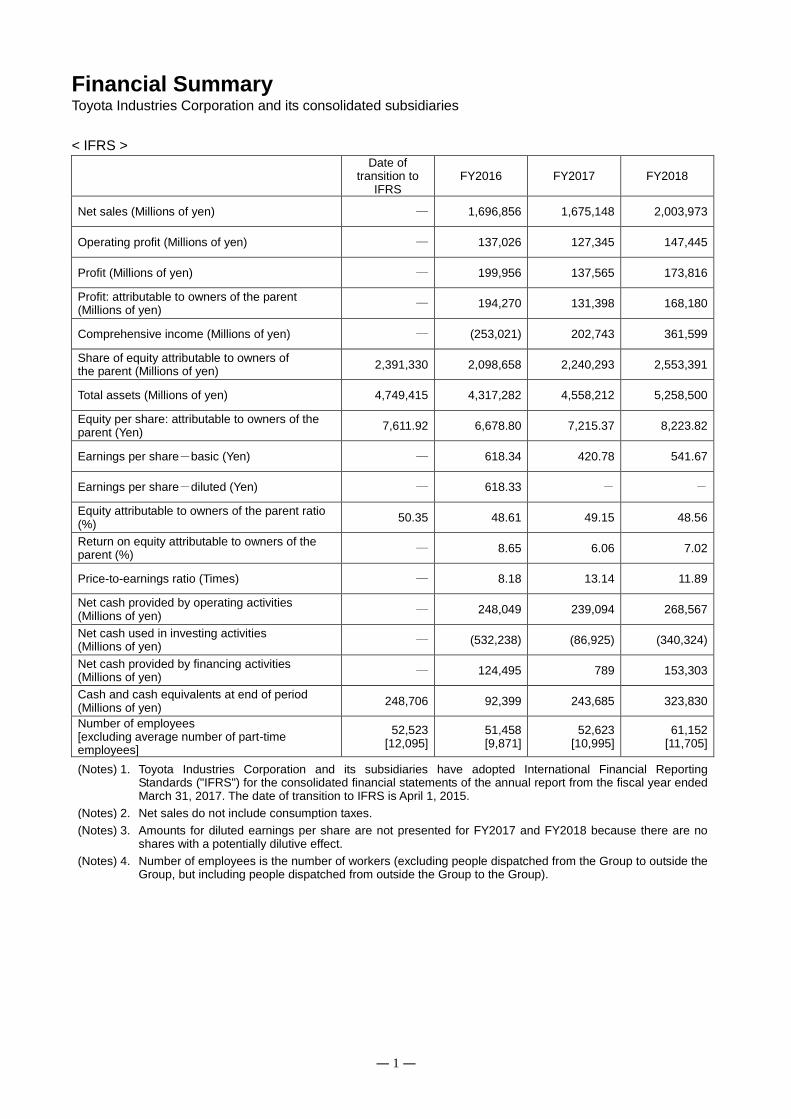
Financial Summary Toyota Industries Corporation and its consolidated subsidiaries
< IFRS >
Date of
transition to IFRS
FY2016 FY2017 FY2018
Net sales (Millions of yen) ― 1,696,856 1,675,148 2,003,973
Operating profit (Millions of yen) ― 137,026 127,345 147,445
Profit (Millions of yen) ― 199,956 137,565 173,816
Profit: attributable to owners of the parent (Millions of yen)
― 194,270 131,398 168,180
Comprehensive income (Millions of yen) ― (253,021) 202,743 361,599
Share of equity attributable to owners of the parent (Millions of yen)
2,391,330 2,098,658 2,240,293 2,553,391
Total assets (Millions of yen) 4,749,415 4,317,282 4,558,212 5,258,500
Equity per share: attributable to owners of the parent (Yen)
7,611.92 6,678.80 7,215.37 8,223.82
Earnings per share-basic (Yen) ― 618.34 420.78 541.67
Earnings per share-diluted (Yen) ― 618.33 - -
Equity attributable to owners of the parent ratio (%)
50.35 48.61 49.15 48.56
Return on equity attributable to owners of the parent (%)
― 8.65 6.06 7.02
Price-to-earnings ratio (Times) ― 8.18 13.14 11.89
Net cash provided by operating activities (Millions of yen)
― 248,049 239,094 268,567
Net cash used in investing activities (Millions of yen)
― (532,238) (86,925) (340,324)
Net cash provided by financing activities (Millions of yen)
― 124,495 789 153,303
Cash and cash equivalents at end of period (Millions of yen)
248,706 92,399 243,685 323,830
Number of employees [excluding average number of part-time employees]
52,523 [12,095]
51,458 [9,871]
52,623 [10,995]
61,152 [11,705]
(Notes) 1. Toyota Industries Corporation and its subsidiaries have adopted International Financial Reporting
Standards ("IFRS") for the consolidated financial statements of the annual report from the fiscal year ended March 31, 2017. The date of transition to IFRS is April 1, 2015.
(Notes) 2. Net sales do not include consumption taxes.
(Notes) 3. Amounts for diluted earnings per share are not presented for FY2017 and FY2018 because there are no shares with a potentially dilutive effect.
(Notes) 4. Number of employees is the number of workers (excluding people dispatched from the Group to outside the Group, but including people dispatched from outside the Group to the Group).
― 2 ―
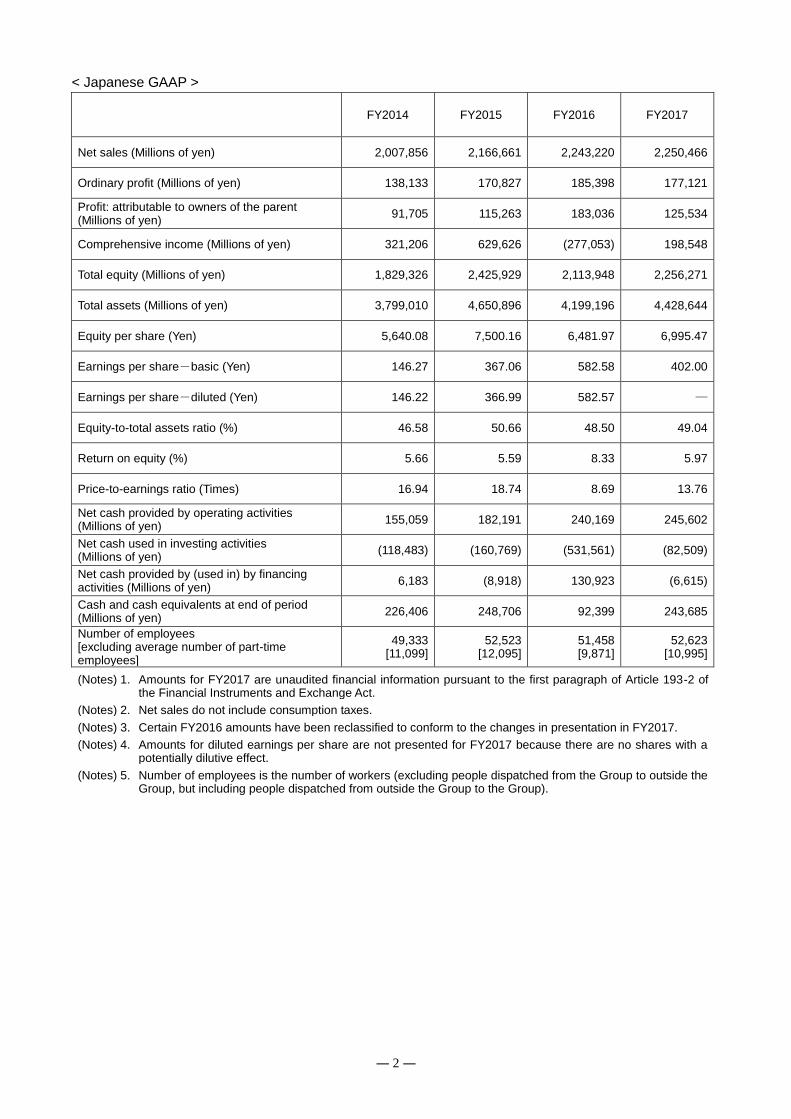
< Japanese GAAP >
FY2014 FY2015 FY2016 FY2017
Net sales (Millions of yen) 2,007,856 2,166,661 2,243,220 2,250,466
Ordinary profit (Millions of yen) 138,133 170,827 185,398 177,121
Profit: attributable to owners of the parent (Millions of yen)
91,705 115,263 183,036 125,534
Comprehensive income (Millions of yen) 321,206 629,626 (277,053) 198,548
Total equity (Millions of yen) 1,829,326 2,425,929 2,113,948 2,256,271
Total assets (Millions of yen) 3,799,010 4,650,896 4,199,196 4,428,644
Equity per share (Yen) 5,640.08 7,500.16 6,481.97 6,995.47
Earnings per share-basic (Yen) 146.27 367.06 582.58 402.00
Earnings per share-diluted (Yen) 146.22 366.99 582.57 ―
Equity-to-total assets ratio (%) 46.58 50.66 48.50 49.04
Return on equity (%) 5.66 5.59 8.33 5.97
Price-to-earnings ratio (Times) 16.94 18.74 8.69 13.76
Net cash provided by operating activities (Millions of yen)
155,059 182,191 240,169 245,602
Net cash used in investing activities (Millions of yen)
(118,483) (160,769) (531,561) (82,509)
Net cash provided by (used in) by financing activities (Millions of yen)
6,183 (8,918) 130,923 (6,615)
Cash and cash equivalents at end of period (Millions of yen)
226,406 248,706 92,399 243,685
Number of employees [excluding average number of part-time employees]
49,333 [11,099]
52,523 [12,095]
51,458 [9,871]
52,623 [10,995]
(Notes) 1. Amounts for FY2017 are unaudited financial information pursuant to the first paragraph of Article 193-2 of
the Financial Instruments and Exchange Act.
(Notes) 2. Net sales do not include consumption taxes.
(Notes) 3. Certain FY2016 amounts have been reclassified to conform to the changes in presentation in FY2017.
(Notes) 4. Amounts for diluted earnings per share are not presented for FY2017 because there are no shares with a potentially dilutive effect.
(Notes) 5. Number of employees is the number of workers (excluding people dispatched from the Group to outside the Group, but including people dispatched from outside the Group to the Group).
― 3 ―
Management's Discussion and Analysis of Financial Condition and Results of Operations
The following Management's Discussion and Analysis of Financial Condition and Results of Operations is based on
information known to management as of June 2018.
This section contains projections and forward-looking statements that involve risks, uncertainties and assumptions. You
should be aware that certain risks and uncertainties could cause the actual results of Toyota Industries Corporation and its
consolidated subsidiaries to differ materially from any projections or forward-looking statements. These risks and
uncertainties include, but are not limited to, those listed under "Risk Information" and elsewhere in this annual report.
The fiscal year ended March 31, 2018 is referred to as FY2018 and other fiscal years are referred to in a corresponding
manner. All references to the "Company" herein are to Toyota Industries Corporation on a stand-alone basis and
references to "Toyota Industries" herein are to the Company and its 207 consolidated subsidiaries.
1. Result of Operations
(1) Operating Performance
In FY2018, the global economy remained strong overall on the back of an expansion in consumer spending and
exports in Europe and the United States despite such uncertainties as the slowdown in economic growth in China and
geopolitical risks. The Japanese economy progressed favorably due mainly to an increase in exports as well as a
recovery in domestic demand including consumer spending and capital investment. In this operating environment,
Toyota Industries undertook efforts to ensure customer trust through a dedication to quality as well as to expand sales
by responding flexibly to market trends.
As a result, total consolidated net sales amounted to 2,003.9 billion yen, an increase of 328.8 billion yen, or 20%, from
the previous fiscal year.
(2) Operating Performance Highlights by Business Segment
Operating results by business segment are as follows.
Net sales for each segment do not include inter-segment transactions.
(Automobile)
The automobile market expanded on a global basis, supported by robust sales mainly in Europe and China. Amid such
operating conditions, net sales of the Automobile Segment totaled 595.0 billion yen, an increase of 32.4 billion yen, or
6%. Operating profit amounted to 29.6 billion yen, an increase of 4.7 billion yen, or 19%, from the previous fiscal year.
Within this segment, net sales of the Vehicle Business amounted to 72.1 billion yen, a decrease of 1.0 billion yen, or
1%, due to decreases in sales of the Vitz (Yaris outside Japan).
Net sales of the Engine Business totaled 98.7 billion yen, an increase of 8.7 billion yen, or 10%, as a result of
increases in sales of AR gasoline engines and GD diesel engines.
Net sales of the Car Air-Conditioning Compressor Business totaled 351.4 billion yen, an increase of 16.7 billion yen, or
5%, attributable mainly to an increase in unit sales in Japan, North America and China.
Net sales of Electronics Parts, Foundry and Others Business totaled 72.7 billion yen, an increase of 8.0 billion, or 12%,
due primarily to increases in sales of electronics parts and foundry products.
― 4 ―
(Materials Handling Equipment)
The materials handling equipment market as a whole expanded globally driven by China, emerging countries, Europe
and the United States. Amid this operating climate, Toyota Industries strengthened production and sales structures and
rolled out new products matched to respective markets. In December 2017, Toyota Industries commenced sales of the
new reach type electric lift trucks, "Rinova" in Japan. These initiatives led to an increase in unit sales of mainstay lift
trucks in respective regions. In addition, U.S.-based Bastian Solutions LLC and Netherland-based Vanderlande
Industries Holding B.V. joined the Toyota Industries Group in April 2017 and May 2017, respectively, resulting in net
sales of 1,283.0 billion yen, an increase of 294.9 billion yen, or 30%. Operating profit amounted to 104.9 billion yen, an
increase of 15.5 billion yen, or 17%, from the previous fiscal year.
(Textile Machinery)
The textile machinery market was sluggish mainly in China and emerging countries in Asia. Despite an increase in
sales of instruments for textile quality measurement, sales of both weaving machinery and spinning machinery
declined, which resulted in net sales of 65.5 billion yen, a decrease of 0.7 billion yen, or 1%. Operating profit
amounted to 6.1 billion yen, a decrease of 0.7 billion yen, or 10%, from the previous fiscal year.
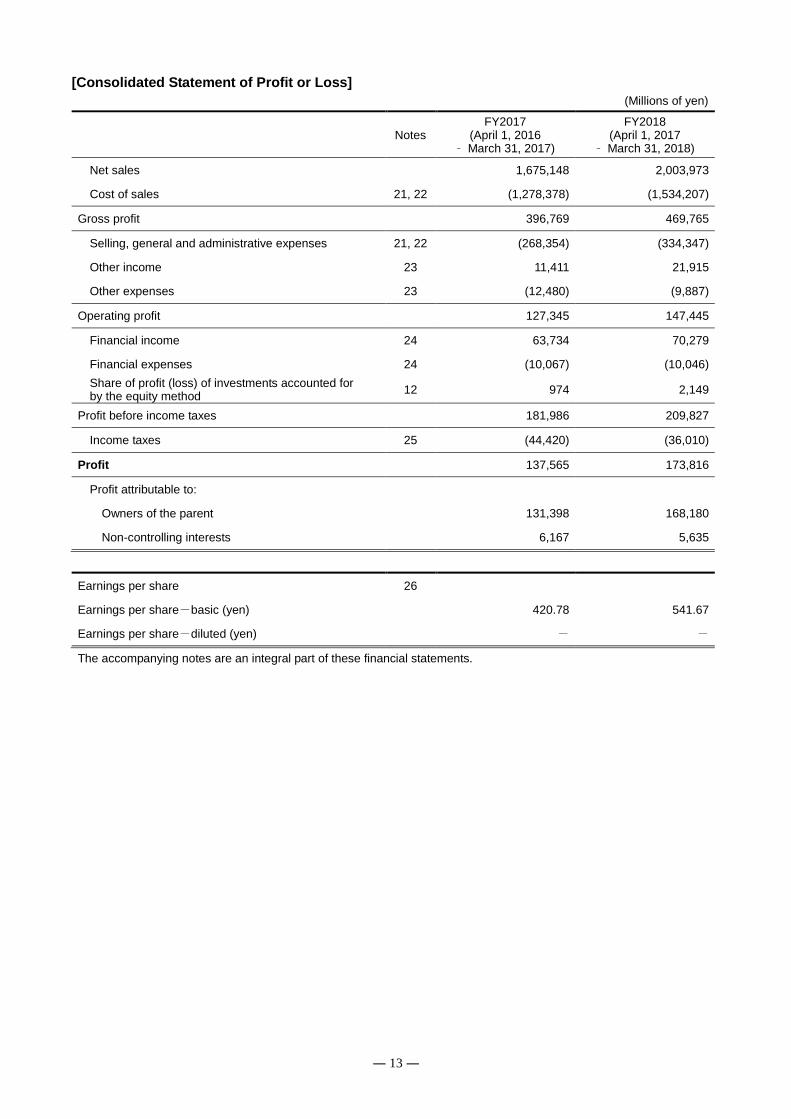
(3) Operating profit
Operating profit for FY2018 was 147.4 billion yen, an increase of 20.1 billion yen, or 16%, from the previous fiscal year.
This was due mainly to increases in sales efforts, promoting cost reduction efforts throughout the Toyota Industries
Group, the impact of exchange rate fluctuations and changes in retirement benefit plan despite increase in raw material
costs and increase in labor costs.
(4) Profit before income taxes
Profit before income taxes amounted to 209.8 billion yen, an increase of 27.9 billion yen, or 15%, from the previous
fiscal year. This was due mainly to dividends income of 65.3 billion yen, an increase of 3.5 billion yen, or 6%, from the
previous fiscal year.
(5) Profit attributable to owners of the parent
Profit attributable to owners of the parent totaled 168.1 billion yen, an increase of 36.8 billion yen, or 28%, from the
previous fiscal year.
Earnings per share-basic was 541.67 yen compared with 420.78 yen in the previous fiscal year.
2. Consolidated Financial Condition
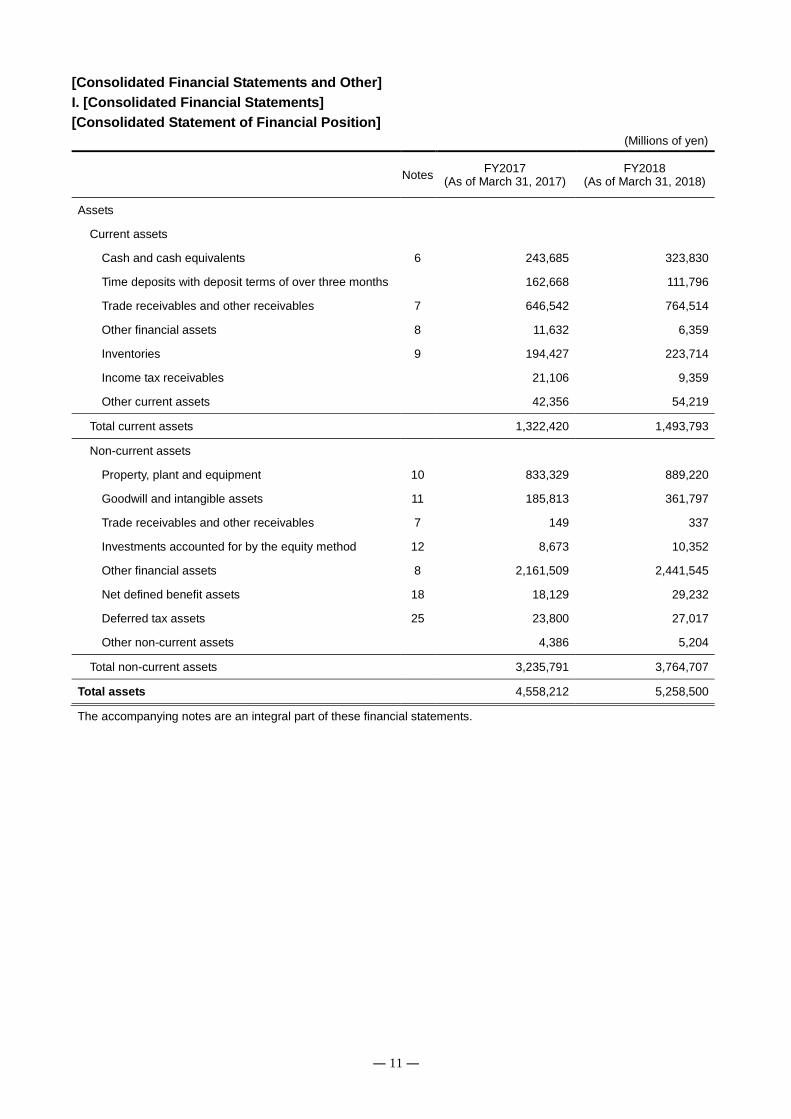
Total assets amounted to 5,258.5 billion yen, an increase of 700.3 billion yen from the end of the previous fiscal year, due
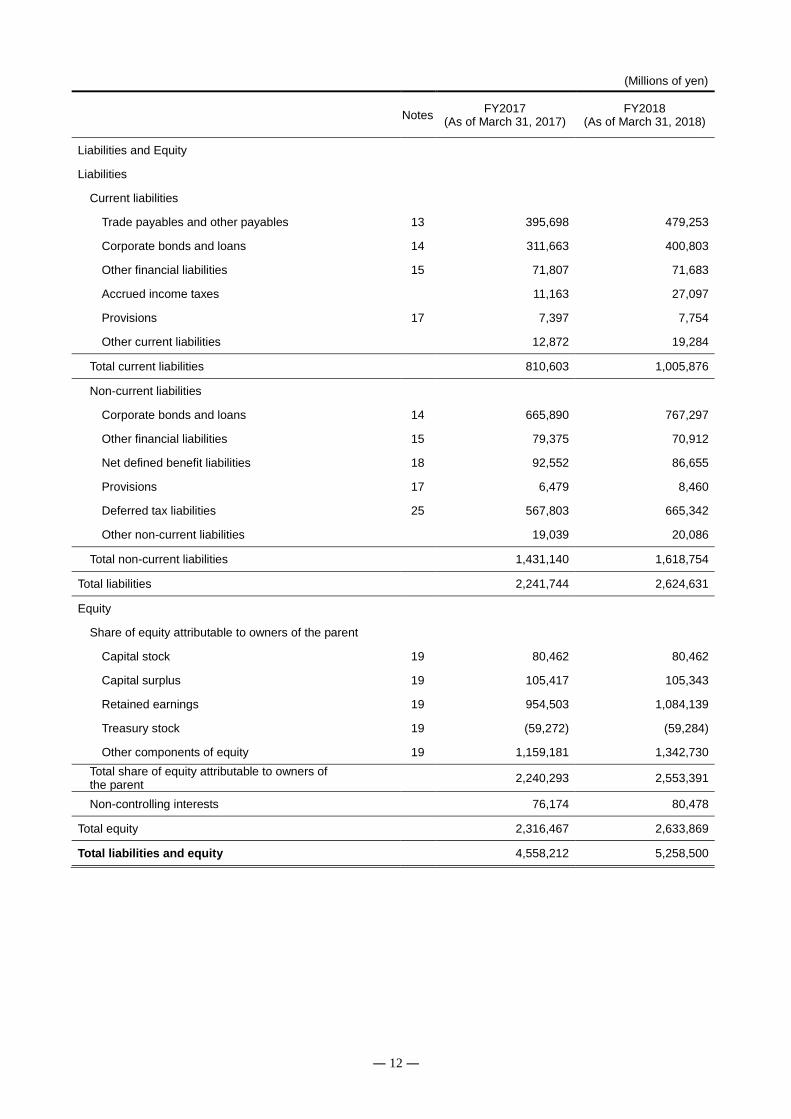
mainly to an increase in market value of investment securities. Liabilities amounted to 2,624.6 billion yen, an increase of
382.9 billion yen from the end of the previous fiscal year, due mainly to an increase in corporate bonds and loans. Equity
amounted to 2,633.8 billion yen, an increase of 317.4 billion yen from the end of the previous fiscal year.
― 5 ―
3. Liquidity and Capital Resources
Toyota Industries' financial policy is to ensure sufficient financing and liquidity for its business activities and to maintain
strong consolidated financial position. Currently, funds for capital investments and other long-term capital needs are
provided from retained earnings and long-term debt, and working capital needs are met through short-term loans. Long-
term debt financing is carried out mainly through issuance of corporate bonds and loans from financial institutions.
Toyota Industries continues to maintain its solid financial condition. Through the use of such current assets as cash and
cash equivalents and short-term investments, as well as free cash flows and funds procured from financial institutions,
Toyota Industries believes that it will be able to provide sufficient funds for the working capital necessary to expand
existing businesses and develop new projects, as well as for future investments.
Regarding fund management, the Company undertakes integrated fund management of its subsidiaries in Japan, while
Toyota Industries North America, Inc. (TINA) and Toyota Industries Finance International AB (TIFI) centrally manage the
funds of subsidiaries in North America and Europe, respectively. Through close cooperation among the Company, TINA
and TIFI, we strive for efficient, unified fund management on a global consolidated basis.
4. Cash Flows
Net cash provided by operating activities were 268.5 billion yen in FY2018, due mainly to posting profit before income
taxes of 209.8 billion yen. Net cash provided by operating activities increased by 29.5 billion yen compared to net cash
provided by operating activities of 239.0 billion yen in the previous fiscal year.
Net cash used in investing activities were 340.3 billion yen in FY2018, attributable primarily to payments for purchases of
property, plant and equipment amounting to 200.1 billion yen. Net cash used in investing activities increased by 253.4
billion yen compared to net cash used in investing activities of 86.9 billion yen in the previous fiscal year.
Net cash provided by financing activities were 153.3 billion yen in FY2018, due mainly to proceeds from issuance of
corporate bonds of 294.5 billion yen. Net cash provided by financing activities increased by 152.6 billion yen compared to
net cash provided by financing activities of 0.7 billion yen in the previous fiscal year.
After adding translation adjustments and cash and cash equivalents at beginning of period, cash and cash equivalents as
of March 31, 2018 stood at 323.8 billion yen, an increase in 80.2 billion yen, or 33%, from the end of the previous fiscal
year.
5. Investment in Property, Plant and Equipment
During FY2018, Toyota Industries made a total investment of 216,048 million yen in property, plant and equipment
(including materials handling equipment for lease) in order to launch new products, streamline and upgrade production
equipment.
In regard to investment in property, plant and equipment by the reporting segments, investment in property, plant and
equipment in Automobile, Materials Handling Equipment, Textile Machinery and Others were 80,726 million yen, 129,741
million yen, 2,366 million yen and 3,214 million yen, respectively.
― 6 ―
6. Strategies and Outlook
Outlook for Results for FY2019
With regard to the future economic outlook, the global economy is expected to continue growing. However, uncertainties
surrounding the business environment preclude optimism, as the impact of trade frictions arising from protectionist policies
in the United States, the future trend in monetary policy in principal countries and geopolitical risks require close
monitoring.
Amid this challenging environment, Toyota Industries will continue to undertake concerted efforts to strengthen its
management platform and raise corporate value.
First of all, we will work to bolster our management platform so that we can respond quickly to rapid changes in the
business environment. Specifically, based on the concept of quality first, we aim to build a stronger production foundation
by improving productivity on a global scale. Moreover, we will strive to build a lean corporate structure by thoroughly
eliminating waste, by setting lead times in terms of quality, cost and products throughout our entire global supply chain and
by improving productivity in administrative sections. At the same time, we will strengthen risk management in order to
quickly and accurately respond to changes in world affairs.
In addition to the above measures, we will focus on the timely launch of appealing products demanded by customers
worldwide; improve earnings power by expanding the value chain and strengthening solution proposal capabilities; and
proactively utilize the Internet of Things (IoT), artificial intelligence (AI) and other cutting-edge technologies. Through such
measures, we aim to raise the competitiveness of our businesses. In addition, we will develop our next growth pillars by
promoting strategic technology and product development while also adopting open innovation. To support such business
development, we will continue our efforts to create an organization and workplace climate that enables diverse human
resources to fully demonstrate their abilities and develop personnel who can play active roles in the global arena.
In other areas, Toyota Industries will create a workplace climate that places top priority on safety; ensure thoroughgoing
compliance, including adherence to laws and regulations; and proactively participate in social contribution activities. By
carrying out these initiatives, we aim to broadly meet the trust of society and grow harmoniously with society. With regard
to protection of the global environment, we will undertake Group-wide initiatives toward the realization of "a zero CO2
emission society in 2050".
Through these initiatives, we aim for sustainable growth of each business and strive to support industries and social
foundations around the world and contribute to an enriched lifestyle and comfortable society as described in Vision 2020.
7. Dividend Policy
Toyota Industries intends to meet the expectations of shareholders for continuous dividends while giving full consideration
to business performance, funding requirements, the dividend payout ratio and other factors.
Toyota Industries' Ordinary General Meeting of Shareholders, held on June 12, 2018, approved a year-end cash dividend
of 80.0 yen per share. Including the interim cash dividend of 70.0 yen per share, cash dividends for the year totaled 150.0
yen per share.
Toyota Industries will use retained earnings to improve the competitiveness of its products, augment production capacity in
Japan and outside Japan, as well as to expand into new fields of business and strengthen its corporate constitution in
securing future profits for its shareholders.
The Company's Articles of Incorporation stipulate that it may pay interim cash dividends as prescribed in Article 454-5 of
the Companies Act and it is the Company's basic policy to pay dividends from retained earnings twice a year (interim and
year-end).
The Company's Articles of Incorporation also stipulate that what is prescribed in Article 459-1 of the Companies Act can be
― 7 ―
added to the Articles of Incorporation. As the Company's policy, discretion to pay interim cash dividends is determined by
the Board of Directors while payment of year-end cash dividends is subject to approval at the Ordinary General Meeting of
Shareholders.
8. Risk Information
The following represent risks that could have a material impact on Toyota Industries' financial condition, business results
and share prices. Toyota Industries judged the following as future risks as of March 31, 2018.
(1) Principal Customers
Toyota Industries' automobile and engine products are sold primarily to Toyota Motor Corporation ("TMC"). In FY2018,
net sales to TMC accounted for 9.3% of consolidated net sales. Therefore, TMC's vehicle sales could have an impact
on Toyota Industries' business results. As of March 31, 2018, TMC holds 24.7% of the Company's voting rights.
(2) Product Development Capabilities
Based on the concept of "developing appealing new products", Toyota Industries proactively develops new products by
utilizing its leading-edge technologies, as it strives to anticipate increasingly sophisticated and diversifying needs of the
market and ensure the satisfaction of its customers.
R&D activities are focused mainly on developing and upgrading products in current business fields and peripheral
sectors. Toyota Industries expects that revenues derived from these fields will continue to account for a significant
portion of total revenues and anticipates that future growth will be contingent on the development and sales of new
products in these fields. Toyota Industries believes that it can continue to develop appealing new products. However,
Toyota Industries may not be able to forecast market needs and develop and introduce appealing new products in a
timely manner. This could result in lower future growth and have an adverse impact on Toyota Industries' financial
condition and business results.
Such a situation could result from risks that include there is no assurance that Toyota Industries will be able to allocate
sufficient future funds necessary for the development of appealing new products; no assurance that product sales will
be successful, as forecasts of products supported by the market may not always be accurate; and no assurance that
newly developed products and technologies will always be protected as intellectual property.
(3) Intellectual Property Rights
In undertaking its business activities, Toyota Industries has acquired numerous intellectual property rights, including
those acquired outside Japan, such as patents related to its products, product designs and manufacturing methods.
However, not all patents submitted will necessarily be registered as rights, and these patents could thus be rejected by
patent authorities or invalidated by third parties. Also, a third party could circumvent a patent of Toyota Industries and
introduce a competing product into the market. Moreover, Toyota Industries' products utilize a wide range of
technologies. Therefore, Toyota Industries could become a party subject to litigation involving the intellectual property
rights of a third party.
(4) Product Defects
Guided by the basic philosophy of "offering products and services that are clean, safe and of high quality", Toyota
Industries makes its utmost efforts to enhance quality.
However, Toyota Industries cannot guarantee all its products will be defect-free and that product recalls will not be
made in the future. Product defects that could lead to large-scale recalls and product liability indemnities could result in
large cost burdens and have a significant negative impact on the evaluation of Toyota Industries. It could also have an
adverse effect on Toyota Industries' financial condition and business results due to a decrease in sales, deterioration of
profitability and decrease in share prices of Toyota Industries.
― 8 ―
(5) Price Competition
Toyota Industries faces extremely harsh competition in each of the industries in which it conducts business, including
its Automobile and Materials Handling Equipment businesses, which are the core of Toyota Industries' earnings
foundation. Toyota Industries believes it offers high value-added products that are unrivalled in terms of technology,
quality and cost.
Amid an environment characterized by intensifying price competition, however, Toyota Industries may be unable to
maintain or increase market share against low-cost competitors or to maintain profitability. This could have an adverse
impact on Toyota Industries' financial condition and business results.
(6) Reliance on Suppliers of Raw Materials and Components
Toyota Industries' products rely on various raw materials and components from suppliers outside Toyota Industries.
Toyota Industries has concluded basic business contracts with these external suppliers and assumes it can carry out
stable transactions for raw materials and components. However, Toyota Industries has no assurances against future
shortages of raw materials and components, which arise from a global shortage due to tight supply or an unforeseen
accident involving a supplier. Such shortages could have a negative effect on Toyota Industries' production and cause
an increase in costs, which could have an adverse impact on Toyota Industries' financial condition and business results.
(7) Environmental Regulations
In view of its social responsibilities as a company, Toyota Industries strives to reduce any burden on the environment
resulting from its production processes, as well as strictly adheres to applicable environmental laws and regulations.
However, various environmental regulations could also be revised and strengthened in the future. Accordingly, any
expenses necessary for continuous strict adherence to these environmental regulations could result in increased
business costs and have an adverse impact on Toyota Industries' financial condition and business results.
(8) Alliances with Other Companies
Aiming to expand its businesses, Toyota Industries engages in joint activities with other companies through alliances
and joint ventures. However, a wildly fluctuating market trend or a disagreement between Toyota Industries and its
partners, owing to business, financial or other reasons, could prevent Toyota Industries from deriving the intended
benefits of its alliances.
(9) Exchange Rate Fluctuations
Toyota Industries' businesses encompass the production and sales of products and the provision of services worldwide.
Generally, the strengthening of the yen against other currencies (especially against the U.S. dollar and the euro, which
account for a significant portion of Toyota Industries' sales) has an adverse impact on Toyota Industries' business, while
a weakening of the yen has a favorable impact. As such, in the businesses in which the Toyota Industries manufactures
products in Japan and exports them, the strengthening of the yen could reduce Toyota Industries' relative price
competitiveness on a global basis and have an adverse impact on Toyota Industries' financial condition and business
results.
(10) Share Price Fluctuations
Toyota Industries holds marketable securities, and therefore bears the risk of price fluctuations of these shares. Based
on fair market value of these shares at the end of the fiscal year under review, Toyota Industries had unrealized gains.
However, unrealized gains on marketable securities could worsen depending on future share price movements.
Additionally, a fall in share prices could reduce the value of pension assets, leading to an increase in the pension
shortfall.

― 9 ―
(11) Effects of Disasters, Power Blackouts and Other Incidents
Toyota Industries carries out regular checks and inspections of its production facilities to minimize the effect of
production breakdown. However, there is no assurance Toyota Industries can completely prevent or lessen the impact
of man-made or natural disasters and power blackouts occurring at Toyota Industries' and its suppliers' production
facilities. Specifically, the majority of Toyota Industries' domestic production facilities and most of its business partners
are situated in the Chubu region. Therefore, major disasters in this region could delay or stop production or shipment
activities. Such prolonged delays and stoppages could have an adverse impact on Toyota Industries' financial
condition and business results.
(12) Latent Risks Associated with International Activities
Toyota Industries manufactures and sells products and provides services in various countries. Such unforeseen
factors as social chaos, including political disruptions, terrorism and wars, as well as changes in economic conditions,
could have an adverse impact on Toyota Industries' financial condition and business results.
(13) Post-employment benefits
Toyota Industries' defined benefit plan expenses and liabilities are calculated based on actuarial assumptions that
incorporate discount rates and other factors. Therefore, differences between actual results and assumptions, such as
a reduction in discount rates or a decrease in plan assets, as well as changes in the assumptions could have a
significant impact on recognized expenses and calculated liabilities in future accounting periods.
9. Significant Contract Agreements
There are no material significant contract agreements that need to be disclosed as of the end of fiscal year ended March
31, 2018.
10. Information regarding differences in major items pertaining to the overview of operating results
The differences in major items pertaining to the overview of operating results for the consolidated financial statements
prepared in accordance with IFRS and for consolidated financial statements prepared in accordance with Generally
Accepted Accounting Principles in Japan ("Japanese GAAP") are as follows.
(1) Net amounts of supply-for-a-fee transactions
Regarding supply-for-a-fee transactions, net sales and cost of sales were recorded at the time of repurchase under
Japanese GAAP; under IFRS, on the other hand, only net amounts of machining fee equivalents are recognized as
revenue. As a result, net sales decreased 570,974 million yen and cost of sales decreased 570,974 million yen for the
fiscal year ended March 31, 2018.
(2) Goodwill
Goodwill was amortized principally over less than 20 years on a straight-line basis under Japanese GAAP; under IFRS,
on the other hand, it has not been amortized since the transition date, while an impairment test is conducted for every
period. As a result, selling, general and administrative expenses decreased 10,290 million yen for the fiscal year ended
March 31, 2018.
11. Toyota Industries' Relationship to Toyota Motor Corporation
Due to historical reasons, Toyota Industries maintains close relationships with Toyota Motor Corporation ("TMC") and
Toyota Group companies in terms of capital and business dealings.
(1) Historical Background
In 1933, Kiichiro Toyoda, the eldest son of founder Sakichi Toyoda and then Managing Director of Toyoda Automatic
Loom Works, Ltd. (the present Toyota Industries), established the Automobile Department within the Company based
― 10 ―
on his resolve to manufacture Japanese-made automobiles. In 1937, the Automobile Department was spun off and
became an independent company, Toyota Motor Co., Ltd. (the present TMC).
(2) Capital Relationship
In light of this historical background, Toyota Industries and TMC have maintained a close capital relationship. As of
March 31, 2018, Toyota Industries holds 7.85% (232,037 thousand shares) of TMC's total shares in issue. Likewise, as
of the same date, TMC holds 24.67% of Toyota Industries' total voting rights. Toyota Industries is a TMC affiliate
accounted for by the equity method.
(3) Business Relationship
Toyota Industries assembles certain cars and produces automobile engines under consignment from TMC. Additionally,
Toyota Industries sells a portion of its other components and products directly or indirectly to other Toyota Group
companies. In FY2018, our net sales to TMC on a stand-alone basis accounted for 9.3% of our consolidated net sales.
(4) Contributions to the Toyota Group
As a member of the Toyota Group, Toyota Industries aims to contribute to strengthening the competitiveness of TMC
and other Toyota Group companies in such areas as quality, cost, delivery and technologies. Toyota Industries is
confident that raising the Toyota Group's competitiveness will lead to increases in sales to and profits from the Toyota
Group, thereby contributing to raising Toyota Industries' corporate value.
― 11 ―
[Consolidated Financial Statements and Other]
I. [Consolidated Financial Statements]
[Consolidated Statement of Financial Position]
(Millions of yen)
Notes FY2017
(As of March 31, 2017) FY2018
(As of March 31, 2018)
Assets
Current assets
Cash and cash equivalents 6 243,685 323,830
Time deposits with deposit terms of over three months 162,668 111,796
Trade receivables and other receivables 7 646,542 764,514
Other financial assets 8 11,632 6,359
Inventories 9 194,427 223,714
Income tax receivables 21,106 9,359
Other current assets 42,356 54,219
Total current assets 1,322,420 1,493,793
Non-current assets
Property, plant and equipment 10 833,329 889,220
Goodwill and intangible assets 11 185,813 361,797
Trade receivables and other receivables 7 149 337
Investments accounted for by the equity method 12 8,673 10,352
Other financial assets 8 2,161,509 2,441,545
Net defined benefit assets 18 18,129 29,232
Deferred tax assets 25 23,800 27,017
Other non-current assets 4,386 5,204
Total non-current assets 3,235,791 3,764,707
Total assets 4,558,212 5,258,500
The accompanying notes are an integral part of these financial statements.
― 12 ―
(Millions of yen)
Notes FY2017
(As of March 31, 2017) FY2018
(As of March 31, 2018)
Liabilities and Equity
Liabilities
Current liabilities
Trade payables and other payables 13 395,698 479,253
Corporate bonds and loans 14 311,663 400,803
Other financial liabilities 15 71,807 71,683
Accrued income taxes 11,163 27,097
Provisions 17 7,397 7,754
Other current liabilities 12,872 19,284
Total current liabilities 810,603 1,005,876
Non-current liabilities
Corporate bonds and loans 14 665,890 767,297
Other financial liabilities 15 79,375 70,912
Net defined benefit liabilities 18 92,552 86,655
Provisions 17 6,479 8,460
Deferred tax liabilities 25 567,803 665,342
Other non-current liabilities 19,039 20,086
Total non-current liabilities 1,431,140 1,618,754
Total liabilities 2,241,744 2,624,631
Equity
Share of equity attributable to owners of the parent
Capital stock 19 80,462 80,462
Capital surplus 19 105,417 105,343
Retained earnings 19 954,503 1,084,139
Treasury stock 19 (59,272) (59,284)
Other components of equity 19 1,159,181 1,342,730
Total share of equity attributable to owners of the parent
2,240,293 2,553,391
Non-controlling interests 76,174 80,478
Total equity 2,316,467 2,633,869
Total liabilities and equity 4,558,212 5,258,500
― 13 ―
[Consolidated Statement of Profit or Loss]
(Millions of yen)
Notes FY2017
(April 1, 2016 – March 31, 2017)
FY2018 (April 1, 2017
– March 31, 2018)
Net sales 1,675,148 2,003,973
Cost of sales 21, 22 (1,278,378) (1,534,207)
Gross profit 396,769 469,765
Selling, general and administrative expenses 21, 22 (268,354) (334,347)
Other income 23 11,411 21,915
Other expenses 23 (12,480) (9,887)
Operating profit 127,345 147,445
Financial income 24 63,734 70,279
Financial expenses 24 (10,067) (10,046)
Share of profit (loss) of investments accounted for by the equity method
12 974 2,149
Profit before income taxes 181,986 209,827
Income taxes 25 (44,420) (36,010)
Profit 137,565 173,816
Profit attributable to:
Owners of the parent 131,398 168,180
Non-controlling interests 6,167 5,635
Earnings per share 26
Earnings per share-basic (yen) 420.78 541.67
Earnings per share-diluted (yen) - -
The accompanying notes are an integral part of these financial statements.

― 14 ―
[Consolidated Statement of Comprehensive Income]
(Millions of yen)
Notes FY2017
(April 1, 2016 – March 31, 2017)
FY2018 (April 1, 2017
– March 31, 2018)
Profit 137,565 173,816
Other comprehensive income:
Items not to be reclassified into profit or loss
Net changes in revaluation of FVTOCI financial assets
27, 29 77,802 184,278
Remeasurements of defined benefit plans 18, 27 4,862 3,629
Other comprehensive income of affiliates accounted for by the equity method
12, 27 21 (4)
Total items not to be reclassified into profit or loss 82,686 187,903
Items that can be reclassified into profit or loss
Translation adjustments of foreign operations 27 (18,913) (1,564)
Cash flow hedges 27, 29 1,242 1,419
Other comprehensive income of affiliates accounted for by the equity method
12, 27 162 24
Total items that can be reclassified into profit or loss (17,509) (120)
Total other comprehensive income 65,177 187,782
Comprehensive income 202,743 361,599
Total comprehensive income attributable to:
Owners of the parent 197,355 355,101
Non-controlling interests 5,387 6,497
The accompanying notes are an integral part of these financial statements.
― 15 ―
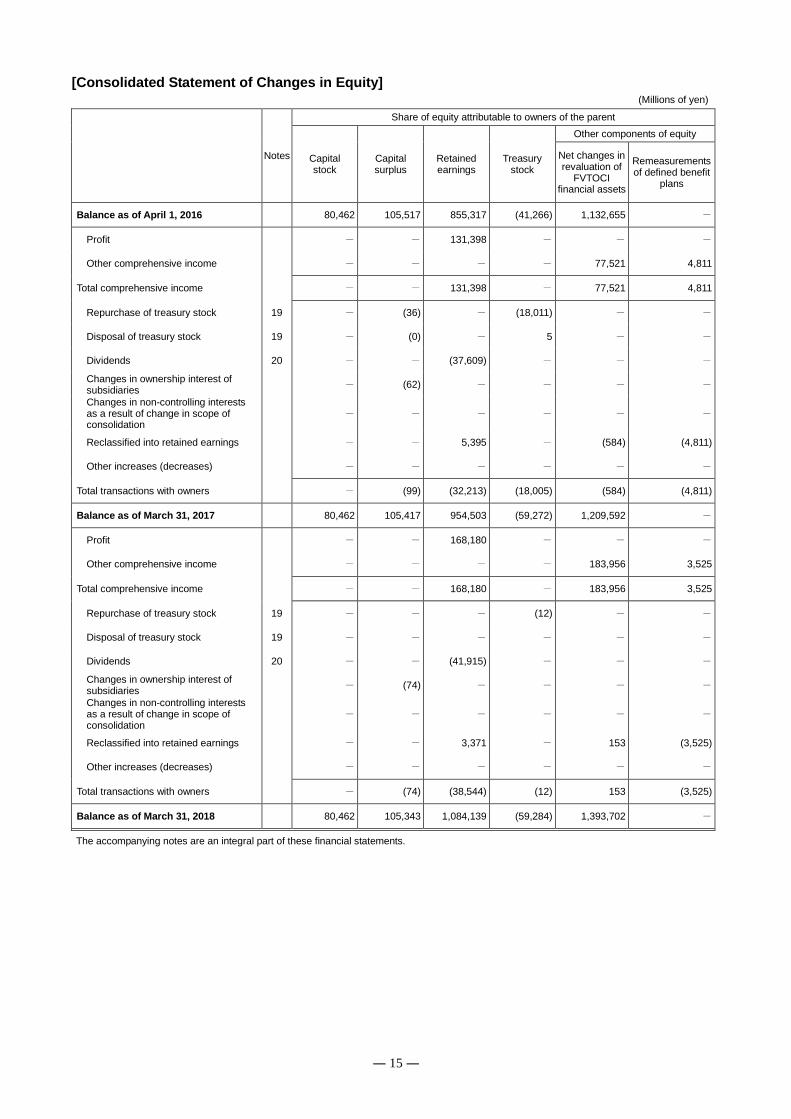
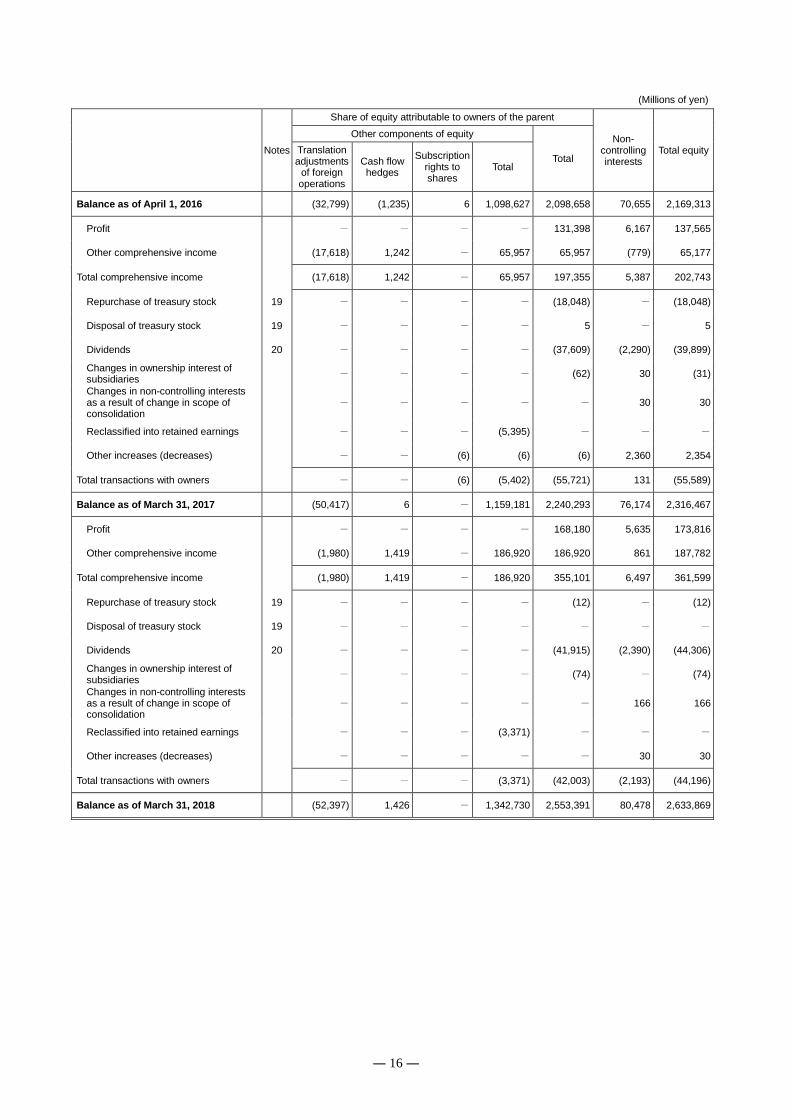
[Consolidated Statement of Changes in Equity]
(Millions of yen)
Notes
Share of equity attributable to owners of the parent
Capital stock
Capital surplus
Retained earnings
Treasury stock
Other components of equity
Net changes in revaluation of
FVTOCI financial assets
Remeasurements of defined benefit
plans
Balance as of April 1, 2016 80,462 105,517 855,317 (41,266) 1,132,655 -
Profit - - 131,398 - - -
Other comprehensive income - - - - 77,521 4,811
Total comprehensive income - - 131,398 - 77,521 4,811
Repurchase of treasury stock 19 - (36) - (18,011) - -
Disposal of treasury stock 19 - (0) - 5 - -
Dividends 20 - - (37,609) - - -
Changes in ownership interest of subsidiaries
- (62) - - - -
Changes in non-controlling interests as a result of change in scope of consolidation
- - - - - -
Reclassified into retained earnings - - 5,395 - (584) (4,811)
Other increases (decreases) - - - - - -
Total transactions with owners - (99) (32,213) (18,005) (584) (4,811)
Balance as of March 31, 2017 80,462 105,417 954,503 (59,272) 1,209,592 -
Profit - - 168,180 - - -
Other comprehensive income - - - - 183,956 3,525
Total comprehensive income - - 168,180 - 183,956 3,525
Repurchase of treasury stock 19 - - - (12) - -
Disposal of treasury stock 19 - - - - - -
Dividends 20 - - (41,915) - - -
Changes in ownership interest of subsidiaries
- (74) - - - -
Changes in non-controlling interests as a result of change in scope of consolidation
- - - - - -
Reclassified into retained earnings - - 3,371 - 153 (3,525)
Other increases (decreases) - - - - - -
Total transactions with owners - (74) (38,544) (12) 153 (3,525)
Balance as of March 31, 2018 80,462 105,343 1,084,139 (59,284) 1,393,702 -
The accompanying notes are an integral part of these financial statements.
― 16 ―
(Millions of yen)
Notes
Share of equity attributable to owners of the parent
Non-controlling interests
Total equity
Other components of equity
Total Translation adjustments
of foreign operations
Cash flow hedges
Subscription rights to shares
Total
Balance as of April 1, 2016 (32,799) (1,235) 6 1,098,627 2,098,658 70,655 2,169,313
Profit - - - - 131,398 6,167 137,565
Other comprehensive income (17,618) 1,242 - 65,957 65,957 (779) 65,177
Total comprehensive income (17,618) 1,242 - 65,957 197,355 5,387 202,743
Repurchase of treasury stock 19 - - - - (18,048) - (18,048)
Disposal of treasury stock 19 - - - - 5 - 5
Dividends 20 - - - - (37,609) (2,290) (39,899)
Changes in ownership interest of subsidiaries
- - - - (62) 30 (31)
Changes in non-controlling interests as a result of change in scope of consolidation
- - - - - 30 30
Reclassified into retained earnings - - - (5,395) - - -
Other increases (decreases) - - (6) (6) (6) 2,360 2,354
Total transactions with owners - - (6) (5,402) (55,721) 131 (55,589)
Balance as of March 31, 2017 (50,417) 6 - 1,159,181 2,240,293 76,174 2,316,467
Profit - - - - 168,180 5,635 173,816
Other comprehensive income (1,980) 1,419 - 186,920 186,920 861 187,782
Total comprehensive income (1,980) 1,419 - 186,920 355,101 6,497 361,599
Repurchase of treasury stock 19 - - - - (12) - (12)
Disposal of treasury stock 19 - - - - - - -
Dividends 20 - - - - (41,915) (2,390) (44,306)
Changes in ownership interest of subsidiaries
- - - - (74) - (74)
Changes in non-controlling interests as a result of change in scope of consolidation
- - - - - 166 166
Reclassified into retained earnings - - - (3,371) - - -
Other increases (decreases) - - - - - 30 30
Total transactions with owners - - - (3,371) (42,003) (2,193) (44,196)
Balance as of March 31, 2018 (52,397) 1,426 - 1,342,730 2,553,391 80,478 2,633,869
― 17 ―
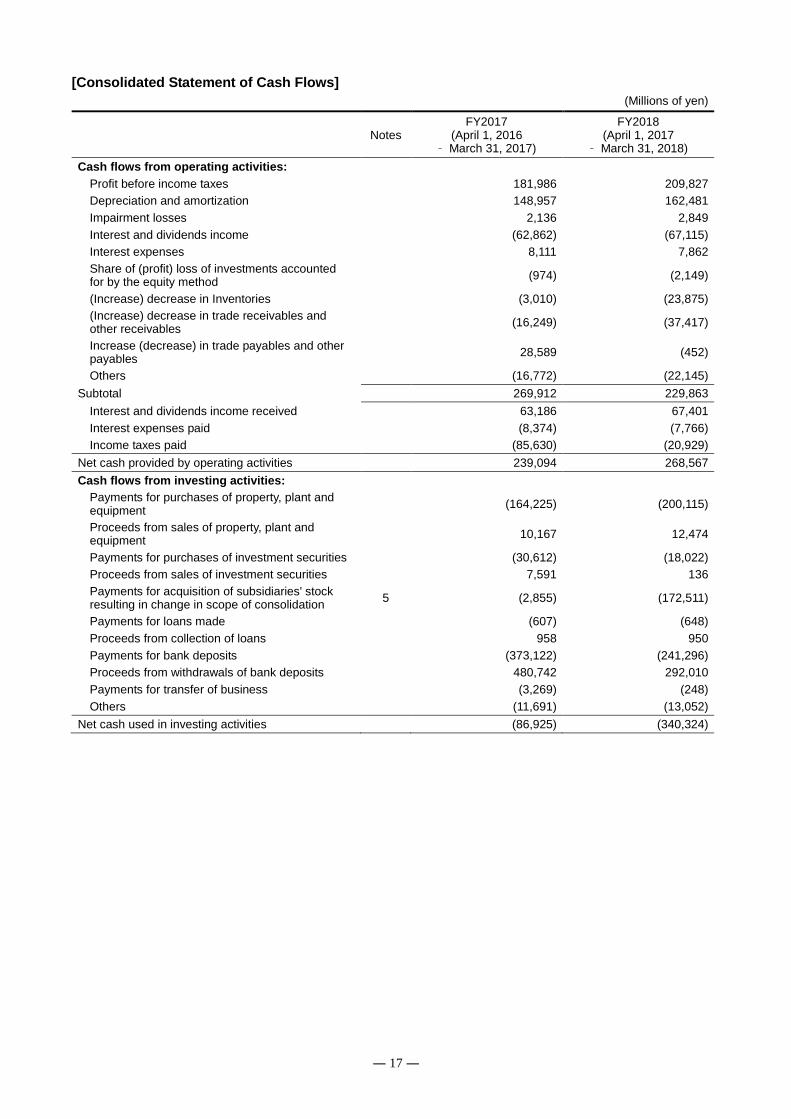
[Consolidated Statement of Cash Flows]
(Millions of yen)
Notes FY2017
(April 1, 2016 – March 31, 2017)
FY2018 (April 1, 2017
– March 31, 2018)
Cash flows from operating activities:
Profit before income taxes 181,986 209,827
Depreciation and amortization 148,957 162,481
Impairment losses 2,136 2,849
Interest and dividends income (62,862) (67,115)
Interest expenses 8,111 7,862
Share of (profit) loss of investments accounted for by the equity method
(974) (2,149)
(Increase) decrease in Inventories (3,010) (23,875)
(Increase) decrease in trade receivables and other receivables
(16,249) (37,417)
Increase (decrease) in trade payables and other payables
28,589 (452)
Others (16,772) (22,145)
Subtotal 269,912 229,863
Interest and dividends income received 63,186 67,401
Interest expenses paid (8,374) (7,766)
Income taxes paid (85,630) (20,929)
Net cash provided by operating activities 239,094 268,567
Cash flows from investing activities:
Payments for purchases of property, plant and equipment
(164,225) (200,115)
Proceeds from sales of property, plant and equipment
10,167 12,474
Payments for purchases of investment securities (30,612) (18,022)
Proceeds from sales of investment securities 7,591 136
Payments for acquisition of subsidiaries' stock resulting in change in scope of consolidation
5 (2,855) (172,511)
Payments for loans made (607) (648)
Proceeds from collection of loans 958 950
Payments for bank deposits (373,122) (241,296)
Proceeds from withdrawals of bank deposits 480,742 292,010
Payments for transfer of business (3,269) (248)
Others (11,691) (13,052)
Net cash used in investing activities (86,925) (340,324)
― 18 ―
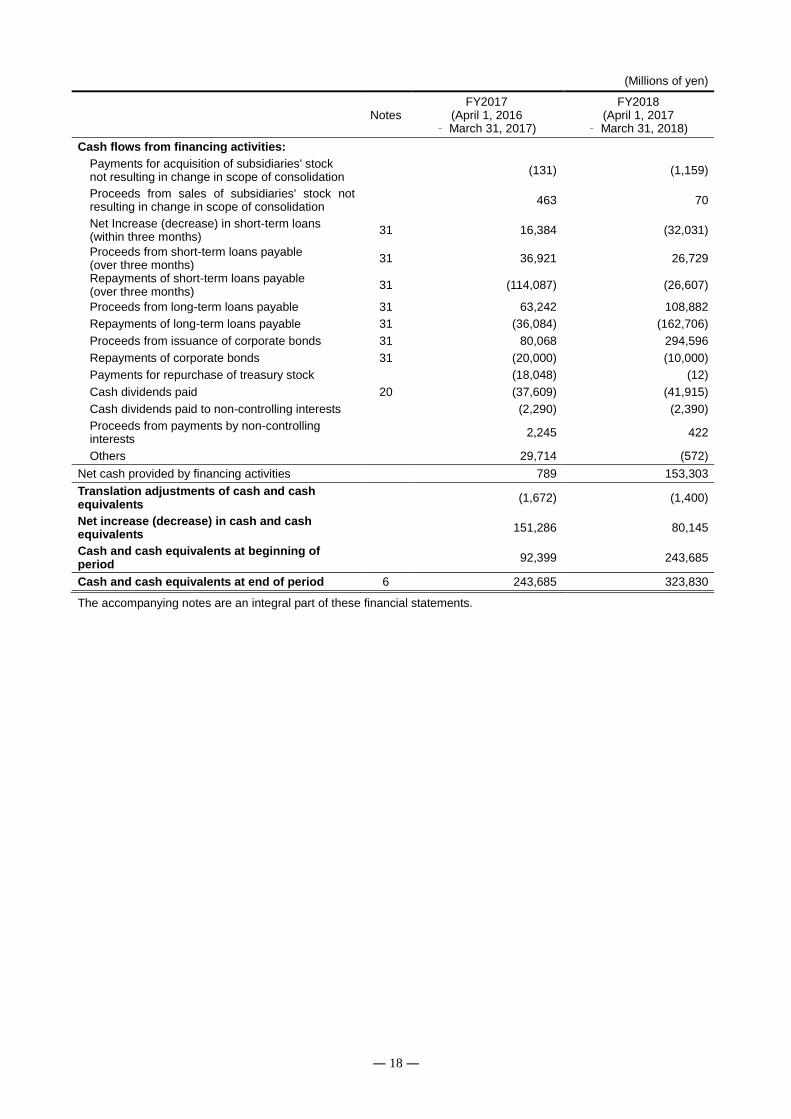
(Millions of yen)
Notes FY2017
(April 1, 2016 – March 31, 2017)
FY2018 (April 1, 2017
– March 31, 2018)
Cash flows from financing activities:
Payments for acquisition of subsidiaries' stock not resulting in change in scope of consolidation
(131) (1,159)
Proceeds from sales of subsidiaries' stock not resulting in change in scope of consolidation
463 70
Net Increase (decrease) in short-term loans (within three months)
31 16,384 (32,031)
Proceeds from short-term loans payable (over three months)
31 36,921 26,729
Repayments of short-term loans payable (over three months)
31 (114,087) (26,607)
Proceeds from long-term loans payable 31 63,242 108,882
Repayments of long-term loans payable 31 (36,084) (162,706)
Proceeds from issuance of corporate bonds 31 80,068 294,596
Repayments of corporate bonds 31 (20,000) (10,000)
Payments for repurchase of treasury stock (18,048) (12)
Cash dividends paid 20 (37,609) (41,915)
Cash dividends paid to non-controlling interests (2,290) (2,390)
Proceeds from payments by non-controlling interests
2,245 422
Others 29,714 (572)
Net cash provided by financing activities 789 153,303
Translation adjustments of cash and cash equivalents
(1,672) (1,400)
Net increase (decrease) in cash and cash equivalents
151,286 80,145
Cash and cash equivalents at beginning of period
92,399 243,685
Cash and cash equivalents at end of period 6 243,685 323,830
The accompanying notes are an integral part of these financial statements.
― 19 ―
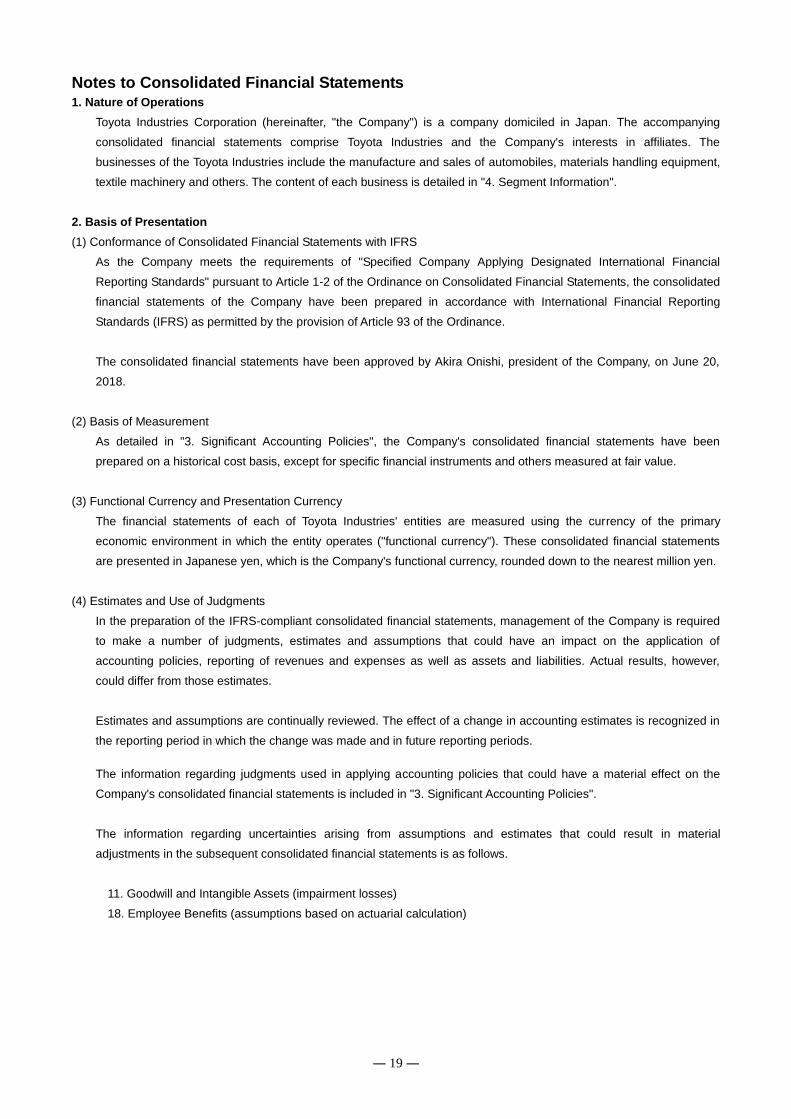
Notes to Consolidated Financial Statements 1. Nature of Operations
Toyota Industries Corporation (hereinafter, "the Company") is a company domiciled in Japan. The accompanying
consolidated financial statements comprise Toyota Industries and the Company's interests in affiliates. The
businesses of the Toyota Industries include the manufacture and sales of automobiles, materials handling equipment,
textile machinery and others. The content of each business is detailed in "4. Segment Information".
2. Basis of Presentation
(1) Conformance of Consolidated Financial Statements with IFRS
As the Company meets the requirements of "Specified Company Applying Designated International Financial
Reporting Standards" pursuant to Article 1-2 of the Ordinance on Consolidated Financial Statements, the consolidated
financial statements of the Company have been prepared in accordance with International Financial Reporting
Standards (IFRS) as permitted by the provision of Article 93 of the Ordinance.
The consolidated financial statements have been approved by Akira Onishi, president of the Company, on June 20,
2018.
(2) Basis of Measurement
As detailed in "3. Significant Accounting Policies", the Company's consolidated financial statements have been
prepared on a historical cost basis, except for specific financial instruments and others measured at fair value.
(3) Functional Currency and Presentation Currency
The financial statements of each of Toyota Industries' entities are measured using the currency of the primary
economic environment in which the entity operates ("functional currency"). These consolidated financial statements
are presented in Japanese yen, which is the Company's functional currency, rounded down to the nearest million yen.
(4) Estimates and Use of Judgments
In the preparation of the IFRS-compliant consolidated financial statements, management of the Company is required
to make a number of judgments, estimates and assumptions that could have an impact on the application of
accounting policies, reporting of revenues and expenses as well as assets and liabilities. Actual results, however,
could differ from those estimates.
Estimates and assumptions are continually reviewed. The effect of a change in accounting estimates is recognized in
the reporting period in which the change was made and in future reporting periods.
The information regarding judgments used in applying accounting policies that could have a material effect on the
Company's consolidated financial statements is included in "3. Significant Accounting Policies".
The information regarding uncertainties arising from assumptions and estimates that could result in material
adjustments in the subsequent consolidated financial statements is as follows.
11. Goodwill and Intangible Assets (impairment losses)
18. Employee Benefits (assumptions based on actuarial calculation)

― 20 ―
(5) Changes in presentation
(Consolidated Statement of Financial Position)
In prior periods, "Advances received" were presented in "Other current liabilities" of "Current liabilities". In the fiscal
year ended March 31, 2018, a change was made and "Advances received" is now presented in "Trade payables and
other payables" of "Current liabilities".
This change was made in order to present the results of sales activities by Toyota Industries in response to the
increased amount of advances received related to construction contracts as a result of the consolidation of Bastian
Solutions LLC in April 2017 and Vanderlande Industries Holding B.V. in May 2017. To reflect the change in
presentation, 8,365 million yen previously presented in "Other current liabilities" of "Current liabilities" in the
consolidated statement of financial position for the fiscal year ended March 31, 2017 has been reclassified into "Trade
payables and other payables" of "Current liabilities".
In addition, "Time deposits with deposit terms of over three months", which were included in "Other financial assets" of
"Current assets", are now presented separately from the fiscal year ended March 31, 2018.
This change is intended to make the presentation clearer and easier to understand for users of the consolidated
financial statements. To reflect this change in presentation, 162,668 million yen previously presented in "Other
financial assets" of "Current assets" in the consolidated statement of financial position for the fiscal year ended March
31, 2017 has been reclassified into "Time deposits with deposit terms of over three months" of "Current assets".
(6) Early Adoption of New Accounting Standards
Toyota Industries has early adopted IFRS 9 "Financial Instruments" (revised in July 2014).
(7) Accounting Standards and Interpretations Not Yet Adopted by the Company
The principal accounting standards and interpretations issued or amended prior to the approval date of the
consolidated financial statements that are not yet adopted by Toyota Industries as of the reporting date are as follows.
The potential impact of adopting IFRS 15 "Revenue from Contracts with Customers" on its financial position and
business performance is immaterial. Toyota Industries is currently evaluating the potential impact of adopting IFRS 16
"Leases" on its financial position and business performance, which cannot be estimated as of the reporting date.
IFRS Title
Mandatory effective date
(Fiscal year beginning on or after)
To be adopted by
the Company
Description of standards and amendments
IFRS 15 Revenue from Contracts with Customers
January 1, 2018 FY2019 Accounting transactions and disclosure demand for revenue recognition
IFRS 16 Leases January 1, 2019 FY2020 Accounting transactions and disclosure demand for leases
― 21 ―
3. Significant Accounting Policies
(1) Basis of Consolidation
(i) Business combinations
Business combinations are accounted for using the acquisition method. Goodwill is measured as the difference
between the aggregate of the acquisition-date fair value of the consideration transferred, the amount of any non-
controlling interests in the acquiree and, in a business combination achieved in stages, the acquisition-date fair value
of the acquirer's previously held equity interest in the acquiree, and the net of the acquisition-date amounts of the
identifiable assets acquired and the liabilities assumed. If the difference is negative, it is immediately recognized in
profit or loss. If the initial accounting for a business combination is incomplete by the end of the fiscal year in which
the combination occurs, provisional amounts of incomplete items are measured, which are adjusted during the
measurement period within one year from the date of acquisition. Acquisition-related costs incurred are recognized as
expenses. For intangible assets acquired through a business combination, see "(6) Intangible Assets (iii) Intangible
assets acquired in business combinations". For policy on impairment losses of non-financial assets including goodwill,
see "(15) Impairment Losses (ii) Non-financial assets".
(ii) Subsidiaries
Subsidiaries are entities controlled by the Company. The financial statements of the subsidiaries are consolidated into
those of the Company from the date on which the Company acquires control until the date on which the Company
loses control. Subsidiaries' financial statements are adjusted if their accounting policies differ from those of the
Company. Intra-group balances, transactions and any unrealized gains or losses resulting from intra-group
transactions are eliminated on consolidation. Comprehensive income is attributed to the owners of the parent and to
non-controlling interests, even if this results in the non-controlling interests having a deficit balance. Non-controlling
interests consist of the amount of those interests recognized initially at the date on which the Company acquires
control and the changes in non-controlling interests since the said date.
The consolidated financial statements contain financial statements of subsidiaries whose closing dates differ from that
of the parent as a result of those dates being required by laws of the countries where those subsidiaries reside. For
those subsidiaries, financial statements are prepared as of and years ended for March 31, and used in the
consolidated closing date.
(iii) Affiliates
Affiliates are entities in which Toyota Industries has a significant influence, but not control, over financial and operating
policies. Investments in affiliates are accounted for by the equity method from the date on which the Company
possesses a significant influence until the date on which the Company loses the significant influence.
If accounting policies of affiliates differ from those adopted by Toyota Industries, the Company makes necessary
modifications to align them with those of Toyota Industries.
Under the equity method, the investment is initially measured at cost and is adjusted thereafter for the post-acquisition
change in the Toyota Industries' share of the affiliates' net assets. In doing so, the amount equivalent to Toyota
Industries' share of the affiliates' net assets is recognized in profit or loss of the Group. Also, the amount equivalent to
Toyota Industries' share of the affiliates' other comprehensive income is recognized in other comprehensive income of
Toyota Industries. The amount equivalent to Toyota Industries' share of the affiliates' loss is recognized as a loss until
the amount exceeds the investment (including long-term interests that, in substance, form part of the Toyota
Industries' net investment in that affiliate), and losses in excess of the investment are recognized only to the extent
that Toyota Industries has incurred legal or constructive obligations or made payments on behalf of the affiliate.
Unrealized gains or losses from significant inter-company transactions are eliminated to the extent of Toyota
Industries' share of the equity interest in the affiliate.
Any excess of the cost of acquisition over identifiable assets, liabilities and contingent liabilities of the affiliate at the
date of acquisition is recognized as goodwill and included in the carrying value of the investment, and is not amortized.
― 22 ―
(2) Foreign Currencies
(i) Foreign currency transactions
Foreign currency transactions are converted into the functional currency of Toyota Industries using the exchange rate
prevailing at the transaction date. Monetary assets and liabilities denominated in foreign currencies are converted into
the functional currency using the exchange rate at the end of the reporting period.
Non-monetary assets and liabilities denominated in foreign currencies that are measured at fair value are retranslated
into the functional currency at the spot rate using the exchange rate at the fair value calculation date.
Any exchange difference arising from the retranslation and settlement is recognized in profit or loss of the period.
(ii) Foreign operations
Assets and liabilities of foreign operations including goodwill and fair value adjustments arising from acquisition are
translated at the exchange rates at the end of the reporting period. Income and expenses of foreign operations are
translated at the average exchange rates during the fiscal year, except in cases where exchange rates fluctuate
significantly. If exchange rates fluctuate significantly, the exchange rate at the transaction date is used.
Foreign currency differences from the translation are recognized in other comprehensive income. When a foreign
operation is disposed of or control, significant influence or joint control is lost, the cumulative amount of exchange
differences related to that foreign operation is reclassified to profit or loss as part of the gain or loss on the disposal.
(3) Cash and Cash Equivalents
Cash and cash equivalents are cash on hand, readily available deposits and short-term highly liquid and low risk
investments with maturities not exceeding three months at the time of purchase.
(4) Inventories
Inventories are stated at the lower of cost or net realizable value. Cost of inventories includes purchase costs,
processing costs and all other costs incurred in bringing them to their existing location and condition, and is calculated
primarily using the moving average method.
Net realizable value is the estimated selling price in the ordinary course of business less the estimated costs of
completion and the estimated costs necessary to sell.
(5) Property, Plant and Equipment
Property, plant and equipment are measured using the cost model and stated at cost less accumulated depreciation
and accumulated impairment losses.
Estimated useful lives and the method of depreciation are reviewed at the fiscal year-end. Changes in estimated
useful lives or depreciation methods are accounted for on a prospective basis as a change in accounting estimate.
Property, plant and equipment, excluding land and construction in progress, are depreciated on a straight-line basis
over their estimated useful lives. Leased assets are depreciated over the shorter of the lease term or their estimated
useful lives, unless it is reasonably certain that Toyota Industries will acquire ownership by expiration of the lease term.
The estimated useful lives for major classes of assets are as follows.
Buildings and structures: 5 to 60 years
Machinery and vehicles: 3 to 22 years
An item of property, plant and equipment is derecognized on disposal or when it is withdrawn from use and no future
economic benefits are expected from its disposal. Any gain or loss arising from derecognition of an item of property,
plant and equipment is included in profit or loss when it is derecognized.
For the policy on impairment of property, plant and equipment, see "(15) Impairment Losses (ii) Non-financial assets".
― 23 ―
(6) Intangible Assets
Intangible assets are measured using the cost model and stated at cost less accumulated depreciation and
accumulated impairment losses.
(i) Intangible assets acquired separately
Intangible assets acquired separately with finite useful lives are carried at cost less accumulated amortization and
accumulated impairment losses.
Intangible assets acquired separately with indefinite useful lives are carried at cost less accumulated impairment
losses, without being amortized but tested for impairment, in the same way as goodwill.
(ii) Internally generated intangible assets
Expenditure on research is recognized as an expense in the consolidated statements of profit or loss in the fiscal
year in which it is incurred.
An intangible asset arising from development (or from the development phase of an internal project) is recognized
if, and only if, all of the following can be demonstrated:
a) the technical feasibility of completing the intangible asset so that it will be available for use or sale
b) its intention to complete the intangible asset and use or sell it
c) its ability to use or sell the intangible asset
d) how the intangible asset will generate probable future economic benefits
e) the availability of adequate technical, financial and other resources to complete development and to use or
sell the intangible asset
f) its ability to measure reliably the expenditure attributable to the intangible asset during its development
The cost of an internally generated intangible asset is the sum of expenditure incurred from the date when the
intangible asset first meets the recognition criteria above to the completion of its development. If an internally
generated asset is not recognized, a development cost is recognized as an expense in the consolidated
statements of profit or loss in the fiscal year in which it is incurred.
After initial recognition, an internally generated intangible assets are carried at cost less accumulated amortization
and accumulated impairment losses.
(iii) Intangible assets acquired in business combinations
The cost of intangible assets acquired in a business combination is measured at fair value at the acquisition date.
After initial recognition, intangible assets acquired in a business combination are carried at cost less accumulated
amortization and accumulated impairment losses.
(iv) Amortization of intangible assets
Intangible assets with finite useful lives are amortized on a straight-line basis over their estimated useful lives. The
estimated useful lives of major classes of assets are as follows.
・Software: 3 to 5 years
・Development assets: 2 to 10 years
Estimated useful lives and amortization methods are reviewed at each reporting date, and any revisions are
applied as revisions to accounting estimates prospectively.
― 24 ―
(v) Derecognition of intangible assets
An item of intangible assets is derecognized on disposal or when it is withdrawn from use and no future economic
benefits are expected from its disposal. Any gain or loss arising from derecognition of an item of intangible assets
is included in profit or loss when it is derecognized.
For policies on impairment of intangible assets, see "(15) Impairment Losses (ii) Non-financial assets".
(7) Leases
Toyota Industries determines whether or not a contract contains a lease based on the substance of such contract by
examining whether the performance of the contract relies on using specific assets or an asset group and whether the
contract gives the right to use the asset.
Contracts containing leases are classified as finance leases whenever substantially all risks and economic values
incidental to the ownership of assets are transferred to the lessee, and other leases are classified as operating leases.
(i) Leases as lessee
Finance leases are recorded as an asset and a liability at the lower of the fair value of the asset and the present
value of the minimum lease payments on the consolidated statements of financial position, as calculated at
commencement of the lease term. Lease assets are depreciated on a straight-line basis based on accounting
policies applied to the assets. Financial expenses are allocated to each period over the lease term so that the
interest rate will be proportional to the liability balance.
Payments under operating leases are recognized on a straight-line basis over the period of the lease.
(ii) Leases as lessor
An investment asset held under a financial lease is recorded as a receivable at an amount equal to the net
investment in the lease. If Toyota Industries is a manufacturer or distributor lessor in a lease, selling profit or loss in
a financial lease is recognized in accordance with the accounting policy it follows for sales of goods (see "(12)
Profits"). Financial income is recognized from commencement of the lease term based on the effective interest
method. If Toyota Industries is not a manufacturer or distributor lessor in a lease, financial income is recognized
from commencement of the lease term based on the effective interest method. The interest rate implicit in the
lease is the discount rate that causes the aggregate present value of the minimum lease payments receivable and
the unguaranteed residual value to be equal to the sum of the fair value of the leased asset and any initial direct
costs.
Income from operating leases is recognized on a straight-line basis over the lease term, unless another systematic
basis is more representative of the time pattern in which use benefit derived from the leased asset is diminished.
(8) Provisions
The Company recognizes provisions if it has a present legal or constructive obligation as a result of past events, it is
probable that an outflow of resources embodying economic benefits will be required to settle the obligation and the
amount of obligation can be reliably estimated.
In case the time value of money is material, the amount of a provision is measured at the present value of the amount
of expenditures expected to be required to settle the obligation.
― 25 ―
(9) Government Grants
A government grant is recognized at fair value when there is reasonable assurance that Toyota Industries will comply
with any conditions attached to the grant and it will receive the grant. When a grant is received for acquisition of an
asset, the carrying amount of the asset is calculated by deducting the amount of the grant from the acquisition cost of
the asset.
(10) Employee Benefits
(i) Post-employment benefits
Toyota Industries adopts the pension and lump-sum payment defined benefit plan and the defined contribution plan.
Toyota Industries' liabilities (assets) in respect of defined benefit plans is calculated for each plan by estimating the
amount of future benefits earned by employees in the previous fiscal year and the fiscal year under review,
discounting that amount to the present value, deducting the fair value of plan assets, making adjustments concerning
the asset ceiling to that amount and, where necessary, considering economic benefits available. Remeasurements of
liabilities (assets) in respect of defined benefit plans are recognized in other comprehensive income and at the time of
their occurrence directly transferred from other components of equity to retained earnings. Prior service cost is
recognized in profit or loss as it occurs. Market yields on high-quality corporate bonds with roughly the same maturity
as that of Toyota Industries' net defined benefit liabilities at the end of the reporting period are used as the discount
rate. Interest expenses on liabilities (asset) in respect of defined benefit plans are presented as financial expenses.
Contributions under the defined contribution plan are expensed as the employees' services are provided.
(ii) Short-term employee benefits
Short-term employee benefits are expensed as the relevant services are provided and are not discounted.
For bonuses, if Toyota Industries has the present legal and constructive obligation to pay them as the result of past
services provided by employees and the amount can be reliably estimated, the amount estimated to be paid is
recognized as a liability.
(iii) Other long-term employee benefits
The amount of an obligation in respect of the long-service travel award scheme is calculated by estimating the
amount of future benefits earned by employees in the current and prior fiscal years and discounting that amount to the
present value.
Market yields on high-quality corporate bonds with roughly the same maturity as that of Toyota Industries' long-term
employee benefits at the end of the reporting period are used as the discount rate.
(iv) Share-based compensation
Toyota Industries has the cash-settled share-based compensation plan for some of its subsidiaries outside Japan.
Cash-settled share-based compensation is measured at the fair value of the goods or services received and liabilities
incurred. The fair value of the liabilities is remeasured at the end of each reporting period and on the settlement date,
and changes in fair value are recognized in profit or loss.
(11) Financial Instruments
A financial instrument is a contract that gives rise to a financial asset of one entity and a financial liability or equity
instrument of another entity. The Group recognizes a financial asset or a financial liability when it becomes a party to
the contract of a financial instrument. A purchase or sale of financial assets is recognized or derecognized at the trade
date.
― 26 ―
(i) Non-derivative financial assets
Toyota Industries categorizes non-derivative assets into financial assets measured at amortized cost, financial assets
measured at fair value through other comprehensive income (FVTOCI) and financial assets measured at fair value
through profit or loss (FVTPL).
For details of fair value measurement, see "29. Financial Instruments (3) Fair value of financial instruments".
(Financial assets measured at amortized cost)
Toyota Industries categorizes financial assets as financial assets measured at amortized cost if financial assets are
held with the objective of collecting contractual cash flows and their contractual terms provide cash flows on
specified dates that are solely payments of principal and interest on the principal amount outstanding. Financial
assets measured at amortized cost are initially measured at fair value. The carrying amount of financial assets
measured at amortized cost is subsequently measured using the effective interest method.
(Financial assets measured at fair value)
Toyota Industries categorizes financial assets other than financial assets measured at amortized cost as financial
assets measured at fair value. Financial assets measured at fair value are further divided into the following
classifications according to holding purpose.
(Equity instruments measured at fair value through other comprehensive income (FVTOCI))
Shares and other financial assets held mainly for the purpose of maintaining or enhancing business relationships
with investees are designated at initial recognition as financial assets at FVTOCI.
Equity instruments at FVTOCI are measured at fair value at initial recognition and changes in fair value thereafter
are recognized in other comprehensive income. However, dividends arising from financial assets at FVTOCI are in
principle recognized in profit or loss.
If an equity instrument at FVTOCI is derecognized, the cumulative amount of other comprehensive income
recognized in other components of equity on the consolidated statements of financial position is directly transferred
to retained earnings.
(Financial assets measured at fair value through profit or loss (FVTPL))
Financial assets not designated as financial assets at FVTOCI of financial assets measured by Toyota Industries
are classified as financial assets at FVTPL.
Financial assets at FVTPL are measured at fair value at initial recognition and changes in fair value thereafter are
recognized in profit or loss.
(ii) Non-derivative financial liabilities
Non-derivative financial liabilities are measured at fair value at initial recognition and thereafter at amortization cost
using the effective interest method.
A financial liability is derecognized when its contractual obligations are discharged or canceled, or expire.
― 27 ―
(iii) Derivatives
Toyota Industries holds derivative financial instruments to hedge foreign currency and interest rate fluctuation risks,
including foreign currency forward contracts, currency options, currency swaps, interest rate swaps and interest rate
currency swaps.
For all of these derivatives, Toyota Industries recognizes financial assets or financial liabilities when it becomes the
party to these derivatives contracts.
Some of derivatives Toyota Industries holds for hedging purposes do not meet hedge accounting requirements.
Changes in fair value of these derivatives are immediately recognized in profit or loss.
Toyota Industries adopts cash flow hedges only as a hedge accounting method.
(iv) Offsetting financial assets and liabilities
Financial assets and liabilities are offset and reported as net amounts in the consolidated statements of financial
position only if Toyota Industries currently has a legally enforceable right to set off the recognized amounts and
intends to settle on a net basis or to realize the asset and settle the liability simultaneously.
(12) Revenues
Revenues are measured at the fair value of the consideration received or receivables for goods and services provided
less sales related taxes.
(i) Sales of goods
Revenue from the sales of goods is recognized when the significant risks and economic values of ownership of the
goods have been transferred to the customer; Toyota Industries has neither continuing managerial involvement nor
effective control over the goods sold; the amount of revenue and the costs incurred or to be incurred in respect of the
transaction can be measured reliably; and the collectibility of consideration is high. The timing of transferring risks and
rewards of ownership of goods varies depending on the conditions of individual terms of sales contracts. Normally,
revenue is recognized when a customer accepts goods after inspection.
Toyota Industries provides incentives to distributors. If these incentives are discounts to distributors, they are
estimated and recognized when products are sold and recorded as reduction to revenue.
(ii) Provision of services
Revenue from the provision of services is recognized over the terms of individual service contracts.
(iii) Multiple-element transactions
Toyota Industries enters into multiple-element arrangements that include various elements such as products and
maintenance. If elements of a multiple-element arrangement meet the following criteria, Toyota Industries allocates
the arrangement consideration to individual elements based on each component's relative fair value and recognizes
revenue for each element.
・Each element has stand-alone value to the customer.
・The fair value of each element can be reliably measured.
If the above criteria are not met, revenue as one stand-alone accounting unit is deferred until undelivered products or
services are delivered.

― 28 ―
(13) Financial Income and Financial Expenses
Financial income includes interest income, dividends income, gains on foreign currency translation and gain on
derivatives (excluding gain or loss on hedging instruments that are recognized in other comprehensive income).
Interest income is recognized as earned using the effective interest method. Dividends income is recognized on the
date of Toyota Industries' vesting.
Financial expenses include interest expense, losses on foreign currency translation and loss on derivatives (excluding
loss on hedging instruments that are recognized in other comprehensive income).
(14) Income Taxes
Income taxes comprise current taxes and deferred taxes. These are recognized in profit or loss except taxes that arise
from items that are recognized either in other comprehensive income or directly in equity or from business
combinations.
Taxes for the fiscal year under review are the expected taxes payable or receivable on the taxable profit or loss for the
year, using the tax rates and tax laws enacted or substantively enacted by the end of the reporting period.
Deferred tax assets and liabilities are recognized on temporary differences between the carrying amounts of assets
and liabilities for accounting purposes and their tax basis. Deferred tax assets and liabilities are not recognized if the
temporary difference arises from the initial recognition of an asset or liability in a transaction not related to a business
combination and affects neither accounting profit nor taxable profit. Also, deferred tax liabilities are not recognized if
the taxable temporary difference arises from the initial recognition of goodwill.
Deferred tax liabilities are recognized for taxable temporary differences associated with investments in subsidiaries
and affiliates. However, deferred tax liabilities are not recognized if Toyota Industries is able to control the reversal of
the temporary difference and it is probable that the temporary difference will not reverse in the foreseeable future.
Deferred tax assets arising from deductible temporary differences associated with such investments are only
recognized to the extent that it is probable that there will be sufficient taxable profits against which to utilize the
benefits of the temporary differences and they are expected to reverse in the foreseeable future.
Deferred tax assets and liabilities are measured at the tax rates expected to apply in the period in which the asset
realized or the liability is settled based on tax laws that have been enacted or substantively enacted by the end of the
reporting period.
Deferred tax assets and liabilities are offset when there is a legally enforceable right to offset current tax assets
against current tax liabilities and when income taxes are levied by the same taxation authority on the same taxable
entity, or on different taxable entities that intend either to settle current tax assets and liabilities on a net basis, or to
realize the assets and settle the liabilities simultaneously.
Deferred tax assets are recognized for unused tax losses, tax credits and deductible temporary differences to the
extent that it is probable that taxable profits will be available against which they can be utilized. The carrying amount
of deferred tax assets is reviewed at the end of each reporting period and reduced to the extent that it is no longer
probable that sufficient taxable profits will be earned to allow related tax benefits to be realized.
― 29 ―
(15) Impairment Losses
(i) Financial assets
Financial assets measured at amortized cost are assessed for impairment losses based on expected credit losses.
At the end of the reporting period, if credit risk has not increased significantly after initial recognition, the amount of
loss allowance is calculated based on the expected credit losses resulting from default events that are possible within
12 months after the reporting date (12-month expected credit losses). On the other hand, at the end of the reporting
period, if credit risk has increased significantly after initial recognition, the amount of loss allowance is calculated
based on the expected credit losses resulting from all possible default events over the life of the financial instrument
(lifetime expected credit losses).
However, regardless of the above, lifetime expected credit loss measurement always applies to trade receivables and
lease investment assets without a significant financing component.
For details, see "29. Financial Instruments (2) Matters concerning risk management".
(ii) Non-financial assets
Toyota Industries reviews carrying amounts of non-financial assets, excluding inventories and deferred tax assets, at
every reporting fiscal year-end to determine whether there is any indication of impairment. If there is any indication of
impairment, impairment testing is conducted based on the recoverable amount of the asset. Goodwill and intangible
assets with indefinite useful lives are tested annually for impairment regardless of whether there is any indication of
impairment.
A cash-generating unit (CGU), which is a unit for conducting impairment testing, is the smallest group of assets that
generates cash inflows that are generally independent of cash flows of other assets or groups of assets. A CGU for
goodwill is the smallest unit monitored for internal control purposes and is no larger than an operating segment before
aggregation. Impairment testing for goodwill is conducted at a CGU or a group of CGUs for the smallest unit
monitored for internal control purposes and within the scope of an operating segment before aggregation.
The recoverable amount of an asset or CGU is the greater of its value in use or its fair value less cost to sell. In
calculating the value in use, estimated future cash flows are discounted to the present value using a pre-tax discount
rate that reflects the time value of money and risks specific to the asset not considered in estimating future cash flows.
Because corporate assets do not generate independent cash inflows, if there is an indication that a corporate asset
may be impaired, impairment testing is conducted based on the recoverable amount for the CGU to which the
corporate asset belongs.
An impairment loss is recognized if the carrying amount of an asset or CGU exceeds its recoverable amount. An
impairment loss recognized in relation to a CGU is allocated to reduce the carrying amount of assets within the CGU
on a pro rata basis determined by the relative carrying amount of each asset.
An asset or CGU impaired in prior years is reviewed at every reporting fiscal year-end to determine whether there is
any indication of a reversal of impairment loss recognized in prior years. The recoverable amount is estimated for an
impairment loss recognized in prior years for an asset or CGU with an indication of reversal of impairment, and the
impairment loss is reversed if the recoverable amount exceeds the carrying amount. The carrying amount after
reversal of the impairment loss must not exceed the carrying amount of the asset that would be determined if no
impairment had been recognized and the asset had been depreciated or amortized until the reversal. An impairment
loss recognized for goodwill is not reversed.
― 30 ―
(16) Earnings per Share
Basic earnings per share are calculated by dividing profit attributable to ordinary equity holders of the parent entity by
the weighted-average number of common stock issued and outstanding after adjusting treasury stock for each
calculation period. Diluted earnings per share take into account the impacts of all dilutive shares that bear the effects
of dilution in calculating the weighted-average number of shares issued and outstanding.
(17) Reporting by Segment
An operating segment is one of the constituent units of any business activity that earns revenue and incurs expenses,
including transactions with another operating segment. The results of all operating segments are such that their
financial information can be obtained individually and are periodically reviewed by the management for allocating
management resources to each segment and assessing operating performance.

― 31 ―
4. Segment Information
The operating segments reported below are the segments of Toyota Industries for which separate financial information is
available and for which operating profit (loss) amounts are evaluated regularly by executive management in deciding how
to allocate resources and in assessing performance.
The reporting segments of Toyota Industries consist of Automobile, Materials Handling Equipment and Textile Machinery.
The similarity of products and services are taken into account for the separation. Within the Automobile Segment, vehicles,
engines, car air-conditioning compressors and others are included due to the similarity of their economic characteristics
such as net sales. The main products and services of each segment are as follows.
Segment Main products and services of each segment
Automobile Vehicles, diesel and gasoline engines, car air-conditioning compressors, electronic components for automobiles, foundry parts for engines
Materials Handling Equipment
Lift trucks, warehouse trucks, automated storage and retrieval systems, aerial work platforms, logistics solutions, sales financing business
Textile Machinery Weaving machinery, spinning machinery, instruments for yarn testing and cotton classing
The accounting method of reporting segment information is based on "3. Significant Accounting Policies".
Segment profit is based on operating profit.
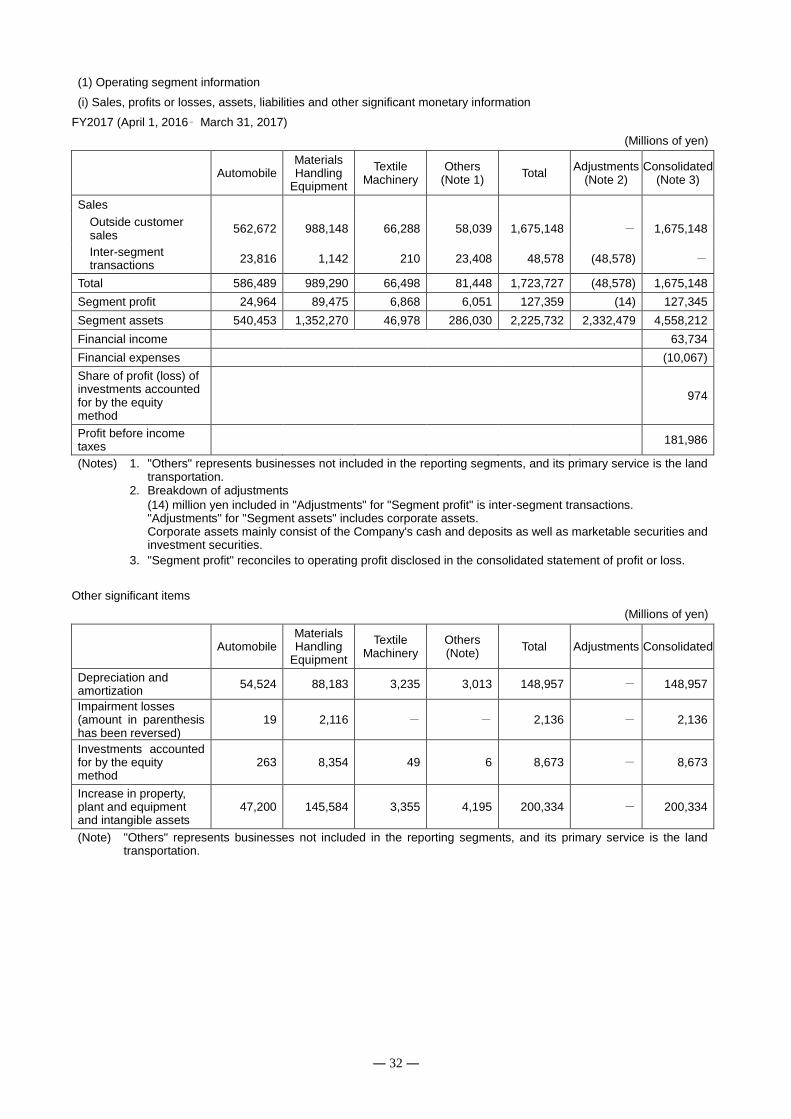
― 32 ―
(1) Operating segment information
(i) Sales, profits or losses, assets, liabilities and other significant monetary information
FY2017 (April 1, 2016– March 31, 2017)
(Millions of yen)
Automobile Materials Handling
Equipment
Textile Machinery
Others (Note 1)
Total Adjustments
(Note 2) Consolidated
(Note 3)
Sales
Outside customer sales
562,672 988,148 66,288 58,039 1,675,148 - 1,675,148
Inter-segment transactions
23,816 1,142 210 23,408 48,578 (48,578) -
Total 586,489 989,290 66,498 81,448 1,723,727 (48,578) 1,675,148
Segment profit 24,964 89,475 6,868 6,051 127,359 (14) 127,345
Segment assets 540,453 1,352,270 46,978 286,030 2,225,732 2,332,479 4,558,212
Financial income 63,734
Financial expenses (10,067)
Share of profit (loss) of investments accounted for by the equity method
974
Profit before income taxes
181,986
(Notes)
1.
"Others" represents businesses not included in the reporting segments, and its primary service is the land transportation.
2. Breakdown of adjustments
(14) million yen included in "Adjustments" for "Segment profit" is inter-segment transactions. "Adjustments" for "Segment assets" includes corporate assets. Corporate assets mainly consist of the Company's cash and deposits as well as marketable securities and investment securities.
3. "Segment profit" reconciles to operating profit disclosed in the consolidated statement of profit or loss.
Other significant items
(Millions of yen)
Automobile Materials Handling
Equipment
Textile Machinery
Others (Note)
Total Adjustments Consolidated
Depreciation and amortization
54,524 88,183 3,235 3,013 148,957 - 148,957
Impairment losses (amount in parenthesis has been reversed)
19 2,116 - - 2,136 - 2,136
Investments accounted for by the equity method
263 8,354 49 6 8,673 - 8,673
Increase in property, plant and equipment and intangible assets
47,200 145,584 3,355 4,195 200,334 - 200,334
(Note)
"Others" represents businesses not included in the reporting segments, and its primary service is the land transportation.
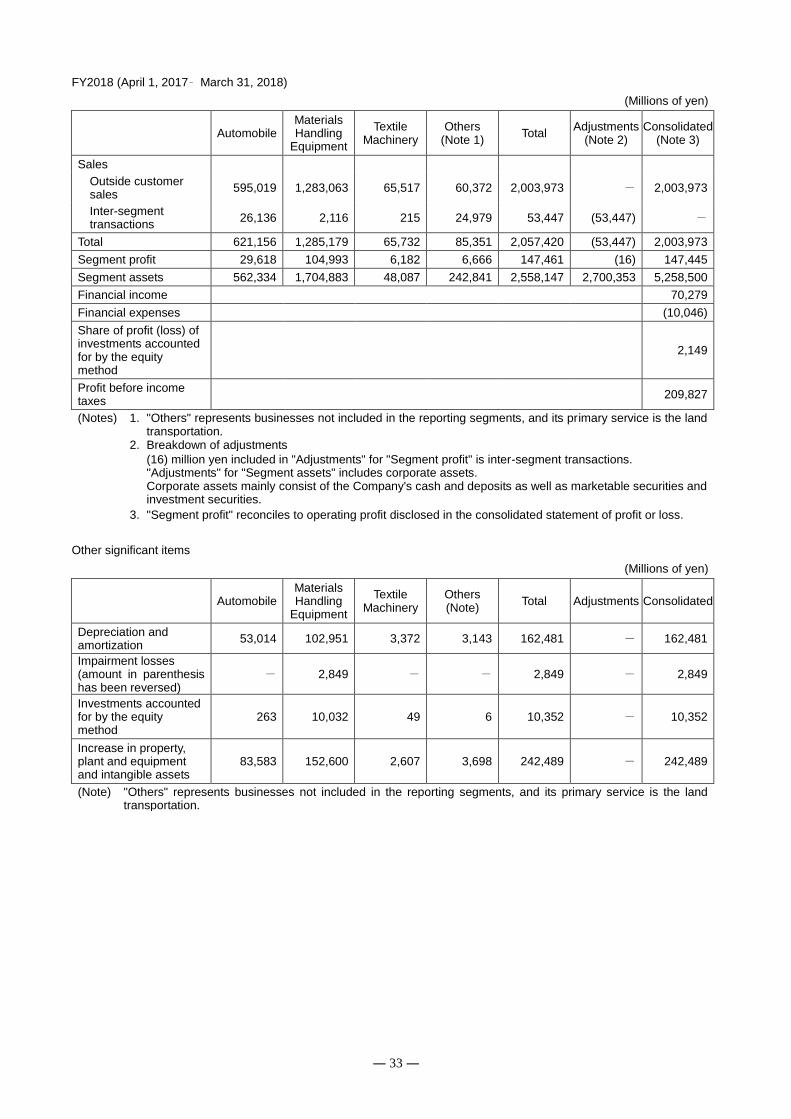
― 33 ―
FY2018 (April 1, 2017– March 31, 2018)
(Millions of yen)
Automobile Materials Handling
Equipment
Textile Machinery
Others (Note 1)
Total Adjustments
(Note 2) Consolidated
(Note 3)
Sales
Outside customer sales
595,019 1,283,063 65,517 60,372 2,003,973 - 2,003,973
Inter-segment transactions
26,136 2,116 215 24,979 53,447 (53,447) -
Total 621,156 1,285,179 65,732 85,351 2,057,420 (53,447) 2,003,973
Segment profit 29,618 104,993 6,182 6,666 147,461 (16) 147,445
Segment assets 562,334 1,704,883 48,087 242,841 2,558,147 2,700,353 5,258,500
Financial income 70,279
Financial expenses (10,046)
Share of profit (loss) of investments accounted for by the equity method
2,149
Profit before income taxes
209,827
(Notes)
1.
"Others" represents businesses not included in the reporting segments, and its primary service is the land transportation.
2. Breakdown of adjustments
(16) million yen included in "Adjustments" for "Segment profit" is inter-segment transactions. "Adjustments" for "Segment assets" includes corporate assets. Corporate assets mainly consist of the Company's cash and deposits as well as marketable securities and investment securities.
3. "Segment profit" reconciles to operating profit disclosed in the consolidated statement of profit or loss.
Other significant items
(Millions of yen)
Automobile Materials Handling
Equipment
Textile Machinery
Others (Note)
Total Adjustments Consolidated
Depreciation and amortization
53,014 102,951 3,372 3,143 162,481 - 162,481
Impairment losses (amount in parenthesis has been reversed)
- 2,849 - - 2,849 - 2,849
Investments accounted for by the equity method
263 10,032 49 6 10,352 - 10,352
Increase in property, plant and equipment and intangible assets
83,583 152,600 2,607 3,698 242,489 - 242,489
(Note)
"Others" represents businesses not included in the reporting segments, and its primary service is the land transportation.
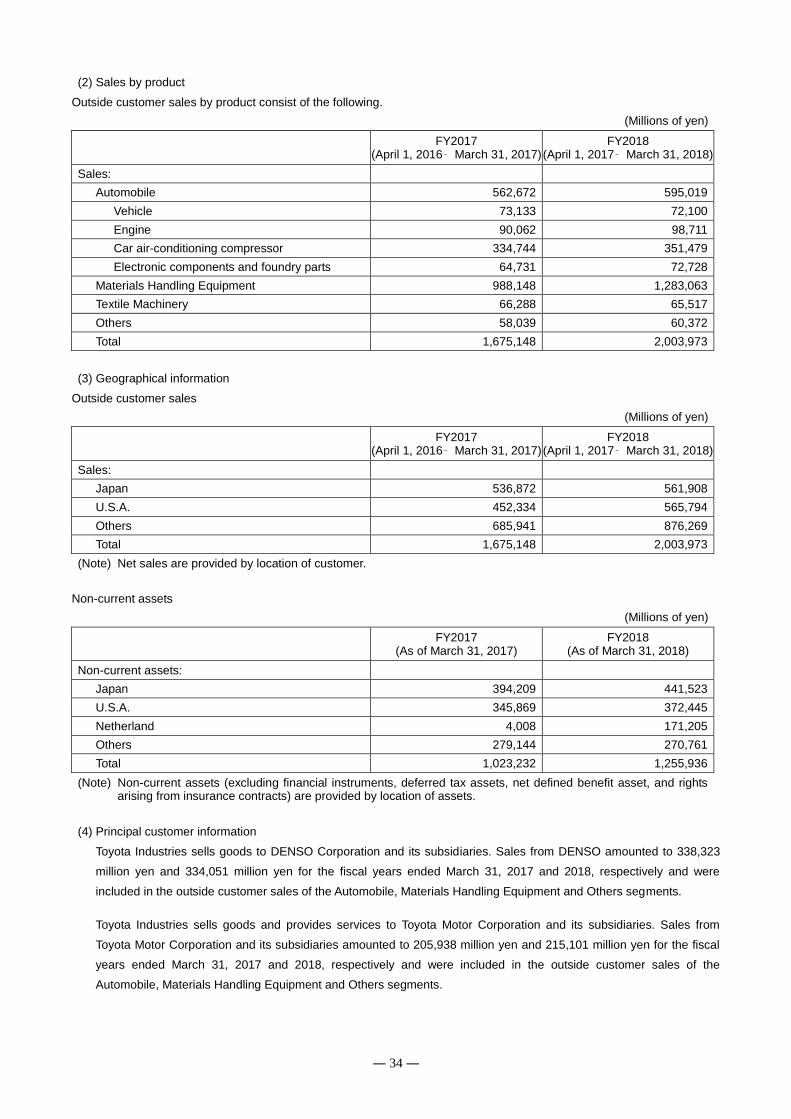
― 34 ―
(2) Sales by product
Outside customer sales by product consist of the following.
(Millions of yen)
FY2017
(April 1, 2016– March 31, 2017) FY2018
(April 1, 2017– March 31, 2018)
Sales:
Automobile 562,672 595,019
Vehicle 73,133 72,100
Engine 90,062 98,711
Car air-conditioning compressor 334,744 351,479
Electronic components and foundry parts 64,731 72,728
Materials Handling Equipment 988,148 1,283,063
Textile Machinery 66,288 65,517
Others 58,039 60,372
Total 1,675,148 2,003,973
(3) Geographical information
Outside customer sales
(Millions of yen)
FY2017
(April 1, 2016– March 31, 2017) FY2018
(April 1, 2017– March 31, 2018)
Sales:
Japan 536,872 561,908
U.S.A. 452,334 565,794
Others 685,941 876,269
Total 1,675,148 2,003,973 (Note) Net sales are provided by location of customer.
Non-current assets
(Millions of yen)
FY2017
(As of March 31, 2017) FY2018
(As of March 31, 2018)
Non-current assets:
Japan 394,209 441,523
U.S.A. 345,869 372,445
Netherland 4,008 171,205
Others 279,144 270,761
Total 1,023,232 1,255,936 (Note)
Non-current assets (excluding financial instruments, deferred tax assets, net defined benefit asset, and rights arising from insurance contracts) are provided by location of assets.
(4) Principal customer information
Toyota Industries sells goods to DENSO Corporation and its subsidiaries. Sales from DENSO amounted to 338,323
million yen and 334,051 million yen for the fiscal years ended March 31, 2017 and 2018, respectively and were
included in the outside customer sales of the Automobile, Materials Handling Equipment and Others segments.
Toyota Industries sells goods and provides services to Toyota Motor Corporation and its subsidiaries. Sales from
Toyota Motor Corporation and its subsidiaries amounted to 205,938 million yen and 215,101 million yen for the fiscal
years ended March 31, 2017 and 2018, respectively and were included in the outside customer sales of the
Automobile, Materials Handling Equipment and Others segments.
― 35 ―
5. Business Combinations
(Business combination through acquisition)
On May 18, 2017, Toyota Industries Europe AB, the holding company for the Materials Handling Equipment Business
in Europe, acquired Netherland-based Vanderlande Industries Holding B.V., which engages in the logistics solutions
business on a global scale. The outline of the acquisition is as follows:
1. Outline of business combination
(1) Name and business of acquiree
Name: Vanderlande Industries Holding B.V. (hereinafter, "Vanderlande")
Business activities: Logistics solutions business
(2) Primary reasons for business combination
By making Vanderlande a consolidated subsidiary, Toyota Industries aims for further growth through globally providing
new types of logistics solutions that customers demand.
(3) Acquisition date
May 18, 2017
(4) Measure of business combination
Stock acquisition
(5) Name of acquiree after business combination
Vanderlande Industries Holding B.V.
(6) Percentage of voting equity interests acquired
Voting rights ratio of 100% after the acquisition
(7) Primary basis of determination of acquirer
Owing to (2), it is evident that the consolidated subsidiary of the Company holds a majority of the voting rights and
controls the decision-making body.
2. Acquisition cost and considerations by type
Consideration for acquisition (cash): 144,639 million yen
Acquisition cost: 144,639 million yen
3. Content and amount of principal acquisition-related costs
Advisory fees and other expenses: 679 million yen
In FY2017, the above amount is included mainly in "Other expenses" on the consolidated statement of profit or loss.
4. Amount and factors of recognition of goodwill
(1) Amount of goodwill recognized
61,518 million yen
The amount of goodwill was determined following the completion of allocation of the cost of acquisition.
(2) Factors of recognition of goodwill
Because the acquisition cost exceeded the net amount of assets acquired and liabilities assumed, the excess amount
was recorded as goodwill. The goodwill primarily represents excess earning capacity and synergistic effects with the
existing businesses. Goodwill is not deductible for tax purposes.
― 36 ―
5. Identified assets acquired and liabilities assumed upon business combination
Cash and cash equivalents 6,159 million yen
Trade receivables and other receivables 33,188
Inventories 8,388
Property, plant and equipment 14,149
Intangible assets (Note 1) 88,894
Other assets 9,252
Total assets (Note 2) 160,032
Trade payables and other payables 45,932
Corporate bonds and loans 2,646
Provisions 2,452
Deferred tax liabilities 22,223
Other liabilities 3,640
Total liabilities 76,896 (Notes) 1. Intangible assets mainly consist of customer-related assets. 2. The amount of goodwill, as referred to under "4. (1) Amount of goodwill recognized", is not included in the
assets presented above.
Provisional accounting treatment was used in the third quarter. Allocation of the cost of acquisition was completed and no
adjustment of the amount was made for the fiscal year ended March 31, 2018.
6. Fair value, contractual amount and estimated uncollectible amount of receivables acquired
(Millions of yen)
Fair value Contractual amount Estimated uncollectible
amount
Accounts receivable 19,867 20,124 256
7. Net sales and profit attributable to owners of the parent related to the acquiree
Net sales of the acquiree since the acquisition date, which were recorded in the consolidated statement of profit or loss,
were 151,732 million yen before eliminations of inter-company transactions, which mainly arose from construction
contracts, and profit attributable to owners of the parent was 3,129 million yen.
Assuming that the business combination had been completed at the beginning of the fiscal year ended March 31, 2018
(April 1, 2017), pro-forma net sales and pro-forma profit attributable to owners of the parent in the consolidated
statement of profit or loss would have been 2,033,476 million yen and 169,050 million yen, respectively. Note that these
figures do not take into account the eliminations of inter-company transactions and do not indicate the actual operating
results if the business combination had been completed at the beginning of the fiscal year ended March 31, 2018. This
pro-forma information is not subject to audit of the independent auditor.
― 37 ―
(Business combination through acquisition)
On April 3, 2017, Toyota Advanced Logistics Solutions, Inc., the Company's subsidiary in North America, acquired U.S.-
based Bastian Solutions LLC, a leading system integrator in North America. The outline of the acquisition is as follows:
1. Outline of business combination
(1) Name and business of acquiree
Name: Bastian Solutions LLC (hereinafter, "Bastian")
Business activities: Logistics solutions business
(2) Primary reasons for business combination
By making Bastian a consolidated subsidiary, Toyota Industries aims for full-fledged entry into the logistics solutions
business in North America, where significant growth is anticipated.
(3) Acquisition date
April 3, 2017
(4) Measure of business combination
Stock acquisition
(5) Name of acquiree after business combination
Bastian Solutions LLC
(6) Percentage of voting equity interests acquired
Voting rights ratio of 100% after the acquisition
(7) Primary basis of determination of acquirer
Owing to (2), it is evident that the consolidated subsidiary of the Company holds a majority of the voting rights and
controls the decision-making body.
2. Acquisition cost and considerations by type
Consideration for acquisition (cash): 29,794 million yen
Acquisition cost: 29,794 million yen
3. Content and amount of principal acquisition-related costs
Advisory fees and other expenses: 144 million yen
In FY2017, the above amount is included in "Other expenses" on the consolidated statement of profit or loss.
4. Amount and factors of recognition of goodwill
(1) Amount of goodwill recognized
14,320 million yen
The amount of goodwill was determined following the completion of allocation of the cost of acquisition.
(2) Factors of recognition of goodwill
Because the acquisition cost exceeded the net amount of assets acquired and liabilities assumed, the excess amount
is recorded as goodwill. The goodwill primarily represents excess earning capacity and synergistic effects with the
existing businesses. Goodwill is not deductible for tax purposes.

― 38 ―
5. Identified assets acquired and liabilities assumed upon business combination
Cash and cash equivalents 1,388 million yen
Trade receivables and other receivables 4,874
Property, plant and equipment 496
Intangible assets (Note 1) 13,908
Other assets 793
Total assets (Note 2) 21,463
Trade payables and other payables 5,880
Corporate bonds and loans 109
Total liabilities 5,989 (Notes) 1. Intangible assets mainly consist of customer-related assets.
2. The amount of goodwill, as referred to under "4. (1) Amount of goodwill recognized", is not included in the assets presented above.
Provisional accounting treatment was used in the third quarter, but allocation of the cost of acquisition was completed in
the fiscal year ended March 31, 2018. As a result, goodwill decreased by 5,156 million yen from the provisionally
calculated amount. The principal change in the identified assets acquired and liabilities assumed from the initial
provisionally calculated amount is a 5,285 million yen decline in deferred tax liabilities.
6. Fair values, contractual amount and estimated uncollectible amount of receivables acquired
(Millions of yen)
Fair value Contractual amount Estimated uncollectible
amount
Accounts receivable 3,649 3,660 11
7. Net sales and profit attributable to owners of the parent related to the acquiree
Net sales of the acquiree since the acquisition date, which were recorded in the consolidated statement of profit or loss,
were 29,040 million yen before eliminations of inter-company transactions, which mainly arose from construction
contracts. Profit attributable to owners of the parent is omitted due to its immateriality.
Since the acquisition date was carried out on April 3, 2017, pro-forma net sales and pro-forma profit attributable to
owners of the parent when assuming that the business combination had been completed at the beginning of the fiscal
year ended March 31, 2018 are omitted.
― 39 ―
6. Cash and Cash Equivalents
Cash and cash equivalents consist of the following.
(Millions of yen)
FY2017
(As of March 31, 2017) FY2018
(As of March 31, 2018)
Cash and deposits 243,685 323,830
Short-term investments (securities) which have an original maturity within three months
- -
Total 243,685 323,830
The balance of cash and cash equivalents on the consolidated statement of financial position as of the end of the fiscal
years ended March 31, 2017 and 2018 are consistent with the balances of cash and cash equivalents on the
consolidated statement of cash flows.
These short-term investments are financial assets measured at amortized cost.
7. Trade Receivables and Other Receivables
Trade receivables and other receivables consist of the following.
(Millions of yen)
FY2017
(As of March 31, 2017) FY2018
(As of March 31, 2018)
Trade notes and accounts receivable 287,627 346,307
Loans for sales financing 92,668 100,643
Other receivables 22,365 41,969
Lease investment assets 248,974 281,056
Others 21 21
Elimination: Allowance for doubtful accounts (4,965) (5,147)
Total 646,691 764,851
These receivables are financial assets measured at amortized cost.
Amounts by collection or settlement period consist of the following.
(Millions of yen)
FY2017
(As of March 31, 2017) FY2018
(As of March 31, 2018)
Due within 12 months 427,525 468,542
Due after 12 months 219,166 296,309
Total 646,691 764,851
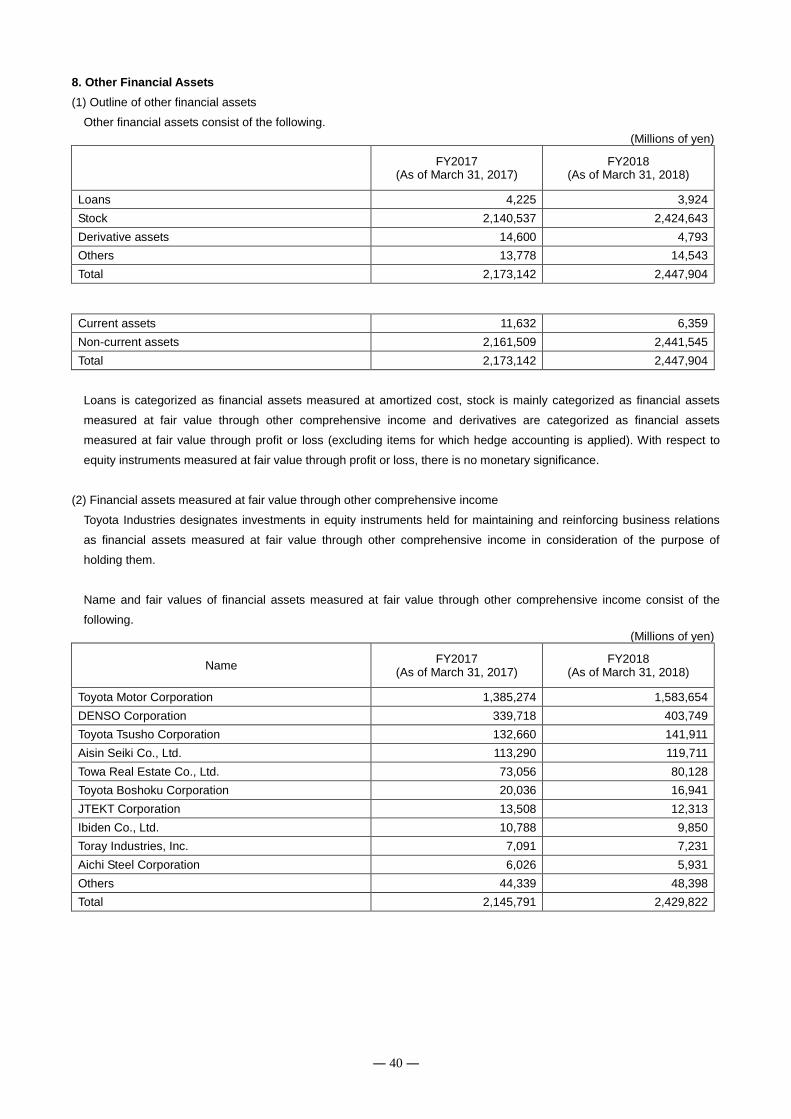
― 40 ―
8. Other Financial Assets
(1) Outline of other financial assets
Other financial assets consist of the following.
(Millions of yen)
FY2017
(As of March 31, 2017) FY2018
(As of March 31, 2018)
Loans 4,225 3,924
Stock 2,140,537 2,424,643
Derivative assets 14,600 4,793
Others 13,778 14,543
Total 2,173,142 2,447,904
Current assets 11,632 6,359
Non-current assets 2,161,509 2,441,545
Total 2,173,142 2,447,904
Loans is categorized as financial assets measured at amortized cost, stock is mainly categorized as financial assets
measured at fair value through other comprehensive income and derivatives are categorized as financial assets
measured at fair value through profit or loss (excluding items for which hedge accounting is applied). With respect to
equity instruments measured at fair value through profit or loss, there is no monetary significance.
(2) Financial assets measured at fair value through other comprehensive income
Toyota Industries designates investments in equity instruments held for maintaining and reinforcing business relations
as financial assets measured at fair value through other comprehensive income in consideration of the purpose of
holding them.
Name and fair values of financial assets measured at fair value through other comprehensive income consist of the
following.
(Millions of yen)
Name FY2017
(As of March 31, 2017) FY2018
(As of March 31, 2018)
Toyota Motor Corporation 1,385,274 1,583,654
DENSO Corporation 339,718 403,749
Toyota Tsusho Corporation 132,660 141,911
Aisin Seiki Co., Ltd. 113,290 119,711
Towa Real Estate Co., Ltd. 73,056 80,128
Toyota Boshoku Corporation 20,036 16,941
JTEKT Corporation 13,508 12,313
Ibiden Co., Ltd. 10,788 9,850
Toray Industries, Inc. 7,091 7,231
Aichi Steel Corporation 6,026 5,931
Others 44,339 48,398
Total 2,145,791 2,429,822
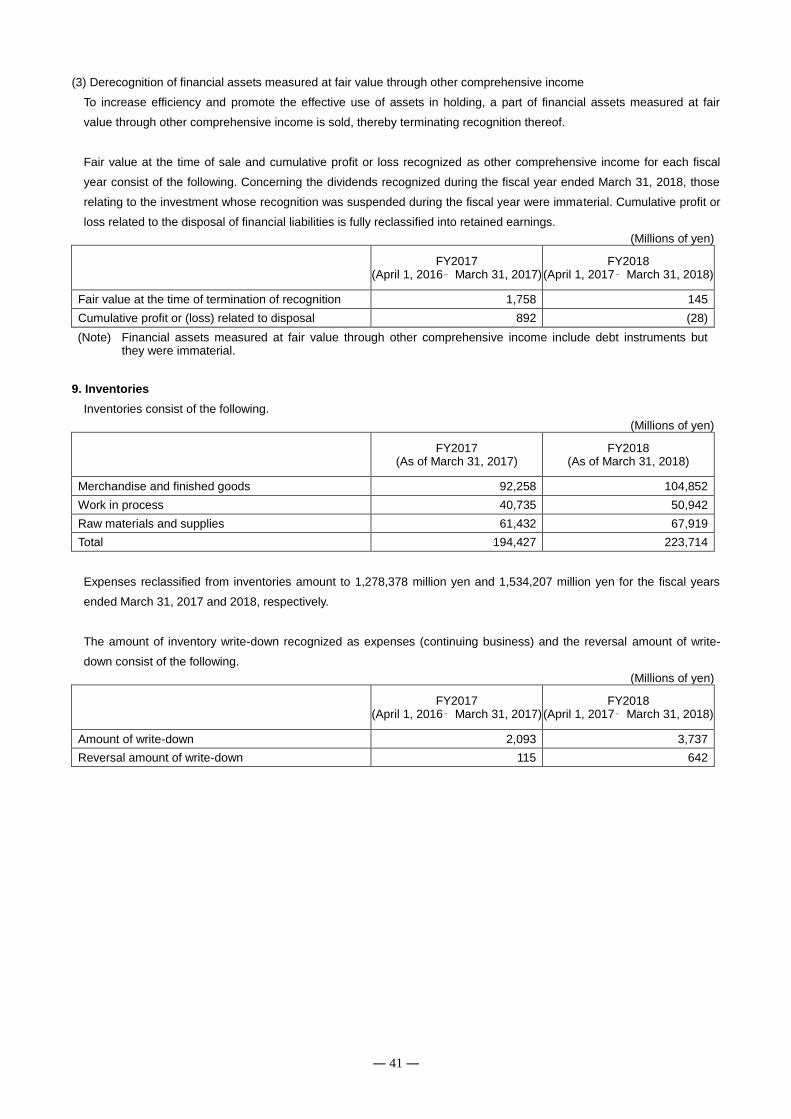
― 41 ―
(3) Derecognition of financial assets measured at fair value through other comprehensive income
To increase efficiency and promote the effective use of assets in holding, a part of financial assets measured at fair
value through other comprehensive income is sold, thereby terminating recognition thereof.
Fair value at the time of sale and cumulative profit or loss recognized as other comprehensive income for each fiscal
year consist of the following. Concerning the dividends recognized during the fiscal year ended March 31, 2018, those
relating to the investment whose recognition was suspended during the fiscal year were immaterial. Cumulative profit or
loss related to the disposal of financial liabilities is fully reclassified into retained earnings.
(Millions of yen)
FY2017
(April 1, 2016– March 31, 2017) FY2018
(April 1, 2017– March 31, 2018)
Fair value at the time of termination of recognition 1,758 145
Cumulative profit or (loss) related to disposal 892 (28) (Note)
Financial assets measured at fair value through other comprehensive income include debt instruments but they were immaterial.
9. Inventories
Inventories consist of the following.
(Millions of yen)
FY2017
(As of March 31, 2017) FY2018
(As of March 31, 2018)
Merchandise and finished goods 92,258 104,852
Work in process 40,735 50,942
Raw materials and supplies 61,432 67,919
Total 194,427 223,714
Expenses reclassified from inventories amount to 1,278,378 million yen and 1,534,207 million yen for the fiscal years
ended March 31, 2017 and 2018, respectively.
The amount of inventory write-down recognized as expenses (continuing business) and the reversal amount of write-
down consist of the following.
(Millions of yen)
FY2017
(April 1, 2016– March 31, 2017) FY2018
(April 1, 2017– March 31, 2018)
Amount of write-down 2,093 3,737
Reversal amount of write-down 115 642
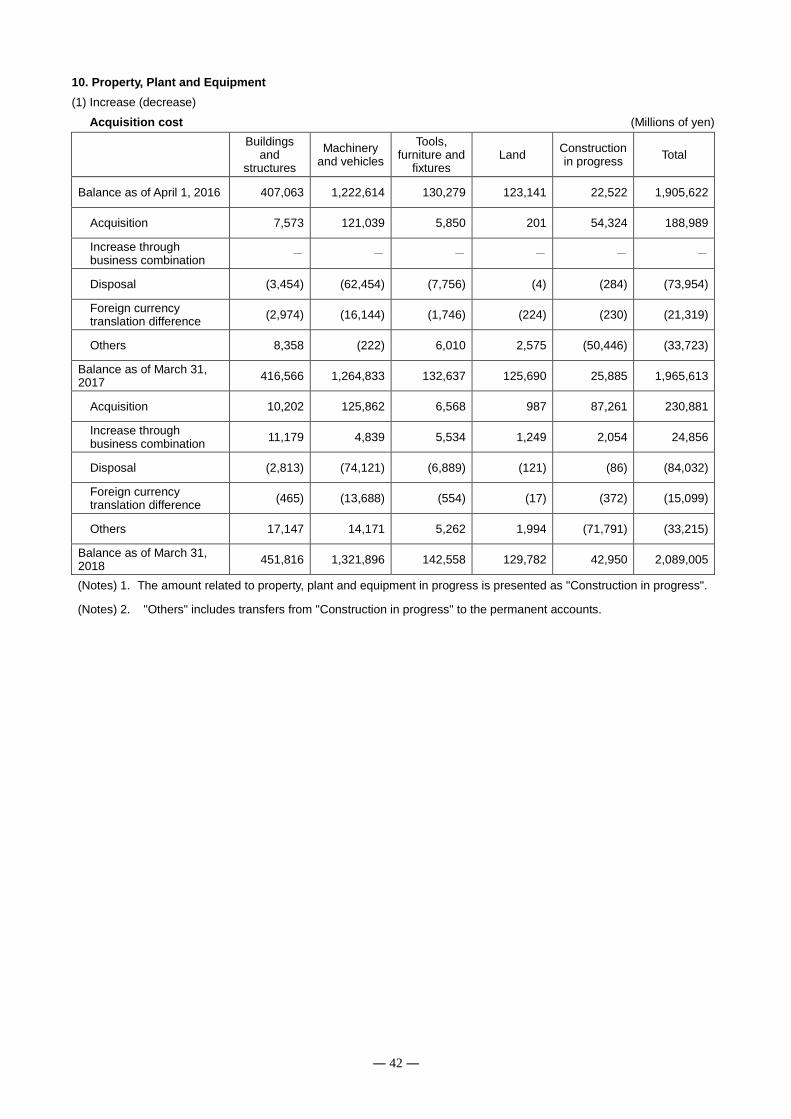
― 42 ―
10. Property, Plant and Equipment
(1) Increase (decrease)
Acquisition cost (Millions of yen)
Buildings
and structures
Machinery and vehicles
Tools, furniture and
fixtures Land
Construction in progress
Total
Balance as of April 1, 2016 407,063 1,222,614 130,279 123,141 22,522 1,905,622
Acquisition 7,573 121,039 5,850 201 54,324 188,989
Increase through business combination
- - - - - -
Disposal (3,454) (62,454) (7,756) (4) (284) (73,954)
Foreign currency translation difference
(2,974) (16,144) (1,746) (224) (230) (21,319)
Others 8,358 (222) 6,010 2,575 (50,446) (33,723)
Balance as of March 31, 2017
416,566 1,264,833 132,637 125,690 25,885 1,965,613
Acquisition 10,202 125,862 6,568 987 87,261 230,881
Increase through business combination
11,179 4,839 5,534 1,249 2,054 24,856
Disposal (2,813) (74,121) (6,889) (121) (86) (84,032)
Foreign currency translation difference
(465) (13,688) (554) (17) (372) (15,099)
Others 17,147 14,171 5,262 1,994 (71,791) (33,215)
Balance as of March 31, 2018
451,816 1,321,896 142,558 129,782 42,950 2,089,005
(Notes) 1. The amount related to property, plant and equipment in progress is presented as "Construction in progress".
(Notes) 2. "Others" includes transfers from "Construction in progress" to the permanent accounts.
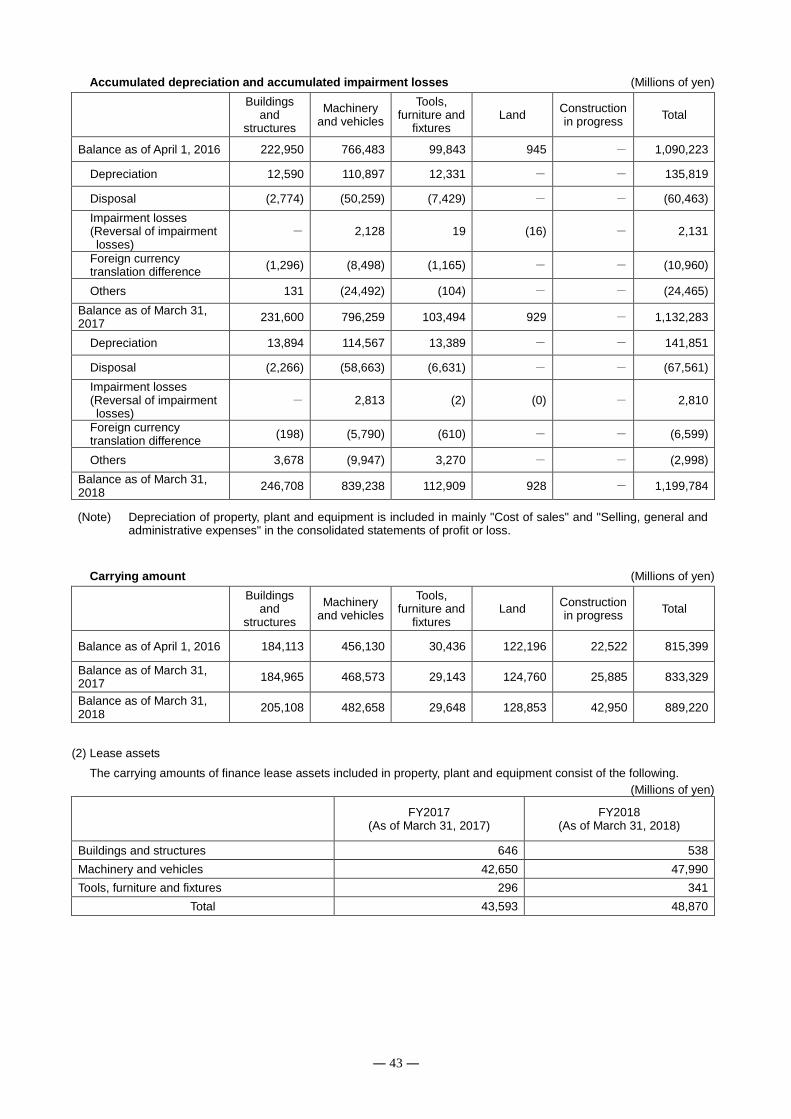
― 43 ―
Accumulated depreciation and accumulated impairment losses (Millions of yen)
Buildings
and structures
Machinery and vehicles
Tools, furniture and
fixtures Land
Construction in progress
Total
Balance as of April 1, 2016 222,950 766,483 99,843 945 - 1,090,223
Depreciation 12,590 110,897 12,331 - - 135,819
Disposal (2,774) (50,259) (7,429) - - (60,463)
Impairment losses (Reversal of impairment losses)
- 2,128 19 (16) - 2,131
Foreign currency translation difference
(1,296) (8,498) (1,165) - - (10,960)
Others 131 (24,492) (104) - - (24,465)
Balance as of March 31, 2017
231,600 796,259 103,494 929 - 1,132,283
Depreciation 13,894 114,567 13,389 - - 141,851
Disposal (2,266) (58,663) (6,631) - - (67,561)
Impairment losses (Reversal of impairment losses)
- 2,813 (2) (0) - 2,810
Foreign currency translation difference
(198) (5,790) (610) - - (6,599)
Others 3,678 (9,947) 3,270 - - (2,998)
Balance as of March 31, 2018
246,708 839,238 112,909 928 - 1,199,784
(Note)
Depreciation of property, plant and equipment is included in mainly "Cost of sales" and "Selling, general and administrative expenses" in the consolidated statements of profit or loss.
Carrying amount (Millions of yen)
Buildings
and structures
Machinery and vehicles
Tools, furniture and
fixtures Land
Construction in progress
Total
Balance as of April 1, 2016 184,113 456,130 30,436 122,196 22,522 815,399
Balance as of March 31, 2017
184,965 468,573 29,143 124,760 25,885 833,329
Balance as of March 31, 2018
205,108 482,658 29,648 128,853 42,950 889,220
(2) Lease assets
The carrying amounts of finance lease assets included in property, plant and equipment consist of the following.
(Millions of yen)
FY2017
(As of March 31, 2017) FY2018
(As of March 31, 2018)
Buildings and structures 646 538
Machinery and vehicles 42,650 47,990
Tools, furniture and fixtures 296 341
Total 43,593 48,870
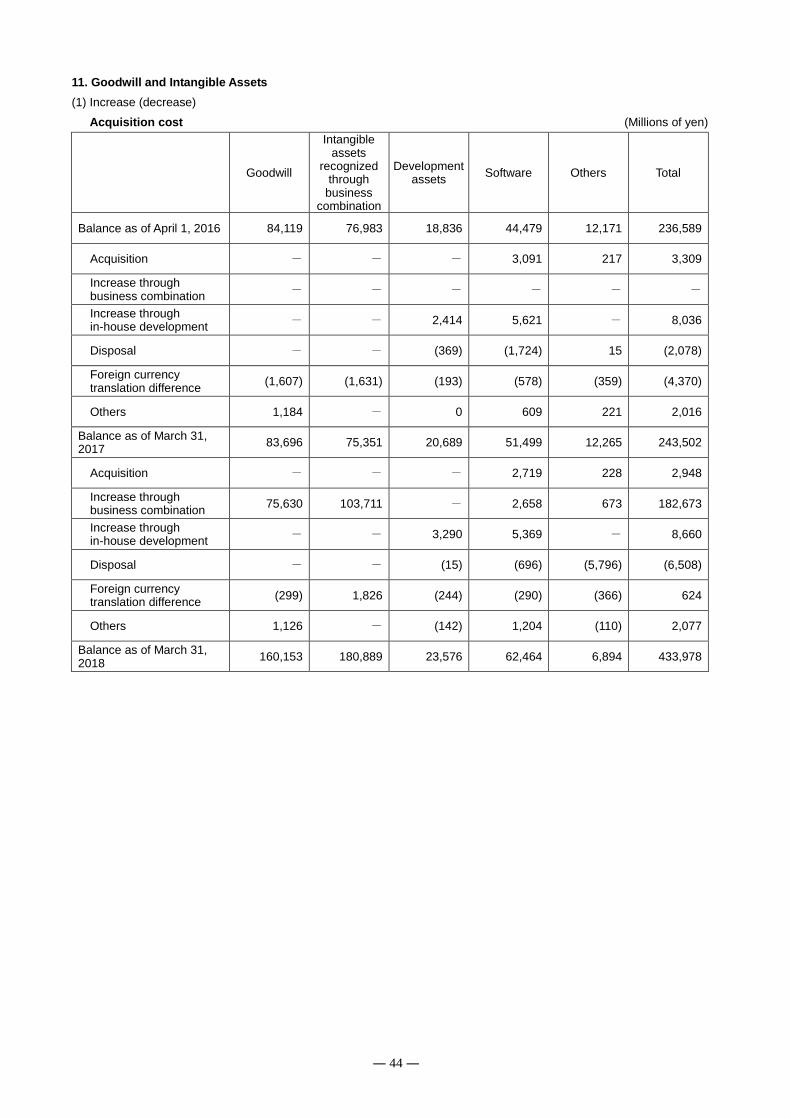
― 44 ―
11. Goodwill and Intangible Assets
(1) Increase (decrease)
Acquisition cost (Millions of yen)
Goodwill
Intangible assets
recognized through
business combination
Development assets
Software Others Total
Balance as of April 1, 2016 84,119 76,983 18,836 44,479 12,171 236,589
Acquisition - - - 3,091 217 3,309
Increase through business combination
- - - - - -
Increase through in-house development
- - 2,414 5,621 - 8,036
Disposal - - (369) (1,724) 15 (2,078)
Foreign currency translation difference
(1,607) (1,631) (193) (578) (359) (4,370)
Others 1,184 - 0 609 221 2,016
Balance as of March 31, 2017
83,696 75,351 20,689 51,499 12,265 243,502
Acquisition - - - 2,719 228 2,948
Increase through business combination
75,630 103,711 - 2,658 673 182,673
Increase through in-house development
- - 3,290 5,369 - 8,660
Disposal - - (15) (696) (5,796) (6,508)
Foreign currency translation difference
(299) 1,826 (244) (290) (366) 624
Others 1,126 - (142) 1,204 (110) 2,077
Balance as of March 31, 2018
160,153 180,889 23,576 62,464 6,894 433,978
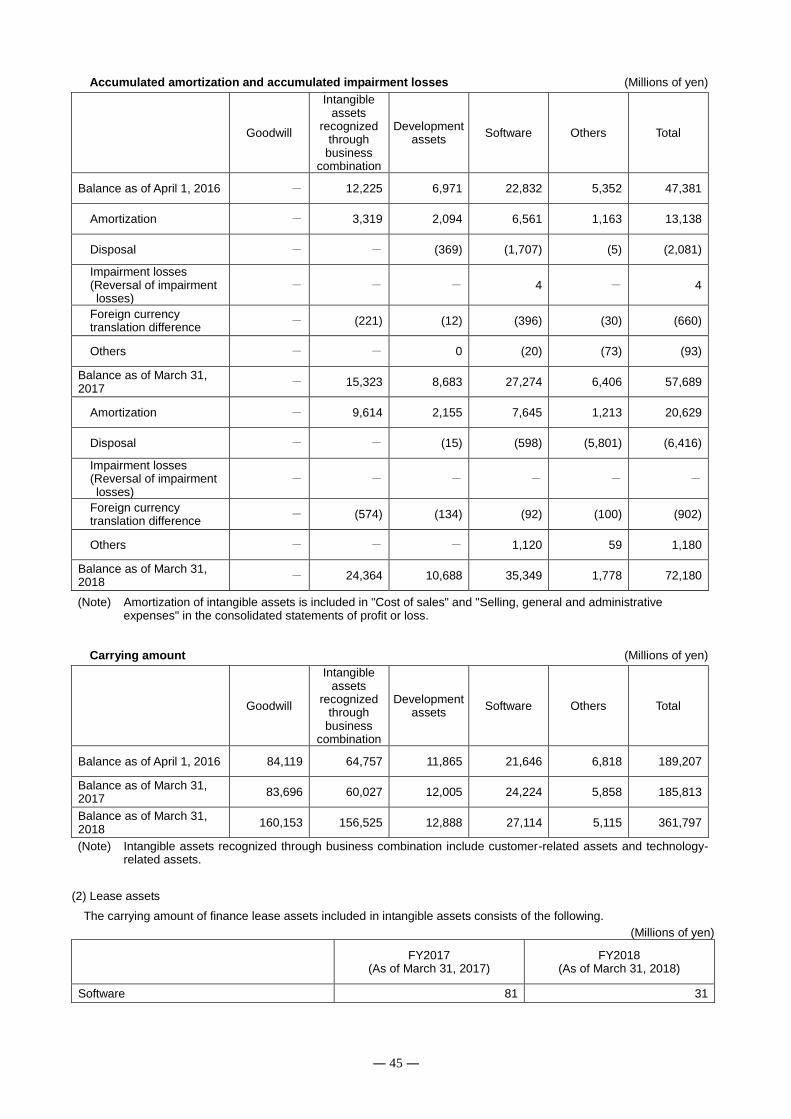
― 45 ―
Accumulated amortization and accumulated impairment losses (Millions of yen)
Goodwill
Intangible assets
recognized through
business combination
Development assets
Software Others Total
Balance as of April 1, 2016 - 12,225 6,971 22,832 5,352 47,381
Amortization - 3,319 2,094 6,561 1,163 13,138
Disposal - - (369) (1,707) (5) (2,081)
Impairment losses (Reversal of impairment losses)
- - - 4 - 4
Foreign currency translation difference
- (221) (12) (396) (30) (660)
Others - - 0 (20) (73) (93)
Balance as of March 31, 2017
- 15,323 8,683 27,274 6,406 57,689
Amortization - 9,614 2,155 7,645 1,213 20,629
Disposal - - (15) (598) (5,801) (6,416)
Impairment losses (Reversal of impairment losses)
- - - - - -
Foreign currency translation difference
- (574) (134) (92) (100) (902)
Others - - - 1,120 59 1,180
Balance as of March 31, 2018
- 24,364 10,688 35,349 1,778 72,180
(Note)
Amortization of intangible assets is included in "Cost of sales" and "Selling, general and administrative expenses" in the consolidated statements of profit or loss.
Carrying amount (Millions of yen)
Goodwill
Intangible assets
recognized through
business combination
Development assets
Software Others Total
Balance as of April 1, 2016 84,119 64,757 11,865 21,646 6,818 189,207
Balance as of March 31, 2017
83,696 60,027 12,005 24,224 5,858 185,813
Balance as of March 31, 2018
160,153 156,525 12,888 27,114 5,115 361,797
(Note) Intangible assets recognized through business combination include customer-related assets and technology-
related assets.
(2) Lease assets
The carrying amount of finance lease assets included in intangible assets consists of the following.
(Millions of yen)
FY2017
(As of March 31, 2017) FY2018
(As of March 31, 2018)
Software 81 31
― 46 ―
(3) Impairment testing of goodwill
Toyota Industries performs, with respect to goodwill, impairment testing as necessary during each period or in case
there is a sign of impairment. The recoverable value in impairment testing is calculated based on value in use.
Value in use is calculated by discounting the estimated amount of cash flows based on the business plan for the next
five years that has been primarily approved by the management in present value. The estimation of cash flows is based
on the assumption that cash flows of more than five years will increase at a certain growth rate. The growth rate is
determined by referencing the long-term expected growth rate of the market in which cash-generating units belong
(about 0 to 3%). The discount rate is calculated based on the weighted-average capital cost before tax of cash-
generating units (about 5 to 12%).
Toyota Industries concluded that even if there were reasonably possible changes in key assumptions used in the
impairment assessment, it is unlikely that a material impairment would arise.
With respect to the balance of goodwill as of the end of the fiscal years ended March 31, 2017 and 2018, major items
include: goodwill recognized in conjunction with the acquisition of the Cascade Corporation Group in the Materials
Handling Equipment Segment; goodwill recognized in conjunction with the business transfer of Toyota Industries
Commercial Finance, Inc. (TICF); goodwill recognized in conjunction with the acquisition of the Vanderlande Group;
goodwill recognized in conjunction with the acquisition of the Bastian Group; and goodwill recognized in conjunction with
the acquisition of the Uster Technologies AG Group in the Textile Machinery Segment. Goodwill recognized in
conjunction with the acquisition of the Cascade Corporation Group is allocated to Cascade Corporation Group and
amounts to 27,387 million yen and 25,934 million yen as of the end of the fiscal years ended March 31, 2017 and 2018,
respectively. Goodwill recognized in conjunction with the business transfer of TICF is allocated to the Materials Handling
Equipment Business in North America which is functioning as the cash-generating unit and amounts to 26,315 million
yen and 24,919 million yen as of the end of the fiscal years ended March 31, 2017 and 2018, respectively. Goodwill
recognized in conjunction with the acquisition of the Vanderlande Group is allocated to the Material Handling Equipment
Business which is functioning as the cash-generating unit and amounts to 64,789 million yen as of the end of the fiscal
year ended March 31, 2018. Goodwill recognized in conjunction with the acquisition of the Bastian Group is allocated to
the Material Handling Equipment Business which is functioning as the cash-generating unit and amounts to 13,673
million yen as of the end of the fiscal year ended March 31, 2018. Goodwill recognized in conjunction with the
acquisition of the Uster Technologies AG Group is allocated to Uster Technologies AG group and amounts to 13,923
million yen and 13,831 million yen as of the end of the fiscal years ended March 31, 2017 and 2018, respectively.
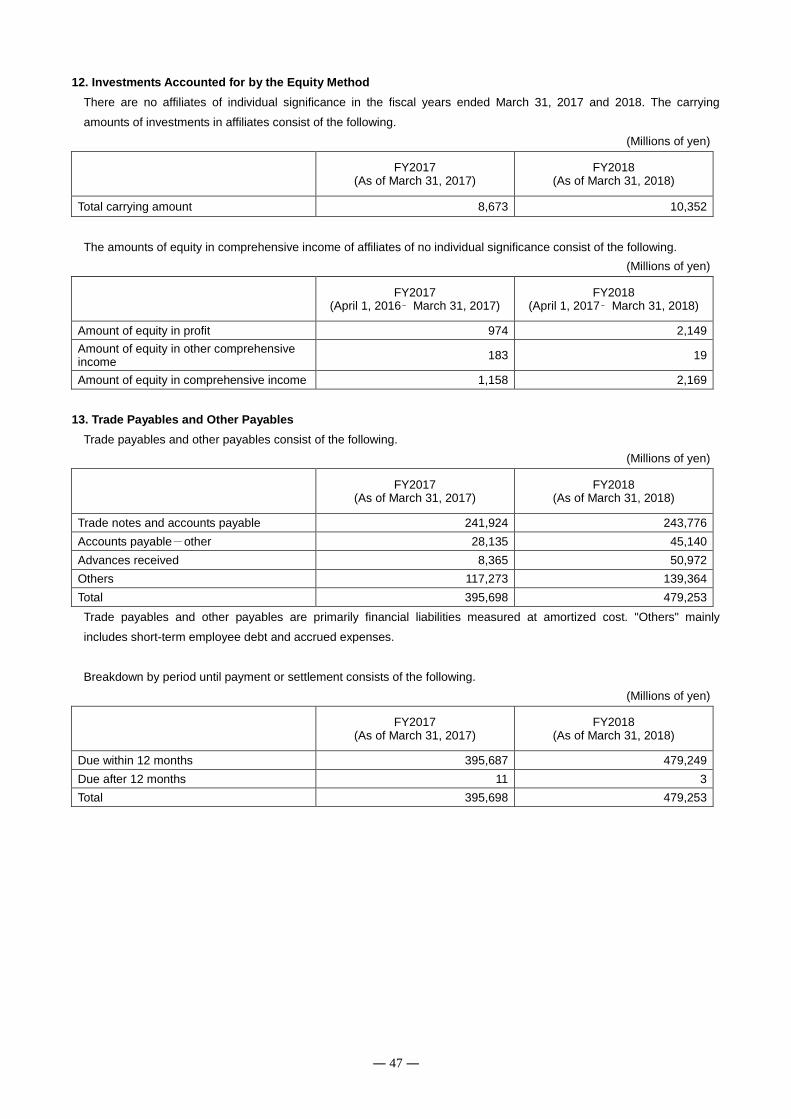
― 47 ―
12. Investments Accounted for by the Equity Method
There are no affiliates of individual significance in the fiscal years ended March 31, 2017 and 2018. The carrying
amounts of investments in affiliates consist of the following.
(Millions of yen)
FY2017
(As of March 31, 2017) FY2018
(As of March 31, 2018)
Total carrying amount 8,673 10,352
The amounts of equity in comprehensive income of affiliates of no individual significance consist of the following.
(Millions of yen)
FY2017
(April 1, 2016– March 31, 2017) FY2018
(April 1, 2017– March 31, 2018)
Amount of equity in profit 974 2,149
Amount of equity in other comprehensive income
183 19
Amount of equity in comprehensive income 1,158 2,169
13. Trade Payables and Other Payables
Trade payables and other payables consist of the following.
(Millions of yen)
FY2017
(As of March 31, 2017) FY2018
(As of March 31, 2018)
Trade notes and accounts payable 241,924 243,776
Accounts payable-other 28,135 45,140
Advances received 8,365 50,972
Others 117,273 139,364
Total 395,698 479,253
Trade payables and other payables are primarily financial liabilities measured at amortized cost. "Others" mainly
includes short-term employee debt and accrued expenses.
Breakdown by period until payment or settlement consists of the following.
(Millions of yen)
FY2017
(As of March 31, 2017) FY2018
(As of March 31, 2018)
Due within 12 months 395,687 479,249
Due after 12 months 11 3
Total 395,698 479,253
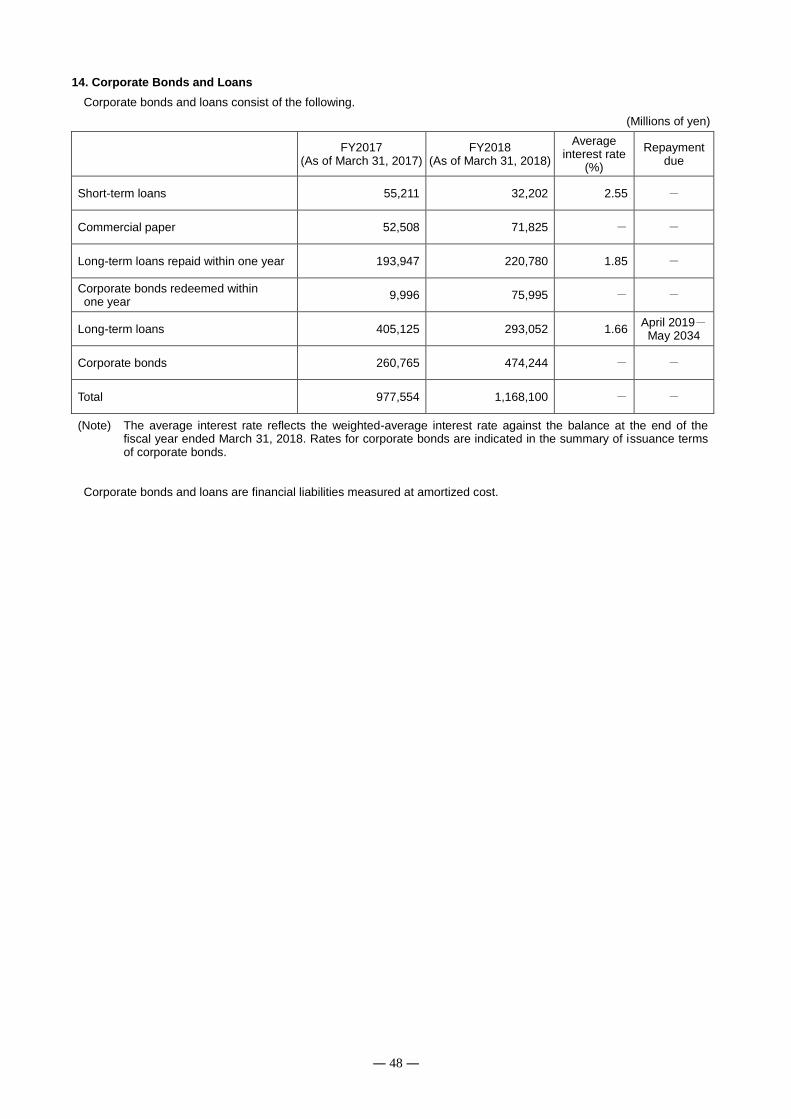
― 48 ―
14. Corporate Bonds and Loans
Corporate bonds and loans consist of the following.
(Millions of yen)
FY2017
(As of March 31, 2017) FY2018
(As of March 31, 2018)
Average interest rate
(%)
Repayment due
Short-term loans 55,211 32,202 2.55 -
Commercial paper 52,508 71,825 - -
Long-term loans repaid within one year 193,947 220,780 1.85 -
Corporate bonds redeemed within one year
9,996 75,995 - -
Long-term loans 405,125 293,052 1.66 April 2019-
May 2034
Corporate bonds 260,765 474,244 - -
Total 977,554 1,168,100 - -
(Note)
The average interest rate reflects the weighted-average interest rate against the balance at the end of the fiscal year ended March 31, 2018. Rates for corporate bonds are indicated in the summary of issuance terms of corporate bonds.
Corporate bonds and loans are financial liabilities measured at amortized cost.
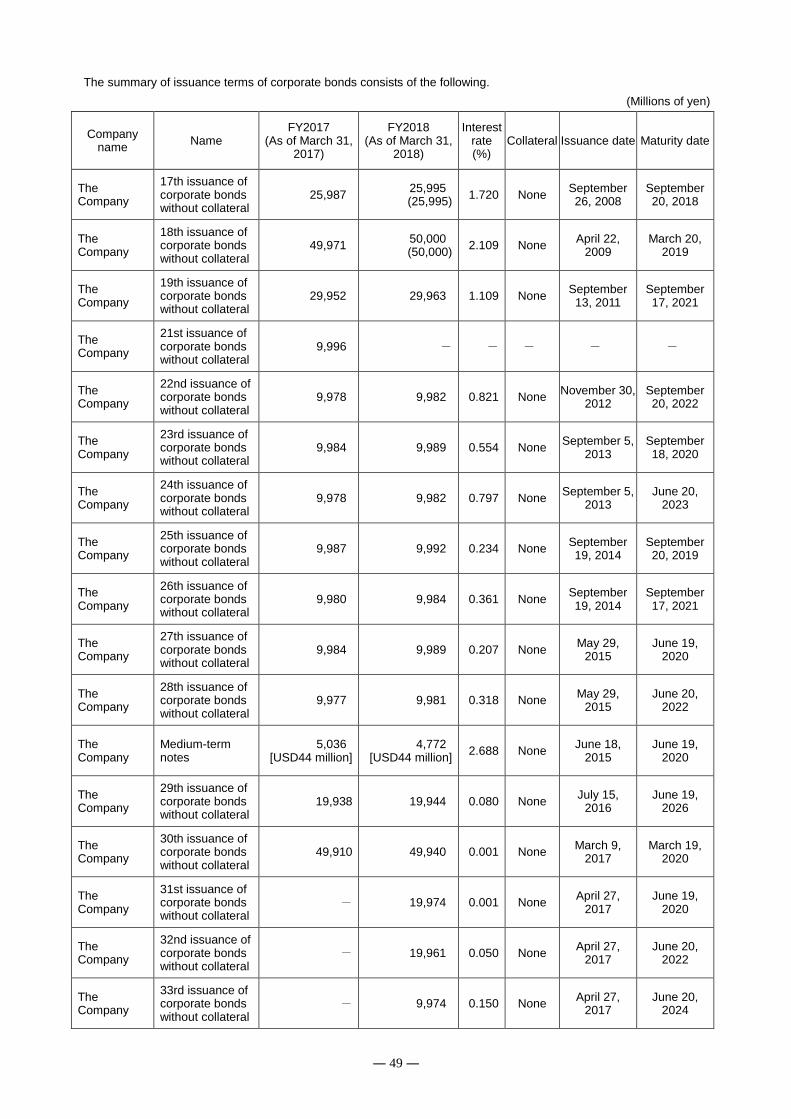
― 49 ―
The summary of issuance terms of corporate bonds consists of the following.
(Millions of yen)
Company name
Name FY2017
(As of March 31, 2017)
FY2018 (As of March 31,
2018)
Interest rate (%)
Collateral Issuance date Maturity date
The Company
17th issuance of corporate bonds without collateral
25,987 25,995 (25,995)
1.720 None September 26, 2008
September 20, 2018
The Company
18th issuance of corporate bonds without collateral
49,971 50,000 (50,000)
2.109 None April 22,
2009 March 20,
2019
The Company
19th issuance of corporate bonds without collateral
29,952 29,963 1.109 None September 13, 2011
September 17, 2021
The Company
21st issuance of corporate bonds without collateral
9,996 - - - - -
The Company
22nd issuance of corporate bonds without collateral
9,978 9,982 0.821 None November 30,
2012 September 20, 2022
The Company
23rd issuance of corporate bonds without collateral
9,984 9,989 0.554 None September 5,
2013 September 18, 2020
The Company
24th issuance of corporate bonds without collateral
9,978 9,982 0.797 None September 5,
2013 June 20,
2023
The Company
25th issuance of corporate bonds without collateral
9,987 9,992 0.234 None September 19, 2014
September 20, 2019
The Company
26th issuance of corporate bonds without collateral
9,980 9,984 0.361 None September 19, 2014
September 17, 2021
The Company
27th issuance of corporate bonds without collateral
9,984 9,989 0.207 None May 29,
2015 June 19,
2020
The Company
28th issuance of corporate bonds without collateral
9,977 9,981 0.318 None May 29,
2015 June 20,
2022
The Company
Medium-term notes
5,036 [USD44 million]
4,772 [USD44 million]
2.688 None June 18,
2015 June 19,
2020
The Company
29th issuance of corporate bonds without collateral
19,938 19,944 0.080 None July 15,
2016 June 19,
2026
The Company
30th issuance of corporate bonds without collateral
49,910 49,940 0.001 None March 9,
2017 March 19,
2020
The Company
31st issuance of corporate bonds without collateral
- 19,974 0.001 None April 27,
2017 June 19,
2020
The Company
32nd issuance of corporate bonds without collateral
- 19,961 0.050 None April 27,
2017 June 20,
2022
The Company
33rd issuance of corporate bonds without collateral
- 9,974 0.150 None April 27,
2017 June 20,
2024
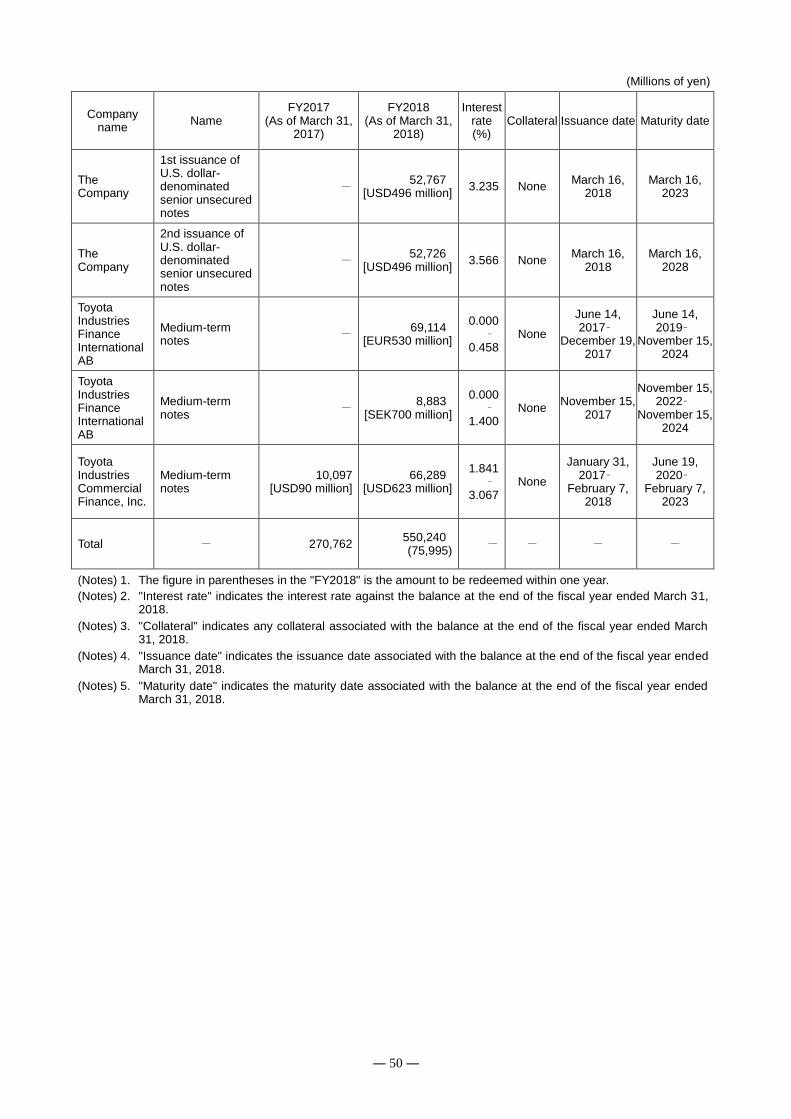
― 50 ―
(Millions of yen)
Company name
Name FY2017
(As of March 31, 2017)
FY2018 (As of March 31,
2018)
Interest rate (%)
Collateral Issuance date Maturity date
The Company
1st issuance of U.S. dollar-denominated senior unsecured notes
- 52,767
[USD496 million] 3.235 None
March 16, 2018
March 16, 2023
The Company
2nd issuance of U.S. dollar-denominated senior unsecured notes
- 52,726
[USD496 million] 3.566 None
March 16, 2018
March 16, 2028
Toyota Industries Finance International AB
Medium-term notes
- 69,114
[EUR530 million]
0.000–
0.458 None
June 14, 2017–
December 19, 2017
June 14, 2019–
November 15, 2024
Toyota Industries Finance International AB
Medium-term notes
- 8,883
[SEK700 million]
0.000–
1.400 None
November 15, 2017
November 15, 2022–
November 15, 2024
Toyota Industries Commercial Finance, Inc.
Medium-term notes
10,097 [USD90 million]
66,289 [USD623 million]
1.841–
3.067 None
January 31, 2017–
February 7, 2018
June 19, 2020–
February 7, 2023
Total - 270,762 550,240 (75,995)
- - - -
(Notes) 1. The figure in parentheses in the "FY2018" is the amount to be redeemed within one year.
(Notes) 2. "Interest rate" indicates the interest rate against the balance at the end of the fiscal year ended March 31, 2018.
(Notes) 3. "Collateral" indicates any collateral associated with the balance at the end of the fiscal year ended March 31, 2018.
(Notes) 4. "Issuance date" indicates the issuance date associated with the balance at the end of the fiscal year ended March 31, 2018.
(Notes) 5. "Maturity date" indicates the maturity date associated with the balance at the end of the fiscal year ended March 31, 2018.
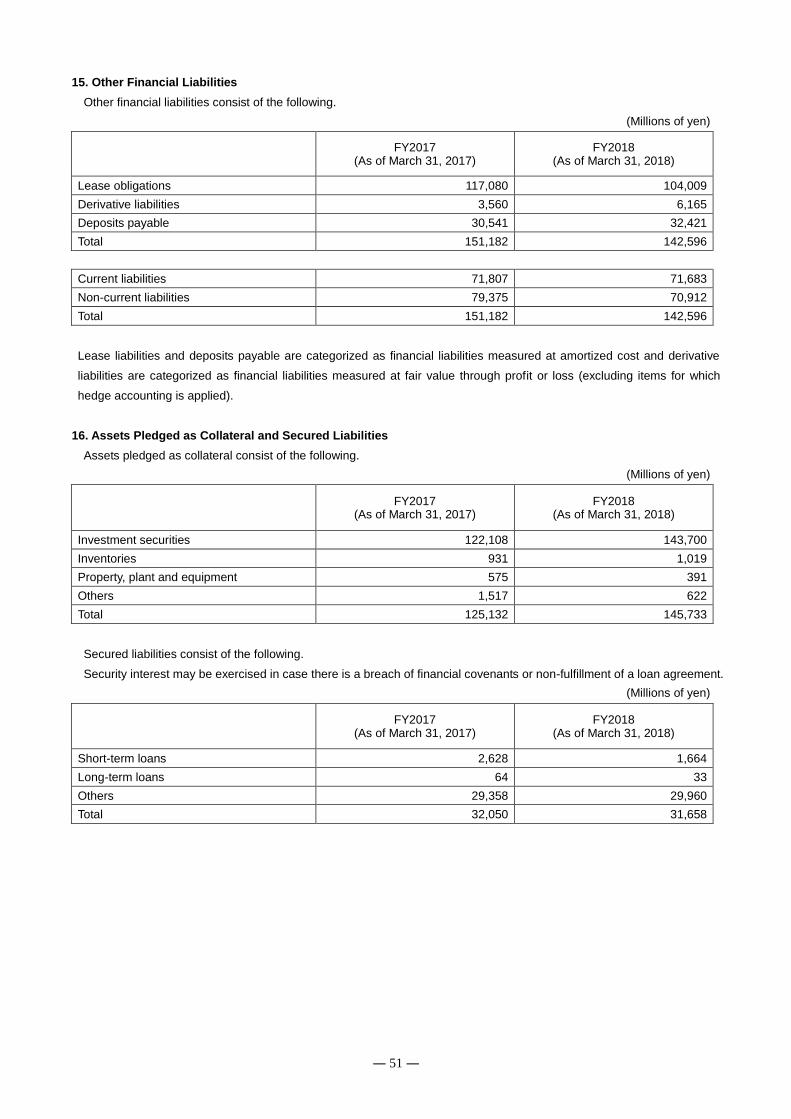
― 51 ―
15. Other Financial Liabilities
Other financial liabilities consist of the following.
(Millions of yen)
FY2017
(As of March 31, 2017) FY2018
(As of March 31, 2018)
Lease obligations 117,080 104,009
Derivative liabilities 3,560 6,165
Deposits payable 30,541 32,421
Total 151,182 142,596
Current liabilities 71,807 71,683
Non-current liabilities 79,375 70,912
Total 151,182 142,596
Lease liabilities and deposits payable are categorized as financial liabilities measured at amortized cost and derivative
liabilities are categorized as financial liabilities measured at fair value through profit or loss (excluding items for which
hedge accounting is applied).
16. Assets Pledged as Collateral and Secured Liabilities
Assets pledged as collateral consist of the following.
(Millions of yen)
FY2017
(As of March 31, 2017) FY2018
(As of March 31, 2018)
Investment securities 122,108 143,700
Inventories 931 1,019
Property, plant and equipment 575 391
Others 1,517 622
Total 125,132 145,733
Secured liabilities consist of the following.
Security interest may be exercised in case there is a breach of financial covenants or non-fulfillment of a loan agreement.
(Millions of yen)
FY2017
(As of March 31, 2017) FY2018
(As of March 31, 2018)
Short-term loans 2,628 1,664
Long-term loans 64 33
Others 29,358 29,960
Total 32,050 31,658
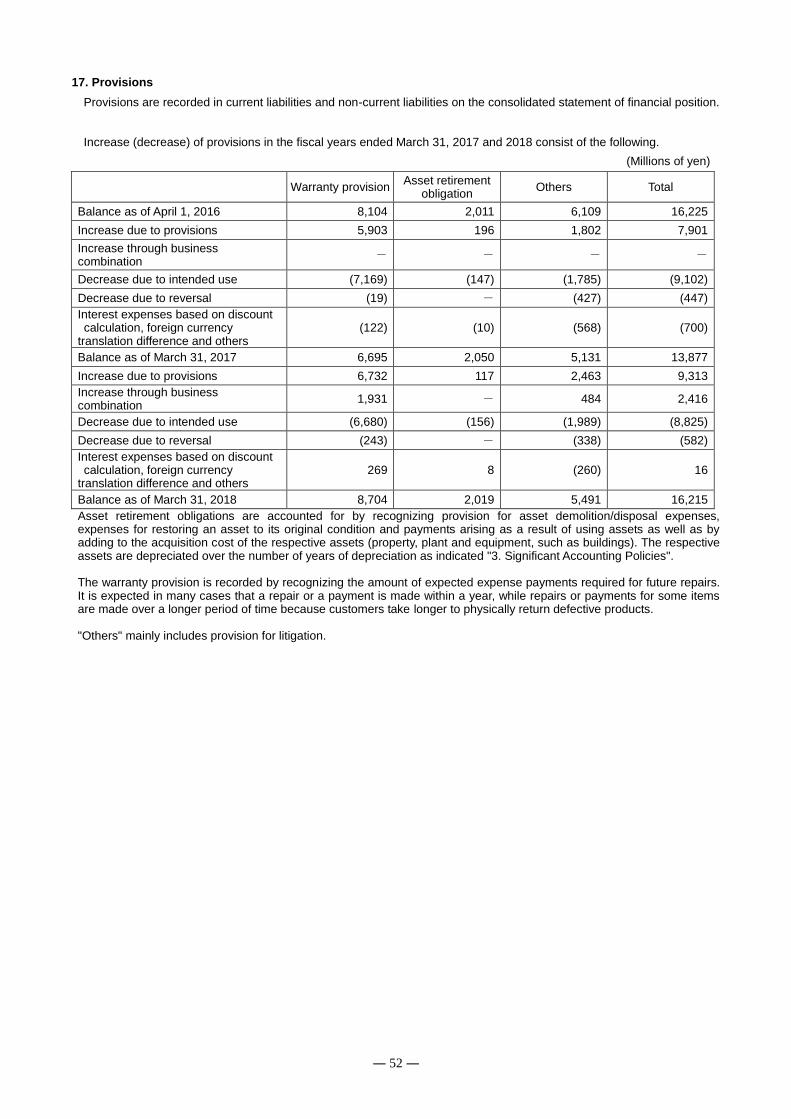
― 52 ―
17. Provisions
Provisions are recorded in current liabilities and non-current liabilities on the consolidated statement of financial position.
Increase (decrease) of provisions in the fiscal years ended March 31, 2017 and 2018 consist of the following.
(Millions of yen)
Warranty provision Asset retirement
obligation Others Total
Balance as of April 1, 2016 8,104 2,011 6,109 16,225
Increase due to provisions 5,903 196 1,802 7,901
Increase through business combination
- - - -
Decrease due to intended use (7,169) (147) (1,785) (9,102)
Decrease due to reversal (19) - (427) (447)
Interest expenses based on discount calculation, foreign currency translation difference and others
(122) (10) (568) (700)
Balance as of March 31, 2017 6,695 2,050 5,131 13,877
Increase due to provisions 6,732 117 2,463 9,313
Increase through business combination
1,931 - 484 2,416
Decrease due to intended use (6,680) (156) (1,989) (8,825)
Decrease due to reversal (243) - (338) (582)
Interest expenses based on discount calculation, foreign currency translation difference and others
269 8 (260) 16
Balance as of March 31, 2018 8,704 2,019 5,491 16,215
Asset retirement obligations are accounted for by recognizing provision for asset demolition/disposal expenses, expenses for restoring an asset to its original condition and payments arising as a result of using assets as well as by adding to the acquisition cost of the respective assets (property, plant and equipment, such as buildings). The respective assets are depreciated over the number of years of depreciation as indicated "3. Significant Accounting Policies". The warranty provision is recorded by recognizing the amount of expected expense payments required for future repairs. It is expected in many cases that a repair or a payment is made within a year, while repairs or payments for some items are made over a longer period of time because customers take longer to physically return defective products. "Others" mainly includes provision for litigation.
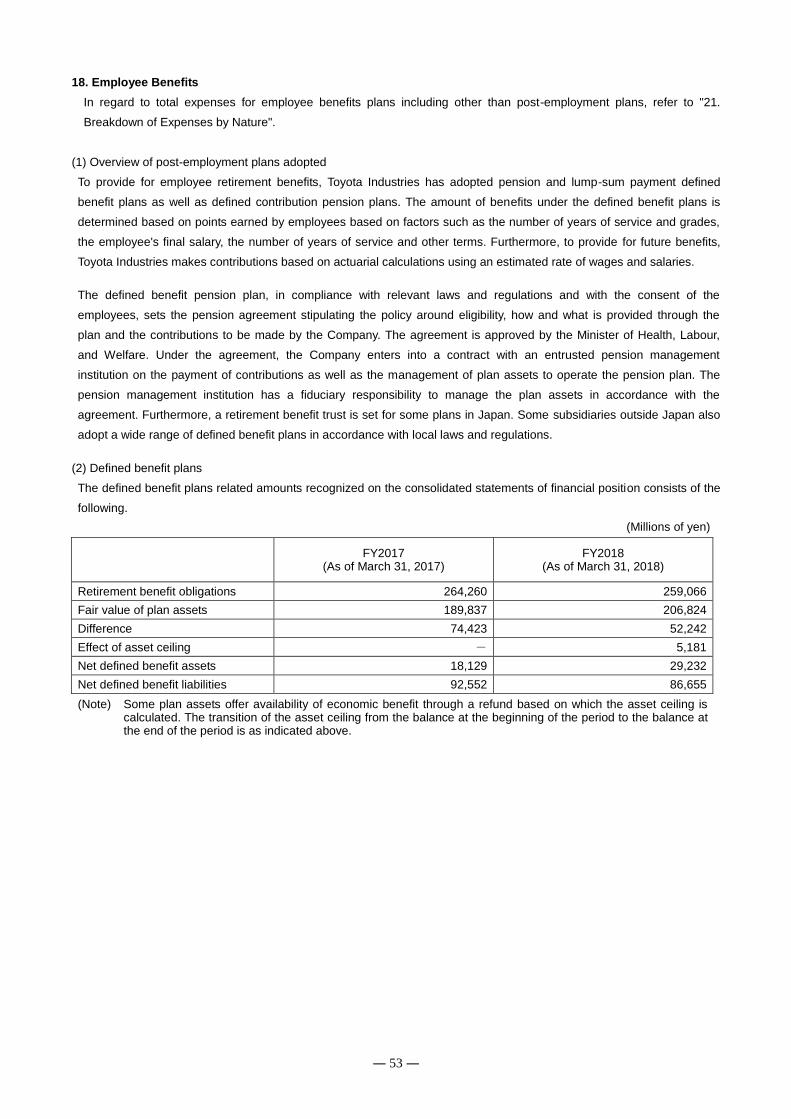
― 53 ―
18. Employee Benefits
In regard to total expenses for employee benefits plans including other than post-employment plans, refer to "21.
Breakdown of Expenses by Nature".
(1) Overview of post-employment plans adopted
To provide for employee retirement benefits, Toyota Industries has adopted pension and lump-sum payment defined
benefit plans as well as defined contribution pension plans. The amount of benefits under the defined benefit plans is
determined based on points earned by employees based on factors such as the number of years of service and grades,
the employee's final salary, the number of years of service and other terms. Furthermore, to provide for future benefits,
Toyota Industries makes contributions based on actuarial calculations using an estimated rate of wages and salaries.
The defined benefit pension plan, in compliance with relevant laws and regulations and with the consent of the
employees, sets the pension agreement stipulating the policy around eligibility, how and what is provided through the
plan and the contributions to be made by the Company. The agreement is approved by the Minister of Health, Labour,
and Welfare. Under the agreement, the Company enters into a contract with an entrusted pension management
institution on the payment of contributions as well as the management of plan assets to operate the pension plan. The
pension management institution has a fiduciary responsibility to manage the plan assets in accordance with the
agreement. Furthermore, a retirement benefit trust is set for some plans in Japan. Some subsidiaries outside Japan also
adopt a wide range of defined benefit plans in accordance with local laws and regulations.
(2) Defined benefit plans
The defined benefit plans related amounts recognized on the consolidated statements of financial position consists of the
following.
(Millions of yen)
FY2017
(As of March 31, 2017) FY2018
(As of March 31, 2018)
Retirement benefit obligations 264,260 259,066
Fair value of plan assets 189,837 206,824
Difference 74,423 52,242
Effect of asset ceiling - 5,181
Net defined benefit assets 18,129 29,232
Net defined benefit liabilities 92,552 86,655 (Note)
Some plan assets offer availability of economic benefit through a refund based on which the asset ceiling is calculated. The transition of the asset ceiling from the balance at the beginning of the period to the balance at the end of the period is as indicated above.
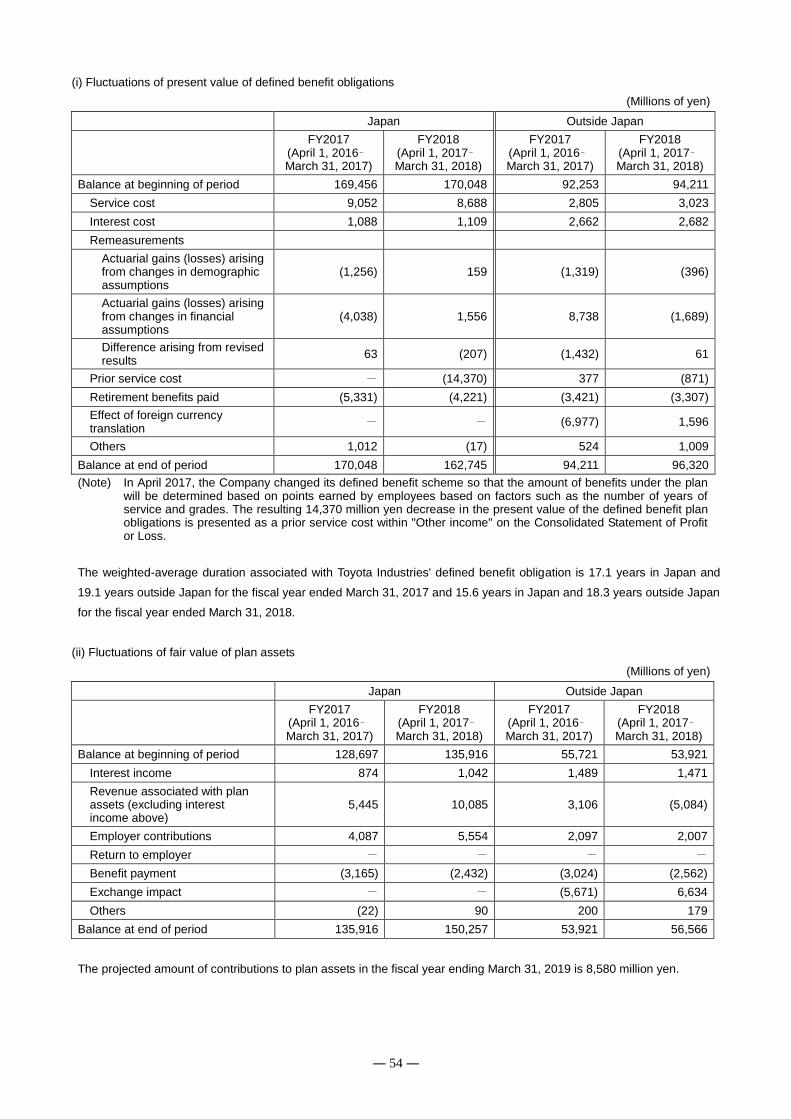
― 54 ―
(i) Fluctuations of present value of defined benefit obligations
(Millions of yen)
Japan Outside Japan
FY2017
(April 1, 2016–March 31, 2017)
FY2018 (April 1, 2017–March 31, 2018)
FY2017
(April 1, 2016–March 31, 2017)
FY2018 (April 1, 2017–March 31, 2018)
Balance at beginning of period 169,456 170,048 92,253 94,211
Service cost 9,052 8,688 2,805 3,023
Interest cost 1,088 1,109 2,662 2,682
Remeasurements
Actuarial gains (losses) arising from changes in demographic assumptions
(1,256) 159 (1,319) (396)
Actuarial gains (losses) arising from changes in financial assumptions
(4,038) 1,556 8,738 (1,689)
Difference arising from revised results
63 (207) (1,432) 61
Prior service cost - (14,370) 377 (871)
Retirement benefits paid (5,331) (4,221) (3,421) (3,307)
Effect of foreign currency translation
- - (6,977) 1,596
Others 1,012 (17) 524 1,009
Balance at end of period 170,048 162,745 94,211 96,320 (Note)
In April 2017, the Company changed its defined benefit scheme so that the amount of benefits under the plan will be determined based on points earned by employees based on factors such as the number of years of service and grades. The resulting 14,370 million yen decrease in the present value of the defined benefit plan obligations is presented as a prior service cost within "Other income" on the Consolidated Statement of Profit or Loss.
The weighted-average duration associated with Toyota Industries' defined benefit obligation is 17.1 years in Japan and
19.1 years outside Japan for the fiscal year ended March 31, 2017 and 15.6 years in Japan and 18.3 years outside Japan
for the fiscal year ended March 31, 2018.
(ii) Fluctuations of fair value of plan assets
(Millions of yen)
Japan Outside Japan
FY2017
(April 1, 2016–March 31, 2017)
FY2018 (April 1, 2017–March 31, 2018)
FY2017 (April 1, 2016–March 31, 2017)
FY2018 (April 1, 2017–March 31, 2018)
Balance at beginning of period 128,697 135,916 55,721 53,921
Interest income 874 1,042 1,489 1,471
Revenue associated with plan assets (excluding interest income above)
5,445 10,085 3,106 (5,084)
Employer contributions 4,087 5,554 2,097 2,007
Return to employer - - - -
Benefit payment (3,165) (2,432) (3,024) (2,562)
Exchange impact - - (5,671) 6,634
Others (22) 90 200 179
Balance at end of period 135,916 150,257 53,921 56,566
The projected amount of contributions to plan assets in the fiscal year ending March 31, 2019 is 8,580 million yen.
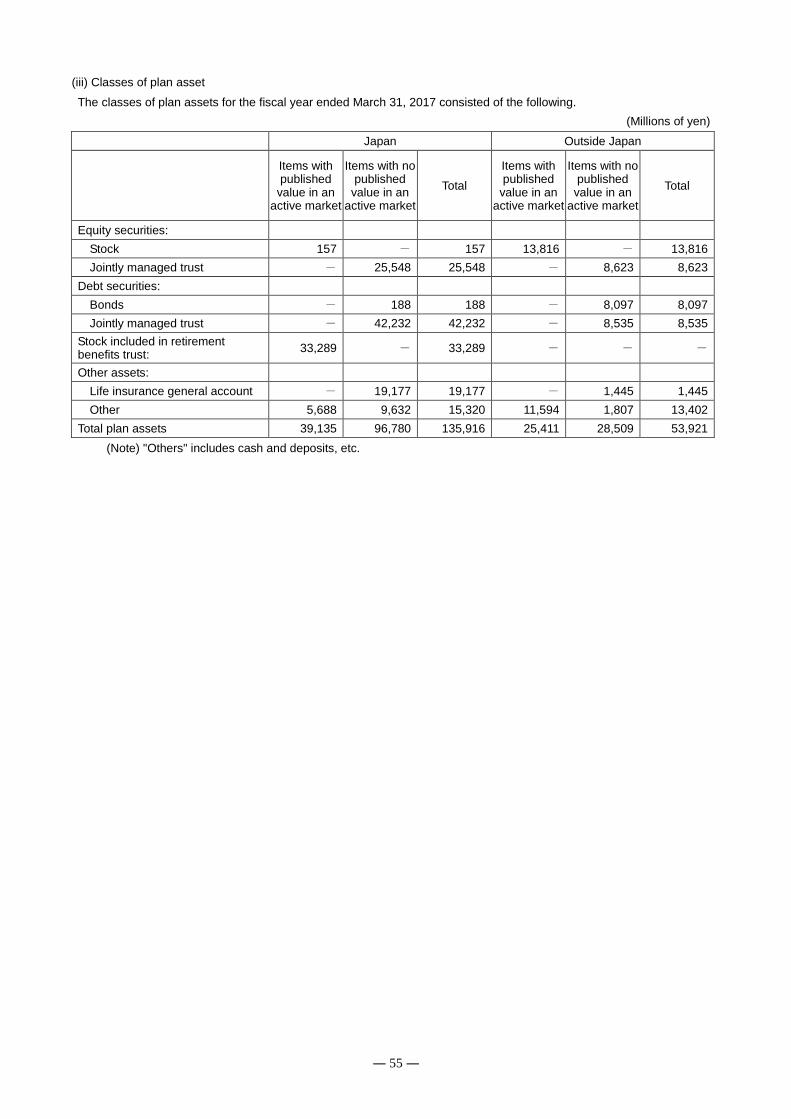
― 55 ―
(iii) Classes of plan asset
The classes of plan assets for the fiscal year ended March 31, 2017 consisted of the following.
(Millions of yen)
Japan Outside Japan
Items with published
value in an active market
Items with no published
value in an active market
Total
Items with published
value in an active market
Items with no published
value in an active market
Total
Equity securities:
Stock 157 - 157 13,816 - 13,816
Jointly managed trust - 25,548 25,548 - 8,623 8,623
Debt securities:
Bonds - 188 188 - 8,097 8,097
Jointly managed trust - 42,232 42,232 - 8,535 8,535
Stock included in retirement benefits trust:
33,289 - 33,289 - - -
Other assets:
Life insurance general account - 19,177 19,177 - 1,445 1,445
Other 5,688 9,632 15,320 11,594 1,807 13,402
Total plan assets 39,135 96,780 135,916 25,411 28,509 53,921
(Note) "Others" includes cash and deposits, etc.
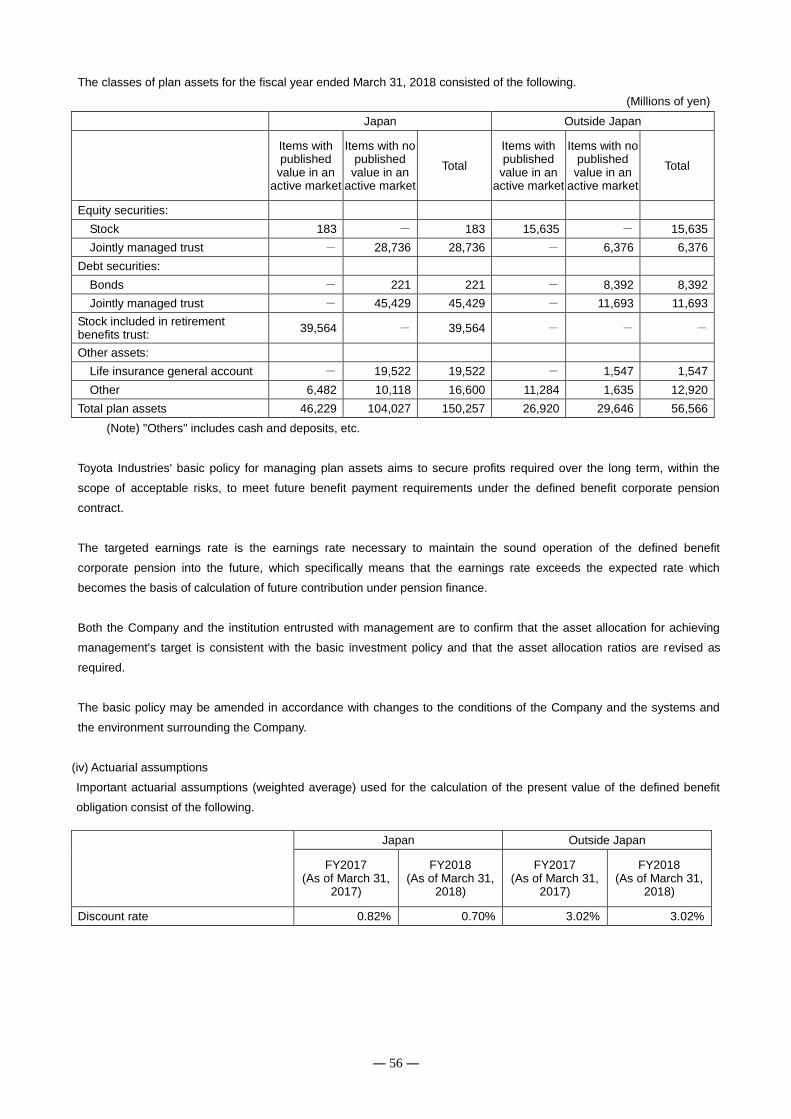
― 56 ―
The classes of plan assets for the fiscal year ended March 31, 2018 consisted of the following.
(Millions of yen)
Japan Outside Japan
Items with published
value in an active market
Items with no published
value in an active market
Total
Items with published
value in an active market
Items with no published
value in an active market
Total
Equity securities:
Stock 183 - 183 15,635 - 15,635
Jointly managed trust - 28,736 28,736 - 6,376 6,376
Debt securities:
Bonds - 221 221 - 8,392 8,392
Jointly managed trust - 45,429 45,429 - 11,693 11,693
Stock included in retirement benefits trust:
39,564 - 39,564 - - -
Other assets:
Life insurance general account - 19,522 19,522 - 1,547 1,547
Other 6,482 10,118 16,600 11,284 1,635 12,920
Total plan assets 46,229 104,027 150,257 26,920 29,646 56,566
(Note) "Others" includes cash and deposits, etc.
Toyota Industries' basic policy for managing plan assets aims to secure profits required over the long term, within the
scope of acceptable risks, to meet future benefit payment requirements under the defined benefit corporate pension
contract.
The targeted earnings rate is the earnings rate necessary to maintain the sound operation of the defined benefit
corporate pension into the future, which specifically means that the earnings rate exceeds the expected rate which
becomes the basis of calculation of future contribution under pension finance.
Both the Company and the institution entrusted with management are to confirm that the asset allocation for achieving
management's target is consistent with the basic investment policy and that the asset allocation ratios are revised as
required.
The basic policy may be amended in accordance with changes to the conditions of the Company and the systems and
the environment surrounding the Company.
(iv) Actuarial assumptions
Important actuarial assumptions (weighted average) used for the calculation of the present value of the defined benefit
obligation consist of the following.
Japan Outside Japan
FY2017 (As of March 31,
2017)
FY2018 (As of March 31,
2018)
FY2017 (As of March 31,
2017)
FY2018 (As of March 31,
2018)
Discount rate 0.82 % 0.70 % 3.02 % 3.02 %

― 57 ―
In cases where the discount rate fluctuates at the ratios indicated below, assuming there are no changes to other
assumptions, the defined benefit obligation as of the end of the fiscal year ended March 31, 2017 and 2018 would have
been impacted as follows. While the sensitivity analysis assumes that there are no changes in other assumptions, it is
possible that changes in other assumptions could impact the sensitivity analysis.
(Millions of yen)
FY2017
(As of March 31, 2017) FY2018
(As of March 31, 2018)
Discount rate
Japan 0.5% increase (11,116) (9,642)
0.5% decrease 12,521 10,726
Outside Japan
0.5% increase (6,971) (6,996)
0.5% decrease 7,803 7,744
(3) Defined contribution pension plan
The amount of contributions paid for the defined contribution pension plan for the fiscal years ended March 31, 2017 and
2018 were 6,021 million yen and 7,091 million yen, respectively. Welfare insurance premiums are accounted for in the
defined contribution pension plan and included in employee benefits expenses.
(4) Multi-employer plan
Certain subsidiaries in Japan participate in corporate pension funds of a multi-employer plan. Because the plan is a multi-
employer-type defined benefit plan and the amount of pension investment corresponding to the contribution by one's own
company cannot be rationally calculated, the amount of contribution required is accounted for as retirement benefit
expenses. The Nagano Machine and Allied Products Employees' Pension Fund, in which certain domestic subsidiaries
were enrolled, transferred to the government the substitutional portion of the employee pension fund liabilities on April 1,
2017 and became the Nagano Machine and Allied Products Employees' Corporate Pension Fund. Additionally, the Japan
Industrial Machine and Allied Products Employees' Pension Fund, in which certain domestic subsidiaries were enrolled,
transferred to the government the substitutional portion of the employee pension fund liabilities on May 1, 2017 and
became the Japan Industrial Machine and Allied Products Employees' Corporate Pension Fund.
The amount of the contribution required in each fiscal year consists of the following.
(Millions of yen)
FY2017
(April 1, 2016– March 31, 2017) FY2018
(April 1, 2017– March 31, 2018)
Contributions 56 57
The projected contribution in the fiscal year ending March 31, 2019 is 57 million yen.
The funded and unfunded status, on an aggregation basis of the Group's entire plans are as follows.
(Millions of yen)
FY2017
(As of March 31, 2017) FY2018
(As of March 31, 2018)
Plan assets 102,683 98,881
Actuarial liability based on pension plan finance calculation and minimum actuarial reserve
126,106 134,733
Funded/(Unfunded) amount (23,423) (35,852)
The rate of contributions of Toyota Industries within the entire plan consists of the following.
FY2017
(As of March 31, 2017) FY2018
(As of March 31, 2018)
Rate of contribution 6.37 % 6.64 %
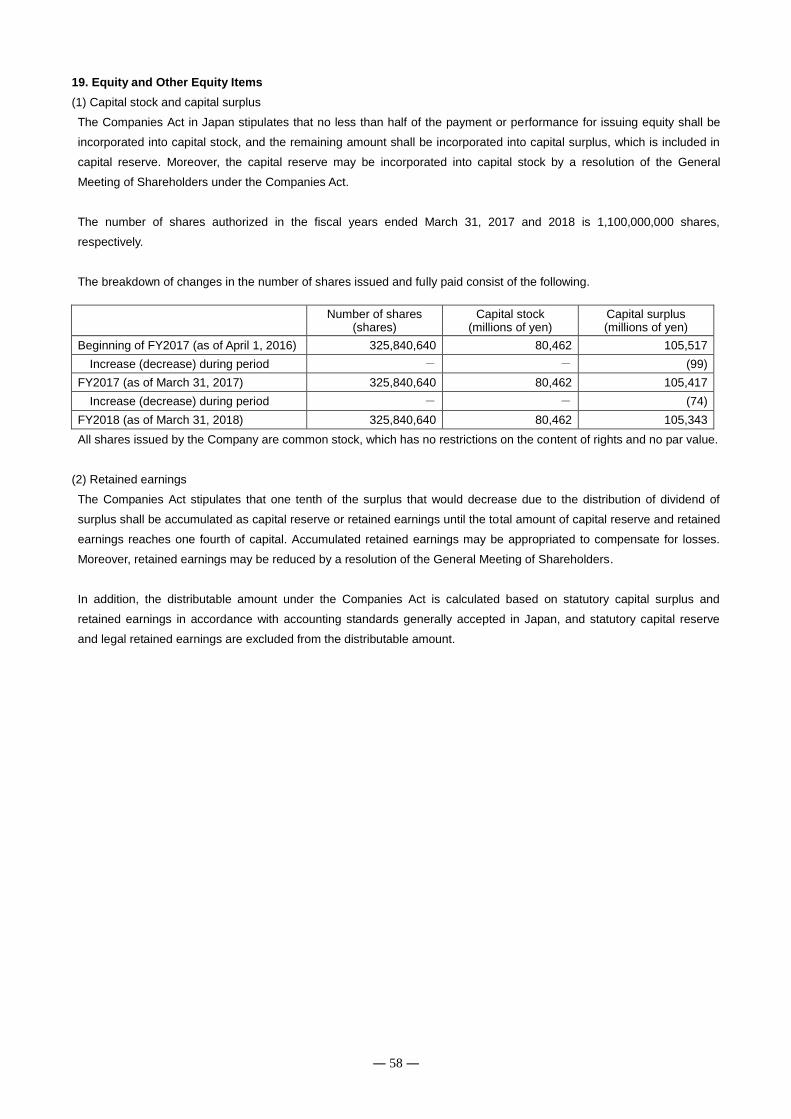
― 58 ―
19. Equity and Other Equity Items
(1) Capital stock and capital surplus
The Companies Act in Japan stipulates that no less than half of the payment or performance for issuing equity shall be
incorporated into capital stock, and the remaining amount shall be incorporated into capital surplus, which is included in
capital reserve. Moreover, the capital reserve may be incorporated into capital stock by a resolution of the General
Meeting of Shareholders under the Companies Act.
The number of shares authorized in the fiscal years ended March 31, 2017 and 2018 is 1,100,000,000 shares,
respectively.
The breakdown of changes in the number of shares issued and fully paid consist of the following.
Number of shares
(shares) Capital stock
(millions of yen) Capital surplus (millions of yen)
Beginning of FY2017 (as of April 1, 2016) 325,840,640 80,462 105,517
Increase (decrease) during period - - (99)
FY2017 (as of March 31, 2017) 325,840,640 80,462 105,417
Increase (decrease) during period - - (74)
FY2018 (as of March 31, 2018) 325,840,640 80,462 105,343
All shares issued by the Company are common stock, which has no restrictions on the content of rights and no par value.
(2) Retained earnings
The Companies Act stipulates that one tenth of the surplus that would decrease due to the distribution of dividend of
surplus shall be accumulated as capital reserve or retained earnings until the total amount of capital reserve and retained
earnings reaches one fourth of capital. Accumulated retained earnings may be appropriated to compensate for losses.
Moreover, retained earnings may be reduced by a resolution of the General Meeting of Shareholders.
In addition, the distributable amount under the Companies Act is calculated based on statutory capital surplus and
retained earnings in accordance with accounting standards generally accepted in Japan, and statutory capital reserve
and legal retained earnings are excluded from the distributable amount.
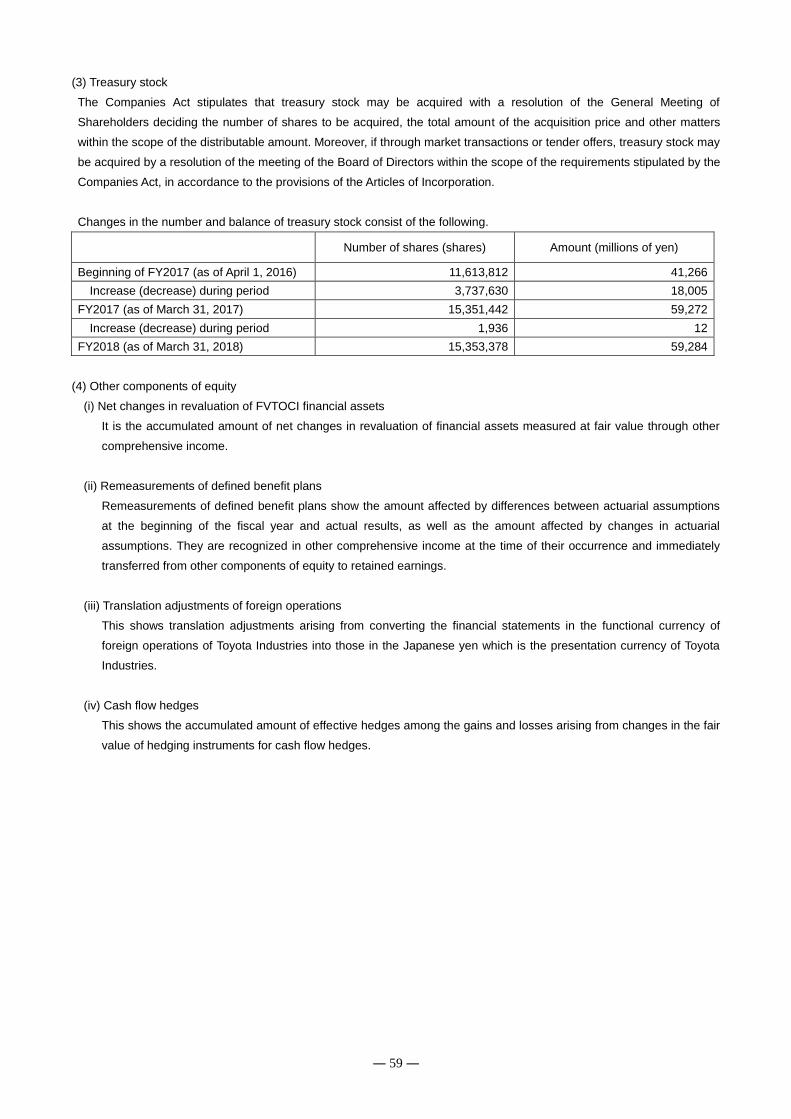
― 59 ―
(3) Treasury stock
The Companies Act stipulates that treasury stock may be acquired with a resolution of the General Meeting of
Shareholders deciding the number of shares to be acquired, the total amount of the acquisition price and other matters
within the scope of the distributable amount. Moreover, if through market transactions or tender offers, treasury stock may
be acquired by a resolution of the meeting of the Board of Directors within the scope of the requirements stipulated by the
Companies Act, in accordance to the provisions of the Articles of Incorporation.
Changes in the number and balance of treasury stock consist of the following.
Number of shares (shares) Amount (millions of yen)
Beginning of FY2017 (as of April 1, 2016) 11,613,812 41,266
Increase (decrease) during period 3,737,630 18,005
FY2017 (as of March 31, 2017) 15,351,442 59,272
Increase (decrease) during period 1,936 12
FY2018 (as of March 31, 2018) 15,353,378 59,284
(4) Other components of equity
(i) Net changes in revaluation of FVTOCI financial assets
It is the accumulated amount of net changes in revaluation of financial assets measured at fair value through other
comprehensive income.
(ii) Remeasurements of defined benefit plans
Remeasurements of defined benefit plans show the amount affected by differences between actuarial assumptions
at the beginning of the fiscal year and actual results, as well as the amount affected by changes in actuarial
assumptions. They are recognized in other comprehensive income at the time of their occurrence and immediately
transferred from other components of equity to retained earnings.
(iii) Translation adjustments of foreign operations
This shows translation adjustments arising from converting the financial statements in the functional currency of
foreign operations of Toyota Industries into those in the Japanese yen which is the presentation currency of Toyota
Industries.
(iv) Cash flow hedges
This shows the accumulated amount of effective hedges among the gains and losses arising from changes in the fair
value of hedging instruments for cash flow hedges.
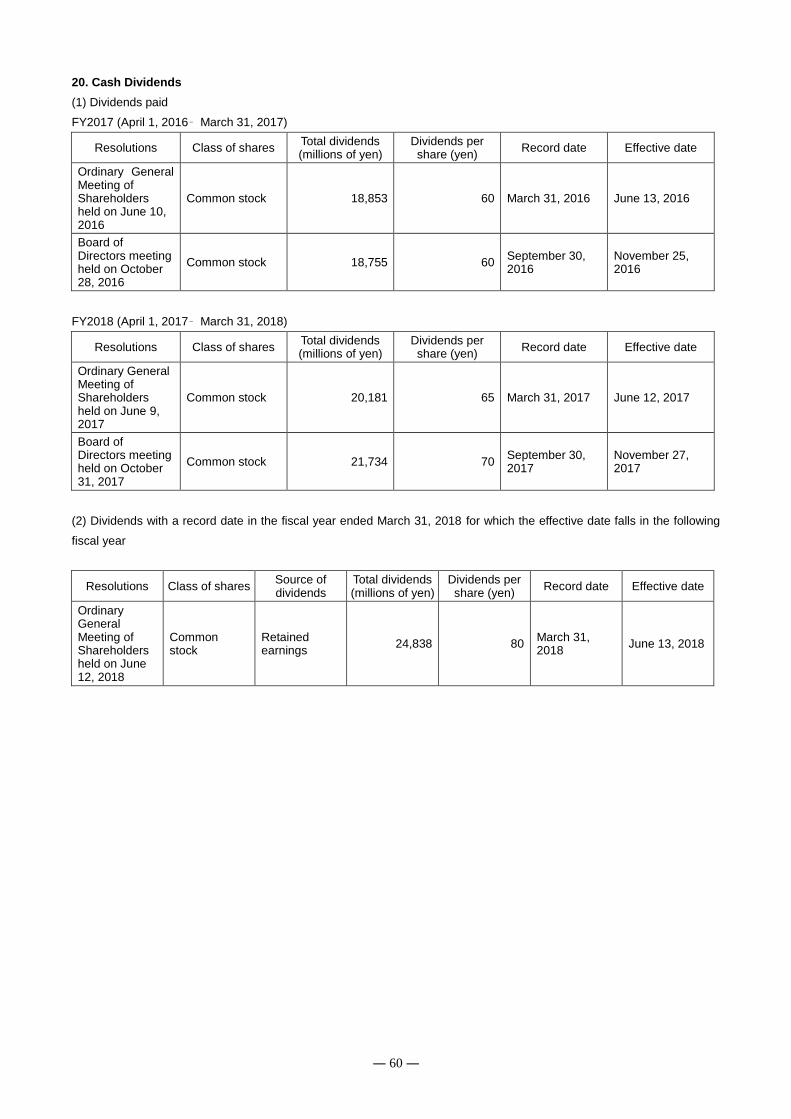
― 60 ―
20. Cash Dividends
(1) Dividends paid
FY2017 (April 1, 2016– March 31, 2017)
Resolutions Class of shares Total dividends (millions of yen)
Dividends per share (yen)
Record date Effective date
Ordinary General Meeting of Shareholders held on June 10, 2016
Common stock 18,853 60 March 31, 2016 June 13, 2016
Board of Directors meeting held on October 28, 2016
Common stock 18,755 60 September 30, 2016
November 25, 2016
FY2018 (April 1, 2017– March 31, 2018)
Resolutions Class of shares Total dividends (millions of yen)
Dividends per share (yen)
Record date Effective date
Ordinary General Meeting of Shareholders held on June 9, 2017
Common stock 20,181 65 March 31, 2017 June 12, 2017
Board of Directors meeting held on October 31, 2017
Common stock 21,734 70 September 30, 2017
November 27, 2017
(2) Dividends with a record date in the fiscal year ended March 31, 2018 for which the effective date falls in the following
fiscal year
Resolutions Class of shares Source of dividends
Total dividends (millions of yen)
Dividends per share (yen)
Record date Effective date
Ordinary General Meeting of Shareholders held on June 12, 2018
Common stock
Retained earnings
24,838 80 March 31, 2018
June 13, 2018
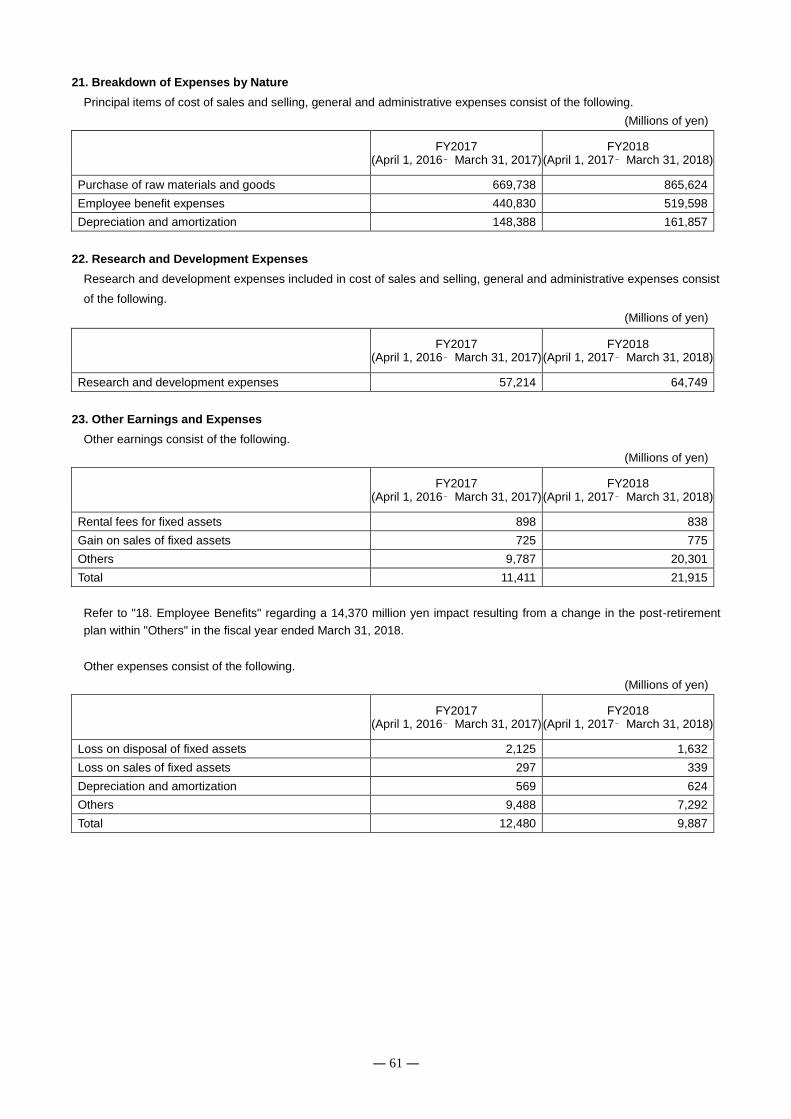
― 61 ―
21. Breakdown of Expenses by Nature
Principal items of cost of sales and selling, general and administrative expenses consist of the following.
(Millions of yen)
FY2017
(April 1, 2016– March 31, 2017) FY2018
(April 1, 2017– March 31, 2018)
Purchase of raw materials and goods 669,738 865,624
Employee benefit expenses 440,830 519,598
Depreciation and amortization 148,388 161,857
22. Research and Development Expenses
Research and development expenses included in cost of sales and selling, general and administrative expenses consist
of the following.
(Millions of yen)
FY2017
(April 1, 2016– March 31, 2017) FY2018
(April 1, 2017– March 31, 2018)
Research and development expenses 57,214 64,749
23. Other Earnings and Expenses
Other earnings consist of the following.
(Millions of yen)
FY2017
(April 1, 2016– March 31, 2017) FY2018
(April 1, 2017– March 31, 2018)
Rental fees for fixed assets 898 838
Gain on sales of fixed assets 725 775
Others 9,787 20,301
Total 11,411 21,915
Refer to "18. Employee Benefits" regarding a 14,370 million yen impact resulting from a change in the post-retirement
plan within "Others" in the fiscal year ended March 31, 2018.
Other expenses consist of the following.
(Millions of yen)
FY2017
(April 1, 2016– March 31, 2017) FY2018
(April 1, 2017– March 31, 2018)
Loss on disposal of fixed assets 2,125 1,632
Loss on sales of fixed assets 297 339
Depreciation and amortization 569 624
Others 9,488 7,292
Total 12,480 9,887
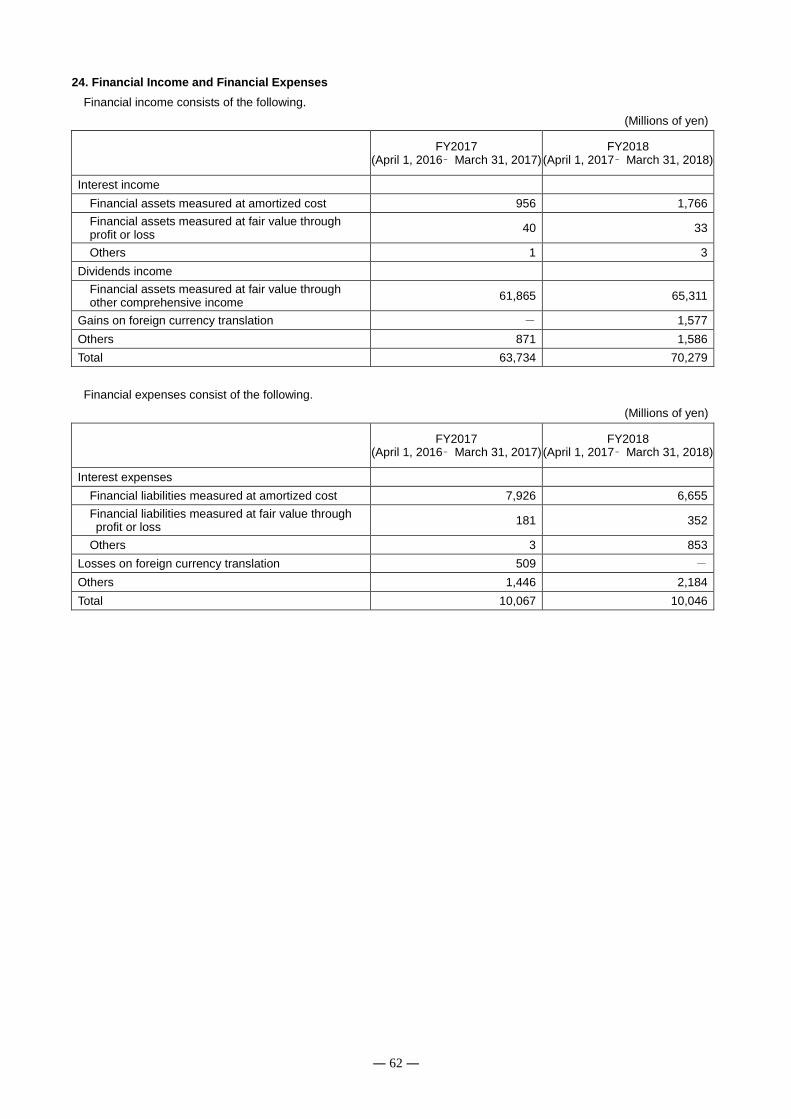
― 62 ―
24. Financial Income and Financial Expenses
Financial income consists of the following.
(Millions of yen)
FY2017
(April 1, 2016– March 31, 2017) FY2018
(April 1, 2017– March 31, 2018)
Interest income
Financial assets measured at amortized cost 956 1,766
Financial assets measured at fair value through profit or loss
40 33
Others 1 3
Dividends income
Financial assets measured at fair value through other comprehensive income
61,865 65,311
Gains on foreign currency translation - 1,577
Others 871 1,586
Total 63,734 70,279
Financial expenses consist of the following.
(Millions of yen)
FY2017
(April 1, 2016– March 31, 2017) FY2018
(April 1, 2017– March 31, 2018)
Interest expenses
Financial liabilities measured at amortized cost 7,926 6,655
Financial liabilities measured at fair value through profit or loss
181 352
Others 3 853
Losses on foreign currency translation 509 -
Others 1,446 2,184
Total 10,067 10,046
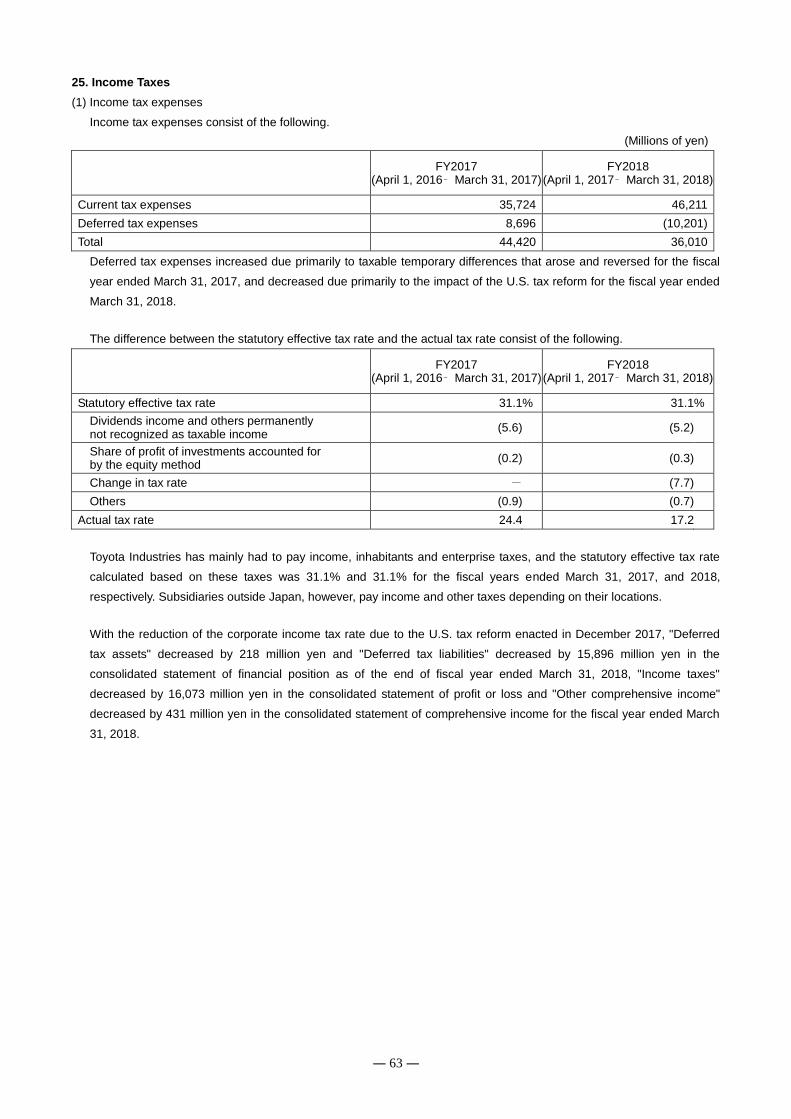
― 63 ―
25. Income Taxes
(1) Income tax expenses
Income tax expenses consist of the following.
(Millions of yen)
FY2017
(April 1, 2016– March 31, 2017) FY2018
(April 1, 2017– March 31, 2018)
Current tax expenses 35,724 46,211
Deferred tax expenses 8,696 (10,201)
Total 44,420 36,010
Deferred tax expenses increased due primarily to taxable temporary differences that arose and reversed for the fiscal
year ended March 31, 2017, and decreased due primarily to the impact of the U.S. tax reform for the fiscal year ended
March 31, 2018.
The difference between the statutory effective tax rate and the actual tax rate consist of the following.
FY2017
(April 1, 2016– March 31, 2017) FY2018
(April 1, 2017– March 31, 2018)
Statutory effective tax rate 31.1 % 31.1 %
Dividends income and others permanently not recognized as taxable income
(5.6) (5.2)
Share of profit of investments accounted for by the equity method
(0.2) (0.3)
Change in tax rate - (7.7)
Others (0.9) (0.7)
Actual tax rate 24.4 17.2
Toyota Industries has mainly had to pay income, inhabitants and enterprise taxes, and the statutory effective tax rate
calculated based on these taxes was 31.1% and 31.1% for the fiscal years ended March 31, 2017, and 2018,
respectively. Subsidiaries outside Japan, however, pay income and other taxes depending on their locations.
With the reduction of the corporate income tax rate due to the U.S. tax reform enacted in December 2017, "Deferred
tax assets" decreased by 218 million yen and "Deferred tax liabilities" decreased by 15,896 million yen in the
consolidated statement of financial position as of the end of fiscal year ended March 31, 2018, "Income taxes"
decreased by 16,073 million yen in the consolidated statement of profit or loss and "Other comprehensive income"
decreased by 431 million yen in the consolidated statement of comprehensive income for the fiscal year ended March
31, 2018.
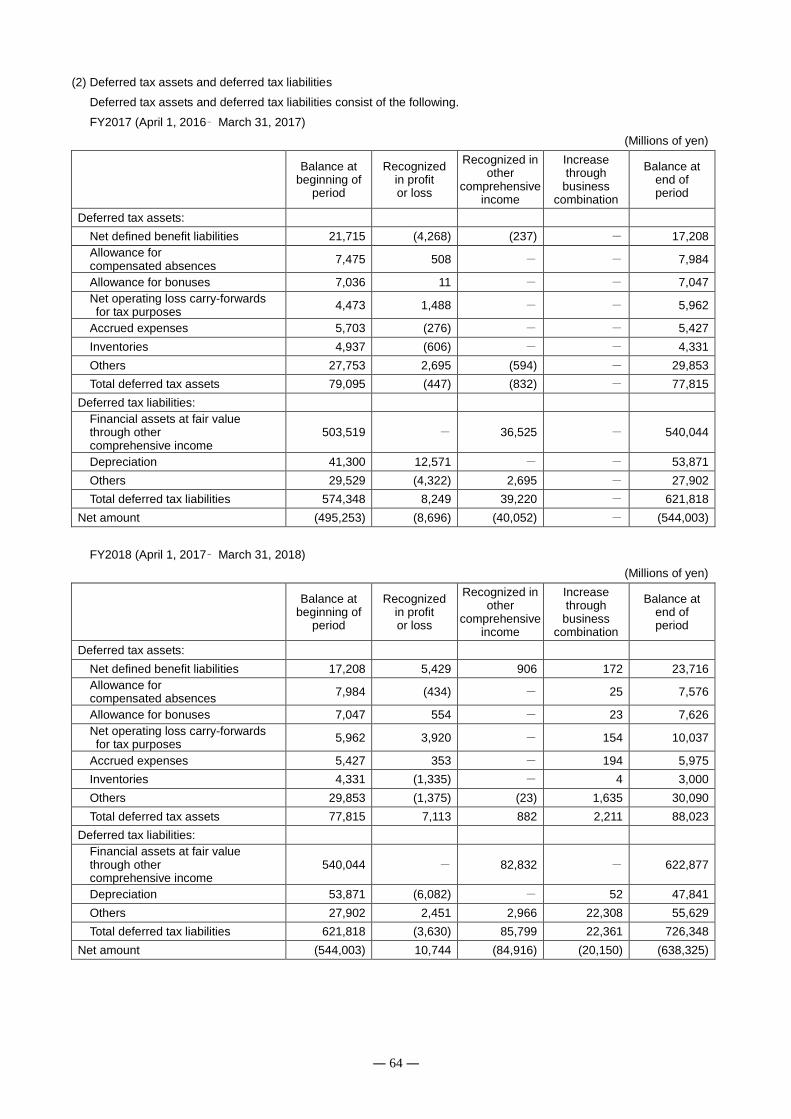
― 64 ―
(2) Deferred tax assets and deferred tax liabilities
Deferred tax assets and deferred tax liabilities consist of the following.
FY2017 (April 1, 2016– March 31, 2017)
(Millions of yen)
Balance at
beginning of period
Recognized in profit or loss
Recognized in other
comprehensive income
Increase through
business combination
Balance at end of period
Deferred tax assets:
Net defined benefit liabilities 21,715 (4,268) (237) - 17,208
Allowance for compensated absences
7,475 508 - - 7,984
Allowance for bonuses 7,036 11 - - 7,047
Net operating loss carry-forwards for tax purposes
4,473 1,488 - - 5,962
Accrued expenses 5,703 (276) - - 5,427
Inventories 4,937 (606) - - 4,331
Others 27,753 2,695 (594) - 29,853
Total deferred tax assets 79,095 (447) (832) - 77,815
Deferred tax liabilities:
Financial assets at fair value through other comprehensive income
503,519 - 36,525 - 540,044
Depreciation 41,300 12,571 - - 53,871
Others 29,529 (4,322) 2,695 - 27,902
Total deferred tax liabilities 574,348 8,249 39,220 - 621,818
Net amount (495,253) (8,696) (40,052) - (544,003)
FY2018 (April 1, 2017– March 31, 2018)
(Millions of yen)
Balance at
beginning of period
Recognized in profit or loss
Recognized in other
comprehensive income
Increase through
business combination
Balance at end of period
Deferred tax assets:
Net defined benefit liabilities 17,208 5,429 906 172 23,716
Allowance for compensated absences
7,984 (434) - 25 7,576
Allowance for bonuses 7,047 554 - 23 7,626
Net operating loss carry-forwards for tax purposes
5,962 3,920 - 154 10,037
Accrued expenses 5,427 353 - 194 5,975
Inventories 4,331 (1,335) - 4 3,000
Others 29,853 (1,375) (23) 1,635 30,090
Total deferred tax assets 77,815 7,113 882 2,211 88,023
Deferred tax liabilities:
Financial assets at fair value through other comprehensive income
540,044 - 82,832 - 622,877
Depreciation 53,871 (6,082) - 52 47,841
Others 27,902 2,451 2,966 22,308 55,629
Total deferred tax liabilities 621,818 (3,630) 85,799 22,361 726,348
Net amount (544,003) 10,744 (84,916) (20,150) (638,325)
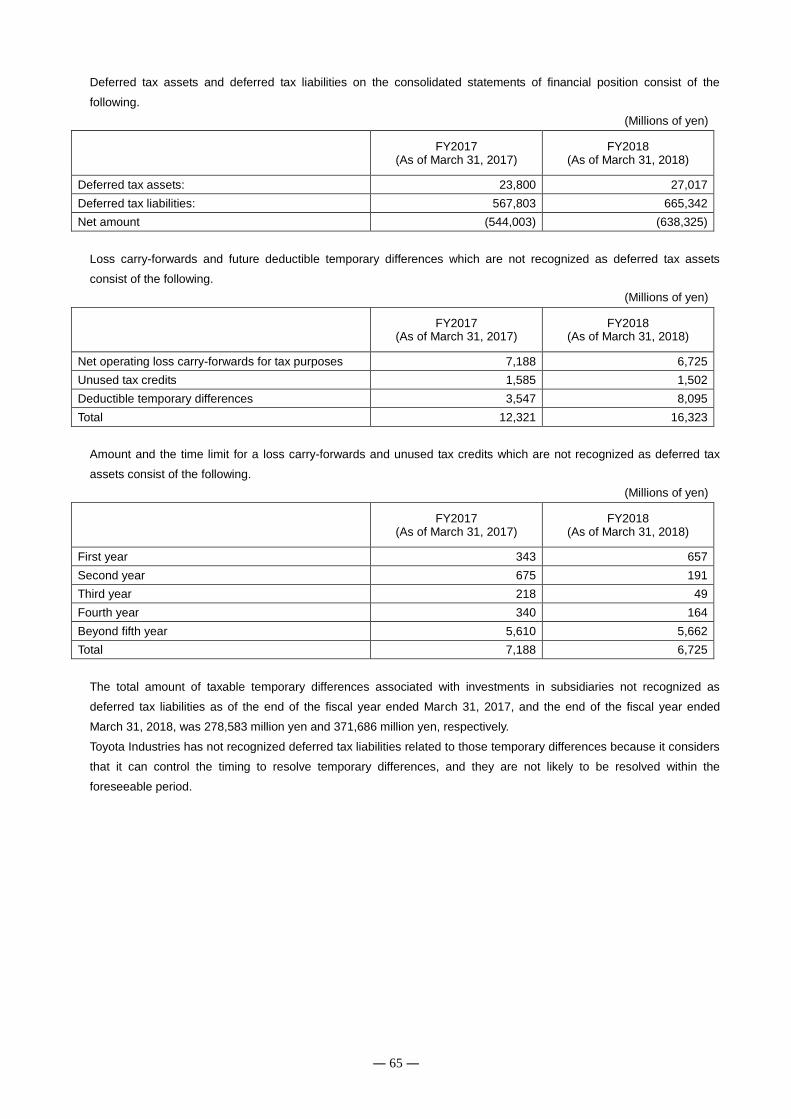
― 65 ―
Deferred tax assets and deferred tax liabilities on the consolidated statements of financial position consist of the
following.
(Millions of yen)
FY2017
(As of March 31, 2017) FY2018
(As of March 31, 2018)
Deferred tax assets: 23,800 27,017
Deferred tax liabilities: 567,803 665,342
Net amount (544,003) (638,325)
Loss carry-forwards and future deductible temporary differences which are not recognized as deferred tax assets
consist of the following.
(Millions of yen)
FY2017
(As of March 31, 2017) FY2018
(As of March 31, 2018)
Net operating loss carry-forwards for tax purposes 7,188 6,725
Unused tax credits 1,585 1,502
Deductible temporary differences 3,547 8,095
Total 12,321 16,323
Amount and the time limit for a loss carry-forwards and unused tax credits which are not recognized as deferred tax
assets consist of the following.
(Millions of yen)
FY2017
(As of March 31, 2017) FY2018
(As of March 31, 2018)
First year 343 657
Second year 675 191
Third year 218 49
Fourth year 340 164
Beyond fifth year 5,610 5,662
Total 7,188 6,725
The total amount of taxable temporary differences associated with investments in subsidiaries not recognized as
deferred tax liabilities as of the end of the fiscal year ended March 31, 2017, and the end of the fiscal year ended
March 31, 2018, was 278,583 million yen and 371,686 million yen, respectively.
Toyota Industries has not recognized deferred tax liabilities related to those temporary differences because it considers
that it can control the timing to resolve temporary differences, and they are not likely to be resolved within the
foreseeable period.
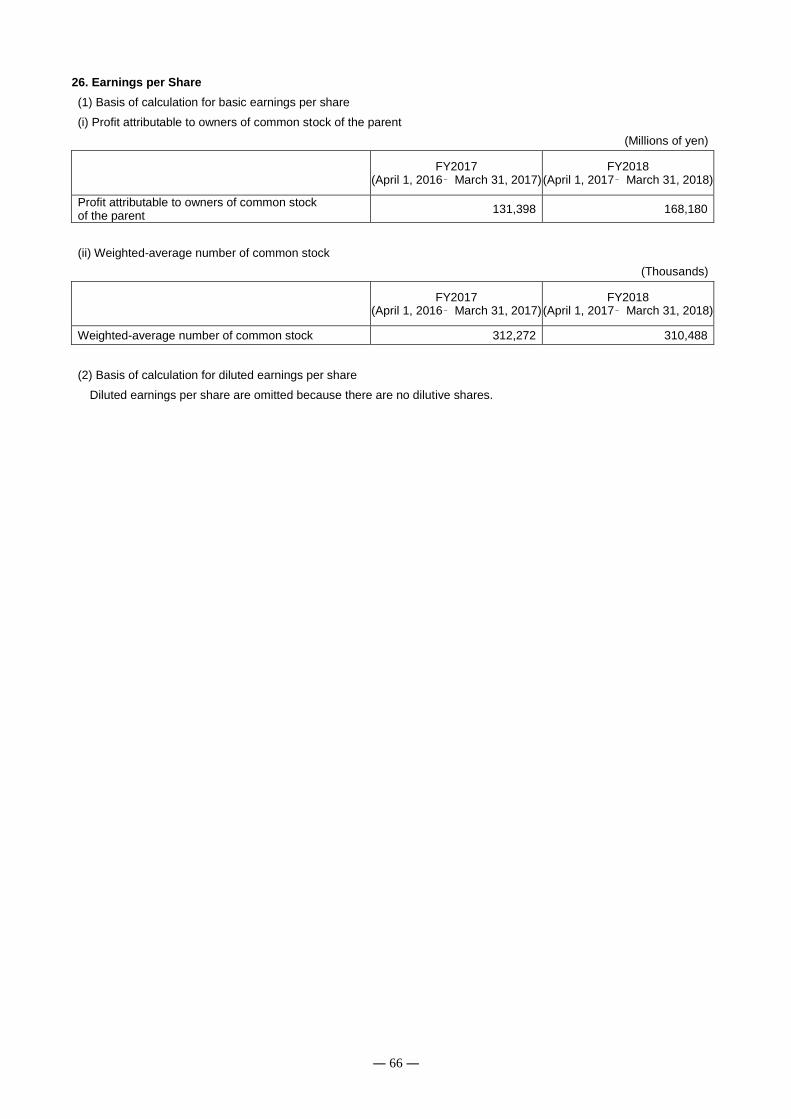
― 66 ―
26. Earnings per Share
(1) Basis of calculation for basic earnings per share
(i) Profit attributable to owners of common stock of the parent
(Millions of yen)
FY2017
(April 1, 2016– March 31, 2017) FY2018
(April 1, 2017– March 31, 2018)
Profit attributable to owners of common stock of the parent
131,398 168,180
(ii) Weighted-average number of common stock
(Thousands)
FY2017
(April 1, 2016– March 31, 2017) FY2018
(April 1, 2017– March 31, 2018)
Weighted-average number of common stock 312,272 310,488
(2) Basis of calculation for diluted earnings per share
Diluted earnings per share are omitted because there are no dilutive shares.
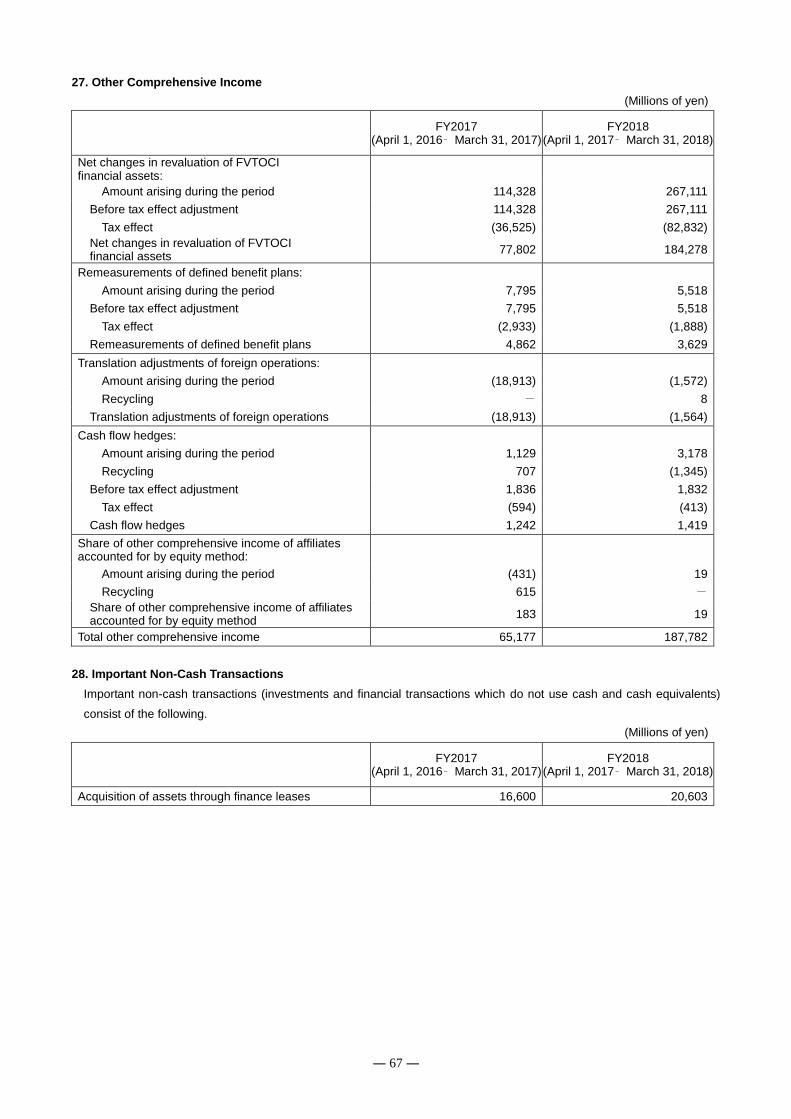
― 67 ―
27. Other Comprehensive Income
(Millions of yen)
FY2017
(April 1, 2016– March 31, 2017) FY2018
(April 1, 2017– March 31, 2018)
Net changes in revaluation of FVTOCI financial assets:
Amount arising during the period 114,328 267,111
Before tax effect adjustment 114,328 267,111
Tax effect (36,525) (82,832)
Net changes in revaluation of FVTOCI financial assets
77,802 184,278
Remeasurements of defined benefit plans:
Amount arising during the period 7,795 5,518
Before tax effect adjustment 7,795 5,518
Tax effect (2,933) (1,888)
Remeasurements of defined benefit plans 4,862 3,629
Translation adjustments of foreign operations:
Amount arising during the period (18,913) (1,572)
Recycling - 8
Translation adjustments of foreign operations (18,913) (1,564)
Cash flow hedges:
Amount arising during the period 1,129 3,178
Recycling 707 (1,345)
Before tax effect adjustment 1,836 1,832
Tax effect (594) (413)
Cash flow hedges 1,242 1,419
Share of other comprehensive income of affiliates accounted for by equity method:
Amount arising during the period (431) 19
Recycling 615 -
Share of other comprehensive income of affiliates accounted for by equity method
183 19
Total other comprehensive income 65,177 187,782
28. Important Non-Cash Transactions
Important non-cash transactions (investments and financial transactions which do not use cash and cash equivalents)
consist of the following.
(Millions of yen)
FY2017
(April 1, 2016– March 31, 2017) FY2018
(April 1, 2017– March 31, 2018)
Acquisition of assets through finance leases 16,600 20,603
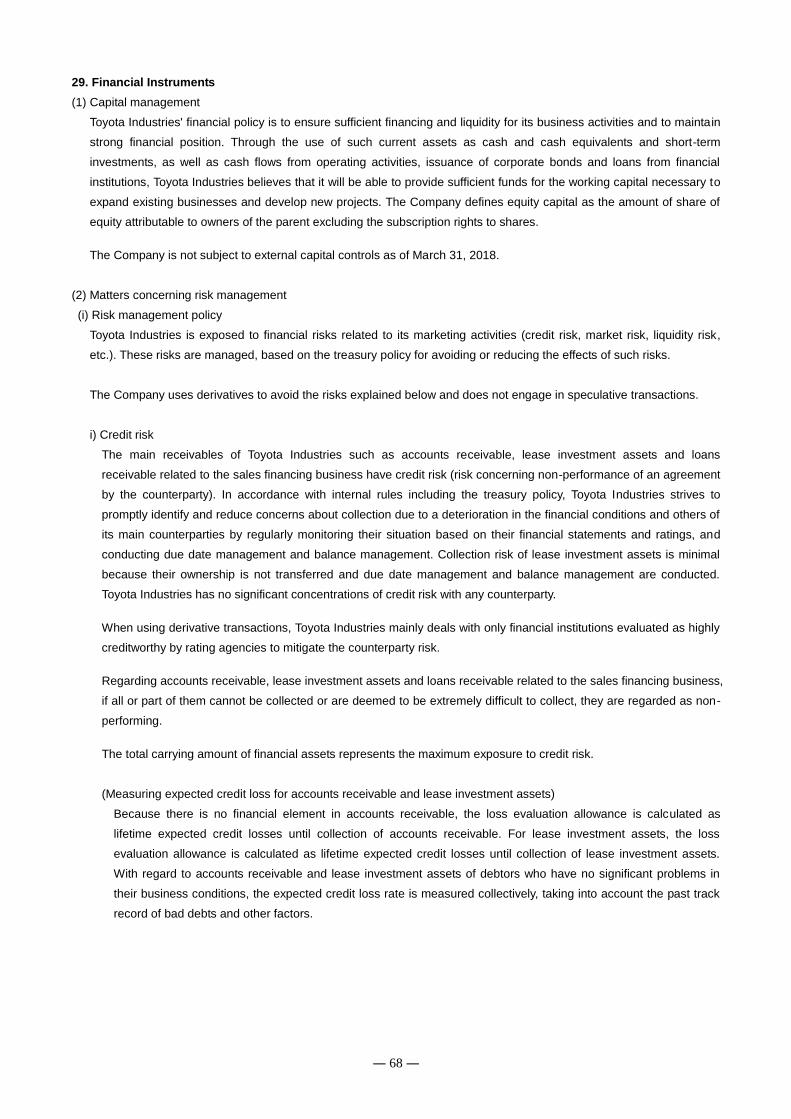
― 68 ―
29. Financial Instruments
(1) Capital management
Toyota Industries' financial policy is to ensure sufficient financing and liquidity for its business activities and to maintain
strong financial position. Through the use of such current assets as cash and cash equivalents and short-term
investments, as well as cash flows from operating activities, issuance of corporate bonds and loans from financial
institutions, Toyota Industries believes that it will be able to provide sufficient funds for the working capital necessary to
expand existing businesses and develop new projects. The Company defines equity capital as the amount of share of
equity attributable to owners of the parent excluding the subscription rights to shares.
The Company is not subject to external capital controls as of March 31, 2018.
(2) Matters concerning risk management
(i) Risk management policy
Toyota Industries is exposed to financial risks related to its marketing activities (credit risk, market risk, liquidity risk,
etc.). These risks are managed, based on the treasury policy for avoiding or reducing the effects of such risks.
The Company uses derivatives to avoid the risks explained below and does not engage in speculative transactions.
i) Credit risk
The main receivables of Toyota Industries such as accounts receivable, lease investment assets and loans
receivable related to the sales financing business have credit risk (risk concerning non-performance of an agreement
by the counterparty). In accordance with internal rules including the treasury policy, Toyota Industries strives to
promptly identify and reduce concerns about collection due to a deterioration in the financial conditions and others of
its main counterparties by regularly monitoring their situation based on their financial statements and ratings, and
conducting due date management and balance management. Collection risk of lease investment assets is minimal
because their ownership is not transferred and due date management and balance management are conducted.
Toyota Industries has no significant concentrations of credit risk with any counterparty.
When using derivative transactions, Toyota Industries mainly deals with only financial institutions evaluated as highly
creditworthy by rating agencies to mitigate the counterparty risk.
Regarding accounts receivable, lease investment assets and loans receivable related to the sales financing business,
if all or part of them cannot be collected or are deemed to be extremely difficult to collect, they are regarded as non-
performing.
The total carrying amount of financial assets represents the maximum exposure to credit risk.
(Measuring expected credit loss for accounts receivable and lease investment assets)
Because there is no financial element in accounts receivable, the loss evaluation allowance is calculated as
lifetime expected credit losses until collection of accounts receivable. For lease investment assets, the loss
evaluation allowance is calculated as lifetime expected credit losses until collection of lease investment assets.
With regard to accounts receivable and lease investment assets of debtors who have no significant problems in
their business conditions, the expected credit loss rate is measured collectively, taking into account the past track
record of bad debts and other factors.
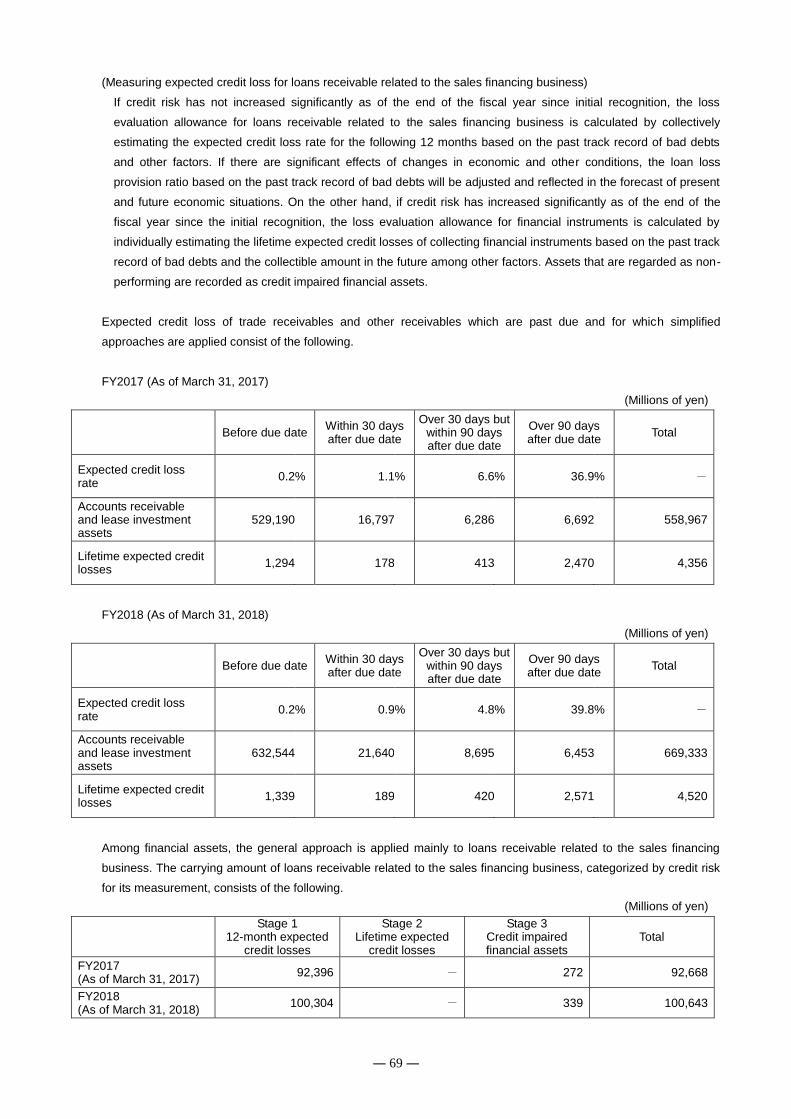
― 69 ―
(Measuring expected credit loss for loans receivable related to the sales financing business)
If credit risk has not increased significantly as of the end of the fiscal year since initial recognition, the loss
evaluation allowance for loans receivable related to the sales financing business is calculated by collectively
estimating the expected credit loss rate for the following 12 months based on the past track record of bad debts
and other factors. If there are significant effects of changes in economic and other conditions, the loan loss
provision ratio based on the past track record of bad debts will be adjusted and reflected in the forecast of present
and future economic situations. On the other hand, if credit risk has increased significantly as of the end of the
fiscal year since the initial recognition, the loss evaluation allowance for financial instruments is calculated by
individually estimating the lifetime expected credit losses of collecting financial instruments based on the past track
record of bad debts and the collectible amount in the future among other factors. Assets that are regarded as non-
performing are recorded as credit impaired financial assets.
Expected credit loss of trade receivables and other receivables which are past due and for which simplified
approaches are applied consist of the following.
FY2017 (As of March 31, 2017)
(Millions of yen)
Before due date Within 30 days after due date
Over 30 days but within 90 days after due date
Over 90 days after due date
Total
Expected credit loss rate
0.2 % 1.1 % 6.6 % 36.9 % -
Accounts receivable and lease investment assets
529,190 16,797 6,286 6,692 558,967
Lifetime expected credit losses
1,294 178 413 2,470 4,356
FY2018 (As of March 31, 2018)
(Millions of yen)
Before due date Within 30 days after due date
Over 30 days but within 90 days after due date
Over 90 days after due date
Total
Expected credit loss rate
0.2 % 0.9 % 4.8 % 39.8 % -
Accounts receivable and lease investment assets
632,544 21,640 8,695 6,453 669,333
Lifetime expected credit losses
1,339 189 420 2,571 4,520
Among financial assets, the general approach is applied mainly to loans receivable related to the sales financing
business. The carrying amount of loans receivable related to the sales financing business, categorized by credit risk
for its measurement, consists of the following.
(Millions of yen)
Stage 1
12-month expected credit losses
Stage 2 Lifetime expected
credit losses
Stage 3 Credit impaired financial assets
Total
FY2017 (As of March 31, 2017)
92,396 - 272 92,668
FY2018 (As of March 31, 2018)
100,304 - 339 100,643
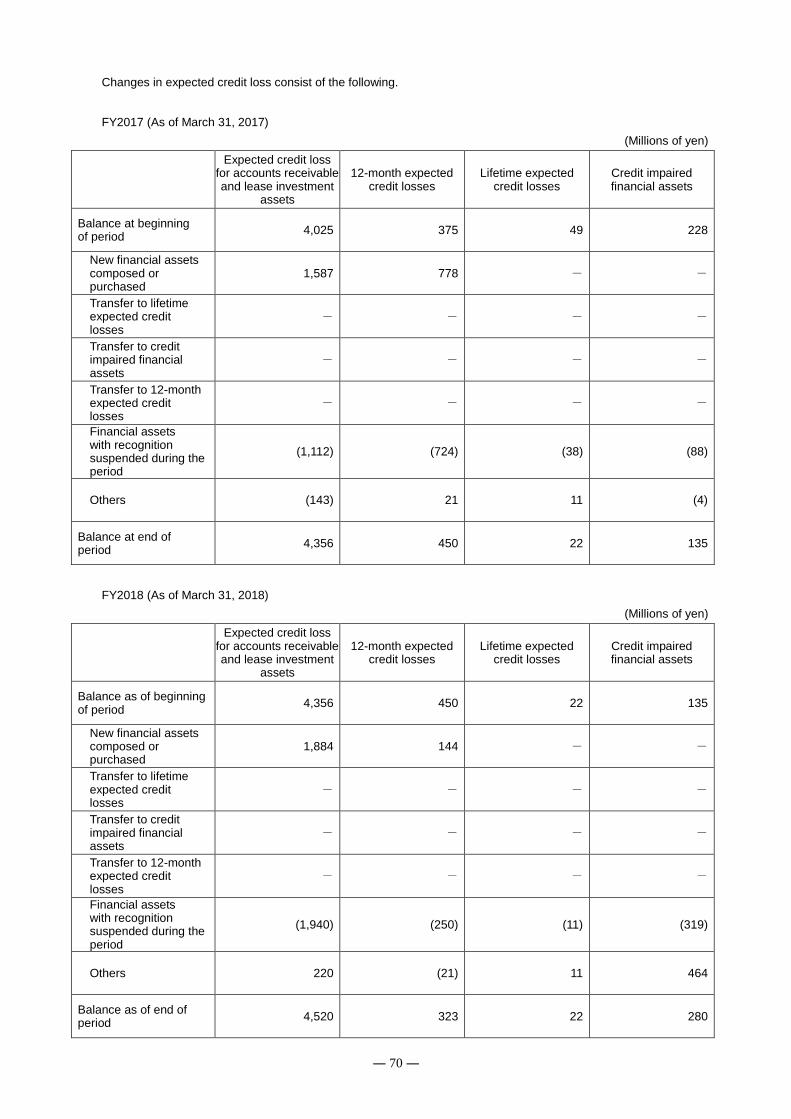
― 70 ―
Changes in expected credit loss consist of the following.
FY2017 (As of March 31, 2017)
(Millions of yen)
Expected credit loss for accounts receivable and lease investment
assets
12-month expected credit losses
Lifetime expected credit losses
Credit impaired financial assets
Balance at beginning of period
4,025 375 49 228
New financial assets composed or purchased
1,587 778 - -
Transfer to lifetime expected credit losses
- - - -
Transfer to credit impaired financial assets
- - - -
Transfer to 12-month expected credit losses
- - - -
Financial assets with recognition suspended during the period
(1,112) (724) (38) (88)
Others (143) 21 11 (4)
Balance at end of period
4,356 450 22 135
FY2018 (As of March 31, 2018)
(Millions of yen)
Expected credit loss for accounts receivable and lease investment
assets
12-month expected credit losses
Lifetime expected credit losses
Credit impaired financial assets
Balance as of beginning of period
4,356 450 22 135
New financial assets composed or purchased
1,884 144 - -
Transfer to lifetime expected credit losses
- - - -
Transfer to credit impaired financial assets
- - - -
Transfer to 12-month expected credit losses
- - - -
Financial assets with recognition suspended during the period
(1,940) (250) (11) (319)
Others 220 (21) 11 464
Balance as of end of period
4,520 323 22 280
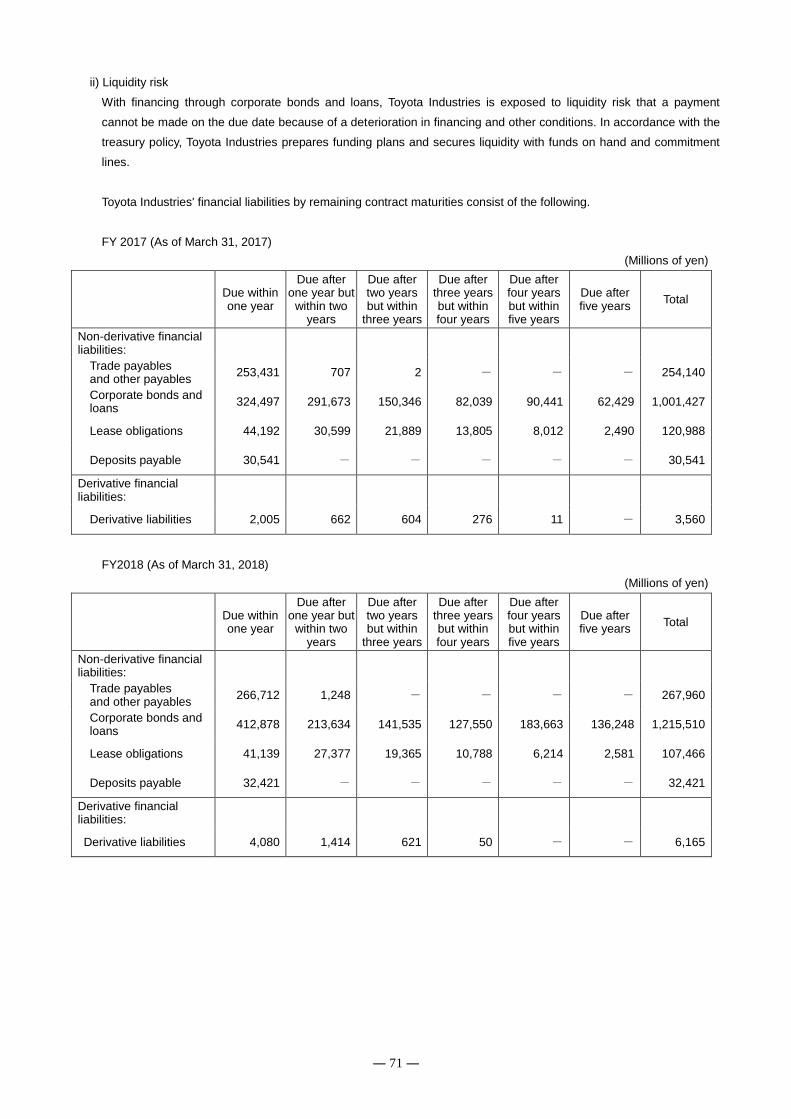
― 71 ―
ii) Liquidity risk
With financing through corporate bonds and loans, Toyota Industries is exposed to liquidity risk that a payment
cannot be made on the due date because of a deterioration in financing and other conditions. In accordance with the
treasury policy, Toyota Industries prepares funding plans and secures liquidity with funds on hand and commitment
lines.
Toyota Industries' financial liabilities by remaining contract maturities consist of the following.
FY 2017 (As of March 31, 2017)
(Millions of yen)
Due within one year
Due after one year but
within two years
Due after two years but within
three years
Due after three years but within four years
Due after four years but within five years
Due after five years
Total
Non-derivative financial liabilities:
Trade payables and other payables
253,431 707 2 - - - 254,140
Corporate bonds and loans
324,497 291,673 150,346 82,039 90,441 62,429 1,001,427
Lease obligations 44,192 30,599 21,889 13,805 8,012 2,490 120,988
Deposits payable 30,541 - - - - - 30,541
Derivative financial liabilities:
Derivative liabilities 2,005 662 604 276 11 - 3,560
FY2018 (As of March 31, 2018)
(Millions of yen)
Due within one year
Due after one year but
within two years
Due after two years but within
three years
Due after three years but within four years
Due after four years but within five years
Due after five years
Total
Non-derivative financial liabilities:
Trade payables and other payables
266,712 1,248 - - - - 267,960
Corporate bonds and loans
412,878 213,634 141,535 127,550 183,663 136,248 1,215,510
Lease obligations 41,139 27,377 19,365 10,788 6,214 2,581 107,466
Deposits payable 32,421 - - - - - 32,421
Derivative financial liabilities:
Derivative liabilities 4,080 1,414 621 50 - - 6,165
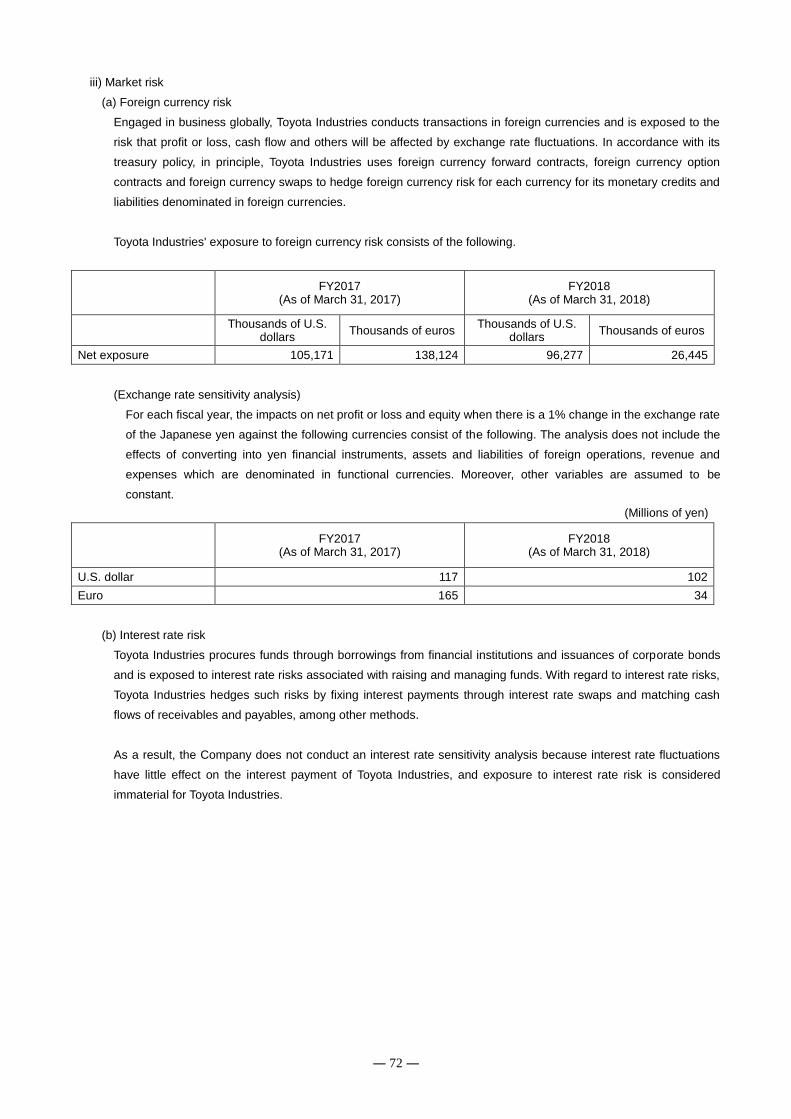
― 72 ―
iii) Market risk
(a) Foreign currency risk
Engaged in business globally, Toyota Industries conducts transactions in foreign currencies and is exposed to the
risk that profit or loss, cash flow and others will be affected by exchange rate fluctuations. In accordance with its
treasury policy, in principle, Toyota Industries uses foreign currency forward contracts, foreign currency option
contracts and foreign currency swaps to hedge foreign currency risk for each currency for its monetary credits and
liabilities denominated in foreign currencies.
Toyota Industries' exposure to foreign currency risk consists of the following.
FY2017
(As of March 31, 2017) FY2018
(As of March 31, 2018)
Thousands of U.S.
dollars Thousands of euros
Thousands of U.S. dollars
Thousands of euros
Net exposure 105,171 138,124 96,277 26,445
(Exchange rate sensitivity analysis)
For each fiscal year, the impacts on net profit or loss and equity when there is a 1% change in the exchange rate
of the Japanese yen against the following currencies consist of the following. The analysis does not include the
effects of converting into yen financial instruments, assets and liabilities of foreign operations, revenue and
expenses which are denominated in functional currencies. Moreover, other variables are assumed to be
constant.
(Millions of yen)
FY2017
(As of March 31, 2017) FY2018
(As of March 31, 2018)
U.S. dollar 117 102
Euro 165 34
(b) Interest rate risk
Toyota Industries procures funds through borrowings from financial institutions and issuances of corporate bonds
and is exposed to interest rate risks associated with raising and managing funds. With regard to interest rate risks,
Toyota Industries hedges such risks by fixing interest payments through interest rate swaps and matching cash
flows of receivables and payables, among other methods.
As a result, the Company does not conduct an interest rate sensitivity analysis because interest rate fluctuations
have little effect on the interest payment of Toyota Industries, and exposure to interest rate risk is considered
immaterial for Toyota Industries.
― 73 ―
(c) Price fluctuation risk of equity financial instruments
Toyota Industries holds listed shares of companies with business relationships and is exposed to price fluctuation
risk of equity financial instruments. Toyota Industries constantly reviews the status of its holdings of these financial
instruments, taking into account relationships with and financial conditions of business partners.
Toyota Industries does not hold equity financial instruments for trading purposes and does not actively trade these
investments.
If Toyota Industries assumes a 1% decline in the prices of listed shares held by Toyota Industries on the fiscal
years ended March 31, 2017 and 2018, decreases in other comprehensive income (before adjusting tax effect)
would have been 20,499 million yen and 23,261 million yen, respectively.
Moreover, because the shares held by Toyota Industries are designated as financial assets at FVTOCI, the
assumed 1% rise or drop of share prices will not have a significant impact on profit or loss in terms of monetary
amount.
Liquidity discounts are an important unobservable input used to measure the fair value of unlisted shares and
other equity securities. A significant increase (decrease) of these discounts will cause a significant decrease
(increase) in fair value.
(3) Fair value of financial instruments
The following three levels of inputs are used to measure fair value.
(Level 1)
The market prices of the same assets or liabilities in active markets (which continuously ensure sufficient trading
frequencies and transaction volumes) that Toyota Industries have access to as of the measurement date are used as
they are without adjustments.
(Level 2)
This level includes the published prices of similar assets or liabilities in active markets; the published prices of the
same assets or liabilities in inactive markets; inputs other than the observable published prices of assets and liabilities;
and inputs calculated or supported mainly by observable market data.
(Level 3)
Because data are available only from limited markets, Toyota Industries uses unobservable inputs which reflect the
judgment of Toyota Industries in the assumptions used by market participants to decide the prices of assets and
liabilities. Toyota Industries calculates inputs based on the best available information, including the data of Toyota
Industries itself.
Fair value is measured by the Accounting Department in accordance with the evaluation policy and procedures of Toyota
Industries, using the evaluation model that can most appropriately reflect individual characteristics, features and risks of
financial instruments. Moreover, changes are continuously examined for important indicators which affect fluctuations of
fair value.
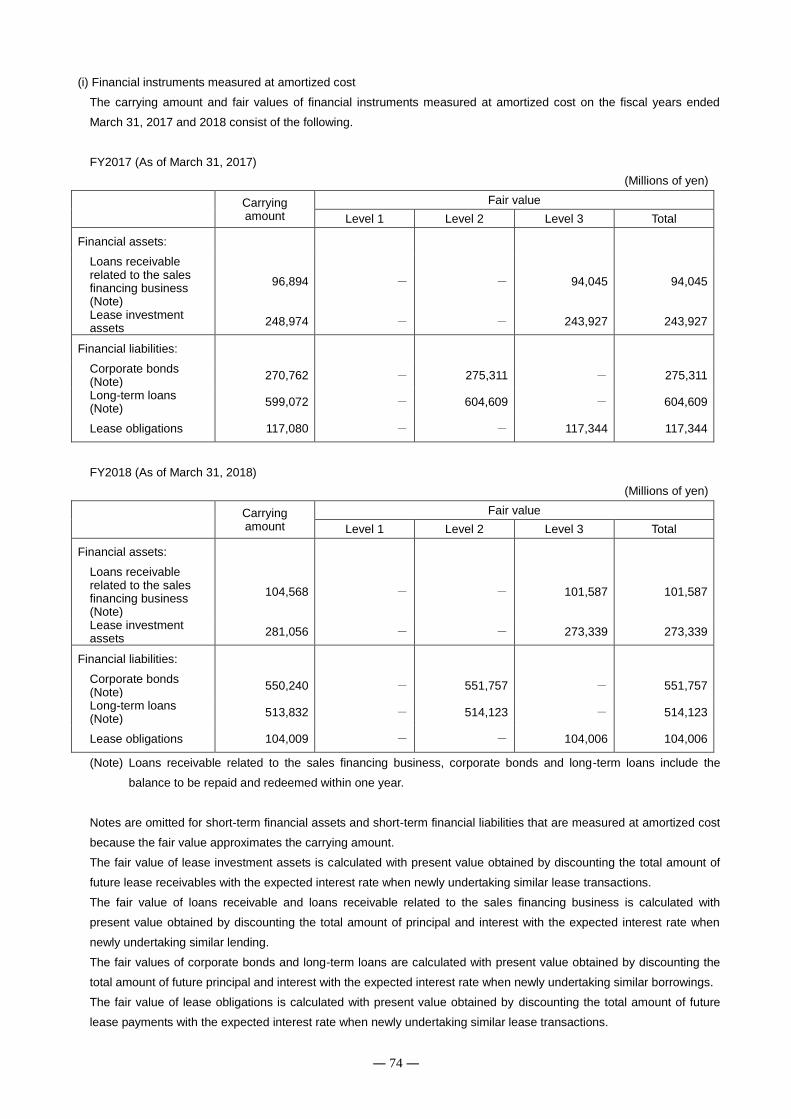
― 74 ―
(i) Financial instruments measured at amortized cost
The carrying amount and fair values of financial instruments measured at amortized cost on the fiscal years ended
March 31, 2017 and 2018 consist of the following.
FY2017 (As of March 31, 2017)
(Millions of yen)
Carrying amount
Fair value
Level 1 Level 2 Level 3 Total
Financial assets:
Loans receivable related to the sales financing business (Note)
96,894 - - 94,045 94,045
Lease investment assets
248,974 - - 243,927 243,927
Financial liabilities:
Corporate bonds (Note)
270,762 - 275,311 - 275,311
Long-term loans (Note)
599,072 - 604,609 - 604,609
Lease obligations 117,080 - - 117,344 117,344
FY2018 (As of March 31, 2018)
(Millions of yen)
Carrying amount
Fair value
Level 1 Level 2 Level 3 Total
Financial assets:
Loans receivable related to the sales financing business (Note)
104,568 - - 101,587 101,587
Lease investment assets
281,056 - - 273,339 273,339
Financial liabilities:
Corporate bonds (Note)
550,240 - 551,757 - 551,757
Long-term loans (Note)
513,832 - 514,123 - 514,123
Lease obligations 104,009 - - 104,006 104,006
(Note) Loans receivable related to the sales financing business, corporate bonds and long-term loans include the
balance to be repaid and redeemed within one year.
Notes are omitted for short-term financial assets and short-term financial liabilities that are measured at amortized cost
because the fair value approximates the carrying amount.
The fair value of lease investment assets is calculated with present value obtained by discounting the total amount of
future lease receivables with the expected interest rate when newly undertaking similar lease transactions.
The fair value of loans receivable and loans receivable related to the sales financing business is calculated with
present value obtained by discounting the total amount of principal and interest with the expected interest rate when
newly undertaking similar lending.
The fair values of corporate bonds and long-term loans are calculated with present value obtained by discounting the
total amount of future principal and interest with the expected interest rate when newly undertaking similar borrowings.
The fair value of lease obligations is calculated with present value obtained by discounting the total amount of future
lease payments with the expected interest rate when newly undertaking similar lease transactions.
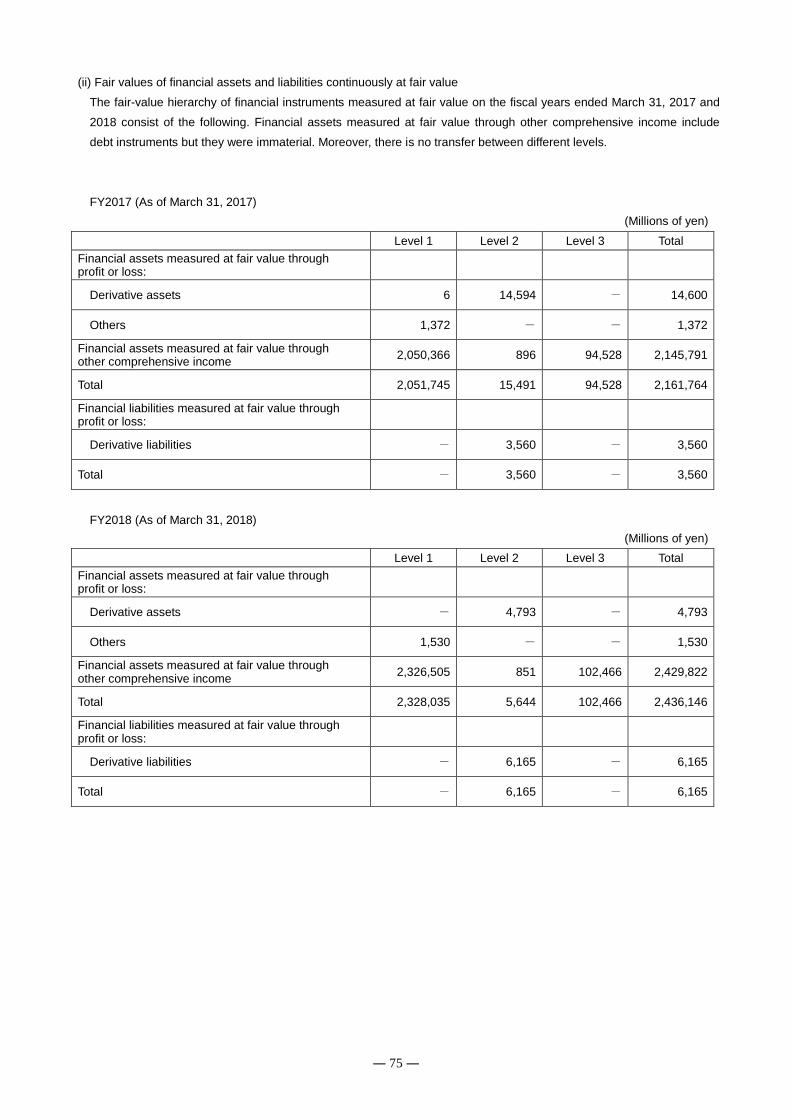
― 75 ―
(ii) Fair values of financial assets and liabilities continuously at fair value
The fair-value hierarchy of financial instruments measured at fair value on the fiscal years ended March 31, 2017 and
2018 consist of the following. Financial assets measured at fair value through other comprehensive income include
debt instruments but they were immaterial. Moreover, there is no transfer between different levels.
FY2017 (As of March 31, 2017)
(Millions of yen) Level 1 Level 2 Level 3 Total
Financial assets measured at fair value through profit or loss:
Derivative assets 6 14,594 - 14,600
Others 1,372 - - 1,372
Financial assets measured at fair value through other comprehensive income
2,050,366 896 94,528 2,145,791
Total 2,051,745 15,491 94,528 2,161,764
Financial liabilities measured at fair value through profit or loss:
Derivative liabilities - 3,560 - 3,560
Total - 3,560 - 3,560
FY2018 (As of March 31, 2018)
(Millions of yen) Level 1 Level 2 Level 3 Total
Financial assets measured at fair value through profit or loss:
Derivative assets - 4,793 - 4,793
Others 1,530 - - 1,530
Financial assets measured at fair value through other comprehensive income
2,326,505 851 102,466 2,429,822
Total 2,328,035 5,644 102,466 2,436,146
Financial liabilities measured at fair value through profit or loss:
Derivative liabilities - 6,165 - 6,165
Total - 6,165 - 6,165
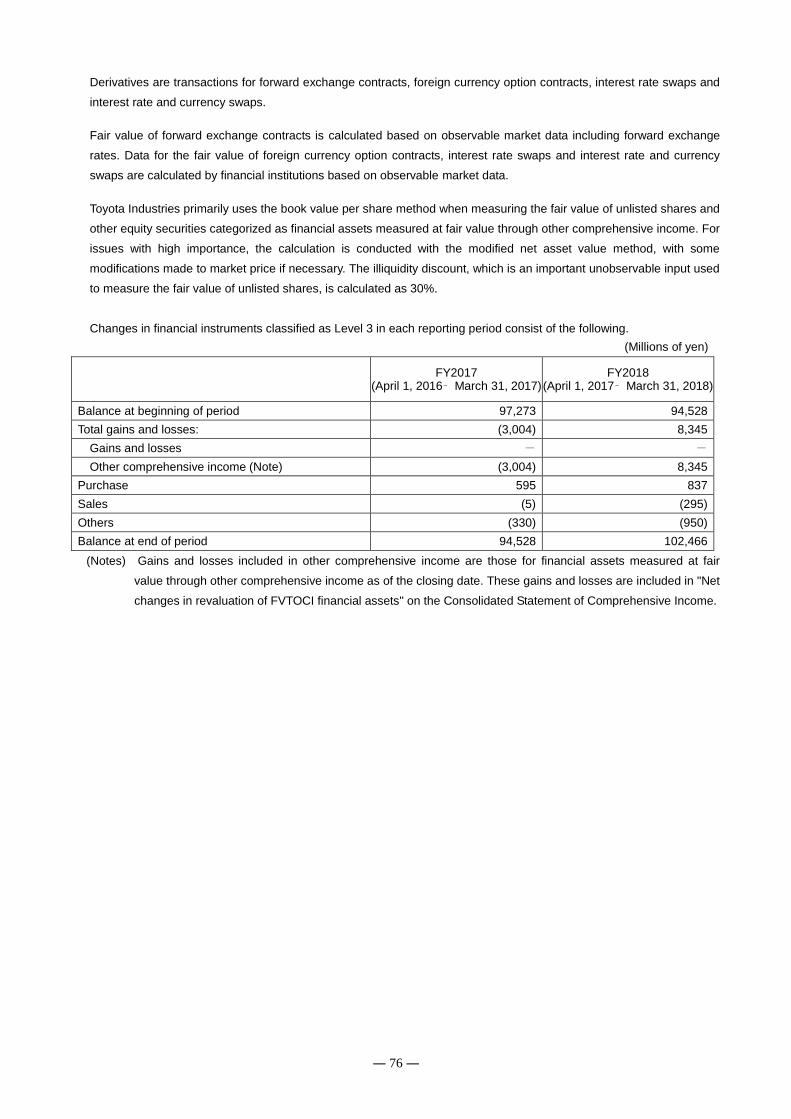
― 76 ―
Derivatives are transactions for forward exchange contracts, foreign currency option contracts, interest rate swaps and
interest rate and currency swaps.
Fair value of forward exchange contracts is calculated based on observable market data including forward exchange
rates. Data for the fair value of foreign currency option contracts, interest rate swaps and interest rate and currency
swaps are calculated by financial institutions based on observable market data.
Toyota Industries primarily uses the book value per share method when measuring the fair value of unlisted shares and
other equity securities categorized as financial assets measured at fair value through other comprehensive income. For
issues with high importance, the calculation is conducted with the modified net asset value method, with some
modifications made to market price if necessary. The illiquidity discount, which is an important unobservable input used
to measure the fair value of unlisted shares, is calculated as 30%.
Changes in financial instruments classified as Level 3 in each reporting period consist of the following.
(Millions of yen)
FY2017
(April 1, 2016– March 31, 2017) FY2018
(April 1, 2017– March 31, 2018)
Balance at beginning of period 97,273 94,528
Total gains and losses: (3,004) 8,345
Gains and losses - -
Other comprehensive income (Note) (3,004) 8,345
Purchase 595 837
Sales (5) (295)
Others (330) (950)
Balance at end of period 94,528 102,466
(Notes) Gains and losses included in other comprehensive income are those for financial assets measured at fair
value through other comprehensive income as of the closing date. These gains and losses are included in "Net
changes in revaluation of FVTOCI financial assets" on the Consolidated Statement of Comprehensive Income.
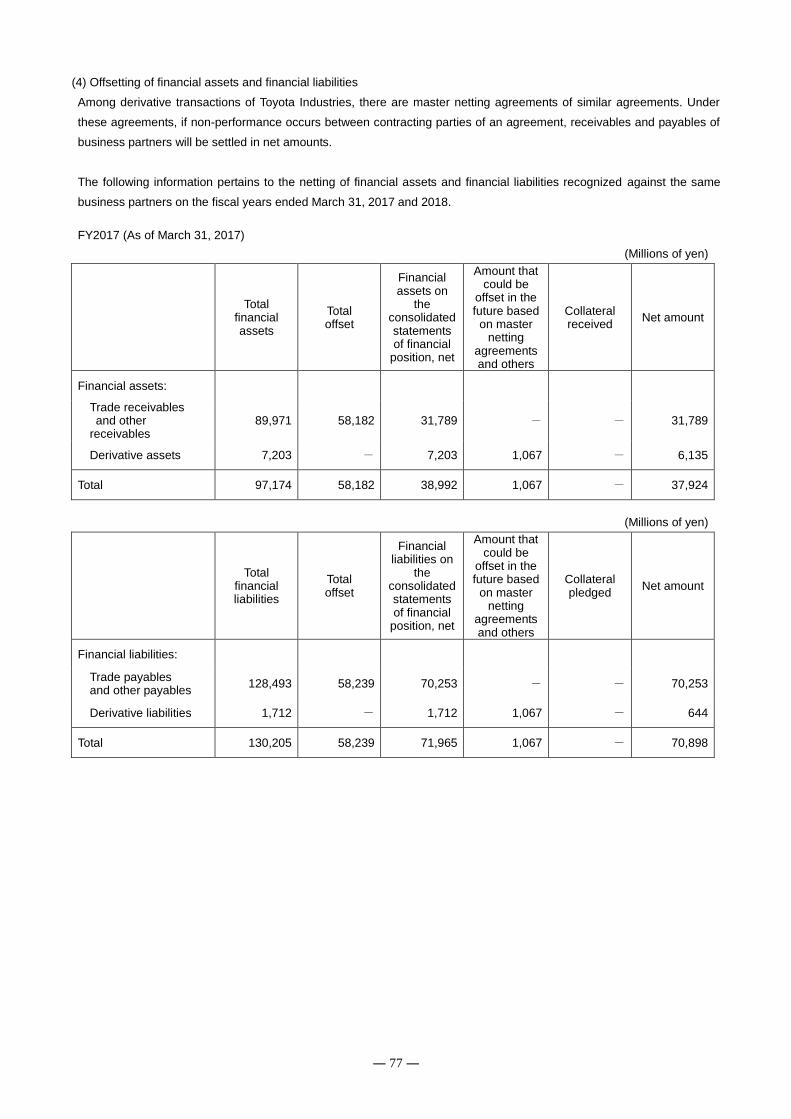
― 77 ―
(4) Offsetting of financial assets and financial liabilities
Among derivative transactions of Toyota Industries, there are master netting agreements of similar agreements. Under
these agreements, if non-performance occurs between contracting parties of an agreement, receivables and payables of
business partners will be settled in net amounts.
The following information pertains to the netting of financial assets and financial liabilities recognized against the same
business partners on the fiscal years ended March 31, 2017 and 2018.
FY2017 (As of March 31, 2017)
(Millions of yen)
Total
financial assets
Total offset
Financial assets on
the consolidated statements of financial
position, net
Amount that could be
offset in the future based
on master netting
agreements and others
Collateral received
Net amount
Financial assets:
Trade receivables and other receivables
89,971 58,182 31,789 - - 31,789
Derivative assets 7,203 - 7,203 1,067 - 6,135
Total 97,174 58,182 38,992 1,067 - 37,924
(Millions of yen)
Total
financial liabilities
Total offset
Financial liabilities on
the consolidated statements of financial
position, net
Amount that could be
offset in the future based
on master netting
agreements and others
Collateral pledged
Net amount
Financial liabilities:
Trade payables and other payables
128,493 58,239 70,253 - - 70,253
Derivative liabilities 1,712 - 1,712 1,067 - 644
Total 130,205 58,239 71,965 1,067 - 70,898
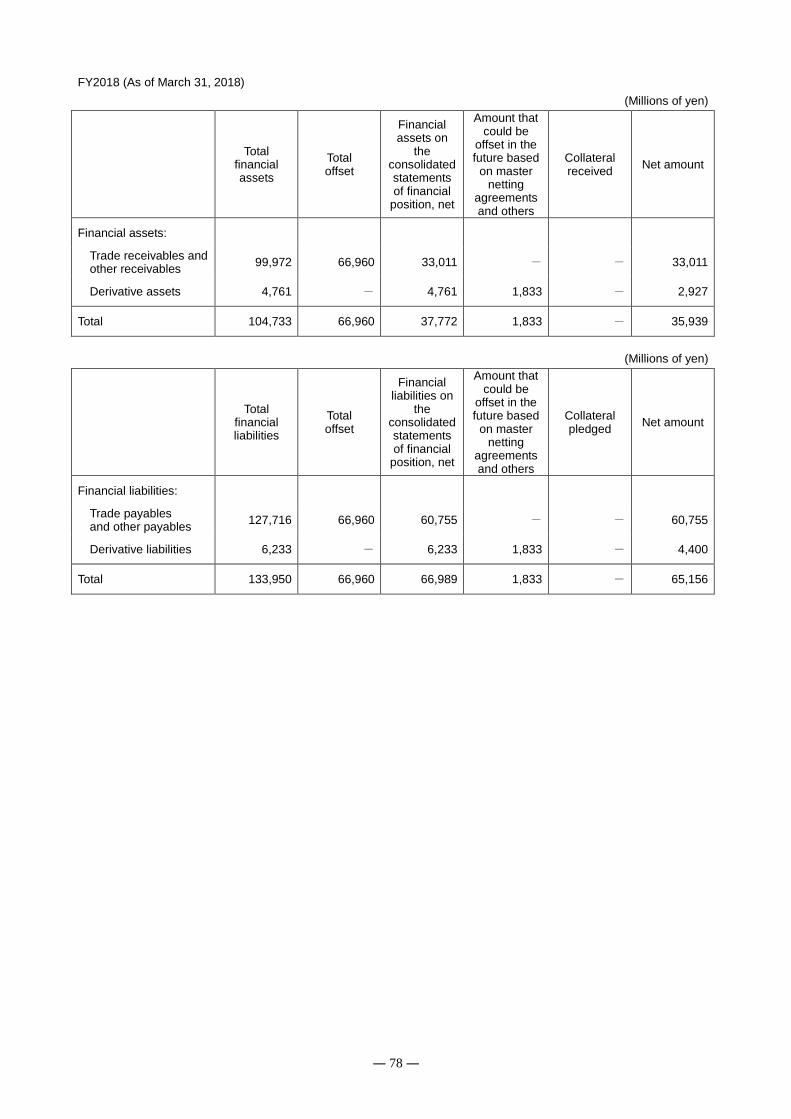
― 78 ―
FY2018 (As of March 31, 2018)
(Millions of yen)
Total
financial assets
Total offset
Financial assets on
the consolidated statements of financial
position, net
Amount that could be
offset in the future based
on master netting
agreements and others
Collateral received
Net amount
Financial assets:
Trade receivables and other receivables
99,972 66,960 33,011 - - 33,011
Derivative assets 4,761 - 4,761 1,833 - 2,927
Total 104,733 66,960 37,772 1,833 - 35,939
(Millions of yen)
Total
financial liabilities
Total offset
Financial liabilities on
the consolidated statements of financial
position, net
Amount that could be
offset in the future based
on master netting
agreements and others
Collateral pledged
Net amount
Financial liabilities:
Trade payables and other payables
127,716 66,960 60,755 - - 60,755
Derivative liabilities 6,233 - 6,233 1,833 - 4,400
Total 133,950 66,960 66,989 1,833 - 65,156
― 79 ―
(5) Derivative transactions and hedging activities
Toyota Industries has concluded derivative agreements with financial institutions to hedge changes in cash flows of
financial assets and financial liabilities. Forward exchange contracts and currency options are used to hedge foreign
currency risks concerning trade receivables and trade payables denominated in foreign currencies. Moreover, currency
swaps, interest rate swaps and interest rate and currency swaps are used to hedge foreign currency risk and interest rate
risk of borrowings, corporate bonds and others.
In the execution and management of hedge transactions, interest rate risk and foreign currency risk are hedged in
accordance with treasury policy. Moreover, the status of hedge transactions is regularly reported to the director in charge
of accounting and other responsible people.
Regarding foreign currency risk in operating activities, a certain amount of targeted risks are hedged, with the total
amount of targeted risks set as the upper limit. However, among targeted risks, usance transactions are in principle fully
covered. Regarding the foreign currency risk of investing activities which require a resolution of the Board of Directors,
the full amount is hedged in principle. For the foreign currency risk of other investing activities and financing activities, the
full amount is hedged as necessary.
Regarding interest rate risk, the upper limit is the amount equivalent to the balance of targeted risks for the hedging
amount, while the remaining period of targeted risks is the upper limit for the hedging period.
The effectiveness of hedging is evaluated by respectively comparing the market fluctuations or the accumulated changes
in cash flows of hedged items and hedging instruments during the period from the start of hedging to the evaluation of the
effectiveness. A high correlation has been observed between the two. Moreover, regarding hedges with prospective
ineffective portions, the ineffective amount is calculated using quantitative methods.
Toyota Industries sets an appropriate hedging ratio based on the volumes of hedged items and hedging instruments at
the start of hedge transactions, establishing a one-on-one relationship in principle. If the hedging relationship comes to be
deemed not effective but there is no change in the purpose of risk management, the hedging ratio established at the start
of hedging relationship is readjusted to make the relationship effective again. Moreover, if the purpose of risk
management is changed for the hedging relationship, application of hedge accounting is suspended.
(i) Effects of hedges on the Consolidated Statement of Financial Position
The carrying amount of derivative transactions designated to be hedged and financial instruments other than derivative
transactions on the fiscal years ended March 31, 2017 and 2018 consist of the following. Because the important
conditions for hedging instruments and hedged items are consistent or closely consistent, the values of hedging
instruments and hedged items move in the opposite directions in response to the same risk. Accordingly, the amount of
ineffective portions is immaterial, and it has been omitted.
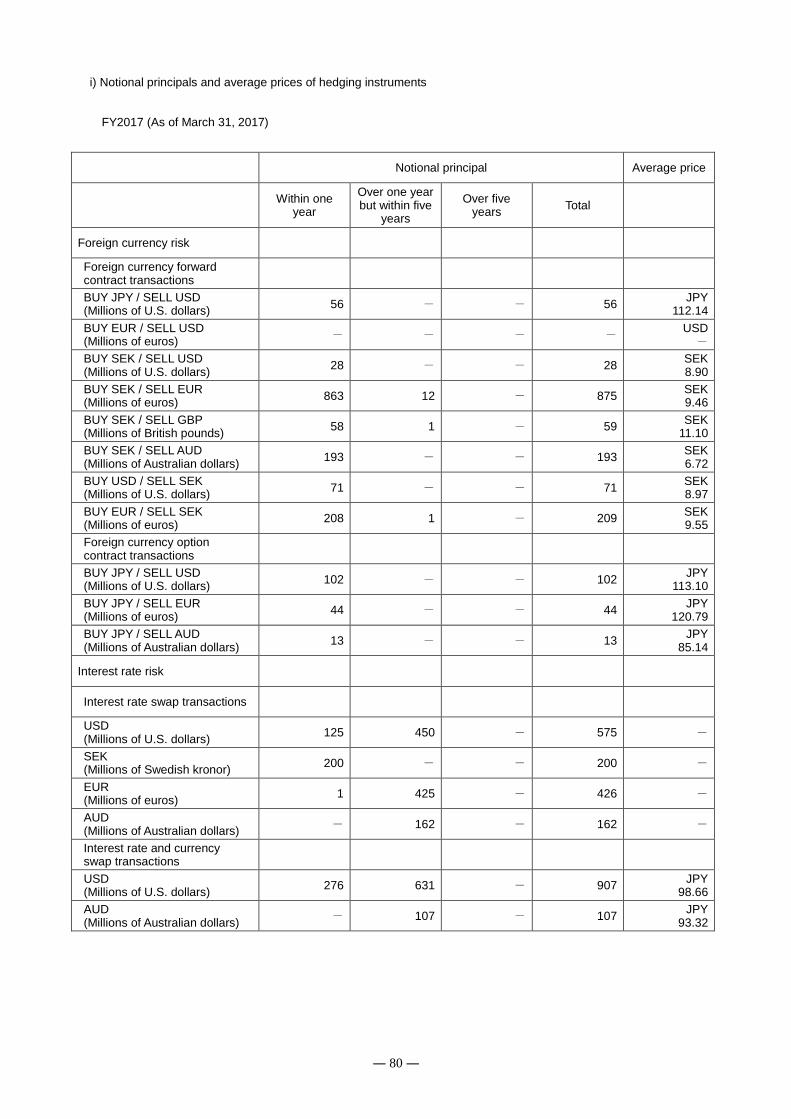
― 80 ―
i) Notional principals and average prices of hedging instruments
FY2017 (As of March 31, 2017)
Notional principal Average price
Within one
year
Over one year but within five
years
Over five years
Total
Foreign currency risk
Foreign currency forward contract transactions
BUY JPY / SELL USD (Millions of U.S. dollars)
56 - - 56 JPY
112.14
BUY EUR / SELL USD (Millions of euros)
- - - - USD -
BUY SEK / SELL USD (Millions of U.S. dollars)
28 - - 28 SEK 8.90
BUY SEK / SELL EUR (Millions of euros)
863 12 - 875 SEK 9.46
BUY SEK / SELL GBP (Millions of British pounds)
58 1 - 59 SEK
11.10
BUY SEK / SELL AUD (Millions of Australian dollars)
193 - - 193 SEK 6.72
BUY USD / SELL SEK (Millions of U.S. dollars)
71 - - 71 SEK 8.97
BUY EUR / SELL SEK (Millions of euros)
208 1 - 209 SEK 9.55
Foreign currency option contract transactions
BUY JPY / SELL USD (Millions of U.S. dollars)
102 - - 102 JPY
113.10
BUY JPY / SELL EUR (Millions of euros)
44 - - 44 JPY
120.79
BUY JPY / SELL AUD (Millions of Australian dollars)
13 - - 13 JPY
85.14
Interest rate risk
Interest rate swap transactions
USD (Millions of U.S. dollars)
125 450 - 575 -
SEK (Millions of Swedish kronor)
200 - - 200 -
EUR (Millions of euros)
1 425 - 426 -
AUD (Millions of Australian dollars)
- 162 - 162 -
Interest rate and currency swap transactions
USD (Millions of U.S. dollars)
276 631 - 907 JPY
98.66
AUD (Millions of Australian dollars)
- 107 - 107 JPY
93.32
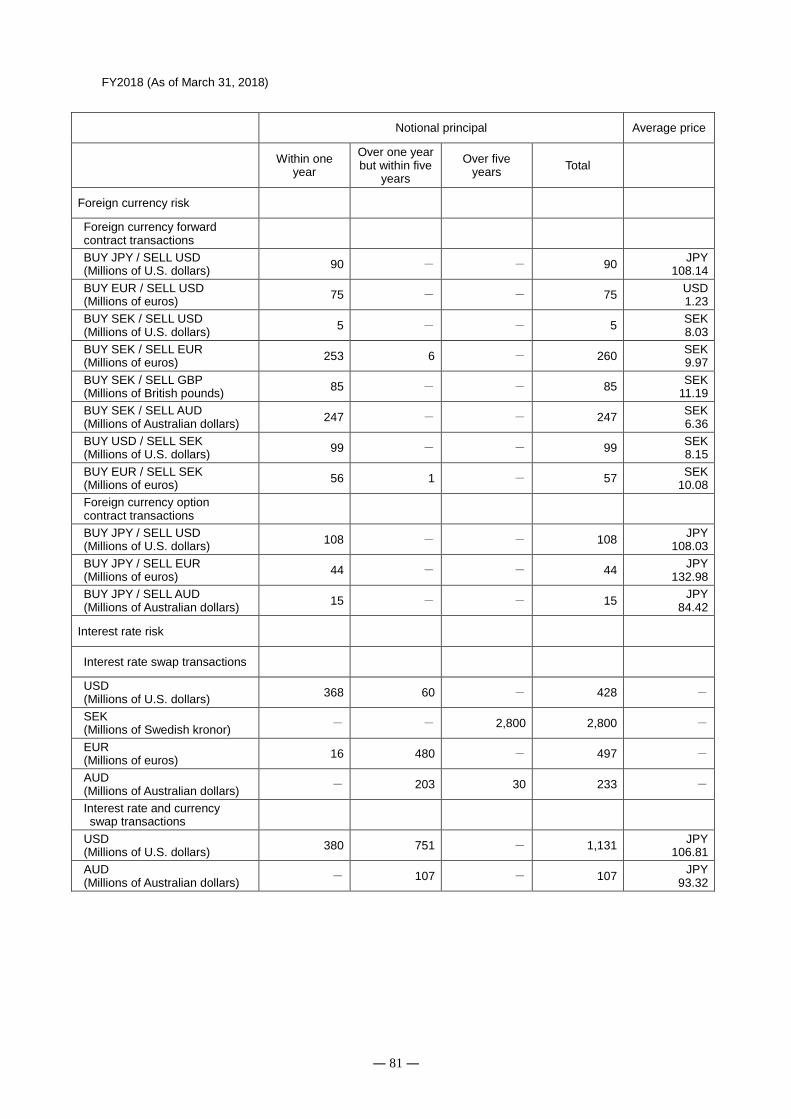
― 81 ―
FY2018 (As of March 31, 2018)
Notional principal Average price
Within one
year
Over one year but within five
years
Over five years
Total
Foreign currency risk
Foreign currency forward contract transactions
BUY JPY / SELL USD (Millions of U.S. dollars)
90 - - 90 JPY
108.14
BUY EUR / SELL USD (Millions of euros)
75 - - 75 USD 1.23
BUY SEK / SELL USD (Millions of U.S. dollars)
5 - - 5 SEK 8.03
BUY SEK / SELL EUR (Millions of euros)
253 6 - 260 SEK 9.97
BUY SEK / SELL GBP (Millions of British pounds)
85 - - 85 SEK
11.19
BUY SEK / SELL AUD (Millions of Australian dollars)
247 - - 247 SEK 6.36
BUY USD / SELL SEK (Millions of U.S. dollars)
99 - - 99 SEK 8.15
BUY EUR / SELL SEK (Millions of euros)
56 1 - 57 SEK
10.08
Foreign currency option contract transactions
BUY JPY / SELL USD (Millions of U.S. dollars)
108 - - 108 JPY
108.03
BUY JPY / SELL EUR (Millions of euros)
44 - - 44 JPY
132.98
BUY JPY / SELL AUD (Millions of Australian dollars)
15 - - 15 JPY
84.42
Interest rate risk
Interest rate swap transactions
USD (Millions of U.S. dollars)
368 60 - 428 -
SEK (Millions of Swedish kronor)
- - 2,800 2,800 -
EUR (Millions of euros)
16 480 - 497 -
AUD (Millions of Australian dollars)
- 203 30 233 -
Interest rate and currency swap transactions
USD (Millions of U.S. dollars)
380 751 - 1,131 JPY
106.81
AUD (Millions of Australian dollars)
- 107 - 107 JPY
93.32
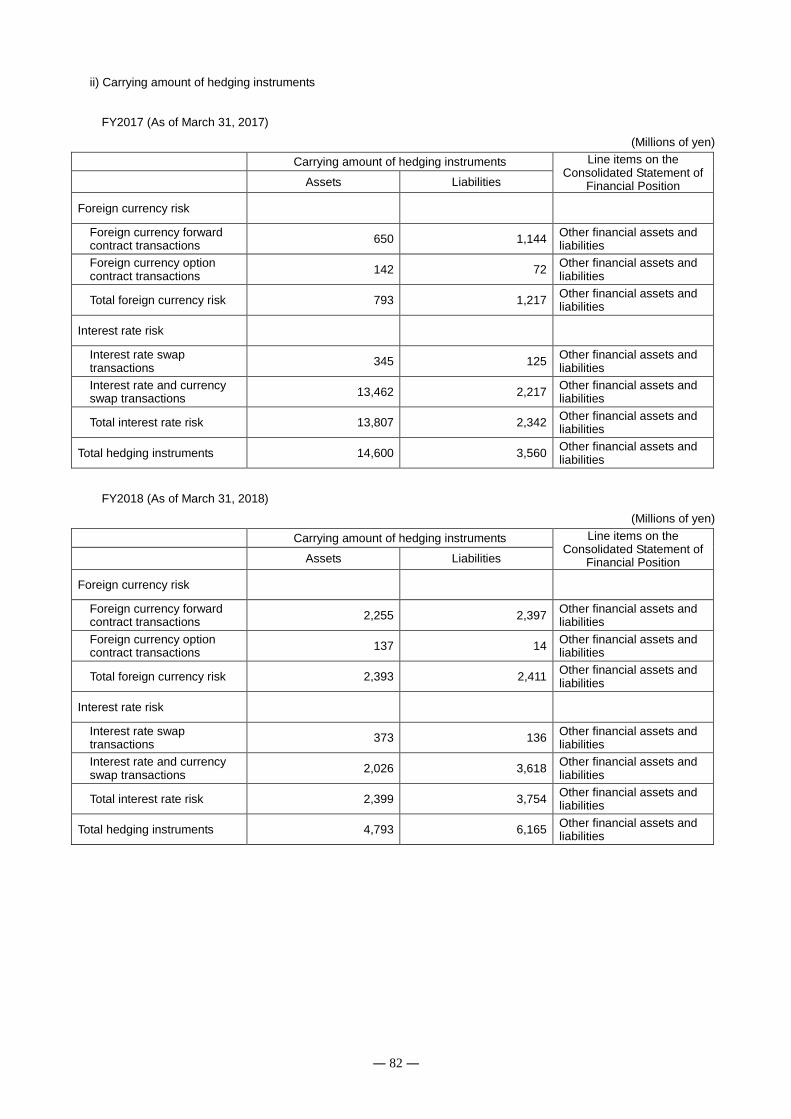
― 82 ―
ii) Carrying amount of hedging instruments
FY2017 (As of March 31, 2017)
(Millions of yen)
Carrying amount of hedging instruments Line items on the Consolidated Statement of
Financial Position Assets Liabilities
Foreign currency risk
Foreign currency forward contract transactions
650 1,144 Other financial assets and liabilities
Foreign currency option contract transactions
142 72 Other financial assets and liabilities
Total foreign currency risk 793 1,217 Other financial assets and liabilities
Interest rate risk
Interest rate swap transactions
345 125 Other financial assets and liabilities
Interest rate and currency swap transactions
13,462 2,217 Other financial assets and liabilities
Total interest rate risk 13,807 2,342 Other financial assets and liabilities
Total hedging instruments 14,600 3,560 Other financial assets and liabilities
FY2018 (As of March 31, 2018)
(Millions of yen)
Carrying amount of hedging instruments Line items on the Consolidated Statement of
Financial Position Assets Liabilities
Foreign currency risk
Foreign currency forward contract transactions
2,255 2,397 Other financial assets and liabilities
Foreign currency option contract transactions
137 14 Other financial assets and liabilities
Total foreign currency risk 2,393 2,411 Other financial assets and liabilities
Interest rate risk
Interest rate swap transactions
373 136 Other financial assets and liabilities
Interest rate and currency swap transactions
2,026 3,618 Other financial assets and liabilities
Total interest rate risk 2,399 3,754 Other financial assets and liabilities
Total hedging instruments 4,793 6,165 Other financial assets and liabilities
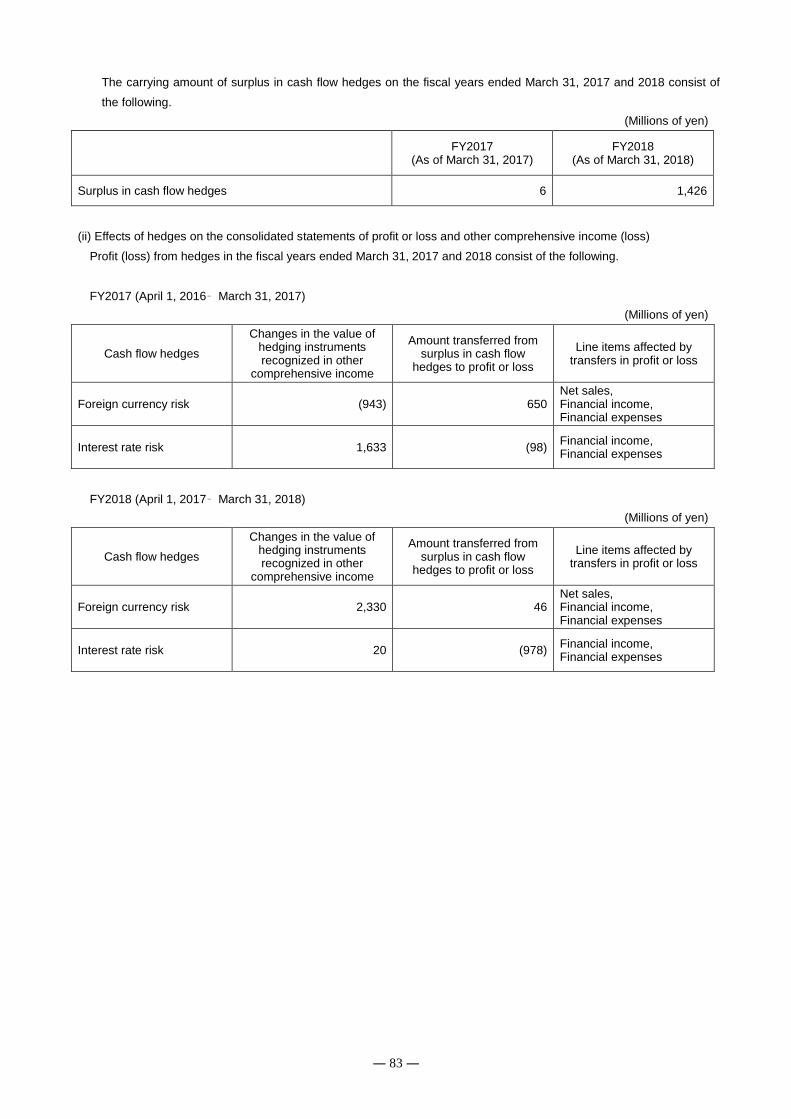
― 83 ―
The carrying amount of surplus in cash flow hedges on the fiscal years ended March 31, 2017 and 2018 consist of
the following.
(Millions of yen)
FY2017
(As of March 31, 2017) FY2018
(As of March 31, 2018)
Surplus in cash flow hedges 6 1,426
(ii) Effects of hedges on the consolidated statements of profit or loss and other comprehensive income (loss)
Profit (loss) from hedges in the fiscal years ended March 31, 2017 and 2018 consist of the following.
FY2017 (April 1, 2016– March 31, 2017)
(Millions of yen)
Cash flow hedges
Changes in the value of hedging instruments recognized in other
comprehensive income
Amount transferred from surplus in cash flow
hedges to profit or loss
Line items affected by transfers in profit or loss
Foreign currency risk (943) 650 Net sales, Financial income, Financial expenses
Interest rate risk 1,633 (98) Financial income, Financial expenses
FY2018 (April 1, 2017– March 31, 2018)
(Millions of yen)
Cash flow hedges
Changes in the value of hedging instruments recognized in other
comprehensive income
Amount transferred from surplus in cash flow
hedges to profit or loss
Line items affected by transfers in profit or loss
Foreign currency risk 2,330 46 Net sales, Financial income, Financial expenses
Interest rate risk 20 (978) Financial income, Financial expenses
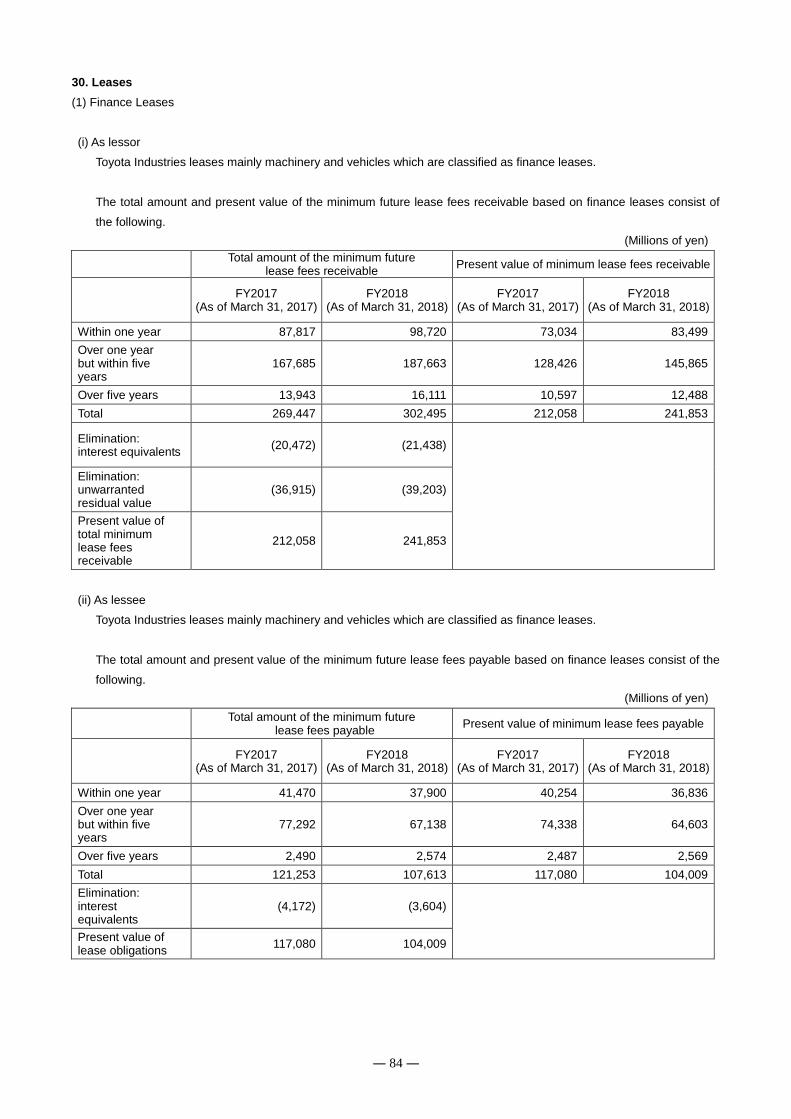
― 84 ―
30. Leases
(1) Finance Leases
(i) As lessor
Toyota Industries leases mainly machinery and vehicles which are classified as finance leases.
The total amount and present value of the minimum future lease fees receivable based on finance leases consist of
the following.
(Millions of yen)
Total amount of the minimum future
lease fees receivable Present value of minimum lease fees receivable
FY2017
(As of March 31, 2017) FY2018
(As of March 31, 2018) FY2017
(As of March 31, 2017) FY2018
(As of March 31, 2018)
Within one year 87,817 98,720 73,034 83,499
Over one year but within five years
167,685 187,663 128,426 145,865
Over five years 13,943 16,111 10,597 12,488
Total 269,447 302,495 212,058 241,853
Elimination: interest equivalents
(20,472) (21,438)
Elimination: unwarranted residual value
(36,915) (39,203)
Present value of total minimum lease fees receivable
212,058 241,853
(ii) As lessee
Toyota Industries leases mainly machinery and vehicles which are classified as finance leases.
The total amount and present value of the minimum future lease fees payable based on finance leases consist of the
following.
(Millions of yen)
Total amount of the minimum future
lease fees payable Present value of minimum lease fees payable
FY2017
(As of March 31, 2017) FY2018
(As of March 31, 2018) FY2017
(As of March 31, 2017) FY2018
(As of March 31, 2018)
Within one year 41,470 37,900 40,254 36,836
Over one year but within five years
77,292 67,138 74,338 64,603
Over five years 2,490 2,574 2,487 2,569
Total 121,253 107,613 117,080 104,009
Elimination: interest equivalents
(4,172) (3,604)
Present value of lease obligations
117,080 104,009
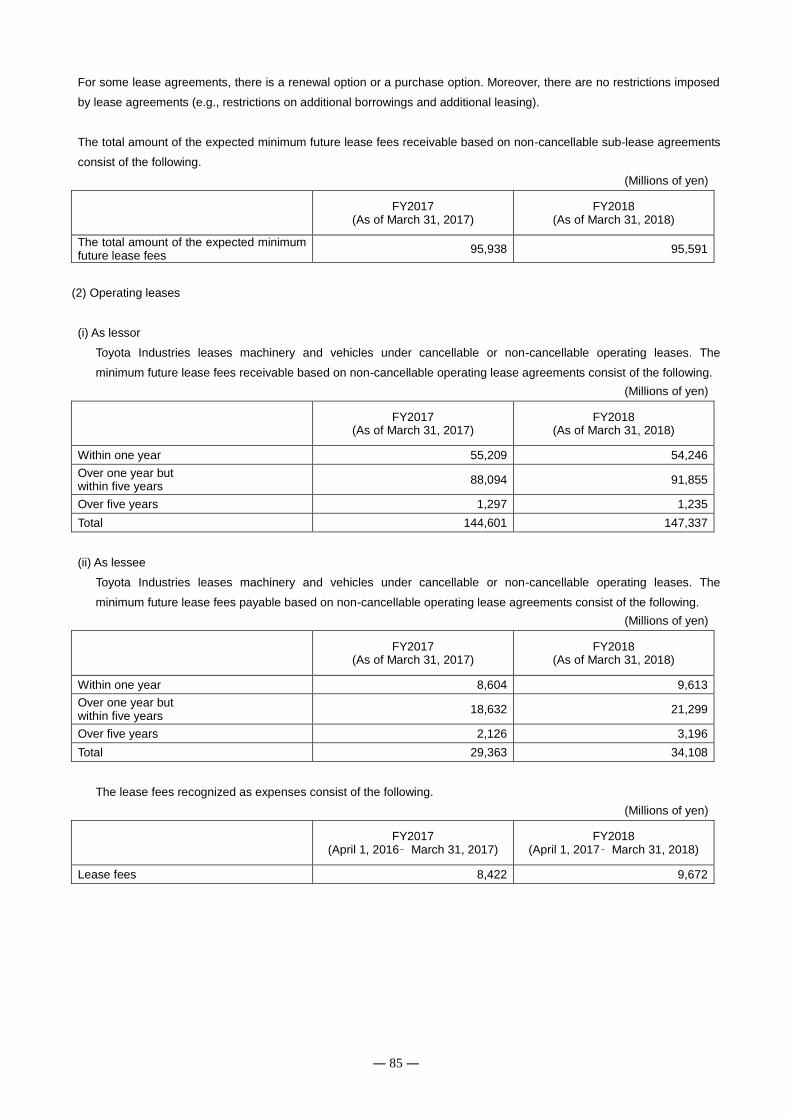
― 85 ―
For some lease agreements, there is a renewal option or a purchase option. Moreover, there are no restrictions imposed
by lease agreements (e.g., restrictions on additional borrowings and additional leasing).
The total amount of the expected minimum future lease fees receivable based on non-cancellable sub-lease agreements
consist of the following.
(Millions of yen)
FY2017
(As of March 31, 2017) FY2018
(As of March 31, 2018)
The total amount of the expected minimum future lease fees
95,938 95,591
(2) Operating leases
(i) As lessor
Toyota Industries leases machinery and vehicles under cancellable or non-cancellable operating leases. The
minimum future lease fees receivable based on non-cancellable operating lease agreements consist of the following.
(Millions of yen)
FY2017
(As of March 31, 2017) FY2018
(As of March 31, 2018)
Within one year 55,209 54,246
Over one year but within five years
88,094 91,855
Over five years 1,297 1,235
Total 144,601 147,337
(ii) As lessee
Toyota Industries leases machinery and vehicles under cancellable or non-cancellable operating leases. The
minimum future lease fees payable based on non-cancellable operating lease agreements consist of the following.
(Millions of yen)
FY2017
(As of March 31, 2017) FY2018
(As of March 31, 2018)
Within one year 8,604 9,613
Over one year but within five years
18,632 21,299
Over five years 2,126 3,196
Total 29,363 34,108
The lease fees recognized as expenses consist of the following.
(Millions of yen)
FY2017
(April 1, 2016– March 31, 2017) FY2018
(April 1, 2017– March 31, 2018)
Lease fees 8,422 9,672
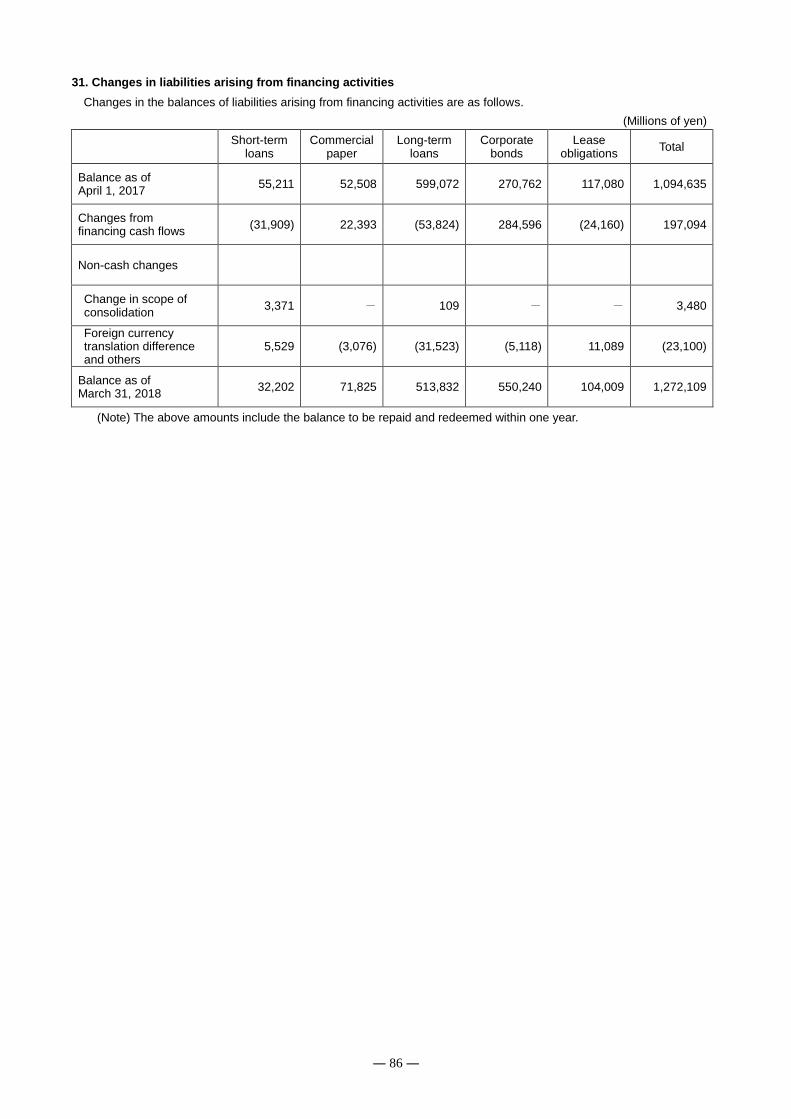
― 86 ―
31. Changes in liabilities arising from financing activities
Changes in the balances of liabilities arising from financing activities are as follows.
(Millions of yen)
Short-term
loans Commercial
paper Long-term
loans Corporate
bonds Lease
obligations Total
Balance as of April 1, 2017
55,211 52,508 599,072 270,762 117,080 1,094,635
Changes from financing cash flows
(31,909) 22,393 (53,824) 284,596 (24,160) 197,094
Non-cash changes
Change in scope of consolidation
3,371 - 109 - - 3,480
Foreign currency translation difference and others
5,529 (3,076) (31,523) (5,118) 11,089 (23,100)
Balance as of March 31, 2018
32,202 71,825 513,832 550,240 104,009 1,272,109
(Note) The above amounts include the balance to be repaid and redeemed within one year.
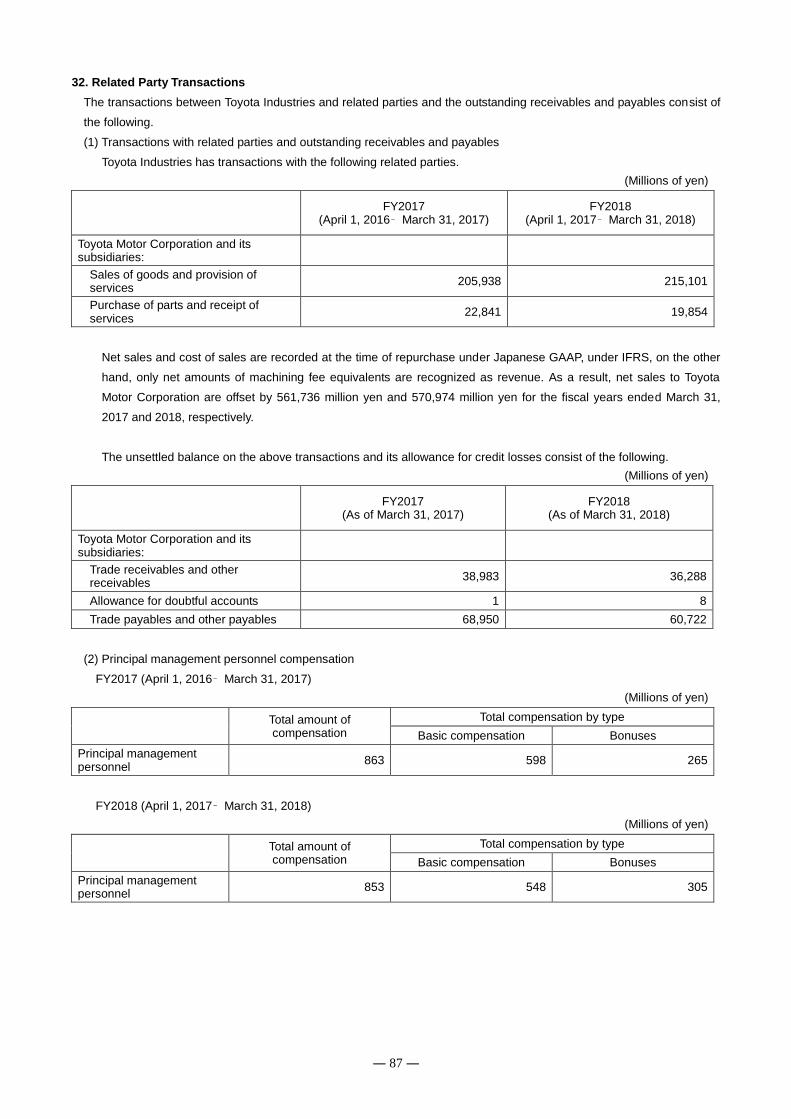
― 87 ―
32. Related Party Transactions
The transactions between Toyota Industries and related parties and the outstanding receivables and payables consist of
the following.
(1) Transactions with related parties and outstanding receivables and payables
Toyota Industries has transactions with the following related parties.
(Millions of yen)
FY2017
(April 1, 2016– March 31, 2017) FY2018
(April 1, 2017– March 31, 2018)
Toyota Motor Corporation and its subsidiaries:
Sales of goods and provision of services
205,938 215,101
Purchase of parts and receipt of services
22,841 19,854
Net sales and cost of sales are recorded at the time of repurchase under Japanese GAAP, under IFRS, on the other
hand, only net amounts of machining fee equivalents are recognized as revenue. As a result, net sales to Toyota
Motor Corporation are offset by 561,736 million yen and 570,974 million yen for the fiscal years ended March 31,
2017 and 2018, respectively.
The unsettled balance on the above transactions and its allowance for credit losses consist of the following.
(Millions of yen)
FY2017
(As of March 31, 2017) FY2018
(As of March 31, 2018)
Toyota Motor Corporation and its subsidiaries:
Trade receivables and other receivables
38,983 36,288
Allowance for doubtful accounts 1 8
Trade payables and other payables 68,950 60,722
(2) Principal management personnel compensation
FY2017 (April 1, 2016– March 31, 2017)
(Millions of yen)
Total amount of compensation
Total compensation by type
Basic compensation Bonuses
Principal management personnel
863 598 265
FY2018 (April 1, 2017– March 31, 2018)
(Millions of yen)
Total amount of compensation
Total compensation by type
Basic compensation Bonuses
Principal management personnel
853 548 305
― 88 ―
33. Contingencies
There are no material contingent liabilities that need to be disclosed as of the end of the fiscal year ended March 31,
2017 and the end of fiscal year ended March 31, 2018.
34. Commitments
Regarding the acquisition of property, plant and equipment, important capital expenditures (commitments) which are
contracted but not yet recognized on the consolidated financial statements are 23,298 million yen and 31,752 million yen
as of the end of the fiscal year ended March 31, 2017 and the end of the fiscal year ended March 31, 2018, respectively.
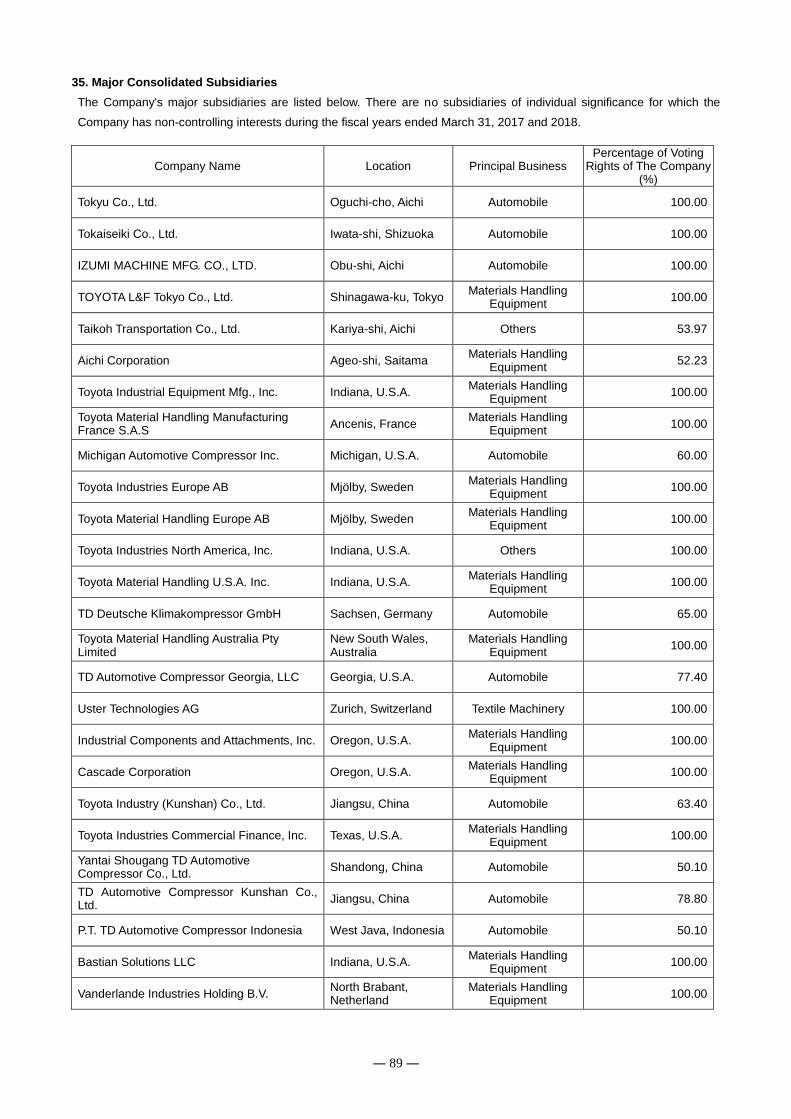
― 89 ―
35. Major Consolidated Subsidiaries
The Company's major subsidiaries are listed below. There are no subsidiaries of individual significance for which the
Company has non-controlling interests during the fiscal years ended March 31, 2017 and 2018.
Company Name Location Principal Business Percentage of Voting
Rights of The Company (%)
Tokyu Co., Ltd. Oguchi-cho, Aichi Automobile 100.00
Tokaiseiki Co., Ltd. Iwata-shi, Shizuoka Automobile 100.00
IZUMI MACHINE MFG. CO., LTD. Obu-shi, Aichi Automobile 100.00
TOYOTA L&F Tokyo Co., Ltd. Shinagawa-ku, Tokyo Materials Handling
Equipment 100.00
Taikoh Transportation Co., Ltd. Kariya-shi, Aichi Others 53.97
Aichi Corporation Ageo-shi, Saitama Materials Handling
Equipment 52.23
Toyota Industrial Equipment Mfg., Inc. Indiana, U.S.A. Materials Handling
Equipment 100.00
Toyota Material Handling Manufacturing France S.A.S
Ancenis, France Materials Handling
Equipment 100.00
Michigan Automotive Compressor Inc. Michigan, U.S.A. Automobile 60.00
Toyota Industries Europe AB Mjölby, Sweden Materials Handling
Equipment 100.00
Toyota Material Handling Europe AB Mjölby, Sweden Materials Handling
Equipment 100.00
Toyota Industries North America, Inc. Indiana, U.S.A. Others 100.00
Toyota Material Handling U.S.A. Inc. Indiana, U.S.A. Materials Handling
Equipment 100.00
TD Deutsche Klimakompressor GmbH Sachsen, Germany Automobile 65.00
Toyota Material Handling Australia Pty Limited
New South Wales, Australia
Materials Handling Equipment
100.00
TD Automotive Compressor Georgia, LLC Georgia, U.S.A. Automobile 77.40
Uster Technologies AG Zurich, Switzerland Textile Machinery 100.00
Industrial Components and Attachments, Inc. Oregon, U.S.A. Materials Handling
Equipment 100.00
Cascade Corporation Oregon, U.S.A. Materials Handling
Equipment 100.00
Toyota Industry (Kunshan) Co., Ltd. Jiangsu, China Automobile 63.40
Toyota Industries Commercial Finance, Inc. Texas, U.S.A. Materials Handling
Equipment 100.00
Yantai Shougang TD Automotive Compressor Co., Ltd.
Shandong, China Automobile 50.10
TD Automotive Compressor Kunshan Co., Ltd.
Jiangsu, China Automobile 78.80
P.T. TD Automotive Compressor Indonesia West Java, Indonesia Automobile 50.10
Bastian Solutions LLC Indiana, U.S.A. Materials Handling
Equipment 100.00
Vanderlande Industries Holding B.V. North Brabant, Netherland
Materials Handling Equipment
100.00
― 90 ―
36. Subsequent Events
There are no material subsequent events to be reported as of August 10, 2018.
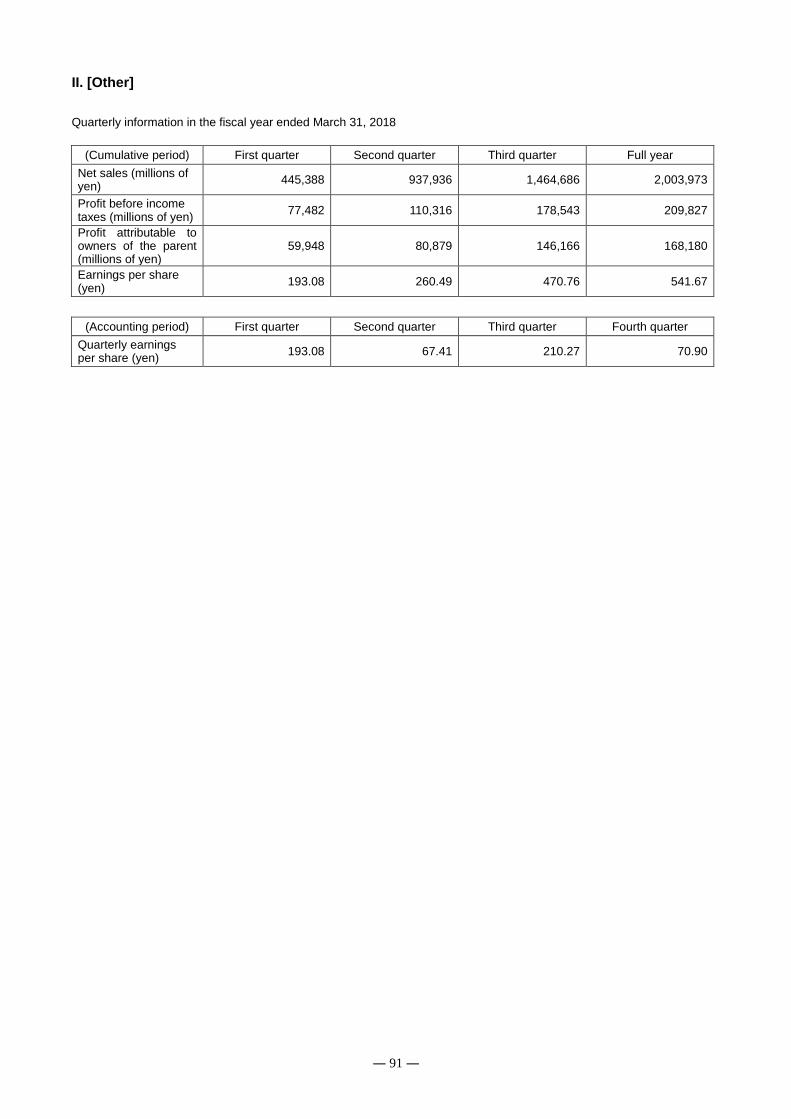
― 91 ―
II. [Other]
Quarterly information in the fiscal year ended March 31, 2018
(Cumulative period) First quarter Second quarter Third quarter Full year
Net sales (millions of yen)
445,388 937,936 1,464,686 2,003,973
Profit before income taxes (millions of yen)
77,482 110,316 178,543 209,827
Profit attributable to owners of the parent (millions of yen)
59,948 80,879 146,166 168,180
Earnings per share (yen)
193.08 260.49 470.76 541.67
(Accounting period) First quarter Second quarter Third quarter Fourth quarter
Quarterly earnings per share (yen)
193.08 67.41 210.27 70.90
― 92 ―
Independent Auditor's Report
To the Board of Directors of Toyota Industries Corporation We have audited the accompanying consolidated financial statements of Toyota Industries Corporation ("the Company") and its consolidated subsidiaries, which comprise the consolidated statement of financial position as at March 31, 2018, and the consolidated statement of profit or loss, consolidated statement of comprehensive income, consolidated statement of changes in equity and consolidated statement of cash flows for the year then ended, and notes to consolidated financial statements. Management's Responsibility for the Consolidated Financial Statements Management is responsible for the preparation and fair presentation of these consolidated financial statements in accordance with International Financial Reporting Standards, and for such internal control as management determines is necessary to enable the preparation of consolidated financial statements that are free from material misstatement, whether due to fraud or error. Auditor's Responsibility Our responsibility is to express an opinion on these consolidated financial statements based on our audit. We conducted our audit in accordance with auditing standards generally accepted in Japan. Those standards require that we comply with ethical requirements and plan and perform the audit to obtain reasonable assurance about whether the consolidated financial statements are free from material misstatement. An audit involves performing procedures to obtain audit evidence about the amounts and disclosures in the consolidated financial statements. The procedures selected depend on the auditor's judgment, including the assessment of the risks of material misstatement of the consolidated financial statements, whether due to fraud or error. In making those risk assessments, the auditor considers internal control relevant to the entity's preparation and fair presentation of the consolidated financial statements in order to design audit procedures that are appropriate in the circumstances, while the purpose of the financial statement audit is not to express an opinion on the effectiveness of the entity's internal control. An audit also includes evaluating the appropriateness of accounting policies used and the reasonableness of accounting estimates made by management, as well as evaluating the overall presentation of the consolidated financial statements. We believe that the audit evidence we have obtained is sufficient and appropriate to provide a basis for our audit opinion. Opinion In our opinion, the consolidated financial statements present fairly, in all material respects, the financial position of the Company and its consolidated subsidiaries as at March 31, 2018, and their financial performance and cash flows for the year then ended in accordance with International Financial Reporting Standards.
August 10, 2018

TOYOTA INDUSTRIES CORPORATION 2-1, Toyoda-cho, Kariya-shi, Aichi 448-8671, Japan Telephone: +81-(0)566-22-2511 Facsimile: +81-(0)566-27-5650 www.toyota-industries.com