Embed Size (px)
Citation preview
Annual Financial Report2016-2017
mcmaster.ca/bms

YEAR IN REVIEW ..................................................... 5 By The Numbers .................................................... 7
FINANCIAL ANALYSIS ........................................... 8Revenues ................................................................. 11 Operating Grants Income Research Grants and Contracts Research Overhead Grants Tuition Fees Ancillary Operations Investment Income
Compensation and Benefits .................................... 15 Expense Employee Future Benefit Obligations
(Pension and Other)
Capital Projects and Financing ............................... 19 Capital Projects Capital Financing Financial Health and Sustainability Metrics
Enterprise Risk Management ................................. 23
SUPPLEMENTAL INFORMATION Operating Fund and Operating Budget ............... 25
FINANCIAL STATEMENTS ................................. 27 Statement of Financial Position Statement of Operations Statement of Changes in Net Assets Statement of Cash flows Notes to Financial Statements
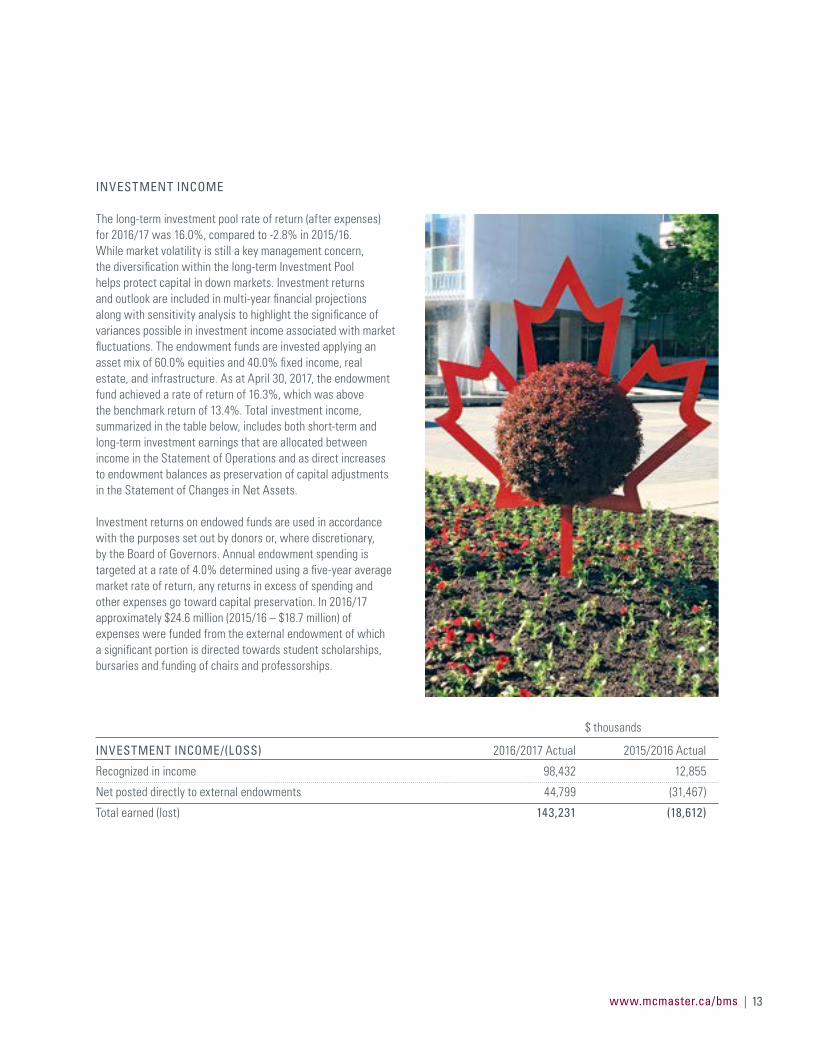
Change and TransitionMcMaster University’s Annual Financial Report theme of Change and Transition is beautifully
reflected in the gardens at McMaster. By their very nature, gardens are always in transition.
McMaster’s grounds and gardens are particularly spectacular in the summer, if almost to celebrate the
end of another fiscal year.
We have chosen to feature the gardens of summer throughout this report, and are most grateful to our
grounds crew for tending and nurturing the gardens so that all campus community members can enjoy them.
In this, Canada’s sesquicentennial year, the red and white of our flag is
featured in the plantings.
Cover photo: Garden and entrance at University Hall | Plantings: McMaster Facilities Services | Photography: McMaster Public Relations | Layout: Media Production Services
Annual Financial Report
2016-2017
| FINANCIAL SERVICES ANNUAL REPORT 2016-20174
www.mcmaster.ca/bms | 5
In 2012/13 McMaster’s Annual Report was themed Change and Transition. In 2016/17 the focus has been on Change and Transition Reviews. In 2012/13 McMaster launched the first of several Oracle PeopleSoft, or Mosaic, system modules that have had an impact on almost every faculty, staff or student member. The years following focused on system improvements and sustainability, people process changes, training, and more. However, in 2016/17, four years following the first system launch, there was a renewed interest across McMaster in further opportunities for change. In the past year, McMaster has launched, completed, or is in the process of completing an IT Review, a Budget Model Review, a Research-Finance Review, and a multi-university Benchmarking exercise. All of these initiatives are aimed at re-examining our non-academic activities in an effort to understand what McMaster does well and where improvements can be made. The IT Review resulted in a new IT governance model being launched in early 2017. This model embraces broad University-wide IT planning, governance, and oversight, involving a variety of system users, and aims to better serve the University’s research, teaching and learning, and administration constituencies. The model also places a focus on the core infrastructure and security needs of McMaster’s current and future IT environment. Further change initiatives are inevitable as other reviews are actioned.
The year also marked the loss of former McMaster President and Vice-Chancellor, Peter George, who served three terms as President before retiring in 2010. The new 500-bed residence and learning centre currently under construction will be named the Peter George Centre for Living and Learning in his honour.
Other capital initiatives completed or underway during the 2016/17 year include L.R. Wilson Hall, the Gerald Hatch Centre for Engineering Experiential Learning, and the renovation and expansion of the A.N. Bourns Building, including the Combined Heat & Power Plant. In addition, two new public-private partnerships (P3) are underway. The first P3 project approved is McMaster’s Main Street Student Residence, a two-phase undergraduate residence that will provide approximately 1,500 additional beds when fully completed, as well as community and research space. The second P3 initiative in approval stages is a downtown graduate student residence that will provide over 580 graduate student beds. McMaster’s involvement in P3 projects has allowed the University to partner with private developers to access capital funding that would otherwise not be available to the University without impacting its future debt capacity. Finally, negotiations with the City of Hamilton and MetroLinx regarding the Hamilton Light Rail Transit project are also continuing.
McMaster has made investments in research infrastructure and commercialization opportunities through the provision of space and equipment support at the McMaster Innovation Park for spin-off companies stemming from McMaster researchers. Innovative financial solutions, including equity participation, have been established to cultivate a spirit of support, collaboration and entrepreneurship that is beneficial to individual researchers, the University, and our society.
Solid financial planning initiatives, like many launched in 2016/17, enable McMaster to conserve funds in support of the University’s core academic and research mission. McMaster completed 2016/17 with a consolidated surplus of $129.2 million, compared to $29.1 million last year. The most significant contributor to this surplus is investment income, which achieved a 16.0% return (compared to -2.8% in the previous year) and generated $98.4 million in investment income. This income replenishes the recognized loss in the previous year, improves capital preservation of restricted funds, and funds an additional operating budget commitment totaling $15.0 million over five years, ending in 2019/20. McMaster deploys a diversified investment approach to generate long-term revenue streams and preserve capital. Investment markets continue to be somewhat volatile, which has reduced McMaster’s long-term average return outlook for the Investment Pool. The lower return environment coupled with the upcoming launch of a corridor (or capped) government-funding model for domestic student enrolment means it is more critical than ever that new revenue generation and investment opportunities are considered.
Year in Review
In the past year, McMaster has launched, completed, or is in the process of completing
an IT Review, a Budget Model Review, a Research-Finance
Review, and a multi-university Benchmarking exercise.
2016/17 Financial Analysis and Commentary
| FINANCIAL SERVICES ANNUAL REPORT 2016-20176
Also during 2016/17, a number of initiatives were launched as part of a multi-year plan to better align McMaster to the United Nations Principles for Responsible Investment. Initiatives include the consideration of additional environmental, societal, governmental and public policy factors when hiring new investment managers or implementing investment strategies. Further, McMaster issued a request for proposals to complete a carbon-footprint measurement of the Investment Pool that will inform the Investment Pool Committee and improve reporting capabilities to the McMaster community. Several investment related initiatives have been established as an interim step pending completion of the report from the Advisory Committee on Fossil Fuels Divestment.
Included within the consolidated results is an operating fund surplus of $25.9 million (2015/16 $4.4 million).. The surplus relates to both increased revenues and decreased expenditures. Revenue growth includes undergraduate enrolment growth, increased research related revenues, greater external utility recoveries, as well as additional government funding for Indigenous and first generation programs. Expenditure decline includes utility savings, and deferral of some initiatives. Within the operating fund, the University was able to fund a number of key strategic priorities in support of McMaster’s strategic mandate agreement objectives.
McMaster’s financial health planning contributed to its improved Standard and Poor’s credit rating of AA (stable), two ratings above the province, and is founded on a conservative approach to planning for costs. Included in this scope are longer term funding obligations associated with pensions, post-retirement benefits, debt retirement, and capital preservation. During 2016/17, the hourly pension plan was revalued, resulting in a small going concern surplus of $1.6 million and a solvency deficit of $20.4 million. The salaried pension plan will be valued in 2017/18 and new pension legislation will become effective in 2018, which should reduce McMaster’s benefit rate. The approach adopted in 2011 to manage the non-pension post-retirement deficits continues to be an effective long-term financing strategy that will eliminate this unfunded obligation over the next 30 years and eliminate the associated benefit rate charge to departments over time. Debt retirement sinking funds exist to repay two $120.0 million bonds (maturing in 2052 and 2065) and continue to be an effective strategy to exhaust these obligations. Finally, annual capital deferred maintenance funding of $10.0 million from the operating budget and additional annual support from residence operations has helped to improve the facilities condition index to 15.0% (16.1% - 2015/2016) along with the completion of new buildings. Additional work on capital preservation is underway to ensure systems infrastructure funding is sufficient to sustain and keep pace with IT needs.
The information contained in this Annual Financial Report is intended to provide the reader with financial information for the fiscal year ended April 30, 2017. While the focus of this document is the consolidated operations of all funds on an accrual basis, information regarding the Operating Fund, which operates on a cash basis for budgeting and accounting purposes, has been included on page 25.
Other documents to which the reader can refer to provide a more in-depth discussion of the University include:
Strategic Mandate Agreement
SMA – Signed Agreement – April, 2014 http://www.mcmaster.ca/vpacademic/documents/SMA_2014_McMaster_Agreement.pdf
SMA – March, 2014 http://www.mcmaster.ca/vpacademic/documents/SMA-McMaster-March,2014.pdf
McMaster Goals and Priorities Report 2016-2017 https://president.mcmaster.ca/wp-content/uploads/2017/09/McMaster-Goals-and-Priorities-Report-2016-2107.pdf
Forward with Integrity https://president.mcmaster.ca/guiding-strategy/
Consolidated Budget – June 2017 http://mcmaster.ca/bms/pdf/2017-18_budget.pdf
State of the Academy Address – March 2017 https://www.youtube.com/watch?v=pWvuFJoakA4&feature=youtu.be
University Fact Book http://www.mcmaster.ca/vpacademic/documents/FactBook2015-2016.pdf
Sustainability Report https://www.mcmaster.ca/sustainability/documents/Sustainability%20Report%202016.pdf
www.mcmaster.ca/bms | 7
By the Numbers
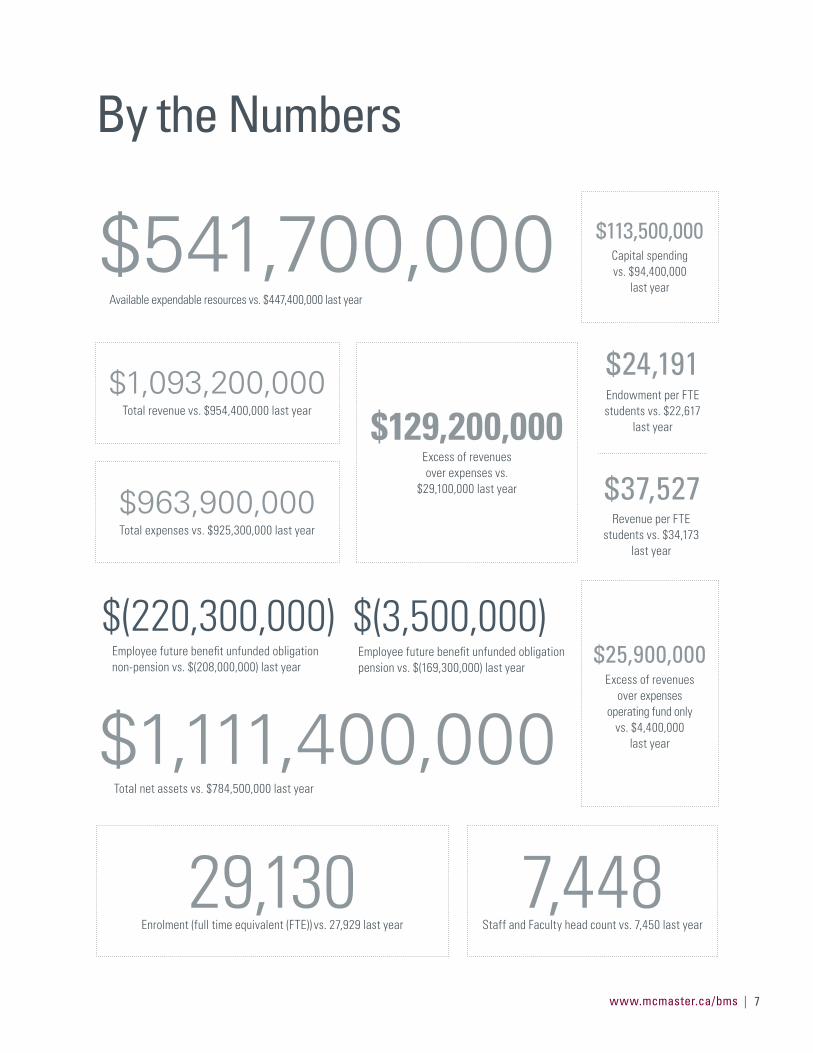
$1,093,200,000Total revenue vs. $954,400,000 last year
$25,900,000Excess of revenues
over expenses operating fund only
vs. $4,400,000 last year
$113,500,000Capital spending vs. $94,400,000
last year
$129,200,000Excess of revenues over expenses vs.
$29,100,000 last year
7,448Staff and Faculty head count vs. 7,450 last year
29,130Enrolment (full time equivalent (FTE)) vs. 27,929 last year
$963,900,000Total expenses vs. $925,300,000 last year
$(3,500,000)Employee future benefit unfunded obligation pension vs. $(169,300,000) last year
$24,191
$37,527
Endowment per FTE students vs. $22,617
last year
Revenue per FTE students vs. $34,173
last year
$(220,300,000)Employee future benefit unfunded obligation non-pension vs. $(208,000,000) last year
$541,700,000Available expendable resources vs. $447,400,000 last year
Total net assets vs. $784,500,000 last year
$1,111,400,000
| FINANCIAL SERVICES ANNUAL REPORT 2016-20178
Financial AnalysisTOTAL REVENUE
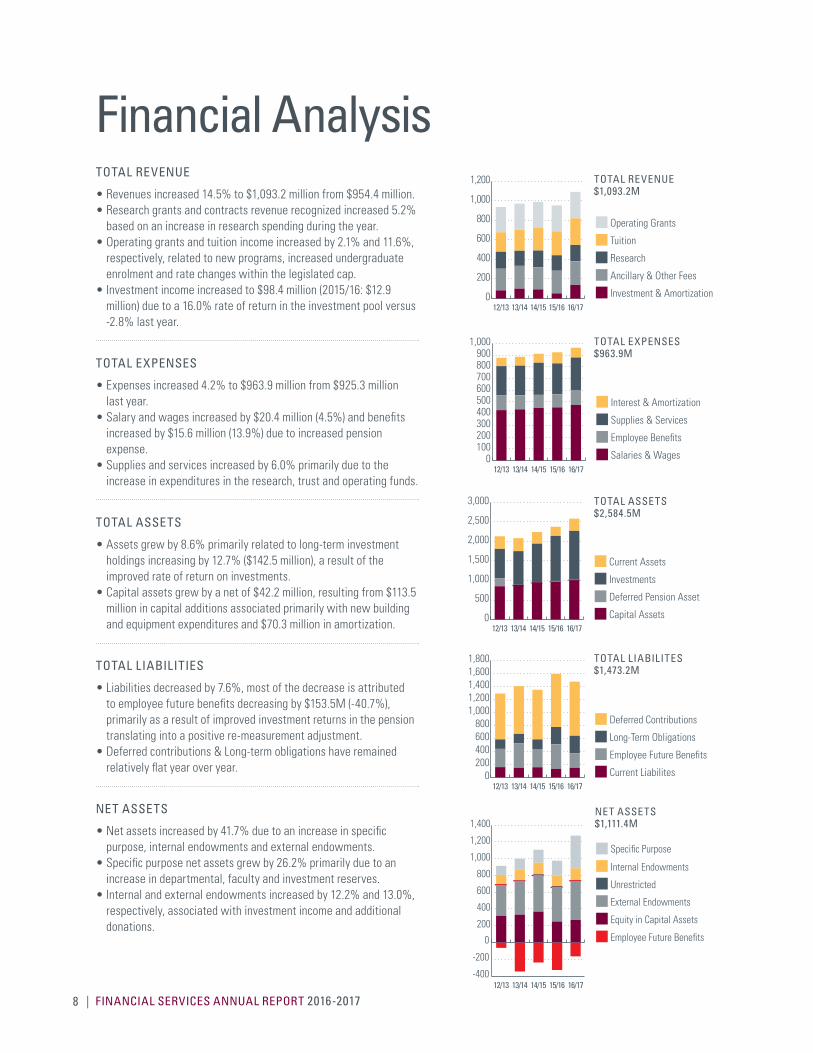
• Revenues increased 14.5% to $1,093.2 million from $954.4 million.• Research grants and contracts revenue recognized increased 5.2%
based on an increase in research spending during the year.• Operating grants and tuition income increased by 2.1% and 11.6%,
respectively, related to new programs, increased undergraduate enrolment and rate changes within the legislated cap.
• Investment income increased to $98.4 million (2015/16: $12.9 million) due to a 16.0% rate of return in the investment pool versus -2.8% last year.
TOTAL EXPENSES
• Expenses increased 4.2% to $963.9 million from $925.3 million last year.
• Salary and wages increased by $20.4 million (4.5%) and benefits increased by $15.6 million (13.9%) due to increased pension expense.
• Supplies and services increased by 6.0% primarily due to the increase in expenditures in the research, trust and operating funds.
TOTAL ASSETS
• Assets grew by 8.6% primarily related to long-term investment holdings increasing by 12.7% ($142.5 million), a result of the improved rate of return on investments.
• Capital assets grew by a net of $42.2 million, resulting from $113.5 million in capital additions associated primarily with new building and equipment expenditures and $70.3 million in amortization.
TOTAL LIABILITIES
• Liabilities decreased by 7.6%, most of the decrease is attributed to employee future benefits decreasing by $153.5M (-40.7%), primarily as a result of improved investment returns in the pension translating into a positive re-measurement adjustment.
• Deferred contributions & Long-term obligations have remained relatively flat year over year.
NET ASSETS
• Net assets increased by 41.7% due to an increase in specific purpose, internal endowments and external endowments.
• Specific purpose net assets grew by 26.2% primarily due to an increase in departmental, faculty and investment reserves.
• Internal and external endowments increased by 12.2% and 13.0%, respectively, associated with investment income and additional donations.
0
200
400
600
800
1,000
1,200
Operating Grants
Tuition
Research
Ancillary & Other Fees
Investment & Amortization16/1715/1614/1513/1412/13
TOTAL REVENUE $1,093.2M
0100200300400500600700800900
1,000
Interest & Amortization
Supplies & Services
Employee Benefits
Salaries & Wages16/1715/1614/1513/1412/13
TOTAL EXPENSES $963.9M
0
500
1,000
1,500
2,000
2,500
3,000
Current Assets
Investments
Deferred Pension Asset
Capital Assets16/1715/1614/1513/1412/13
TOTAL ASSETS $2,584.5M
0200400600800
1,0001,2001,4001,6001,800
Deferred Contributions
Long-Term Obligations
Employee Future Benefits
Current Liabilites16/1715/1614/1513/1412/13
TOTAL LIABILITES $1,473.2M
0
-200
-400
200
400
600
800
1,000
1,200
1,400
Specific Purpose
Internal Endowments
Unrestricted
Employee Future Benefits
External Endowments
Equity in Capital Assets
16/1715/1614/1513/1412/13
0
NET ASSETS $1,111.4M
www.mcmaster.ca/bms | 9
LONG-TERM DEBT
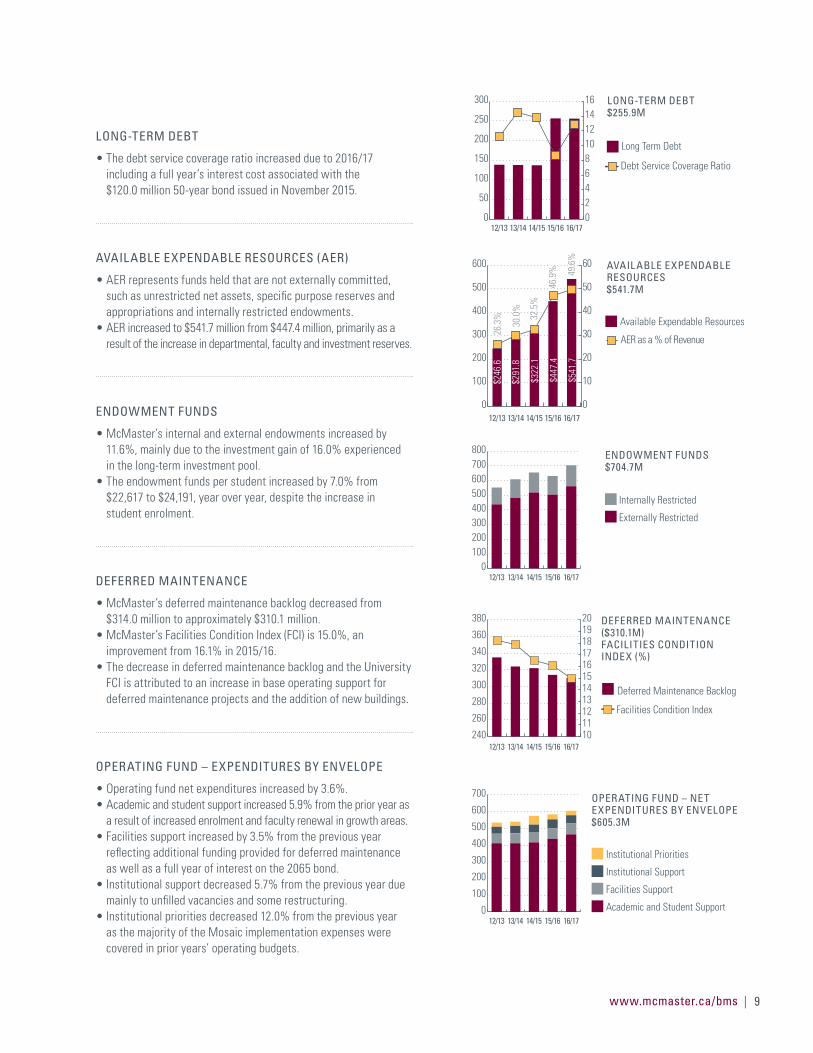
• The debt service coverage ratio increased due to 2016/17 including a full year’s interest cost associated with the $120.0 million 50-year bond issued in November 2015.
AVAILABLE EXPENDABLE RESOURCES (AER)
• AER represents funds held that are not externally committed, such as unrestricted net assets, specific purpose reserves and appropriations and internally restricted endowments.
• AER increased to $541.7 million from $447.4 million, primarily as a result of the increase in departmental, faculty and investment reserves.
ENDOWMENT FUNDS
• McMaster’s internal and external endowments increased by 11.6%, mainly due to the investment gain of 16.0% experienced in the long-term investment pool.
• The endowment funds per student increased by 7.0% from $22,617 to $24,191, year over year, despite the increase in student enrolment.
DEFERRED MAINTENANCE
• McMaster’s deferred maintenance backlog decreased from $314.0 million to approximately $310.1 million.
• McMaster’s Facilities Condition Index (FCI) is 15.0%, an improvement from 16.1% in 2015/16.
• The decrease in deferred maintenance backlog and the University FCI is attributed to an increase in base operating support for deferred maintenance projects and the addition of new buildings.
OPERATING FUND – EXPENDITURES BY ENVELOPE
• Operating fund net expenditures increased by 3.6%.• Academic and student support increased 5.9% from the prior year as
a result of increased enrolment and faculty renewal in growth areas.• Facilities support increased by 3.5% from the previous year
reflecting additional funding provided for deferred maintenance as well as a full year of interest on the 2065 bond.
• Institutional support decreased 5.7% from the previous year due mainly to unfilled vacancies and some restructuring.
• Institutional priorities decreased 12.0% from the previous year as the majority of the Mosaic implementation expenses were covered in prior years’ operating budgets.
0
50
100
150
200
250
300
Long Term Debt
16/1715/1614/1513/1412/130246810121416
Debt Service Coverage Ratio
LONG-TERM DEBT $255.9M
0
100
200
300
400
500
600
Available Expendable Resources
16/1715/1614/1513/1412/13
$291
.8
$246
.6
$322
.1
$447
.4
$541
.7
0
10
20
30
40
50
60
AER as a % of Revenue
26.3
%
30.0
%
32.5
%
46.9
% 49.6
%
AVAIL ABLE EXPENDABLE RESOURCES $541.7M
0100200300400500600700800
Internally Restricted
Externally Restricted
16/1715/1614/1513/1412/13
ENDOWMENT FUNDS $704.7M
240
260
280
300
320
340
360
380
Deferred Maintenance Backlog
16/1715/1614/1513/1412/131011121314151617181920
Facilities Condition Index
DEFERRED MAINTENANCE ($310.1M) FACILITIES CONDITION INDEX (%)
0
100
200
300
400
500
600
700
Institutional Priorities
Institutional Support
Facilities Support
Academic and Student Support16/1715/1614/1513/1412/13
OPERATING FUND – NET EXPENDITURES BY ENVELOPE $605.3M

| FINANCIAL SERVICES ANNUAL REPORT 2016-201710
www.mcmaster.ca/bms | 11
In 2016/17 total revenue increased by 14.5% to $1,093.2 million (2015/16 – $954.4 million) reflecting revenue per student of $37,527 (2015/16 – $34,173). The revenue increase of $138.7 million relates primarily to $98.4 million in investment income associated with a 16.0% return and an increase of $28.5 million in tuition income related to increased undergraduate enrolment. McMaster University continues to focus on new revenue generation opportunities across all areas of the University while actively managing existing revenue streams to optimize investments in the student experience, academic and research mission. Key investment priorities include differentiation through experiential learning programs and technology and infrastructure transformations.
OPERATING GRANTS INCOME
Government operating grants increased by $5.7 million or 2.1% over 2015/16 primarily due to provincial grant funding for Indigenous and first generation programs.
RESEARCH GRANTS AND CONTRACTS
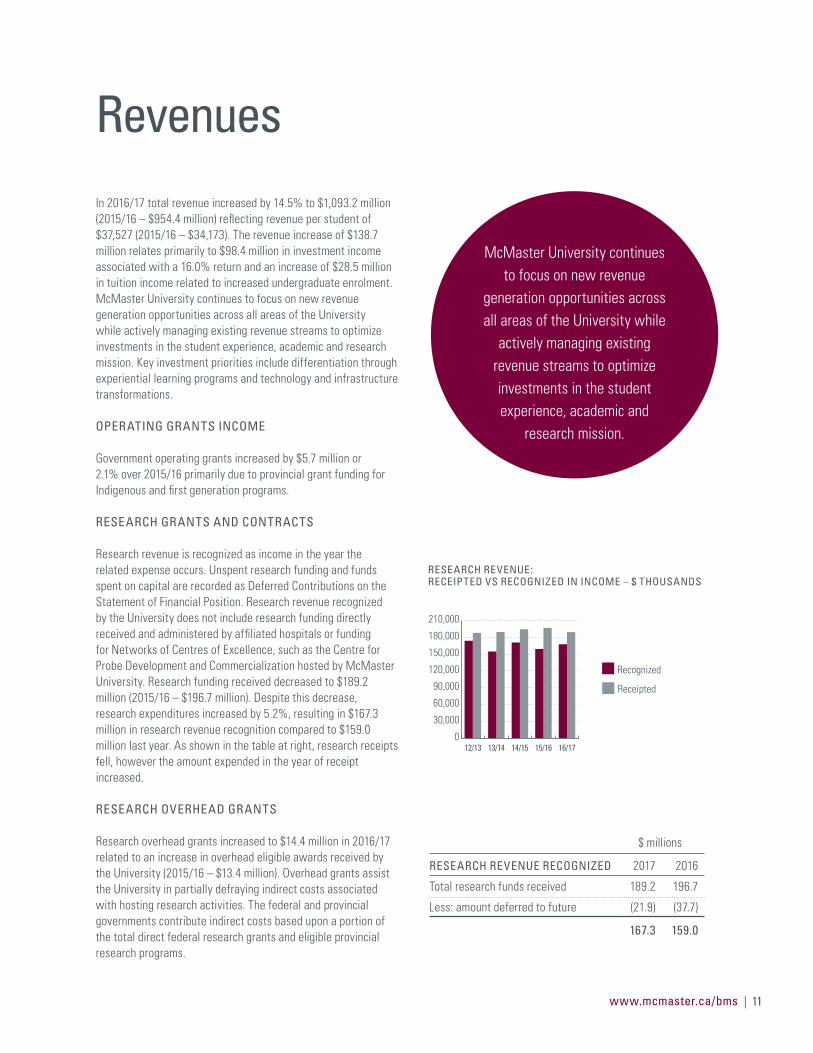
Research revenue is recognized as income in the year the related expense occurs. Unspent research funding and funds spent on capital are recorded as Deferred Contributions on the Statement of Financial Position. Research revenue recognized by the University does not include research funding directly received and administered by affiliated hospitals or funding for Networks of Centres of Excellence, such as the Centre for Probe Development and Commercialization hosted by McMaster University. Research funding received decreased to $189.2 million (2015/16 – $196.7 million). Despite this decrease, research expenditures increased by 5.2%, resulting in $167.3 million in research revenue recognition compared to $159.0 million last year. As shown in the table at right, research receipts fell, however the amount expended in the year of receipt increased.
RESEARCH OVERHEAD GRANTS
Research overhead grants increased to $14.4 million in 2016/17 related to an increase in overhead eligible awards received by the University (2015/16 – $13.4 million). Overhead grants assist the University in partially defraying indirect costs associated with hosting research activities. The federal and provincial governments contribute indirect costs based upon a portion of the total direct federal research grants and eligible provincial research programs.
Revenues
0
30,000
60,000
90,000
120,000
150,000
180,000
210,000
Receipted
Recognized
16/1715/1614/1513/1412/13
RESEARCH REVENUE: RECEIPTED VS RECOGNIZED IN INCOME – $ THOUSANDS
$ millions
RESEARCH REVENUE RECOGNIZED 2017 2016
Total research funds received 189.2 196.7
Less: amount deferred to future (21.9) (37.7)
167.3 159.0
McMaster University continues to focus on new revenue
generation opportunities across all areas of the University while
actively managing existing revenue streams to optimize investments in the student experience, academic and
research mission.
| FINANCIAL SERVICES ANNUAL REPORT 2016-201712
TUITION FEES
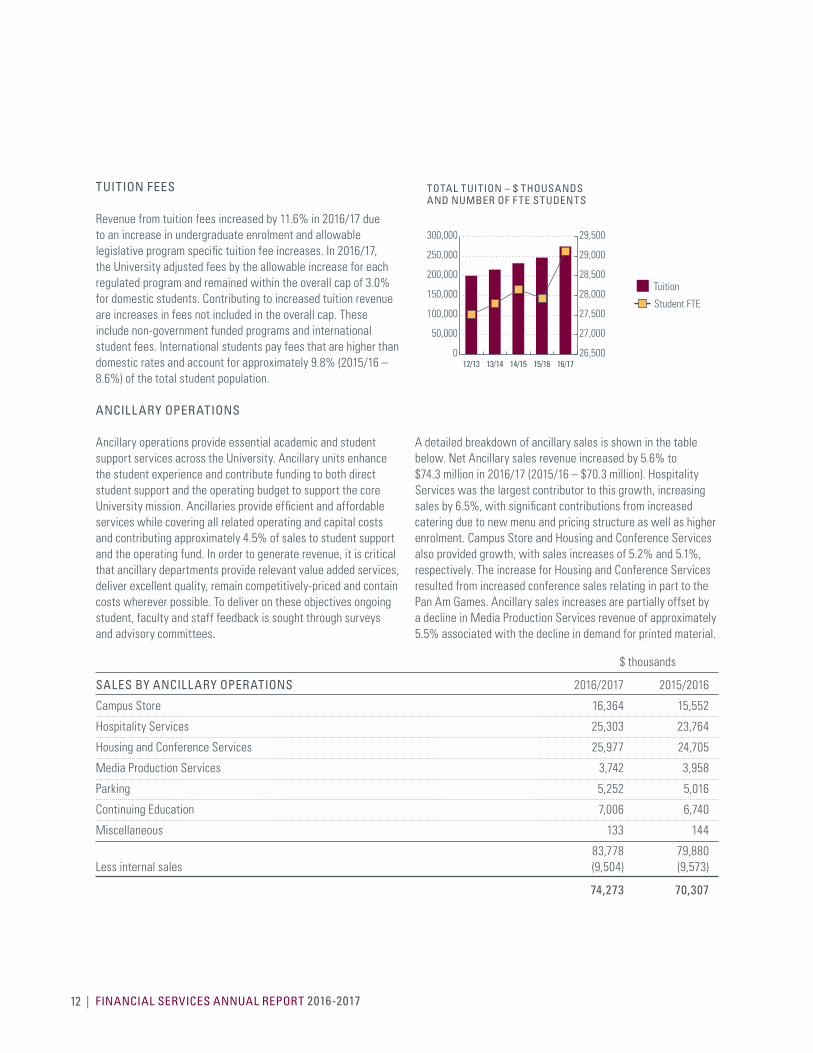
Revenue from tuition fees increased by 11.6% in 2016/17 due to an increase in undergraduate enrolment and allowable legislative program specific tuition fee increases. In 2016/17, the University adjusted fees by the allowable increase for each regulated program and remained within the overall cap of 3.0% for domestic students. Contributing to increased tuition revenue are increases in fees not included in the overall cap. These include non-government funded programs and international student fees. International students pay fees that are higher than domestic rates and account for approximately 9.8% (2015/16 – 8.6%) of the total student population.
ANCILLARY OPERATIONS
Ancillary operations provide essential academic and student support services across the University. Ancillary units enhance the student experience and contribute funding to both direct student support and the operating budget to support the core University mission. Ancillaries provide efficient and affordable services while covering all related operating and capital costs and contributing approximately 4.5% of sales to student support and the operating fund. In order to generate revenue, it is critical that ancillary departments provide relevant value added services, deliver excellent quality, remain competitively-priced and contain costs wherever possible. To deliver on these objectives ongoing student, faculty and staff feedback is sought through surveys and advisory committees.
A detailed breakdown of ancillary sales is shown in the table below. Net Ancillary sales revenue increased by 5.6% to $74.3 million in 2016/17 (2015/16 – $70.3 million). Hospitality Services was the largest contributor to this growth, increasing sales by 6.5%, with significant contributions from increased catering due to new menu and pricing structure as well as higher enrolment. Campus Store and Housing and Conference Services also provided growth, with sales increases of 5.2% and 5.1%, respectively. The increase for Housing and Conference Services resulted from increased conference sales relating in part to the Pan Am Games. Ancillary sales increases are partially offset by a decline in Media Production Services revenue of approximately 5.5% associated with the decline in demand for printed material.
0
50,000
100,000
150,000
200,000
250,000
300,000
Tuition
16/1715/1614/1513/1412/1326,500
27,000
27,500
28,000
28,500
29,000
29,500
Student FTE
TOTAL TUITION – $ THOUSANDS AND NUMBER OF F TE STUDENTS
$ thousands
SALES BY ANCILLARY OPERATIONS 2016/2017 2015/2016
Campus Store 16,364 15,552
Hospitality Services 25,303 23,764
Housing and Conference Services 25,977 24,705
Media Production Services 3,742 3,958
Parking 5,252 5,016
Continuing Education 7,006 6,740
Miscellaneous 133 144
83,778 79,880Less internal sales (9,504) (9,573)
74,273 70,307
www.mcmaster.ca/bms | 13
INVESTMENT INCOME
The long-term investment pool rate of return (after expenses) for 2016/17 was 16.0%, compared to -2.8% in 2015/16. While market volatility is still a key management concern, the diversification within the long-term Investment Pool helps protect capital in down markets. Investment returns and outlook are included in multi-year financial projections along with sensitivity analysis to highlight the significance of variances possible in investment income associated with market fluctuations. The endowment funds are invested applying an asset mix of 60.0% equities and 40.0% fixed income, real estate, and infrastructure. As at April 30, 2017, the endowment fund achieved a rate of return of 16.3%, which was above the benchmark return of 13.4%. Total investment income, summarized in the table below, includes both short-term and long-term investment earnings that are allocated between income in the Statement of Operations and as direct increases to endowment balances as preservation of capital adjustments in the Statement of Changes in Net Assets.
Investment returns on endowed funds are used in accordance with the purposes set out by donors or, where discretionary, by the Board of Governors. Annual endowment spending is targeted at a rate of 4.0% determined using a five-year average market rate of return, any returns in excess of spending and other expenses go toward capital preservation. In 2016/17 approximately $24.6 million (2015/16 – $18.7 million) of expenses were funded from the external endowment of which a significant portion is directed towards student scholarships, bursaries and funding of chairs and professorships.
$ thousands
INVESTMENT INCOME/(LOSS) 2016/2017 Actual 2015/2016 Actual
Recognized in income 98,432 12,855
Net posted directly to external endowments 44,799 (31,467)
Total earned (lost) 143,231 (18,612)

| FINANCIAL SERVICES ANNUAL REPORT 2016-201714
www.mcmaster.ca/bms | 15
Compensation and Benefits
McMaster University provides competitively benchmarked compensation and benefit plans for faculty and staff for both career and retirement phases of life. McMaster manages both current and future costs associated with total compensation plans to ensure a long-term sustainable financial environment. Salary and wage expenses are shown together in the Statement of Operations, with related employee benefit costs identified separately. The employee benefit expenses include statutory benefit costs, other current benefit costs, and accruals for pension and other non-pension benefits (primarily medical benefits and dental care) that are earned in relation to current year service. Additional information related to the current year expenses, pension and non-pension liabilities and unfunded deficits are included in this section.
EXPENSE
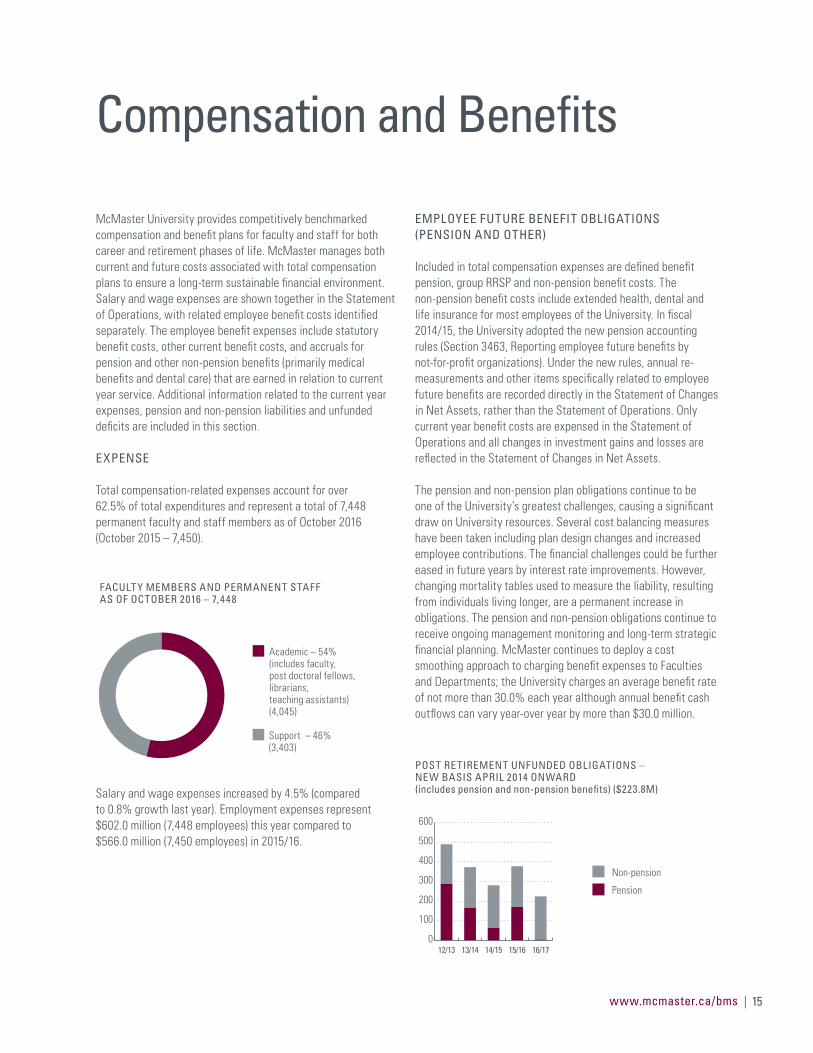
Total compensation-related expenses account for over 62.5% of total expenditures and represent a total of 7,448 permanent faculty and staff members as of October 2016 (October 2015 – 7,450).
Salary and wage expenses increased by 4.5% (compared to 0.8% growth last year). Employment expenses represent $602.0 million (7,448 employees) this year compared to $566.0 million (7,450 employees) in 2015/16.
EMPLOYEE FUTURE BENEFIT OBLIGATIONS (PENSION AND OTHER)
Included in total compensation expenses are defined benefit pension, group RRSP and non-pension benefit costs. The non-pension benefit costs include extended health, dental and life insurance for most employees of the University. In fiscal 2014/15, the University adopted the new pension accounting rules (Section 3463, Reporting employee future benefits by not-for-profit organizations). Under the new rules, annual re-measurements and other items specifically related to employee future benefits are recorded directly in the Statement of Changes in Net Assets, rather than the Statement of Operations. Only current year benefit costs are expensed in the Statement of Operations and all changes in investment gains and losses are reflected in the Statement of Changes in Net Assets.
The pension and non-pension plan obligations continue to be one of the University’s greatest challenges, causing a significant draw on University resources. Several cost balancing measures have been taken including plan design changes and increased employee contributions. The financial challenges could be further eased in future years by interest rate improvements. However, changing mortality tables used to measure the liability, resulting from individuals living longer, are a permanent increase in obligations. The pension and non-pension obligations continue to receive ongoing management monitoring and long-term strategic financial planning. McMaster continues to deploy a cost smoothing approach to charging benefit expenses to Faculties and Departments; the University charges an average benefit rate of not more than 30.0% each year although annual benefit cash outflows can vary year-over year by more than $30.0 million.
FACULT Y MEMBERS AND PERMANENT STAFF AS OF OCTOBER 2016 – 7,448
Academic – 54% (includes faculty, post doctoral fellows, librarians, teaching assistants) (4,045)
Support – 46% (3,403)
0
100
200
300
400
500
600
Non-pension
Pension
16/1715/1614/1513/1412/13
POST RETIREMENT UNFUNDED OBLIGATIONS – NEW BASIS APRIL 2014 ONWARD (includes pension and non-pension benefits) ($223.8M)
| FINANCIAL SERVICES ANNUAL REPORT 2016-201716
PENSION
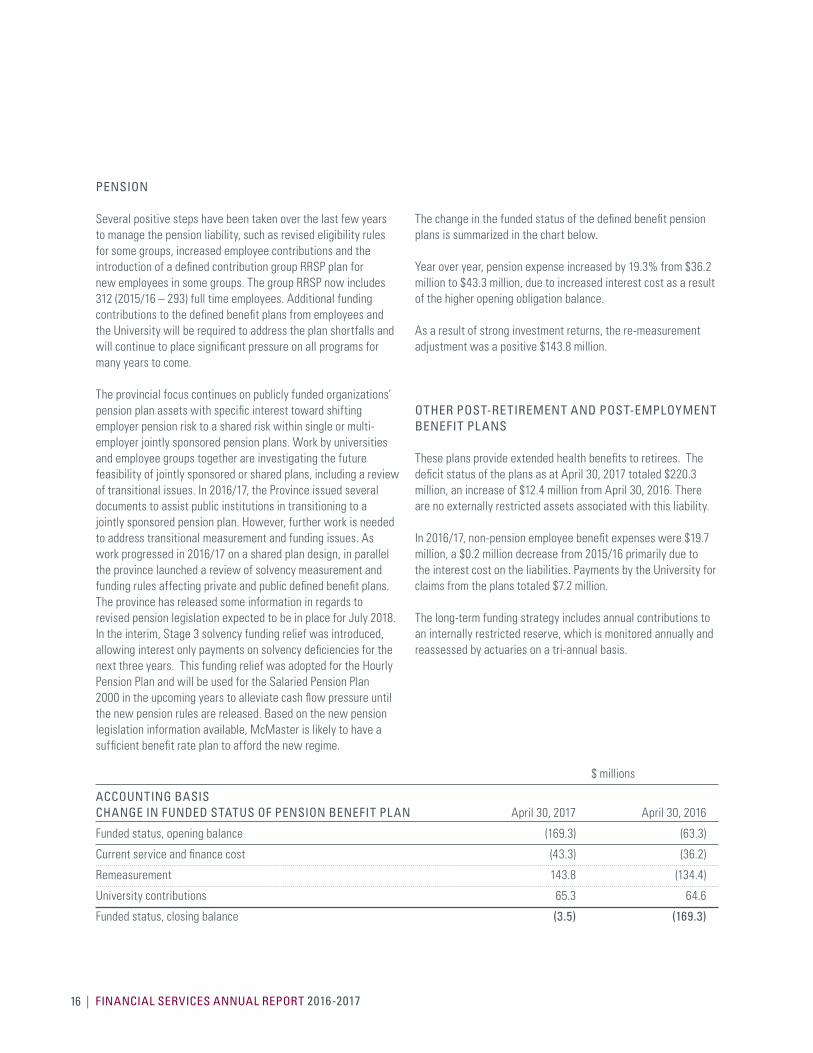
Several positive steps have been taken over the last few years to manage the pension liability, such as revised eligibility rules for some groups, increased employee contributions and the introduction of a defined contribution group RRSP plan for new employees in some groups. The group RRSP now includes 312 (2015/16 – 293) full time employees. Additional funding contributions to the defined benefit plans from employees and the University will be required to address the plan shortfalls and will continue to place significant pressure on all programs for many years to come.
The provincial focus continues on publicly funded organizations’ pension plan assets with specific interest toward shifting employer pension risk to a shared risk within single or multi-employer jointly sponsored pension plans. Work by universities and employee groups together are investigating the future feasibility of jointly sponsored or shared plans, including a review of transitional issues. In 2016/17, the Province issued several documents to assist public institutions in transitioning to a jointly sponsored pension plan. However, further work is needed to address transitional measurement and funding issues. As work progressed in 2016/17 on a shared plan design, in parallel the province launched a review of solvency measurement and funding rules affecting private and public defined benefit plans. The province has released some information in regards to revised pension legislation expected to be in place for July 2018. In the interim, Stage 3 solvency funding relief was introduced, allowing interest only payments on solvency deficiencies for the next three years. This funding relief was adopted for the Hourly Pension Plan and will be used for the Salaried Pension Plan 2000 in the upcoming years to alleviate cash flow pressure until the new pension rules are released. Based on the new pension legislation information available, McMaster is likely to have a sufficient benefit rate plan to afford the new regime.
The change in the funded status of the defined benefit pension plans is summarized in the chart below.
Year over year, pension expense increased by 19.3% from $36.2 million to $43.3 million, due to increased interest cost as a result of the higher opening obligation balance.
As a result of strong investment returns, the re-measurement adjustment was a positive $143.8 million.
OTHER POST-RETIREMENT AND POST-EMPLOYMENT BENEFIT PLANS
These plans provide extended health benefits to retirees. The deficit status of the plans as at April 30, 2017 totaled $220.3 million, an increase of $12.4 million from April 30, 2016. There are no externally restricted assets associated with this liability.
In 2016/17, non-pension employee benefit expenses were $19.7 million, a $0.2 million decrease from 2015/16 primarily due to the interest cost on the liabilities. Payments by the University for claims from the plans totaled $7.2 million.
The long-term funding strategy includes annual contributions to an internally restricted reserve, which is monitored annually and reassessed by actuaries on a tri-annual basis.
$ millions
ACCOUNTING BASIS CHANGE IN FUNDED STATUS OF PENSION BENEFIT PLAN April 30, 2017 April 30, 2016
Funded status, opening balance (169.3) (63.3)
Current service and finance cost (43.3) (36.2)
Remeasurement 143.8 (134.4)
University contributions 65.3 64.6
Funded status, closing balance (3.5) (169.3)

www.mcmaster.ca/bms | 17

| FINANCIAL SERVICES ANNUAL REPORT 2016-201718
www.mcmaster.ca/bms | 19
McMaster University is committed to technology transformation, building purpose-focused spaces, and renewing existing infrastructure to ensure its research focused student-centered identity is maintained in support of an environment of excellence.
The McMaster Campus Plan and annual Capital Plan provide a comprehensive framework guiding campus capital development. The University’s capital objectives are to preserve and enhance a high quality campus while meeting McMaster’s changing needs.
CAPITAL PROJECTS
The L.R. Wilson Hall project was completed in fiscal 2016/17 and opened in September 2016. This new building supports Liberal Arts and accommodates the Faculties of Humanities and Social Sciences. This LEED-certified building includes teaching and learning spaces, gardens and public gathering spaces. L.R. Wilson Hall also houses liberal arts research centres, such as the Wilson Institute for Canadian History and the Gilbrea Centre for Health and Aging, as well as McMaster’s Indigenous Studies program and Indigenous student support offices.
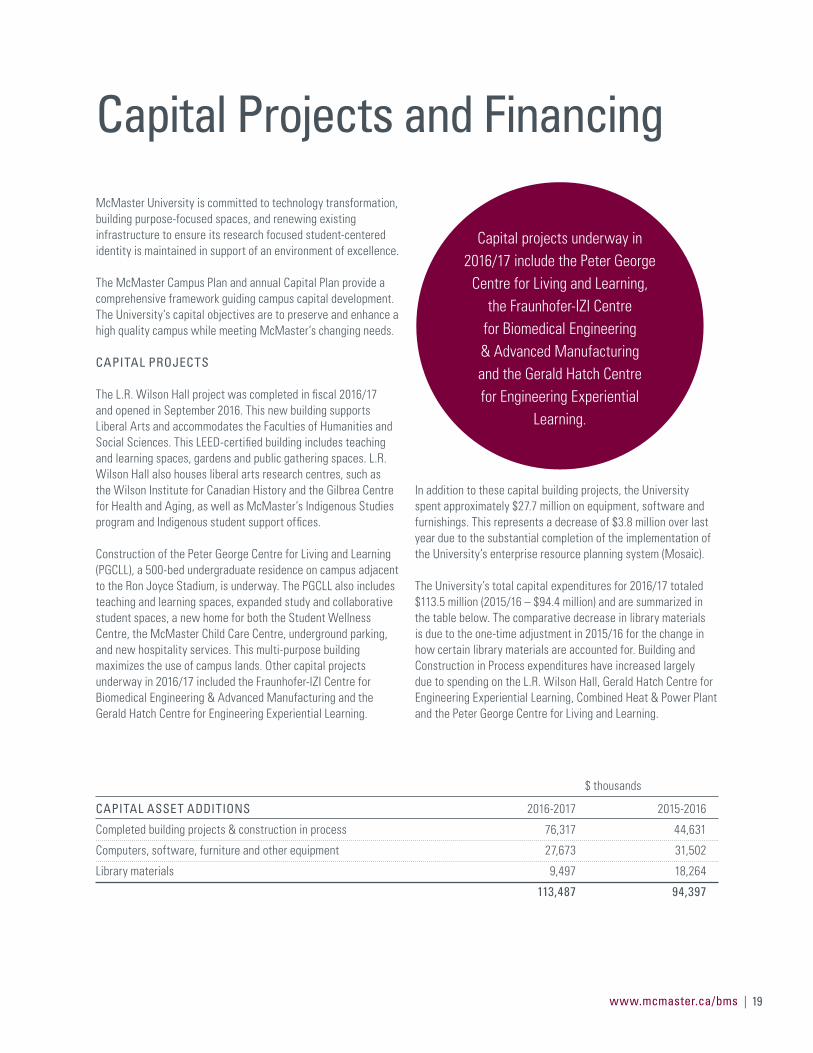
Construction of the Peter George Centre for Living and Learning (PGCLL), a 500-bed undergraduate residence on campus adjacent to the Ron Joyce Stadium, is underway. The PGCLL also includes teaching and learning spaces, expanded study and collaborative student spaces, a new home for both the Student Wellness Centre, the McMaster Child Care Centre, underground parking, and new hospitality services. This multi-purpose building maximizes the use of campus lands. Other capital projects underway in 2016/17 included the Fraunhofer-IZI Centre for Biomedical Engineering & Advanced Manufacturing and the Gerald Hatch Centre for Engineering Experiential Learning.
In addition to these capital building projects, the University spent approximately $27.7 million on equipment, software and furnishings. This represents a decrease of $3.8 million over last year due to the substantial completion of the implementation of the University’s enterprise resource planning system (Mosaic).
The University’s total capital expenditures for 2016/17 totaled $113.5 million (2015/16 – $94.4 million) and are summarized in the table below. The comparative decrease in library materials is due to the one-time adjustment in 2015/16 for the change in how certain library materials are accounted for. Building and Construction in Process expenditures have increased largely due to spending on the L.R. Wilson Hall, Gerald Hatch Centre for Engineering Experiential Learning, Combined Heat & Power Plant and the Peter George Centre for Living and Learning.
Capital Projects and Financing
$ thousands
CAPITAL ASSET ADDITIONS 2016-2017 2015-2016
Completed building projects & construction in process 76,317 44,631
Computers, software, furniture and other equipment 27,673 31,502
Library materials 9,497 18,264
113,487 94,397
Capital projects underway in 2016/17 include the Peter George
Centre for Living and Learning, the Fraunhofer-IZI Centre
for Biomedical Engineering & Advanced Manufacturing and the Gerald Hatch Centre for Engineering Experiential
Learning.
| FINANCIAL SERVICES ANNUAL REPORT 2016-201720
CAPITAL FINANCING
Building projects with long-term funding sources such as user fees, parking levies and future fundraising continued to be financed through internal central bank loans. In 2016/17, all scheduled loan repayments were received. The internal central bank capital loans decreased to $80.6 million in 2016/17 from $86.2 million last year. The loans have varying repayment terms and interest rates, which reflect the date of issue and the project income stream.
The University’s Debt Policy ratios provide a framework for monitoring the University’s ability to undertake additional external or internal debt to carry out strategic investments. In fiscal 2015/16, the University completed a 50-year debenture call for $120.0 million, which was fully subscribed at a coupon of 4.105%. The long-term bond issuance is supporting capital plans included in the multi-year projections, most notably the Peter George Centre for Living and Learning. A sinking fund was established in the year to provide for the debt retirement in 2065. The additional debt effectively reduced McMaster’s weighted average cost of capital by 1.0% from 6.75% to 5.75% with stabilization factored in.
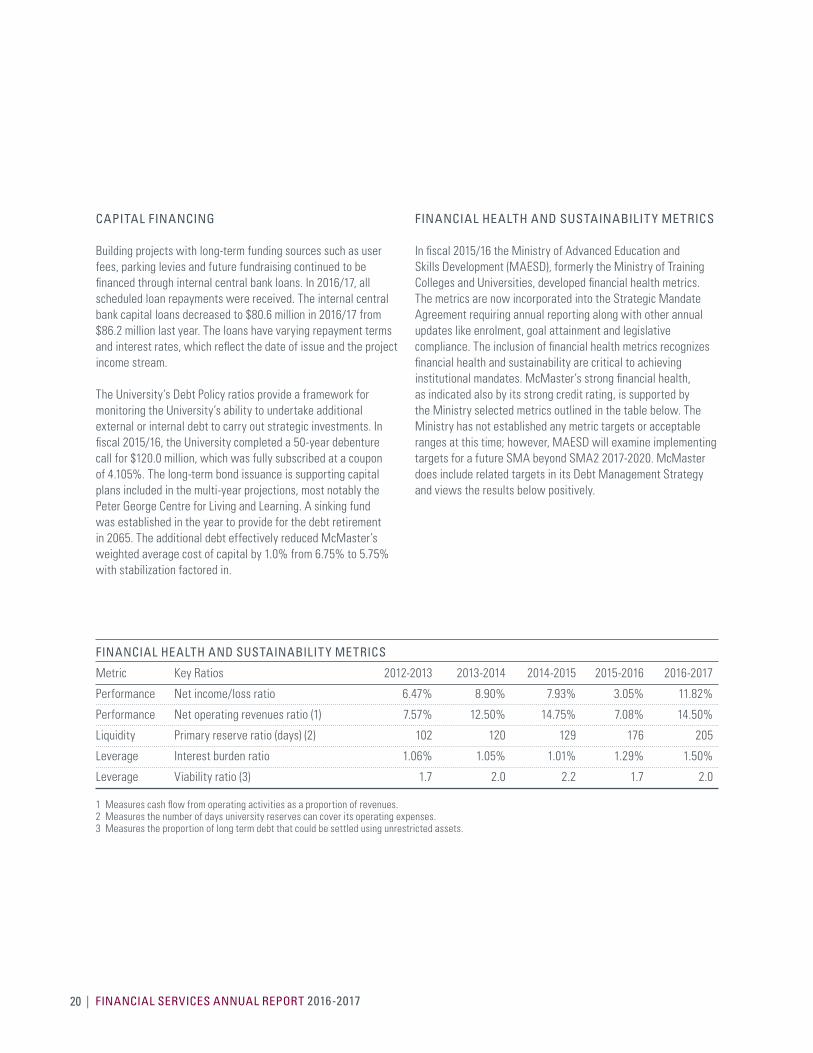
FINANCIAL HEALTH AND SUSTAINABILITY METRICS
In fiscal 2015/16 the Ministry of Advanced Education and Skills Development (MAESD), formerly the Ministry of Training Colleges and Universities, developed financial health metrics. The metrics are now incorporated into the Strategic Mandate Agreement requiring annual reporting along with other annual updates like enrolment, goal attainment and legislative compliance. The inclusion of financial health metrics recognizes financial health and sustainability are critical to achieving institutional mandates. McMaster’s strong financial health, as indicated also by its strong credit rating, is supported by the Ministry selected metrics outlined in the table below. The Ministry has not established any metric targets or acceptable ranges at this time; however, MAESD will examine implementing targets for a future SMA beyond SMA2 2017-2020. McMaster does include related targets in its Debt Management Strategy and views the results below positively.
FINANCIAL HEALTH AND SUSTAINABILITY METRICS
Metric Key Ratios 2012-2013 2013-2014 2014-2015 2015-2016 2016-2017
Performance Net income/loss ratio 6.47% 8.90% 7.93% 3.05% 11.82%
Performance Net operating revenues ratio (1) 7.57% 12.50% 14.75% 7.08% 14.50%
Liquidity Primary reserve ratio (days) (2) 102 120 129 176 205
Leverage Interest burden ratio 1.06% 1.05% 1.01% 1.29% 1.50%
Leverage Viability ratio (3) 1.7 2.0 2.2 1.7 2.0
1 Measures cash flow from operating activities as a proportion of revenues.2 Measures the number of days university reserves can cover its operating expenses.3 Measures the proportion of long term debt that could be settled using unrestricted assets.
www.mcmaster.ca/bms | 21
| FINANCIAL SERVICES ANNUAL REPORT 2016-201722
www.mcmaster.ca/bms | 23
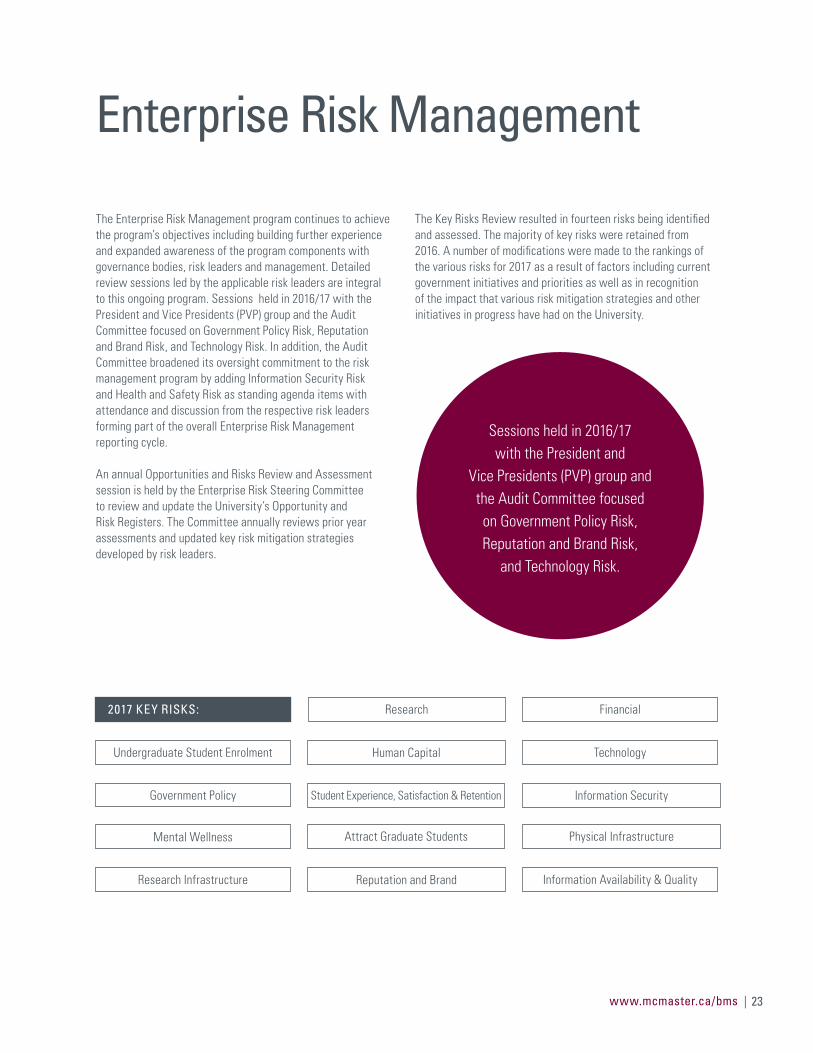
The Enterprise Risk Management program continues to achieve the program’s objectives including building further experience and expanded awareness of the program components with governance bodies, risk leaders and management. Detailed review sessions led by the applicable risk leaders are integral to this ongoing program. Sessions held in 2016/17 with the President and Vice Presidents (PVP) group and the Audit Committee focused on Government Policy Risk, Reputation and Brand Risk, and Technology Risk. In addition, the Audit Committee broadened its oversight commitment to the risk management program by adding Information Security Risk and Health and Safety Risk as standing agenda items with attendance and discussion from the respective risk leaders forming part of the overall Enterprise Risk Management reporting cycle.
An annual Opportunities and Risks Review and Assessment session is held by the Enterprise Risk Steering Committee to review and update the University’s Opportunity and Risk Registers. The Committee annually reviews prior year assessments and updated key risk mitigation strategies developed by risk leaders.
The Key Risks Review resulted in fourteen risks being identified and assessed. The majority of key risks were retained from 2016. A number of modifications were made to the rankings of the various risks for 2017 as a result of factors including current government initiatives and priorities as well as in recognition of the impact that various risk mitigation strategies and other initiatives in progress have had on the University.
Enterprise Risk Management
Undergraduate Student Enrolment
2017 KEY RISKS:
Physical InfrastructureAttract Graduate Students
Research Infrastructure
Technology
Government Policy
Reputation and Brand
Research
Mental Wellness
Financial
Human Capital
Information SecurityStudent Experience, Satisfaction & Retention
Information Availability & Quality
Sessions held in 2016/17 with the President and
Vice Presidents (PVP) group and the Audit Committee focused on Government Policy Risk, Reputation and Brand Risk,
and Technology Risk.
| FINANCIAL SERVICES ANNUAL REPORT 2016-201724
www.mcmaster.ca/bms | 25
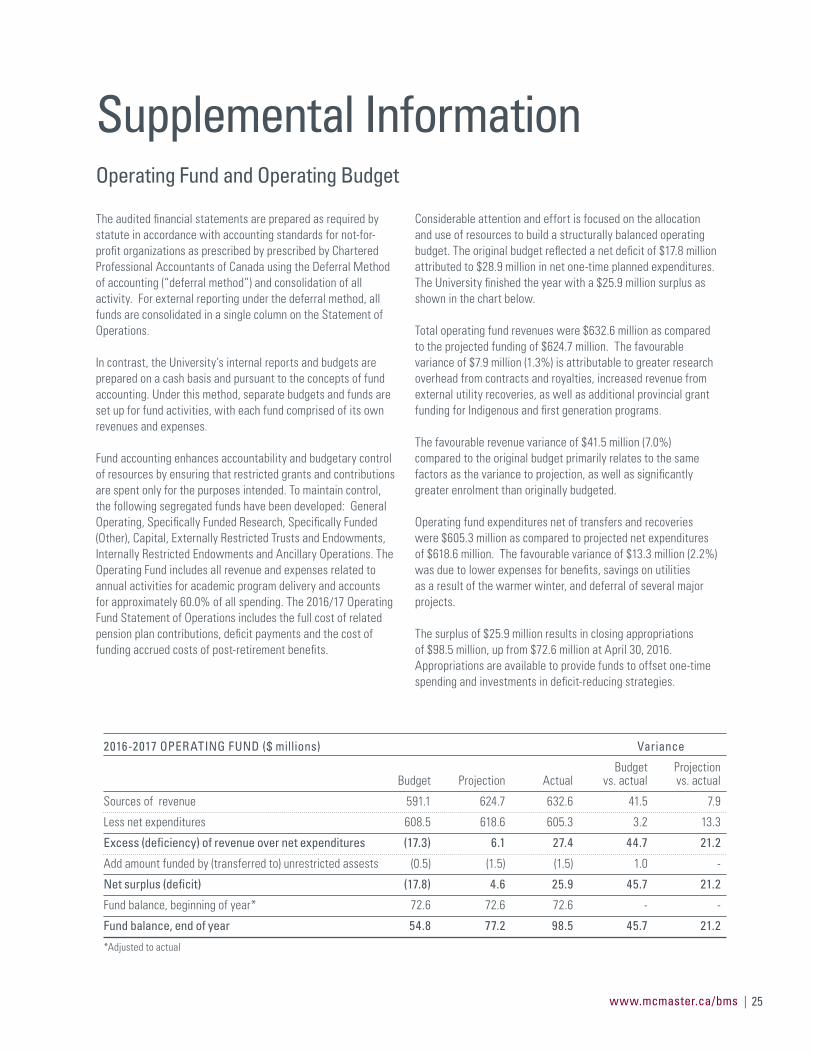
The audited financial statements are prepared as required by statute in accordance with accounting standards for not-for-profit organizations as prescribed by prescribed by Chartered Professional Accountants of Canada using the Deferral Method of accounting (“deferral method”) and consolidation of all activity. For external reporting under the deferral method, all funds are consolidated in a single column on the Statement of Operations.
In contrast, the University’s internal reports and budgets are prepared on a cash basis and pursuant to the concepts of fund accounting. Under this method, separate budgets and funds are set up for fund activities, with each fund comprised of its own revenues and expenses.
Fund accounting enhances accountability and budgetary control of resources by ensuring that restricted grants and contributions are spent only for the purposes intended. To maintain control, the following segregated funds have been developed: General Operating, Specifically Funded Research, Specifically Funded (Other), Capital, Externally Restricted Trusts and Endowments, Internally Restricted Endowments and Ancillary Operations. The Operating Fund includes all revenue and expenses related to annual activities for academic program delivery and accounts for approximately 60.0% of all spending. The 2016/17 Operating Fund Statement of Operations includes the full cost of related pension plan contributions, deficit payments and the cost of funding accrued costs of post-retirement benefits.
Considerable attention and effort is focused on the allocation and use of resources to build a structurally balanced operating budget. The original budget reflected a net deficit of $17.8 million attributed to $28.9 million in net one-time planned expenditures. The University finished the year with a $25.9 million surplus as shown in the chart below.
Total operating fund revenues were $632.6 million as compared to the projected funding of $624.7 million. The favourable variance of $7.9 million (1.3%) is attributable to greater research overhead from contracts and royalties, increased revenue from external utility recoveries, as well as additional provincial grant funding for Indigenous and first generation programs.
The favourable revenue variance of $41.5 million (7.0%) compared to the original budget primarily relates to the same factors as the variance to projection, as well as significantly greater enrolment than originally budgeted.
Operating fund expenditures net of transfers and recoveries were $605.3 million as compared to projected net expenditures of $618.6 million. The favourable variance of $13.3 million (2.2%) was due to lower expenses for benefits, savings on utilities as a result of the warmer winter, and deferral of several major projects.
The surplus of $25.9 million results in closing appropriations of $98.5 million, up from $72.6 million at April 30, 2016. Appropriations are available to provide funds to offset one-time spending and investments in deficit-reducing strategies.
Operating Fund and Operating Budget
Supplemental Information
2016-2017 OPERATING FUND ($ millions) Variance
Budget Projection Budget Projection Actual vs. actual vs. actual
Sources of revenue 591.1 624.7 632.6 41.5 7.9
Less net expenditures 608.5 618.6 605.3 3.2 13.3
Excess (deficiency) of revenue over net expenditures (17.3) 6.1 27.4 44.7 21.2
Add amount funded by (transferred to) unrestricted assests (0.5) (1.5) (1.5) 1.0 -
Net surplus (deficit) (17.8) 4.6 25.9 45.7 21.2
Fund balance, beginning of year* 72.6 72.6 72.6 - -
Fund balance, end of year 54.8 77.2 98.5 45.7 21.2
*Adjusted to actual

| FINANCIAL SERVICES ANNUAL REPORT 2016-201726
www.mcmaster.ca/bms | 27
STATEMENT OF MANAGEMENT RESPONSIBILITY ................... 28
INDEPENDENT AUDITORS’ REPORT ............... 29
FINANCIAL STATEMENTS ................................. 30 Statement of Financial Position Statement of Operations Statement of Changes in Net Assets Statement of Cash Flows Notes to Financial Statements
Financial Statements
Annual Financial Report
2016-2017
28
Statement of Management Responsibility
Management of the University is responsible for the preparation of the financial statements, the notes thereto and all otherfinancial information contained in this Annual Financial Report.
Management has prepared the financial statements in accordance with Canadian accounting standards for not-for-profitorganizations. Management believes the financial statements present fairly the University's financial position as at April 30,2017 and the results of its operations, changes in net assets and its cash flows for the year ended April 30, 2017. In order toachieve the objective of fair presentation in all material respects, the use of reasonable estimates and judgements wereemployed. Additionally, management has ensured that financial information presented elsewhere in this Annual FinancialReport has been prepared in a manner consistent with that in the financial statements.
In fulfilling its responsibilities and recognizing the limits inherent in all systems, management has developed and maintains asystem of internal controls designed to provide reasonable assurance that University assets are safeguarded from loss andthat the accounting records are a reliable basis for the preparation of financial statements.
Mercer (Canada) Limited has been retained by the University in order to provide an estimate of the University's current yearposition for pension and other employee future benefits. Management has provided the valuation actuary with the informationnecessary for the completion of the University's report and retains ultimate responsibility for the determination and estimationof the pension and other employee future benefits liabilities reported.
The Board of Governors carries out its responsibility for review of the financial statements and this Annual Financial Reportprincipally through the Planning and Resources Committee and its Audit Committee. No members of the Audit Committeeare officers or employees of the University. The Audit Committee meets regularly with management, as well as the internalauditors and the external auditors, to discuss the results of the audit examinations and financial reporting matters, and tosatisfy itself that each party is properly discharging its responsibilities. The auditors have full access to the Audit Committeewith and without the presence of management.
The financial statements for the year ended April 30, 2017 have been reported on by KPMG LLP, Chartered ProfessionalAccountants, the auditors appointed by the Board of Governors. The Independent Auditors' Report outlines the scope of theiraudit and their opinion on the presentation of the information included in the financial statements.
Vice-President, Administration President AVP (Administration) & CFOOctober 26, 2017
3
29
INDEPENDENT AUDITORS' REPORT
To the Board of Governors of McMaster University
We have audited the accompanying financial statements of McMaster University (the "University”), which comprise thestatements of financial position as at April 30, 2017, the statements of operations, changes in net assets, and cash flows for theyear then ended, and notes, comprising a summary of significant accounting policies and other explanatory information.
Management's Responsibility for the Financial Statements
Management is responsible for the preparation and fair presentation of these financial statements in accordance with Canadianaccounting standards for not-for-profit organizations, and for such internal control as management determines is necessary toenable the preparation of financial statements that are free from material misstatement, whether due to fraud or error.
Auditors' Responsibility
Our responsibility is to express an opinion on these financial statements based on our audit. We conducted our audit inaccordance with Canadian generally accepted auditing standards. Those standards require that we comply with ethicalrequirements and plan and perform an audit to obtain reasonable assurance about whether the financial statements are freefrom material misstatement.
An audit involves performing procedures to obtain audit evidence about the amounts and disclosures in the financial statements.The procedures selected depend on our judgment, including the assessment of the risks of material misstatement of the financialstatements, whether due to fraud or error. In making those risk assessments, we consider internal control relevant to theUniversity's preparation and fair presentation of the financial statements in order to design audit procedures that are appropriatein the circumstances, but not for the purpose of expressing an opinion on the effectiveness of the University's internal control. Anaudit also includes evaluating the appropriateness of accounting policies used and the reasonableness of accounting estimatesmade by management, as well as evaluating the overall presentation of the financial statements.
We believe that the audit evidence we have obtained is sufficient and appropriate to provide a basis for our audit opinion.
Opinion
In our opinion, the financial statements present fairly, in all material respects, the financial position of McMaster University as atApril 30, 2017 and the results of its operations and its cash flows for the year then ended in accordance with Canadianaccounting standards for not-for-profit organizations.
Chartered Professional Accountants, Licensed Public Accountants
Hamilton, CanadaOctober 26, 2017
4
30
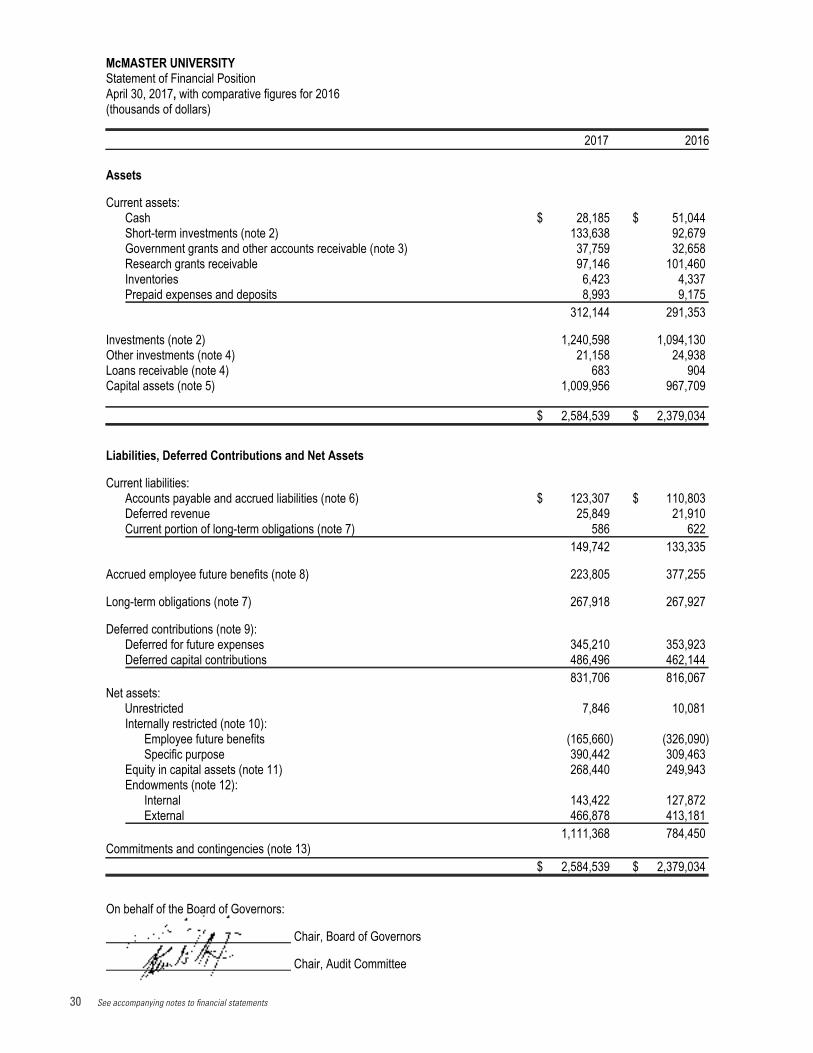
McMASTER UNIVERSITYStatement of Financial PositionApril 30, 2017, with comparative figures for 2016(thousands of dollars)
2017 2016
Assets
Current assets:Cash $ 28,185 $ 51,044Short-term investments (note 2) 133,638 92,679Government grants and other accounts receivable (note 3) 37,759 32,658Research grants receivable 97,146 101,460Inventories 6,423 4,337Prepaid expenses and deposits 8,993 9,175
312,144 291,353
Investments (note 2) 1,240,598 1,094,130Other investments (note 4) 21,158 24,938Loans receivable (note 4) 683 904Capital assets (note 5) 1,009,956 967,709
$ 2,584,539 $ 2,379,034
Liabilities, Deferred Contributions and Net Assets
Current liabilities:Accounts payable and accrued liabilities (note 6) $ 123,307 $ 110,803Deferred revenue 25,849 21,910Current portion of long-term obligations (note 7) 586 622
149,742 133,335
Accrued employee future benefits (note 8) 223,805 377,255
Long-term obligations (note 7) 267,918 267,927
Deferred contributions (note 9):Deferred for future expenses 345,210 353,923Deferred capital contributions 486,496 462,144
831,706 816,067Net assets:
Unrestricted 7,846 10,081Internally restricted (note 10):
Employee future benefits (165,660) (326,090)Specific purpose 390,442 309,463
Equity in capital assets (note 11) 268,440 249,943Endowments (note 12):
Internal 143,422 127,872External 466,878 413,181
1,111,368 784,450Commitments and contingencies (note 13)
$ 2,584,539 $ 2,379,034
On behalf of the Board of Governors:
Chair, Board of Governors
Chair, Audit Committee
See accompanying notes to financial statements
5
See accompanying notes to financial statements
31
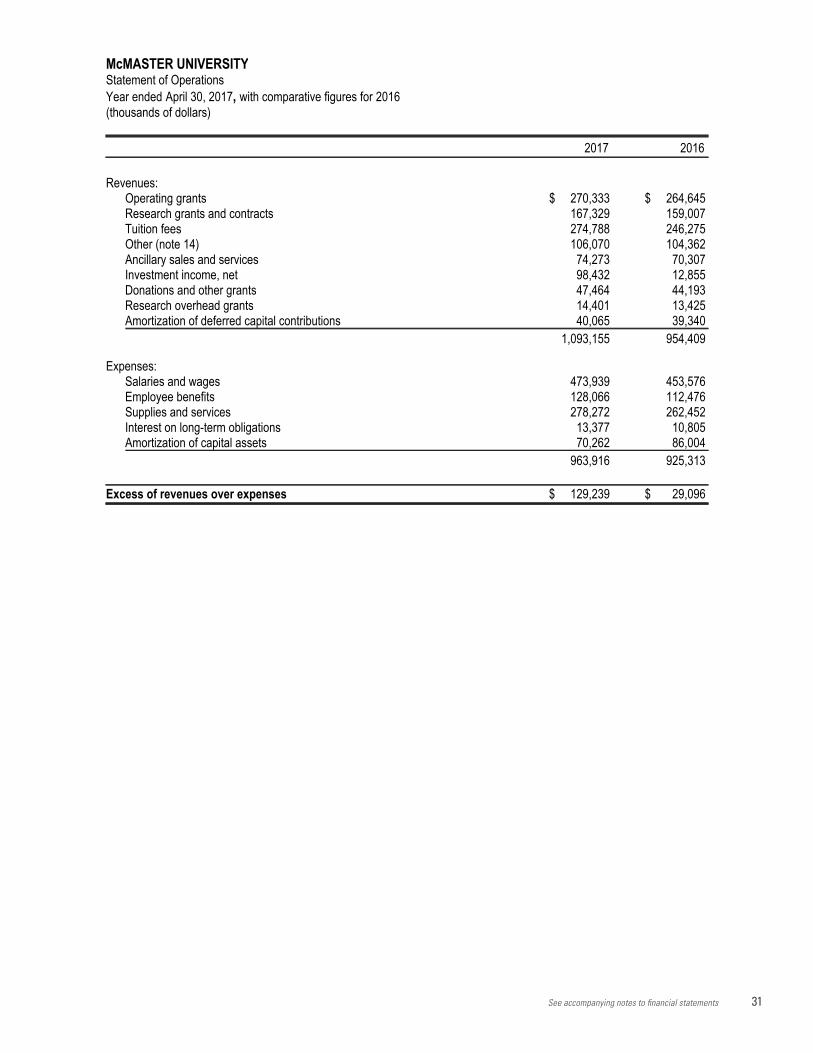
McMASTER UNIVERSITYStatement of Operations
Year ended April 30, 2017, with comparative figures for 2016(thousands of dollars)
2017 2016
Revenues:Operating grants $ 270,333 $ 264,645Research grants and contracts 167,329 159,007Tuition fees 274,788 246,275Other (note 14) 106,070 104,362Ancillary sales and services 74,273 70,307Investment income, net 98,432 12,855Donations and other grants 47,464 44,193Research overhead grants 14,401 13,425Amortization of deferred capital contributions 40,065 39,340
1,093,155 954,409
Expenses:Salaries and wages 473,939 453,576Employee benefits 128,066 112,476Supplies and services 278,272 262,452Interest on long-term obligations 13,377 10,805Amortization of capital assets 70,262 86,004
963,916 925,313
Excess of revenues over expenses $ 129,239 $ 29,096
See accompanying notes to financial statements
6
See accompanying notes to financial statements
32
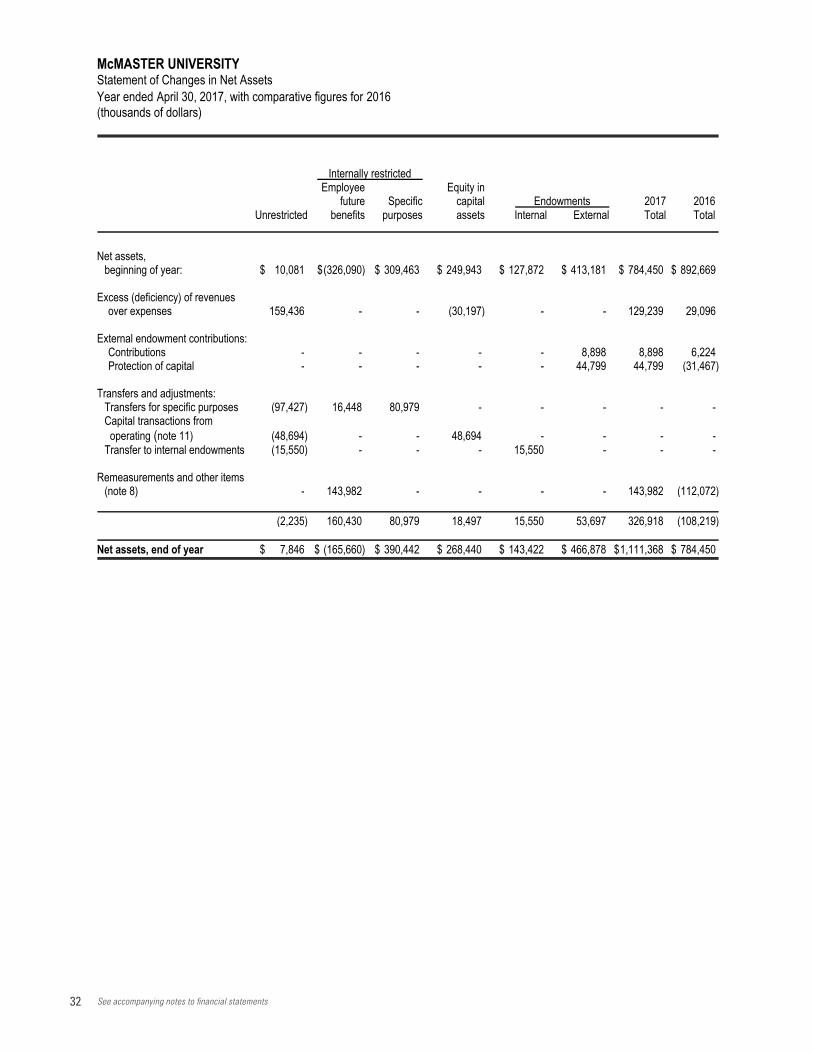
McMASTER UNIVERSITYStatement of Changes in Net Assets
Year ended April 30, 2017, with comparative figures for 2016(thousands of dollars)
Internally restrictedEmployee Equity in
future Specific capital Endowments 2017 2016 Unrestricted benefits purposes assets Internal External Total Total
Net assets, beginning of year: $ 10,081 $(326,090) $ 309,463 $ 249,943 $ 127,872 $ 413,181 $ 784,450 $ 892,669
Excess (deficiency) of revenuesover expenses 159,436 - - (30,197) - - 129,239 29,096
External endowment contributions:Contributions - - - - - 8,898 8,898 6,224Protection of capital - - - - - 44,799 44,799 (31,467)
Transfers and adjustments:Transfers for specific purposes (97,427) 16,448 80,979 - - - - -Capital transactions from
operating (note 11) (48,694) - - 48,694 - - - -Transfer to internal endowments (15,550) - - - 15,550 - - -
Remeasurements and other items(note 8) - 143,982 - - - - 143,982 (112,072)
(2,235) 160,430 80,979 18,497 15,550 53,697 326,918 (108,219)
Net assets, end of year $ 7,846 $ (165,660) $ 390,442 $ 268,440 $ 143,422 $ 466,878 $1,111,368 $ 784,450
See accompanying notes to financial statements
7
See accompanying notes to financial statements
33
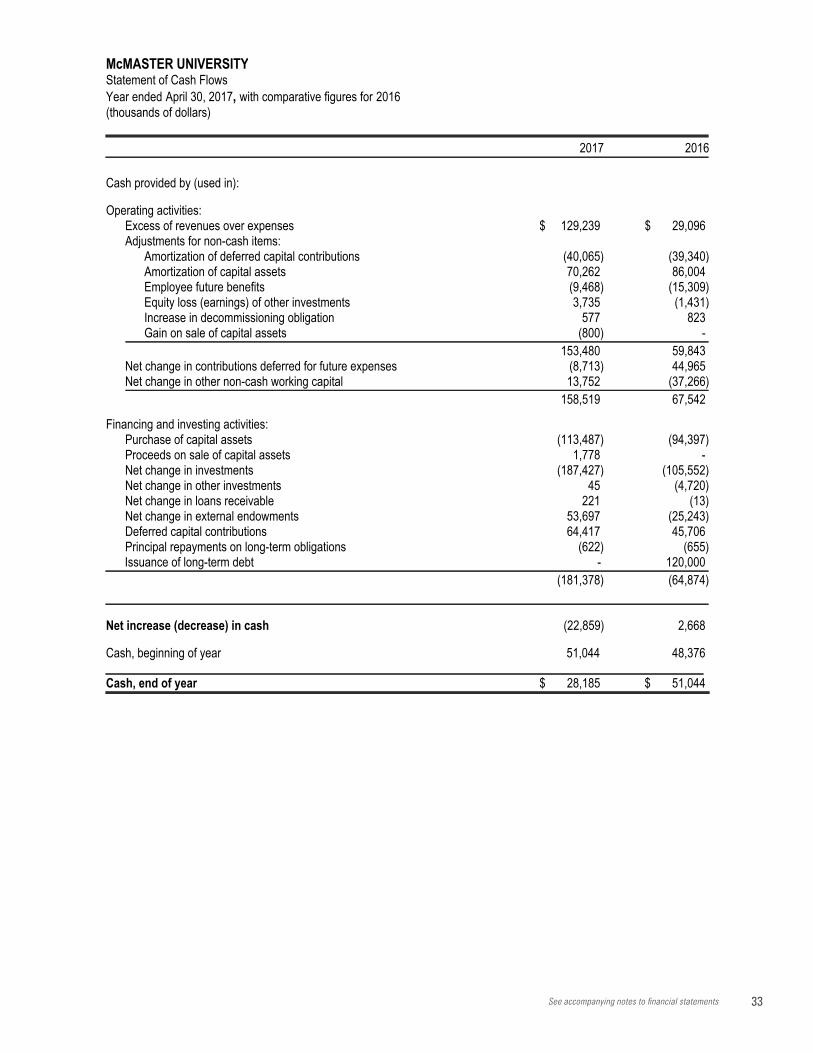
McMASTER UNIVERSITYStatement of Cash Flows
Year ended April 30, 2017, with comparative figures for 2016(thousands of dollars)
2017 2016
Cash provided by (used in):
Operating activities:Excess of revenues over expenses $ 129,239 $ 29,096Adjustments for non-cash items:
Amortization of deferred capital contributions (40,065) (39,340)Amortization of capital assets 70,262 86,004Employee future benefits (9,468) (15,309)Equity loss (earnings) of other investments 3,735 (1,431)Increase in decommissioning obligation 577 823Gain on sale of capital assets (800) -
153,480 59,843Net change in contributions deferred for future expenses (8,713) 44,965Net change in other non-cash working capital 13,752 (37,266)
158,519 67,542
Financing and investing activities:Purchase of capital assets (113,487) (94,397)Proceeds on sale of capital assets 1,778 -Net change in investments (187,427) (105,552)Net change in other investments 45 (4,720)Net change in loans receivable 221 (13)Net change in external endowments 53,697 (25,243)Deferred capital contributions 64,417 45,706Principal repayments on long-term obligations (622) (655)Issuance of long-term debt - 120,000
(181,378) (64,874)
Net increase (decrease) in cash (22,859) 2,668
Cash, beginning of year 51,044 48,376
Cash, end of year $ 28,185 $ 51,044
See accompanying notes to financial statements
8
See accompanying notes to financial statements
34
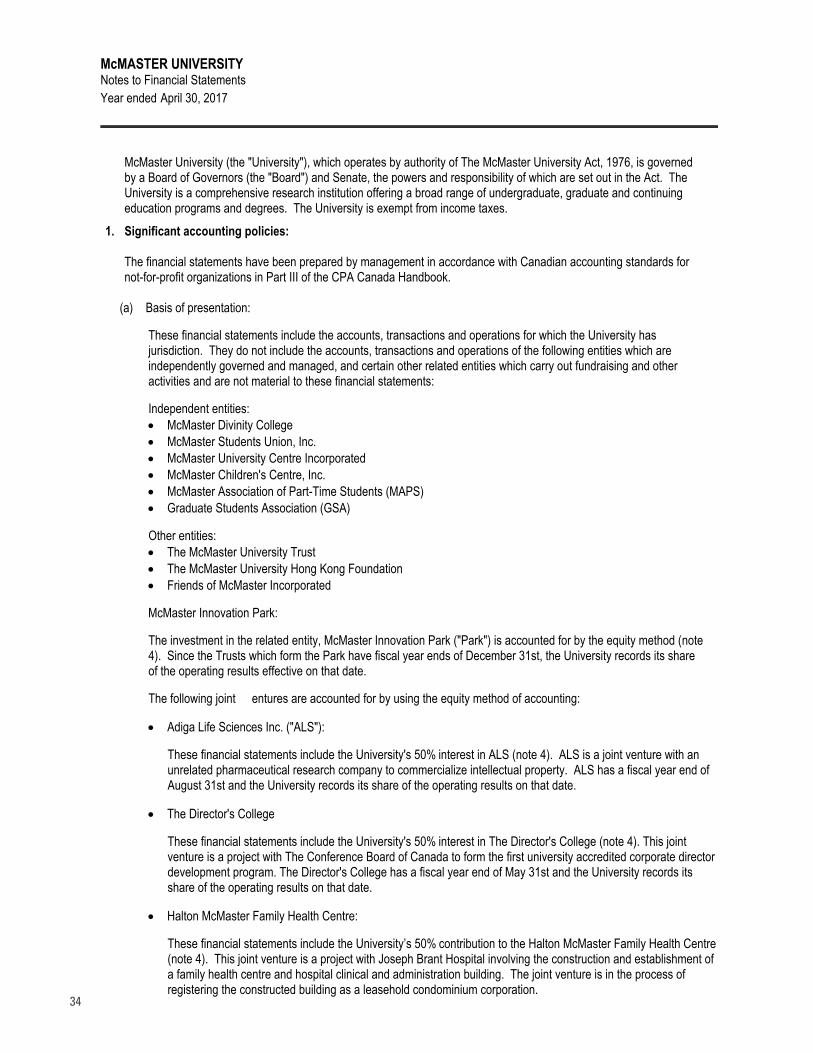
McMASTER UNIVERSITYNotes to Financial Statements
Year ended April 30, 2017
McMaster University (the "University"), which operates by authority of The McMaster University Act, 1976, is governedby a Board of Governors (the "Board") and Senate, the powers and responsibility of which are set out in the Act. TheUniversity is a comprehensive research institution offering a broad range of undergraduate, graduate and continuingeducation programs and degrees. The University is exempt from income taxes.
1. Significant accounting policies:
The financial statements have been prepared by management in accordance with Canadian accounting standards fornot-for-profit organizations in Part III of the CPA Canada Handbook.
(a) Basis of presentation:
These financial statements include the accounts, transactions and operations for which the University hasjurisdiction. They do not include the accounts, transactions and operations of the following entities which areindependently governed and managed, and certain other related entities which carry out fundraising and otheractivities and are not material to these financial statements:
Independent entities: McMaster Divinity College
McMaster Students Union, Inc.
McMaster University Centre Incorporated
McMaster Children's Centre, Inc.
McMaster Association of Part-Time Students (MAPS)
Graduate Students Association (GSA)
Other entities: The McMaster University Trust
The McMaster University Hong Kong Foundation
Friends of McMaster Incorporated
McMaster Innovation Park:
The investment in the related entity, McMaster Innovation Park ("Park") is accounted for by the equity method (note4). Since the Trusts which form the Park have fiscal year ends of December 31st, the University records its shareof the operating results effective on that date.
The following joint ventures are accounted for by using the equity method of accounting:
Adiga Life Sciences Inc. ("ALS"):
These financial statements include the University's 50% interest in ALS (note 4). ALS is a joint venture with anunrelated pharmaceutical research company to commercialize intellectual property. ALS has a fiscal year end ofAugust 31st and the University records its share of the operating results on that date.
The Director's College
These financial statements include the University's 50% interest in The Director's College (note 4). This jointventure is a project with The Conference Board of Canada to form the first university accredited corporate directordevelopment program. The Director's College has a fiscal year end of May 31st and the University records itsshare of the operating results on that date.
Halton McMaster Family Health Centre:
These financial statements include the University’s 50% contribution to the Halton McMaster Family Health Centre(note 4). This joint venture is a project with Joseph Brant Hospital involving the construction and establishment ofa family health centre and hospital clinical and administration building. The joint venture is in the process ofregistering the constructed building as a leasehold condominium corporation.
9
35
McMASTER UNIVERSITYNotes to Financial Statements
Year ended April 30, 2017
1. Significant accounting policies (continued):
(a) Basis of presentation (continued):
OSCAR EMR:
OSCAR EMR ("OSCAR") is a not-for-profit technology/software company incorporated under the OntarioCorporations Act, controlled by McMaster University. OSCAR has a fiscal year end of December 31st. Financialinformation is disclosed in Note 4. OSCAR has not been consolidated in the University's financial statements.
(b) Revenue recognition:
The University follows the deferral method of accounting for contributions which include donations and governmentgrants. The principles under this method are summarized as follows:
Unrestricted contributions are recognized as revenue when received or receivable if the amount to be received
can be reasonably estimated and collection is reasonably assured.
Contributions externally restricted for purposes other than endowment and capital assets are deferred and
recognized as revenue in the year in which the related expenses are recognized.
Contributions externally restricted for capital asset purchases are deferred and amortized to operations on the
same basis as the related capital asset.
External endowment contributions and income preserved under the endowment capital protection policy (note
1(m)) are recognized as a direct increase in endowment net assets. Income earned from the investment
thereof, to the extent it is allocated, is recorded as deferred contributions and recorded as revenue in the
periods in which the related expenses are incurred.
Tuition fees which relate to academic terms or parts thereof occurring after April 30th are recorded as deferredrevenue. Gifts-in-kind are recorded at their fair market value on receipt, or at nominal value when fair market valuecannot be reasonably determined. Pledges from fundraising and other donations are recorded in the period inwhich they are collected. Ancillary sales and services revenue is recognized at point of sale or when the servicehas been provided.
(c) Financial instruments:
Financial instruments are recorded at fair value on initial recognition. Freestanding derivative instruments that are notin a qualifying hedging relationship and equity instruments that are quoted in an active market are subsequentlymeasured at fair value. All other financial instruments are subsequently recorded at cost or amortized cost, unlessmanagement has elected to carry the instruments at fair value. The University has elected to carry investments inequity instruments, fixed income and other securities at fair value.
Transaction costs incurred on the acquisition of financial instruments measured subsequently at fair value areexpensed as incurred. All other financial instruments are adjusted by transaction costs incurred on acquisition andfinancing costs, which are amortized using the straight-line method.
Financial assets are assessed for impairment on an annual basis at the end of the fiscal year if there are indicators ofimpairment. If there is an indicator of impairment, the University determines if there is a significant adverse change inthe expected amount or timing of future cash flows from the financial asset. If there is a significant adverse change inthe expected cash flows, the carrying value of the financial asset is reduced to the highest of the present value of theexpected cash flows, the amount that could be realized from selling the financial asset or the amount the Universityexpects to realize by exercising its right to any collateral. If events and circumstances reverse in a future period, animpairment loss will be reversed to the extent of the improvement, not exceeding the initial impairment charge.
10
36
McMASTER UNIVERSITYNotes to Financial Statements
Year ended April 30, 2017
1. Significant accounting policies (continued):
(d) Derivative financial instruments:
The University is party to an interest rate swap agreement which is used to manage the exposure to fluctuations ininterest rates. The University uses the accrual basis of accounting for hedges. Gains or losses realized on thesettlement of the hedging item are deferred until the settlement of the hedged item.
At the inception of the hedging relationship, the University designates that hedge accounting will be applied. TheUniversity formally documents the hedging relationship between the hedging instruments and hedged item. At theinception of the hedge and throughout its term, the terms of the hedging item and hedged item are the same.
Hedge accounting is used only when the notional amount of the swap matches the principal amount of the hedgeditem, the fair value of the swap at the inception is nil, the fixed rate is the same throughout the swap and the variablerate is based on the same index and includes the same or no adjustment and the debt instrument cannot be settledbefore maturity and the swap matures within two weeks of the maturity date of the debt.
(e) Investments:
Short-term investments are investments with a remaining term to maturity of one year or less and are intended tobe converted to cash within one year. Short-term investments recorded at cost plus accrued income whichtogether approximates fair value. Short-term investments includes cash and short-term investments held withinpooled fund investments.
Long-term investments are carried at fair values. Changes in fair values are included in investment income.
Externally restricted investment income to the extent it is allocated is included with deferred contributions andrecognized as revenue when the related expenses are incurred.
Unrestricted investment income is recognized as revenue during the period in which it is earned. Investment incomefrom internal endowments is recorded as unrestricted revenue and transferred to internal endowments.
(f) Inventories:
Bookstore and nuclear reactor inventories are recorded at the lower of cost and net realizable value. Otherinventories are recorded at cost which is a reasonable estimate of net realizable value.
(g) Capital assets:
Capital assets are recorded at cost, or if donated, at fair value on the date of receipt. Amortization is recorded onthe straight-line basis at the following annual rates:
Buildings 2.5% to 10%Decommissioning retirement costs 4%Site improvements 5%Library materials 20%Computing systems 5% to 10%Equipment, furnishings and vehicles 20%Computing equipment 33.3%Leasehold improvements term of lease
Capital assets in progress are carried at cost, with no amortization recorded until such time as the assets areavailable for their intended use.
(h) Collections and works of art:
The McMaster Museum of Art has significant collections of works of art and coins. Donations of works of artamounted to $494,000 (2016 - $383,000) and are recorded in operations in the year of acquisition.
11
37
McMASTER UNIVERSITYNotes to Financial Statements
Year ended April 30, 2017
1. Significant accounting policies (continued):
(i) Contributed services:
The University acknowledges the receipt of donated services. Because of the difficulty of determining their fairvalue, donated services are not recognized in the financial statements.
(j) Ancillary enterprises:
Ancillary enterprises are self-sustaining operations which fund their own replacements and renovations ofequipment and facilities. Substantially all of the net operating results are transferred annually from unrestricted netassets to specific purpose net assets.
(k) Employee future benefits:
The University maintains defined benefit registered and non-registered pension plans, a retirement incentiveprogram and group registered retirement savings plans. Non-pension post-retirement and post-employmentbenefits plans are also provided. Financial information is disclosed in Note 8.
The University accrues its obligations for the defined benefit plans as the employees render the services
necessary to earn the pension benefits. The current service cost and the finance cost for the year are charged
to excess of revenues over expenses. The actuarial determination of the accrued benefit obligations for
funded defined benefit plans uses the funding valuation method. This cost reflects management's estimates of
investment yields, salary escalation, health care trend rates and other factors.
The University has elected to accrue its obligations and related costs for unfunded plans on a basis consistent
with funded plans.
Remeasurement and other items are recognized as a direct increase (decrease) to net assets and are not
reclassified to the statement of operations in subsequent periods. Remeasurement and other items comprise
the aggregate of: the difference between the actual return on plan assets and the return calculated using the
discount rate used to determine the defined benefit obligation; the actuarial gains and losses; the effect of any
valuation allowance in the case of a net defined benefit asset; past service costs; and any gains and losses
arising from settlements and curtailments.
The University also makes regular contributions to its Group Registered Retirement Savings Plan ("RRSP"),administered by a third party, on behalf of each eligible employee. Group RRSP contributions are charged tooperations in the year made.
(l) Net assets:
Net assets are classified as follows:
Unrestricted: operating funds available without specific restrictions.
Internally restricted:
Employee future benefits: unfunded portion of pension and other non-pension retirement and post-
employment benefits, net of funds set aside to meet estimated future obligations.
Specific purpose: as approved by the Board, unexpended departmental budgets carried forward for
subsequent expenditures and other portions of net assets reserved for specific purposes.
Equity in capital assets: funds invested in capital assets, exclusive of capital assets financed through long-termobligations or deferred capital contributions.
Internal endowments: unrestricted contributions including unspent investment income which have beenrestricted by action of the Board.
External endowments: external contributions, the principal of which is non-expendable pursuant to therestrictions by the donor, and income retained under the endowment capital protection policy.
12
38
McMASTER UNIVERSITYNotes to Financial Statements
Year ended April 30, 2017
1. Significant accounting policies (continued):
(m) Endowment capital protection policy:
In order to protect the capital value of endowment investments, an endowment capital protection policy limits theamount of investment income allocated for spending to 4% and requires the reinvestment of excess income earned(interest, dividends, realized and unrealized capital gains, net of expenses).
Should endowment spending commitments exceed allocated income, amounts will be drawn from accumulated netinvestment income balances to fund deficiencies.
For endowments without sufficient accumulated investment income, temporary encroachment on capital is permitted.The encroached amounts will be recovered from future investment returns.
(n) Decommissioning obligation:
The fair value of a future asset retirement obligation is recognized when a legal obligation for the retirement oftangible long-lived assets is incurred and a reasonable estimate thereof can be determined. Concurrently, theassociated decommissioning costs are capitalized as a part of the carrying amount of the asset and amortized overits remaining useful life. The liability and the related asset may be adjusted periodically due to changes inestimates until settlement of the obligation.
(o) Foreign currency translation:
The University accounts for transactions in foreign currencies at the exchange rates in effect at the time of thetransactions. At year end, monetary assets and liabilities in foreign currencies are translated at year end exchangerates. Foreign exchange gains and losses on investments have been included in investment income.
(p) Use of estimates:
The preparation of the financial statements requires management to make estimates and assumptions that affectthe reported amounts of assets and liabilities and disclosure of contingent assets and liabilities at the date of thefinancial statements and the reported amounts of revenues and expenses during the year. Significant itemssubject to the use of management estimates and assumptions include the valuation of financial instruments, thecarrying amount of capital assets, the valuation allowance for receivables, the valuation of pension and otheremployee future benefits, provisions for contingencies, and the decommissioning obligation. Actual results coulddiffer from those estimates.
(q) Change in accounting policy:
During the year, management reviewed the accounting policy for investments and changed it to provide morerelevant information. Investments with remaining term to maturity of 1 year or less and cash and short-terminvestments held within pooled funds are now classified as short-term investments (Note 1(e)). The previousaccounting policy included investments with a term to maturity of 90 days or less on acquisition in cash andequivalents. The prior year was adjusted to reflect this change in policy. As a result, for the year ended April 30th,2016, the classification of short-term investments, totaling $92,679,000, was added to the statement of financialposition. This classification was offset by a decrease in investments of $54,551,000 and a decrease in cash andequivalents of $38,128,000.
13
39
McMASTER UNIVERSITYNotes to Financial Statements
Year ended April 30, 2017
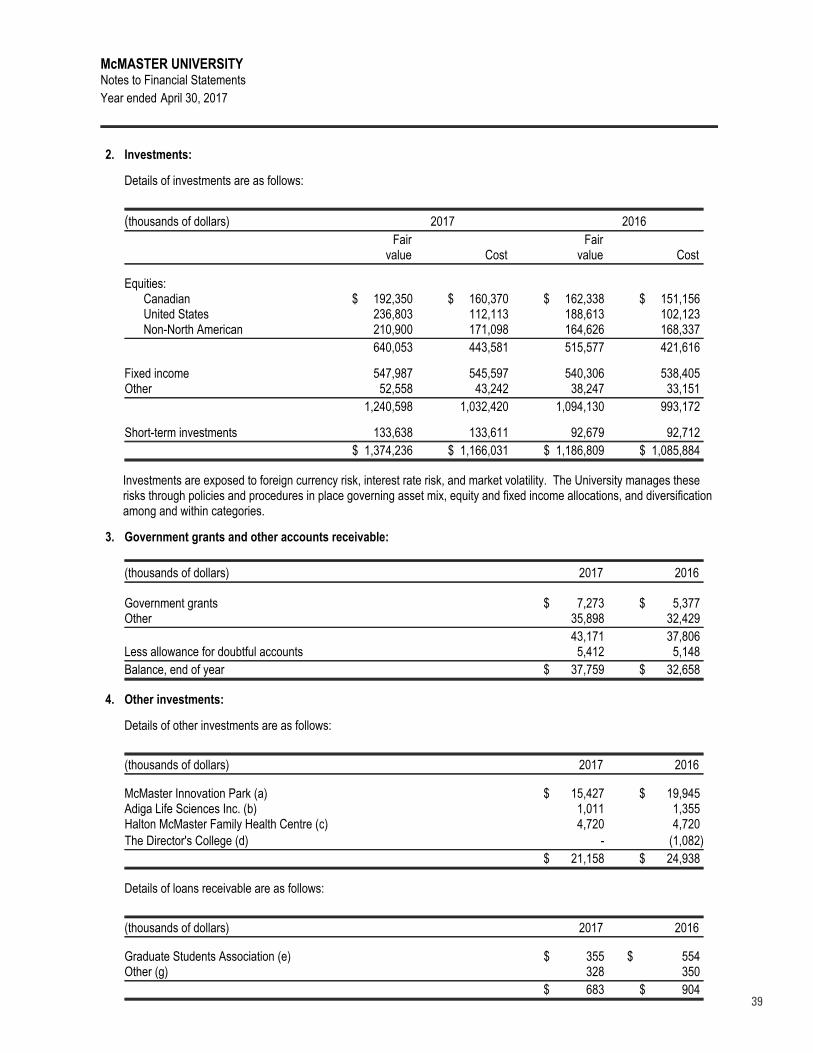
2. Investments:
Details of investments are as follows:
(thousands of dollars) 2017 2016
Fair Fairvalue Cost value Cost
Equities:Canadian $ 192,350 $ 160,370 $ 162,338 $ 151,156United States 236,803 112,113 188,613 102,123Non-North American 210,900 171,098 164,626 168,337
640,053 443,581 515,577 421,616
Fixed income 547,987 545,597 540,306 538,405Other 52,558 43,242 38,247 33,151
1,240,598 1,032,420 1,094,130 993,172
Short-term investments 133,638 133,611 92,679 92,712
$ 1,374,236 $ 1,166,031 $ 1,186,809 $ 1,085,884
Investments are exposed to foreign currency risk, interest rate risk, and market volatility. The University manages theserisks through policies and procedures in place governing asset mix, equity and fixed income allocations, and diversificationamong and within categories.
3. Government grants and other accounts receivable:
(thousands of dollars) 2017 2016
Government grants $ 7,273 $ 5,377Other 35,898 32,429
43,171 37,806Less allowance for doubtful accounts 5,412 5,148
Balance, end of year $ 37,759 $ 32,658
4. Other investments:
Details of other investments are as follows:
(thousands of dollars) 2017 2016
McMaster Innovation Park (a) $ 15,427 $ 19,945Adiga Life Sciences Inc. (b) 1,011 1,355Halton McMaster Family Health Centre (c) 4,720 4,720
The Director's College (d) - (1,082)
$ 21,158 $ 24,938
Details of loans receivable are as follows:
(thousands of dollars) 2017 2016
Graduate Students Association (e) $ 355 $ 554Other (g) 328 350
$ 683 $ 904
14
40
McMASTER UNIVERSITYNotes to Financial Statements
Year ended April 30, 2017
4. Other investments (continued):
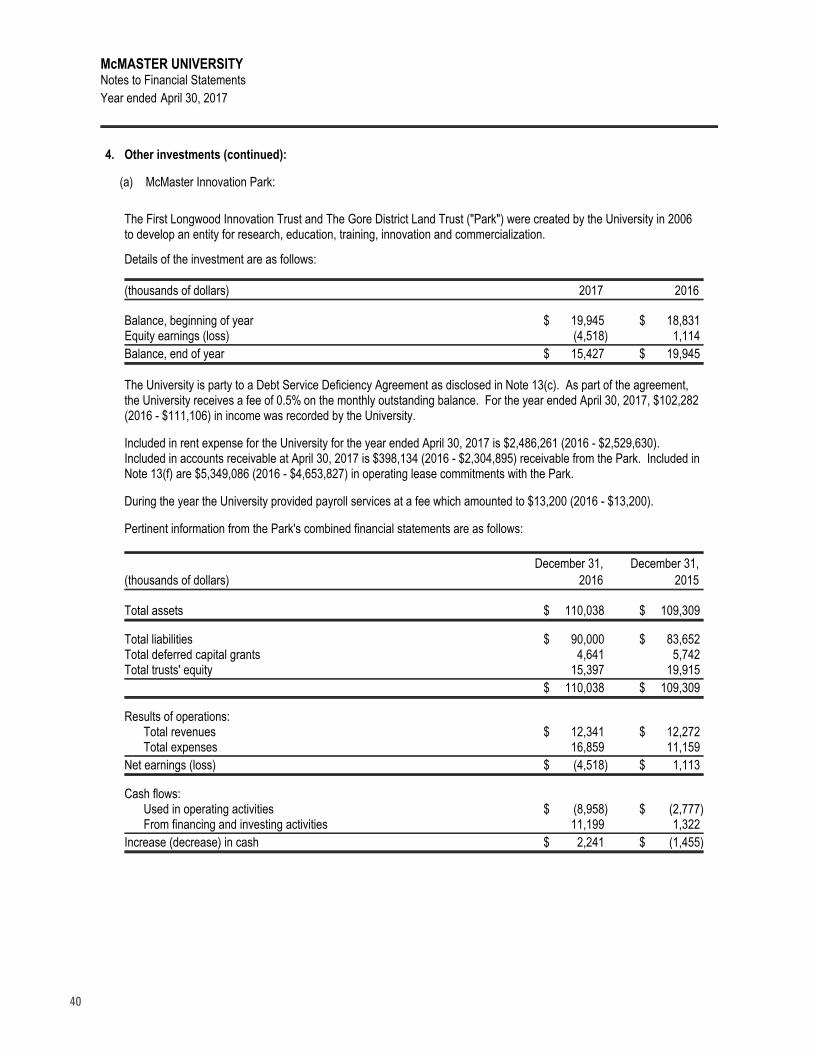
(a) McMaster Innovation Park:
The First Longwood Innovation Trust and The Gore District Land Trust ("Park") were created by the University in 2006to develop an entity for research, education, training, innovation and commercialization.
Details of the investment are as follows:
(thousands of dollars) 2017 2016
Balance, beginning of year $ 19,945 $ 18,831Equity earnings (loss) (4,518) 1,114
Balance, end of year $ 15,427 $ 19,945
The University is party to a Debt Service Deficiency Agreement as disclosed in Note 13(c). As part of the agreement,the University receives a fee of 0.5% on the monthly outstanding balance. For the year ended April 30, 2017, $102,282(2016 - $111,106) in income was recorded by the University.
Included in rent expense for the University for the year ended April 30, 2017 is $2,486,261 (2016 - $2,529,630).Included in accounts receivable at April 30, 2017 is $398,134 (2016 - $2,304,895) receivable from the Park. Included inNote 13(f) are $5,349,086 (2016 - $4,653,827) in operating lease commitments with the Park.
During the year the University provided payroll services at a fee which amounted to $13,200 (2016 - $13,200).
Pertinent information from the Park's combined financial statements are as follows:
December 31, December 31,
(thousands of dollars) 2016 2015
Total assets $ 110,038 $ 109,309
Total liabilities $ 90,000 $ 83,652Total deferred capital grants 4,641 5,742Total trusts' equity 15,397 19,915
$ 110,038 $ 109,309
Results of operations:Total revenues $ 12,341 $ 12,272Total expenses 16,859 11,159
Net earnings (loss) $ (4,518) $ 1,113
Cash flows:Used in operating activities $ (8,958) $ (2,777)From financing and investing activities 11,199 1,322
Increase (decrease) in cash $ 2,241 $ (1,455)
15
41
McMASTER UNIVERSITYNotes to Financial Statements
Year ended April 30, 2017
4. Other investments (continued):
(b) Adiga Life Sciences Inc.:
Financial information from Adiga Life Sciences Inc.'s financial statements are as follows:
August 31, August 31,
(thousands of dollars) 2016 2015
Total assets $ 2,382 $ 3,889
Total liabilities $ 361 $ 1,178Total equity 2,021 2,711
$ 2,382 $ 3,889
Results of operations:Total revenue $ 5,102 $ 8,027Total expenses 5,792 7,192
Net earnings (loss) $ (690) $ 835
(c) Halton McMaster Family Health Centre:
The investment in the Halton McMaster Family Health Centre represents the University's contribution of the base costs toconstruct the building.
(d) The Director's College:
The Director's College was a joint venture with The Conference Board of Canada to form the first university accreditedcorporate director development program. The University recorded its 50% share of the operating results based on TheDirector's College fiscal year ended May 31st. The joint venture ceased operations in December, 2016. Included inaccounts receivable is $92,000 for the University's portion of the final distribution from the joint venture.
Financial information from The Director's College financial statements are as follows:
May 31, May 31,
(thousands of dollars) 2016 2015
Total assets $ 508 $ 676
Total liabilities $ 604 $ 441Total equity (96) 235
$ 508 $ 676
Results of operations:Total revenue $ 1,627 $ 1,700Total expenses 1,957 1,900
Net loss $ (330) $ (200)
(e) Graduate Students' Association:
The University has a loan receivable from Graduate Students' Association in the amount of $354,735 at April 30, 2017(2016 - $554,373). The loan bears interest at a fixed rate of 6.75%, repaid in lump sum payments due and payable withinsixty days of the closing of each of the trimestrial graduate registration periods.
16
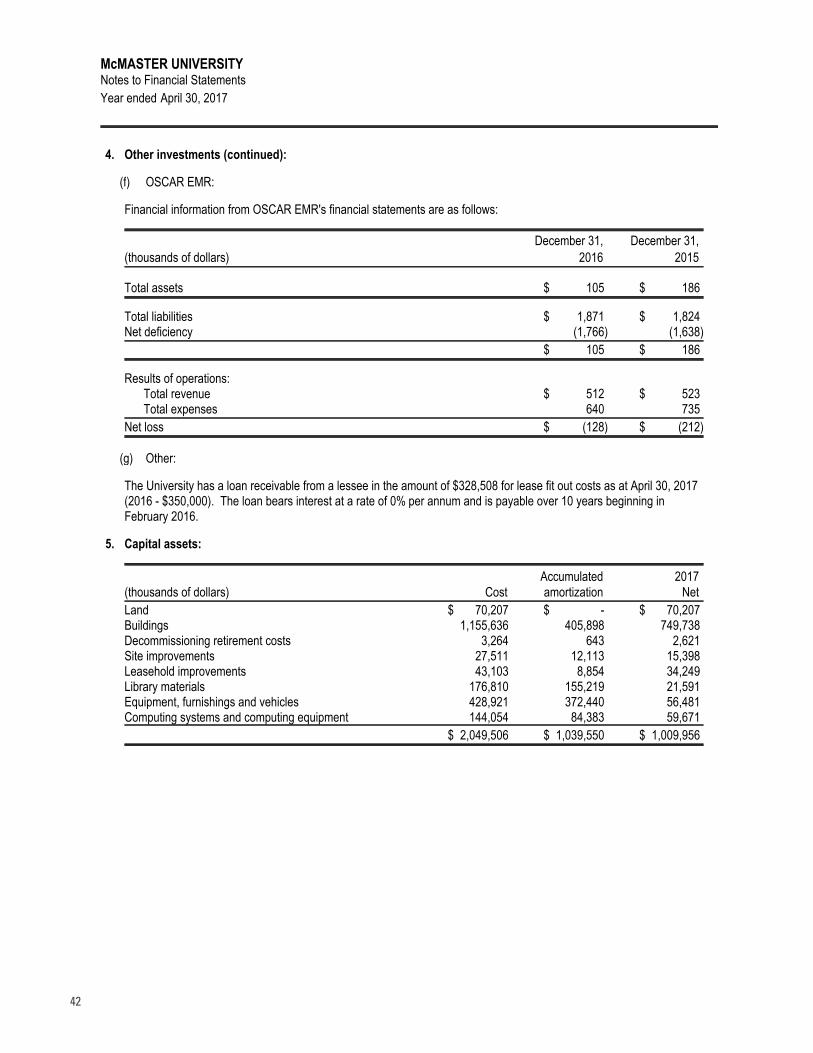
42
McMASTER UNIVERSITYNotes to Financial Statements
Year ended April 30, 2017
4. Other investments (continued):
(f) OSCAR EMR:
Financial information from OSCAR EMR's financial statements are as follows:
December 31, December 31,
(thousands of dollars) 2016 2015
Total assets $ 105 $ 186
Total liabilities $ 1,871 $ 1,824Net deficiency (1,766) (1,638)
$ 105 $ 186
Results of operations:Total revenue $ 512 $ 523Total expenses 640 735
Net loss $ (128) $ (212)
(g) Other:
The University has a loan receivable from a lessee in the amount of $328,508 for lease fit out costs as at April 30, 2017(2016 - $350,000). The loan bears interest at a rate of 0% per annum and is payable over 10 years beginning inFebruary 2016.
5. Capital assets:
Accumulated 2017(thousands of dollars) Cost amortization Net
Land $ 70,207 $ - $ 70,207Buildings 1,155,636 405,898 749,738Decommissioning retirement costs 3,264 643 2,621Site improvements 27,511 12,113 15,398Leasehold improvements 43,103 8,854 34,249Library materials 176,810 155,219 21,591Equipment, furnishings and vehicles 428,921 372,440 56,481Computing systems and computing equipment 144,054 84,383 59,671
$ 2,049,506 $ 1,039,550 $ 1,009,956
17
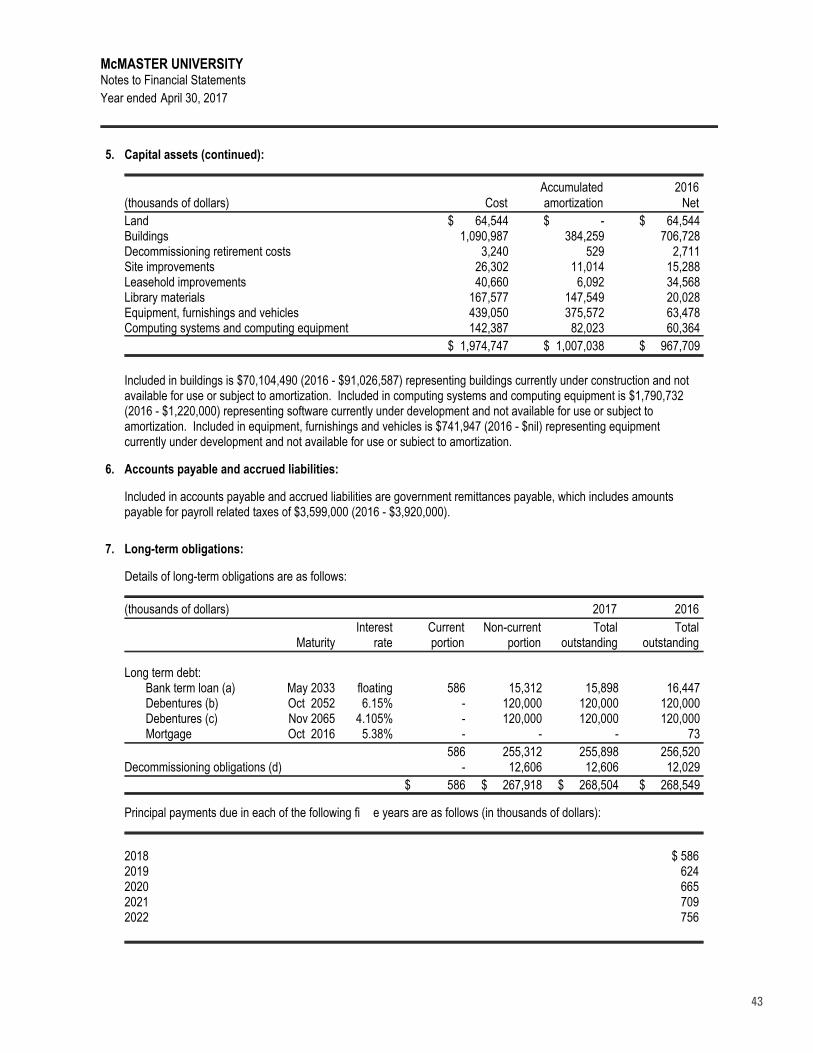
43
McMASTER UNIVERSITYNotes to Financial Statements
Year ended April 30, 2017
5. Capital assets (continued):
Accumulated 2016(thousands of dollars) Cost amortization Net
Land $ 64,544 $ - $ 64,544Buildings 1,090,987 384,259 706,728Decommissioning retirement costs 3,240 529 2,711Site improvements 26,302 11,014 15,288Leasehold improvements 40,660 6,092 34,568Library materials 167,577 147,549 20,028Equipment, furnishings and vehicles 439,050 375,572 63,478Computing systems and computing equipment 142,387 82,023 60,364
$ 1,974,747 $ 1,007,038 $ 967,709
Included in buildings is $70,104,490 (2016 - $91,026,587) representing buildings currently under construction and notavailable for use or subject to amortization. Included in computing systems and computing equipment is $1,790,732(2016 - $1,220,000) representing software currently under development and not available for use or subject toamortization. Included in equipment, furnishings and vehicles is $741,947 (2016 - $nil) representing equipmentcurrently under development and not available for use or subject to amortization.
6. Accounts payable and accrued liabilities:
Included in accounts payable and accrued liabilities are government remittances payable, which includes amountspayable for payroll related taxes of $3,599,000 (2016 - $3,920,000).
7. Long-term obligations:
Details of long-term obligations are as follows:
(thousands of dollars) 2017 2016
Interest Current Non-current Total TotalMaturity rate portion portion outstanding outstanding
Long term debt:Bank term loan (a) May 2033 floating 586 15,312 15,898 16,447Debentures (b) Oct 2052 6.15% - 120,000 120,000 120,000Debentures (c) Nov 2065 4.105% - 120,000 120,000 120,000Mortgage Oct 2016 5.38% - - - 73
586 255,312 255,898 256,520Decommissioning obligations (d) - 12,606 12,606 12,029
$ 586 $ 267,918 $ 268,504 $ 268,549
Principal payments due in each of the following five years are as follows (in thousands of dollars):
2018 $ 5862019 6242020 6652021 7092022 756
18
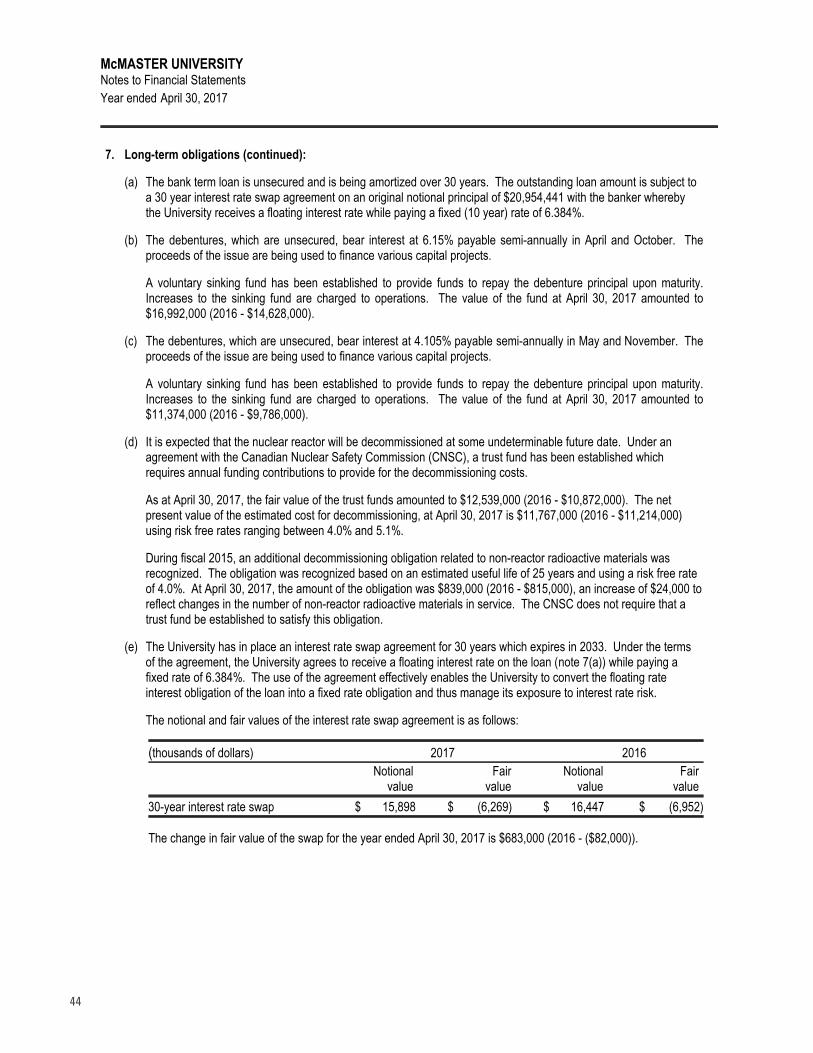
44
McMASTER UNIVERSITYNotes to Financial Statements
Year ended April 30, 2017
7. Long-term obligations (continued):
(a) The bank term loan is unsecured and is being amortized over 30 years. The outstanding loan amount is subject toa 30 year interest rate swap agreement on an original notional principal of $20,954,441 with the banker wherebythe University receives a floating interest rate while paying a fixed (10 year) rate of 6.384%.
(b) The debentures, which are unsecured, bear interest at 6.15% payable semi-annually in April and October. Theproceeds of the issue are being used to finance various capital projects.
A voluntary sinking fund has been established to provide funds to repay the debenture principal upon maturity.Increases to the sinking fund are charged to operations. The value of the fund at April 30, 2017 amounted to$16,992,000 (2016 - $14,628,000).
(c) The debentures, which are unsecured, bear interest at 4.105% payable semi-annually in May and November. Theproceeds of the issue are being used to finance various capital projects.
A voluntary sinking fund has been established to provide funds to repay the debenture principal upon maturity.Increases to the sinking fund are charged to operations. The value of the fund at April 30, 2017 amounted to$11,374,000 (2016 - $9,786,000).
(d) It is expected that the nuclear reactor will be decommissioned at some undeterminable future date. Under anagreement with the Canadian Nuclear Safety Commission (CNSC), a trust fund has been established whichrequires annual funding contributions to provide for the decommissioning costs.
As at April 30, 2017, the fair value of the trust funds amounted to $12,539,000 (2016 - $10,872,000). The netpresent value of the estimated cost for decommissioning, at April 30, 2017 is $11,767,000 (2016 - $11,214,000)using risk free rates ranging between 4.0% and 5.1%.
During fiscal 2015, an additional decommissioning obligation related to non-reactor radioactive materials wasrecognized. The obligation was recognized based on an estimated useful life of 25 years and using a risk free rateof 4.0%. At April 30, 2017, the amount of the obligation was $839,000 (2016 - $815,000), an increase of $24,000 toreflect changes in the number of non-reactor radioactive materials in service. The CNSC does not require that atrust fund be established to satisfy this obligation.
(e) The University has in place an interest rate swap agreement for 30 years which expires in 2033. Under the termsof the agreement, the University agrees to receive a floating interest rate on the loan (note 7(a)) while paying afixed rate of 6.384%. The use of the agreement effectively enables the University to convert the floating rateinterest obligation of the loan into a fixed rate obligation and thus manage its exposure to interest rate risk.
The notional and fair values of the interest rate swap agreement is as follows:
(thousands of dollars) 2017 2016
Notional Fair Notional Fairvalue value value value
30-year interest rate swap $ 15,898 $ (6,269) $ 16,447 $ (6,952)
The change in fair value of the swap for the year ended April 30, 2017 is $683,000 (2016 - ($82,000)).
19
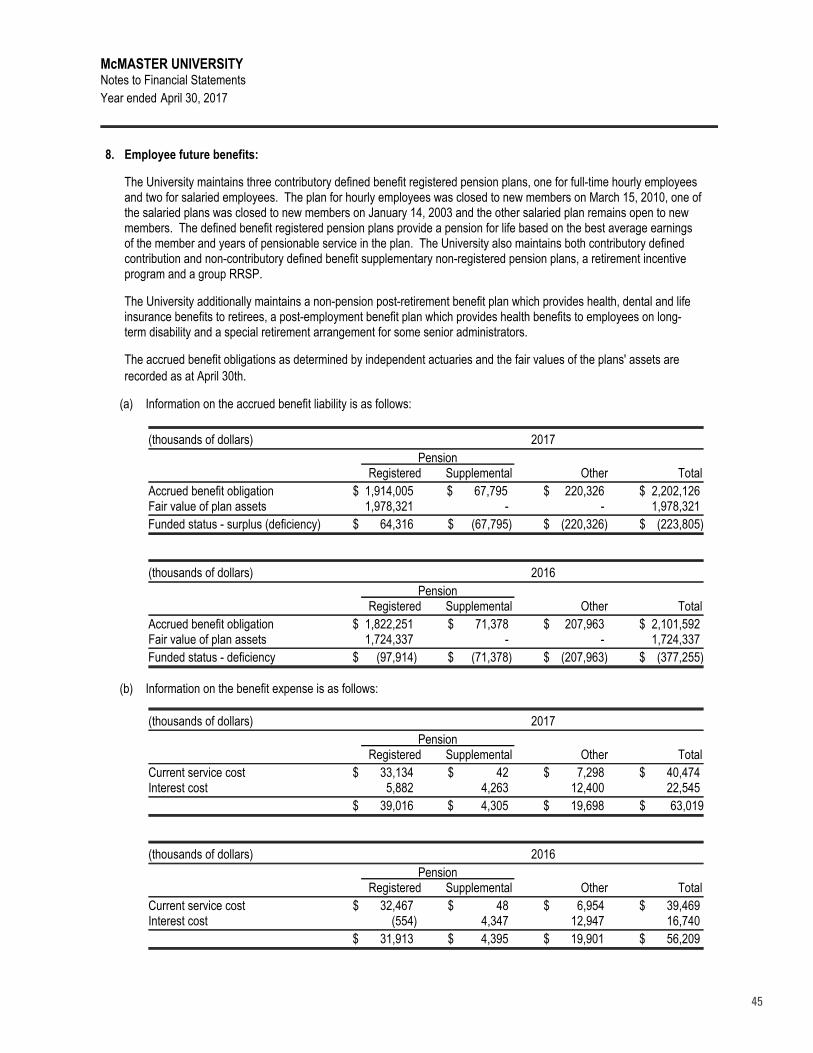
45
McMASTER UNIVERSITYNotes to Financial Statements
Year ended April 30, 2017
8. Employee future benefits:
The University maintains three contributory defined benefit registered pension plans, one for full-time hourly employeesand two for salaried employees. The plan for hourly employees was closed to new members on March 15, 2010, one ofthe salaried plans was closed to new members on January 14, 2003 and the other salaried plan remains open to newmembers. The defined benefit registered pension plans provide a pension for life based on the best average earningsof the member and years of pensionable service in the plan. The University also maintains both contributory definedcontribution and non-contributory defined benefit supplementary non-registered pension plans, a retirement incentiveprogram and a group RRSP.
The University additionally maintains a non-pension post-retirement benefit plan which provides health, dental and lifeinsurance benefits to retirees, a post-employment benefit plan which provides health benefits to employees on long-term disability and a special retirement arrangement for some senior administrators.
The accrued benefit obligations as determined by independent actuaries and the fair values of the plans' assets are
recorded as at April 30th.
(a) Information on the accrued benefit liability is as follows:
(thousands of dollars) 2017
PensionRegistered Supplemental Other Total
Accrued benefit obligation $ 1,914,005 $ 67,795 $ 220,326 $ 2,202,126Fair value of plan assets 1,978,321 - - 1,978,321
Funded status - surplus (deficiency) $ 64,316 $ (67,795) $ (220,326) $ (223,805)
(thousands of dollars) 2016
PensionRegistered Supplemental Other Total
Accrued benefit obligation $ 1,822,251 $ 71,378 $ 207,963 $ 2,101,592Fair value of plan assets 1,724,337 - - 1,724,337
Funded status - deficiency $ (97,914) $ (71,378) $ (207,963) $ (377,255)
(b) Information on the benefit expense is as follows:
(thousands of dollars) 2017
PensionRegistered Supplemental Other Total
Current service cost $ 33,134 $ 42 $ 7,298 $ 40,474Interest cost 5,882 4,263 12,400 22,545
$ 39,016 $ 4,305 $ 19,698 $ 63,019
(thousands of dollars) 2016
PensionRegistered Supplemental Other Total
Current service cost $ 32,467 $ 48 $ 6,954 $ 39,469Interest cost (554) 4,347 12,947 16,740
$ 31,913 $ 4,395 $ 19,901 $ 56,209
20
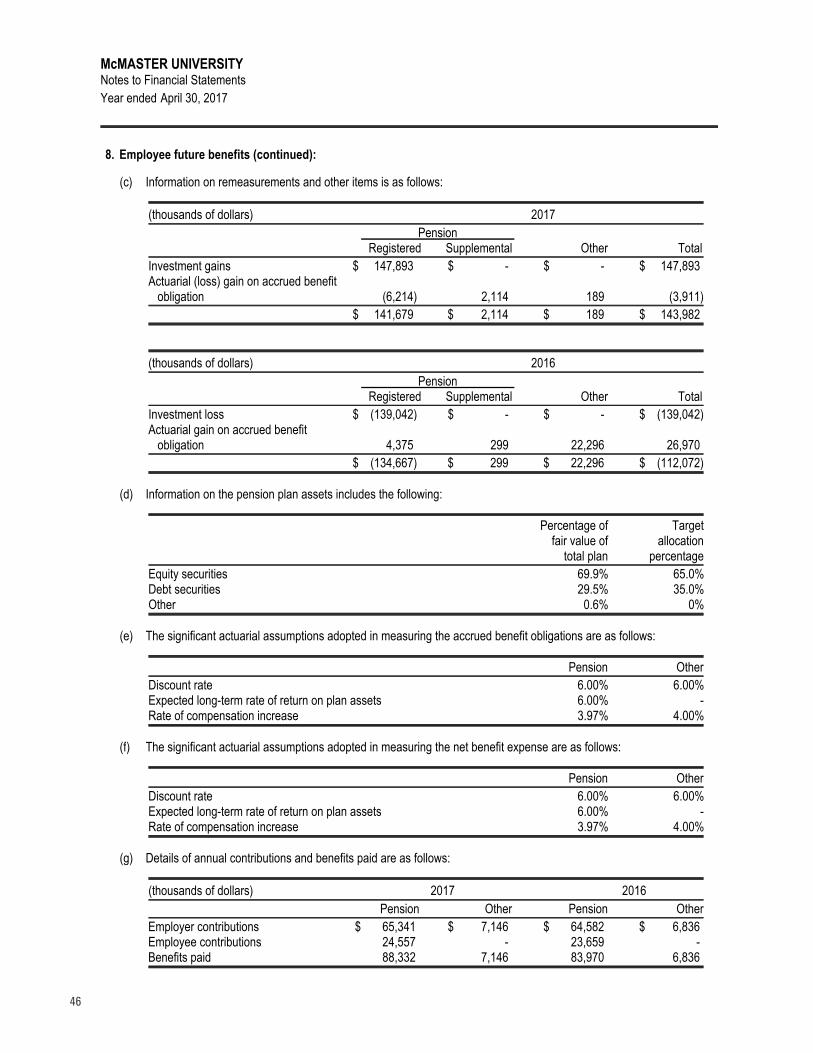
46
McMASTER UNIVERSITYNotes to Financial Statements
Year ended April 30, 2017
8. Employee future benefits (continued):
(c) Information on remeasurements and other items is as follows:
(thousands of dollars) 2017
PensionRegistered Supplemental Other Total
Investment gains $ 147,893 $ - $ - $ 147,893Actuarial (loss) gain on accrued benefit obligation (6,214) 2,114 189 (3,911)
$ 141,679 $ 2,114 $ 189 $ 143,982
(thousands of dollars) 2016
PensionRegistered Supplemental Other Total
Investment loss $ (139,042) $ - $ - $ (139,042)Actuarial gain on accrued benefit obligation 4,375 299 22,296 26,970
$ (134,667) $ 299 $ 22,296 $ (112,072)
(d) Information on the pension plan assets includes the following:
Percentage of Targetfair value of allocation
total plan percentage
Equity securities 69.9% 65.0%Debt securities 29.5% 35.0%Other 0.6% 0%
(e) The significant actuarial assumptions adopted in measuring the accrued benefit obligations are as follows:
Pension Other
Discount rate 6.00% 6.00%Expected long-term rate of return on plan assets 6.00% -Rate of compensation increase 3.97% 4.00%
(f) The significant actuarial assumptions adopted in measuring the net benefit expense are as follows:
Pension Other
Discount rate 6.00% 6.00%Expected long-term rate of return on plan assets 6.00% -Rate of compensation increase 3.97% 4.00%
(g) Details of annual contributions and benefits paid are as follows:
(thousands of dollars) 2017 2016
Pension Other Pension Other
Employer contributions $ 65,341 $ 7,146 $ 64,582 $ 6,836Employee contributions 24,557 - 23,659 -Benefits paid 88,332 7,146 83,970 6,836
21
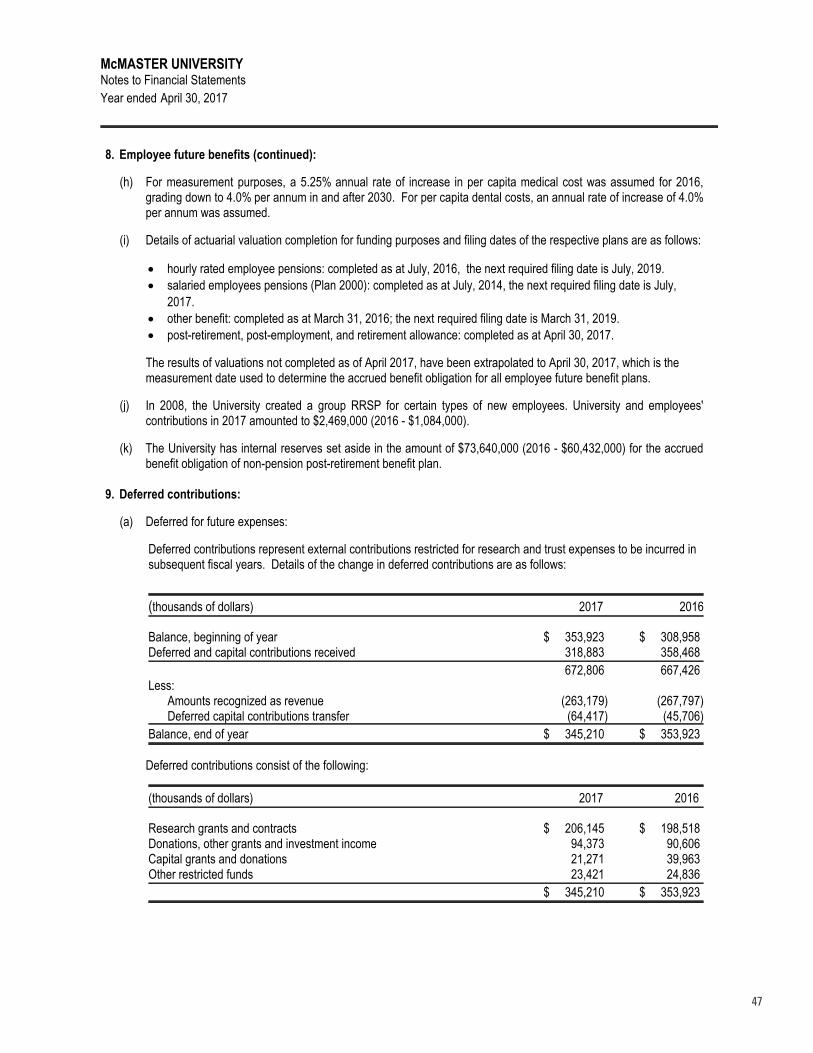
47
McMASTER UNIVERSITYNotes to Financial Statements
Year ended April 30, 2017
8. Employee future benefits (continued):
(h) For measurement purposes, a 5.25% annual rate of increase in per capita medical cost was assumed for 2016,grading down to 4.0% per annum in and after 2030. For per capita dental costs, an annual rate of increase of 4.0%per annum was assumed.
(i) Details of actuarial valuation completion for funding purposes and filing dates of the respective plans are as follows:
hourly rated employee pensions: completed as at July, 2016, the next required filing date is July, 2019.
salaried employees pensions (Plan 2000): completed as at July, 2014, the next required filing date is July,
2017.
other benefit: completed as at March 31, 2016; the next required filing date is March 31, 2019.
post-retirement, post-employment, and retirement allowance: completed as at April 30, 2017.
The results of valuations not completed as of April 2017, have been extrapolated to April 30, 2017, which is themeasurement date used to determine the accrued benefit obligation for all employee future benefit plans.
(j) In 2008, the University created a group RRSP for certain types of new employees. University and employees'contributions in 2017 amounted to $2,469,000 (2016 - $1,084,000).
(k) The University has internal reserves set aside in the amount of $73,640,000 (2016 - $60,432,000) for the accruedbenefit obligation of non-pension post-retirement benefit plan.
9. Deferred contributions:
(a) Deferred for future expenses:
Deferred contributions represent external contributions restricted for research and trust expenses to be incurred insubsequent fiscal years. Details of the change in deferred contributions are as follows:
(thousands of dollars) 2017 2016
Balance, beginning of year $ 353,923 $ 308,958Deferred and capital contributions received 318,883 358,468
672,806 667,426Less:
Amounts recognized as revenue (263,179) (267,797)Deferred capital contributions transfer (64,417) (45,706)
Balance, end of year $ 345,210 $ 353,923
Deferred contributions consist of the following:
(thousands of dollars) 2017 2016
Research grants and contracts $ 206,145 $ 198,518Donations, other grants and investment income 94,373 90,606Capital grants and donations 21,271 39,963Other restricted funds 23,421 24,836
$ 345,210 $ 353,923
22
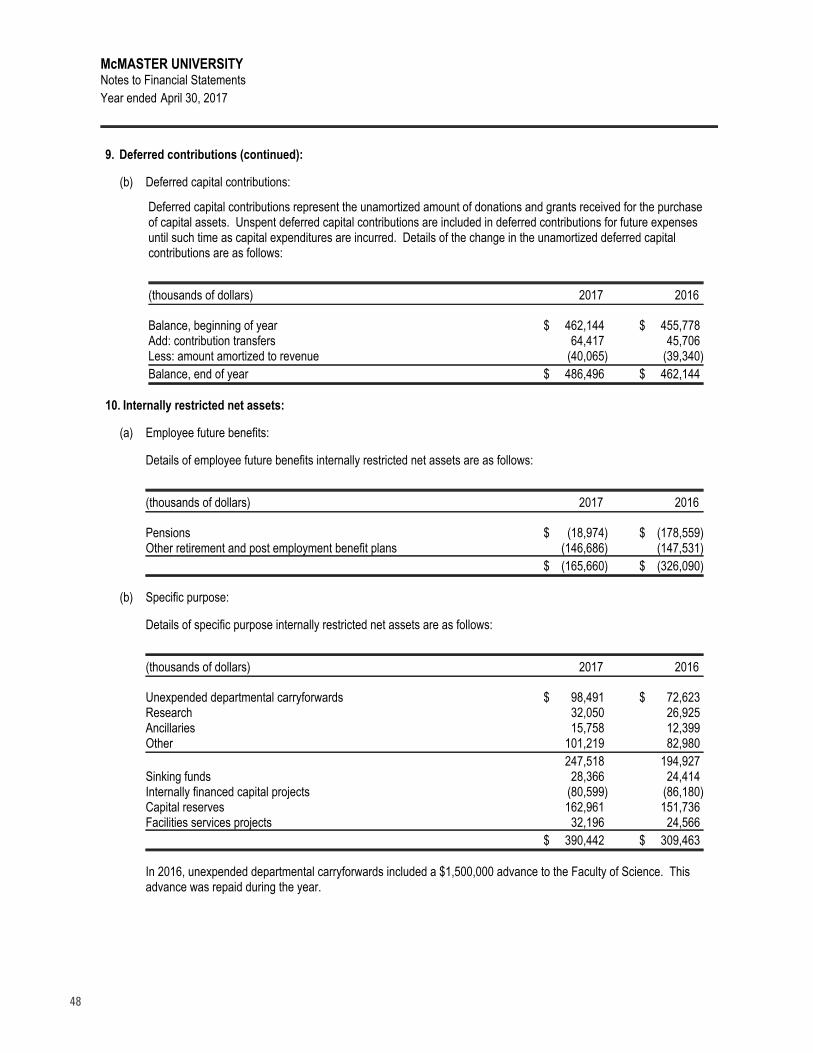
48
McMASTER UNIVERSITYNotes to Financial Statements
Year ended April 30, 2017
9. Deferred contributions (continued):
(b) Deferred capital contributions:
Deferred capital contributions represent the unamortized amount of donations and grants received for the purchaseof capital assets. Unspent deferred capital contributions are included in deferred contributions for future expensesuntil such time as capital expenditures are incurred. Details of the change in the unamortized deferred capitalcontributions are as follows:
(thousands of dollars) 2017 2016
Balance, beginning of year $ 462,144 $ 455,778Add: contribution transfers 64,417 45,706Less: amount amortized to revenue (40,065) (39,340)
Balance, end of year $ 486,496 $ 462,144
10. Internally restricted net assets:
(a) Employee future benefits:
Details of employee future benefits internally restricted net assets are as follows:
(thousands of dollars) 2017 2016
Pensions $ (18,974) $ (178,559)Other retirement and post employment benefit plans (146,686) (147,531)
$ (165,660) $ (326,090)
(b) Specific purpose:
Details of specific purpose internally restricted net assets are as follows:
(thousands of dollars) 2017 2016
Unexpended departmental carryforwards $ 98,491 $ 72,623Research 32,050 26,925Ancillaries 15,758 12,399Other 101,219 82,980
247,518 194,927Sinking funds 28,366 24,414Internally financed capital projects (80,599) (86,180)Capital reserves 162,961 151,736Facilities services projects 32,196 24,566
$ 390,442 $ 309,463
In 2016, unexpended departmental carryforwards included a $1,500,000 advance to the Faculty of Science. Thisadvance was repaid during the year.
23
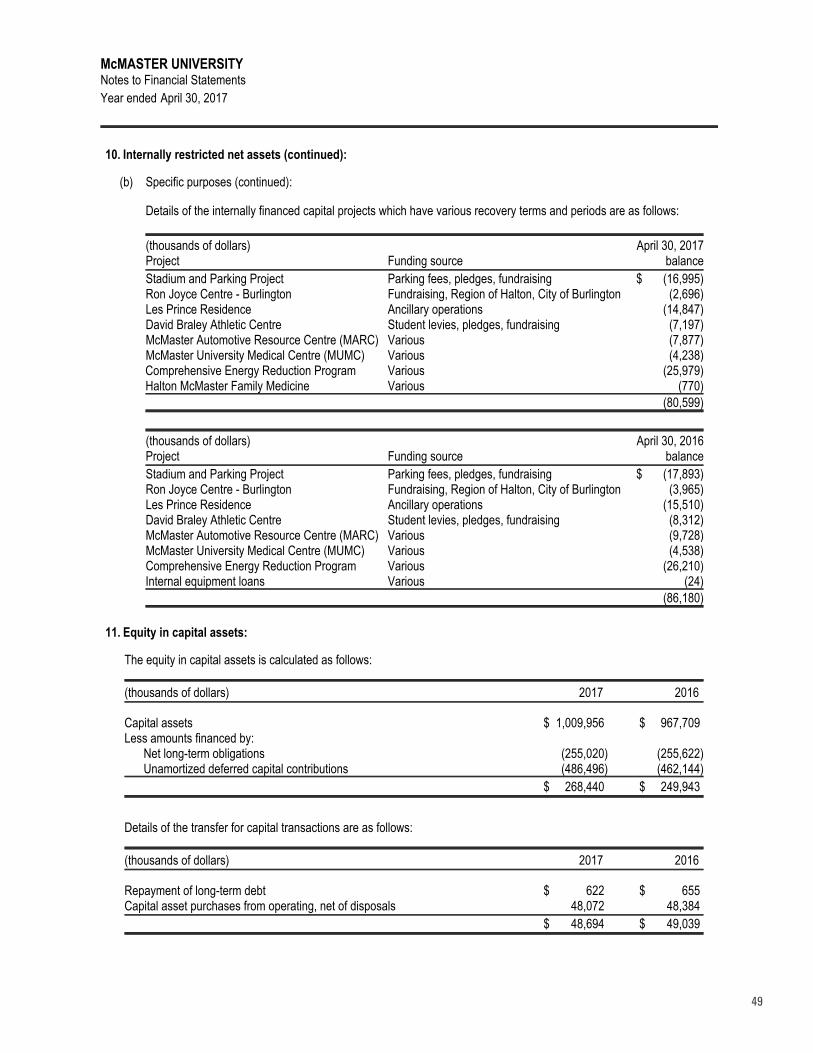
49
McMASTER UNIVERSITYNotes to Financial Statements
Year ended April 30, 2017
10. Internally restricted net assets (continued):
(b) Specific purposes (continued):
Details of the internally financed capital projects which have various recovery terms and periods are as follows:
(thousands of dollars) April 30, 2017Project Funding source balance
Stadium and Parking Project Parking fees, pledges, fundraising $ (16,995)Ron Joyce Centre - Burlington Fundraising, Region of Halton, City of Burlington (2,696)Les Prince Residence Ancillary operations (14,847)David Braley Athletic Centre Student levies, pledges, fundraising (7,197)McMaster Automotive Resource Centre (MARC) Various (7,877)McMaster University Medical Centre (MUMC) Various (4,238)Comprehensive Energy Reduction Program Various (25,979)Halton McMaster Family Medicine Various (770)
(80,599)
(thousands of dollars) April 30, 2016Project Funding source balance
Stadium and Parking Project Parking fees, pledges, fundraising $ (17,893)Ron Joyce Centre - Burlington Fundraising, Region of Halton, City of Burlington (3,965)Les Prince Residence Ancillary operations (15,510)David Braley Athletic Centre Student levies, pledges, fundraising (8,312)McMaster Automotive Resource Centre (MARC) Various (9,728)McMaster University Medical Centre (MUMC) Various (4,538)Comprehensive Energy Reduction Program Various (26,210)Internal equipment loans Various (24)
(86,180)
11. Equity in capital assets:
The equity in capital assets is calculated as follows:
(thousands of dollars) 2017 2016
Capital assets $ 1,009,956 $ 967,709Less amounts financed by:
Net long-term obligations (255,020) (255,622)Unamortized deferred capital contributions (486,496) (462,144)
$ 268,440 $ 249,943
Details of the transfer for capital transactions are as follows:
(thousands of dollars) 2017 2016
Repayment of long-term debt $ 622 $ 655Capital asset purchases from operating, net of disposals 48,072 48,384
$ 48,694 $ 49,039
24
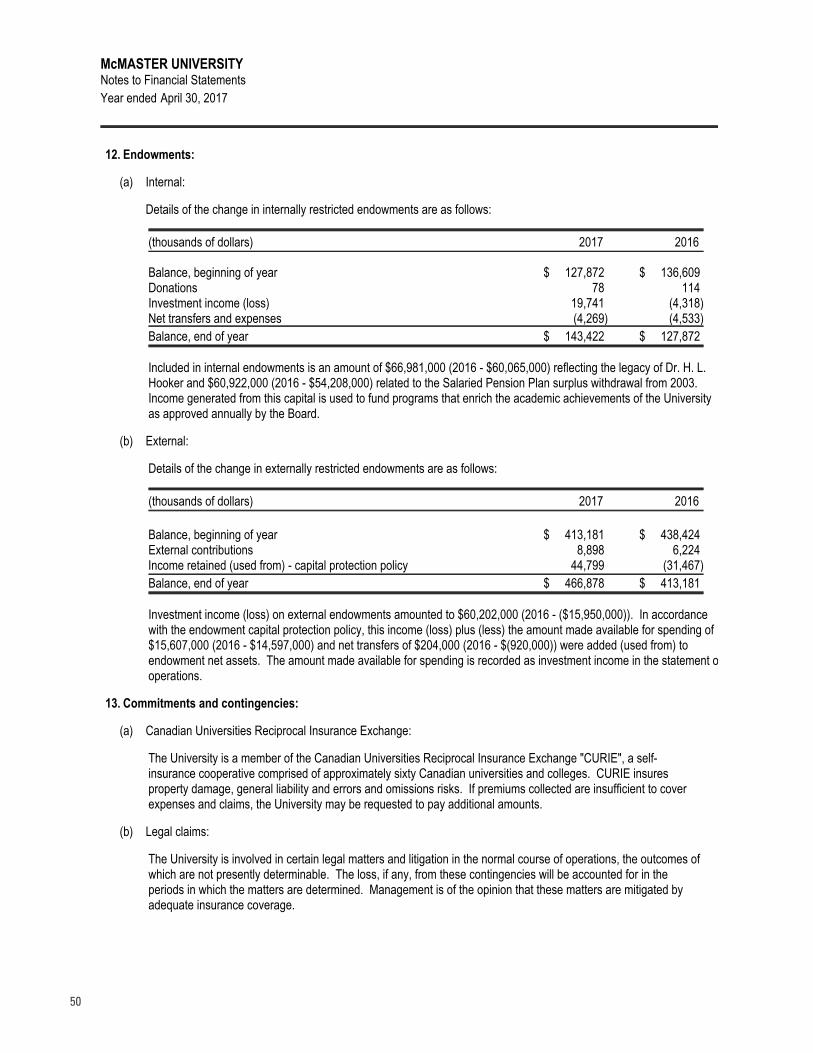
50
McMASTER UNIVERSITYNotes to Financial Statements
Year ended April 30, 2017
12. Endowments:
(a) Internal:
Details of the change in internally restricted endowments are as follows:
(thousands of dollars) 2017 2016
Balance, beginning of year $ 127,872 $ 136,609Donations 78 114Investment income (loss) 19,741 (4,318)Net transfers and expenses (4,269) (4,533)
Balance, end of year $ 143,422 $ 127,872
Included in internal endowments is an amount of $66,981,000 (2016 - $60,065,000) reflecting the legacy of Dr. H. L.Hooker and $60,922,000 (2016 - $54,208,000) related to the Salaried Pension Plan surplus withdrawal from 2003.Income generated from this capital is used to fund programs that enrich the academic achievements of the Universityas approved annually by the Board.
(b) External:
Details of the change in externally restricted endowments are as follows:
(thousands of dollars) 2017 2016
Balance, beginning of year $ 413,181 $ 438,424External contributions 8,898 6,224Income retained (used from) - capital protection policy 44,799 (31,467)
Balance, end of year $ 466,878 $ 413,181
Investment income (loss) on external endowments amounted to $60,202,000 (2016 - ($15,950,000)). In accordancewith the endowment capital protection policy, this income (loss) plus (less) the amount made available for spending of$15,607,000 (2016 - $14,597,000) and net transfers of $204,000 (2016 - $(920,000)) were added (used from) toendowment net assets. The amount made available for spending is recorded as investment income in the statement ofoperations.
13. Commitments and contingencies:
(a) Canadian Universities Reciprocal Insurance Exchange:
The University is a member of the Canadian Universities Reciprocal Insurance Exchange "CURIE", a self-insurance cooperative comprised of approximately sixty Canadian universities and colleges. CURIE insuresproperty damage, general liability and errors and omissions risks. If premiums collected are insufficient to coverexpenses and claims, the University may be requested to pay additional amounts.
(b) Legal claims:
The University is involved in certain legal matters and litigation in the normal course of operations, the outcomes ofwhich are not presently determinable. The loss, if any, from these contingencies will be accounted for in theperiods in which the matters are determined. Management is of the opinion that these matters are mitigated byadequate insurance coverage.
25
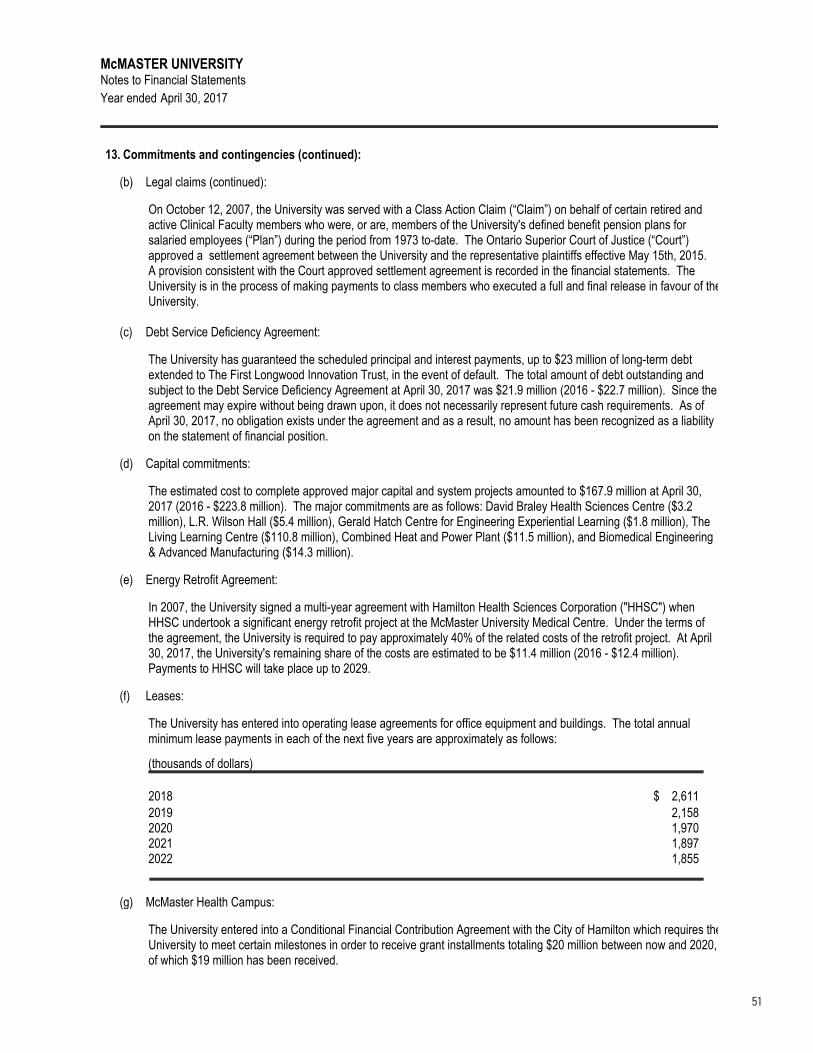
51
McMASTER UNIVERSITYNotes to Financial Statements
Year ended April 30, 2017
13. Commitments and contingencies (continued):
(b) Legal claims (continued):
On October 12, 2007, the University was served with a Class Action Claim (“Claim”) on behalf of certain retired andactive Clinical Faculty members who were, or are, members of the University's defined benefit pension plans forsalaried employees (“Plan”) during the period from 1973 to-date. The Ontario Superior Court of Justice (“Court”)approved a settlement agreement between the University and the representative plaintiffs effective May 15th, 2015.A provision consistent with the Court approved settlement agreement is recorded in the financial statements. TheUniversity is in the process of making payments to class members who executed a full and final release in favour of theUniversity.
(c) Debt Service Deficiency Agreement:
The University has guaranteed the scheduled principal and interest payments, up to $23 million of long-term debtextended to The First Longwood Innovation Trust, in the event of default. The total amount of debt outstanding andsubject to the Debt Service Deficiency Agreement at April 30, 2017 was $21.9 million (2016 - $22.7 million). Since theagreement may expire without being drawn upon, it does not necessarily represent future cash requirements. As ofApril 30, 2017, no obligation exists under the agreement and as a result, no amount has been recognized as a liabilityon the statement of financial position.
(d) Capital commitments:
The estimated cost to complete approved major capital and system projects amounted to $167.9 million at April 30,2017 (2016 - $223.8 million). The major commitments are as follows: David Braley Health Sciences Centre ($3.2million), L.R. Wilson Hall ($5.4 million), Gerald Hatch Centre for Engineering Experiential Learning ($1.8 million), TheLiving Learning Centre ($110.8 million), Combined Heat and Power Plant ($11.5 million), and Biomedical Engineering& Advanced Manufacturing ($14.3 million).
(e) Energy Retrofit Agreement:
In 2007, the University signed a multi-year agreement with Hamilton Health Sciences Corporation ("HHSC") whenHHSC undertook a significant energy retrofit project at the McMaster University Medical Centre. Under the terms ofthe agreement, the University is required to pay approximately 40% of the related costs of the retrofit project. At April30, 2017, the University's remaining share of the costs are estimated to be $11.4 million (2016 - $12.4 million).Payments to HHSC will take place up to 2029.
(f) Leases:
The University has entered into operating lease agreements for office equipment and buildings. The total annualminimum lease payments in each of the next five years are approximately as follows:
(thousands of dollars)
2018 $ 2,611
2019 2,1582020 1,9702021 1,8972022 1,855
(g) McMaster Health Campus:
The University entered into a Conditional Financial Contribution Agreement with the City of Hamilton which requires theUniversity to meet certain milestones in order to receive grant installments totaling $20 million between now and 2020,of which $19 million has been received.
26
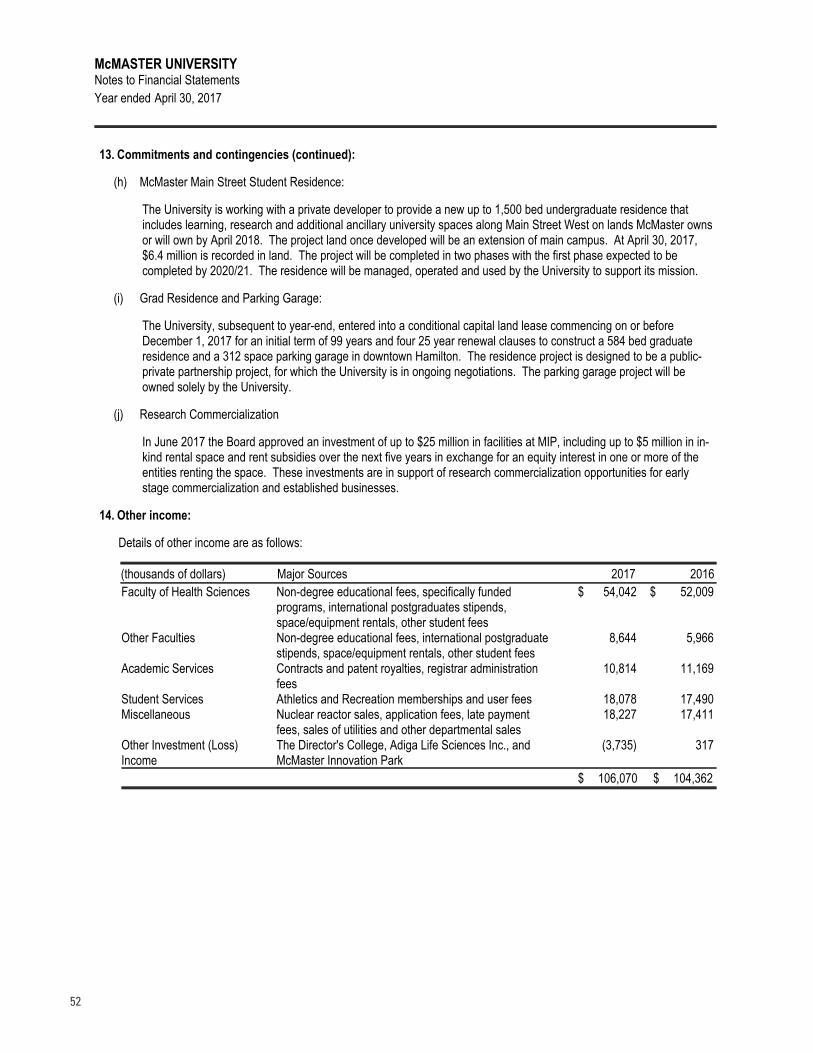
52
McMASTER UNIVERSITYNotes to Financial Statements
Year ended April 30, 2017
13. Commitments and contingencies (continued):
(h) McMaster Main Street Student Residence:
The University is working with a private developer to provide a new up to 1,500 bed undergraduate residence thatincludes learning, research and additional ancillary university spaces along Main Street West on lands McMaster ownsor will own by April 2018. The project land once developed will be an extension of main campus. At April 30, 2017,$6.4 million is recorded in land. The project will be completed in two phases with the first phase expected to becompleted by 2020/21. The residence will be managed, operated and used by the University to support its mission.
(i) Grad Residence and Parking Garage:
The University, subsequent to year-end, entered into a conditional capital land lease commencing on or beforeDecember 1, 2017 for an initial term of 99 years and four 25 year renewal clauses to construct a 584 bed graduateresidence and a 312 space parking garage in downtown Hamilton. The residence project is designed to be a public-private partnership project, for which the University is in ongoing negotiations. The parking garage project will beowned solely by the University.
(j) Research Commercialization
In June 2017 the Board approved an investment of up to $25 million in facilities at MIP, including up to $5 million in in-kind rental space and rent subsidies over the next five years in exchange for an equity interest in one or more of theentities renting the space. These investments are in support of research commercialization opportunities for earlystage commercialization and established businesses.
14. Other income:
Details of other income are as follows:
(thousands of dollars) Major Sources 2017 2016
Faculty of Health Sciences Non-degree educational fees, specifically fundedprograms, international postgraduates stipends,space/equipment rentals, other student fees
$ 54,042 $ 52,009
Other Faculties Non-degree educational fees, international postgraduatestipends, space/equipment rentals, other student fees
8,644 5,966
Academic Services Contracts and patent royalties, registrar administrationfees
10,814 11,169
Student Services Athletics and Recreation memberships and user fees 18,078 17,490Miscellaneous Nuclear reactor sales, application fees, late payment
fees, sales of utilities and other departmental sales 18,227 17,411
Other Investment (Loss) Income
The Director's College, Adiga Life Sciences Inc., andMcMaster Innovation Park
(3,735) 317
$ 106,070 $ 104,362
27
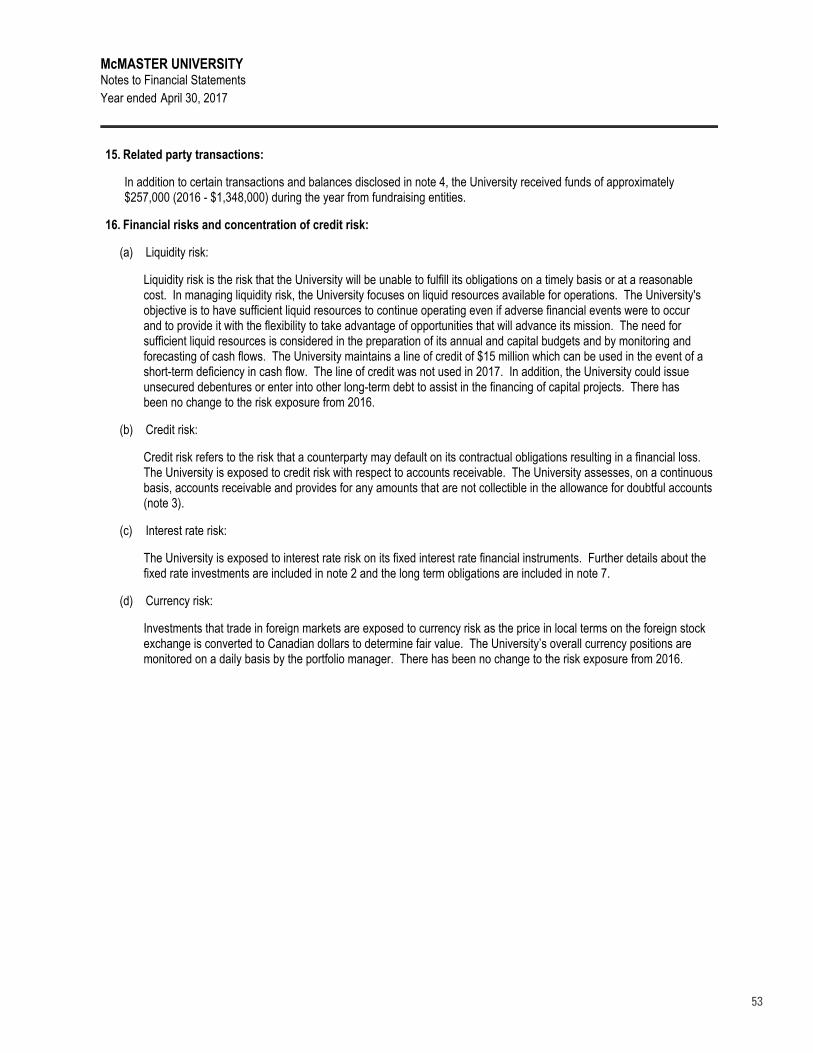
53
McMASTER UNIVERSITYNotes to Financial Statements
Year ended April 30, 2017
15. Related party transactions:
In addition to certain transactions and balances disclosed in note 4, the University received funds of approximately$257,000 (2016 - $1,348,000) during the year from fundraising entities.
16. Financial risks and concentration of credit risk:
(a) Liquidity risk:
Liquidity risk is the risk that the University will be unable to fulfill its obligations on a timely basis or at a reasonablecost. In managing liquidity risk, the University focuses on liquid resources available for operations. The University'sobjective is to have sufficient liquid resources to continue operating even if adverse financial events were to occurand to provide it with the flexibility to take advantage of opportunities that will advance its mission. The need forsufficient liquid resources is considered in the preparation of its annual and capital budgets and by monitoring andforecasting of cash flows. The University maintains a line of credit of $15 million which can be used in the event of ashort-term deficiency in cash flow. The line of credit was not used in 2017. In addition, the University could issueunsecured debentures or enter into other long-term debt to assist in the financing of capital projects. There hasbeen no change to the risk exposure from 2016.
(b) Credit risk:
Credit risk refers to the risk that a counterparty may default on its contractual obligations resulting in a financial loss.The University is exposed to credit risk with respect to accounts receivable. The University assesses, on a continuousbasis, accounts receivable and provides for any amounts that are not collectible in the allowance for doubtful accounts(note 3).
(c) Interest rate risk:
The University is exposed to interest rate risk on its fixed interest rate financial instruments. Further details about thefixed rate investments are included in note 2 and the long term obligations are included in note 7.
(d) Currency risk:
Investments that trade in foreign markets are exposed to currency risk as the price in local terms on the foreign stockexchange is converted to Canadian dollars to determine fair value. The University’s overall currency positions aremonitored on a daily basis by the portfolio manager. There has been no change to the risk exposure from 2016.
28
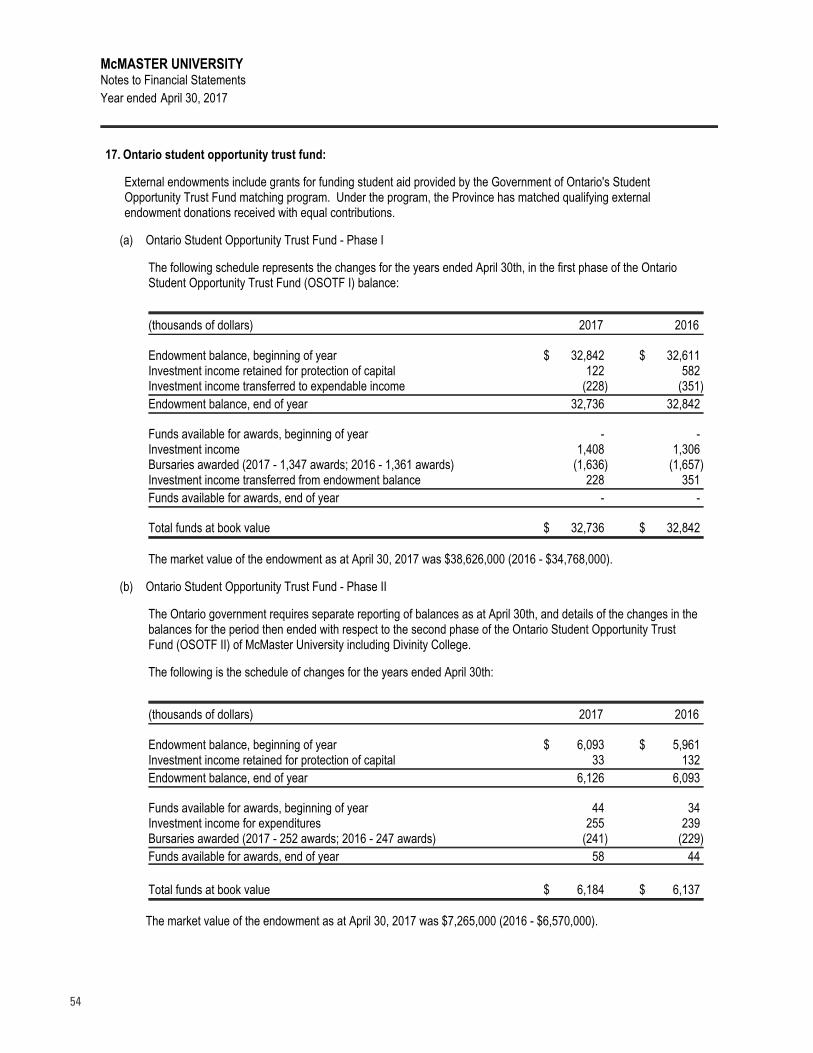
54
McMASTER UNIVERSITYNotes to Financial Statements
Year ended April 30, 2017
17. Ontario student opportunity trust fund:
External endowments include grants for funding student aid provided by the Government of Ontario's StudentOpportunity Trust Fund matching program. Under the program, the Province has matched qualifying externalendowment donations received with equal contributions.
(a) Ontario Student Opportunity Trust Fund - Phase I
The following schedule represents the changes for the years ended April 30th, in the first phase of the OntarioStudent Opportunity Trust Fund (OSOTF I) balance:
(thousands of dollars) 2017 2016
Endowment balance, beginning of year $ 32,842 $ 32,611Investment income retained for protection of capital 122 582Investment income transferred to expendable income (228) (351)
Endowment balance, end of year 32,736 32,842
Funds available for awards, beginning of year - -Investment income 1,408 1,306Bursaries awarded (2017 - 1,347 awards; 2016 - 1,361 awards) (1,636) (1,657)Investment income transferred from endowment balance 228 351
Funds available for awards, end of year - -
Total funds at book value $ 32,736 $ 32,842
The market value of the endowment as at April 30, 2017 was $38,626,000 (2016 - $34,768,000).
(b) Ontario Student Opportunity Trust Fund - Phase II
The Ontario government requires separate reporting of balances as at April 30th, and details of the changes in thebalances for the period then ended with respect to the second phase of the Ontario Student Opportunity TrustFund (OSOTF II) of McMaster University including Divinity College.
The following is the schedule of changes for the years ended April 30th:
(thousands of dollars) 2017 2016
Endowment balance, beginning of year $ 6,093 $ 5,961Investment income retained for protection of capital 33 132
Endowment balance, end of year 6,126 6,093
Funds available for awards, beginning of year 44 34Investment income for expenditures 255 239Bursaries awarded (2017 - 252 awards; 2016 - 247 awards) (241) (229)
Funds available for awards, end of year 58 44
Total funds at book value $ 6,184 $ 6,137
The market value of the endowment as at April 30, 2017 was $7,265,000 (2016 - $6,570,000).
29
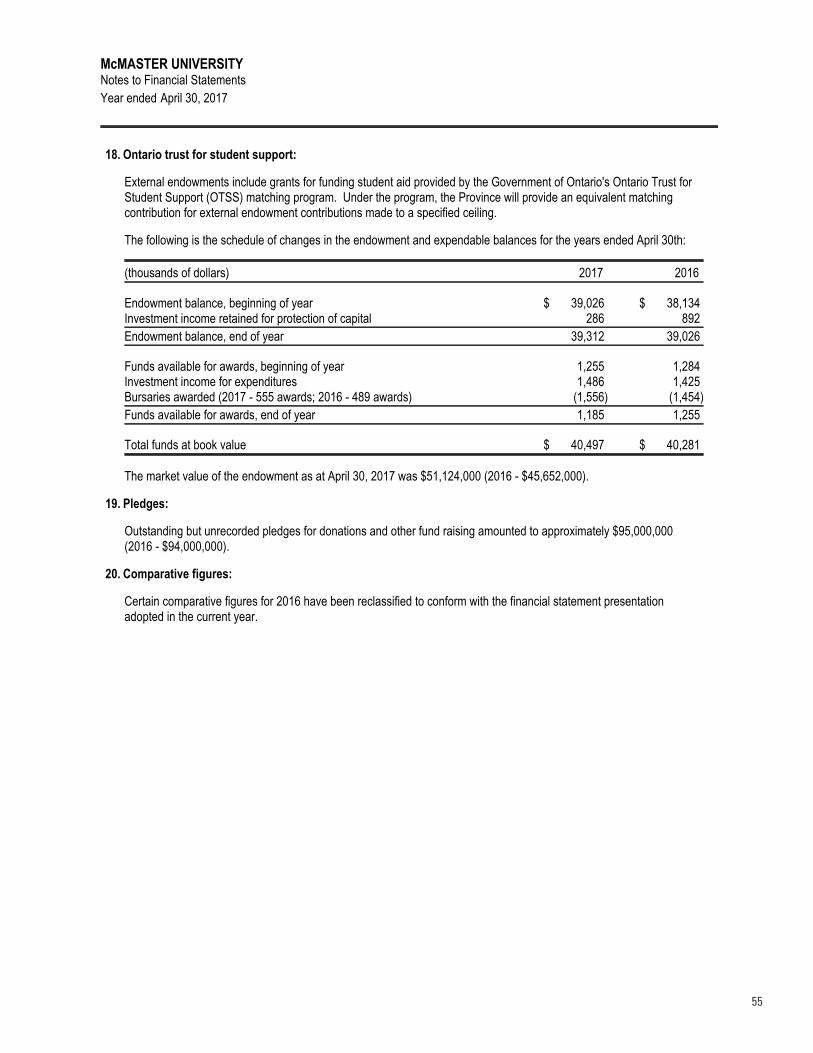
55
McMASTER UNIVERSITYNotes to Financial Statements
Year ended April 30, 2017
18. Ontario trust for student support:
External endowments include grants for funding student aid provided by the Government of Ontario's Ontario Trust forStudent Support (OTSS) matching program. Under the program, the Province will provide an equivalent matchingcontribution for external endowment contributions made to a specified ceiling.
The following is the schedule of changes in the endowment and expendable balances for the years ended April 30th:
(thousands of dollars) 2017 2016
Endowment balance, beginning of year $ 39,026 $ 38,134Investment income retained for protection of capital 286 892
Endowment balance, end of year 39,312 39,026
Funds available for awards, beginning of year 1,255 1,284Investment income for expenditures 1,486 1,425Bursaries awarded (2017 - 555 awards; 2016 - 489 awards) (1,556) (1,454)
Funds available for awards, end of year 1,185 1,255
Total funds at book value $ 40,497 $ 40,281
The market value of the endowment as at April 30, 2017 was $51,124,000 (2016 - $45,652,000).
19. Pledges:
Outstanding but unrecorded pledges for donations and other fund raising amounted to approximately $95,000,000(2016 - $94,000,000).
20. Comparative figures:
Certain comparative figures for 2016 have been reclassified to conform with the financial statement presentationadopted in the current year.
30


Financial Services 1280 Main Street WestHamilton, ON L8N 1E9
Designed and produced by Media Production Services
The Office of Financial Services supports and promotes sustainability. To download a pdf version of this report please visit mcmaster.ca/bms