Embed Size (px)
Citation preview
State Board of Education Rule 6A-1.0071, Florida Administrative Code and Section 1001.51(12)(b), Florida Statutes
Annual Financial Report
2017-2018 Superintendent’s Annual Financial Report (ESE 145) Report of Financial Data to the Commissioner of Education (ESE 348)
Accounting Department
Dawn Posey, Director Elizabeth Moore, Supervisor
Stacy Pearson, Senior Accountant Nancy Roca, Capital Outlay Accountant
Amy Snodgrass, Senior Accountant Toni Dendler, Medicaid Specialist
September 11, 2018
2017-18 Final AFR, St. Johns County Schools September 2018 Page 1 of 132

2017-18 Final AFR, St. Johns County Schools September 2018 Page 2 of 132

2017-18 Final AFR, St. Johns County Schools September 2018 Page 3 of 132

EXHIBIT A-1 Page 1
1
MANAGEMENT’S DISCUSSION AND ANALYSIS
The management of the St. Johns County District School Board (District) has prepared the following
discussion and analysis of financial activities for the fiscal year ended June 30, 2018. It is intended to
provide a broad overview using a short-term and long-term analysis of the District’s activities based on
information presented in the financial report and fiscal policies that have been adopted by the School
Board (Board). The intent of this discussion and analysis is to assist the reader in focusing on significant
financial issues, provide an overview of the District’s financial activities, identify changes in the District’s
financial position, identify material deviations from the approved budget, and highlight significant issues
in the individual funds. The Management’s Discussion and Analysis (MD&A) is intended to highlight
significant transactions, events, and conditions and should be considered in conjunction with the District’s
financial statements and notes to financial statements found immediately following the MD&A.
FINANCIAL HIGHLIGHTS
Key financial highlights for the 2017-18 fiscal year are as follows:
The District’s total assets and deferred outflows of resources exceeded total liabilities and deferred
inflows of resources at June 30, 2018, by $541,568,780 (net position). After deducting investment
in capital assets (net of related debt) and restricted net position, the District had a deficit
unrestricted net position of $84,129,442.
In total, the District’s net position increased $54,536,601, which represents a 11 percent increase
from the 2016-17 fiscal year. This increase is mainly due to an increase in the District’s investment
in capital assets.
The District’s total government-wide revenues of $437,163,612 were comprised of general
revenues of $391,044,856, or 89 percent of total government-wide revenues, and program specific
revenues from charges for services, operating grants and contributions, and capital grants and
contributions of $46,118,756, or 11 percent of total government-wide revenues. This compares to
the prior fiscal year with government-wide revenues of $423,283,248, which were comprised of
general revenues of $369,498,136, or 87 percent of total government-wide revenues, and charges
for services, operating grants and contributions, and capital grants and contributions of
$53,785,112, or 13 percent of total government-wide revenues.
The District’s total expenses for governmental activities of $382,627,011 were offset by program
specific revenues of $46,118,756. The remaining expenses were funded from general revenues
and fund balance. In the prior fiscal year, total expenses of $361,548,555 were offset with program
specific revenues of $53,785,112 with the remaining expenses funded from general revenues and
fund balance.
2017-18 Final AFR, St. Johns County Schools September 2018 Page 4 of 132

EXHIBIT A-1 Page 1
2
The District’s governmental funds reported a combined ending fund balance of $178,391,592, a
decrease of $7,921,525, or 4 percent, in the 2017-18 fiscal year in comparison with the prior fiscal
year’s balance of $186,313,117.
The General Fund total fund balance was $54,931,346 as of June 30, 2018, and represents an
increase of $7,104,024, or 15 percent, as compared to the prior fiscal year’s balance of
$47,827,322.
The assigned and unassigned fund balance of the General Fund, which represents net current
financial resources available for general appropriation by the Board, totaled $43,087,755 at
June 30, 2018, or 14 percent, of total general revenues. For the 2016-17 fiscal year, the assigned
and unassigned fund balance in the General Fund was $37,422,204, or 13 percent of total General
Fund revenues.
The District’s investment in capital assets (net of accumulated depreciation) increased by
$41,967,788, or 7 percent, from its balance of $583,479,978 at June 30, 2017, to $625,447,766 at
June 30, 2018, mainly due to the construction of Palm Valley Academy and Freedom Crossing
Academy.
The District’s capital asset-related long-term debt decreased by a net amount of $21,165,431, or
14 percent, from its balance of $147,900,811 at June 30, 2017, to $126,735,380 at June 30, 2018,
mainly due to the redemption of debt principal.
2017-18 Final AFR, St. Johns County Schools September 2018 Page 5 of 132

EXHIBIT A-1 Page 1
3
The Primary Government financial overview for the 2016-17 and 2017-18 fiscal years is shown below:
OVERVIEW OF FINANCIAL STATEMENTS
The basic financial statements consist of three components:
Government-Wide Financial Statements;
Fund Financial Statements; and
Notes to Financial Statements.
This report also includes required supplementary information intended to furnish additional details to
support the basic financial statements.
$-
$200,000,000
$400,000,000
$600,000,000
$800,000,000
$1,000,000,000
$1,200,000,000
Assets & DeferredOutflows
Liabilities & DeferredInflows
Net Position Program Revenues General Revenues Expenses
Primary Government Financial Overview
2017 2018
2017-18 Final AFR, St. Johns County Schools September 2018 Page 6 of 132

EXHIBIT A-1 Page 1
4
Government-Wide Financial Statements
The government-wide financial statements provide both short term and long term information about the
District’s overall financial condition, in a manner similar to those of a private-sector business. These
include a statement of net position and a statement of activities that are designed to provide consolidated
financial information about the governmental activities of the District presented on the accrual basis of
accounting, specifically:
The statement of net position provides information about the District’s financial position, its assets
and liabilities, and deferred inflows/outflows of resources, using an economic resources
measurement focus. Assets and deferred outflows of resources less liabilities and deferred
inflows of resources, equals net position, which is a measure of the District’s financial health.
The statement of activities presents information about the change in the District’s net
position and the results of operations during the fiscal year. An increase or decrease in net
position is an indication of whether the District’s financial health is improving or deteriorating.
The government-wide statements present the District’s activities in the following categories:
Governmental activities – This represents most of the District’s services, including its educational
programs: basic, vocational, adult, and exceptional education. Support functions such as
transportation and administration are also included. Local property taxes and the State’s
education finance program provide most of the resources that support these activities.
Component units – The District presents aggregate financial information for the St. Johns County
Education Foundation, Inc. D/B/A INK! (Foundation); St. Augustine Public Montessori School,
operated by St. Augustine Montessori Community, Inc.; and the Therapeutic Learning Center
Charter School along with St. Johns Community Campus Charter School, both of which are
operated by The Arc of the St. Johns, Inc. Although legally separate organizations, the
component units are included in this report because they meet the criteria for inclusion provided
by generally accepted accounting principles. Financial information for these component units is
reported separately from the financial information presented for the primary government.
The St. Johns County School Board Leasing Corporation (Leasing Corporation), although also a
legally separate entity, was formed to facilitate financing for the acquisition of facilities and
equipment for the District. Due to the substantive economic relationship between the District and
the Leasing Corporation, the Leasing Corporation has been included as an integral part of the
primary government.
2017-18 Final AFR, St. Johns County Schools September 2018 Page 7 of 132

EXHIBIT A-1 Page 1
5
Fund Financial Statements
Fund financial statements are one of the components of the basic financial statements. A fund is a
grouping of related accounts that is used to maintain control over resources that have been segregated
for specific activities or objectives. The District uses fund accounting to ensure and demonstrate
compliance with finance-related legal requirements and prudent fiscal management. Certain funds are
established by law while others are created by legal agreements, such as bond covenants. Fund financial
statements provide more detailed information about the District’s financial activities, focusing on its most
significant or “major” funds rather than fund types. This is in contrast to the entitywide perspective
contained in the government-wide statements. All of the District’s funds may be classified within one of
the broad categories discussed below.
Governmental Funds: Governmental funds are used to account for essentially the same functions
reported as governmental activities in the government-wide financial statements. However, unlike the
government-wide financial statements, governmental fund financial statements focus on near term
inflows and outflows of spendable resources, as well as on balances of spendable resources available
at the end of the fiscal year. Such information may be useful in assessing a government’s near term
financing requirements.
Because the focus of governmental funds is narrower than that of the government-wide financial
statements, it is useful to compare the information presented for governmental funds with similar
information presented for governmental activities in the government-wide financial statements. By doing
so, readers may better understand the long term impact of the government’s near term financing
decisions. Both the governmental funds balance sheet and the governmental funds statement of
revenues, expenditures, and changes in fund balances provide a reconciliation to facilitate this
comparison between governmental funds and governmental activities.
The governmental funds balance sheet and statement of revenues, expenditures, and changes in fund
balances provide detailed information about the District’s most significant funds. The District’s major
funds are the General Fund, Debt Service – Other Debt Service Fund, Capital Projects – Section
1011.14/1011.15 Loan Fund, Capital Projects – Local Capital Improvement Fund, and Capital Projects –
Other Capital Projects Fund. Data from the other governmental funds are combined into a single,
aggregated presentation.
The District adopts an annual appropriated budget for its governmental funds. A budgetary comparison
schedule is provided in the required supplementary information for the General Fund to demonstrate
compliance with its budget.
Proprietary Funds: Proprietary funds may be established to account for activities in which a fee is
charged for services. Internal Service Funds are used to accumulate and allocate costs internally among
2017-18 Final AFR, St. Johns County Schools September 2018 Page 8 of 132

EXHIBIT A-1 Page 1
6
the District’s various functions. The District used its Internal Service Funds to account for
its self-insurance programs, which includes group medical, dental, and vision coverages, and its workers’
compensation program. The District’s Internal Service Funds are included within governmental activities
in the government-wide financial statements because the services predominantly benefit the District’s
governmental activities.
Fiduciary Funds: Fiduciary funds are used to report assets held in a trustee or fiduciary capacity for the
benefit of external parties, such as school and student activity funds. Fiduciary funds are not reflected in
the government-wide statements because the resources are not available to support the District’s own
programs. In its fiduciary capacity, the District is responsible for ensuring that the assets reported in
these funds are used only for their intended purposes.
The District uses agency funds to account for resources held for student activities and groups.
Notes to Financial Statements
The notes provide additional information that is essential for a full understanding of the data provided in
the government-wide and fund financial statements.
Other Information
In addition to the basic financial statements and accompanying notes, this report also presents required
supplementary information concerning the District’s net pension liability and its progress in funding its
obligation to provide other postemployment benefits to its employees.
2017-18 Final AFR, St. Johns County Schools September 2018 Page 9 of 132

EXHIBIT A-1 Page 1
7
GOVERNMENT-WIDE FINANCIAL ANALYSIS
As noted earlier, net position over time may serve as a useful indicator of a government’s financial health.
The following is a summary of the District’s net position as of June 30, 2018, compared to net position as
of June 30, 2017:
The largest portion of the District’s net position is investment in capital assets (e.g., land; buildings;
furniture, fixtures, and equipment), less any related debt still outstanding. The District uses these capital
assets to provide education and related services to the students of St. Johns County, Florida;
consequently, these assets are not available for future spending. Although the investment in capital
assets is reported net of related debt, the resources used to repay the debt must be provided from other
sources, since the capital assets cannot be used to liquidate these liabilities.
The restricted portion of the District’s net position represents resources that are subject to external
restrictions on how they may be used. The District’s deficit unrestricted net position was the result, in
part, of accruing long-term liabilities of $28,547,971 in compensated absences payable, $183,425,248 in
6/30/18 6/30/17
Current and Other Assets 265,153,998$ 250,234,958$
Capital Assets 625,447,766 583,479,978
Total Assets 890,601,764 833,714,936
Deferred Outflows of Resources 84,066,760 73,667,222
Long-Term Liabilities 369,079,608 402,608,209
Other Liabilities 50,577,714 37,268,129
Total Liabilities 419,657,322 439,876,338
Deferred Inflows of Resources 13,442,422 3,387,255
Net Position:
Net Investment in Capital Assets 499,241,608 454,071,103
Restricted 126,456,614 122,864,096
Unrestricted (Deficit) (84,129,442) (112,816,634)
Total Net Position 541,568,780$ 464,118,565$
Net Position, End of Year
Governmental
Activities
2017-18 Final AFR, St. Johns County Schools September 2018 Page 10 of 132

EXHIBIT A-1 Page 1
8
net pension liability, and $30,120,974 in other postemployment benefits payable. These long-term
liabilities are funded on a pay-as-you-go basis.
The District’s total net position increased by $54,536,601 during the 2017-18 fiscal year. This increase
mainly represents the degree to which ongoing revenues have exceeded ongoing expenses. Details of
the revenues and expenses composing the increase are as follows:
2017-18 Final AFR, St. Johns County Schools September 2018 Page 11 of 132
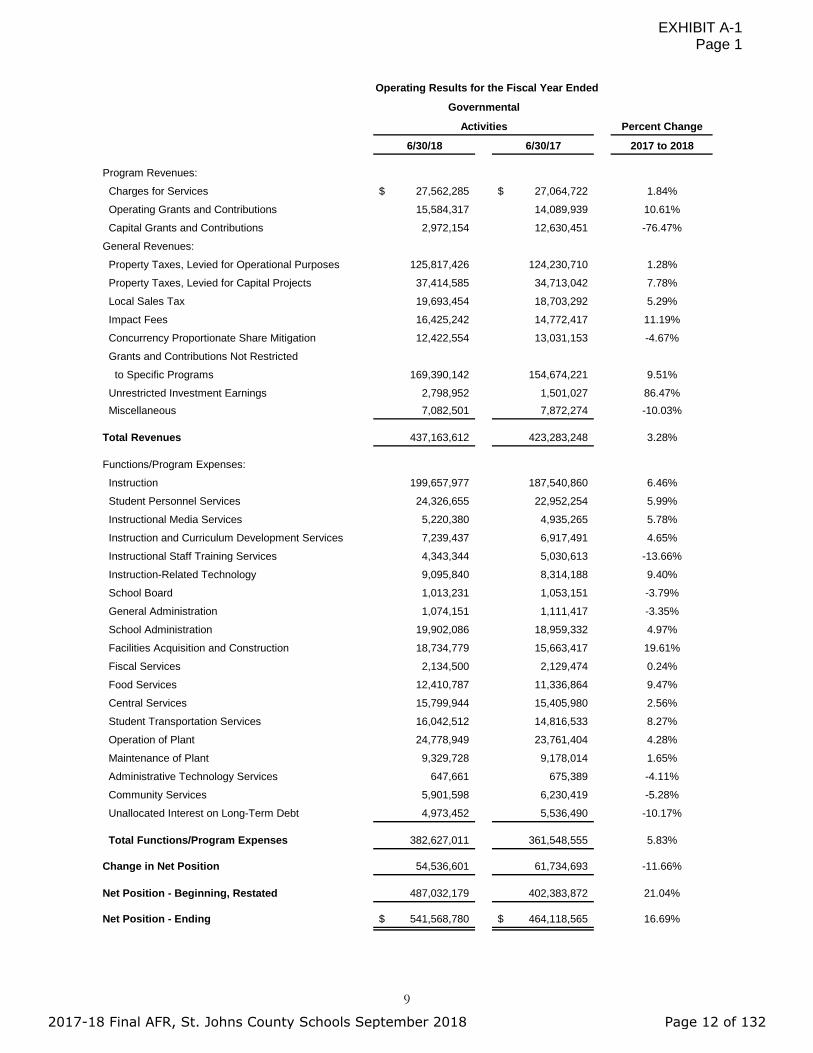
EXHIBIT A-1 Page 1
9
Operating Results for the Fiscal Year Ended
Percent Change
6/30/18 6/30/17 2017 to 2018
Program Revenues:
Charges for Services 27,562,285$ 27,064,722$ 1.84%
Operating Grants and Contributions 15,584,317 14,089,939 10.61%
Capital Grants and Contributions 2,972,154 12,630,451 -76.47%
General Revenues:
Property Taxes, Levied for Operational Purposes 125,817,426 124,230,710 1.28%
Property Taxes, Levied for Capital Projects 37,414,585 34,713,042 7.78%
Local Sales Tax 19,693,454 18,703,292 5.29%
Impact Fees 16,425,242 14,772,417 11.19%
Concurrency Proportionate Share Mitigation 12,422,554 13,031,153 -4.67%
Grants and Contributions Not Restricted
to Specific Programs 169,390,142 154,674,221 9.51%
Unrestricted Investment Earnings 2,798,952 1,501,027 86.47% Miscellaneous 7,082,501 7,872,274 -10.03%
Total Revenues 437,163,612 423,283,248 3.28%
Functions/Program Expenses:
Instruction 199,657,977 187,540,860 6.46%
Student Personnel Services 24,326,655 22,952,254 5.99%
Instructional Media Services 5,220,380 4,935,265 5.78%
Instruction and Curriculum Development Services 7,239,437 6,917,491 4.65%
Instructional Staff Training Services 4,343,344 5,030,613 -13.66%
Instruction-Related Technology 9,095,840 8,314,188 9.40%
School Board 1,013,231 1,053,151 -3.79%
General Administration 1,074,151 1,111,417 -3.35%
School Administration 19,902,086 18,959,332 4.97%
Facilities Acquisition and Construction 18,734,779 15,663,417 19.61%
Fiscal Services 2,134,500 2,129,474 0.24%
Food Services 12,410,787 11,336,864 9.47%
Central Services 15,799,944 15,405,980 2.56%
Student Transportation Services 16,042,512 14,816,533 8.27%
Operation of Plant 24,778,949 23,761,404 4.28%
Maintenance of Plant 9,329,728 9,178,014 1.65%
Administrative Technology Services 647,661 675,389 -4.11%
Community Services 5,901,598 6,230,419 -5.28%
Unallocated Interest on Long-Term Debt 4,973,452 5,536,490 -10.17%
Total Functions/Program Expenses 382,627,011 361,548,555 5.83%
Change in Net Position 54,536,601 61,734,693 -11.66%
Net Position - Beginning, Restated 487,032,179 402,383,872 21.04%
Net Position - Ending 541,568,780$ 464,118,565$ 16.69%
Governmental
Activities
2017-18 Final AFR, St. Johns County Schools September 2018 Page 12 of 132

EXHIBIT A-1 Page 1
10
Governmental Activities Revenue by Source – Statement of Activities
Charges for Services6.3%
Operating Grants and Contributions
3.6%
Capital Grants and Contributions0.7%
Property Taxes, Levied for Operational Purposes
28.8%
Property Taxes, Levied for Capital Projects
8.6%
Local Sales Tax4.5%Impact Fees
3.8%
Concurrency Proportionate Share Mitigation
2.8%
Grants and Contributions Not Restricted to Specific Programs
38.7%
Unrestricted Investment Earnings0.6%
Miscellaneous1.6%
2018
Charges for Services6.4%
Operating Grants and Contributions
3.3%
Capital Grants and Contributions3.0%
Property Taxes, Levied for Operational Purposes
29.3%
Property Taxes, Levied for Capital Projects
8.2%Local Sales Tax
4.4%Impact Fees
3.5%
Concurrency Proportionate Share Mitigation
3.1%
Grants and Contributions Not Restricted to Specific Programs
36.5%
Unrestricted Investment Earnings0.4%
Miscellaneous1.9%
2017
2017-18 Final AFR, St. Johns County Schools September 2018 Page 13 of 132

EXHIBIT A-1 Page 1
11
Governmental Activities Expenses by Major Function – Statement of Activities
Instruction52.2%Student and Instructional
Support Services13.1%
General Support Services31.9%
Community Services1.5%
Unallocated Interest on Long-Term Debt
1.3%
2018
Instruction51.9%Student and Instructional
Support Services13.3%
General Support Services31.6%
Community Services1.7%
Unallocated Interest on Long-Term Debt
1.5%
2017
2017-18 Final AFR, St. Johns County Schools September 2018 Page 14 of 132
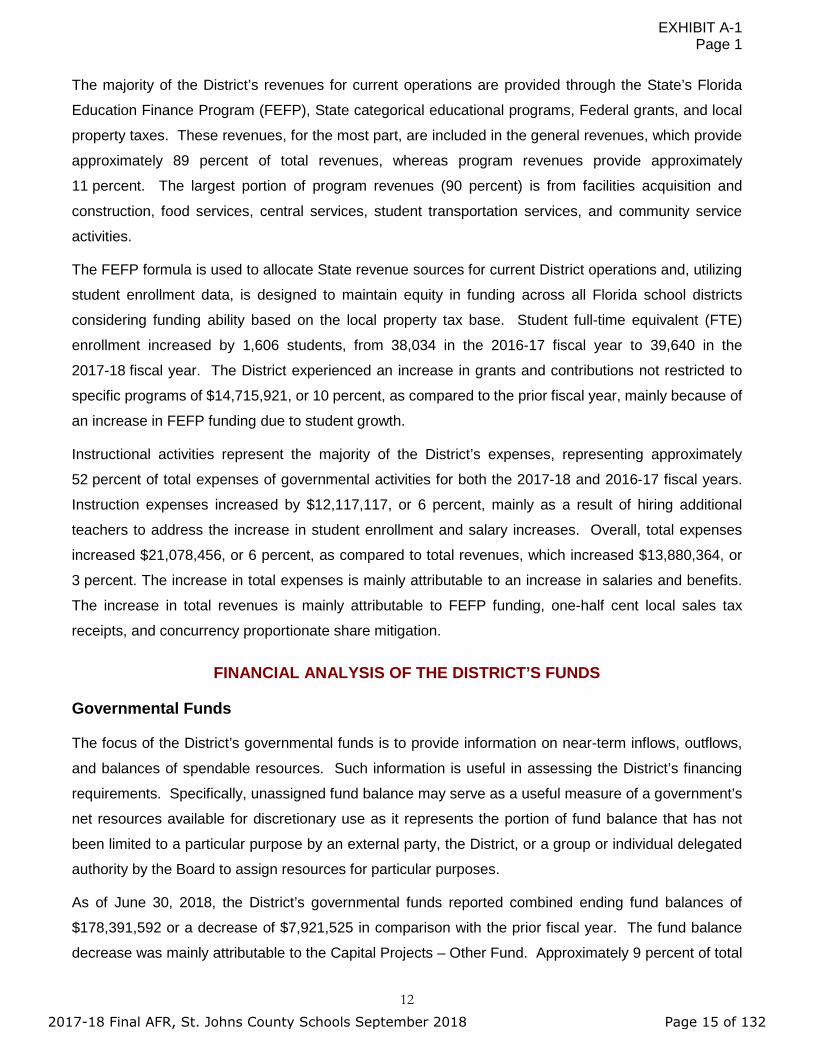
EXHIBIT A-1 Page 1
12
The majority of the District’s revenues for current operations are provided through the State’s Florida
Education Finance Program (FEFP), State categorical educational programs, Federal grants, and local
property taxes. These revenues, for the most part, are included in the general revenues, which provide
approximately 89 percent of total revenues, whereas program revenues provide approximately
11 percent. The largest portion of program revenues (90 percent) is from facilities acquisition and
construction, food services, central services, student transportation services, and community service
activities.
The FEFP formula is used to allocate State revenue sources for current District operations and, utilizing
student enrollment data, is designed to maintain equity in funding across all Florida school districts
considering funding ability based on the local property tax base. Student full-time equivalent (FTE)
enrollment increased by 1,606 students, from 38,034 in the 2016-17 fiscal year to 39,640 in the
2017-18 fiscal year. The District experienced an increase in grants and contributions not restricted to
specific programs of $14,715,921, or 10 percent, as compared to the prior fiscal year, mainly because of
an increase in FEFP funding due to student growth.
Instructional activities represent the majority of the District’s expenses, representing approximately
52 percent of total expenses of governmental activities for both the 2017-18 and 2016-17 fiscal years.
Instruction expenses increased by $12,117,117, or 6 percent, mainly as a result of hiring additional
teachers to address the increase in student enrollment and salary increases. Overall, total expenses
increased $21,078,456, or 6 percent, as compared to total revenues, which increased $13,880,364, or
3 percent. The increase in total expenses is mainly attributable to an increase in salaries and benefits.
The increase in total revenues is mainly attributable to FEFP funding, one-half cent local sales tax
receipts, and concurrency proportionate share mitigation.
FINANCIAL ANALYSIS OF THE DISTRICT’S FUNDS
Governmental Funds
The focus of the District’s governmental funds is to provide information on near-term inflows, outflows,
and balances of spendable resources. Such information is useful in assessing the District’s financing
requirements. Specifically, unassigned fund balance may serve as a useful measure of a government’s
net resources available for discretionary use as it represents the portion of fund balance that has not
been limited to a particular purpose by an external party, the District, or a group or individual delegated
authority by the Board to assign resources for particular purposes.
As of June 30, 2018, the District’s governmental funds reported combined ending fund balances of
$178,391,592 or a decrease of $7,921,525 in comparison with the prior fiscal year. The fund balance
decrease was mainly attributable to the Capital Projects – Other Fund. Approximately 9 percent of total
2017-18 Final AFR, St. Johns County Schools September 2018 Page 15 of 132

EXHIBIT A-1 Page 1
13
fund balance, or $15,164,837, is unassigned, which is available for spending at the District’s discretion.
The governmental fund balance can be broken down as follows: $1,097,187 as nonspendable,
$125,038,029 as restricted, $9,200,723 as committed, and $27,890,816 as assigned.
Major Governmental Funds
The General Fund is the District’s chief operating fund. At the end of the current fiscal year, unassigned
fund balance was $15,196,939 and assigned fund balance was $27,890,816, while the total fund balance
was $54,931,346. The District’s General Fund’s total fund balance for the 2017-18 fiscal year increased
by $7,104,024 or 15 percent, as compared to the prior year. This increase is a result of measures
implemented by the District to reduce expenditures including, but not limited, to the reduction of
administrative staff and delaying filling vacant positions.
Key factors for understanding this increase are as follows:
Total revenues increased by $17,926,923, or 6 percent, mainly from an increase in property taxes
and State funding related to increases in enrollment.
Total expenditures increased by $14,566,308, or 5 percent, due mainly to increased salary and
benefit costs.
Transfers in were comparable to prior year.
The Debt Service – Other Debt Service Fund is used to account for financial resources used to pay debt
service principal, interest, and related costs for the certificates of participation and sales tax revenue
bonds. For the 2017-18 fiscal year, the total fund balance increased by $63,647 in the current fiscal year
to $4,786,086, at June 30, 2018.
The Capital Projects – Section 1011.14/1011.15 Loan Fund is used to account for the financial resources
generated by the District’s Revenue Anticipation Note, Series 2018, that was undertaken for the
acquisition, construction, installation and equipping of various capital improvements related to
educational facilities, including, but not limited to, the renovation and expansion of Mill Creek Elementary
Fund Balance 2018 2017Increase
(Decrease)Percentage
Change
Major Governmental Funds: General Fund 54,931,346$ 47,827,322$ 7,104,024$ 14.85% Debt Service - Other Debt Service Fund 4,786,086 4,722,439 63,647 1.35% Captial Projects - Section 1011.14/1011.15 Loan Fund (264,060) - (264,060) 0.00% Capital Projects - Local Capital Improvement Fund 26,645,446 26,685,434 (39,988) -0.15% Capital Projects - Other Capital Projects Fund 81,115,449 97,054,039 (15,938,590) -16.42% Other Governmental Fund (nonmajor) 11,177,325 10,023,883 1,153,442 11.51%Total Fund Balances 178,391,592$ 186,313,117$ (7,921,525)$ 11.14%
2017-18 Final AFR, St. Johns County Schools September 2018 Page 16 of 132
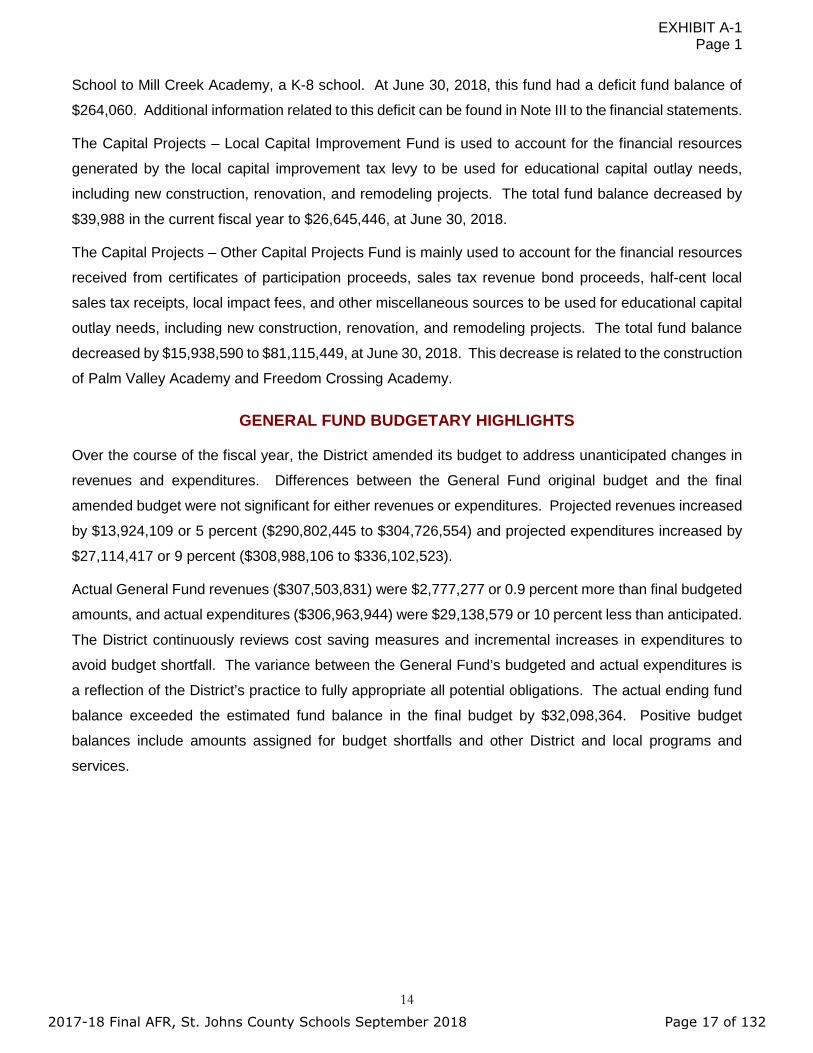
EXHIBIT A-1 Page 1
14
School to Mill Creek Academy, a K-8 school. At June 30, 2018, this fund had a deficit fund balance of
$264,060. Additional information related to this deficit can be found in Note III to the financial statements.
The Capital Projects – Local Capital Improvement Fund is used to account for the financial resources
generated by the local capital improvement tax levy to be used for educational capital outlay needs,
including new construction, renovation, and remodeling projects. The total fund balance decreased by
$39,988 in the current fiscal year to $26,645,446, at June 30, 2018.
The Capital Projects – Other Capital Projects Fund is mainly used to account for the financial resources
received from certificates of participation proceeds, sales tax revenue bond proceeds, half-cent local
sales tax receipts, local impact fees, and other miscellaneous sources to be used for educational capital
outlay needs, including new construction, renovation, and remodeling projects. The total fund balance
decreased by $15,938,590 to $81,115,449, at June 30, 2018. This decrease is related to the construction
of Palm Valley Academy and Freedom Crossing Academy.
GENERAL FUND BUDGETARY HIGHLIGHTS
Over the course of the fiscal year, the District amended its budget to address unanticipated changes in
revenues and expenditures. Differences between the General Fund original budget and the final
amended budget were not significant for either revenues or expenditures. Projected revenues increased
by $13,924,109 or 5 percent ($290,802,445 to $304,726,554) and projected expenditures increased by
$27,114,417 or 9 percent ($308,988,106 to $336,102,523).
Actual General Fund revenues ($307,503,831) were $2,777,277 or 0.9 percent more than final budgeted
amounts, and actual expenditures ($306,963,944) were $29,138,579 or 10 percent less than anticipated.
The District continuously reviews cost saving measures and incremental increases in expenditures to
avoid budget shortfall. The variance between the General Fund’s budgeted and actual expenditures is
a reflection of the District’s practice to fully appropriate all potential obligations. The actual ending fund
balance exceeded the estimated fund balance in the final budget by $32,098,364. Positive budget
balances include amounts assigned for budget shortfalls and other District and local programs and
services.
2017-18 Final AFR, St. Johns County Schools September 2018 Page 17 of 132

EXHIBIT A-1 Page 1
15
CAPITAL ASSETS AND LONG-TERM DEBT
Capital Assets
The District’s investment in capital assets (net of accumulated depreciation) as of June 30, 2018, totaled
$625,447,766. The capital assets include land; construction in progress; improvements other than
buildings; buildings and fixed equipment; furniture, fixtures, and equipment; motor vehicles; and audio
visual materials and computer software.
Major capital asset additions during the current fiscal year included construction of Palm Valley Academy
and Freedom Crossing Academy.
Additional information on the District’s capital assets can be found in Notes I.F.5, IV.D and IV.H to the
financial statements.
Long-Term Debt
The District had total long-term debt outstanding of $126,735,380 at the end of the current fiscal year
related to the construction and acquisition of capital assets. This debt consisted of $81,452,976 of
Certificates of Participation, $42,197,404 of District Sales Tax Revenue Bonds, and $3,085,000 of State
School Bonds. The District’s long-term debt decreased a net amount of $21,165,431, or 14 percent,
mainly from the redemption of debt principal.
Additional information on the District’s long-term debt can be found in Notes I.F.7, and IV.J.1 through
IV.J.3 to the financial statements.
REQUESTS FOR INFORMATION
This financial report is designed to provide a general overview of the St. Johns County School District’s
finances. Questions concerning any of the information provided in this report or requests for additional
financial information should be addressed to the Chief Financial Officer, St. Johns County School District,
40 Orange Street, St. Augustine, FL 32084.
2017-18 Final AFR, St. Johns County Schools September 2018 Page 18 of 132
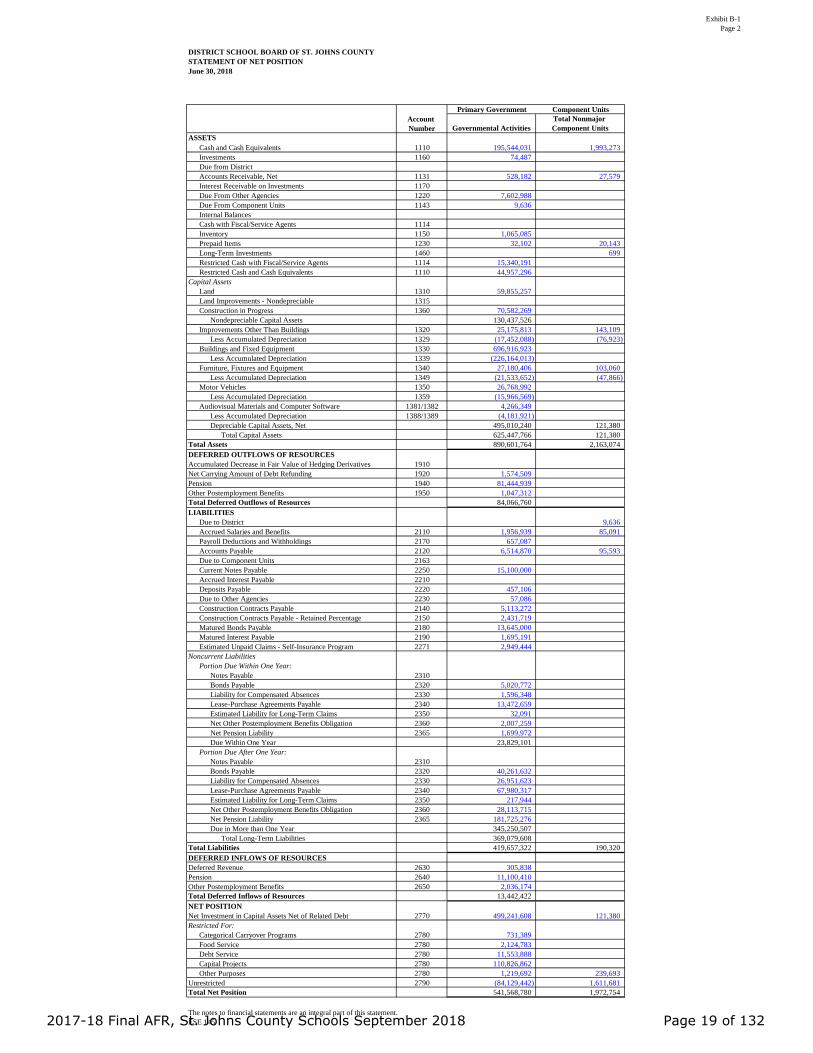
Exhibit B-1Page 2
DISTRICT SCHOOL BOARD OF ST. JOHNS COUNTYSTATEMENT OF NET POSITIONJune 30, 2018
Governmental ActivitiesTotal Nonmajor Component Units
ASSETS Cash and Cash Equivalents 1110 195,544,031 1,993,273Investments 1160 74,487 Due from District Accounts Receivable, Net 1131 528,182 27,579Interest Receivable on Investments 1170 Due From Other Agencies 1220 7,602,988 Due From Component Units 1143 9,636 Internal Balances Cash with Fiscal/Service Agents 1114 Inventory 1150 1,065,085 Prepaid Items 1230 32,102 20,143Long-Term Investments 1460 699Restricted Cash with Fiscal/Service Agents 1114 15,340,191 Restricted Cash and Cash Equivalents 1110 44,957,296
Capital AssetsLand 1310 59,855,257 Land Improvements - Nondepreciable 1315 Construction in Progress 1360 70,582,269
Nondepreciable Capital Assets 130,437,526 Improvements Other Than Buildings 1320 25,175,813 143,109
Less Accumulated Depreciation 1329 (17,452,088) (76,923)Buildings and Fixed Equipment 1330 696,916,923
Less Accumulated Depreciation 1339 (226,164,013) Furniture, Fixtures and Equipment 1340 27,180,406 103,060
Less Accumulated Depreciation 1349 (21,533,652) (47,866)Motor Vehicles 1350 26,768,992
Less Accumulated Depreciation 1359 (15,966,569) Audiovisual Materials and Computer Software 1381/1382 4,266,349
Less Accumulated Depreciation 1388/1389 (4,181,921) Depreciable Capital Assets, Net 495,010,240 121,380
Total Capital Assets 625,447,766 121,380Total Assets 890,601,764 2,163,074DEFERRED OUTFLOWS OF RESOURCESAccumulated Decrease in Fair Value of Hedging Derivatives 1910 Net Carrying Amount of Debt Refunding 1920 1,574,509 Pension 1940 81,444,939 Other Postemployment Benefits 1950 1,047,312 Total Deferred Outflows of Resources 84,066,760 LIABILITIES
Due to District 9,636Accrued Salaries and Benefits 2110 1,956,939 85,091Payroll Deductions and Withholdings 2170 657,087 Accounts Payable 2120 6,514,870 95,593Due to Component Units 2163 Current Notes Payable 2250 15,100,000 Accrued Interest Payable 2210 Deposits Payable 2220 457,106 Due to Other Agencies 2230 57,086 Construction Contracts Payable 2140 5,113,272 Construction Contracts Payable - Retained Percentage 2150 2,431,719 Matured Bonds Payable 2180 13,645,000 Matured Interest Payable 2190 1,695,191 Estimated Unpaid Claims - Self-Insurance Program 2271 2,949,444
Noncurrent LiabilitiesPortion Due Within One Year:
Notes Payable 2310 Bonds Payable 2320 5,020,772 Liability for Compensated Absences 2330 1,596,348 Lease-Purchase Agreements Payable 2340 13,472,659 Estimated Liability for Long-Term Claims 2350 32,091 Net Other Postemployment Benefits Obligation 2360 2,007,259 Net Pension Liability 2365 1,699,972 Due Within One Year 23,829,101
Portion Due After One Year:Notes Payable 2310 Bonds Payable 2320 40,261,632 Liability for Compensated Absences 2330 26,951,623 Lease-Purchase Agreements Payable 2340 67,980,317 Estimated Liability for Long-Term Claims 2350 217,944 Net Other Postemployment Benefits Obligation 2360 28,113,715 Net Pension Liability 2365 181,725,276 Due in More than One Year 345,250,507
Total Long-Term Liabilities 369,079,608 Total Liabilities 419,657,322 190,320DEFERRED INFLOWS OF RESOURCESDeferred Revenue 2630 305,838 Pension 2640 11,100,410 Other Postemployment Benefits 2650 2,036,174 Total Deferred Inflows of Resources 13,442,422 NET POSITIONNet Investment in Capital Assets Net of Related Debt 2770 499,241,608 121,380Restricted For:
Categorical Carryover Programs 2780 731,389 Food Service 2780 2,124,783 Debt Service 2780 11,553,888 Capital Projects 2780 110,826,862 Other Purposes 2780 1,219,692 239,693
Unrestricted 2790 (84,129,442) 1,611,681Total Net Position 541,568,780 1,972,754
The notes to financial statements are an integral part of this statement.ESE 145
Primary Government Component UnitsAccount Number
2017-18 Final AFR, St. Johns County Schools September 2018 Page 19 of 132

Exhibit B-2Page 3
DISTRICT SCHOOL BOARD OF ST. JOHNS COUNTYSTATEMENT OF ACTIVITIESFor the Fiscal Year Ended June 30, 2018
GovernmentalActivities
Business-TypeActivities Total
Governmental Activities:Instruction 5000 199,657,977 2,773,576 (196,884,401) (196,884,401)Student Support Services 6100 24,326,655 (24,326,655) (24,326,655)Instructional Media Services 6200 5,220,380 (5,220,380) (5,220,380)Instruction and Curriculum Development Services 6300 7,239,437 (7,239,437) (7,239,437)Instructional Staff Training Services 6400 4,343,344 (4,343,344) (4,343,344)Instruction-Related Technology 6500 9,095,840 (9,095,840) (9,095,840)Board 7100 1,013,231 (1,013,231) (1,013,231)General Administration 7200 1,074,151 (1,074,151) (1,074,151)School Administration 7300 19,902,086 (19,902,086) (19,902,086)Facilities Acquisition and Construction 7400 18,734,779 1,265,555 (17,469,224) (17,469,224)Fiscal Services 7500 2,134,500 (2,134,500) (2,134,500)Food Services 7600 12,410,787 6,999,606 6,033,764 622,583 622,583Central Services 7700 15,799,944 11,619,739 (4,180,205) (4,180,205)Student Transportation Services 7800 16,042,512 691,665 9,550,553 (5,800,294) (5,800,294)Operation of Plant 7900 24,778,949 (24,778,949) (24,778,949)Maintenance of Plant 8100 9,329,728 (9,329,728) (9,329,728)Administrative Technology Services 8200 647,661 (647,661) (647,661)Community Services 9100 5,901,598 5,477,699 (423,899) (423,899)Interest on Long-Term Debt 9200 4,973,452 1,706,599 (3,266,853) (3,266,853)Unallocated Depreciation/Amortization Expense
Total Governmental Activities 382,627,011 27,562,285 15,584,317 2,972,154 (336,508,255) (336,508,255)Business-type Activities:
Self-Insurance Consortium Daycare Operations Other Business-Type Activity
Total Business-Type Activities 0 0 0 0 0Total Primary Government 382,627,011 27,562,285 15,584,317 2,972,154 (336,508,255) (336,508,255)Component Units:
Major Component Unit Name 0 0 0 0 0Major Component Unit Name 0 0 0 0 0Total Nonmajor Component Units 2,852,729 12,437 1,293,837 90,866 (1,455,589)
Total Component Units 2,852,729 12,437 1,293,837 90,866 (1,455,589)
General Revenues:Taxes:
Property Taxes, Levied for Operational Purposes 125,817,426 125,817,426Property Taxes, Levied for Debt ServiceProperty Taxes, Levied for Capital Projects 37,414,585 37,414,585Local Sales Taxes 19,693,454 19,693,454
Grants and Contributions Not Restricted to Specific Programs 169,390,142 169,390,142 1,467,680Investment Earnings 2,798,952 2,798,952 1,369Miscellaneous 7,082,501 7,082,501Impact Fees 16,425,242 16,425,242Proportionate Share Concurrency 12,422,554 12,422,554TransfersTotal General Revenues, Special Items, Extraordinary Items and Transfers 391,044,856 391,044,856 1,469,049Change in Net Position 54,536,601 54,536,601 13,460Net Position, July 1, 2017 464,118,565 464,118,565 1,959,294Adjustments to Net Position 22,913,614 22,913,614Net Position, June 30, 2018 541,568,780 541,568,780 1,972,754
The notes to financial statements are an integral part of this statement.ESE 145
Expenses
Net (Expense) Revenue and Changes in Net PositionPrimary Government
Program Revenues
ComponentUnitsFUNCTIONS
AccountNumber
Charges forServices
OperatingGrants and
Contributions
CapitalGrants and
Contributions
2017-18 Final AFR, St. Johns County Schools September 2018 Page 20 of 132
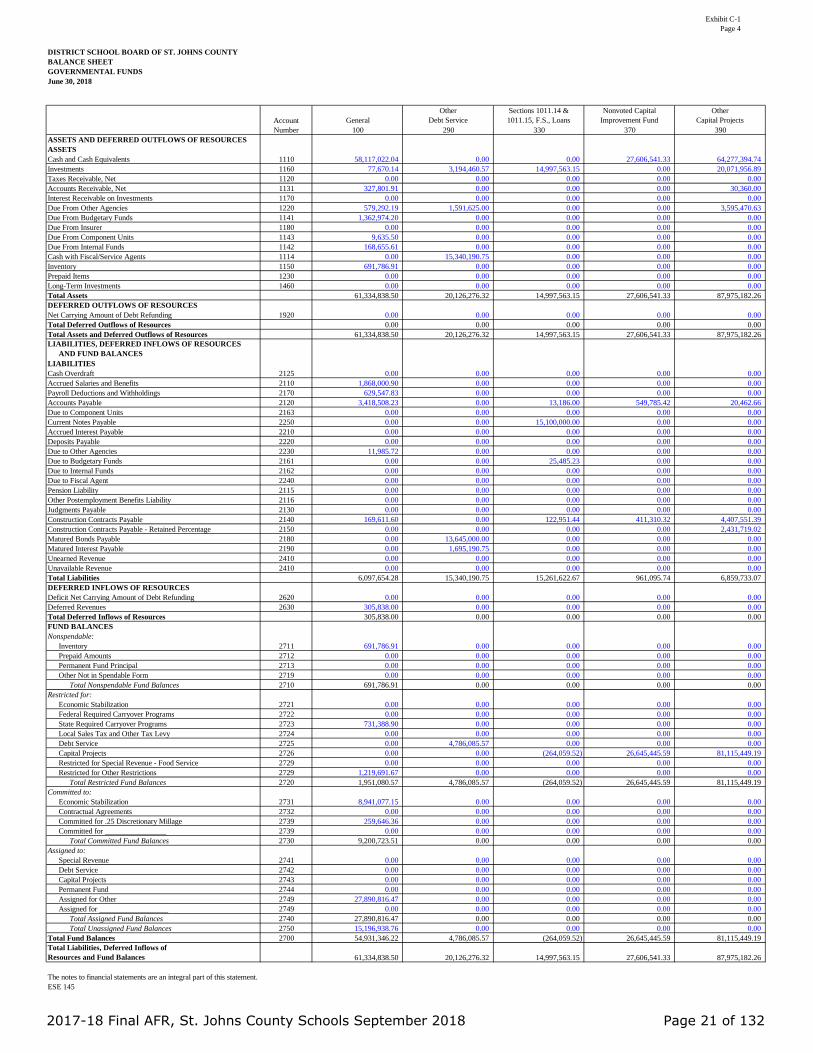
Exhibit C-1Page 4
DISTRICT SCHOOL BOARD OF ST. JOHNS COUNTYBALANCE SHEETGOVERNMENTAL FUNDSJune 30, 2018
GeneralOther
Debt ServiceSections 1011.14 &1011.15, F.S., Loans
Nonvoted CapitalImprovement Fund
OtherCapital Projects
100 290 330 370 390ASSETS AND DEFERRED OUTFLOWS OF RESOURCESASSETSCash and Cash Equivalents 1110 58,117,022.04 0.00 0.00 27,606,541.33 64,277,394.74Investments 1160 77,670.14 3,194,460.57 14,997,563.15 0.00 20,071,956.89Taxes Receivable, Net 1120 0.00 0.00 0.00 0.00 0.00Accounts Receivable, Net 1131 327,801.91 0.00 0.00 0.00 30,360.00Interest Receivable on Investments 1170 0.00 0.00 0.00 0.00 0.00Due From Other Agencies 1220 579,292.19 1,591,625.00 0.00 0.00 3,595,470.63Due From Budgetary Funds 1141 1,362,974.20 0.00 0.00 0.00 0.00Due From Insurer 1180 0.00 0.00 0.00 0.00 0.00Due From Component Units 1143 9,635.50 0.00 0.00 0.00 0.00Due From Internal Funds 1142 168,655.61 0.00 0.00 0.00 0.00Cash with Fiscal/Service Agents 1114 0.00 15,340,190.75 0.00 0.00 0.00Inventory 1150 691,786.91 0.00 0.00 0.00 0.00Prepaid Items 1230 0.00 0.00 0.00 0.00 0.00Long-Term Investments 1460 0.00 0.00 0.00 0.00 0.00Total Assets 61,334,838.50 20,126,276.32 14,997,563.15 27,606,541.33 87,975,182.26DEFERRED OUTFLOWS OF RESOURCESNet Carrying Amount of Debt Refunding 1920 0.00 0.00 0.00 0.00 0.00Total Deferred Outflows of Resources 0.00 0.00 0.00 0.00 0.00Total Assets and Deferred Outflows of Resources 61,334,838.50 20,126,276.32 14,997,563.15 27,606,541.33 87,975,182.26LIABILITIES, DEFERRED INFLOWS OF RESOURCES
AND FUND BALANCESLIABILITIES Cash Overdraft 2125 0.00 0.00 0.00 0.00 0.00Accrued Salaries and Benefits 2110 1,868,000.90 0.00 0.00 0.00 0.00Payroll Deductions and Withholdings 2170 629,547.83 0.00 0.00 0.00 0.00Accounts Payable 2120 3,418,508.23 0.00 13,186.00 549,785.42 20,462.66Due to Component Units 2163 0.00 0.00 0.00 0.00 0.00Current Notes Payable 2250 0.00 0.00 15,100,000.00 0.00 0.00Accrued Interest Payable 2210 0.00 0.00 0.00 0.00 0.00Deposits Payable 2220 0.00 0.00 0.00 0.00 0.00Due to Other Agencies 2230 11,985.72 0.00 0.00 0.00 0.00Due to Budgetary Funds 2161 0.00 0.00 25,485.23 0.00 0.00Due to Internal Funds 2162 0.00 0.00 0.00 0.00 0.00Due to Fiscal Agent 2240 0.00 0.00 0.00 0.00 0.00Pension Liability 2115 0.00 0.00 0.00 0.00 0.00Other Postemployment Benefits Liability 2116 0.00 0.00 0.00 0.00 0.00Judgments Payable 2130 0.00 0.00 0.00 0.00 0.00Construction Contracts Payable 2140 169,611.60 0.00 122,951.44 411,310.32 4,407,551.39Construction Contracts Payable - Retained Percentage 2150 0.00 0.00 0.00 0.00 2,431,719.02Matured Bonds Payable 2180 0.00 13,645,000.00 0.00 0.00 0.00Matured Interest Payable 2190 0.00 1,695,190.75 0.00 0.00 0.00Unearned Revenue 2410 0.00 0.00 0.00 0.00 0.00Unavailable Revenue 2410 0.00 0.00 0.00 0.00 0.00Total Liabilities 6,097,654.28 15,340,190.75 15,261,622.67 961,095.74 6,859,733.07DEFERRED INFLOWS OF RESOURCESDeficit Net Carrying Amount of Debt Refunding 2620 0.00 0.00 0.00 0.00 0.00Deferred Revenues 2630 305,838.00 0.00 0.00 0.00 0.00Total Deferred Inflows of Resources 305,838.00 0.00 0.00 0.00 0.00FUND BALANCESNonspendable:
Inventory 2711 691,786.91 0.00 0.00 0.00 0.00Prepaid Amounts 2712 0.00 0.00 0.00 0.00 0.00Permanent Fund Principal 2713 0.00 0.00 0.00 0.00 0.00Other Not in Spendable Form 2719 0.00 0.00 0.00 0.00 0.00
Total Nonspendable Fund Balances 2710 691,786.91 0.00 0.00 0.00 0.00Restricted for:
Economic Stabilization 2721 0.00 0.00 0.00 0.00 0.00Federal Required Carryover Programs 2722 0.00 0.00 0.00 0.00 0.00State Required Carryover Programs 2723 731,388.90 0.00 0.00 0.00 0.00Local Sales Tax and Other Tax Levy 2724 0.00 0.00 0.00 0.00 0.00Debt Service 2725 0.00 4,786,085.57 0.00 0.00 0.00Capital Projects 2726 0.00 0.00 (264,059.52) 26,645,445.59 81,115,449.19Restricted for Special Revenue - Food Service 2729 0.00 0.00 0.00 0.00 0.00Restricted for Other Restrictions 2729 1,219,691.67 0.00 0.00 0.00 0.00
Total Restricted Fund Balances 2720 1,951,080.57 4,786,085.57 (264,059.52) 26,645,445.59 81,115,449.19Committed to:
Economic Stabilization 2731 8,941,077.15 0.00 0.00 0.00 0.00Contractual Agreements 2732 0.00 0.00 0.00 0.00 0.00Committed for .25 Discretionary Millage 2739 259,646.36 0.00 0.00 0.00 0.00Committed for ________________ 2739 0.00 0.00 0.00 0.00 0.00
Total Committed Fund Balances 2730 9,200,723.51 0.00 0.00 0.00 0.00Assigned to:
Special Revenue 2741 0.00 0.00 0.00 0.00 0.00Debt Service 2742 0.00 0.00 0.00 0.00 0.00Capital Projects 2743 0.00 0.00 0.00 0.00 0.00Permanent Fund 2744 0.00 0.00 0.00 0.00 0.00Assigned for Other 2749 27,890,816.47 0.00 0.00 0.00 0.00Assigned for __________________ 2749 0.00 0.00 0.00 0.00 0.00
Total Assigned Fund Balances 2740 27,890,816.47 0.00 0.00 0.00 0.00Total Unassigned Fund Balances 2750 15,196,938.76 0.00 0.00 0.00 0.00
Total Fund Balances 2700 54,931,346.22 4,786,085.57 (264,059.52) 26,645,445.59 81,115,449.19Total Liabilities, Deferred Inflows ofResources and Fund Balances 61,334,838.50 20,126,276.32 14,997,563.15 27,606,541.33 87,975,182.26
The notes to financial statements are an integral part of this statement.ESE 145
AccountNumber
2017-18 Final AFR, St. Johns County Schools September 2018 Page 21 of 132

Exhibit C-1Page 4
DISTRICT SCHOOL BOARD OF ST. JOHNS COUNTYBALANCE SHEETGOVERNMENTAL FUNDSJune 30, 2018
ASSETS AND DEFERRED OUTFLOWS OF RESOURCESASSETSCash and Cash Equivalents 1110Investments 1160Taxes Receivable, Net 1120Accounts Receivable, Net 1131Interest Receivable on Investments 1170Due From Other Agencies 1220Due From Budgetary Funds 1141Due From Insurer 1180Due From Component Units 1143Due From Internal Funds 1142Cash with Fiscal/Service Agents 1114Inventory 1150Prepaid Items 1230Long-Term Investments 1460Total AssetsDEFERRED OUTFLOWS OF RESOURCESNet Carrying Amount of Debt Refunding 1920Total Deferred Outflows of ResourcesTotal Assets and Deferred Outflows of ResourcesLIABILITIES, DEFERRED INFLOWS OF RESOURCES
AND FUND BALANCESLIABILITIES Cash Overdraft 2125Accrued Salaries and Benefits 2110Payroll Deductions and Withholdings 2170Accounts Payable 2120Due to Component Units 2163Current Notes Payable 2250Accrued Interest Payable 2210Deposits Payable 2220Due to Other Agencies 2230Due to Budgetary Funds 2161Due to Internal Funds 2162Due to Fiscal Agent 2240Pension Liability 2115Other Postemployment Benefits Liability 2116Judgments Payable 2130Construction Contracts Payable 2140Construction Contracts Payable - Retained Percentage 2150Matured Bonds Payable 2180Matured Interest Payable 2190Unearned Revenue 2410Unavailable Revenue 2410Total LiabilitiesDEFERRED INFLOWS OF RESOURCESDeficit Net Carrying Amount of Debt Refunding 2620Deferred Revenues 2630Total Deferred Inflows of ResourcesFUND BALANCESNonspendable:
Inventory 2711Prepaid Amounts 2712Permanent Fund Principal 2713Other Not in Spendable Form 2719
Total Nonspendable Fund Balances 2710Restricted for:
Economic Stabilization 2721Federal Required Carryover Programs 2722State Required Carryover Programs 2723Local Sales Tax and Other Tax Levy 2724Debt Service 2725Capital Projects 2726Restricted for Special Revenue - Food Service 2729Restricted for Other Restrictions 2729
Total Restricted Fund Balances 2720Committed to:
Economic Stabilization 2731Contractual Agreements 2732Committed for .25 Discretionary Millage 2739Committed for ________________ 2739
Total Committed Fund Balances 2730Assigned to:
Special Revenue 2741Debt Service 2742Capital Projects 2743Permanent Fund 2744Assigned for Other 2749Assigned for __________________ 2749
Total Assigned Fund Balances 2740Total Unassigned Fund Balances 2750
Total Fund Balances 2700Total Liabilities, Deferred Inflows ofResources and Fund Balances
The notes to financial statements are an integral part of this statement.ESE 145
AccountNumber
4,182,581.98 154,183,540.096,767,802.72 45,109,453.47
0.00 0.001,097.34 359,259.25
0.00 0.001,836,600.03 7,602,987.85
0.00 1,362,974.200.00 0.000.00 9,635.500.00 168,655.610.00 15,340,190.75
373,298.10 1,065,085.0132,101.76 32,101.76
0.00 0.0013,193,481.93 225,233,883.49
0.00 0.000.00 0.00
13,193,481.93 225,233,883.49
0.00 0.0087,367.62 1,955,368.5227,369.79 656,917.6259,876.56 4,061,818.87
0.00 0.000.00 15,100,000.000.00 0.00
457,105.89 457,105.8945,100.19 57,085.91
1,337,488.97 1,362,974.200.00 0.000.00 0.000.00 0.000.00 0.000.00 0.00
1,847.50 5,113,272.250.00 2,431,719.020.00 13,645,000.000.00 1,695,190.750.00 0.000.00 0.00
2,016,156.52 46,536,453.03
0.00 0.000.00 305,838.000.00 305,838.00
373,298.10 1,065,085.0132,101.76 32,101.76
0.00 0.000.00 0.00
405,399.86 1,097,186.77
0.00 0.000.00 0.000.00 731,388.900.00 0.00
6,767,802.72 11,553,888.292,284,739.48 109,781,574.741,751,485.11 1,751,485.11
0.00 1,219,691.6710,804,027.31 125,038,028.71
0.00 8,941,077.150.00 0.000.00 259,646.360.00 0.000.00 9,200,723.51
0.00 0.000.00 0.000.00 0.000.00 0.000.00 27,890,816.470.00 0.000.00 27,890,816.47
(32,101.76) 15,164,837.0011,177,325.41 178,391,592.46
13,193,481.93 225,233,883.49
OtherGovernmental
Funds
TotalGovernmental
Funds
2017-18 Final AFR, St. Johns County Schools September 2018 Page 22 of 132

Exhibit C-2Page 5
DISTRICT SCHOOL BOARD OF ST. JOHNS COUNTYRECONCILIATION OF THE GOVERNMENTAL FUNDS BALANCE SHEET
TO THE GOVERNMENT-WIDE STATEMENT OF NET POSITIONFor the Fiscal Year Ended June 30, 2018
Total Fund Balances - Governmental Funds 178,391,592
Amounts reported for governmental activities in the statement of net position are different because:
Capital assets, net of accumulated depreciation, used in governmental activities are not financial resources and, therefore, are not reported as assets in the governmental funds. 625,447,766
The difference between the acquisition price and the net carrying amount of refunded debt is reported as a deferredoutflows of resources in government-wide statements, but is not reported in the governmental funds. 1,574,509
Deferred outflows of resources and deferred inflows of resources related to pensions are applicable to future periods and;therefore, are reported in the statement of net position, but not in the governmental funds.
Deferred Outflows 81,444,939 Deferred Inflows (12,928,811) 68,516,128
Deferred outflows of resources and deferred inflows of resources related to other postemployment healthcare benefitscosts are applicable to future periods and; therefore, are reported in the statement of net position, but not in thegovernmental funds.
Deferred Outflows 1,047,312 Deferred Inflows (207,773) 839,539
Internal service funds are used by management to charge the costs of certain activities, such as insurance, to individualfunds. The assets and liabilities of the internal service funds are included in governmental activities in the satement ofnet position. 35,628,819
Long-term liabilities are not due and payable in the current period and, therefore, are not reported as liabilities in the governmental funds. Long-term liabilities at year-end consist of:
Bonds Payable (45,282,404) Certificates of Participation Payable (77,845,000)
Unamortized Premiums on Certificates of Participation (3,607,976) Compensated Absences Payable (28,547,971)
Postemployment Healthcare Benefits Payable (30,120,974) Net Pension Liability (183,425,248) (368,829,573)
Total Net Position - Governmental Activities 541,568,780
The accompanying notes to financial statements are an integral part of this statement.ESE 145
2017-18 Final AFR, St. Johns County Schools September 2018 Page 23 of 132
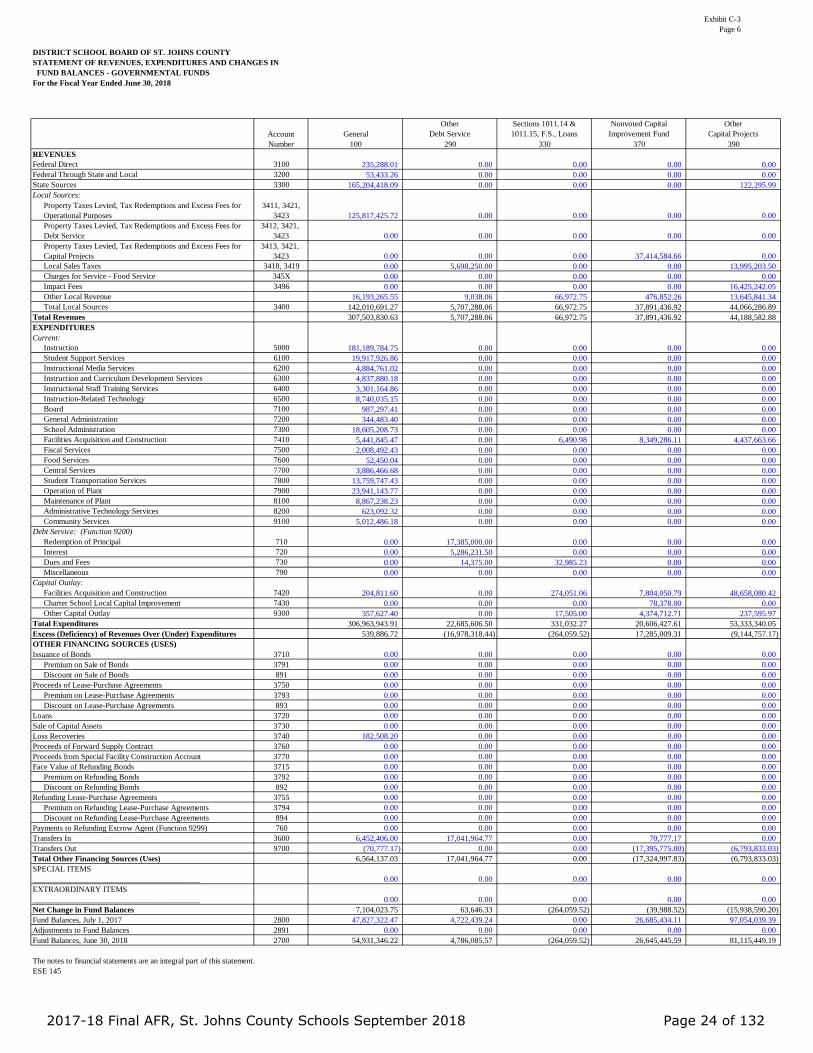
Exhibit C-3Page 6
DISTRICT SCHOOL BOARD OF ST. JOHNS COUNTYSTATEMENT OF REVENUES, EXPENDITURES AND CHANGES IN FUND BALANCES - GOVERNMENTAL FUNDSFor the Fiscal Year Ended June 30, 2018
GeneralOther
Debt ServiceSections 1011.14 &1011.15, F.S., Loans
Nonvoted CapitalImprovement Fund
OtherCapital Projects
100 290 330 370 390REVENUESFederal Direct 3100 235,288.01 0.00 0.00 0.00 0.00Federal Through State and Local 3200 53,433.26 0.00 0.00 0.00 0.00State Sources 3300 165,204,418.09 0.00 0.00 0.00 122,295.99Local Sources:
Property Taxes Levied, Tax Redemptions and Excess Fees for Operational Purposes
3411, 3421,3423 125,817,425.72 0.00 0.00 0.00 0.00
Property Taxes Levied, Tax Redemptions and Excess Fees for Debt Service
3412, 3421, 3423 0.00 0.00 0.00 0.00 0.00
Property Taxes Levied, Tax Redemptions and Excess Fees for Capital Projects
3413, 3421, 3423 0.00 0.00 0.00 37,414,584.66 0.00
Local Sales Taxes 3418, 3419 0.00 5,698,250.00 0.00 0.00 13,995,203.50Charges for Service - Food Service 345X 0.00 0.00 0.00 0.00 0.00Impact Fees 3496 0.00 0.00 0.00 0.00 16,425,242.05Other Local Revenue 16,193,265.55 9,038.06 66,972.75 476,852.26 13,645,841.34Total Local Sources 3400 142,010,691.27 5,707,288.06 66,972.75 37,891,436.92 44,066,286.89
Total Revenues 307,503,830.63 5,707,288.06 66,972.75 37,891,436.92 44,188,582.88EXPENDITURESCurrent:
Instruction 5000 181,189,784.75 0.00 0.00 0.00 0.00Student Support Services 6100 19,917,926.86 0.00 0.00 0.00 0.00Instructional Media Services 6200 4,884,761.02 0.00 0.00 0.00 0.00Instruction and Curriculum Development Services 6300 4,837,880.18 0.00 0.00 0.00 0.00Instructional Staff Training Services 6400 3,301,164.86 0.00 0.00 0.00 0.00Instruction-Related Technology 6500 8,740,035.15 0.00 0.00 0.00 0.00Board 7100 987,297.41 0.00 0.00 0.00 0.00General Administration 7200 344,483.40 0.00 0.00 0.00 0.00School Administration 7300 18,605,208.73 0.00 0.00 0.00 0.00Facilities Acquisition and Construction 7410 5,441,845.47 0.00 6,490.98 8,349,286.11 4,437,663.66Fiscal Services 7500 2,008,492.43 0.00 0.00 0.00 0.00Food Services 7600 52,450.04 0.00 0.00 0.00 0.00Central Services 7700 3,886,466.68 0.00 0.00 0.00 0.00Student Transportation Services 7800 13,759,747.43 0.00 0.00 0.00 0.00Operation of Plant 7900 23,941,143.77 0.00 0.00 0.00 0.00Maintenance of Plant 8100 8,867,238.23 0.00 0.00 0.00 0.00Administrative Technology Services 8200 623,092.32 0.00 0.00 0.00 0.00Community Services 9100 5,012,486.18 0.00 0.00 0.00 0.00
Debt Service: (Function 9200)Redemption of Principal 710 0.00 17,385,000.00 0.00 0.00 0.00Interest 720 0.00 5,286,231.50 0.00 0.00 0.00Dues and Fees 730 0.00 14,375.00 32,985.23 0.00 0.00Miscellaneous 790 0.00 0.00 0.00 0.00 0.00
Capital Outlay:Facilities Acquisition and Construction 7420 204,811.60 0.00 274,051.06 7,804,050.79 48,658,080.42Charter School Local Capital Improvement 7430 0.00 0.00 0.00 78,378.00 0.00Other Capital Outlay 9300 357,627.40 0.00 17,505.00 4,374,712.71 237,595.97
Total Expenditures 306,963,943.91 22,685,606.50 331,032.27 20,606,427.61 53,333,340.05Excess (Deficiency) of Revenues Over (Under) Expenditures 539,886.72 (16,978,318.44) (264,059.52) 17,285,009.31 (9,144,757.17)OTHER FINANCING SOURCES (USES)Issuance of Bonds 3710 0.00 0.00 0.00 0.00 0.00
Premium on Sale of Bonds 3791 0.00 0.00 0.00 0.00 0.00Discount on Sale of Bonds 891 0.00 0.00 0.00 0.00 0.00
Proceeds of Lease-Purchase Agreements 3750 0.00 0.00 0.00 0.00 0.00Premium on Lease-Purchase Agreements 3793 0.00 0.00 0.00 0.00 0.00Discount on Lease-Purchase Agreements 893 0.00 0.00 0.00 0.00 0.00
Loans 3720 0.00 0.00 0.00 0.00 0.00Sale of Capital Assets 3730 0.00 0.00 0.00 0.00 0.00Loss Recoveries 3740 182,508.20 0.00 0.00 0.00 0.00Proceeds of Forward Supply Contract 3760 0.00 0.00 0.00 0.00 0.00Proceeds from Special Facility Construction Account 3770 0.00 0.00 0.00 0.00 0.00Face Value of Refunding Bonds 3715 0.00 0.00 0.00 0.00 0.00
Premium on Refunding Bonds 3792 0.00 0.00 0.00 0.00 0.00Discount on Refunding Bonds 892 0.00 0.00 0.00 0.00 0.00
Refunding Lease-Purchase Agreements 3755 0.00 0.00 0.00 0.00 0.00Premium on Refunding Lease-Purchase Agreements 3794 0.00 0.00 0.00 0.00 0.00Discount on Refunding Lease-Purchase Agreements 894 0.00 0.00 0.00 0.00 0.00
Payments to Refunding Escrow Agent (Function 9299) 760 0.00 0.00 0.00 0.00 0.00Transfers In 3600 6,452,406.00 17,041,964.77 0.00 70,777.17 0.00Transfers Out 9700 (70,777.17) 0.00 0.00 (17,395,775.00) (6,793,833.03)Total Other Financing Sources (Uses) 6,564,137.03 17,041,964.77 0.00 (17,324,997.83) (6,793,833.03)SPECIAL ITEMS__________________________________________ 0.00 0.00 0.00 0.00 0.00EXTRAORDINARY ITEMS__________________________________________ 0.00 0.00 0.00 0.00 0.00Net Change in Fund Balances 7,104,023.75 63,646.33 (264,059.52) (39,988.52) (15,938,590.20)Fund Balances, July 1, 2017 2800 47,827,322.47 4,722,439.24 0.00 26,685,434.11 97,054,039.39Adjustments to Fund Balances 2891 0.00 0.00 0.00 0.00 0.00Fund Balances, June 30, 2018 2700 54,931,346.22 4,786,085.57 (264,059.52) 26,645,445.59 81,115,449.19
The notes to financial statements are an integral part of this statement.ESE 145
AccountNumber
2017-18 Final AFR, St. Johns County Schools September 2018 Page 24 of 132
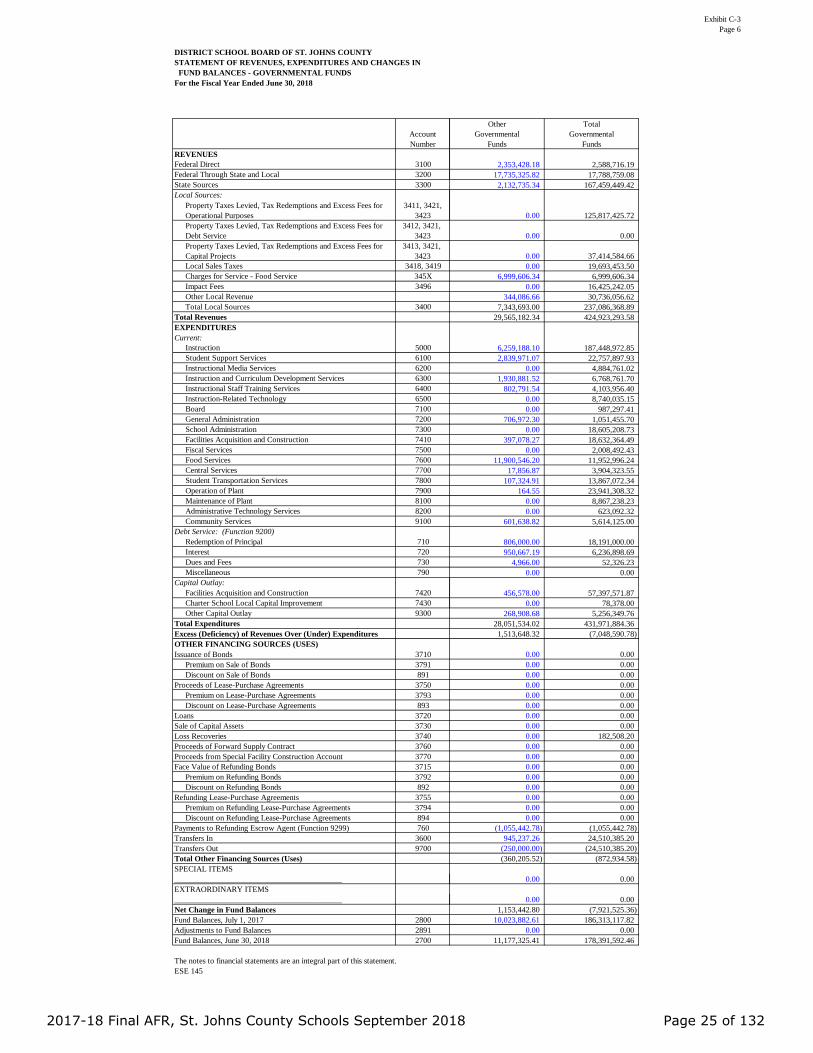
Exhibit C-3Page 6
DISTRICT SCHOOL BOARD OF ST. JOHNS COUNTYSTATEMENT OF REVENUES, EXPENDITURES AND CHANGES IN FUND BALANCES - GOVERNMENTAL FUNDSFor the Fiscal Year Ended June 30, 2018
REVENUESFederal Direct 3100Federal Through State and Local 3200State Sources 3300Local Sources:
Property Taxes Levied, Tax Redemptions and Excess Fees for Operational Purposes
3411, 3421,3423
Property Taxes Levied, Tax Redemptions and Excess Fees for Debt Service
3412, 3421, 3423
Property Taxes Levied, Tax Redemptions and Excess Fees for Capital Projects
3413, 3421, 3423
Local Sales Taxes 3418, 3419Charges for Service - Food Service 345XImpact Fees 3496Other Local RevenueTotal Local Sources 3400
Total Revenues EXPENDITURESCurrent:
Instruction 5000Student Support Services 6100Instructional Media Services 6200Instruction and Curriculum Development Services 6300Instructional Staff Training Services 6400Instruction-Related Technology 6500Board 7100General Administration 7200School Administration 7300Facilities Acquisition and Construction 7410Fiscal Services 7500Food Services 7600Central Services 7700Student Transportation Services 7800Operation of Plant 7900Maintenance of Plant 8100Administrative Technology Services 8200Community Services 9100
Debt Service: (Function 9200)Redemption of Principal 710Interest 720Dues and Fees 730Miscellaneous 790
Capital Outlay:Facilities Acquisition and Construction 7420Charter School Local Capital Improvement 7430Other Capital Outlay 9300
Total Expenditures Excess (Deficiency) of Revenues Over (Under) Expenditures OTHER FINANCING SOURCES (USES)Issuance of Bonds 3710
Premium on Sale of Bonds 3791Discount on Sale of Bonds 891
Proceeds of Lease-Purchase Agreements 3750Premium on Lease-Purchase Agreements 3793Discount on Lease-Purchase Agreements 893
Loans 3720Sale of Capital Assets 3730Loss Recoveries 3740Proceeds of Forward Supply Contract 3760Proceeds from Special Facility Construction Account 3770Face Value of Refunding Bonds 3715
Premium on Refunding Bonds 3792Discount on Refunding Bonds 892
Refunding Lease-Purchase Agreements 3755Premium on Refunding Lease-Purchase Agreements 3794Discount on Refunding Lease-Purchase Agreements 894
Payments to Refunding Escrow Agent (Function 9299) 760Transfers In 3600Transfers Out 9700Total Other Financing Sources (Uses) SPECIAL ITEMS__________________________________________EXTRAORDINARY ITEMS__________________________________________Net Change in Fund Balances Fund Balances, July 1, 2017 2800Adjustments to Fund Balances 2891Fund Balances, June 30, 2018 2700
The notes to financial statements are an integral part of this statement.ESE 145
AccountNumber
2,353,428.18 2,588,716.1917,735,325.82 17,788,759.082,132,735.34 167,459,449.42
0.00 125,817,425.72
0.00 0.00
0.00 37,414,584.660.00 19,693,453.50
6,999,606.34 6,999,606.340.00 16,425,242.05
344,086.66 30,736,056.627,343,693.00 237,086,368.89
29,565,182.34 424,923,293.58
6,259,188.10 187,448,972.852,839,971.07 22,757,897.93
0.00 4,884,761.021,930,881.52 6,768,761.70
802,791.54 4,103,956.400.00 8,740,035.150.00 987,297.41
706,972.30 1,051,455.700.00 18,605,208.73
397,078.27 18,632,364.490.00 2,008,492.43
11,900,546.20 11,952,996.2417,856.87 3,904,323.55
107,324.91 13,867,072.34164.55 23,941,308.32
0.00 8,867,238.230.00 623,092.32
601,638.82 5,614,125.00
806,000.00 18,191,000.00950,667.19 6,236,898.69
4,966.00 52,326.230.00 0.00
456,578.00 57,397,571.870.00 78,378.00
268,908.68 5,256,349.7628,051,534.02 431,971,884.361,513,648.32 (7,048,590.78)
0.00 0.000.00 0.000.00 0.000.00 0.000.00 0.000.00 0.000.00 0.000.00 0.000.00 182,508.200.00 0.000.00 0.000.00 0.000.00 0.000.00 0.000.00 0.000.00 0.000.00 0.00
(1,055,442.78) (1,055,442.78)945,237.26 24,510,385.20
(250,000.00) (24,510,385.20)(360,205.52) (872,934.58)
0.00 0.00
0.00 0.001,153,442.80 (7,921,525.36)
10,023,882.61 186,313,117.820.00 0.00
11,177,325.41 178,391,592.46
OtherGovernmental
Funds
TotalGovernmental
Funds
2017-18 Final AFR, St. Johns County Schools September 2018 Page 25 of 132

Exhibit C-4Page 7
DISTRICT SCHOOL BOARD OF ST. JOHNS COUNTYRECONCILIATION OF THE STATEMENT OF REVENUES, EXPENDITURESAND CHANGES IN FUND BALANCES OF GOVERNMENTAL FUNDS TO THE
GOVERNMENT-WIDE STATEMENT OF ACTIVITIESFor the Fiscal Year Ended June 30, 2018
Net Change in Fund Balances - Governmental Funds (7,921,525)
Amounts reported for governmental activities in the statement of activities are different because:
Capital outlays are reported in governmental funds as expenditures. However, in the statement of activities, the cost of those assets is allocated over their useful lives as depreciation expense. This is the amount of capital outlays and other capital outlay adjustments, in excess of depreciation expense in the current period:
Capital Outlay Expenditures 62,653,922 Depreciation Expense (20,795,823)
Other Donations and Adjustments 109,689 41,967,788
Issuing long-term bonded debt is an other financing source in the governmental funds, but issuing new debt increases long-term liabilities in the statement of net position. Refunding debt is an other financing use in the governmental funds, but decreases liabilities in the statement of net position. This is the amount of long-term debt that was issued and refunded during the current fiscal year.
State Board of Education Bonds Defeased 1,000,000 1,000,000
Repayment of long-term debt is an expenditure in the governmental funds, but the repayment reduces long-term liabilities in the statement of net assets. The following details the amount of long-term debt principal repaid in the current period:
Certificates of Participation Payable 13,645,000 Bonds Payable 4,546,000 18,191,000
Premiums on bond issues are amortized over the life of the debt in the statement of activities, but are reported as revenue in the governmental funds in the year debt is issued. This is the amount of the current amortization:
Certificates of Participation Payable 1,202,659 Sales Tax Revenue Bonds Payable 771,772 1,974,431
Loss on Refundings are amortized over the life of the debt in the statement of activities, but are reported as expenses in the governmental funds in the year debt is refunded. This is the amount of the loss and the current amortization: (524,837)
In the statement of activities, the cost of compensated absences is measured by the amounts earned during the year, while in the governmental funds, expenditures are recognized based on the amounts actually paid for the compensated absences. This is the net amount of compensated absences (i.e., vacation and sick leave) earned in excess of the amount used in the current period. (1,032,774)
Pension benefit costs are recorded in the statement of activities under the full accrual basis of accounting, but are recorded in the governmental funds when contributions to the plan are paid. This is the net amount of contributions made in excess of pension benefits earned during the period.
FRS Pension Contribution 11,585,668 HIS Pension Contribution 3,213,102
FRS Pension Expense (20,540,669) HIS Pension Expense (5,646,616) (11,388,515)
Other postemployment healthcare benefits costs are recorded in the statement of activities under the full accrual basis of accounting, but are not recorded in the governmental funds until paid. 2,897,766
Internal service funds are used by management to charge the cost of certain activities, such as insurance, to individual funds. The net revenue of internal service funds is reported with governmental activities. 9,373,267
Change in Net Position of Governmental Activities 54,536,601
The accompanying notes to financial statements are an integral part of this statement.ESE 145
2017-18 Final AFR, St. Johns County Schools September 2018 Page 26 of 132

Exhibit C-5Page 8
DISTRICT SCHOOL BOARD OF ST. JOHNS COUNTYSTATEMENT OF NET POSITIONPROPRIETARY FUNDSJune 30, 2018
ASSETS Cash and Cash Equivalents 1110 41,282,821.20Investments 1160 0.00Accounts Receivable, Net 1131 267.25
Capital Assets:Land 1310 0.00Land Improvements - Nondepreciable 1315 0.00Construction in Progress 1360 0.00
Nondepreciable Capital Assets 0.00Improvements Other Than Buildings 1320 0.00
Accumulated Depreciation 1329 0.00Buildings and Fixed Equipment 1330 299,292.00
Accumulated Depreciation 1339 (117,222.70)Furniture, Fixtures and Equipment 1340 153,700.00
Accumulated Depreciation 1349 (153,700.00)Motor Vehicles 1350 0.00
Accumulated Depreciation 1359 0.00Property Under Capital Leases 1370 0.00
Accumulated Depreciation 1379 0.00Computer Software 1382 0.00
Accumulated Amortization 1389 0.00Depreciable Capital Assets, Net 182,069.30
Total Capital Assets 182,069.30Total Assets 41,465,157.75DEFERRED OUTFLOWS OF RESOURCESAccumulated Decrease in Fair Value of Hedging Derivatives 1910 0.00Net Carrying Amount of Debt Refunding 1920 0.00Pension 1940 0.00Other Postemployment Benefits 1950 0.00Total Deferred Outflows of Resources 0.00LIABILITIES
Cash Overdraft 2125 0.00Accrued Salaries and Benefits 2110 1,570.15Payroll Deductions and Withholdings 2170 168.88Accounts Payable 2120 2,453,051.64Sales Tax Payable 2260 0.00Estimated Unpaid Claims - Self-Insurance Program 2271 3,199,479.00Estimated Liability for Claims Adjustment 2272 0.00Unearned Revenues 2410 0.00
Noncurrent LiabilitiesPortion Due Within One Year:
Obligations Under Capital Leases 2315 0.00Liability for Compensated Absences 2330 0.00Estimated Liability for Long-Term Claims 2350 0.00Net Other Postemployment Benefits Obligation 2360 0.00Net Pension Liability 2365 0.00Other Long-Term Liabilities 2380 0.00Due Within One Year 0.00
Portion Due After One Year:Obligations Under Capital Leases 2315 0.00Liability for Compensated Absences 2330 0.00Estimated Liability for Long-Term Claims 2350 0.00Net Other Postemployment Benefits Obligation 2360 0.00Net Pension Liability 2365 0.00Other Long-Term Liabilities 2380 0.00Due in More Than One Year 0.00
Total Long-Term Liabilities 0.00Total Liabilities 5,654,269.67DEFERRED INFLOWS OF RESOURCESAccumulated Increase in Fair Value of Hedging Derivatives 2610 0.00Deficit Net Carrying Amount of Debt Refunding 2620 0.00Deferred Revenues 2630 0.00Pension 2640 0.00Other Postemployment Benefits 2650 0.00Total Deferred Inflows of Resources 0.00NET POSITIONNet Investment in Capital Assets 2770 182,069.30Restricted for ____________________ 2780 0.00Unrestricted 2790 35,628,818.78Total Net Position 35,810,888.08
The notes to financial statements are an integral part of this statement.ESE 145
GovernmentalActivities -
Internal ServiceFunds
AccountNumber
2017-18 Final AFR, St. Johns County Schools September 2018 Page 27 of 132

Exhibit C-6Page 9
DISTRICT SCHOOL BOARD OF ST. JOHNS COUNTYSTATEMENT OF REVENUES, EXPENSES AND CHANGES IN FUND NET POSITIONPROPRIETARY FUNDSFor the Fiscal Year Ended June 30, 2018
OPERATING REVENUESCharges for Services 3481 0.00Charges for Sales 3482 0.00Premium Revenue 3484 53,514,932.12Other Operating Revenues 3489 2,131,933.49Total Operating Revenues 55,646,865.61OPERATING EXPENSESSalaries 100 279,966.79Employee Benefits 200 86,115.42Purchased Services 300 2,710,083.15Energy Services 400 12,198.18Materials and Supplies 500 1,328.12Capital Outlay 600 0.00Other 700 43,512,289.63Depreciation and Amortization Expense 780 20,453.88Total Operating Expenses 46,622,435.17Operating Income (Loss) 9,024,430.44NONOPERATING REVENUES (EXPENSES)Investment Income 3430 328,383.00Gifts, Grants and Bequests 3440 0.00Other Miscellaneous Local Sources 3495 0.00Loss Recoveries 3740 0.00Gain on Disposition of Assets 3780 0.00Interest 720 0.00Miscellaneous 790 0.00Loss on Disposition of Assets 810 0.00Total Nonoperating Revenues (Expenses) 328,383.00Income (Loss) Before Operating Transfers 9,352,813.44Transfers In 3600 0.00Transfers Out 9700 0.00SPECIAL ITEMS___________________________________________ 0.00EXTRAORDINARY ITEMS___________________________________________ 0.00Change In Net Position 9,352,813.44Net Position, July 1, 2017 2880 26,458,074.64Adjustments to Net Position 2896 0.00Net Position, June 30, 2018 2780 35,810,888.08
The notes to financial statements are an integral part of this statement.ESE 145
AccountNumber
GovernmentalActivities -
Internal ServiceFunds
2017-18 Final AFR, St. Johns County Schools September 2018 Page 28 of 132
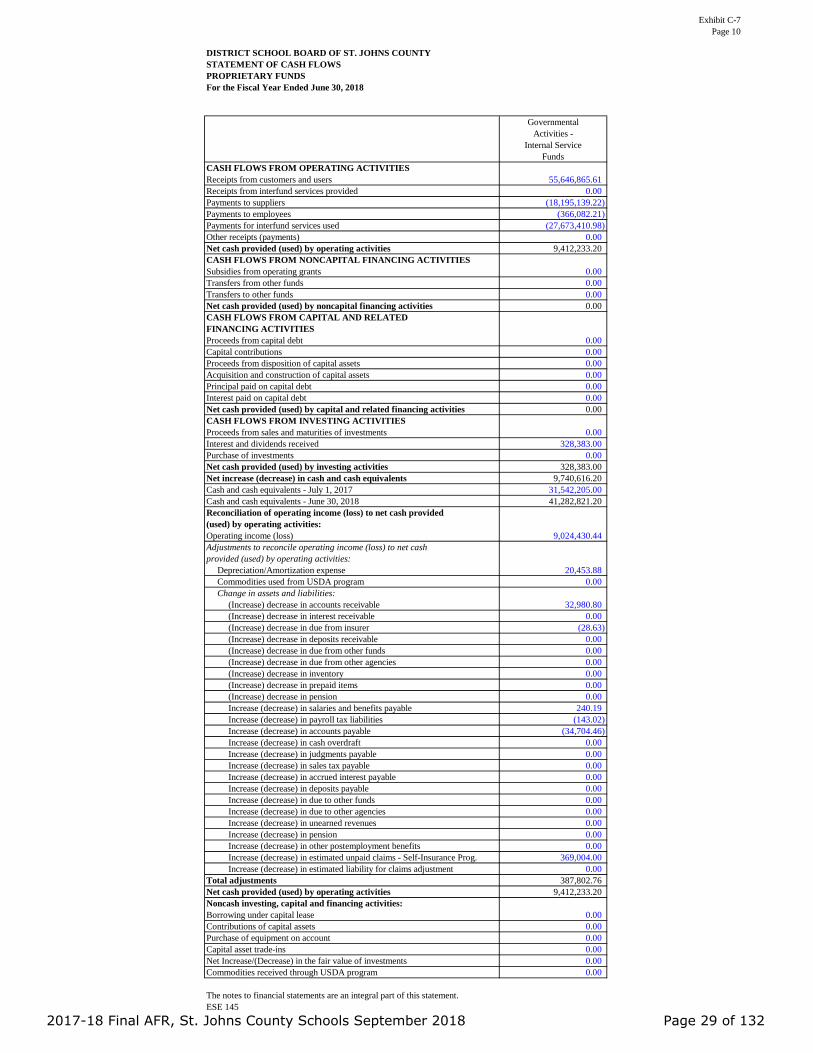
Exhibit C-7Page 10
DISTRICT SCHOOL BOARD OF ST. JOHNS COUNTYSTATEMENT OF CASH FLOWSPROPRIETARY FUNDSFor the Fiscal Year Ended June 30, 2018
CASH FLOWS FROM OPERATING ACTIVITIESReceipts from customers and users 55,646,865.61Receipts from interfund services provided 0.00Payments to suppliers (18,195,139.22)Payments to employees (366,082.21)Payments for interfund services used (27,673,410.98)Other receipts (payments) 0.00Net cash provided (used) by operating activities 9,412,233.20CASH FLOWS FROM NONCAPITAL FINANCING ACTIVITIESSubsidies from operating grants 0.00Transfers from other funds 0.00Transfers to other funds 0.00Net cash provided (used) by noncapital financing activities 0.00CASH FLOWS FROM CAPITAL AND RELATEDFINANCING ACTIVITIESProceeds from capital debt 0.00Capital contributions 0.00Proceeds from disposition of capital assets 0.00Acquisition and construction of capital assets 0.00Principal paid on capital debt 0.00Interest paid on capital debt 0.00Net cash provided (used) by capital and related financing activities 0.00CASH FLOWS FROM INVESTING ACTIVITIESProceeds from sales and maturities of investments 0.00Interest and dividends received 328,383.00Purchase of investments 0.00Net cash provided (used) by investing activities 328,383.00Net increase (decrease) in cash and cash equivalents 9,740,616.20Cash and cash equivalents - July 1, 2017 31,542,205.00Cash and cash equivalents - June 30, 2018 41,282,821.20Reconciliation of operating income (loss) to net cash provided (used) by operating activities:Operating income (loss) 9,024,430.44Adjustments to reconcile operating income (loss) to net cashprovided (used) by operating activities:
Depreciation/Amortization expense 20,453.88Commodities used from USDA program 0.00Change in assets and liabilities:
(Increase) decrease in accounts receivable 32,980.80(Increase) decrease in interest receivable 0.00(Increase) decrease in due from insurer (28.63)(Increase) decrease in deposits receivable 0.00(Increase) decrease in due from other funds 0.00(Increase) decrease in due from other agencies 0.00(Increase) decrease in inventory 0.00(Increase) decrease in prepaid items 0.00(Increase) decrease in pension 0.00Increase (decrease) in salaries and benefits payable 240.19Increase (decrease) in payroll tax liabilities (143.02)Increase (decrease) in accounts payable (34,704.46)Increase (decrease) in cash overdraft 0.00Increase (decrease) in judgments payable 0.00Increase (decrease) in sales tax payable 0.00Increase (decrease) in accrued interest payable 0.00Increase (decrease) in deposits payable 0.00Increase (decrease) in due to other funds 0.00Increase (decrease) in due to other agencies 0.00Increase (decrease) in unearned revenues 0.00Increase (decrease) in pension 0.00Increase (decrease) in other postemployment benefits 0.00Increase (decrease) in estimated unpaid claims - Self-Insurance Prog. 369,004.00Increase (decrease) in estimated liability for claims adjustment 0.00
Total adjustments 387,802.76Net cash provided (used) by operating activities 9,412,233.20Noncash investing, capital and financing activities:Borrowing under capital lease 0.00Contributions of capital assets 0.00Purchase of equipment on account 0.00Capital asset trade-ins 0.00Net Increase/(Decrease) in the fair value of investments 0.00Commodities received through USDA program 0.00
The notes to financial statements are an integral part of this statement.ESE 145
GovernmentalActivities -
Internal ServiceFunds
2017-18 Final AFR, St. Johns County Schools September 2018 Page 29 of 132

Exhibit C-8Page 11
DISTRICT SCHOOL BOARD OF ST. JOHNS COUNTYSTATEMENT OF FIDUCIARY ASSETS AND LIABILITIESFIDUCIARY FUNDSJune 30, 2018
Total Agency Funds89X
ASSETS Cash and Cash Equivalents 1110 4,667,889.00Investments 1160 0.00Accounts Receivable, Net 1131 0.00Pension Contributions Receivable 1132Interest Receivable on Investments 1170 0.00Due From Budgetary Funds 1141 0.00Due From Other Agencies 1220 0.00Inventory 1150 0.00Total Assets 4,667,889.00DEFERRED OUTFLOWS OF RESOURCESAccumulated Decrease in Fair Value of Hedging Derivatives 1910Pension 1940Other Postemployment Benefits 1950Total Deferred Outflows of ResourcesLIABILITIES Cash Overdraft 2125 0.00Accrued Salaries and Benefits 2110 0.00Payroll Deductions and Withholdings 2170 0.00Accounts Payable 2120 0.00Internal Accounts Payable 2290 4,499,233.39Due to Other Agencies 2230Due to Budgetary Funds 2161 168,655.61Total Liabilities 4,667,889.00DEFERRED INFLOWS OF RESOURCESAccumulated Increase in Fair Value of Hedging Derivatives 2610Pension 2640Other Postemployment Benefits 2650Total Deferred Inflows of ResourcesNET POSITIONHeld in Trust for Pension Benefits 2785Held in Trust for Other Purposes 2785Total Net Position
The notes to financial statements are an integral part of this statement.ESE 145
Account Number
2017-18 Final AFR, St. Johns County Schools September 2018 Page 30 of 132

Exhibit C-9Page 12
DISTRICT SCHOOL BOARD OF ST. JOHNS COUNTYSTATEMENT OF CHANGES IN FIDUCIARY NET POSITIONFIDUCIARY FUNDSFor the Fiscal Year Ended June 30, 2018
Total Investment Trust Funds
Total Private-Purpose Trust Funds Total Pension Trust Funds
84X 85X 87XADDITIONSContributions:
Employer 0.00 0.00 0.00Plan Members 0.00 0.00 0.00Gifts, Grants and Bequests 3440 0.00 0.00 0.00
Investment Income:Interest on Investments 3431 0.00 0.00 0.00Gain on Sale of Investments 3432 0.00 0.00 0.00Net Increase (Decrease) in the Fair Value of Investments 3433 0.00 0.00 0.00
Total Investment Income 0.00 0.00 0.00Less Investment Expense 0.00 0.00 0.00
Net Investment Income 0.00 0.00 0.00Total Additions 0.00 0.00 0.00DEDUCTIONSSalaries 100 0.00 0.00 0.00Employee Benefits 200 0.00 0.00 0.00Purchased Services 300 0.00 0.00 0.00Other 700 0.00 0.00 0.00Refunds of Contributions 0.00 0.00 0.00Administrative Expenses 0.00 0.00 0.00Total Deductions 0.00 0.00 0.00Change In Net Position 0.00 0.00 0.00Net Position Held In Trust, July 1, 2017 2885 0.00 0.00 0.00Adjustments to Net Position 2896 0.00 0.00 0.00Net Position Held in Trust for Pension Benefits and Other Purposes, June 30, 2018 2785 0.00 0.00 0.00
The notes to financial statements are an integral part of this statement.ESE 145
Account Number
2017-18 Final AFR, St. Johns County Schools September 2018 Page 31 of 132

Exhibit C-10Page 13
DISTRICT SCHOOL BOARD OF ST. JOHNS COUNTYCOMBINING STATEMENT OF NET POSITIONMAJOR AND NONMAJOR COMPONENT UNITSJune 30, 2018
Account Number
Total Nonmajor Component Units
ASSETS Cash and Cash Equivalents 1110 1,993,273.00Investments 1160 0.00Due From District 1143 0.00Accounts Receivable, Net 1131 27,579.00Interest Receivable on Investments 1170 0.00Due From Other Agencies 1220 0.00Due From Insurer 1180 0.00Deposits Receivable 1210 0.00Internal Balances 0.00Cash with Fiscal/Service Agents 1114 0.00Section 1011.13, F.S. Loan Proceeds 1420 0.00Inventory 1150 0.00Prepaid Items 1230 20,143.00Long-Term Investments 1460 699.00Prepaid Insurance Costs 1430 0.00Other Postemployment Benefits Asset 1410 0.00Pension Asset 1415 0.00
Capital Assets:Land 1310 0.00Land Improvements - Nondepreciable 1315 0.00Construction in Progress 1360 0.00
Nondepreciable Capital Assets 0.00Improvements Other Than Buildings 1320 143,109.00
Less Accumulated Depreciation 1329 (76,923.00)Buildings and Fixed Equipment 1330 0.00
Less Accumulated Depreciation 1339 0.00Furniture, Fixtures and Equipment 1340 103,060.00
Less Accumulated Depreciation 1349 (47,866.00)Motor Vehicles 1350 0.00
Less Accumulated Depreciation 1359 0.00Property Under Capital Leases 1370 0.00
Less Accumulated Depreciation 1379 0.00Audiovisual Materials 1381 0.00
Less Accumulated Depreciation 1388 0.00Computer Software 1382 0.00
Less Accumulated Amortization 1389 0.00Depreciable Capital Assets, Net 121,380.00
Total Capital Assets 121,380.00Total Assets 2,163,074.00DEFERRED OUTFLOWS OF RESOURCESAccumulated Decrease in Fair Value of Hedging Derivatives 1910 0.00Net Carrying Amount of Debt Refunding 1920 0.00Pension 1940 0.00Other Postemployment Benefits 1950 0.00Total Deferred Outflows of Resources 0.00LIABILITIES
Cash Overdraft 2125 0.00Accrued Salaries and Benefits 2110 85,091.00Payroll Deductions and Withholdings 2170 0.00Accounts Payable 2120 95,593.00Due to District 2163 9,636.00
Noncurrent LiabilitiesPortion Due Within One Year:
Notes Payable 2310 0.00Due Within One Year 0.00
Portion Due After One Year:Notes Payable 2310 0.00Due in More than One Year 0.00
Total Long-Term Liabilities 0.00Total Liabilities 190,320.00DEFERRED INFLOWS OF RESOURCESAccumulated Increase in Fair Value of Hedging Derivatives 2610 0.00Deficit Net Carrying Amount of Debt Refunding 2620 0.00Deferred Revenues 2630 0.00Pension 2640 0.00Other Postemployment Benefits 2650 0.00Total Deferred Inflows of Resources 0.00NET POSITIONNet Investment in Capital Assets 2770 121,380.00Restricted For:
Categorical Carryover Programs 2780 0.00Food Service 2780 0.00Debt Service 2780 0.00Capital Projects 2780 0.00Other Purposes 2780 239,693.00
Unrestricted 2790 1,611,681.00Total Net Position 1,972,754.00
The notes to financial statements are an integral part of this statement.ESE 145
2017-18 Final AFR, St. Johns County Schools September 2018 Page 32 of 132
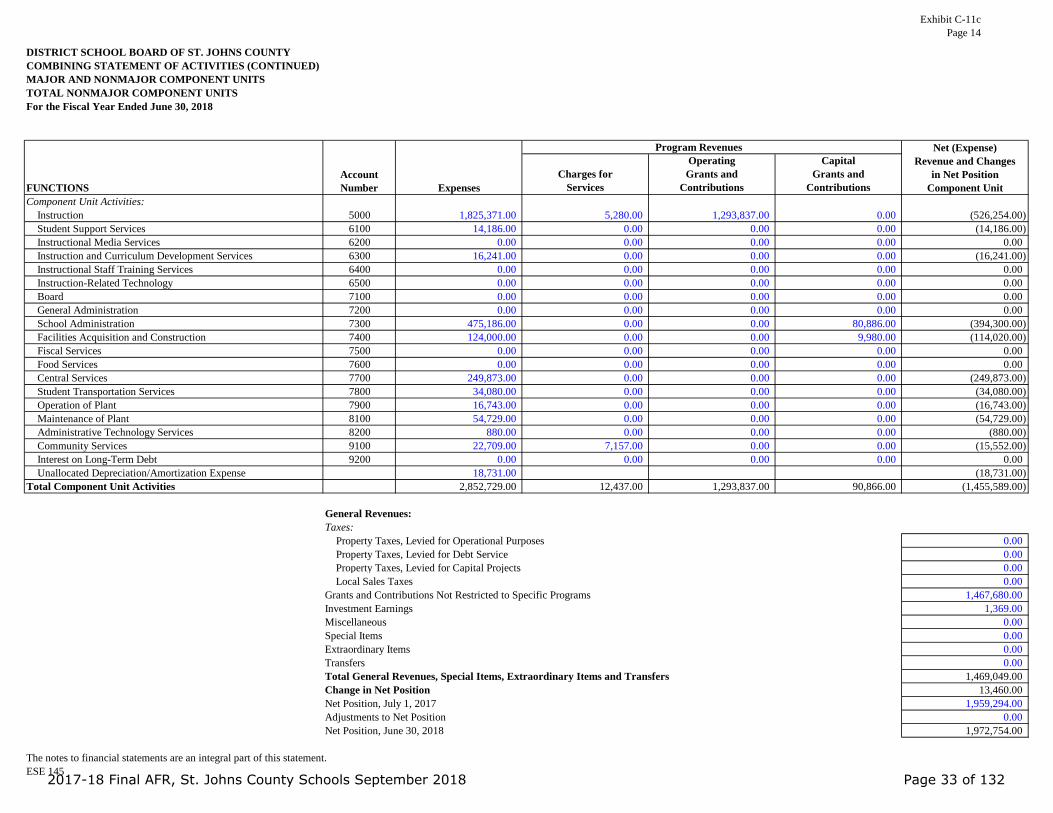
Exhibit C-11cPage 14
DISTRICT SCHOOL BOARD OF ST. JOHNS COUNTYCOMBINING STATEMENT OF ACTIVITIES (CONTINUED)MAJOR AND NONMAJOR COMPONENT UNITSTOTAL NONMAJOR COMPONENT UNITSFor the Fiscal Year Ended June 30, 2018
Charges forServices
OperatingGrants and
Contributions
CapitalGrants and
ContributionsComponent Unit Activities:
Instruction 5000 1,825,371.00 5,280.00 1,293,837.00 0.00 (526,254.00)Student Support Services 6100 14,186.00 0.00 0.00 0.00 (14,186.00)Instructional Media Services 6200 0.00 0.00 0.00 0.00 0.00Instruction and Curriculum Development Services 6300 16,241.00 0.00 0.00 0.00 (16,241.00)Instructional Staff Training Services 6400 0.00 0.00 0.00 0.00 0.00Instruction-Related Technology 6500 0.00 0.00 0.00 0.00 0.00Board 7100 0.00 0.00 0.00 0.00 0.00General Administration 7200 0.00 0.00 0.00 0.00 0.00School Administration 7300 475,186.00 0.00 0.00 80,886.00 (394,300.00)Facilities Acquisition and Construction 7400 124,000.00 0.00 0.00 9,980.00 (114,020.00)Fiscal Services 7500 0.00 0.00 0.00 0.00 0.00Food Services 7600 0.00 0.00 0.00 0.00 0.00Central Services 7700 249,873.00 0.00 0.00 0.00 (249,873.00)Student Transportation Services 7800 34,080.00 0.00 0.00 0.00 (34,080.00)Operation of Plant 7900 16,743.00 0.00 0.00 0.00 (16,743.00)Maintenance of Plant 8100 54,729.00 0.00 0.00 0.00 (54,729.00)Administrative Technology Services 8200 880.00 0.00 0.00 0.00 (880.00)Community Services 9100 22,709.00 7,157.00 0.00 0.00 (15,552.00)Interest on Long-Term Debt 9200 0.00 0.00 0.00 0.00 0.00Unallocated Depreciation/Amortization Expense 18,731.00 (18,731.00)
Total Component Unit Activities 2,852,729.00 12,437.00 1,293,837.00 90,866.00 (1,455,589.00)
General Revenues:Taxes:
Property Taxes, Levied for Operational Purposes 0.00Property Taxes, Levied for Debt Service 0.00Property Taxes, Levied for Capital Projects 0.00Local Sales Taxes 0.00
Grants and Contributions Not Restricted to Specific Programs 1,467,680.00Investment Earnings 1,369.00Miscellaneous 0.00Special Items 0.00Extraordinary Items 0.00Transfers 0.00Total General Revenues, Special Items, Extraordinary Items and Transfers 1,469,049.00Change in Net Position 13,460.00Net Position, July 1, 2017 1,959,294.00Adjustments to Net Position 0.00Net Position, June 30, 2018 1,972,754.00
The notes to financial statements are an integral part of this statement.ESE 145
FUNCTIONSAccountNumber Expenses
Program Revenues Net (Expense)Revenue and Changes
in Net PositionComponent Unit
2017-18 Final AFR, St. Johns County Schools September 2018 Page 33 of 132

Exhibit C-11dPage 15
DISTRICT SCHOOL BOARD OF ST. JOHNS COUNTYCOMBINING STATEMENT OF ACTIVITIESMAJOR AND NONMAJOR COMPONENT UNITSTOTAL COMPONENT UNITSFor the Fiscal Year Ended June 30, 2018
Charges forServices
OperatingGrants and
Contributions
CapitalGrants and
ContributionsComponent Unit Activities:
Instruction 5000 1,825,371.00 5,280.00 1,293,837.00 0.00 (526,254.00)Student Support Services 6100 14,186.00 0.00 0.00 0.00 (14,186.00)Instructional Media Services 6200 0.00 0.00 0.00 0.00 0.00Instruction and Curriculum Development Services 6300 16,241.00 0.00 0.00 0.00 (16,241.00)Instructional Staff Training Services 6400 0.00 0.00 0.00 0.00 0.00Instruction-Related Technology 6500 0.00 0.00 0.00 0.00 0.00Board 7100 0.00 0.00 0.00 0.00 0.00General Administration 7200 0.00 0.00 0.00 0.00 0.00School Administration 7300 475,186.00 0.00 0.00 80,886.00 (394,300.00)Facilities Acquisition and Construction 7400 124,000.00 0.00 0.00 9,980.00 (114,020.00)Fiscal Services 7500 0.00 0.00 0.00 0.00 0.00Food Services 7600 0.00 0.00 0.00 0.00 0.00Central Services 7700 249,873.00 0.00 0.00 0.00 (249,873.00)Student Transportation Services 7800 34,080.00 0.00 0.00 0.00 (34,080.00)Operation of Plant 7900 16,743.00 0.00 0.00 0.00 (16,743.00)Maintenance of Plant 8100 54,729.00 0.00 0.00 0.00 (54,729.00)Administrative Technology Services 8200 880.00 0.00 0.00 0.00 (880.00)Community Services 9100 22,709.00 7,157.00 0.00 0.00 (15,552.00)Interest on Long-Term Debt 9200 0.00 0.00 0.00 0.00 0.00Unallocated Depreciation/Amortization Expense 18,731.00 (18,731.00)
Total Component Unit Activities 2,852,729.00 12,437.00 1,293,837.00 90,866.00 (1,455,589.00)
General Revenues:Taxes:
Property Taxes, Levied for Operational Purposes 0.00Property Taxes, Levied for Debt Service 0.00Property Taxes, Levied for Capital Projects 0.00Local Sales Taxes 0.00
Grants and Contributions Not Restricted to Specific Programs 1,467,680.00Investment Earnings 1,369.00Miscellaneous 0.00Special Items 0.00Extraordinary Items 0.00Transfers 0.00Total General Revenues, Special Items, Extraordinary Items and Transfers 1,469,049.00Change in Net Position 13,460.00Net Position, July 1, 2017 1,959,294.00Adjustments to Net Position 0.00Net Position, June 30, 2018 1,972,754.00
The notes to financial statements are an integral part of this statement.ESE 145
FUNCTIONSAccountNumber Expenses
Program Revenues Net (Expense)Revenue and Changes
in Net PositionComponent Unit
2017-18 Final AFR, St. Johns County Schools September 2018 Page 34 of 132

Exhibit D-1 DOE Page 16
1
I. SUMMARY OF SIGNIFICANT ACCOUNTING POLICIES
A. Description of Government-Wide Financial Statements
The government-wide financial statements (i.e., the statement of net position and the statement of activities) report information on all of the nonfiduciary activities of the primary government and its component units. All fiduciary activities are reported only in the fund financial statements. Governmental activities are normally supported by taxes, intergovernmental revenues, and other nonexchange transactions. The primary government is reported separately from certain legally separate component units for which the primary government is financially accountable. The District has no business-type activities.
The statement of activities presents a comparison between direct expenses and program revenues for each function or program of the St. Johns County School District’s (District) governmental activities. Direct expenses are those that are specifically associated with a service, program, or department and are thereby clearly identifiable to a particular function. Depreciation expense is allocated to the various functions.
B. Reporting Entity
The St. Johns County District School Board (Board) has direct responsibility for operation, control, and supervision of District schools and is considered a primary government for financial reporting. The District is considered part of the Florida system of public education, operates under the general direction of the Florida Department of Education (FDOE), and is governed by State law and State Board of Education (SBE) rules. The governing body of the District is the Board, which is composed of five elected members. The appointed Superintendent of Schools is the executive officer of the Board. Geographic boundaries of the District correspond with those of St. Johns County.
Criteria for determining if other entities are potential component units that should be reported within the District’s basic financial statements are identified and described in the Governmental Accounting Standards Board’s (GASB) Codification of Governmental Accounting and Financial Reporting Standards, Sections 2100 and 2600. The application of these criteria provides for identification of any legally separate entities for which the Board is financially accountable and other organizations for which the nature and significance of their relationship with the Board are such that exclusion would cause the District’s basic financial statements to be misleading.
Based on the application of these criteria, the following component units are included within the District’s reporting entity:
Blended Component Unit Blended component units are, in substance, part of the primary District’s operations, even though they are legally separate entities. Thus, blended component units are appropriately presented as funds of the District. The St. Johns County School Board
NOTES TO THE BASIC FINANCIAL STATEMENTS
2017-18 Final AFR, St. Johns County Schools September 2018 Page 35 of 132

Exhibit D-1 DOE Page 16
2
Leasing Corporation (Leasing Corporation) was formed to facilitate financing for the acquisition of facilities and equipment as further discussed in a subsequent note. Due to the substantive economic relationship between the District and the Leasing Corporation, the financial activities of the Leasing Corporation are included in the accompanying basic financial statements. Separate financial statements for the Leasing Corporation are not published.
Discretely Presented Component Units The component units’ columns in the government-wide financial statements include the financial data of the District's other component units. A separate column is used to emphasize that they are legally separate from the District. The District’s component units consist of the St. Johns County Education Foundation, Inc. D/B/A INK! (Foundation), and three charter schools:
The Foundation is a separate not-for-profit corporation organized and operated as a direct-support organization under Section 1001.453, Florida Statutes, to receive, hold, invest, and administer property and to make expenditures to and for the benefit of public prekindergarten through twelfth grade education in St. Johns County. Because of the nature and significance of its relationship with the District, the Foundation is considered a component unit.
The charter schools consist of St. Augustine Public Montessori School, operated by St. Augustine Montessori Community, Inc., and the Therapeutic Learning Center Charter School along with St. Johns Community Campus Charter School, both of which are operated by The Arc of the St. Johns, Inc. The charter schools are separate not-for-profit corporations organized pursuant to Chapter 617, Florida Statutes, the Florida Not For Profit Corporation Act, and Section 1002.33, Florida Statutes. These charter schools operate under charters approved by their sponsor, the Board.
In accordance with a ruling by and requirement of the FDOE, the charter schools are included as component units of the District. According to the FDOE, the charter schools are fiscally dependent on the District for their tax levy and the majority of their budget and create a financial burden on the District because the charter schools’ full-time equivalent student enrollment is the basis for funding.
The financial data reported on the accompanying statements was derived from the Foundation’s and charter schools’ audited financial statements for the fiscal year ended June 30, 2018. The audit reports are filed in the District’s administrative offices at 40 Orange Street, St. Augustine, Florida 32084.
C. Basis of Presentation: Government-Wide Financial Statements
While separate government-wide and fund financial statements are presented, they are interrelated. The governmental activities column incorporates data from governmental funds and internal service funds. Separate financial statements are provided for governmental funds, proprietary funds, and fiduciary funds, even though the latter are excluded from the government-wide financial statements.
The effects of interfund activity have been eliminated from the government-wide financial statements except for interfund services provided and used.
2017-18 Final AFR, St. Johns County Schools September 2018 Page 36 of 132

Exhibit D-1 DOE Page 16
3
D. Basis of Presentation: Fund Financial Statements
The fund financial statements provide information about the District’s funds, including the fiduciary funds and blended component units. Separate statements for each fund category – governmental, proprietary, and fiduciary – are presented. The emphasis of fund financial statements is on major governmental funds, each displayed in a separate column. All remaining governmental funds are aggregated and reported as nonmajor funds.
The District reports the following major governmental funds:
General Fund – to account for all financial resources not required to be accounted for in another fund, and for certain revenues from the State that are legally restricted to be expended for specific current operating purposes.
Debt Service – Other Debt Service Fund – to account for the accumulation of resources for, and the payment of, debt principal, interest, and related costs for the District’s Certificates of Participation, the 2010 Qualified School Construction Bond, and the 2016 District Sales Tax Revenue Bonds.
Capital Projects – Section 1011.14/1011.15 Loan Fund – to account for the financial resources generated by the District’s Revenue Anticipation Note, Series 2018, in the amount of $15,100,000 borrowed on April 13, 2018, under the provisions of Section 1011.14, Florida Statutes, of which the proceeds are to be used for the acquisition, construction, installation and equipping of various capital improvements related to educational facilities within the District, including, but not limited to, the renovation and expansion of Mill Creek Elementary to Mill Creek Academy, a K-8 school.
Capital Projects – Local Capital Improvement Fund – to account for the financial resources generated by the local capital improvement tax levy to be used for educational capital outlay needs, including renovation and remodeling projects, motor vehicle purchases, and debt service payments.
Capital Projects – Other Capital Projects Fund – to account mainly for the financial resources received from certificates of participation proceeds, sales tax revenue bond proceeds, one-half cent local sales tax receipts, local impact fees, and other miscellaneous sources to be used for educational capital outlay needs, including new construction, renovation and remodeling projects, new and replacement equipment, and debt service payments.
Additionally, the District reports the following proprietary and fiduciary fund types:
Internal Service Funds – to account for the District’s self-insured health and hospitalization programs, which includes medical, dental, and vision plans, and the District’s self-insured workers’ compensation program (for claims incurred prior to June 30, 2008).
Agency Funds – to account for resources of the school internal funds, which are used to administer moneys collected at several schools in connection with school, student athletic, class, and club activities. These activities are excluded from the government-wide financial statements because the District cannot use these assets to finance its operations.
2017-18 Final AFR, St. Johns County Schools September 2018 Page 37 of 132

Exhibit D-1 DOE Page 16
4
During the course of operations the District has activity between funds for various purposes. Any residual balances outstanding at fiscal year-end are reported as due from/to other funds. While these balances are reported in fund financial statements, certain eliminations are made in the preparation of the government-wide financial statements. Balances between the funds included in governmental activities (i.e., the governmental and internal service funds) are eliminated so that only the net amount is included as internal balances in the governmental activities column. Further, certain activity occurs during the year involving transfers of resources between funds. In fund financial statements, these amounts are reported at gross amounts as transfers in and out. While reported in fund financial statements, certain transfers between the funds included in governmental activities are eliminated in the preparation of the governmental-wide financial statements.
E. Measurement Focus and Basis of Accounting
The accounting and financial reporting treatment is determined by the applicable measurement focus and basis of accounting. Measurement focus indicates the type of resources being measured such as current financial resources or economic resources. The basis of accounting indicates the timing of transactions or events for recognition in the financial statements.
The government-wide financial statements are reported using the economic resources measurement focus and the accrual basis of accounting. Revenues are recognized when earned and expenses are recognized when a liability is incurred, regardless of the timing of the related cash flows. Property taxes are recognized in the year for which they are levied. Revenues from grants, entitlements, and donations are recognized in the fiscal year in which all eligibility requirements imposed by the provider have been satisfied.
The governmental fund financial statements are reported using the current financial resources measurement focus and the modified accrual basis of accounting. Revenues, except for certain grant revenues, are recognized when they become measurable and available. Revenues are considered to be available when they are collectible within the current period or soon enough thereafter to pay liabilities of the current period. For this purpose, the District considers revenues to be available if they are collected within 60 days of the end of the current fiscal year. When grant terms provide that the expenditure of resources is the prime factor for determining eligibility for Federal, State, and other grant resources, revenue is recognized at the time the expenditure is made. Entitlements are recorded as revenues when all eligibility requirements are met, including any time requirements, and the amount is received during the period or within the availability period for this revenue source (within 60 days of year-end). Interest associated with the current fiscal period is considered to be susceptible to accrual and so have been recognized as revenues of the current fiscal period. Expenditures are generally recognized when the related fund liability is incurred, as under accrual accounting. However, debt service expenditures, claims and judgments, pension benefits, other postemployment benefits, and compensated absences, are only recorded when payment is due. General capital asset acquisitions are reported as expenditures in governmental funds. Issuance of long-term debt are reported as other financing sources. Allocations of cost, such as depreciation, are not recognized in governmental funds.
2017-18 Final AFR, St. Johns County Schools September 2018 Page 38 of 132

Exhibit D-1 DOE Page 16
5
The proprietary funds are reported using the economic resources measurement focus and the accrual basis of accounting. The agency fund has no measurement focus but utilizes the accrual basis of accounting for reporting its assets and liabilities.
The Foundation is accounted for under the not-for-profit basis of accounting and uses the accrual basis of accounting whereby revenues are recognized when earned and expenses are recognized when incurred.
The charter schools are accounted for as governmental organizations and follow the same accounting model as the District’s governmental activities.
F. Assets, Liabilities, Deferred Outflows/Inflows of Resources, and Net Position/Fund Balance
1. Cash and Cash Equivalents
The District’s cash and cash equivalents are considered to be cash on hand, demand deposits, and short-term liquid investments with original maturities of 3 months or less. Investments classified as cash equivalents include amounts placed with the State Board of Administration (SBA) in Florida PRIME and investments made locally with the Florida Education Investment Trust Fund (FEITF).
Cash deposits are held by banks qualified as public depositories under Florida law. All deposits are insured by federal depository insurance, up to specified limits, or collateralized with securities held in Florida's multiple financial institution collateral pool as required by Chapter 280, Florida Statutes.
2. Investments
Investments consist of amounts placed in the SBA debt service accounts which are restricted for debt service purposes, amounts placed with the SBA for participation in the Florida PRIME investment pool created by Section 218.405, Florida Statutes, and amounts placed in FEITF. These investment pools operate under investment guidelines established by Section 215.47, Florida Statutes.
The District’s investments in Florida PRIME, which the SBA indicates is a Securities and Exchange Commission (SEC) Rule 2a7-like external investment pool, are similar to money market funds in which shares are owned in the fund rather than the underlying investments. These investments are reported at fair value, which is amortized cost.
Investments made locally consist of amounts placed in the FEITF, a SEC Rule 2a7-like external investment pool. These investments are reported at fair value, which is amortized cost.
Types and amounts of investments held at fiscal year-end are described in a subsequent note.
2017-18 Final AFR, St. Johns County Schools September 2018 Page 39 of 132

Exhibit D-1 DOE Page 16
6
3. Restricted Cash and Cash Equivalents
Certain assets held by a trustee, in the name of the District, or invested by the District, in connection with certificates of participation financing arrangements are classified as restricted cash and cash equivalents on the statement of net position because they are set aside for repayment of debt as required by applicable debt covenants, represent proceeds from the sale of certificates of participation, revenue from the one-half cent local sales tax receipts or proceeds from the revenue anticipation note.
These assets consist of $15,349,151 restricted for the repayment of certificates of participation principal and interest payable, of which $15,340,191 is payable on July 1, 2018, and reported as current liabilities on the statement of net position; $6,693,316 restricted for the repayment of QSCBs principal that is maintained in a sinking fund account; $3,185,500 restricted for the repayment of sales tax revenue bonds principal and interest; $8,069,581 of sales tax revenue bonds proceeds restricted for the cost of construction and equipping a new K-8 school and a new elementary school; $12,002,376 of one-half cent local sales tax receipts restricted for new construction, reconstruction and improvement of school facilities, including safety and security improvements and technology upgrades; and $14,997,563 revenue anticipation note proceeds restricted for capital improvements to educational facilities within the District, specifically the renovation and expansion of Mill Creek Elementary to Mill Creek Academy, a K-8 school.
4. Inventories and Prepaid Items
Inventories consist of expendable supplies held for consumption in the course of District operations. Inventories are stated at last invoice price, which approximates the first-in, first-out basis, except that United States Department of Agriculture donated foods are stated at their fair value as determined at the time of donation to the District's food service program by the Florida Department of Agriculture and Consumer Services, Bureau of Food Distribution. The costs of inventories are recorded as expenditures when used rather than when purchased.
Certain payments to vendors reflect costs applicable to future accounting periods and are recorded as prepaid items in both the government-wide and fund financial statements. The cost of prepaid items is recorded as expenditures/expenses when consumed rather than when purchased.
5. Capital Assets
Expenditures for capital assets acquired or constructed for general District purposes are reported in the governmental fund that financed the acquisition or construction. The capital assets so acquired are reported at cost in the government-wide statement of net position but are not reported in the governmental fund financial statements. Capital assets are defined by the District as those costing more than $1,000, except for improvements other than buildings which are defined as those costing more than $250,000. Such assets are recorded at
2017-18 Final AFR, St. Johns County Schools September 2018 Page 40 of 132

Exhibit D-1 DOE Page 16
7
historical cost if purchased or constructed. Donated assets are recorded at acquisition value at the date of donation.
Capital assets are depreciated using the straight-line method over the following estimated useful lives:
Description Estimated Lives
Improvements Other Than Buildings 10 - 40 years
Buildings and Fixed Equipment 10 - 50 years
Furniture, Fixtures, and Equipment 3 - 15 years
Motor Vehicles 5 - 10 years
Audio Visual Materials and Computer Software 5 years
Current year information relative to changes in capital assets is described in a subsequent note.
6. Pensions
The District participates in the Florida Retirement System (FRS). In the government-wide statement of net position, liabilities are recognized for the District’s proportionate share of each pension plan’s net pension liability. For purposes of measuring the net pension liability, deferred outflows of resources and deferred inflows of resources related to pensions, and pension expense, information about the fiduciary net position of the FRS defined benefit plan and the Health Insurance Subsidy (HIS) defined benefit plan and additions to/deductions from the FRS and the HIS fiduciary net position have been determined on the same basis as they are reported by the FRS and the HIS plans. For this purpose, benefit payments (including refunds of employee contributions) are recognized when due and payable in accordance with benefit terms. Investments are reported at fair value.
The District’s retirement plans and related amounts are described in a subsequent note.
7. Long-Term Liabilities
Long-term obligations that will be financed from resources to be received in the future by governmental funds are reported as liabilities in the government-wide statement of net position. Debt premiums and discounts are deferred and amortized over the life of the bonds using the effective interest method. Bonds and certificates of participation payable are reported net of the applicable premium or discount.
In the governmental fund financial statements, bonds and other long-term obligations are not recognized as liabilities until due. Governmental fund types recognize debt premiums and discounts during the current period. The face amount of debt issued and premiums on debt issuance are reported as other financing sources, while discounts on debt issuances are reported as other financing uses.
Changes in long-term liabilities for the current year are reported in a subsequent note.
2017-18 Final AFR, St. Johns County Schools September 2018 Page 41 of 132

Exhibit D-1 DOE Page 16
8
8. Deferred Outflows/Inflows of Resources
In addition to assets, the statement of net position reports a separate section for deferred outflows of resources. This separate financial statement element, deferred outflows of resources, represents a consumption of net position that applies to future periods and so will not be recognized as an outflow of resources (expense) until then. The District has three items that qualify for reporting in this category. The deferred outflows of resources related to pensions and OPEB are discussed in subsequent notes. The net carrying amount for loss on debt refunding reported in the government-wide statement of net position results from the difference in the carrying value of refunded debt and its reacquisition price. This amount is deferred and amortized, as a component of interest expense, over the shorter of the life of the refunded or refunding debt.
In addition to liabilities, the statement of net position reports a separate section for deferred inflows of resources. This separate financial statement element, deferred inflows of resources, represents an acquisition of net position that applies to future periods and so will not be recognized as an inflow of resources (revenue) until that time. The District has three items that qualify for reporting in this category. The deferred inflows of resources related to pensions and OPEB are discussed in subsequent notes. Unavailable revenue from the PELL grant is recognized in the fiscal year in which all eligibility requirements have been met. This amount is deferred and recognized as an inflow of resources in the period that the amounts become available.
9. Net Position Flow Assumption
The District occasionally funds outlays for a particular purpose from both restricted (e.g., restricted bond or grant proceeds) and unrestricted resources. To calculate the amounts to report as restricted net position and unrestricted net position in the government-wide and proprietary fund financial statements, a flow assumption must be made about the order in which the resources are considered to be applied. Consequently, it is the District’s policy to consider restricted net position to have been depleted before unrestricted net position is applied.
10. Fund Balance Flow Assumptions
The District may fund outlays for a particular purpose from both restricted and unrestricted resources (the total of committed, assigned, and unassigned fund balance). To calculate the amounts to report as restricted, committed, assigned, and unassigned fund balance in the governmental fund financial statements a flow assumption must be made about the order in which the resources are considered to be applied. It is the District’s policy to consider restricted fund balance to have been depleted before using any of the components of unrestricted fund balance. Further, when components of unrestricted fund balance can be used for the same purpose, committed fund balance is depleted first, followed by assigned fund balance. Unassigned fund balance is applied last.
2017-18 Final AFR, St. Johns County Schools September 2018 Page 42 of 132

Exhibit D-1 DOE Page 16
9
11. Fund Balance Policies
Fund balance of governmental funds is reported in various categories based on the nature of any limitations requiring the use of resources for specific purposes. The District itself can establish limitations on the use of resources through either a commitment (committed fund balance) or an assignment (assigned fund balance).
The District reports its governmental fund balances in the following categories:
Nonspendable Fund Balance Nonspendable fund balance is the net current financial resources that cannot be spent because they are either not in spendable form or are legally or contractually required to be maintained intact. Generally, not in spendable form means that an item is not expected to be converted to cash. The District classifies its amounts reported as inventories and prepaid items as nonspendable.
Restricted Fund Balance Restricted fund balance is the portion of fund balance on which constraints have been placed by creditors, grantors, contributors, laws or regulations of other governments, constitutional provisions, or enabling legislation. Restricted fund balance places the most binding level of constraint on the use of fund balance. The District classifies most of its fund balances as restricted, other than those in the General Fund. In the General Fund, unspent State Required Carryover (Categorical) Programs and earmarked educational funding that is legally or otherwise restricted are reported as restricted fund balance.
Committed Fund Balance The committed fund balance classification includes amounts that can be used only for the specific purposes determined by a formal action of the District’s highest level of decision-making authority. The Board is the highest level of decision-making authority for the District that can, by adoption of a resolution prior to the end of the fiscal year, commit fund balance. Once adopted, the limitation imposed by the resolution remains in place until a similar action is taken (the adoption of another resolution) to remove or revise the limitation. The District reported the following as committed fund balance in its General Fund:
Economic Stabilization Arrangement The District has established an economic stabilization arrangement in Board Rule 7.01, School District Budget System, which provides that the Board shall commit an amount equal to 3 percent of its estimated revenue from the first Florida Education Finance Program calculation under a stabilization arrangement for the use in an emergency. The District classified the stabilization arrangement moneys as committed fund balance and defines the circumstances that constitute an emergency are non-routine in nature and specifically include the following:
• Failure to pay loans or debt service when due as a result of lack of funds; • Failure to pay uncontested claims to creditors within 90 days due to lack of funds; • Failure to transfer taxes, social security or retirement/benefits for employees; and • Failure for one pay period to pay wages, salaries, or retirement benefits to employees.
At June 30, 2018, the stabilization balance was $8,941,077.
2017-18 Final AFR, St. Johns County Schools September 2018 Page 43 of 132
Exhibit D-1 DOE Page 16
10
Discretionary Millage In accordance with Section 1011.71(1), Florida Statutes, the District levied an additional 0.25 discretionary millage for critical operating needs. The School Board adopted the additional discretionary millage on September 28, 2010, and specified that the moneys be used to support the maintenance and equipment needs of its educational facilities. The unspent portion of the additional discretionary millage moneys, totaling $259,646 at June 30, 2018, is classified as committed fund balance.
Assigned Fund Balance Amounts in the assigned fund balance classification are intended to be used by the District for specific purposes but do not meet the criteria to be classified as committed. Board Rule 7.01 authorizes the Superintendent or Superintendent’s designee to assign fund balance. The Board may also assign fund balance as it does when appropriating fund balance to cover a gap between estimated revenue and appropriations in the subsequent year’s appropriated budget. Unlike commitments, assignments generally only exist temporarily. In other words, an additional action does not normally have to be taken for the removal of an assignment. Conversely, as discussed above, an additional action is essential to either remove or revise a commitment.
Unassigned Fund Balance The unassigned fund balance is the portion of fund balance that is the residual classification for the General Fund. This balance represents amounts that have not been restricted, committed, or assigned for specific purposes.
G. Revenues and Expenditures/Expenses
1. Program Revenues
Amounts reported as program revenues include charges paid by the recipient of the goods or services offered by the program, and grants and contributions that are restricted to meeting the operational or capital requirements of a particular program. All taxes, including those dedicated for specific purposes, and other internally dedicated resources are reported as general revenues rather than program revenues. Revenues that are not classified as program revenues are presented as general revenues. The comparison of direct expenses with program revenues identifies the extent to which each governmental function is self-financing or draws from the general revenues of the District.
2. State Revenue Sources
Significant revenues from State sources for current operations include the Florida Education Finance Program administered by the Florida Department of Education (FDOE) under the provisions of Section 1011.62, Florida Statutes. In accordance with this law, the District determines and reports the number of full-time equivalent (FTE) students and related data to the FDOE. The FDOE performs certain edit checks on the reported number of FTE and related data, and calculates the allocation of funds to the District. The District is permitted to amend its original reporting for a period of 5 months following the date of the original reporting. Such amendments may impact funding allocations for subsequent years. The FDOE may also adjust subsequent fiscal period allocations based upon an audit of the District's compliance in
2017-18 Final AFR, St. Johns County Schools September 2018 Page 44 of 132

Exhibit D-1 DOE Page 16
11
determining and reporting FTE and related data. Normally, such adjustments are treated as reductions or additions of revenue in the fiscal year when the adjustments are made.
The State provides financial assistance to administer certain educational programs. SBE rules require that revenue earmarked for certain programs be expended only for the program for which the money is provided, and require that the money not expended as of the close of the fiscal year be carried forward into the following year to be expended for the same educational programs. The FDOE generally requires that these educational program revenues be accounted for in the General Fund. A portion of the fund balance of the General Fund is restricted in the governmental fund financial statements for the balance of categorical and earmarked educational program resources.
The State allocates gross receipts taxes, generally known as Public Education Capital Outlay money, to the District on an annual basis. The District is authorized to expend these funds only upon applying for and receiving an encumbrance authorization from the FDOE.
A schedule of revenue from State sources for the current fiscal year is presented in a subsequent note.
3. District Property Taxes
The Board is authorized by State law to levy property taxes for District school operations, capital improvements, and debt service.
Property taxes consist of ad valorem taxes on real and personal property within the District. Property values are determined by the St. Johns County Property Appraiser, and property taxes are collected by the St. Johns County Tax Collector.
The Board adopted the 2017 tax levy on September 14, 2017. Tax bills are mailed in October and taxes are payable between November 1 of the year assessed and March 31 of the following year at discounts of up to 4 percent for early payment.
Taxes become a lien on the property on January 1, and are delinquent on April 1, of the year following the year of assessment. State law provides for enforcement of collection of personal property taxes by seizure of the property to satisfy unpaid taxes, and for enforcement of collection of real property taxes by the sale of interest-bearing tax certificates to satisfy unpaid taxes. The procedures result in the collection of essentially all taxes prior to June 30 of the year following the year of assessment.
Property tax revenues are recognized in the government-wide financial statements when the Board adopts the tax levy. Property tax revenues are recognized in the governmental fund financial statements when taxes are received by the District, except that revenue is accrued for taxes collected by the St. Johns County Tax Collector at fiscal year-end but not yet remitted to the District.
Millages and taxes levied for the current year are presented in a subsequent note.
2017-18 Final AFR, St. Johns County Schools September 2018 Page 45 of 132
Exhibit D-1 DOE Page 16
12
4. Federal Revenue Sources
The District receives Federal awards for the enhancement of various educational programs. Federal awards are generally received based on applications submitted to, and approved by, various granting agencies. For Federal awards in which a claim to these grant proceeds is based on incurring eligible expenditures, revenue is recognized to the extent that eligible expenditures have been incurred.
5. Sales Tax Revenue
On November 3, 2015, in a special referendum election, the citizens of St. Johns County authorized a half-cent sales surtax to fund the capital needs of the District, under the authority of Section 212.055(6), Florida Statutes. The sales surtax was effective beginning January 2016 and will continue through December 2025. Revenues will be used to fund critical needs of an increasing student population in St. Johns County as it relates to new construction, facility renovations, remodeling projects, technology, and security.
6. Educational Impact Fees
St. Johns County (County) imposes an educational impact fee based on an ordinance adopted by the County Commission in 1987. This ordinance was most recently amended in March 2011, when Ordinance 2011-7 established, in part, revised rates to be collected. The educational impact fee is collected by the County for most new residential construction. The fees can only be used to acquire, construct, expand, and equip the educational sites and educational capital facilities necessitated by new development and to pay for certain collection and legal defense costs.
7. Concurrency Proportionate Share Mitigation
Pursuant to Section 163.3180(6)(a), Florida Statutes, the District entered into an interlocal agreement with the County and three local municipalities effective October 3, 2008, to implement school concurrency for the purpose of ensuring adequate public school facilities are available to serve the residents of new residential developments. Concurrency requires that necessary infrastructure be planned for and available at the time of development impacts and requires an infrastructure review to determine whether adequate school capacity either already exists, will be in place, or under construction within three years. School capacity is provided through proportionate share mitigation from developers in the form of school construction, land contributions or cash payments for school construction or land acquisition. The District has six concurrency service areas based on adopted Board high school attendance boundaries. If there is not sufficient capacity in the affected concurrency service area, or the adjacent concurrency service area, and the developer elects to proceed with the project, proportionate share mitigation will be required to address the impacts of the proposed development. Developers receive a credit toward the payment of local educational impact fees based on the amount of proportionate share mitigation provided, and the proportionate share mitigation revenue is recognized when payment is made to the District. The County or municipality then approves final construction plans.
2017-18 Final AFR, St. Johns County Schools September 2018 Page 46 of 132

Exhibit D-1 DOE Page 16
13
8. Compensated Absences
In the government-wide financial statements, compensated absences (i.e., paid absences for employee vacation leave and sick leave) are accrued as liabilities using the vesting method. Under this method, the liability amount is estimated based on the accumulated leave at fiscal year-end for employees who are currently eligible, or expected to become eligible, to receive termination payments. A liability for these amounts is reported in the governmental fund financial statements only if it has matured, such as for occurrences of employee resignations and retirements. The liability for compensated absences includes salary related benefits, where applicable.
9. Proprietary Funds Operating and Nonoperating Revenues and Expenses
Proprietary funds distinguish operating revenues and expenses from nonoperating items. Operating revenues and expenses generally result from providing services and producing and delivering goods in connection with the proprietary funds’ principal ongoing operations. The principal operating revenues of the District’s internal service funds are charges for employee health insurance premiums and workers’ compensation insurance. Operating expenses include insurance claims and excess coverage premiums. All revenues and expenses not meeting this definition are reported as nonoperating revenues and expenses.
II. ACCOUNTING CHANGE
Governmental Accounting Standards Board Statement No. 75 The District implemented GASB Statement No. 75, Accounting and Financial Reporting for Postemployment Benefits Other Than Pensions, which replaces GASB Statement No. 45, Accounting and Financial Reporting by Employers for Postemployment Benefits Other Than Pensions, as amended. This Statement addresses accounting and financial reporting for postemployment benefits other than pensions (OPEB) provided to employees of state and local government employers; establishes standards for recognizing and measuring liabilities, deferred outflows of resources, deferred inflows of resources, and expenses; requires governments to report a liability, deferred outflows of resources, deferred inflow of resources, and expenses on the face of the financial statement for the OPEB that they provide; and requires more extensive note disclosures and supplementary information about a government’s OPEB liability. The beginning net position of the District was increased by $22,913,614 due to implementation of GASB Statement No. 75. The District’s total OPEB liability reported at June 30, 2017, decreased by $25,157,561 to $31,763,655 as of July 1, 2017, due to the transition in the valuation methods under GASB Statement No. 45 to GASB Statement No. 75.
2017-18 Final AFR, St. Johns County Schools September 2018 Page 47 of 132

Exhibit D-1 DOE Page 16
14
III. STEWARDSHIP, COMPLIANCE AND ACCOUNTABILITY
A. Deficit Net Position in Major Capital Projects Fund
The following major capital projects fund has a deficit net position balance at June 30, 2018:
The deficit reported in the Capital Projects – Section 1011.14/1011.15 Loan Fund is attributed to the reported liability of $15,100,000 generated by the issuance of Revenue Anticipation Note, Series 2018. These proceeds are for the acquisition, construction, installation and equipping of various capital improvements related to educational facilities, including, but not limited to, the renovation and expansion of Mill Creek Elementary School to Mill Creek Academy, a K-8 school. The deficit will be eliminated during the subsequent years as the pledged proceeds are received and the note is paid in full.
IV. DETAILED NOTES ON ALL ACTIVITIES AND FUNDS
A. Cash Deposits with Financial Institutions
Custodial Credit Risk-Deposits
In the case of deposits, this is the risk that in the event of a bank failure, the District’s deposits may not be returned to the District. The District does not have a policy for custodial credit risk. All bank balances of the District are fully insured or collateralized as required by Chapter 280, Florida Statutes.
Cash balances from all funds are combined and invested to the extent available. Earnings are allocated monthly to each fund based on average daily balances.
B. Investments
Fair Value Measurement
The District categorizes its fair value measurements within the fair value hierarchy established by generally accepted accounting principles. The hierarchy is based on the valuation inputs used to measure the fair value of the asset.
FundBeginning
Net PositionChange in
Net PositionEnding
Net PositionCapital Projects - Section 1011.14/1011.15 Loan -$ (264,060)$ (264,060)$
2017-18 Final AFR, St. Johns County Schools September 2018 Page 48 of 132
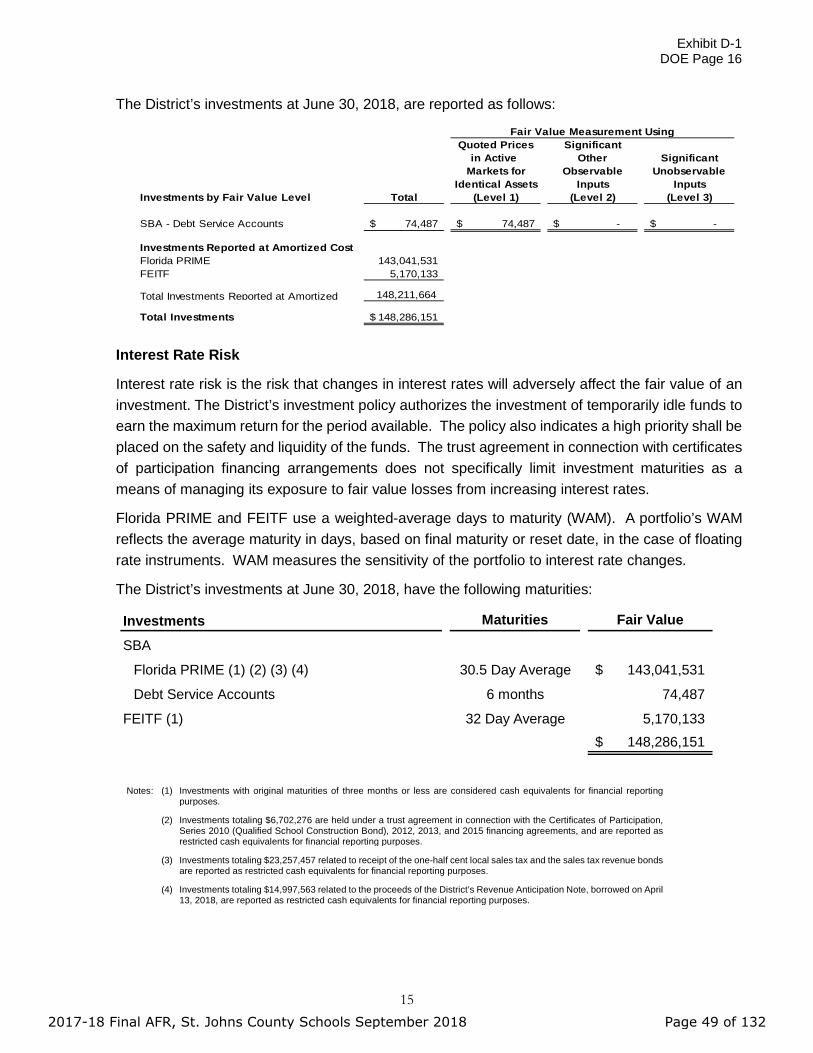
Exhibit D-1 DOE Page 16
15
The District’s investments at June 30, 2018, are reported as follows:
Quoted Prices Significantin Active Other Significant
Markets for Observable UnobservableIdentical Assets Inputs Inputs
Investments by Fair Value Level Total (Level 1) (Level 2) (Level 3)
SBA - Debt Service Accounts 74,487$ 74,487$ -$ -$
Investments Reported at Amortized CostFlorida PRIME 143,041,531 FEITF 5,170,133
Total Investments Reported at Amortized 148,211,664
Total Investments 148,286,151$
Fair Value Measurement Using
Interest Rate Risk
Interest rate risk is the risk that changes in interest rates will adversely affect the fair value of an investment. The District’s investment policy authorizes the investment of temporarily idle funds to earn the maximum return for the period available. The policy also indicates a high priority shall be placed on the safety and liquidity of the funds. The trust agreement in connection with certificates of participation financing arrangements does not specifically limit investment maturities as a means of managing its exposure to fair value losses from increasing interest rates.
Florida PRIME and FEITF use a weighted-average days to maturity (WAM). A portfolio’s WAM reflects the average maturity in days, based on final maturity or reset date, in the case of floating rate instruments. WAM measures the sensitivity of the portfolio to interest rate changes.
The District’s investments at June 30, 2018, have the following maturities:
Notes: (1) Investments with original maturities of three months or less are considered cash equivalents for financial reporting purposes.
(2) Investments totaling $6,702,276 are held under a trust agreement in connection with the Certificates of Participation, Series 2010 (Qualified School Construction Bond), 2012, 2013, and 2015 financing agreements, and are reported as restricted cash equivalents for financial reporting purposes.
(3) Investments totaling $23,257,457 related to receipt of the one-half cent local sales tax and the sales tax revenue bonds are reported as restricted cash equivalents for financial reporting purposes.
(4) Investments totaling $14,997,563 related to the proceeds of the District’s Revenue Anticipation Note, borrowed on April 13, 2018, are reported as restricted cash equivalents for financial reporting purposes.
Investments Maturities Fair Value
SBA
Florida PRIME (1) (2) (3) (4) 30.5 Day Average 143,041,531$
Debt Service Accounts 6 months 74,487
FEITF (1) 32 Day Average 5,170,133 148,286,151$
2017-18 Final AFR, St. Johns County Schools September 2018 Page 49 of 132

Exhibit D-1 DOE Page 16
16
For Florida PRIME, Chapter 218.409(8)(a), Florida Statutes, states that “the principal, and any part thereof, of each account constituting the trust fund is subject to payment at any time from the moneys in the trust funds. However, the Executive Director may, in good faith, on the occurrence of an event that has a material impact on liquidity or operations of the trust funds, for 48 hours limit contributions to or withdrawals from the trust fund to ensure that the Board [State Board of Administration] can invest moneys entrusted to it in exercising its fiduciary responsibility. Such action must be immediately disclosed to all participants, the Trustee, the Joint Legislative Auditing Committee, the Investment Advisory Council, and the Participant Local Government Advisory Council. The Trustees shall convene an emergency meeting as soon as practicable from the time the Executive Director has instituted such measures and review the necessity of those measures. If the Trustees are unable to convene an emergency meeting before the expiration of the 48-hour moratorium on contributions and withdrawals, the moratorium may be extended by the Executive Director until the Trustees are able to meet to review the necessity for the moratorium. If the Trustees agree with such measures, the Trustees shall vote to continue the measures for up to an additional 15 days. The Trustees must convene and vote to continue any such measures before the expiration of the time limit set, but in no case may the time limit set by the Trustees exceed 15 days.” As of June 30, 2018, there were no redemption fees or maximum transaction amounts, or any other requirements that serve to limit a participant’s daily access to 100 percent of their account value.
Credit Risk
Credit risk is the risk that an issuer or other counterpart to an investment will not fulfill its obligations. Section 218.415(17), Florida Statutes, limits investments to the SBA’s Florida PRIME, or any other intergovernmental investment pool authorized pursuant to the Florida Interlocal Cooperation Act as provided in Section 163.01, Florida Statutes; Securities and Exchange Commission registered money market funds with the highest credit quality rating from a nationally recognized rating agency; interest-bearing time deposits in qualified public depositories, as defined in Section 280.02, Florida Statutes; and direct obligations of the United States Treasury. The District’s investment policy does not further limit its investment choices.
The District’s investment in the FEITF and Florida PRIME is rated AAAm by Standard & Poor’s.
The District’s investments in the SBA Debt Service accounts are to provide for debt service payments on bond debt issued by the SBE for the benefit of the District. The District relies on policies developed by the SBA for managing interest rate risk and credit risk for this account. Disclosures for the Debt Service Accounts are included in the notes to financial statements of the State’s Comprehensive Annual Financial Report.
C. Due From Other Agencies
The $7,602,988 reported as due from other agencies primarily consists of $3,625,265 due from the Florida Department of Revenue related to the one-half cent local sales tax; $1,515,204 due from the St. Johns County Board of County Commissioners for the collection of educational impact fees; and $935,684 due from the FDOE for reimbursement of Federal grant expenditures.
2017-18 Final AFR, St. Johns County Schools September 2018 Page 50 of 132

Exhibit D-1 DOE Page 16
17
D. Changes in Capital Assets
Changes in capital assets are presented in the table below:
Beginning Ending
Balance Additions Deletions BalanceGOVERNMENTAL ACTIVITIES
Capital Assets Not Being Depreciated:Land 59,855,257$ -$ -$ 59,855,257$ Construction in Progress 54,767,253 49,074,719 33,259,703 70,582,269
Total Capital Assets Not Being Depreciated 114,622,510 49,074,719 33,259,703 130,437,526
Capital Assets Being Depreciated:Improvements Other Than Buildings 25,057,164 118,649 - 25,175,813 Buildings and Fixed Equipment 655,453,016 41,463,907 - 696,916,923 Furniture, Fixtures, and Equipment 26,749,120 2,115,735 1,684,449 27,180,406 Motor Vehicles 24,822,196 3,218,894 1,272,098 26,768,992 Audio Visual Materials and
Computer Softw are 4,366,669 31,410 131,730 4,266,349
Total Capital Assets Being Depreciated 736,448,165 46,948,595 3,088,277 780,308,483
Less Accumulated Depreciation for:Improvements Other Than Buildings 16,929,329 522,759 - 17,452,088 Buildings and Fixed Equipment 210,574,123 15,589,890 - 226,164,013 Furniture, Fixtures, and Equipment 20,790,916 2,427,185 1,684,449 21,533,652 Motor Vehicles 15,081,065 2,157,602 1,272,098 15,966,569 Audio Visual Materials and
Computer Softw are 4,215,264 98,387 131,730 4,181,921
Total Accumulated Depreciation 267,590,697 20,795,823 3,088,277 285,298,243
Total Capital Assets Being Depreciated, Net 468,857,468 26,152,772 - 495,010,240
Governmental Activities Capital Assets, Net 583,479,978$ 75,227,491$ 33,259,703$ 625,447,766$
2017-18 Final AFR, St. Johns County Schools September 2018 Page 51 of 132

Exhibit D-1 DOE Page 16
18
Depreciation expense was charged to functions as follows:
Function Amount
GOVERNMENTAL ACTIVITIESInstruction 11,914,124$ Student Personnel Services 1,530,868 Instructional Media Services 327,512 Instruction and Curriculum Development Services 459,307 Instructional Staff Training Services 233,604 Instruction-Related Technology 347,212 School Board 25,308 General Administration 22,147 School Administration 1,265,554 Facilities Acquisition and Construction 99,942 Fiscal Services 122,965 Food Services 446,734 Central Services 269,712 Student Transportation Services 2,157,602 Operation of Plant 817,409 Maintenance of Plant 451,319 Administrative Technology Services 23,976 Community Services 280,528
Total Depreciation Expense - Governmental Activities 20,795,823$
E. Retirement Plans
1. Florida Retirement System (FRS) – Defined Benefit Pension Plans
General Information about the FRS
The FRS was created in Chapter 121, Florida Statutes, to provide a defined benefit pension plan for participating public employees. The FRS was amended in 1998 to add the Deferred Retirement Option Program (DROP) under the defined benefit plan and amended in 2000 to provide a defined contribution plan alternative to the defined benefit plan for FRS members effective July 1, 2002. This integrated defined contribution pension plan is the FRS Investment Plan. Chapter 112, Florida Statutes, established the Retiree Health Insurance Subsidy (HIS) Program, a cost-sharing multiple-employer defined benefit pension plan, to assist retired members of any State-administered retirement system in paying the costs of health insurance.
Essentially all regular employees of the District are eligible to enroll as members of the State-administered FRS. Provisions relating to the FRS are established by Chapters 121 and 122, Florida Statutes; Chapter 112, Part IV, Florida Statutes; Chapter 238, Florida Statutes; and FRS Rules, Chapter 60S, Florida Administrative Code; wherein eligibility, contributions, and benefits are defined and described in detail. Such provisions may be amended at any time by further action from the Florida Legislature.
The FRS is a single retirement system administered by the Florida Department of Management Services, Division of Retirement, and consists of the two cost-sharing,
2017-18 Final AFR, St. Johns County Schools September 2018 Page 52 of 132

Exhibit D-1 DOE Page 16
19
multiple-employer defined benefit plans and other nonintegrated programs. A comprehensive annual financial report of the FRS, which includes its financial statements, required supplementary information, actuarial report, and other relevant information, is available from the Florida Department of Management Services’ Web site www.dms.myflorida.com.
The District’s FRS and HIS pension expense totaled $26,187,285 for the fiscal year ended June 30, 2018.
FRS Pension Plan
Plan Description The FRS Pension Plan (Plan) is a cost-sharing multiple-employer defined benefit pension plan, with DROP for eligible employees. The general classes of membership are as follows:
Regular – Members of the FRS who do not qualify for membership in the other classes. Elected County Officers – Members who hold specified elective offices in local
government. Senior Management Service – Members in senior management level positions. Employees enrolled in the Plan prior to July 1, 2011, vest at 6 years of creditable service and employees enrolled in the Plan on or after July 1, 2011, vest at 8 years of creditable service. All vested members, enrolled prior to July 1, 2011, are eligible for normal retirement benefits at age 62 or at any age after 30 years of service. All members enrolled in the Plan on or after July 1, 2011, once vested, are eligible for normal retirement benefits at age 65 or any time after 33 years of creditable service. Employees enrolled in the Plan may include up to 4 years of credit for military service toward creditable service. The Plan also includes an early retirement provision; however, there is a benefit reduction for each year a member retires before his or her normal retirement date. The Plan provides retirement, disability, death benefits, and annual cost-of-living adjustments to eligible participants.
DROP, subject to provisions of Section 121.091, Florida Statutes, permits employees eligible for normal retirement under the Plan to defer receipt of monthly benefit payments while continuing employment with an FRS participating employer. An employee may participate in DROP for a period not to exceed 60 months after electing to participate, except that certain instructional personnel may participate for up to 96 months. During the period of DROP participation, deferred monthly benefits are held in the FRS Trust Fund and accrue interest. The net pension liability does not include amounts for DROP participants, as these members are considered retired and are not accruing additional pension benefits.
Benefits Provided Benefits under the Plan are computed on the basis of age and/or years of service, average final compensation, and service credit. Credit for each year of service is expressed as a percentage of the average final compensation. For members initially enrolled before July 1, 2011, the average final compensation is the average of the five highest fiscal years’ earnings; for members initially enrolled on or after July 1, 2011, the average final compensation is the average of the eight highest fiscal years’ earnings. The total percentage value of the benefit received is determined by calculating the total value of all service, which
2017-18 Final AFR, St. Johns County Schools September 2018 Page 53 of 132

Exhibit D-1 DOE Page 16
20
is based on the retirement class to which the member belonged when the service credit was earned. Members are eligible for in-line-of-duty or regular disability and survivors’ benefits. The following chart shows the percentage value for each year of service credit earned:
Class, Initial Enrollment, and Retirement Age/Years of Service Percent Value
Regular Class members initially enrolled before July 1, 2011 Retirement up to age 62 or up to 30 years of service 1.60 Retirement at age 63 or with 31 years of service 1.63 Retirement at age 64 or with 32 years of service 1.65 Retirement at age 65 or with 33 or more years of service 1.68
Regular Class members initially enrolled on or after July 1, 2011 Retirement up to age 65 or up to 33 years of service 1.60 Retirement at age 66 or with 34 years of service 1.63 Retirement at age 67 or with 35 years of service 1.65 Retirement at age 68 or with 36 or more years of service 1.68
Elected County Officers 3.00
Senior Management Service Class 2.00
As provided in Section 121.101, Florida Statutes, if the member is initially enrolled in the FRS before July 1, 2011, and all service credit was accrued before July 1, 2011, the annual cost-of-living adjustment is 3 percent per year. If the member is initially enrolled before July 1, 2011, and has service credit on or after July 1, 2011, there is an individually calculated cost-of-living adjustment. The annual cost-of-living adjustment is a proportion of 3 percent determined by dividing the sum of the pre-July 2011 service credit by the total service credit at retirement multiplied by 3 percent. Plan members initially enrolled on or after July 1, 2011, will not have a cost-of-living adjustment after retirement.
Contributions. The Florida Legislature establishes contribution rates for participating employers and employees. Contribution rates during the 2017-18 fiscal year were as follows:
Class Employee Employer (1)
FRS, Regular 3.00 7.92FRS, Elected County Officers 3.00 45.50FRS, Senior Management Service 3.00 22.71DROP - Applicable to Members from All of the Above Classes 0.00 13.26FRS, Reemployed Retiree (2) (2)
Percent of Gross Salary
Notes: (1) Employer rates include 1.66 percent for the postemployment health insurance subsidy. Also, employer rates, other than for DROP participants, include 0.06 percent for administrative costs of the Investment Plan.
(2) Contribution rates are dependent upon retirement class in which reemployed.
The District’s contributions to the Plan totaled $14,798,770 for the fiscal year ended June 30, 2018.
2017-18 Final AFR, St. Johns County Schools September 2018 Page 54 of 132
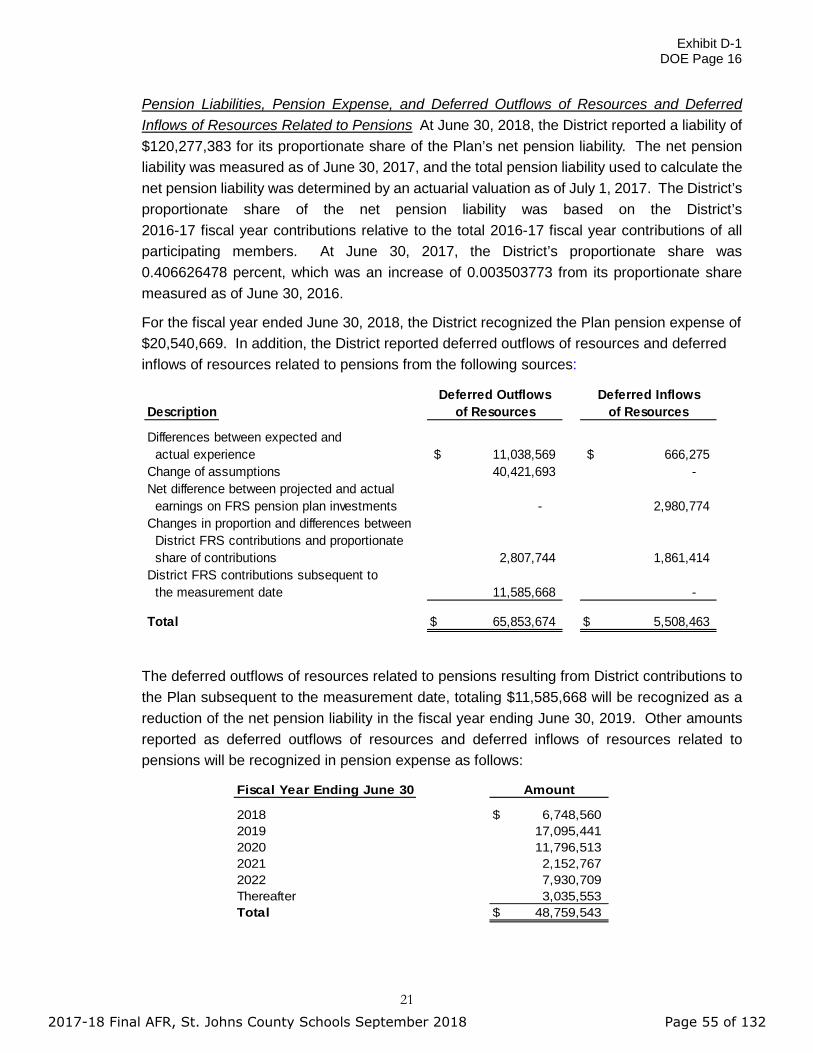
Exhibit D-1 DOE Page 16
21
Pension Liabilities, Pension Expense, and Deferred Outflows of Resources and Deferred Inflows of Resources Related to Pensions At June 30, 2018, the District reported a liability of $120,277,383 for its proportionate share of the Plan’s net pension liability. The net pension liability was measured as of June 30, 2017, and the total pension liability used to calculate the net pension liability was determined by an actuarial valuation as of July 1, 2017. The District’s proportionate share of the net pension liability was based on the District’s 2016-17 fiscal year contributions relative to the total 2016-17 fiscal year contributions of all participating members. At June 30, 2017, the District’s proportionate share was 0.406626478 percent, which was an increase of 0.003503773 from its proportionate share measured as of June 30, 2016.
For the fiscal year ended June 30, 2018, the District recognized the Plan pension expense of $20,540,669. In addition, the District reported deferred outflows of resources and deferred inflows of resources related to pensions from the following sources:
Description
Differences between expected and actual experience $ 11,038,569 $ 666,275 Change of assumptions 40,421,693 - Net difference between projected and actual earnings on FRS pension plan investments - 2,980,774 Changes in proportion and differences between District FRS contributions and proportionate share of contributions 2,807,744 1,861,414 District FRS contributions subsequent to the measurement date 11,585,668 -
Total $ 65,853,674 $ 5,508,463
Deferred Outflowsof Resources
Deferred Inflowsof Resources
The deferred outflows of resources related to pensions resulting from District contributions to the Plan subsequent to the measurement date, totaling $11,585,668 will be recognized as a reduction of the net pension liability in the fiscal year ending June 30, 2019. Other amounts reported as deferred outflows of resources and deferred inflows of resources related to pensions will be recognized in pension expense as follows:
Fiscal Year Ending June 30
2018 $ 6,748,560 2019 17,095,441 2020 11,796,513 2021 2,152,767 2022 7,930,709 Thereafter 3,035,553 Total $ 48,759,543
Amount
2017-18 Final AFR, St. Johns County Schools September 2018 Page 55 of 132

Exhibit D-1 DOE Page 16
22
Actuarial Assumptions The total pension liability in the July 1, 2017, actuarial valuation was determined using the following actuarial assumptions, applied to all periods included in the measurement:
Inflation 2.60 percentSalary Increases 3.25 percent, average, including inflationInvestment rate of return 7.10 percent, net of pension plan investment expense,
including inflation
Mortality rates were based on the Generational RP-2000 with Projection Scale BB.
The actuarial assumptions used in the July 1, 2017, valuation were based on the results of an actuarial experience study for the period July 1, 2008, through June 30, 2013.
The long-term expected rate of return on pension plan investments was not based on historical returns, but instead is based on a forward-looking capital market economic model. The allocation policy’s description of each asset class was used to map the target allocation to the asset classes shown below. Each asset class assumption is based on a consistent set of underlying assumptions, and includes an adjustment for the inflation assumption.
The target allocation and best estimates of arithmetic and geometric real rates of return for each major asset class are summarized in the following table:
Discount Rate The discount rate used to measure the total pension liability was 7.1 percent. The Plan’s fiduciary net position was projected to be available to make all projected future benefit payments of current active and inactive employees. Therefore, the discount rate for calculating the total pension liability is equal to the long-term expected rate of return. The discount rate used in the 2017 valuation was updated from 7.6 percent to 7.1 percent.
Sensitivity of the District’s Proportionate Share of the Net Pension Liability to Changes in the Discount Rate The following presents the District’s proportionate share of the net pension liability calculated using the discount rate of 7.1 percent, as well as what the District’s proportionate share of the net pension liability would be if it were calculated using a discount
CompoundAnnual Annual
Target Arithmetic (Geometric) StandardAsset Class Allocation (1) Return Return Deviation
Cash 1% 3.0% 3.0% 1.8%Fixed Income 18% 4.5% 4.4% 4.2%Global Equity 53% 7.8% 6.6% 17.0%Real Estate (Property) 10% 6.6% 5.9% 12.8%Private Equity 6% 11.5% 7.8% 30.0%Strategic Investments 12% 6.1% 5.6% 9.7%
Total 100%
Assumed inflation - Mean 2.6% 1.9%
Note: (1) As outlined in the Plan's investment policy
2017-18 Final AFR, St. Johns County Schools September 2018 Page 56 of 132

Exhibit D-1 DOE Page 16
23
rate that is 1 percentage point lower (6.1 percent) or 1 percentage point higher (8.1 percent) than the current rate:
Pension Plan Fiduciary Net Position Detailed information about the Plan’s fiduciary net position is available in the separately issued FRS Pension Plan and Other State Administered Systems Comprehensive Annual Financial Report.
Payables to the Pension Plan At June 30, 2018, the District reported a payable of $1,815,728 for the outstanding amount of contributions to the Plan required for the fiscal year ended June 30, 2018.
HIS Pension Plan
Plan Description The HIS Pension Plan (HIS Plan) is a cost-sharing multiple-employer defined benefit pension plan established under Section 112.363, Florida Statutes, and may be amended by the Florida Legislature at any time. The benefit is a monthly payment to assist retirees of State-administered retirement systems in paying their health insurance costs and is administered by the Florida Department of Management Services, Division of Retirement.
Benefits Provided For the fiscal year ended June 30, 2018, eligible retirees and beneficiaries received a monthly HIS payment of $5 for each year of creditable service completed at the time of retirement, with a minimum HIS payment of $30 and a maximum HIS payment of $150 per month, pursuant to Section 112.363, Florida Statutes. To be eligible to receive a HIS Plan benefit, a retiree under a State-administered retirement system must provide proof of health insurance coverage, which may include Federal Medicare.
Contributions The HIS Plan is funded by required contributions from FRS participating employers as set by the Florida Legislature. Employer contributions are a percentage of gross compensation for all active FRS members. For the fiscal year ended June 30, 2018, the contribution rate was 1.66 percent of payroll pursuant to Section 112.363, Florida Statutes. The District contributed 100 percent of its statutorily required contributions for the current and preceding 3 years. HIS Plan contributions are deposited in a separate trust fund from which payments are authorized. HIS Plan benefits are not guaranteed and are subject to annual legislative appropriation. In the event the legislative appropriation or available funds fail to provide full subsidy benefits to all participants, benefits may be reduced or canceled.
The District’s contributions to the HIS Plan totaled $3,213,102 for the fiscal year ended June 30, 2018.
1% Current 1%Decrease Discount Rate Increase
(6.1%) (7.1%) (8.1%)
District's proportionate share of the net pension liability 217,694,800$ 120,277,383$ 39,398,609$
2017-18 Final AFR, St. Johns County Schools September 2018 Page 57 of 132

Exhibit D-1 DOE Page 16
24
Pension Liabilities, Pension Expense, and Deferred Outflows of Resources and Deferred Inflows of Resources Related to Pensions At June 30, 2018, the District reported a net pension liability of $63,147,865 for its proportionate share of the HIS Plan’s net pension liability. The current portion of the net pension liability is the District’s proportionate share of benefit payments expected to be paid within 1 year, net of the District’s proportionate share of the pension plan’s fiduciary net position available to pay that amount. The net pension liability was measured as of June 30, 2017, and the total pension liability used to calculate the net pension liability was determined by an actuarial valuation as of July 1, 2017. The District’s proportionate share of the net pension liability was based on the District’s 2016-17 fiscal year contributions relative to the total 2016-17 fiscal year contributions of all participating members. At June 30, 2017, the District’s proportionate share was 0.590583056 percent, which was an increase of 0.006400776 from its proportionate share measured as of June 30, 2016.
For the fiscal year ended June 30, 2018, the District recognized the HIS Plan pension expense of $5,646,616. In addition, the District reported deferred outflows of resources and deferred inflows of resources related to pensions from the following sources:
Description
Differences between expected and actual experience $ - $ 131,484 Change of assumptions 8,876,419 5,460,463 Net difference between projected and actual earnings on HIS pension plan investments 35,020 - Changes in proportion and differences between District HIS contributions and proportionate share of contributions 3,466,724 - District HIS contributions subsequent to the measurement date 3,213,102 -
Total $ 15,591,265 $ 5,591,947
Deferred Outflowsof Resources
Deferred Inflowsof Resources
The deferred outflows of resources related to pensions resulting from District contributions to the HIS Plan subsequent to the measurement date, totaling $3,213,102 will be recognized as a reduction of the net pension liability in the fiscal year ending June 30, 2019. Other amounts reported as deferred outflows of resources and deferred inflows of resources related to pensions will be recognized in pension expense as follows:
Fiscal Year Ending June 30
2018 $ 1,878,326 2019 1,871,700 2020 1,868,519 2021 1,340,134 2022 544,803 Thereafter (717,266) Total $ 6,786,216
Amount
2017-18 Final AFR, St. Johns County Schools September 2018 Page 58 of 132

Exhibit D-1 DOE Page 16
25
Actuarial Assumptions The total pension liability in the July 1, 2017, actuarial valuation was determined using the following actuarial assumptions, applied to all periods included in the measurement:
Inflation 2.60 percentSalary Increases 3.25 percent, average, including inflationMunicipal Bond Rate 3.58 percent
Mortality rates were based on the Generational RP-2000 with Projected Scale BB.
While an experience study had not been completed for the HIS Plan, the actuarial assumptions that determined the total pension liability for the HIS Plan were based on certain results of the most recent experience study for the FRS Plan.
Discount Rate The discount rate used to measure the total pension liability was 3.58 percent. In general, the discount rate for calculating the total pension liability is equal to the single rate equivalent to discounting at the long-term expected rate of return for benefit payments prior to the projected depletion date. Because the HIS benefit is essentially funded on a pay-as-you-go basis, the depletion date is considered to be immediate, and the single equivalent discount rate is equal to the municipal bond rate selected by the HIS Plan sponsor. The Bond Buyer General Obligation 20-Bond Municipal Bond Index was adopted as the applicable municipal bond index. The discount rate used in the 2017 valuation was updated from 2.85 percent to 3.58 percent.
Sensitivity of the District’s Proportionate Share of the Net Pension Liability to Changes in the Discount Rate The following presents the District’s proportionate share of the net pension liability calculated using the discount rate of 3.58 percent, as well as what the District’s proportionate share of the net pension liability would be if it were calculated using a discount rate that is 1 percentage point lower (2.58 percent) or 1 percentage point higher (4.58 percent) than the current rate:
Pension Plan Fiduciary Net Position Detailed information about the HIS Plan’s fiduciary net position is available in the separately issued FRS Pension Plan and Other State Administered Systems Comprehensive Annual Financial Report.
Payables to the Pension Plan At June 30, 2018, the District reported a payable of $389,836 for the outstanding amount of contributions to the HIS Plan required for the fiscal year ended June 30, 2018.
Decrease Discount Rate Increase(2.58%) (3.58%) (4.58%)
District's proportionate share of the net pension liability (asset) 72,060,077$ 63,147,865$ 55,724,485$
2017-18 Final AFR, St. Johns County Schools September 2018 Page 59 of 132

Exhibit D-1 DOE Page 16
26
2. FRS – Defined Contribution Pension Plan
The SBA administers the defined contribution plan officially titled the FRS Investment Plan (Investment Plan). The Investment Plan is reported in the SBA’s annual financial statements and in the State of Florida Comprehensive Annual Financial Report.
As provided in Section 121.4501, Florida Statutes, eligible FRS members may elect to participate in the Investment Plan in lieu of the FRS defined benefit plan. District employees participating in DROP are not eligible to participate in the Investment Plan. Employer and employee contributions, including amounts contributed to individual member’s accounts, are defined by law, but the ultimate benefit depends in part on the performance of investment funds. Retirement benefits are based upon the value of the member’s account upon retirement. Benefit terms, including contribution requirements, for the Investment Plan are established and may be amended by the Florida Legislature. The Investment Plan is funded with the same employer and employee contribution rates that are based on salary and membership class (Regular, Elected County Officers, etc.), as the FRS defined benefit plan. Contributions are directed to individual member accounts, and the individual members allocate contributions and account balances among various approved investment choices. Costs of administering the Investment Plan, including the FRS Financial Guidance Program, are funded through an employer contribution of 0.06 percent of payroll and by forfeited benefits of plan members. Allocations to the investment member’s accounts during the 2017-18 fiscal year were as follows:
Percent ofGross
Class Compensation
FRS, Regular 6.30FRS, Elected County Officers 11.34FRS, Senior Management Service 7.67
For all membership classes, employees are immediately vested in their own contributions and are vested after 1 year of service for employer contributions and investment earnings, regardless of membership class. If an accumulated benefit obligation for service credit originally earned under the FRS Pension Plan is transferred to the Investment Plan, the member must have the years of service required for FRS Pension Plan vesting (including the service credit represented by the transferred funds) to be vested for these funds and the earnings on the funds. Nonvested employer contributions are placed in a suspense account for up to 5 years. If the employee returns to FRS-covered employment within the 5-year period, the employee will regain control over their account. If the employee does not return within the 5-year period, the employee will forfeit the accumulated account balance. For the fiscal year ended June 30, 2018, the information for the amount of forfeitures was unavailable from the SBA; however, management believes that these amounts, if any, would be immaterial to the District.
2017-18 Final AFR, St. Johns County Schools September 2018 Page 60 of 132

Exhibit D-1 DOE Page 16
27
After termination and applying to receive benefits, the member may rollover vested funds to another qualified plan, structure a periodic payment under the Investment Plan, receive a lump-sum distribution, leave the funds invested for future distribution, or any combination of these options. Disability coverage is provided; the member may either transfer the account balance to the FRS Pension Plan when approved for disability retirement to receive guaranteed lifetime monthly benefits under the FRS Pension Plan, or remain in the Investment Plan and rely upon that account balance for retirement income.
The District’s Investment Plan pension expense totaled $2,665,327 for the fiscal year ended June 30, 2018.
Payables to the Investment Plan At June 30, 2018, the District reported a payable of $407,169 for the outstanding amount of contributions to the Investment Plan required for the fiscal year ended June 30, 2018.
F. Other Postemployment Benefit Plan – OPEB Plan
The District follows GASB Statement No. 75, Accounting and Financial Reporting for Postemployment Benefits Other than Pensions, for reporting the employers’ OPEB Plan liability.
Plan Description The Other Postemployment Benefits Plan (OPEB Plan) is a single-employer defined benefit plan administered by the District. Pursuant to the provisions of Section 112.0801, Florida Statutes, former employees who retire from the District are eligible to participate in the District’s health and hospitalization plan for medical, prescription drug, dental, and vision coverage. Retirees and their eligible dependents shall be offered the same health and hospitalization insurance coverage as is offered to active employees at a premium cost of no more than the premium cost applicable to active employees. The District subsidizes the premium rates paid by retirees by allowing them to participate in the OPEB Plan at reduced or blended group (implicitly subsidized) premium rates for both active and retired employees. These rates provide an implicit subsidy for retirees because retiree healthcare costs are generally greater than active employee healthcare costs. The District does not offer any explicit subsidies for retiree coverage. Retirees are assumed to enroll in the Federal Medicare program for their primary coverage as soon as they are eligible. The OPEB Plan does not issue a stand-alone report and is not included in the report of a public employee retirement system or entity. The OPEB Plan contribution requirements and benefit terms of the District and the OPEB Plan members are established and may be amended through recommendations of the Insurance Committee and action from the Board. No assets are accumulated in a trust that meets all of the criteria in GASB Statement No. 75, paragraph 4.
2017-18 Final AFR, St. Johns County Schools September 2018 Page 61 of 132

Exhibit D-1 DOE Page 16
28
Employees Covered by Benefit Terms At June 30, 2017, the following employees were covered by the benefit terms:
Total OPEB Liability The District’s total OPEB liability of $30,120,974 was measured as of June 30, 2017, and was determined by an actuarial valuation as of that date.
Actuarial Assumptions and Other Inputs The total OPEB liability was determined using the following actuarial assumptions and other inputs, applied to all periods included in the measurement, unless otherwise specified:
The discount rate was based on the Bond Buyer General Obligation 20-year Municipal Bond Index.
Mortality rates were based on the Generational RP-2000 with Projected Scale BB.
The demographic actuarial assumptions for retirement, disability incidence, and withdrawal used in the June 30, 2017, valuation were based on the results of an actuarial experience study for the period January 1, 2010, through December 31, 2014, adopted by the FRS.
The remaining actuarial assumptions (e.g., initial per capita costs, health care cost trends, rate of plan participation, rates of plan election, et.) used in the June 30, 2017, valuation were based on a review of recent plan experience done concurrently with the June 30, 2017, valuation.
Inactive Employees or Beneficiaries Currently Receiving Benefits 310
Inactive Employees Entitled to But Not Yet Receiving Benefits-
Active Employees 3,528
Total 3,838
Inflation 2.50 percent
Salary Increases 3.70 percent to 7.80 percent, including inflation as used in the
July 1, 2016 actuarial valuation of the Florida Retirement System
Discount Rate 2.92 at the beginning of the measurement period to 3.56 percent as of June 30, 2017
Healthcare Cost Trend Rates 7.00 percent decreasing to an ultimate trend rate of 4.24 percentplus .39 percent increase for excise tax
2017-18 Final AFR, St. Johns County Schools September 2018 Page 62 of 132

Exhibit D-1 DOE Page 16
29
Changes in the Total OPEB Liability
Sensitivity of the Total OPEB Liability to Changes in the Discount Rate The following table presents the total OPEB liability of the District, as well as what the District’s total OPEB liability would be if it were calculated using a discount rate that is 1 percentage point lower (2.56 percent) or 1 percentage point higher (4.56 percent) than the current rate:
Sensitivity of the District’s Total OPEB Plan Liability to the Healthcare Cost Trend Rates The following table presents the total OPEB liability of the District, as well as what the District’s total OPEB liability would be if it were calculated using healthcare cost trend rates that are 1 percentage point lower (6.00 percent decreasing to 3.24 percent) or 1 percentage point higher (8.00 percent decreasing to 5.24 percent) than the current healthcare cost trend rates:
AmountBalance at June 30, 2017, as Restated 31,763,655$
Changes for the year: Service Cost 1,661,807 Interest 946,718 Changes of Benefit Terms -
Differences Between Expected and Actual Experience -
Changes in Assumptions or Other Inputs (2,243,947)
Benefit Payments (2,007,259)
Net Changes (1,642,681)
Balance at June 30, 2018 30,120,974$
1%Decrease(2.56%)
CurrentDiscount Rate
(3.56%)
1%Decrease(4.56%)
Total OPEB Liability 33,723,217$ 30,120,974$ 27,013,262$
1% Decrease (6.00%
decreasing to 3.24%)
Healthcare Cost Trend
Rates (7.00% decreasing to
4.24%)
1% Increase(8.00%
decreasing to 5.24%)
Total OPEB Liability 25,887,936$ 30,120,974$ 35,417,759$
2017-18 Final AFR, St. Johns County Schools September 2018 Page 63 of 132

Exhibit D-1 DOE Page 16
30
OPEB Expense and Deferred Outflows of Resources and Deferred Inflows of Resources Related to OPEB For the fiscal year ended June 30, 2018, the District recognized OPEB expense of $2,400,752. At June 30, 2018, the District reported deferred outflows of resources and deferred inflows of resources related to OPEB from the following sources:
Of the total amount reported as deferred outflows of resources related to OPEB, $1,047,312 resulting from benefits paid subsequent to the measurement date and before the end of the fiscal year will be included as a reduction of the total OPEB liability in the year ended June 30, 2019. Other amount reported as deferred outflows of resources and deferred inflows of resources related to OPEB will be recognized in OPEB expense as follows:
G. Special Termination Benefits
The Board provides for the payment of special retirement benefits to qualifying employees as follows:
The Board provides for the payment of a special termination incentive to administrative, managerial, and confidential employees hired prior to January 2, 2002. The incentive is equal to 1 percent of final salary times the number of years of St. Johns County District School Board service or $10,000, whichever is greater, provided that the employee retires by the end of the first fiscal year of eligibility. Employees hired on or after January 2, 2002, are not eligible for the retirement incentive, and employees hired before that date and reclassified from another category are eligible for an incentive equal to 1 percent of final salary times the number of years of St. Johns County District School Board service or $10,000, whichever is less, provided that the employee retires by the end of the first fiscal year of eligibility.
DescriptionDeferred Outflows
of ResourcesDeferred Inflows
of Resources
Differences Between Expected and
Actual Experience -$ 2,036,174$
Change in Assumptions or Other Inputs - -
Benefits Paid Subsequent to the Measurement Date 1,047,312 -
Total 1,047,312$ 2,036,174$
Fiscal Year Ending June 30 Total
2019 207,773$ 2020 207,773 2021 207,773 2022 207,773 2023 207,773 Thereafter 997,309
Total 2,036,174$
2017-18 Final AFR, St. Johns County Schools September 2018 Page 64 of 132

Exhibit D-1 DOE Page 16
31
The Board’s collective bargaining agreement with St. Johns Education Association provides for the payment of a special retirement incentive of 30 percent of final salary or $10,000, whichever is greater, for instructional employees who retire with a minimum of 10 years of service, provided that the employee retires by the end of the first fiscal year of eligibility.
The Board’s collective bargaining agreement with the St. Johns Educational Support Professional Association provides for the payment of special retirement benefits to noninstructional employees upon retirement of $3,000 for employees with 15 years of services and an additional $250 for each year of service beyond 15 years, up to a maximum of 30 years of service.
In addition to payments for accrued leave and regular termination benefits, the District reported expenditures for special termination benefits, totaling $800,870 during the 2017-18 fiscal year.
H. Construction and Other Significant Commitments
Encumbrances Appropriations in governmental funds are encumbered upon issuance of purchase orders for goods and services. Even though appropriations lapse at the end of the fiscal year, unfilled purchase orders of the current year are carried forward and the next year's appropriations are likewise encumbered.
The following is a schedule of encumbrances at June 30, 2018. The major Debt Service – Other Debt Service Fund had no encumbrances at June 30, 2018.
Construction Contracts Encumbrances include the following major construction contract commitments at fiscal year-end:
Contract Completed BalanceProject Amount to Date Committed
Palm Valley Academy 36,599,061$ 33,928,424$ 2,670,637$ Freedom Crossing Academy 34,362,307 32,084,978 2,277,329 Nease High School Expansion 4,619,490 2,981,906 1,637,584
Total 75,580,858$ 68,995,308$ 6,585,550$
I. Risk Management Programs
The District is exposed to various risks of loss related to torts; theft of, damage to, and destruction of assets; errors and omissions; injuries to employees; and natural disasters. The District has established self-insurance programs for its employee health and hospitalization and its workers'
General
Capital Projects - Section
1011.14/1011.15 Loan Fund
Capital Projects -
Local Capital Improvement
Capital Projects - Other Capital
Projects
Nonmajor Governmental
FundsTotal Governmental
Funds
1,268,709$ 373,762$ 7,478,074$ 15,112,517$ 591,723$ 24,824,785$
Major Funds
2017-18 Final AFR, St. Johns County Schools September 2018 Page 65 of 132

Exhibit D-1 DOE Page 16
32
compensation liability coverage. For workers’ compensation and most of its other insurance coverage, effective July 1, 2008, the District participates in a group self-insurance program administered by the Florida School Boards Association, Inc. The District’s covered risks relating to property protection, general liability, automobile liability, workers’ compensation, money and securities, employee fidelity and faithful performance, boiler and machinery, and other coverage deemed necessary by the members are included in the group program.
Section 1001.42(12)(k), Florida Statutes, provides the authority for the District to enter into such a risk management program. The program is self-sustaining through member assessments (premiums), and purchases coverage through commercial companies for claims in excess of specified amounts. The Board of Directors for the program is composed of one board member from each participating district and a superintendent and district-level business officer selected from one of the participating districts.
The District’s health and hospitalization self-insurance program, which includes medical, dental, and vision coverage, is being provided on a self-insured basis up to specified limits. The District has entered into an agreement with an insurance company to provide specific excess coverage of claims amounts above $350,000 per insured per year, and laser coverage on one member of $775,000 per year. The program’s administrator has been approved by the Florida Office of Insurance Regulation. The funds for these coverages were established in accordance with Chapter 112, Florida Statutes. The program is administered through the Internal Service Funds.
A liability in the amount of $2,949,444 was actuarially determined for estimated insurance claims payable for claims incurred but not reported (IBNR) for health and hospitalization coverage.
The following schedule represents the changes in claims liability for the past two fiscal years for the District’s self-insured health and hospitalization program:
The Board established a self-insurance program to provide workers’ compensation coverage for its employees for claims incurred prior to June 30, 2008. The District’s liability was limited by excess insurance to $150,000 or $250,000 per occurrence, depending on the year of occurrence, and by aggregate excess insurance per plan year, ranging from $1,000,000 to $3,211,800, except for the 2004-05 plan year, for which aggregate excess insurance was not purchased. For claims incurred on or after July 1, 2008, the District’s workers’ compensation coverage is administered by the Florida School Boards Association program.
A liability in the amount of $250,035 was actuarially determined for estimated insurance claims payable for claims IBNR for workers’ compensation coverage.
Fiscal Year
Balance at Beginning of Fiscal Year
Current-Year Claims and Changes in Estimates Claims Payments
Balance at Fiscal
Year-End
2016-17 2,399,132$ 33,588,639$ (33,555,457)$ 2,432,314$
2017-18 2,432,314 38,224,381 (37,707,251) 2,949,444
2017-18 Final AFR, St. Johns County Schools September 2018 Page 66 of 132

Exhibit D-1 DOE Page 16
33
The following schedule represents the changes in the liability for the past two fiscal years for the District’s workers’ compensation program:
Settled claims resulting from these risks have not exceeded commercial coverage in any of the past three fiscal years.
J. Long-Term Liabilities
1. Notes Payable
Notes payable at June 30, 2018, are as follows:
On April 13, 2018, the District entered a financing arrangement under the provisions of Section 1011.14, Florida Statutes, which authorizes district school boards to create obligations for a period of one year, in anticipation of budgeted revenues accruing on a current basis, without pledging the credit of the District or requiring future levy of taxes for certain purposes. These obligations may be extended from year to year, with the consent of the lender, for a period not to exceed four years, for a total of five years, including the initial year of the loan. The Revenue Anticipation Note, Series 2018, was undertaken for the acquisition, construction, installation and equipping of various capital improvements related to educational facilities, including, but not limited to, the renovation and expansion of Mill Creek Elementary School to Mill Creek Academy, a K-8 school.
Amounts payable for the planned extended repayment of the Section 1011.14, Florida Statutes, bank loan is as follows:
Fiscal Year
Balance at Beginning of Fiscal Year
Current-Year Claims and Changes in Estimates Claims Payments
Balance at Fiscal
Year-End
2016-17 571,035$ (133,148)$ (39,726)$ 398,161$ 2017-18 398,161 (116,035) (32,091) 250,035
Note DescriptionAmount
Outstanding
Interest Rates
(Percent)
Annual Maturity
ToOriginal Amount
Revenue Anticipation Note, Series 2018 15,100,000$ 2.68 2019 15,100,000$
Fiscal Year Ending June 30 Total Principal Interest
2019 3,178,191$ 2,787,000$ 391,191$ 2020 3,286,988 2,957,000 329,988 2021 3,287,741 3,037,000 250,741
2022 3,287,349 3,118,000 169,349
2023 3,286,787 3,201,000 85,787
Total 16,327,056$ 15,100,000$ 1,227,056$
2017-18 Final AFR, St. Johns County Schools September 2018 Page 67 of 132
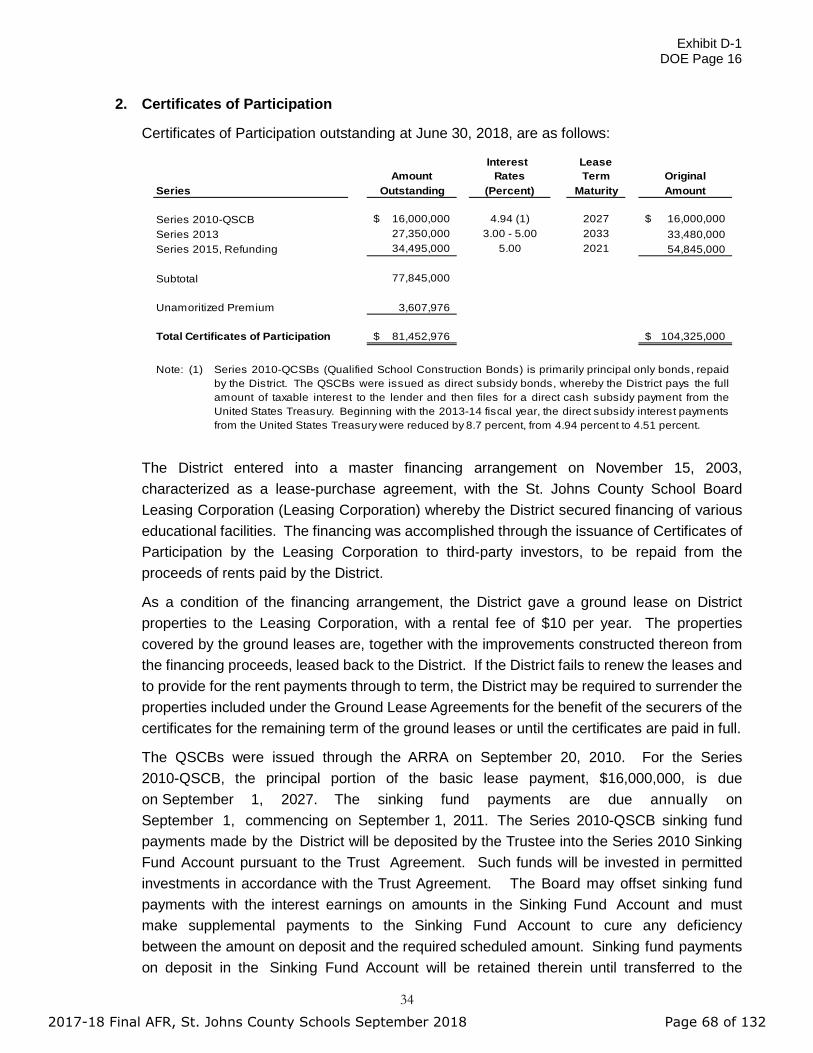
Exhibit D-1 DOE Page 16
34
2. Certificates of Participation
Certificates of Participation outstanding at June 30, 2018, are as follows:
Interest LeaseAmount Rates Term Original
Outstanding (Percent) Maturity Amount
16,000,000$ 4.94 (1) 2027 16,000,000$ 27,350,000 3.00 - 5.00 2033 33,480,000
Series 2015, Refunding 34,495,000 5.00 2021 54,845,000
Subtotal 77,845,000
Unamoritized Premium 3,607,976
81,452,976$ 104,325,000$
Note: (1)
Total Certificates of Participation
Series 2010-QCSBs (Qualified School Construction Bonds) is primarily principal only bonds, repaidby the District. The QSCBs were issued as direct subsidy bonds, whereby the District pays the fullamount of taxable interest to the lender and then files for a direct cash subsidy payment from theUnited States Treasury. Beginning with the 2013-14 fiscal year, the direct subsidy interest paymentsfrom the United States Treasury were reduced by 8.7 percent, from 4.94 percent to 4.51 percent.
Series
Series 2010-QSCBSeries 2013
The District entered into a master financing arrangement on November 15, 2003, characterized as a lease-purchase agreement, with the St. Johns County School Board Leasing Corporation (Leasing Corporation) whereby the District secured financing of various educational facilities. The financing was accomplished through the issuance of Certificates of Participation by the Leasing Corporation to third-party investors, to be repaid from the proceeds of rents paid by the District.
As a condition of the financing arrangement, the District gave a ground lease on District properties to the Leasing Corporation, with a rental fee of $10 per year. The properties covered by the ground leases are, together with the improvements constructed thereon from the financing proceeds, leased back to the District. If the District fails to renew the leases and to provide for the rent payments through to term, the District may be required to surrender the properties included under the Ground Lease Agreements for the benefit of the securers of the certificates for the remaining term of the ground leases or until the certificates are paid in full.
The QSCBs were issued through the ARRA on September 20, 2010. For the Series 2010-QSCB, the principal portion of the basic lease payment, $16,000,000, is due on September 1, 2027. The sinking fund payments are due annually on September 1, commencing on September 1, 2011. The Series 2010-QSCB sinking fund payments made by the District will be deposited by the Trustee into the Series 2010 Sinking Fund Account pursuant to the Trust Agreement. Such funds will be invested in permitted investments in accordance with the Trust Agreement. The Board may offset sinking fund payments with the interest earnings on amounts in the Sinking Fund Account and must make supplemental payments to the Sinking Fund Account to cure any deficiency between the amount on deposit and the required scheduled amount. Sinking fund payments on deposit in the Sinking Fund Account will be retained therein until transferred to the
2017-18 Final AFR, St. Johns County Schools September 2018 Page 68 of 132

Exhibit D-1 DOE Page 16
35
Series 2010 Principal Account and applied to the payment of the $16,000,000 principal component due on the Series 2010-QSCB Certificates at maturity (September 1, 2027) or upon earlier payment. The QSCBs are primarily issued as principal only and provide for a direct cash subsidy payment from the United States Treasury for the interest. Beginning with the 2013-14 fiscal year, the direct subsidy interest payments from the United States Treasury was reduced by 8.7 percent, from 4.94 percent to 4.51 percent.
A summary of the lease terms are as follows:
The District properties included in the ground lease under this arrangement include:
Except for the QSCBs, the lease payments are payable by the District semiannually, on July 1 and January 1, and must be remitted as of the 15th day of the month preceding the payment dates. The QSCB lease payments are payable March 1 and September 1. The following is a schedule by years of future minimum lease payments under the lease agreement together with the present value of minimum lease payments as of June 30:
Certificates Lease Term
Series 2010-QSCB Earlier of the date paid in full or September 1, 2027
Series 2013 Earlier of the date paid in full or July 1, 2033
Series 2015, Refunding Earlier of the date paid in full or July 1, 2021
Certificates Description of Properties
Series 2010-QSCB Construction of Palencia Elementary
Series 2013 Construction of Patriot Oaks Academy and Valley Ridge Academy
Series 2015, Refunding Construction of Wards Creek Elementary School; Pacetti Bay Middle School; a Ninth Grade Center at the existing Bartram Trail High School; Ponte Vedra High School and Creekside High School
Fiscal Year Ending June 30 Total Principal Interest
2019 15,869,987$ 12,270,000$ 3,599,987$ 2020 15,876,487 12,890,000 2,986,487 2021 15,871,987 13,530,000 2,341,987 2022 3,205,488 1,540,000 1,665,488 2023-2027 3,208,488 1,620,000 1,588,488 2028-2032 31,631,675 25,090,000 6,541,675 2033 12,080,588 10,905,000 1,175,588
Total Minimum Lease Payments 97,744,700 77,845,000 19,899,700
Unamoritzed Premium 3,607,976 3,607,976 -
Total Certificates of Participation Payable 101,352,676$ 81,452,976$ 19,899,700$
2017-18 Final AFR, St. Johns County Schools September 2018 Page 69 of 132
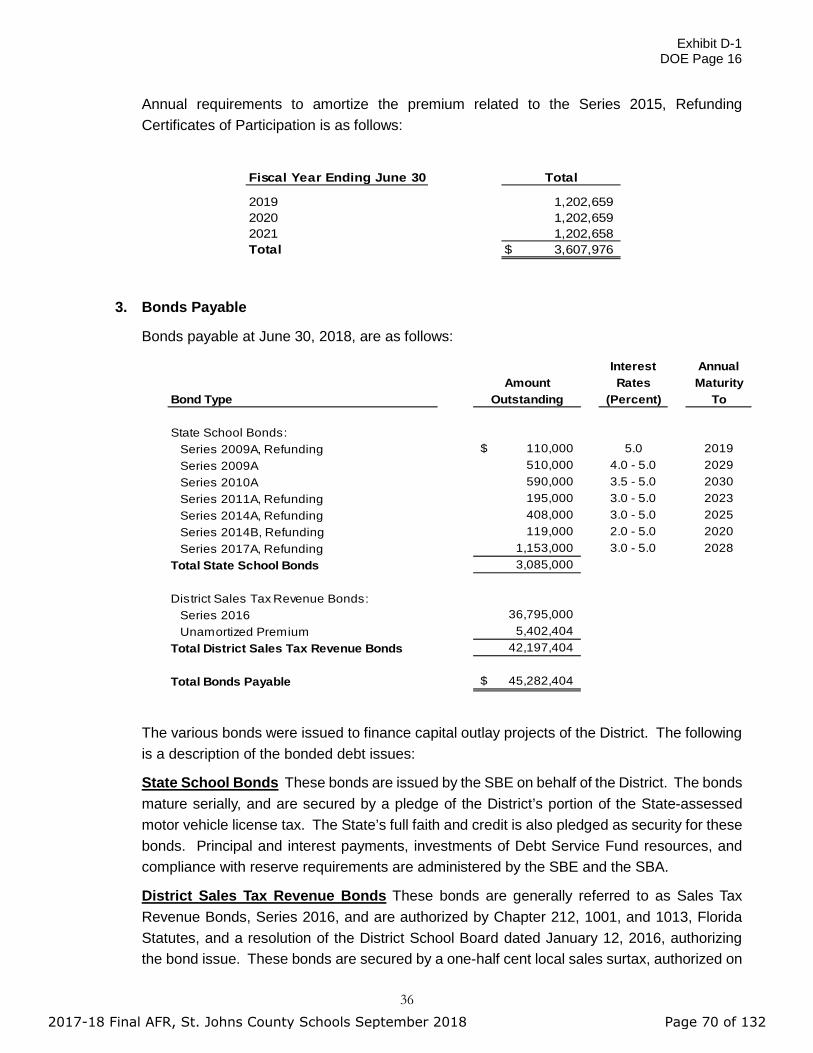
Exhibit D-1 DOE Page 16
36
Annual requirements to amortize the premium related to the Series 2015, Refunding Certificates of Participation is as follows:
Fiscal Year Ending June 30
2019 1,202,659 2020 1,202,659 2021 1,202,658 Total $ 3,607,976
Total
3. Bonds Payable
Bonds payable at June 30, 2018, are as follows:
Interest Annual Amount Rates MaturityBond Type Outstanding (Percent) To
State School Bonds: Series 2009A, Refunding 110,000$ 5.0 2019
Series 2009A 510,000 4.0 - 5.0 2029Series 2010A 590,000 3.5 - 5.0 2030Series 2011A, Refunding 195,000 3.0 - 5.0 2023
Series 2014A, Refunding 408,000 3.0 - 5.0 2025Series 2014B, Refunding 119,000 2.0 - 5.0 2020Series 2017A, Refunding 1,153,000 3.0 - 5.0 2028
Total State School Bonds 3,085,000
District Sales Tax Revenue Bonds: Series 2016 36,795,000 Unamortized Premium 5,402,404 Total District Sales Tax Revenue Bonds 42,197,404
Total Bonds Payable 45,282,404$
The various bonds were issued to finance capital outlay projects of the District. The following is a description of the bonded debt issues:
State School Bonds These bonds are issued by the SBE on behalf of the District. The bonds mature serially, and are secured by a pledge of the District’s portion of the State-assessed motor vehicle license tax. The State’s full faith and credit is also pledged as security for these bonds. Principal and interest payments, investments of Debt Service Fund resources, and compliance with reserve requirements are administered by the SBE and the SBA.
District Sales Tax Revenue Bonds These bonds are generally referred to as Sales Tax Revenue Bonds, Series 2016, and are authorized by Chapter 212, 1001, and 1013, Florida Statutes, and a resolution of the District School Board dated January 12, 2016, authorizing the bond issue. These bonds are secured by a one-half cent local sales surtax, authorized on
2017-18 Final AFR, St. Johns County Schools September 2018 Page 70 of 132
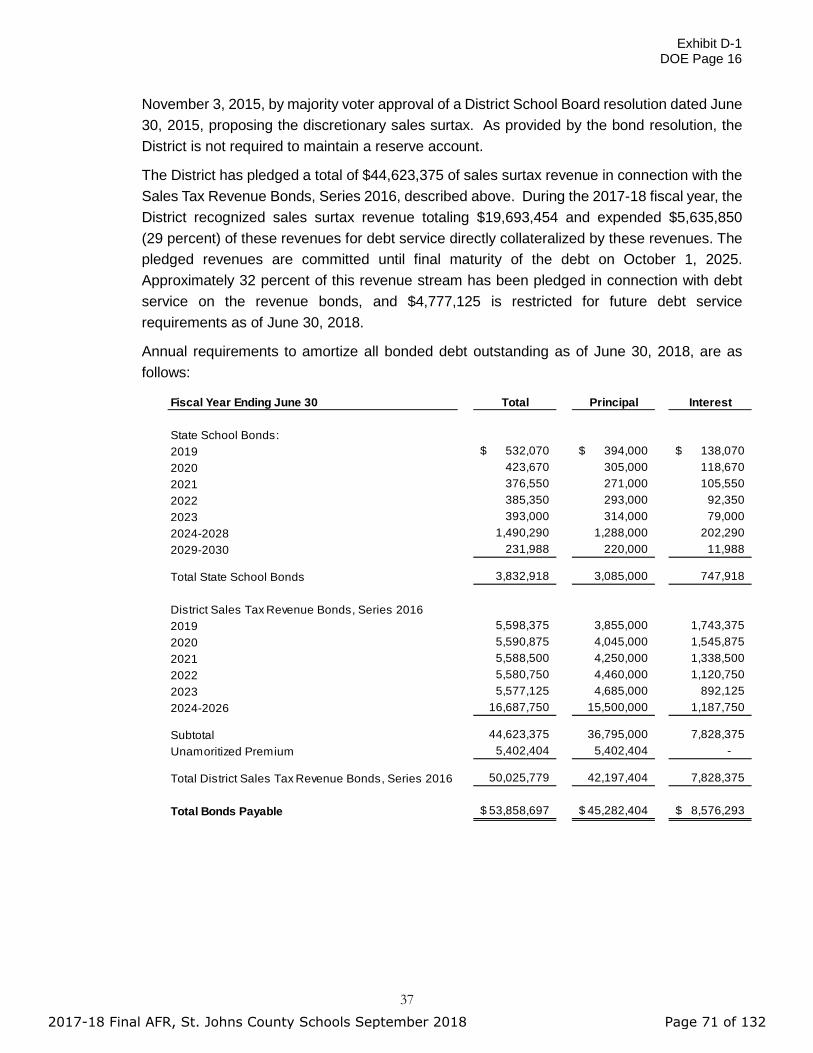
Exhibit D-1 DOE Page 16
37
November 3, 2015, by majority voter approval of a District School Board resolution dated June 30, 2015, proposing the discretionary sales surtax. As provided by the bond resolution, the District is not required to maintain a reserve account.
The District has pledged a total of $44,623,375 of sales surtax revenue in connection with the Sales Tax Revenue Bonds, Series 2016, described above. During the 2017-18 fiscal year, the District recognized sales surtax revenue totaling $19,693,454 and expended $5,635,850 (29 percent) of these revenues for debt service directly collateralized by these revenues. The pledged revenues are committed until final maturity of the debt on October 1, 2025. Approximately 32 percent of this revenue stream has been pledged in connection with debt service on the revenue bonds, and $4,777,125 is restricted for future debt service requirements as of June 30, 2018.
Annual requirements to amortize all bonded debt outstanding as of June 30, 2018, are as follows:
Fiscal Year Ending June 30 Total Principal Interest
State School Bonds:2019 532,070$ 394,000$ 138,070$ 2020 423,670 305,000 118,670 2021 376,550 271,000 105,550 2022 385,350 293,000 92,350 2023 393,000 314,000 79,000 2024-2028 1,490,290 1,288,000 202,290 2029-2030 231,988 220,000 11,988
Total State School Bonds 3,832,918 3,085,000 747,918
District Sales Tax Revenue Bonds, Series 2016 2019 5,598,375 3,855,000 1,743,375 2020 5,590,875 4,045,000 1,545,875 2021 5,588,500 4,250,000 1,338,500 2022 5,580,750 4,460,000 1,120,750 2023 5,577,125 4,685,000 892,125 2024-2026 16,687,750 15,500,000 1,187,750
Subtotal 44,623,375 36,795,000 7,828,375 Unamoritized Premium 5,402,404 5,402,404 -
Total District Sales Tax Revenue Bonds, Series 2016 50,025,779 42,197,404 7,828,375
Total Bonds Payable 53,858,697$ 45,282,404$ 8,576,293$
2017-18 Final AFR, St. Johns County Schools September 2018 Page 71 of 132

Exhibit D-1 DOE Page 16
38
Annual requirements to amortize the premium related to the Series 2016, Sales Tax Revenue Bond is as follows:
4. Defeased Debt
Refunding State School Bonds On April 27, 2017, the FDOE issued SBE, Capital Outlay Refunding Bonds, Series 2017A. The District’s portion of the refunding SBE Capital Outlay Bonds, Series 2017A, was $1,173,000.The refunding bonds established a trust account for the District’ s $1,000,000 portion of the SBE Capital Outlay Bonds, Series 2008A, maturing January 1, 2018, and later. Accordingly, the SBE Capital Outlay Bonds were called during the 2017-18 fiscal year and, as a result, the trust account assets and the liability for the in substance defeased bonds were removed from the government-wide financial statements as of June 30, 2018.
5. Changes in Long-Term Liabilities
The following is a summary of changes in long-term liabilities:
Fiscal Year Ending June 30 Interest
2019 771,772$ 2020 771,772 2021 771,772 2022 771,772 2023 771,772 2024-2025 1,543,544
Total 5,402,404$
DescriptionBeginning Balance Additions Deductions Ending Balance
Due In One Year
GOVERNMENTAL ACTIVITIES
Certificates of Participation Payable:
Certificates of Participation 91,490,000$ -$ 13,645,000$ 77,845,000$ 12,270,000$
Unamortized Premium 4,810,635 - 1,202,659 3,607,976 1,202,659
Total Certificates of Participation Payable 96,300,635 - 14,847,659 81,452,976 13,472,659
Bonds Payable:
District Sales Tax Revenue Bonds 40,535,000 - 3,740,000 36,795,000 3,855,000
Unamortized Premium 6,174,176 - 771,772 5,402,404 771,772
Total District Sales Tax Revenue Bonds 46,709,176 - 4,511,772 42,197,404 4,626,772
State School Bonds 4,891,000 - 1,806,000 3,085,000 394,000
Total Bonds Payable 51,600,176 - 6,317,772 45,282,404 5,020,772
Other Long-Term Liabilities:
Estimated Insurance Claims Payable 398,161 - 148,126 250,035 32,091
Compensated Absences Payable 27,515,197 2,629,122 1,596,348 28,547,971 1,596,348
Other Postemployment Benefits Payable 56,921,216 2,400,752 29,200,994 30,120,974 2,007,259
Net Pension Liability 169,872,824 93,936,247 80,383,823 183,425,248 1,699,972
Total Governmental Activities 402,608,209$ 98,966,121$ 132,494,722$ 369,079,608$ 23,829,101$
2017-18 Final AFR, St. Johns County Schools September 2018 Page 72 of 132

Exhibit D-1 DOE Page 16
39
For the governmental activities, compensated absences, other postemployment benefits, and pensions are generally liquidated with resources of the General Fund. The estimated insurance claims are generally liquidated with the resources of the proprietary fund.
K. Net Position – Net Investment in Capital Assets
In the government-wide statement of net position, the difference between total assets and deferred outflows of resources and total liabilities and deferred inflows of resources is net position. Generally accepted accounting principles require that net position be subdivided into the following three categories: net investment in capital assets, restricted net position, and unrestricted net position.
The composition of net investment in capital assets as of June 30, 2018, is shown in the table below:
Description Amount
Total Capital Assets, Net of Accumulated Depreciation 625,447,766$
Plus Deferred Outflow for Net Carrying Amount of Debt Refunding 1,574,509 Less Related Debt, Net of Unspent Proceeds: Certificates of Participation Payable 81,452,976$ Bonds Payable 45,282,404 Construction and Retainage Payable 7,544,991 Unspent Debt Proceeds (6,499,704) Total Related Debt, Net of Unspent Proceeds (127,780,667)
Total Net Investment in Capital Assets 499,241,608$
2017-18 Final AFR, St. Johns County Schools September 2018 Page 73 of 132
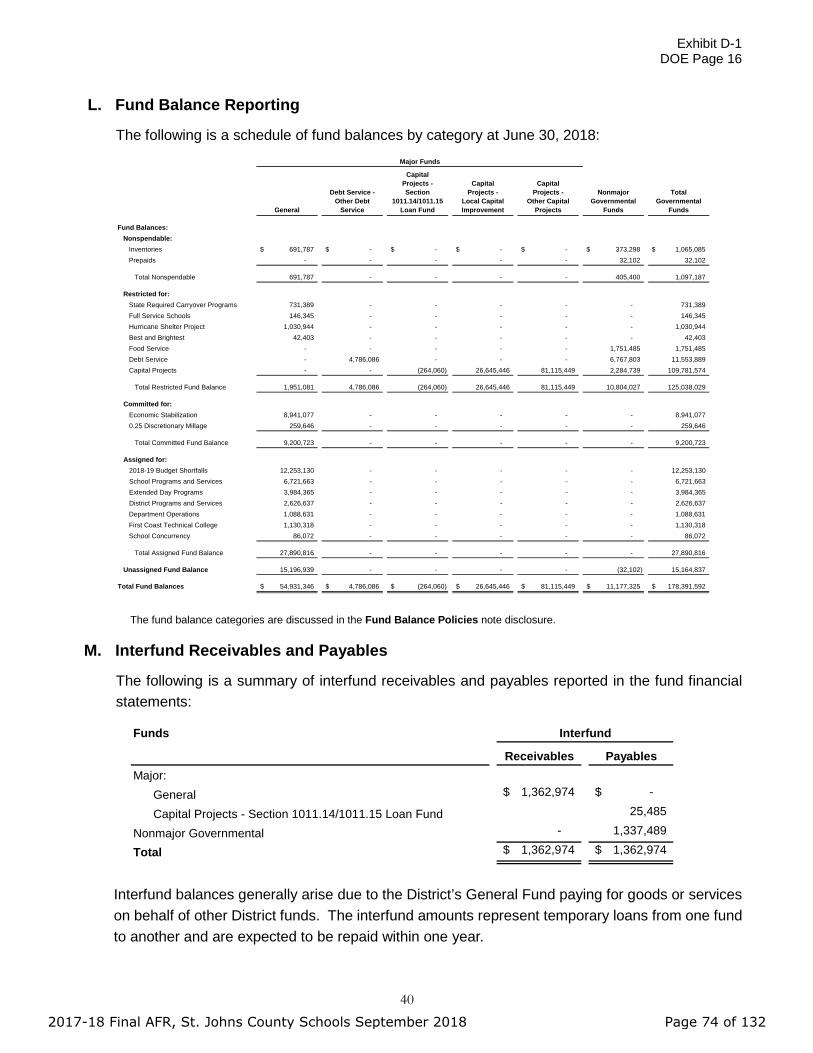
Exhibit D-1 DOE Page 16
40
L. Fund Balance Reporting
The following is a schedule of fund balances by category at June 30, 2018:
The fund balance categories are discussed in the Fund Balance Policies note disclosure.
M. Interfund Receivables and Payables
The following is a summary of interfund receivables and payables reported in the fund financial statements:
Interfund balances generally arise due to the District’s General Fund paying for goods or services on behalf of other District funds. The interfund amounts represent temporary loans from one fund to another and are expected to be repaid within one year.
General
Debt Service - Other Debt
Service
Capital Projects - Section
1011.14/1011.15 Loan Fund
Capital Projects -
Local Capital Improvement
Capital Projects -
Other Capital Projects
Nonmajor Governmental
Funds
Total Governmental
Funds
Fund Balances:Nonspendable:
Inventories 691,787$ -$ -$ -$ -$ 373,298$ 1,065,085$ Prepaids - - - - - 32,102 32,102
Total Nonspendable 691,787 - - - - 405,400 1,097,187
Restricted for:State Required Carryover Programs 731,389 - - - - - 731,389 Full Service Schools 146,345 - - - - - 146,345 Hurricane Shelter Project 1,030,944 - - - - - 1,030,944 Best and Brightest 42,403 - - - - - 42,403 Food Service - - - - - 1,751,485 1,751,485 Debt Service - 4,786,086 - - - 6,767,803 11,553,889 Capital Projects - - (264,060) 26,645,446 81,115,449 2,284,739 109,781,574
Total Restricted Fund Balance 1,951,081 4,786,086 (264,060) 26,645,446 81,115,449 10,804,027 125,038,029
Committed for:Economic Stabilization 8,941,077 - - - - - 8,941,077 0.25 Discretionary Millage 259,646 - - - - - 259,646
Total Committed Fund Balance 9,200,723 - - - - - 9,200,723
Assigned for:2018-19 Budget Shortfalls 12,253,130 - - - - - 12,253,130 School Programs and Services 6,721,663 - - - - - 6,721,663 Extended Day Programs 3,984,365 - - - - - 3,984,365 District Programs and Services 2,626,637 - - - - - 2,626,637 Department Operations 1,088,631 - - - - - 1,088,631 First Coast Technical College 1,130,318 - - - - - 1,130,318 School Concurrency 86,072 - - - - - 86,072
Total Assigned Fund Balance 27,890,816 - - - - - 27,890,816
Unassigned Fund Balance 15,196,939 - - - - (32,102) 15,164,837
Total Fund Balances 54,931,346$ 4,786,086$ (264,060)$ 26,645,446$ 81,115,449$ 11,177,325$ 178,391,592$
Major Funds
Funds
Receivables PayablesMajor:
General 1,362,974$ -$
Capital Projects - Section 1011.14/1011.15 Loan Fund 25,485
Nonmajor Governmental - 1,337,489
Total 1,362,974$ 1,362,974$
Interfund
2017-18 Final AFR, St. Johns County Schools September 2018 Page 74 of 132

Exhibit D-1 DOE Page 16
41
N. Revenues and Expenditures/Expenses
1. Schedule of State Revenue Sources
The following is a schedule of the District’s State revenue sources for the 2017-18 fiscal year:
Source AmountFlorida Education Finance Program (FEFP): Transportation 9,550,553$ Supplemental Academic Instruction 7,691,931 Instructional Materials 3,302,721 Comprehensive Reading Plan 1,812,403 Digital Classrooms Allocation 1,117,903 Florida Teachers Lead 639,159 Safe Schools 588,431 Other FEFP 85,859,376 Categorical Educational Program - Class Size Reduction 42,060,125 Workforce Development Program 4,341,488 Best and Brightest Teacher Scholarship Program 3,564,400 School Recognition 2,990,608 Motor Vehicle License Tax (Capital Outlay and Debt Service) 1,572,324 Voluntary Prekindergarten Program 1,078,270 Gross Receipts Tax (Public Education Capital Outlay) 521,177 Sales Tax Distribution (Formerly Racing Commission Funds) 206,750 Discretionary Lottery Funds 70,618 Mobile Home License Tax 70,330 Food Service Supplement 62,449 Miscellaneous 358,433
Total 167,459,449$
Accounting policies relating to certain State revenue sources are described in the State Revenue Sources note disclosure.
2017-18 Final AFR, St. Johns County Schools September 2018 Page 75 of 132
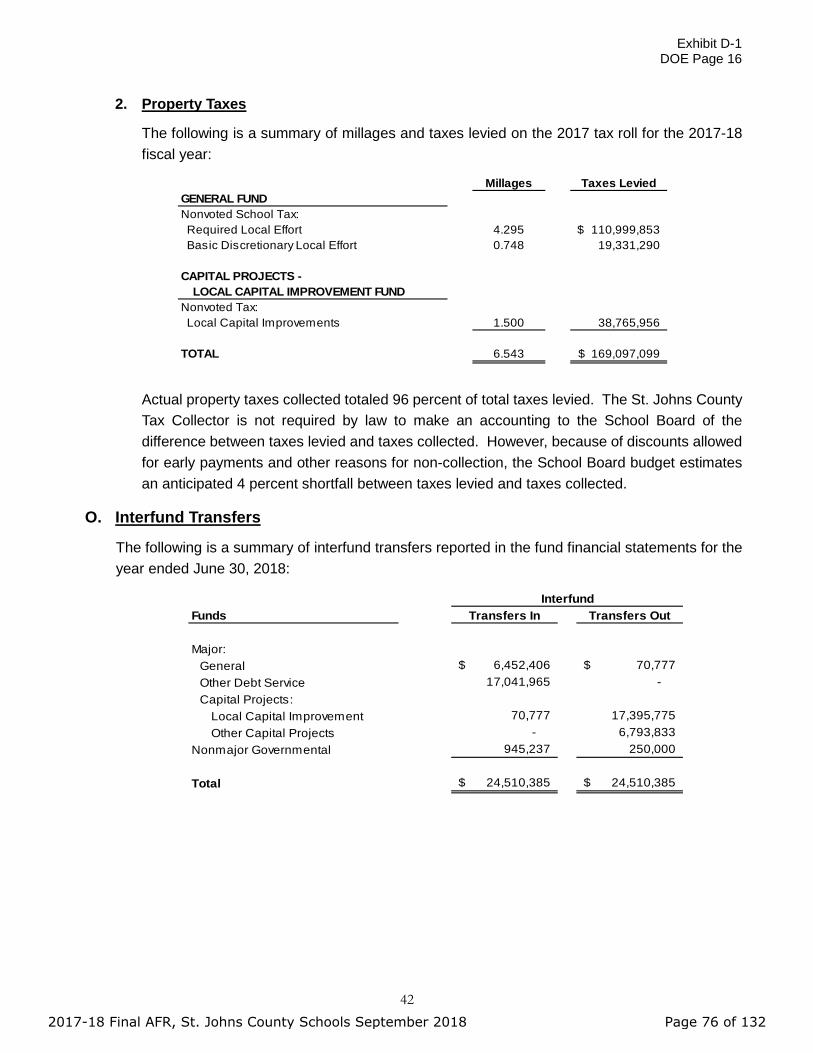
Exhibit D-1 DOE Page 16
42
2. Property Taxes
The following is a summary of millages and taxes levied on the 2017 tax roll for the 2017-18 fiscal year:
Millages Taxes LeviedGENERAL FUNDNonvoted School Tax: Required Local Effort 4.295 110,999,853$ Basic Discretionary Local Effort 0.748 19,331,290
CAPITAL PROJECTS - LOCAL CAPITAL IMPROVEMENT FUNDNonvoted Tax: Local Capital Improvements 1.500 38,765,956
TOTAL 6.543 169,097,099$
Actual property taxes collected totaled 96 percent of total taxes levied. The St. Johns County Tax Collector is not required by law to make an accounting to the School Board of the difference between taxes levied and taxes collected. However, because of discounts allowed for early payments and other reasons for non-collection, the School Board budget estimates an anticipated 4 percent shortfall between taxes levied and taxes collected.
O. Interfund Transfers
The following is a summary of interfund transfers reported in the fund financial statements for the year ended June 30, 2018:
Funds Transfers In Transfers Out
Major: General 6,452,406$ 70,777$ Other Debt Service 17,041,965 -
Capital Projects: Local Capital Improvement 70,777 17,395,775 Other Capital Projects - 6,793,833 Nonmajor Governmental 945,237 250,000
Total 24,510,385$ 24,510,385$
Interfund
2017-18 Final AFR, St. Johns County Schools September 2018 Page 76 of 132

Exhibit D-1 DOE Page 16
43
Interfund transfers represent permanent transfers of moneys between funds. The transfers out of the General Fund were to restore capital outlay tax levy funds to the Capital Projects – Local Capital Improvement Fund for certain unallowed expenditures incurred in the prior year. The transfers out of the Capital Projects – Local Capital Improvement Fund were to provide for debt service payments, property insurance premiums, and to fund certain expenditures of the District’s facilities, and maintenance departments. The transfers out of the Capital Projects – Other Capital Projects Fund were to transfer revenue to the General Fund for subsequent disbursement to charter schools and to provide for debt service payments. The transfers out of the nonmajor governmental funds were to support the General Fund for expenses related to school food service operations.
V. INTERNAL SERVICE FUNDS
The following is a summary of financial information as reported in the internal service funds for the 2017-18 fiscal year.
Group Workers'Health and Group Group Compensation
Hospitalization Dental Vision LiabilityInsurance Insurance Insurance Insurance Total
Total Assets 33,451,943$ 1,411,997$ 1,723,420$ 4,877,797$ 41,465,157$
Liabilities and Net Position:Salaries and Benefits Payable 437$ -$ -$ 1,133$ 1,570$ Payroll Deductions and
Withholdings Payable 166 - - 3 169 Accounts Payable 2,417,730 61 34,824 436 2,453,051 Estimated Insurance Claims Payable 2,626,941 268,623 53,880 250,035 3,199,479 Net Position: Investment in Capital Assets 182,069 - - - 182,069 Unrestricted Net Position 28,224,600 1,143,313 1,634,716 4,626,190 35,628,819
Total Liabilities and Net Position 33,451,943$ 1,411,997$ 1,723,420$ 4,877,797$ 41,465,157$
Revenues:Operating Revenues 50,411,036$ 2,952,765$ 838,014$ 1,445,051$ 55,646,866$ Investment Income 257,970 13,439 15,004 41,970 328,383
Total Revenues 50,669,006 2,966,204 853,018 1,487,021 55,975,249 Total Expenses (41,262,522) (3,168,564) (611,105) (1,580,244) (46,622,435)
Increase (Decrease) in Net Position 9,406,484$ (202,360)$ 241,913$ (93,223)$ 9,352,814$
VI. LITIGATION
The District is a defendant in various lawsuits. Although the outcome of these lawsuits is not presently determinable, in the opinion of the District’s legal counsel, the resolution of these matters will not have a material adverse effect on the financial condition of the District.
2017-18 Final AFR, St. Johns County Schools September 2018 Page 77 of 132
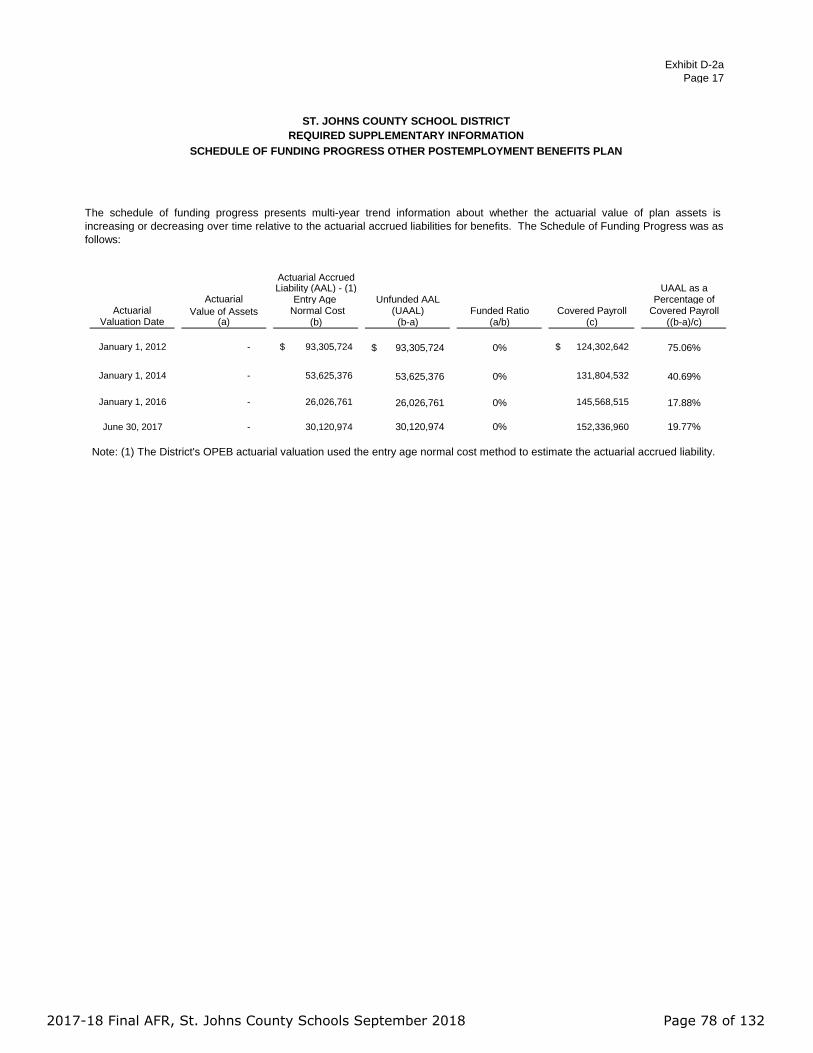
Exhibit D-2aPage 17
Actuarial AccruedLiability (AAL) - (1) UAAL as a
Actuarial Entry Age Unfunded AAL Percentage ofActuarial Value of Assets Normal Cost (UAAL) Funded Ratio Covered Payroll Covered Payroll
Valuation Date (a) (b) (b-a) (a/b) (c) ((b-a)/c)
January 1, 2012 - 93,305,724$ 93,305,724$ 0% 124,302,642$ 75.06%
January 1, 2014 - 53,625,376 53,625,376 0% 131,804,532 40.69%
January 1, 2016 - 26,026,761 26,026,761 0% 145,568,515 17.88%
June 30, 2017 - 30,120,974 30,120,974 0% 152,336,960 19.77%
ST. JOHNS COUNTY SCHOOL DISTRICTREQUIRED SUPPLEMENTARY INFORMATION
SCHEDULE OF FUNDING PROGRESS OTHER POSTEMPLOYMENT BENEFITS PLAN
The schedule of funding progress presents multi-year trend information about whether the actuarial value of plan assets isincreasing or decreasing over time relative to the actuarial accrued liabilities for benefits. The Schedule of Funding Progress was asfollows:
Note: (1) The District's OPEB actuarial valuation used the entry age normal cost method to estimate the actuarial accrued liability.
2017-18 Final AFR, St. Johns County Schools September 2018 Page 78 of 132
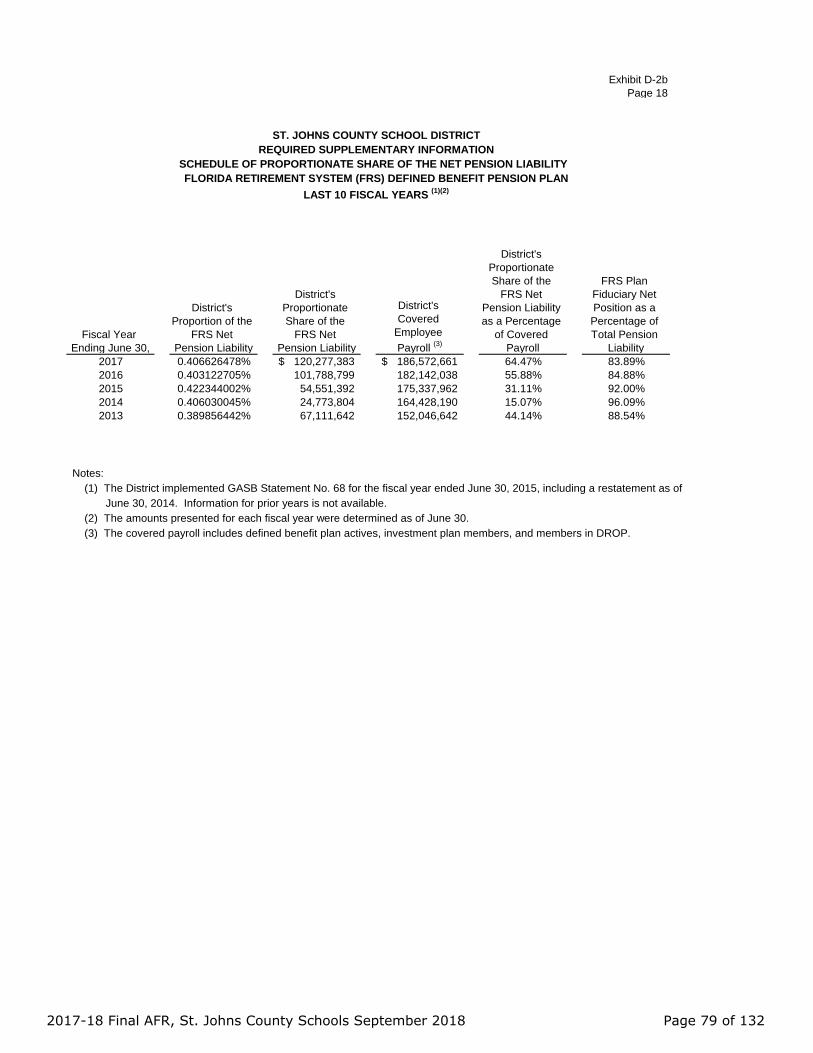
Exhibit D-2bPage 18
Fiscal Year Ending June 30,
District's Proportion of the
FRS Net Pension Liability
District's Proportionate Share of the
FRS Net Pension Liability
District's Covered
Employee Payroll (3)
District's Proportionate Share of the
FRS Net Pension Liability as a Percentage
of Covered Payroll
FRS Plan Fiduciary Net Position as a Percentage of Total Pension
Liability2017 0.406626478% 120,277,383$ 186,572,661$ 64.47% 83.89%2016 0.403122705% 101,788,799 182,142,038 55.88% 84.88%2015 0.422344002% 54,551,392 175,337,962 31.11% 92.00%2014 0.406030045% 24,773,804 164,428,190 15.07% 96.09%2013 0.389856442% 67,111,642 152,046,642 44.14% 88.54%
Notes: (1) The District implemented GASB Statement No. 68 for the fiscal year ended June 30, 2015, including a restatement as of June 30, 2014. Information for prior years is not available. (2) The amounts presented for each fiscal year were determined as of June 30. (3) The covered payroll includes defined benefit plan actives, investment plan members, and members in DROP.
ST. JOHNS COUNTY SCHOOL DISTRICTREQUIRED SUPPLEMENTARY INFORMATION
SCHEDULE OF PROPORTIONATE SHARE OF THE NET PENSION LIABILITY FLORIDA RETIREMENT SYSTEM (FRS) DEFINED BENEFIT PENSION PLAN
LAST 10 FISCAL YEARS (1)(2)
2017-18 Final AFR, St. Johns County Schools September 2018 Page 79 of 132
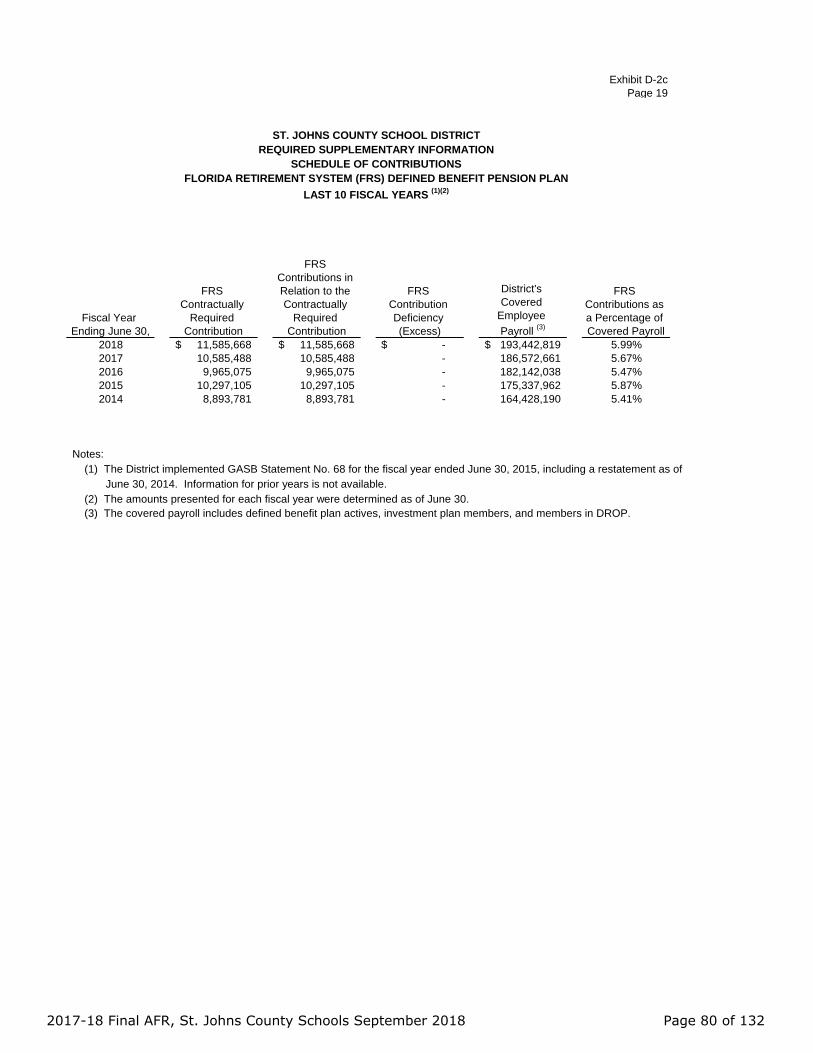
Exhibit D-2cPage 19
Fiscal Year Ending June 30,
FRS Contractually
Required Contribution
FRS Contributions in Relation to the Contractually
Required Contribution
FRS Contribution Deficiency (Excess)
District's Covered
Employee Payroll (3)
FRS Contributions as a Percentage of Covered Payroll
2018 11,585,668$ 11,585,668$ -$ 193,442,819$ 5.99%2017 10,585,488 10,585,488 - 186,572,661 5.67%2016 9,965,075 9,965,075 - 182,142,038 5.47%2015 10,297,105 10,297,105 - 175,337,962 5.87%2014 8,893,781 8,893,781 - 164,428,190 5.41%
Notes: (1) The District implemented GASB Statement No. 68 for the fiscal year ended June 30, 2015, including a restatement as of June 30, 2014. Information for prior years is not available. (2) The amounts presented for each fiscal year were determined as of June 30. (3) The covered payroll includes defined benefit plan actives, investment plan members, and members in DROP.
ST. JOHNS COUNTY SCHOOL DISTRICTREQUIRED SUPPLEMENTARY INFORMATION
SCHEDULE OF CONTRIBUTIONSFLORIDA RETIREMENT SYSTEM (FRS) DEFINED BENEFIT PENSION PLAN
LAST 10 FISCAL YEARS (1)(2)
2017-18 Final AFR, St. Johns County Schools September 2018 Page 80 of 132

Exhibit D-2dPage 20
Fiscal Year Ending June 30,
District's Proportion of the HIS Net Pension
Liability
District's Proportionate
Share of the HIS Net Pension
Liability
District's Covered
Employee Payroll (3)
District's Proportionate
Share of the HIS Net Pension Liability as a
Percentage of Covered Payroll
HIS Plan Fiduciary Net Position as a Percentage of Total Pension
Liability2017 0.590583056% 63,147,865$ 186,572,661$ 33.85% 1.64%2016 0.584182280% 68,084,025 182,142,038 37.38% 0.97%2015 0.577379055% 58,883,581 175,337,962 33.58% 0.50%2014 0.551221367% 51,540,543 164,428,190 31.35% 0.99%2013 0.523120679% 45,544,533 152,046,642 29.95% 1.78%
Notes: (1) The District implemented GASB Statement No. 68 for the fiscal year ended June 30, 2015, including a restatement as of June 30, 2014. Information for prior years is not available. (2) The amounts presented for each fiscal year were determined as of June 30. (3) The covered payroll includes defined benefit plan actives, investment plan members, and members in DROP.
ST. JOHNS COUNTY SCHOOL DISTRICTREQUIRED SUPPLEMENTARY INFORMATION
SCHEDULE OF PROPORTIONATE SHARE OF THE NET PENSION LIABILITYHEALTH INSURANCE SUBSIDY PENSION PLAN
LAST 10 FISCAL YEARS (1)(2)
2017-18 Final AFR, St. Johns County Schools September 2018 Page 81 of 132
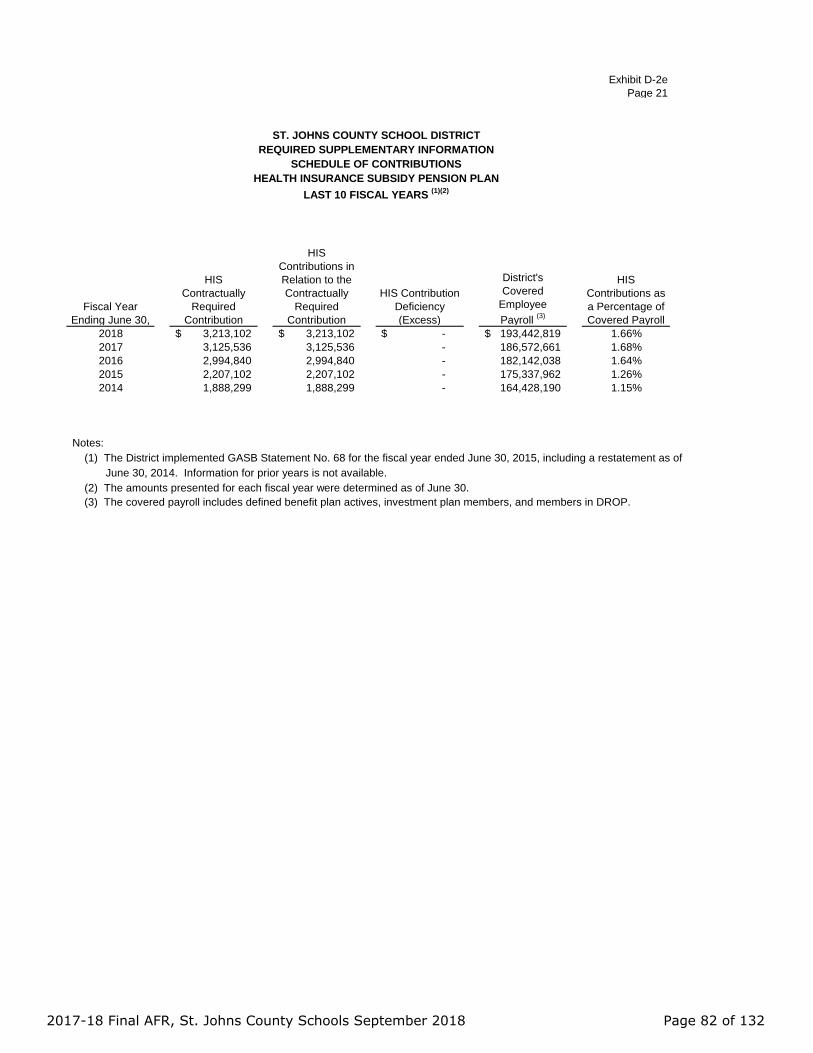
Exhibit D-2ePage 21
Fiscal Year Ending June 30,
HIS Contractually
Required Contribution
HIS Contributions in Relation to the Contractually
Required Contribution
HIS Contribution Deficiency (Excess)
District's Covered
Employee Payroll (3)
HIS Contributions as a Percentage of Covered Payroll
2018 3,213,102$ 3,213,102$ -$ 193,442,819$ 1.66%2017 3,125,536 3,125,536 - 186,572,661 1.68%2016 2,994,840 2,994,840 - 182,142,038 1.64%2015 2,207,102 2,207,102 - 175,337,962 1.26%2014 1,888,299 1,888,299 - 164,428,190 1.15%
Notes: (1) The District implemented GASB Statement No. 68 for the fiscal year ended June 30, 2015, including a restatement as of June 30, 2014. Information for prior years is not available. (2) The amounts presented for each fiscal year were determined as of June 30. (3) The covered payroll includes defined benefit plan actives, investment plan members, and members in DROP.
ST. JOHNS COUNTY SCHOOL DISTRICTREQUIRED SUPPLEMENTARY INFORMATION
SCHEDULE OF CONTRIBUTIONSHEALTH INSURANCE SUBSIDY PENSION PLAN
LAST 10 FISCAL YEARS (1)(2)
2017-18 Final AFR, St. Johns County Schools September 2018 Page 82 of 132

Exhibit D-2f Page 22
NOTES TO REQUIRED SUPPLEMENTARY INFORMATION
1. BUDGETARY BASIS OF ACCOUNTING
The Board follows procedures established by State statutes and SBE rules in establishing budget balances for governmental funds, as described below:
Budgets are prepared, public hearings are held, and original budgets are adopted annually for all governmental fund types in accordance with procedures and time intervals prescribed by law and SBE rules.
Appropriations are controlled at the object level (e.g., salaries, purchased services, and capital outlay) within each activity (e.g., instruction, student personnel services, and school administration) and may be amended by resolution at any Board meeting prior to the due date for the annual financial report.
Budgets are prepared using the same modified accrual basis as is used to account for governmental funds.
Budgetary information is integrated into the accounting system and, to facilitate budget control, budget balances are encumbered when purchase orders are issued. Appropriations lapse at fiscal year-end and encumbrances outstanding are honored from the subsequent year's appropriations.
2. SCHEDULE OF OTHER POSTEMPLOYMENT BENEFIT (OPEB) PLAN LIABILITY AND SCHEDULE OF CHANGE IN OPEB PLAN LIABILITY
Changes in assumptions and other inputs include the change in the discount rate from 2.92 percent as of the beginning of the measurement period to 3.56 percent as of the end of the measurement period. This change is reflected in the Schedule of Changes in Total OPEB Plan Liability.
There are not assets accumulated in a trust to pay related benefits.
3. SCHEDULE OF NET POSITION LIABILITY AND SCHEDULE OF CONTRIBUTIONS – FLORIDA RETIREMENT SYSTEM (FRS) DEFINED BENEFIT PENSION PLAN
Changes in assumptions. The long-term expected rate of return was decreased from 7.60 percent to 7.10 percent.
4. SCHEDULE OF NET PENSION LIABILITY AND SCHEDULE OF CONTRIBUTIONS – HEALTH INSURANCE SUBSIDY PENSION PLAN
Changes in assumptions. The municipal bond rate used to determine total pension liability was increased from 2.85 percent to 3.58 percent.
2017-18 Final AFR, St. Johns County Schools September 2018 Page 83 of 132

Exhibit E-1Page 23
DISTRICT SCHOOL BOARD OF ST. JOHNS COUNTYSCHEDULE OF REVENUES, EXPENDITURES AND CHANGES IN FUND BALANCES - BUDGET AND ACTUALGENERAL FUNDFor the Fiscal Year Ended June 30, 2018
Original FinalREVENUESFederal Direct 3100 200,000.00 200,000.00 235,288.01 35,288.01Federal Through State and Local 3200 53,433.26 53,433.26 0.00State Sources 3300 161,543,248.00 166,399,193.73 165,204,418.09 (1,194,775.64)Local Sources:
Property Taxes Levied, Tax Redemptions and Excess Fees for Operational Purposes
3411, 3421, 3423 125,235,358.00 125,235,358.00 125,817,425.72 582,067.72
Property Taxes Levied, Tax Redemptions and Excess Fees for Debt Service
3412, 3421, 3423 0.00 0.00
Property Taxes Levied, Tax Redemptions and Excess Fees for Capital Projects
3413, 3421, 3423 0.00 0.00
Local Sales Taxes 3418, 3419 0.00 0.00Charges for Service - Food Service 345X 0.00 0.00Impact Fees 3496 0.00 0.00Other Local Revenue 3,823,839.00 12,838,568.70 16,193,265.55 3,354,696.85Total Local Sources 3400 129,059,197.00 138,073,926.70 142,010,691.27 3,936,764.57
Total Revenues 290,802,445.00 304,726,553.69 307,503,830.63 2,777,276.94EXPENDITURESCurrent:
Instruction 5000 190,637,310.93 198,562,502.76 181,189,784.75 17,372,718.01Student Support Services 6100 19,000,250.00 20,349,065.52 19,917,926.86 431,138.66Instructional Media Services 6200 4,894,417.00 5,030,540.88 4,884,761.02 145,779.86Instruction and Curriculum Development Services 6300 4,660,543.00 4,999,397.56 4,837,880.18 161,517.38Instructional Staff Training Services 6400 439,493.00 3,597,068.77 3,301,164.86 295,903.91Instruction-Related Technology 6500 9,026,762.00 9,145,824.12 8,740,035.15 405,788.97Board 7100 1,101,950.00 1,115,400.16 987,297.41 128,102.75General Administration 7200 330,145.00 364,382.63 344,483.40 19,899.23School Administration 7300 19,357,044.07 20,603,430.69 18,605,208.73 1,998,221.96Facilities Acquisition and Construction 7410 4,973,766.00 6,517,865.95 5,441,845.47 1,076,020.48Fiscal Services 7500 2,126,533.00 2,034,646.76 2,008,492.43 26,154.33Food Services 7600 52,450.04 (52,450.04)Central Services 7700 3,721,158.00 3,761,308.40 3,886,466.68 (125,158.28)Student Transportation Services 7800 14,486,187.00 14,687,899.88 13,759,747.43 928,152.45Operation of Plant 7900 24,659,239.69 24,994,590.80 23,941,143.77 1,053,447.03Maintenance of Plant 8100 8,627,703.31 9,199,379.97 8,867,238.23 332,141.74Administrative Technology Services 8200 708,313.00 694,167.43 623,092.32 71,075.11Community Services 9100 237,291.00 8,539,030.74 5,012,486.18 3,526,544.56
Debt Service: (Function 9200)Redemption of Principal 710 0.00 0.00Interest 720 0.00 0.00Due and Fees 730 0.00 0.00Miscellaneous 790 0.00 0.00
Capital Outlay:Facilities Acquisition and Construction 7420 1,226,700.55 204,811.60 1,021,888.95Other Capital Outlay 9300 679,319.40 357,627.40 321,692.00
Total Expenditures 308,988,106.00 336,102,522.97 306,963,943.91 29,138,579.06Excess (Deficiency) of Revenues Over (Under) Expenditures (18,185,661.00) (31,375,969.28) 539,886.72 31,915,856.00OTHER FINANCING SOURCES (USES)Issuance of Bonds 3710 0.00 0.00
Premium on Sale of Bonds 3791 0.00 0.00Discount on Sale of Bonds 891 0.00 0.00
Proceeds of Lease-Purchase Agreements 3750 0.00 0.00Premium on Lease-Purchase Agreements 3793 0.00 0.00Discount on Lease-Purchase Agreements 893 0.00 0.00
Loans 3720 0.00 0.00Sale of Capital Assets 3730 0.00 0.00Loss Recoveries 3740 182,508.20 182,508.20Proceeds of Forward Supply Contract 3760 0.00 0.00Face Value of Refunding Bonds 3715 0.00 0.00
Premium on Refunding Bonds 3792 0.00 0.00Discount on Refunding Bonds 892 0.00 0.00
Refunding Lease-Purchase Agreements 3755 0.00 0.00Premium on Refunding Lease-Purchase Agreements 3794 0.00 0.00Discount on Refunding Lease-Purchase Agreements 894 0.00 0.00
Payments to Refunding Escrow Agent (Function 9299) 760 0.00 0.00Transfers In 3600 6,452,406.00 6,452,406.00 6,452,406.00 0.00Transfers Out 9700 (70,777.17) (70,777.17) 0.00Total Other Financing Sources (Uses) 6,452,406.00 6,381,628.83 6,564,137.03 182,508.20SPECIAL ITEMS__________________________________________ 0.00 0.00EXTRAORDINARY ITEMS__________________________________________ 0.00 0.00Net Change in Fund Balances (11,733,255.00) (24,994,340.45) 7,104,023.75 32,098,364.20Fund Balances, July 1, 2017 2800 47,827,322.47 47,827,322.47 47,827,322.47 0.00Adjustments to Fund Balances 2891 0.00 0.00Fund Balances, June 30, 2018 2700 36,094,067.47 22,832,982.02 54,931,346.22 32,098,364.20
ESE 145
Budgeted AmountsAccountNumber
ActualAmounts
Variance withFinal Budget -
Positive (Negative)
2017-18 Final AFR, St. Johns County Schools September 2018 Page 84 of 132

Exhibit F-1aPage 24
DISTRICT SCHOOL BOARD OF ST. JOHNS COUNTYCOMBINING BALANCE SHEETNONMAJOR GOVERNMENTAL FUNDSJune 30, 2018
FoodServices
Other FederalPrograms
410 420ASSETS AND DEFERRED OUTFLOWS OF RESOURCESASSETSCash and Cash Equivalents 1110 2,247,044.00 0.00 2,247,044.00Investments 1160 0.00 0.00 0.00Taxes Receivable, Net 1120 0.00 0.00 0.00Accounts Receivable, Net 1131 640.34 457.00 1,097.34Interest Receivable on Investments 1170 0.00 0.00 0.00Due From Other Agencies 1220 0.00 1,485,551.03 1,485,551.03Due From Budgetary Funds 1141 0.00 0.00 0.00Due From Insurer 1180 0.00 0.00 0.00Due From Component Units 1143 0.00 0.00 0.00Due From Internal Funds 1142 0.00 0.00 0.00Cash with Fiscal/Service Agents 1114 0.00 0.00 0.00Inventory 1150 373,298.10 0.00 373,298.10Prepaid Items 1230 0.00 32,101.76 32,101.76Long-Term Investments 1460 0.00 0.00 0.00Total Assets 2,620,982.44 1,518,109.79 4,139,092.23DEFERRED OUTFLOWS OF RESOURCESNet Carrying Amount of Debt Refunding 1920 0.00 0.00 0.00Total Deferred Outflows of Resources 0.00 0.00 0.00Total Assets and Deferred Outflows of Resources 2,620,982.44 1,518,109.79 4,139,092.23LIABILITIES, DEFERRED INFLOWS OF RESOURCES
AND FUND BALANCESLIABILITIES Cash Overdraft 2125 0.00 0.00 0.00Accrued Salaries and Benefits 2110 26,533.55 60,834.07 87,367.62Payroll Deductions and Withholdings 2170 8,510.08 18,859.71 27,369.79Accounts Payable 2120 4,049.71 55,826.85 59,876.56Due to Component Units 2163 0.00 0.00 0.00Current Notes Payable 2250 0.00 0.00 0.00Accrued Interest Payable 2210 0.00 0.00 0.00Deposits Payable 2220 457,105.89 0.00 457,105.89Due to Other Agencies 2230 0.00 45,100.19 45,100.19Due to Budgetary Funds 2161 0.00 1,337,488.97 1,337,488.97Due to Internal Funds 2162 0.00 0.00 0.00Due to Fiscal Agent 2240 0.00 0.00 0.00Pension Liability 2115 0.00 0.00 0.00Other Postemployment Benefits Liability 2116 0.00 0.00 0.00Judgments Payable 2130 0.00 0.00 0.00Construction Contracts Payable 2140 0.00 0.00 0.00Construction Contracts Payable - Retained Percentage 2150 0.00 0.00 0.00Matured Bonds Payable 2180 0.00 0.00 0.00Matured Interest Payable 2190 0.00 0.00 0.00Unearned Revenues 2410 0.00 0.00 0.00Unavailable Revenues 2410 0.00 0.00 0.00Total Liabilities 496,199.23 1,518,109.79 2,014,309.02DEFERRED INFLOWS OF RESOURCESDeficit Net Carrying Amount of Debt Refunding 2620 0.00 0.00 0.00Deferred Revenues 2630 0.00 0.00 0.00Total Deferred Inflows of Resources 0.00 0.00 0.00FUND BALANCESNonspendable:
Inventory 2711 373,298.10 0.00 373,298.10Prepaid Amounts 2712 0.00 32,101.76 32,101.76Permanent Fund Principal 2713 0.00 0.00 0.00Other Not in Spendable Form 2719 0.00 0.00 0.00
Total Nonspendable Fund Balances 2710 373,298.10 32,101.76 405,399.86Restricted for:
Economic Stabilization 2721 0.00 0.00 0.00Federal Required Carryover Programs 2722 0.00 0.00 0.00State Required Carryover Programs 2723 0.00 0.00 0.00Local Sales Tax and Other Tax Levy 2724 0.00 0.00 0.00Debt Service 2725 0.00 0.00 0.00Capital Projects 2726 0.00 0.00 0.00Restricted for Special Revenue - Food Service 2729 1,751,485.11 0.00 1,751,485.11Restricted for Other Restrictions 2729 0.00 0.00 0.00
Total Restricted Fund Balances 2720 1,751,485.11 0.00 1,751,485.11Committed to:
Economic Stabilization 2731 0.00 0.00 0.00Contractual Agreements 2732 0.00 0.00 0.00Committed for .25 Discretionary Millage 2739 0.00 0.00 0.00Committed for ________________ 2739 0.00 0.00 0.00
Total Committed Fund Balances 2730 0.00 0.00 0.00Assigned to:
Special Revenue 2741 0.00 0.00 0.00Debt Service 2742 0.00 0.00 0.00Capital Projects 2743 0.00 0.00 0.00Permanent Fund 2744 0.00 0.00 0.00Assigned for Other 2749 0.00 0.00 0.00Assigned for __________________ 2749 0.00 0.00 0.00
Total Assigned Fund Balances 2740 0.00 0.00 0.00Total Unassigned Fund Balances 2750 0.00 (32,101.76) (32,101.76)
Total Fund Balances 2700 2,124,783.21 0.00 2,124,783.21Total Liabilities, Deferred Inflows ofResources and Fund Balances 2,620,982.44 1,518,109.79 4,139,092.23
The notes to financial statements are an integral part of this statement.ESE 145
Special Revenue FundsTotal NonmajorSpecial Revenue
FundsAccountNumber
2017-18 Final AFR, St. Johns County Schools September 2018 Page 85 of 132

Exhibit F-1bPage 25
DISTRICT SCHOOL BOARD OF ST. JOHNS COUNTYCOMBINING BALANCE SHEET (CONTINUED)NONMAJOR GOVERNMENTAL FUNDSJune 30, 2018
SBE/COBIBonds
ARRADebt Service
210 299ASSETS AND DEFERRED OUTFLOWS OF RESOURCESASSETSCash and Cash Equivalents 1110 0.00 0.00 0.00Investments 1160 74,487.12 6,693,315.60 6,767,802.72Taxes Receivable, Net 1120 0.00 0.00 0.00Accounts Receivable, Net 1131 0.00 0.00 0.00Interest Receivable on Investments 1170 0.00 0.00 0.00Due From Other Agencies 1220 0.00 0.00 0.00Due From Budgetary Funds 1141 0.00 0.00 0.00Due From Insurer 1180 0.00 0.00 0.00Due From Component Units 1143 0.00 0.00 0.00Due From Internal Funds 1142 0.00 0.00 0.00Cash with Fiscal/Service Agents 1114 0.00 0.00 0.00Inventory 1150 0.00 0.00 0.00Prepaid Items 1230 0.00 0.00 0.00Long-Term Investments 1460 0.00 0.00 0.00Total Assets 74,487.12 6,693,315.60 6,767,802.72DEFERRED OUTFLOWS OF RESOURCESNet Carrying Amount of Debt Refunding 1920 0.00 0.00 0.00Total Deferred Outflows of Resources 0.00 0.00 0.00Total Assets and Deferred Outflows of Resources 74,487.12 6,693,315.60 6,767,802.72LIABILITIES, DEFERRED INFLOWS OF RESOURCES
AND FUND BALANCESLIABILITIES Cash Overdraft 2125 0.00 0.00 0.00Accrued Salaries and Benefits 2110 0.00 0.00 0.00Payroll Deductions and Withholdings 2170 0.00 0.00 0.00Accounts Payable 2120 0.00 0.00 0.00Due to Component Units 2163 0.00 0.00 0.00Current Notes Payable 2250 0.00 0.00 0.00Accrued Interest Payable 2210 0.00 0.00 0.00Deposits Payable 2220 0.00 0.00 0.00Due to Other Agencies 2230 0.00 0.00 0.00Due to Budgetary Funds 2161 0.00 0.00 0.00Due to Internal Funds 2162 0.00 0.00 0.00Due to Fiscal Agent 2240 0.00 0.00 0.00Pension Liability 2115 0.00 0.00 0.00Other Postemployment Benefits Liability 2116 0.00 0.00 0.00Judgments Payable 2130 0.00 0.00 0.00Construction Contracts Payable 2140 0.00 0.00 0.00Construction Contracts Payable - Retained Percentage 2150 0.00 0.00 0.00Matured Bonds Payable 2180 0.00 0.00 0.00Matured Interest Payable 2190 0.00 0.00 0.00Unearned Revenues 2410 0.00 0.00 0.00Unavailable Revenues 2410 0.00 0.00 0.00Total Liabilities 0.00 0.00 0.00DEFERRED INFLOWS OF RESOURCESDeficit Net Carrying Amount of Debt Refunding 2620 0.00 0.00 0.00Deferred Revenues 2630 0.00 0.00 0.00Total Deferred Inflows of Resources 0.00 0.00 0.00FUND BALANCESNonspendable:
Inventory 2711 0.00 0.00 0.00Prepaid Amounts 2712 0.00 0.00 0.00Permanent Fund Principal 2713 0.00 0.00 0.00Other Not in Spendable Form 2719 0.00 0.00 0.00
Total Nonspendable Fund Balances 2710 0.00 0.00 0.00Restricted for:
Economic Stabilization 2721 0.00 0.00 0.00Federal Required Carryover Programs 2722 0.00 0.00 0.00State Required Carryover Programs 2723 0.00 0.00 0.00Local Sales Tax and Other Tax Levy 2724 0.00 0.00 0.00Debt Service 2725 74,487.12 6,693,315.60 6,767,802.72Capital Projects 2726 0.00 0.00 0.00Restricted for Special Revenue - Food Service 2729 0.00 0.00 0.00Restricted for Other Restrictions 2729 0.00 0.00 0.00
Total Restricted Fund Balances 2720 74,487.12 6,693,315.60 6,767,802.72Committed to:
Economic Stabilization 2731 0.00 0.00 0.00Contractual Agreements 2732 0.00 0.00 0.00Committed for .25 Discretionary Millage 2739 0.00 0.00 0.00Committed for ________________ 2739 0.00 0.00 0.00
Total Committed Fund Balances 2730 0.00 0.00 0.00Assigned to:
Special Revenue 2741 0.00 0.00 0.00Debt Service 2742 0.00 0.00 0.00Capital Projects 2743 0.00 0.00 0.00Permanent Fund 2744 0.00 0.00 0.00Assigned for Other 2749 0.00 0.00 0.00Assigned for __________________ 2749 0.00 0.00 0.00
Total Assigned Fund Balances 2740 0.00 0.00 0.00Total Unassigned Fund Balances 2750 0.00 0.00 0.00
Total Fund Balances 2700 74,487.12 6,693,315.60 6,767,802.72Total Liabilities, Deferred Inflows ofResources and Fund Balances 74,487.12 6,693,315.60 6,767,802.72
The notes to financial statements are an integral part of this statement.ESE 145
Debt Service FundsTotal Nonmajor
Debt ServiceFunds
AccountNumber
2017-18 Final AFR, St. Johns County Schools September 2018 Page 86 of 132

Exhibit F-1cPage 26
DISTRICT SCHOOL BOARD OF ST. JOHNS COUNTYCOMBINING BALANCE SHEET (CONTINUED)NONMAJOR GOVERNMENTAL FUNDSJune 30, 2018
Public EducationCapital Outlay (PECO)
Capital Outlay andDebt Service
340 360ASSETS AND DEFERRED OUTFLOWS OF RESOURCESASSETSCash and Cash Equivalents 1110 18,487.10 1,917,050.88 1,935,537.98Investments 1160 0.00 0.00 0.00Taxes Receivable, Net 1120 0.00 0.00 0.00Accounts Receivable, Net 1131 0.00 0.00 0.00Interest Receivable on Investments 1170 0.00 0.00 0.00Due From Other Agencies 1220 351,049.00 0.00 351,049.00Due From Budgetary Funds 1141 0.00 0.00 0.00Due From Insurer 1180 0.00 0.00 0.00Due From Component Units 1143 0.00 0.00 0.00Due From Internal Funds 1142 0.00 0.00 0.00Cash with Fiscal/Service Agents 1114 0.00 0.00 0.00Inventory 1150 0.00 0.00 0.00Prepaid Items 1230 0.00 0.00 0.00Long-Term Investments 1460 0.00 0.00 0.00Total Assets 369,536.10 1,917,050.88 2,286,586.98DEFERRED OUTFLOWS OF RESOURCESNet Carrying Amount of Debt Refunding 1920 0.00 0.00 0.00Total Deferred Outflows of Resources 0.00 0.00 0.00Total Assets and Deferred Outflows of Resources 369,536.10 1,917,050.88 2,286,586.98LIABILITIES, DEFERRED INFLOWS OF RESOURCES
AND FUND BALANCESLIABILITIES Cash Overdraft 2125 0.00 0.00 0.00Accrued Salaries and Benefits 2110 0.00 0.00 0.00Payroll Deductions and Withholdings 2170 0.00 0.00 0.00Accounts Payable 2120 0.00 0.00 0.00Due to Component Units 2163 0.00 0.00 0.00Current Notes Payable 2250 0.00 0.00 0.00Accrued Interest Payable 2210 0.00 0.00 0.00Deposits Payable 2220 0.00 0.00 0.00Due to Other Agencies 2230 0.00 0.00 0.00Due to Budgetary Funds 2161 0.00 0.00 0.00Due to Internal Funds 2162 0.00 0.00 0.00Due to Fiscal Agent 2240 0.00 0.00 0.00Pension Liability 2115 0.00 0.00 0.00Other Postemployment Benefits Liability 2116 0.00 0.00 0.00Judgments Payable 2130 0.00 0.00 0.00Construction Contracts Payable 2140 1,847.50 0.00 1,847.50Construction Contracts Payable - Retained Percentage 2150 0.00 0.00 0.00Matured Bonds Payable 2180 0.00 0.00 0.00Matured Interest Payable 2190 0.00 0.00 0.00Unearned Revenues 2410 0.00 0.00 0.00Unavailable Revenues 2410 0.00 0.00 0.00Total Liabilities 1,847.50 0.00 1,847.50DEFERRED INFLOWS OF RESOURCESDeficit Net Carrying Amount of Debt Refunding 2620 0.00 0.00 0.00Deferred Revenues 2630 0.00 0.00 0.00Total Deferred Inflows of Resources 0.00 0.00 0.00FUND BALANCESNonspendable:
Inventory 2711 0.00 0.00 0.00Prepaid Amounts 2712 0.00 0.00 0.00Permanent Fund Principal 2713 0.00 0.00 0.00Other Not in Spendable Form 2719 0.00 0.00 0.00
Total Nonspendable Fund Balances 2710 0.00 0.00 0.00Restricted for:
Economic Stabilization 2721 0.00 0.00 0.00Federal Required Carryover Programs 2722 0.00 0.00 0.00State Required Carryover Programs 2723 0.00 0.00 0.00Local Sales Tax and Other Tax Levy 2724 0.00 0.00 0.00Debt Service 2725 0.00 0.00 0.00Capital Projects 2726 367,688.60 1,917,050.88 2,284,739.48Restricted for Special Revenue - Food Service 2729 0.00 0.00 0.00Restricted for Other Restrictions 2729 0.00 0.00 0.00
Total Restricted Fund Balances 2720 367,688.60 1,917,050.88 2,284,739.48Committed to:
Economic Stabilization 2731 0.00 0.00 0.00Contractual Agreements 2732 0.00 0.00 0.00Committed for .25 Discretionary Millage 2739 0.00 0.00 0.00Committed for ________________ 2739 0.00 0.00 0.00
Total Committed Fund Balances 2730 0.00 0.00 0.00Assigned to:
Special Revenue 2741 0.00 0.00 0.00Debt Service 2742 0.00 0.00 0.00Capital Projects 2743 0.00 0.00 0.00Permanent Fund 2744 0.00 0.00 0.00Assigned for Other 2749 0.00 0.00 0.00Assigned for __________________ 2749 0.00 0.00 0.00
Total Assigned Fund Balances 2740 0.00 0.00 0.00Total Unassigned Fund Balances 2750 0.00 0.00 0.00
Total Fund Balances 2700 367,688.60 1,917,050.88 2,284,739.48Total Liabilities, Deferred Inflows ofResources and Fund Balances 369,536.10 1,917,050.88 2,286,586.98
The notes to financial statements are an integral part of this statement.ESE 145
Capital Projects Funds
AccountNumber
Total NonmajorCapital Projects
Funds
2017-18 Final AFR, St. Johns County Schools September 2018 Page 87 of 132

Exhibit F-1dPage 27
DISTRICT SCHOOL BOARD OF ST. JOHNS COUNTYCOMBINING BALANCE SHEET (CONTINUED)NONMAJOR GOVERNMENTAL FUNDSJune 30, 2018
ASSETS AND DEFERRED OUTFLOWS OF RESOURCESASSETSCash and Cash Equivalents 1110 4,182,581.98Investments 1160 6,767,802.72Taxes Receivable, Net 1120 0.00Accounts Receivable, Net 1131 1,097.34Interest Receivable on Investments 1170 0.00Due From Other Agencies 1220 1,836,600.03Due From Budgetary Funds 1141 0.00Due From Insurer 1180 0.00Due From Component Units 1143 0.00Due From Internal Funds 1142 0.00Cash with Fiscal/Service Agents 1114 0.00Inventory 1150 373,298.10Prepaid Items 1230 32,101.76Long-Term Investments 1460 0.00Total Assets 13,193,481.93DEFERRED OUTFLOWS OF RESOURCESNet Carrying Amount of Debt Refunding 1920 0.00Total Deferred Outflows of Resources 0.00Total Assets and Deferred Outflows of Resources 13,193,481.93LIABILITIES, DEFERRED INFLOWS OF RESOURCES
AND FUND BALANCESLIABILITIES Cash Overdraft 2125 0.00Accrued Salaries and Benefits 2110 87,367.62Payroll Deductions and Withholdings 2170 27,369.79Accounts Payable 2120 59,876.56Due to Component Units 2163 0.00Current Notes Payable 2250 0.00Accrued Interest Payable 2210 0.00Deposits Payable 2220 457,105.89Due to Other Agencies 2230 45,100.19Due to Budgetary Funds 2161 1,337,488.97Due to Internal Funds 2162 0.00Due to Fiscal Agent 2240 0.00Pension Liability 2115 0.00Other Postemployment Benefits Liability 2116 0.00Judgments Payable 2130 0.00Construction Contracts Payable 2140 1,847.50Construction Contracts Payable - Retained Percentage 2150 0.00Matured Bonds Payable 2180 0.00Matured Interest Payable 2190 0.00Unearned Revenues 2410 0.00Unavailable Revenues 2410 0.00Total Liabilities 2,016,156.52DEFERRED INFLOWS OF RESOURCESDeficit Net Carrying Amount of Debt Refunding 2620 0.00Deferred Revenues 2630 0.00Total Deferred Inflows of Resources 0.00FUND BALANCESNonspendable:
Inventory 2711 373,298.10Prepaid Amounts 2712 32,101.76Permanent Fund Principal 2713 0.00Other Not in Spendable Form 2719 0.00
Total Nonspendable Fund Balances 2710 405,399.86Restricted for:
Economic Stabilization 2721 0.00Federal Required Carryover Programs 2722 0.00State Required Carryover Programs 2723 0.00Local Sales Tax and Other Tax Levy 2724 0.00Debt Service 2725 6,767,802.72Capital Projects 2726 2,284,739.48Restricted for Special Revenue - Food Service 2729 1,751,485.11Restricted for Other Restrictions 2729 0.00
Total Restricted Fund Balances 2720 10,804,027.31Committed to:
Economic Stabilization 2731 0.00Contractual Agreements 2732 0.00Committed for .25 Discretionary Millage 2739 0.00Committed for ________________ 2739 0.00
Total Committed Fund Balances 2730 0.00Assigned to:
Special Revenue 2741 0.00Debt Service 2742 0.00Capital Projects 2743 0.00Permanent Fund 2744 0.00Assigned for Other 2749 0.00Assigned for __________________ 2749 0.00
Total Assigned Fund Balances 2740 0.00Total Unassigned Fund Balances 2750 (32,101.76)
Total Fund Balances 2700 11,177,325.41Total Liabilities, Deferred Inflows ofResources and Fund Balances 13,193,481.93
The notes to financial statements are an integral part of this statement.ESE 145
TotalNonmajor
GovernmentalFunds
AccountNumber
2017-18 Final AFR, St. Johns County Schools September 2018 Page 88 of 132
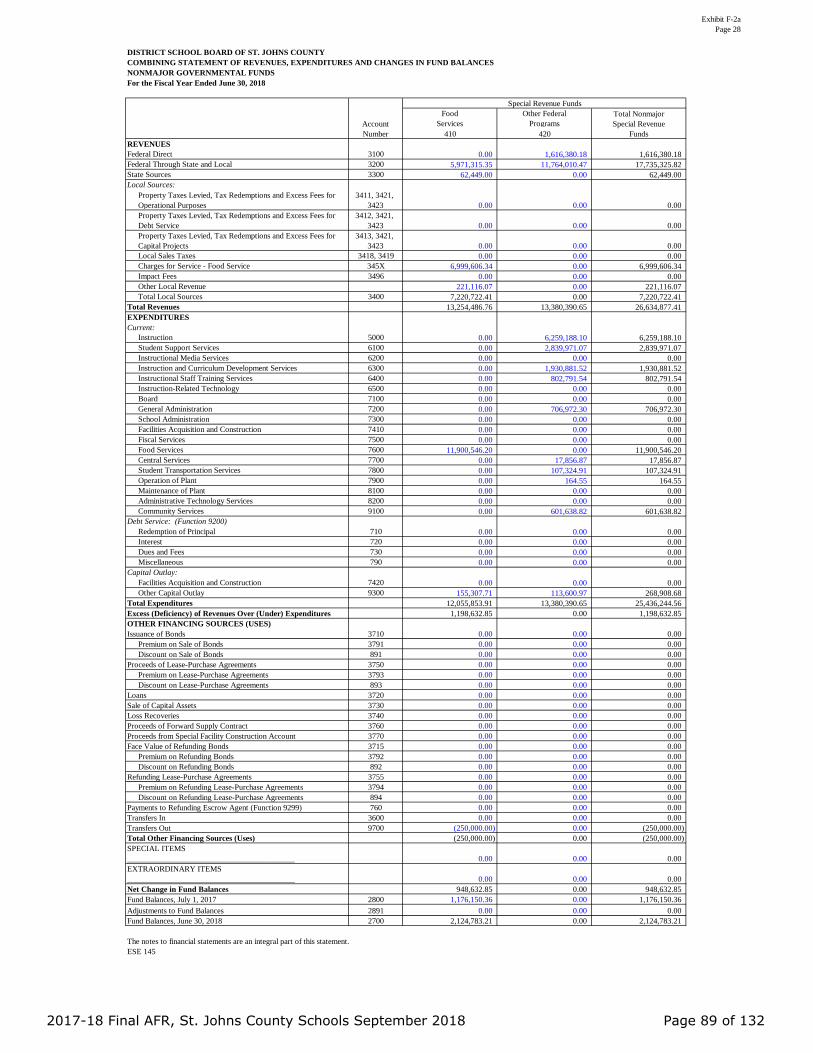
Exhibit F-2aPage 28
DISTRICT SCHOOL BOARD OF ST. JOHNS COUNTYCOMBINING STATEMENT OF REVENUES, EXPENDITURES AND CHANGES IN FUND BALANCESNONMAJOR GOVERNMENTAL FUNDSFor the Fiscal Year Ended June 30, 2018
FoodServices
Other FederalPrograms
410 420REVENUESFederal Direct 3100 0.00 1,616,380.18 1,616,380.18Federal Through State and Local 3200 5,971,315.35 11,764,010.47 17,735,325.82State Sources 3300 62,449.00 0.00 62,449.00Local Sources:
Property Taxes Levied, Tax Redemptions and Excess Fees for Operational Purposes
3411, 3421, 3423 0.00 0.00 0.00
Property Taxes Levied, Tax Redemptions and Excess Fees for Debt Service
3412, 3421, 3423 0.00 0.00 0.00
Property Taxes Levied, Tax Redemptions and Excess Fees for Capital Projects
3413, 3421, 3423 0.00 0.00 0.00
Local Sales Taxes 3418, 3419 0.00 0.00 0.00Charges for Service - Food Service 345X 6,999,606.34 0.00 6,999,606.34Impact Fees 3496 0.00 0.00 0.00Other Local Revenue 221,116.07 0.00 221,116.07Total Local Sources 3400 7,220,722.41 0.00 7,220,722.41
Total Revenues 13,254,486.76 13,380,390.65 26,634,877.41EXPENDITURESCurrent:
Instruction 5000 0.00 6,259,188.10 6,259,188.10Student Support Services 6100 0.00 2,839,971.07 2,839,971.07Instructional Media Services 6200 0.00 0.00 0.00Instruction and Curriculum Development Services 6300 0.00 1,930,881.52 1,930,881.52Instructional Staff Training Services 6400 0.00 802,791.54 802,791.54Instruction-Related Technology 6500 0.00 0.00 0.00Board 7100 0.00 0.00 0.00General Administration 7200 0.00 706,972.30 706,972.30School Administration 7300 0.00 0.00 0.00Facilities Acquisition and Construction 7410 0.00 0.00 0.00Fiscal Services 7500 0.00 0.00 0.00Food Services 7600 11,900,546.20 0.00 11,900,546.20Central Services 7700 0.00 17,856.87 17,856.87Student Transportation Services 7800 0.00 107,324.91 107,324.91Operation of Plant 7900 0.00 164.55 164.55Maintenance of Plant 8100 0.00 0.00 0.00Administrative Technology Services 8200 0.00 0.00 0.00Community Services 9100 0.00 601,638.82 601,638.82
Debt Service: (Function 9200)Redemption of Principal 710 0.00 0.00 0.00Interest 720 0.00 0.00 0.00Dues and Fees 730 0.00 0.00 0.00Miscellaneous 790 0.00 0.00 0.00
Capital Outlay:Facilities Acquisition and Construction 7420 0.00 0.00 0.00Other Capital Outlay 9300 155,307.71 113,600.97 268,908.68
Total Expenditures 12,055,853.91 13,380,390.65 25,436,244.56Excess (Deficiency) of Revenues Over (Under) Expenditures 1,198,632.85 0.00 1,198,632.85OTHER FINANCING SOURCES (USES)Issuance of Bonds 3710 0.00 0.00 0.00
Premium on Sale of Bonds 3791 0.00 0.00 0.00Discount on Sale of Bonds 891 0.00 0.00 0.00
Proceeds of Lease-Purchase Agreements 3750 0.00 0.00 0.00Premium on Lease-Purchase Agreements 3793 0.00 0.00 0.00Discount on Lease-Purchase Agreements 893 0.00 0.00 0.00
Loans 3720 0.00 0.00 0.00Sale of Capital Assets 3730 0.00 0.00 0.00Loss Recoveries 3740 0.00 0.00 0.00Proceeds of Forward Supply Contract 3760 0.00 0.00 0.00Proceeds from Special Facility Construction Account 3770 0.00 0.00 0.00Face Value of Refunding Bonds 3715 0.00 0.00 0.00
Premium on Refunding Bonds 3792 0.00 0.00 0.00Discount on Refunding Bonds 892 0.00 0.00 0.00
Refunding Lease-Purchase Agreements 3755 0.00 0.00 0.00Premium on Refunding Lease-Purchase Agreements 3794 0.00 0.00 0.00Discount on Refunding Lease-Purchase Agreements 894 0.00 0.00 0.00
Payments to Refunding Escrow Agent (Function 9299) 760 0.00 0.00 0.00Transfers In 3600 0.00 0.00 0.00Transfers Out 9700 (250,000.00) 0.00 (250,000.00)Total Other Financing Sources (Uses) (250,000.00) 0.00 (250,000.00)SPECIAL ITEMS__________________________________________ 0.00 0.00 0.00EXTRAORDINARY ITEMS__________________________________________ 0.00 0.00 0.00Net Change in Fund Balances 948,632.85 0.00 948,632.85Fund Balances, July 1, 2017 2800 1,176,150.36 0.00 1,176,150.36Adjustments to Fund Balances 2891 0.00 0.00 0.00Fund Balances, June 30, 2018 2700 2,124,783.21 0.00 2,124,783.21
The notes to financial statements are an integral part of this statement.ESE 145
Special Revenue Funds
AccountNumber
Total NonmajorSpecial Revenue
Funds
2017-18 Final AFR, St. Johns County Schools September 2018 Page 89 of 132
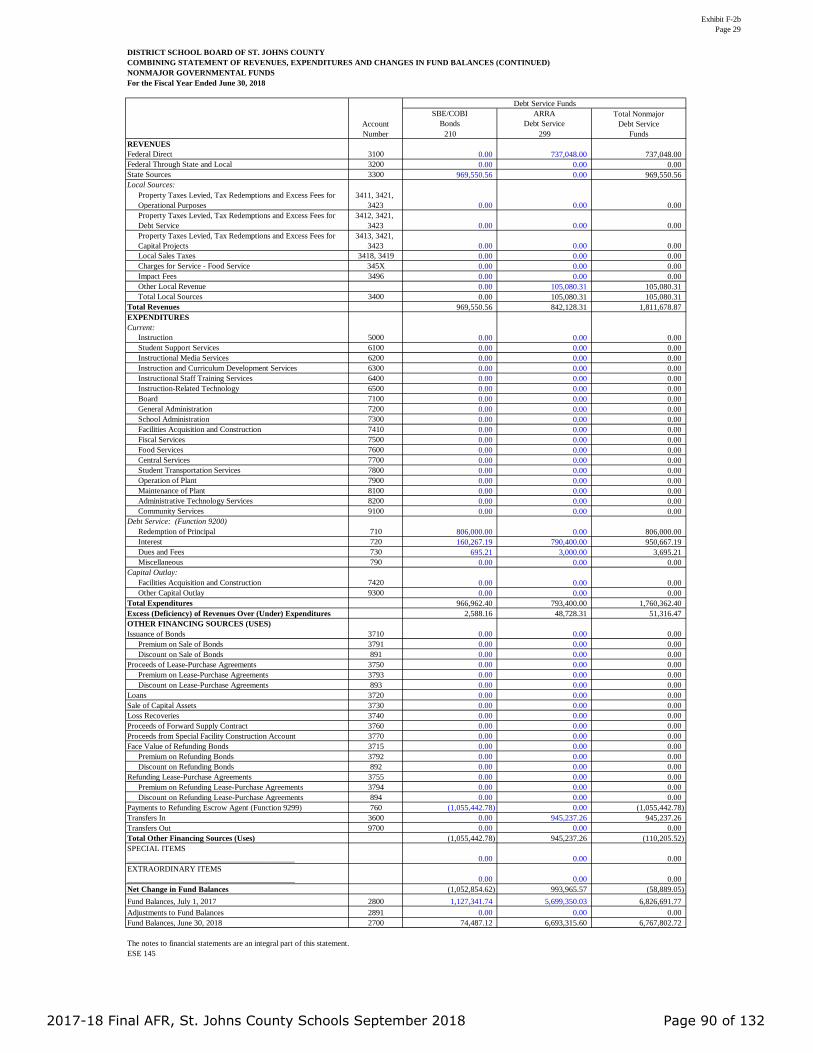
Exhibit F-2bPage 29
DISTRICT SCHOOL BOARD OF ST. JOHNS COUNTYCOMBINING STATEMENT OF REVENUES, EXPENDITURES AND CHANGES IN FUND BALANCES (CONTINUED)NONMAJOR GOVERNMENTAL FUNDSFor the Fiscal Year Ended June 30, 2018
SBE/COBIBonds
ARRADebt Service
210 299REVENUESFederal Direct 3100 0.00 737,048.00 737,048.00Federal Through State and Local 3200 0.00 0.00 0.00State Sources 3300 969,550.56 0.00 969,550.56Local Sources:
Property Taxes Levied, Tax Redemptions and Excess Fees for Operational Purposes
3411, 3421, 3423 0.00 0.00 0.00
Property Taxes Levied, Tax Redemptions and Excess Fees for Debt Service
3412, 3421, 3423 0.00 0.00 0.00
Property Taxes Levied, Tax Redemptions and Excess Fees for Capital Projects
3413, 3421, 3423 0.00 0.00 0.00
Local Sales Taxes 3418, 3419 0.00 0.00 0.00Charges for Service - Food Service 345X 0.00 0.00 0.00Impact Fees 3496 0.00 0.00 0.00Other Local Revenue 0.00 105,080.31 105,080.31Total Local Sources 3400 0.00 105,080.31 105,080.31
Total Revenues 969,550.56 842,128.31 1,811,678.87EXPENDITURESCurrent:
Instruction 5000 0.00 0.00 0.00Student Support Services 6100 0.00 0.00 0.00Instructional Media Services 6200 0.00 0.00 0.00Instruction and Curriculum Development Services 6300 0.00 0.00 0.00Instructional Staff Training Services 6400 0.00 0.00 0.00Instruction-Related Technology 6500 0.00 0.00 0.00Board 7100 0.00 0.00 0.00General Administration 7200 0.00 0.00 0.00School Administration 7300 0.00 0.00 0.00Facilities Acquisition and Construction 7410 0.00 0.00 0.00Fiscal Services 7500 0.00 0.00 0.00Food Services 7600 0.00 0.00 0.00Central Services 7700 0.00 0.00 0.00Student Transportation Services 7800 0.00 0.00 0.00Operation of Plant 7900 0.00 0.00 0.00Maintenance of Plant 8100 0.00 0.00 0.00Administrative Technology Services 8200 0.00 0.00 0.00Community Services 9100 0.00 0.00 0.00
Debt Service: (Function 9200)Redemption of Principal 710 806,000.00 0.00 806,000.00Interest 720 160,267.19 790,400.00 950,667.19Dues and Fees 730 695.21 3,000.00 3,695.21Miscellaneous 790 0.00 0.00 0.00
Capital Outlay:Facilities Acquisition and Construction 7420 0.00 0.00 0.00Other Capital Outlay 9300 0.00 0.00 0.00
Total Expenditures 966,962.40 793,400.00 1,760,362.40Excess (Deficiency) of Revenues Over (Under) Expenditures 2,588.16 48,728.31 51,316.47OTHER FINANCING SOURCES (USES)Issuance of Bonds 3710 0.00 0.00 0.00
Premium on Sale of Bonds 3791 0.00 0.00 0.00Discount on Sale of Bonds 891 0.00 0.00 0.00
Proceeds of Lease-Purchase Agreements 3750 0.00 0.00 0.00Premium on Lease-Purchase Agreements 3793 0.00 0.00 0.00Discount on Lease-Purchase Agreements 893 0.00 0.00 0.00
Loans 3720 0.00 0.00 0.00Sale of Capital Assets 3730 0.00 0.00 0.00Loss Recoveries 3740 0.00 0.00 0.00Proceeds of Forward Supply Contract 3760 0.00 0.00 0.00Proceeds from Special Facility Construction Account 3770 0.00 0.00 0.00Face Value of Refunding Bonds 3715 0.00 0.00 0.00
Premium on Refunding Bonds 3792 0.00 0.00 0.00Discount on Refunding Bonds 892 0.00 0.00 0.00
Refunding Lease-Purchase Agreements 3755 0.00 0.00 0.00Premium on Refunding Lease-Purchase Agreements 3794 0.00 0.00 0.00Discount on Refunding Lease-Purchase Agreements 894 0.00 0.00 0.00
Payments to Refunding Escrow Agent (Function 9299) 760 (1,055,442.78) 0.00 (1,055,442.78)Transfers In 3600 0.00 945,237.26 945,237.26Transfers Out 9700 0.00 0.00 0.00Total Other Financing Sources (Uses) (1,055,442.78) 945,237.26 (110,205.52)SPECIAL ITEMS__________________________________________ 0.00 0.00 0.00EXTRAORDINARY ITEMS__________________________________________ 0.00 0.00 0.00Net Change in Fund Balances (1,052,854.62) 993,965.57 (58,889.05)Fund Balances, July 1, 2017 2800 1,127,341.74 5,699,350.03 6,826,691.77Adjustments to Fund Balances 2891 0.00 0.00 0.00Fund Balances, June 30, 2018 2700 74,487.12 6,693,315.60 6,767,802.72
The notes to financial statements are an integral part of this statement.ESE 145
Debt Service Funds
AccountNumber
Total NonmajorDebt Service
Funds
2017-18 Final AFR, St. Johns County Schools September 2018 Page 90 of 132
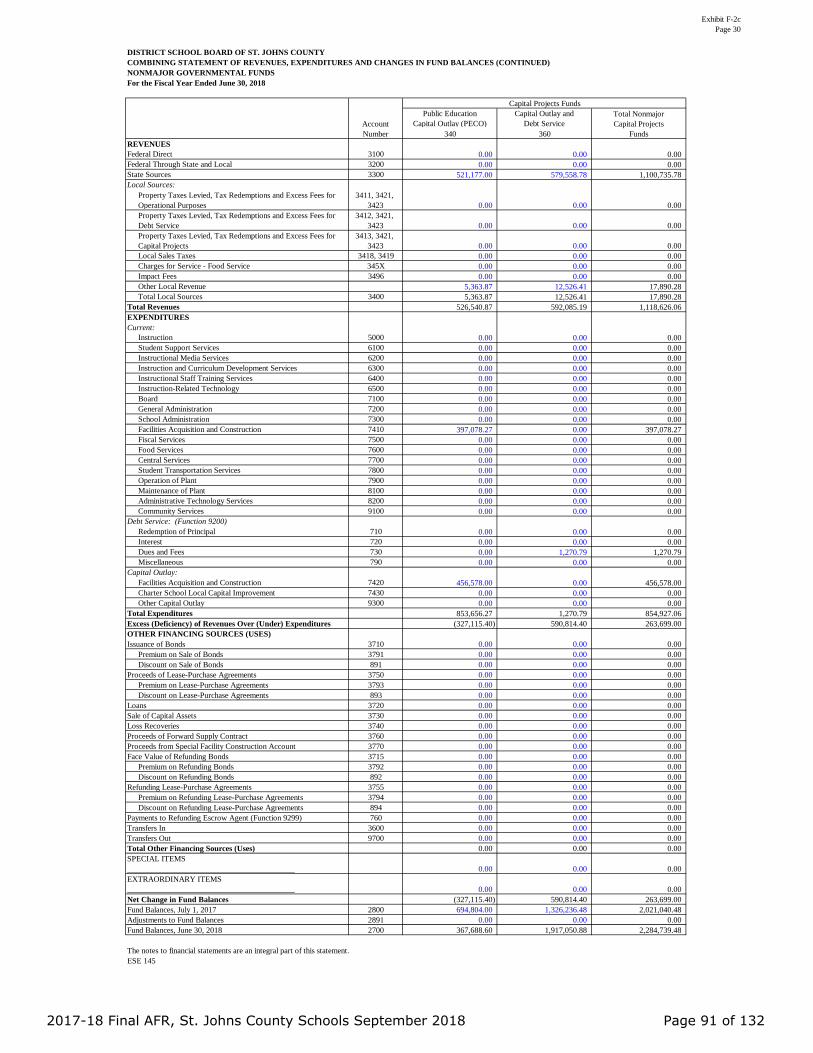
Exhibit F-2cPage 30
DISTRICT SCHOOL BOARD OF ST. JOHNS COUNTYCOMBINING STATEMENT OF REVENUES, EXPENDITURES AND CHANGES IN FUND BALANCES (CONTINUED)NONMAJOR GOVERNMENTAL FUNDSFor the Fiscal Year Ended June 30, 2018
Public EducationCapital Outlay (PECO)
Capital Outlay andDebt Service
340 360REVENUESFederal Direct 3100 0.00 0.00 0.00Federal Through State and Local 3200 0.00 0.00 0.00State Sources 3300 521,177.00 579,558.78 1,100,735.78Local Sources:
Property Taxes Levied, Tax Redemptions and Excess Fees for Operational Purposes
3411, 3421, 3423 0.00 0.00 0.00
Property Taxes Levied, Tax Redemptions and Excess Fees for Debt Service
3412, 3421, 3423 0.00 0.00 0.00
Property Taxes Levied, Tax Redemptions and Excess Fees for Capital Projects
3413, 3421, 3423 0.00 0.00 0.00
Local Sales Taxes 3418, 3419 0.00 0.00 0.00Charges for Service - Food Service 345X 0.00 0.00 0.00Impact Fees 3496 0.00 0.00 0.00Other Local Revenue 5,363.87 12,526.41 17,890.28Total Local Sources 3400 5,363.87 12,526.41 17,890.28
Total Revenues 526,540.87 592,085.19 1,118,626.06EXPENDITURESCurrent:
Instruction 5000 0.00 0.00 0.00Student Support Services 6100 0.00 0.00 0.00Instructional Media Services 6200 0.00 0.00 0.00Instruction and Curriculum Development Services 6300 0.00 0.00 0.00Instructional Staff Training Services 6400 0.00 0.00 0.00Instruction-Related Technology 6500 0.00 0.00 0.00Board 7100 0.00 0.00 0.00General Administration 7200 0.00 0.00 0.00School Administration 7300 0.00 0.00 0.00Facilities Acquisition and Construction 7410 397,078.27 0.00 397,078.27Fiscal Services 7500 0.00 0.00 0.00Food Services 7600 0.00 0.00 0.00Central Services 7700 0.00 0.00 0.00Student Transportation Services 7800 0.00 0.00 0.00Operation of Plant 7900 0.00 0.00 0.00Maintenance of Plant 8100 0.00 0.00 0.00Administrative Technology Services 8200 0.00 0.00 0.00Community Services 9100 0.00 0.00 0.00
Debt Service: (Function 9200)Redemption of Principal 710 0.00 0.00 0.00Interest 720 0.00 0.00 0.00Dues and Fees 730 0.00 1,270.79 1,270.79Miscellaneous 790 0.00 0.00 0.00
Capital Outlay:Facilities Acquisition and Construction 7420 456,578.00 0.00 456,578.00Charter School Local Capital Improvement 7430 0.00 0.00 0.00Other Capital Outlay 9300 0.00 0.00 0.00
Total Expenditures 853,656.27 1,270.79 854,927.06Excess (Deficiency) of Revenues Over (Under) Expenditures (327,115.40) 590,814.40 263,699.00OTHER FINANCING SOURCES (USES)Issuance of Bonds 3710 0.00 0.00 0.00
Premium on Sale of Bonds 3791 0.00 0.00 0.00Discount on Sale of Bonds 891 0.00 0.00 0.00
Proceeds of Lease-Purchase Agreements 3750 0.00 0.00 0.00Premium on Lease-Purchase Agreements 3793 0.00 0.00 0.00Discount on Lease-Purchase Agreements 893 0.00 0.00 0.00
Loans 3720 0.00 0.00 0.00Sale of Capital Assets 3730 0.00 0.00 0.00Loss Recoveries 3740 0.00 0.00 0.00Proceeds of Forward Supply Contract 3760 0.00 0.00 0.00Proceeds from Special Facility Construction Account 3770 0.00 0.00 0.00Face Value of Refunding Bonds 3715 0.00 0.00 0.00
Premium on Refunding Bonds 3792 0.00 0.00 0.00Discount on Refunding Bonds 892 0.00 0.00 0.00
Refunding Lease-Purchase Agreements 3755 0.00 0.00 0.00Premium on Refunding Lease-Purchase Agreements 3794 0.00 0.00 0.00Discount on Refunding Lease-Purchase Agreements 894 0.00 0.00 0.00
Payments to Refunding Escrow Agent (Function 9299) 760 0.00 0.00 0.00Transfers In 3600 0.00 0.00 0.00Transfers Out 9700 0.00 0.00 0.00Total Other Financing Sources (Uses) 0.00 0.00 0.00SPECIAL ITEMS__________________________________________ 0.00 0.00 0.00EXTRAORDINARY ITEMS__________________________________________ 0.00 0.00 0.00Net Change in Fund Balances (327,115.40) 590,814.40 263,699.00Fund Balances, July 1, 2017 2800 694,804.00 1,326,236.48 2,021,040.48Adjustments to Fund Balances 2891 0.00 0.00 0.00Fund Balances, June 30, 2018 2700 367,688.60 1,917,050.88 2,284,739.48
The notes to financial statements are an integral part of this statement.ESE 145
Capital Projects FundsTotal NonmajorCapital Projects
FundsAccountNumber
2017-18 Final AFR, St. Johns County Schools September 2018 Page 91 of 132
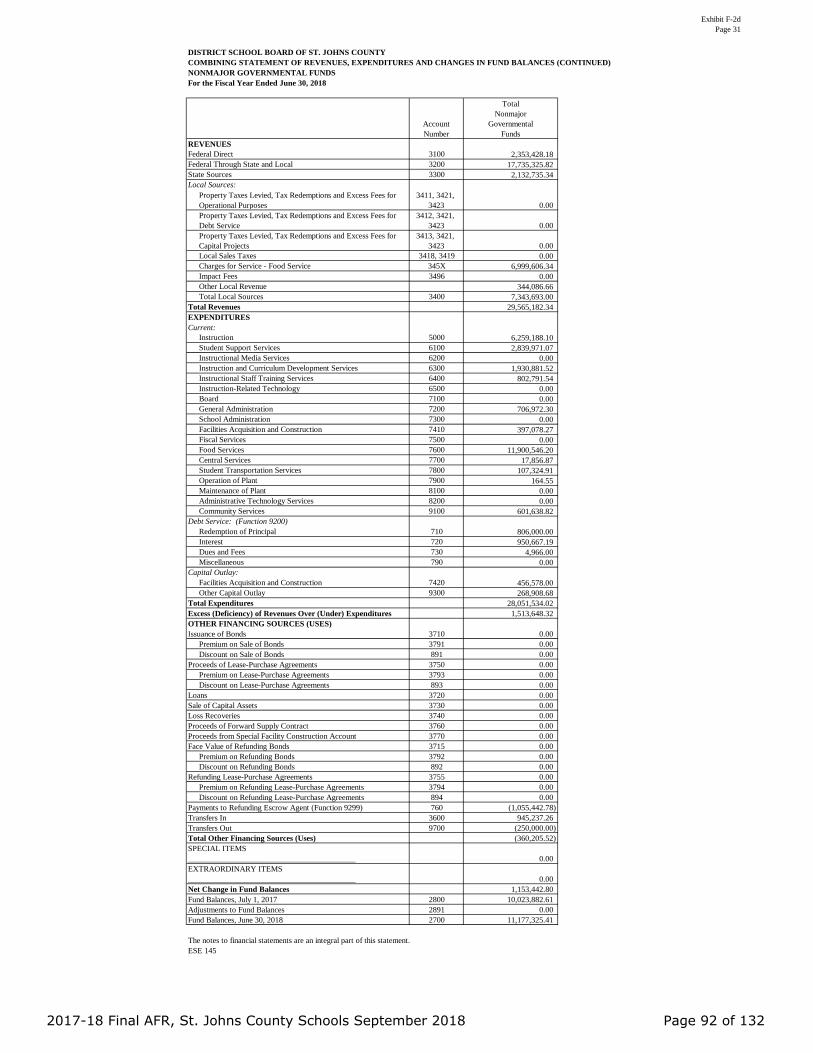
Exhibit F-2dPage 31
DISTRICT SCHOOL BOARD OF ST. JOHNS COUNTYCOMBINING STATEMENT OF REVENUES, EXPENDITURES AND CHANGES IN FUND BALANCES (CONTINUED)NONMAJOR GOVERNMENTAL FUNDSFor the Fiscal Year Ended June 30, 2018
REVENUESFederal Direct 3100 2,353,428.18Federal Through State and Local 3200 17,735,325.82State Sources 3300 2,132,735.34Local Sources:
Property Taxes Levied, Tax Redemptions and Excess Fees for Operational Purposes
3411, 3421, 3423 0.00
Property Taxes Levied, Tax Redemptions and Excess Fees for Debt Service
3412, 3421, 3423 0.00
Property Taxes Levied, Tax Redemptions and Excess Fees for Capital Projects
3413, 3421, 3423 0.00
Local Sales Taxes 3418, 3419 0.00Charges for Service - Food Service 345X 6,999,606.34Impact Fees 3496 0.00Other Local Revenue 344,086.66Total Local Sources 3400 7,343,693.00
Total Revenues 29,565,182.34EXPENDITURESCurrent:
Instruction 5000 6,259,188.10Student Support Services 6100 2,839,971.07Instructional Media Services 6200 0.00Instruction and Curriculum Development Services 6300 1,930,881.52Instructional Staff Training Services 6400 802,791.54Instruction-Related Technology 6500 0.00Board 7100 0.00General Administration 7200 706,972.30School Administration 7300 0.00Facilities Acquisition and Construction 7410 397,078.27Fiscal Services 7500 0.00Food Services 7600 11,900,546.20Central Services 7700 17,856.87Student Transportation Services 7800 107,324.91Operation of Plant 7900 164.55Maintenance of Plant 8100 0.00Administrative Technology Services 8200 0.00Community Services 9100 601,638.82
Debt Service: (Function 9200)Redemption of Principal 710 806,000.00Interest 720 950,667.19Dues and Fees 730 4,966.00Miscellaneous 790 0.00
Capital Outlay:Facilities Acquisition and Construction 7420 456,578.00Other Capital Outlay 9300 268,908.68
Total Expenditures 28,051,534.02Excess (Deficiency) of Revenues Over (Under) Expenditures 1,513,648.32OTHER FINANCING SOURCES (USES)Issuance of Bonds 3710 0.00
Premium on Sale of Bonds 3791 0.00Discount on Sale of Bonds 891 0.00
Proceeds of Lease-Purchase Agreements 3750 0.00Premium on Lease-Purchase Agreements 3793 0.00Discount on Lease-Purchase Agreements 893 0.00
Loans 3720 0.00Sale of Capital Assets 3730 0.00Loss Recoveries 3740 0.00Proceeds of Forward Supply Contract 3760 0.00Proceeds from Special Facility Construction Account 3770 0.00Face Value of Refunding Bonds 3715 0.00
Premium on Refunding Bonds 3792 0.00Discount on Refunding Bonds 892 0.00
Refunding Lease-Purchase Agreements 3755 0.00Premium on Refunding Lease-Purchase Agreements 3794 0.00Discount on Refunding Lease-Purchase Agreements 894 0.00
Payments to Refunding Escrow Agent (Function 9299) 760 (1,055,442.78)Transfers In 3600 945,237.26Transfers Out 9700 (250,000.00)Total Other Financing Sources (Uses) (360,205.52)SPECIAL ITEMS__________________________________________ 0.00EXTRAORDINARY ITEMS__________________________________________ 0.00Net Change in Fund Balances 1,153,442.80Fund Balances, July 1, 2017 2800 10,023,882.61Adjustments to Fund Balances 2891 0.00Fund Balances, June 30, 2018 2700 11,177,325.41
The notes to financial statements are an integral part of this statement.ESE 145
TotalNonmajor
GovernmentalFunds
AccountNumber
2017-18 Final AFR, St. Johns County Schools September 2018 Page 92 of 132

Exhibit H-4Page 32
DISTRICT SCHOOL BOARD OF ST. JOHNS COUNTYCOMBINING STATEMENT OF NET POSITIONINTERNAL SERVICE FUNDSJune 30, 2018
Account Self-Insurance Self-Insurance Self-Insurance Self-Insurance Total InternalNumber 711 712 713 714 Service Funds
ASSETS Cash and Cash Equivalents 1110 33,269,606.44 1,411,997.18 1,723,420.67 4,877,796.91 41,282,821.20Investments 1160 0.00 0.00 0.00 0.00 0.00Accounts Receivable, Net 1131 267.25 0.00 0.00 0.00 267.25Interest Receivable on Investments 1170 0.00 0.00 0.00 0.00 0.00Due From Other Agencies 1220 0.00 0.00 0.00 0.00 0.00Due From Insurer 1180 0.00 0.00 0.00 0.00 0.00Due From Budgetary Funds 1141 0.00 0.00 0.00 0.00 0.00Deposits Receivable 1210 0.00 0.00 0.00 0.00 0.00Cash with Fiscal/Service Agents 1114 0.00 0.00 0.00 0.00 0.00Section 1011.13, F.S., Loan Proceeds 1420 0.00 0.00 0.00 0.00 0.00Inventory 1150 0.00 0.00 0.00 0.00 0.00Prepaid Items 1230 0.00 0.00 0.00 0.00 0.00Long-Term Investments 1460 0.00 0.00 0.00 0.00 0.00Prepaid Insurance Costs 1430 0.00 0.00 0.00 0.00 0.00Other Postemployment Benefits Asset 1410 0.00 0.00 0.00 0.00 0.00Pension Asset 1415 0.00 0.00 0.00 0.00 0.00
Capital Assets:Land 1310 0.00 0.00 0.00 0.00 0.00Land Improvements - Nondepreciable 1315 0.00 0.00 0.00 0.00 0.00Construction in Progress 1360 0.00 0.00 0.00 0.00 0.00
Nondepreciable Capital Assets 0.00 0.00 0.00 0.00 0.00Improvements Other Than Buildings 1320 0.00 0.00 0.00 0.00 0.00
Accumulated Depreciation 1329 0.00 0.00 0.00 0.00 0.00Buildings and Fixed Equipment 1330 299,292.00 0.00 0.00 0.00 299,292.00
Accumulated Depreciation 1339 (117,222.70) 0.00 0.00 0.00 (117,222.70)Furniture, Fixtures and Equipment 1340 153,700.00 0.00 0.00 0.00 153,700.00
Accumulated Depreciation 1349 (153,700.00) 0.00 0.00 0.00 (153,700.00)Motor Vehicles 1350 0.00 0.00 0.00 0.00 0.00
Accumulated Depreciation 1359 0.00 0.00 0.00 0.00 0.00Property Under Capital Leases 1370 0.00 0.00 0.00 0.00 0.00
Accumulated Depreciation 1379 0.00 0.00 0.00 0.00 0.00Computer Software 1382 0.00 0.00 0.00 0.00 0.00
Accumulated Amortization 1389 0.00 0.00 0.00 0.00 0.00Depreciable Capital Assets, Net 182,069.30 0.00 0.00 0.00 182,069.30
Total Capital Assets 182,069.30 0.00 0.00 0.00 182,069.30Total Assets 33,451,942.99 1,411,997.18 1,723,420.67 4,877,796.91 41,465,157.75DEFERRED OUTFLOWS OF RESOURCESAccumulated Decrease in Fair Value of Hedging Derivatives 1910 0.00 0.00 0.00 0.00 0.00Net Carrying Amount of Debt Refunding 1920 0.00 0.00 0.00 0.00 0.00Pension 1940 0.00 0.00 0.00 0.00 0.00Other Postemployment Benefits 1950 0.00 0.00 0.00 0.00 0.00Total Deferred Outflows of Resources 0.00 0.00 0.00 0.00 0.00LIABILITIES
Cash Overdraft 2125 0.00 0.00 0.00 0.00 0.00Accrued Salaries and Benefits 2110 437.22 0.00 0.00 1,132.93 1,570.15Payroll Deductions and Withholdings 2170 165.62 0.00 0.00 3.26 168.88Accounts Payable 2120 2,417,730.45 60.83 34,824.23 436.13 2,453,051.64Sales Tax Payable 2260 0.00 0.00 0.00 0.00 0.00Accrued Interest Payable 2210 0.00 0.00 0.00 0.00 0.00Deposits Payable 2220 0.00 0.00 0.00 0.00 0.00Due to Other Agencies 2230 0.00 0.00 0.00 0.00 0.00Due to Budgetary Funds 2161 0.00 0.00 0.00 0.00 0.00Pension Liability 2115 0.00 0.00 0.00 0.00 0.00Other Postemployment Benefits Liability 2116 0.00 0.00 0.00 0.00 0.00Judgments Payable 2130 0.00 0.00 0.00 0.00 0.00Estimated Unpaid Claims - Self-Insurance Program 2271 2,626,941.00 268,623.00 53,880.00 250,035.00 3,199,479.00Estimated Liability for Claims Adjustment 2272 0.00 0.00 0.00 0.00 0.00Unearned Revenues 2410 0.00 0.00 0.00 0.00 0.00
Noncurrent Liabilities:Portion Due Within One Year:
Obligations Under Capital Leases 2315 0.00 0.00 0.00 0.00 0.00Liability for Compensated Absences 2330 0.00 0.00 0.00 0.00 0.00Estimated Liability for Long-Term Claims 2350 0.00 0.00 0.00 0.00 0.00Net Other Postemployment Benefits Obligation 2360 0.00 0.00 0.00 0.00 0.00Net Pension Liability 2365 0.00 0.00 0.00 0.00 0.00Oher Long-Term Liabilities 2380 0.00 0.00 0.00 0.00 0.00Due Within One Year 0.00 0.00 0.00 0.00 0.00
Portion Due After One Year:Obligations Under Capital Leases 2315 0.00 0.00 0.00 0.00 0.00Liability for Compensated Absences 2330 0.00 0.00 0.00 0.00 0.00Estimated Liability for Long-Term Claims 2350 0.00 0.00 0.00 0.00 0.00Net Other Postemployment Benefits Obligation 2360 0.00 0.00 0.00 0.00 0.00Net Pension Liability 2365 0.00 0.00 0.00 0.00 0.00Other Long-Term Liabilities 2380 0.00 0.00 0.00 0.00 0.00Due In More Than One Year 0.00 0.00 0.00 0.00 0.00
Total Long-Term Liabilities 0.00 0.00 0.00 0.00 0.00Total Liabilities 5,045,274.29 268,683.83 88,704.23 251,607.32 5,654,269.67DEFERRED INFLOWS OF RESOURCESAccumulated Increase in Fair Value of Hedging Derivatives 2610 0.00 0.00 0.00 0.00 0.00Deficit Net Carrying Amount of Debt Refunding 2620 0.00 0.00 0.00 0.00 0.00Deferred Revenues 2630 0.00 0.00 0.00 0.00 0.00Pension 2640 0.00 0.00 0.00 0.00 0.00Other Postemployment Benefits 2650 0.00 0.00 0.00 0.00 0.00Total Deferred Inflows of Resources 0.00 0.00 0.00 0.00 0.00NET POSITIONNet Investment in Capital Assets 2770 182,069.30 0.00 0.00 0.00 182,069.30Restricted for ____________________ 2780 0.00 0.00 0.00 0.00 0.00Unrestricted 2790 28,224,599.40 1,143,313.35 1,634,716.44 4,626,189.59 35,628,818.78Total Net Position 28,406,668.70 1,143,313.35 1,634,716.44 4,626,189.59 35,810,888.08
The notes to financial statements are an integral part of this statement.ESE 1452017-18 Final AFR, St. Johns County Schools September 2018 Page 93 of 132

Exhibit H-5Page 33
DISTRICT SCHOOL BOARD OF ST. JOHNS COUNTYCOMBINING STATEMENT OF REVENUES, EXPENSES AND CHANGES IN FUND NET POSITIONINTERNAL SERVICE FUNDSFor the Fiscal Year Ended June 30, 2018
Account Self-Insurance Self-Insurance Self-Insurance Self-Insurance Total InternalNumber 711 712 713 714 Service Funds
OPERATING REVENUESCharges for Services 3481 0.00 0.00 0.00 0.00 0.00Charges for Sales 3482 0.00 0.00 0.00 0.00 0.00Premium Revenue 3484 48,279,102.32 2,952,764.92 838,013.75 1,445,051.13 53,514,932.12Other Operating Revenues 3489 2,131,933.49 0.00 0.00 0.00 2,131,933.49Total Operating Revenues 50,411,035.81 2,952,764.92 838,013.75 1,445,051.13 55,646,865.61OPERATING EXPENSESSalaries 100 85,095.00 0.00 0.00 194,871.79 279,966.79Employee Benefits 200 24,246.70 0.00 0.00 61,868.72 86,115.42Purchased Services 300 2,710,083.15 0.00 0.00 0.00 2,710,083.15Energy Services 400 12,198.18 0.00 0.00 0.00 12,198.18Materials and Supplies 500 1,328.12 0.00 0.00 0.00 1,328.12Capital Outlay 600 0.00 0.00 0.00 0.00 0.00Other 700 38,409,117.21 3,168,563.29 611,104.65 1,323,504.48 43,512,289.63Depreciation/Amortization Expense 780 20,453.88 0.00 0.00 0.00 20,453.88Total Operating Expenses 41,262,522.24 3,168,563.29 611,104.65 1,580,244.99 46,622,435.17Operating Income (Loss) 9,148,513.57 (215,798.37) 226,909.10 (135,193.86) 9,024,430.44NONOPERATING REVENUES (EXPENSES)Investment Income 3430 257,969.75 13,438.94 15,004.18 41,970.13 328,383.00Gifts, Grants and Bequests 3440 0.00 0.00 0.00 0.00 0.00Other Miscellaneous Local Sources 3495 0.00 0.00 0.00 0.00 0.00Loss Recoveries 3740 0.00 0.00 0.00 0.00 0.00Gain on Disposition of Assets 3780 0.00 0.00 0.00 0.00 0.00Interest 720 0.00 0.00 0.00 0.00 0.00Miscellaneous 790 0.00 0.00 0.00 0.00 0.00Loss on Disposition of Assets 810 0.00 0.00 0.00 0.00 0.00Total Nonoperating Revenues (Expenses) 257,969.75 13,438.94 15,004.18 41,970.13 328,383.00Income (Loss) Before Operating Transfers 9,406,483.32 (202,359.43) 241,913.28 (93,223.73) 9,352,813.44Transfers In 3600 0.00 0.00 0.00 0.00 0.00Transfers Out 9700 0.00 0.00 0.00 0.00 0.00SPECIAL ITEMS___________________________________________ 0.00 0.00 0.00 0.00 0.00EXTRAORDINARY ITEMS___________________________________________ 0.00 0.00 0.00 0.00 0.00Change In Net Position 9,406,483.32 (202,359.43) 241,913.28 (93,223.73) 9,352,813.44Net Position, July 1, 2017 2880 19,000,185.38 1,345,672.78 1,392,803.16 4,719,413.32 26,458,074.64Adjustments to Net Position 2896 0.00 0.00 0.00 0.00 0.00Net Position, June 30, 2018 2780 28,406,668.70 1,143,313.35 1,634,716.44 4,626,189.59 35,810,888.08
The notes to financial statements are an integral part of this statement.ESE 145
2017-18 Final AFR, St. Johns County Schools September 2018 Page 94 of 132
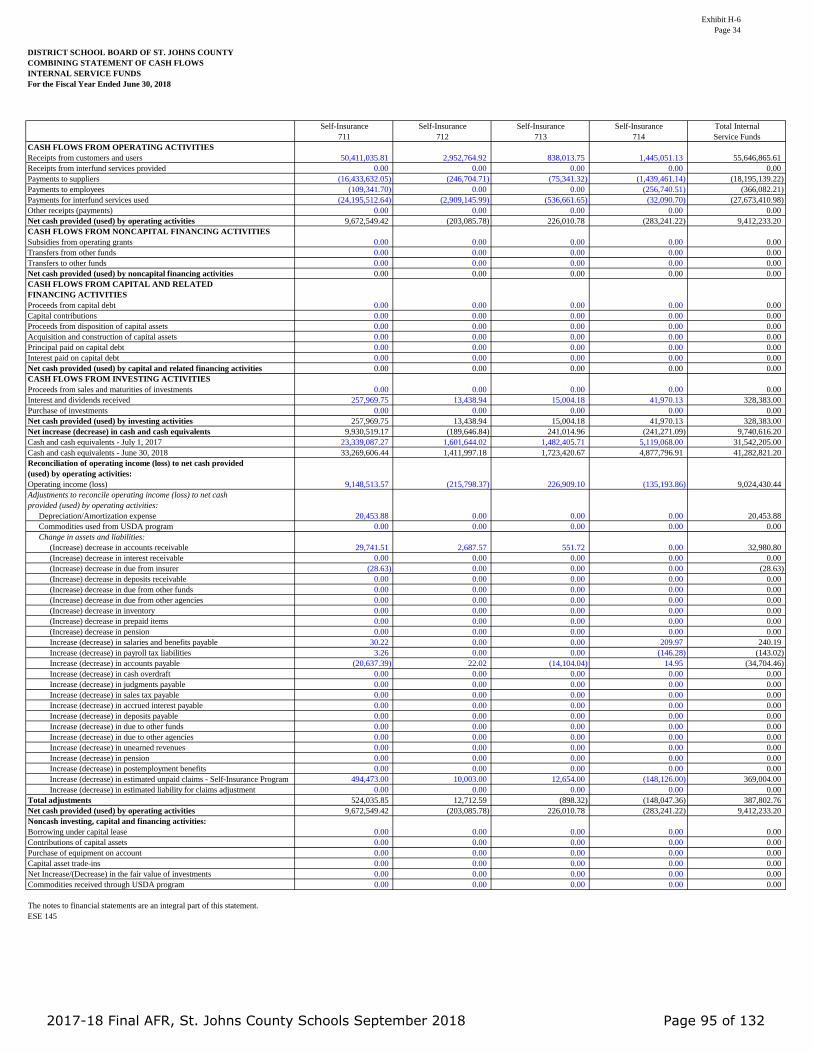
Exhibit H-6Page 34
DISTRICT SCHOOL BOARD OF ST. JOHNS COUNTYCOMBINING STATEMENT OF CASH FLOWSINTERNAL SERVICE FUNDSFor the Fiscal Year Ended June 30, 2018
Self-Insurance Self-Insurance Self-Insurance Self-Insurance Total Internal711 712 713 714 Service Funds
CASH FLOWS FROM OPERATING ACTIVITIESReceipts from customers and users 50,411,035.81 2,952,764.92 838,013.75 1,445,051.13 55,646,865.61Receipts from interfund services provided 0.00 0.00 0.00 0.00 0.00Payments to suppliers (16,433,632.05) (246,704.71) (75,341.32) (1,439,461.14) (18,195,139.22)Payments to employees (109,341.70) 0.00 0.00 (256,740.51) (366,082.21)Payments for interfund services used (24,195,512.64) (2,909,145.99) (536,661.65) (32,090.70) (27,673,410.98)Other receipts (payments) 0.00 0.00 0.00 0.00 0.00Net cash provided (used) by operating activities 9,672,549.42 (203,085.78) 226,010.78 (283,241.22) 9,412,233.20CASH FLOWS FROM NONCAPITAL FINANCING ACTIVITIESSubsidies from operating grants 0.00 0.00 0.00 0.00 0.00Transfers from other funds 0.00 0.00 0.00 0.00 0.00Transfers to other funds 0.00 0.00 0.00 0.00 0.00Net cash provided (used) by noncapital financing activities 0.00 0.00 0.00 0.00 0.00CASH FLOWS FROM CAPITAL AND RELATEDFINANCING ACTIVITIESProceeds from capital debt 0.00 0.00 0.00 0.00 0.00Capital contributions 0.00 0.00 0.00 0.00 0.00Proceeds from disposition of capital assets 0.00 0.00 0.00 0.00 0.00Acquisition and construction of capital assets 0.00 0.00 0.00 0.00 0.00Principal paid on capital debt 0.00 0.00 0.00 0.00 0.00Interest paid on capital debt 0.00 0.00 0.00 0.00 0.00Net cash provided (used) by capital and related financing activities 0.00 0.00 0.00 0.00 0.00CASH FLOWS FROM INVESTING ACTIVITIESProceeds from sales and maturities of investments 0.00 0.00 0.00 0.00 0.00Interest and dividends received 257,969.75 13,438.94 15,004.18 41,970.13 328,383.00Purchase of investments 0.00 0.00 0.00 0.00 0.00Net cash provided (used) by investing activities 257,969.75 13,438.94 15,004.18 41,970.13 328,383.00Net increase (decrease) in cash and cash equivalents 9,930,519.17 (189,646.84) 241,014.96 (241,271.09) 9,740,616.20Cash and cash equivalents - July 1, 2017 23,339,087.27 1,601,644.02 1,482,405.71 5,119,068.00 31,542,205.00Cash and cash equivalents - June 30, 2018 33,269,606.44 1,411,997.18 1,723,420.67 4,877,796.91 41,282,821.20Reconciliation of operating income (loss) to net cash provided (used) by operating activities:Operating income (loss) 9,148,513.57 (215,798.37) 226,909.10 (135,193.86) 9,024,430.44Adjustments to reconcile operating income (loss) to net cashprovided (used) by operating activities:
Depreciation/Amortization expense 20,453.88 0.00 0.00 0.00 20,453.88Commodities used from USDA program 0.00 0.00 0.00 0.00 0.00Change in assets and liabilities:
(Increase) decrease in accounts receivable 29,741.51 2,687.57 551.72 0.00 32,980.80(Increase) decrease in interest receivable 0.00 0.00 0.00 0.00 0.00(Increase) decrease in due from insurer (28.63) 0.00 0.00 0.00 (28.63)(Increase) decrease in deposits receivable 0.00 0.00 0.00 0.00 0.00(Increase) decrease in due from other funds 0.00 0.00 0.00 0.00 0.00(Increase) decrease in due from other agencies 0.00 0.00 0.00 0.00 0.00(Increase) decrease in inventory 0.00 0.00 0.00 0.00 0.00(Increase) decrease in prepaid items 0.00 0.00 0.00 0.00 0.00(Increase) decrease in pension 0.00 0.00 0.00 0.00 0.00Increase (decrease) in salaries and benefits payable 30.22 0.00 0.00 209.97 240.19Increase (decrease) in payroll tax liabilities 3.26 0.00 0.00 (146.28) (143.02)Increase (decrease) in accounts payable (20,637.39) 22.02 (14,104.04) 14.95 (34,704.46)Increase (decrease) in cash overdraft 0.00 0.00 0.00 0.00 0.00Increase (decrease) in judgments payable 0.00 0.00 0.00 0.00 0.00Increase (decrease) in sales tax payable 0.00 0.00 0.00 0.00 0.00Increase (decrease) in accrued interest payable 0.00 0.00 0.00 0.00 0.00Increase (decrease) in deposits payable 0.00 0.00 0.00 0.00 0.00Increase (decrease) in due to other funds 0.00 0.00 0.00 0.00 0.00Increase (decrease) in due to other agencies 0.00 0.00 0.00 0.00 0.00Increase (decrease) in unearned revenues 0.00 0.00 0.00 0.00 0.00Increase (decrease) in pension 0.00 0.00 0.00 0.00 0.00Increase (decrease) in postemployment benefits 0.00 0.00 0.00 0.00 0.00Increase (decrease) in estimated unpaid claims - Self-Insurance Program 494,473.00 10,003.00 12,654.00 (148,126.00) 369,004.00Increase (decrease) in estimated liability for claims adjustment 0.00 0.00 0.00 0.00 0.00
Total adjustments 524,035.85 12,712.59 (898.32) (148,047.36) 387,802.76Net cash provided (used) by operating activities 9,672,549.42 (203,085.78) 226,010.78 (283,241.22) 9,412,233.20Noncash investing, capital and financing activities:Borrowing under capital lease 0.00 0.00 0.00 0.00 0.00Contributions of capital assets 0.00 0.00 0.00 0.00 0.00Purchase of equipment on account 0.00 0.00 0.00 0.00 0.00Capital asset trade-ins 0.00 0.00 0.00 0.00 0.00Net Increase/(Decrease) in the fair value of investments 0.00 0.00 0.00 0.00 0.00Commodities received through USDA program 0.00 0.00 0.00 0.00 0.00
The notes to financial statements are an integral part of this statement.ESE 145
2017-18 Final AFR, St. Johns County Schools September 2018 Page 95 of 132
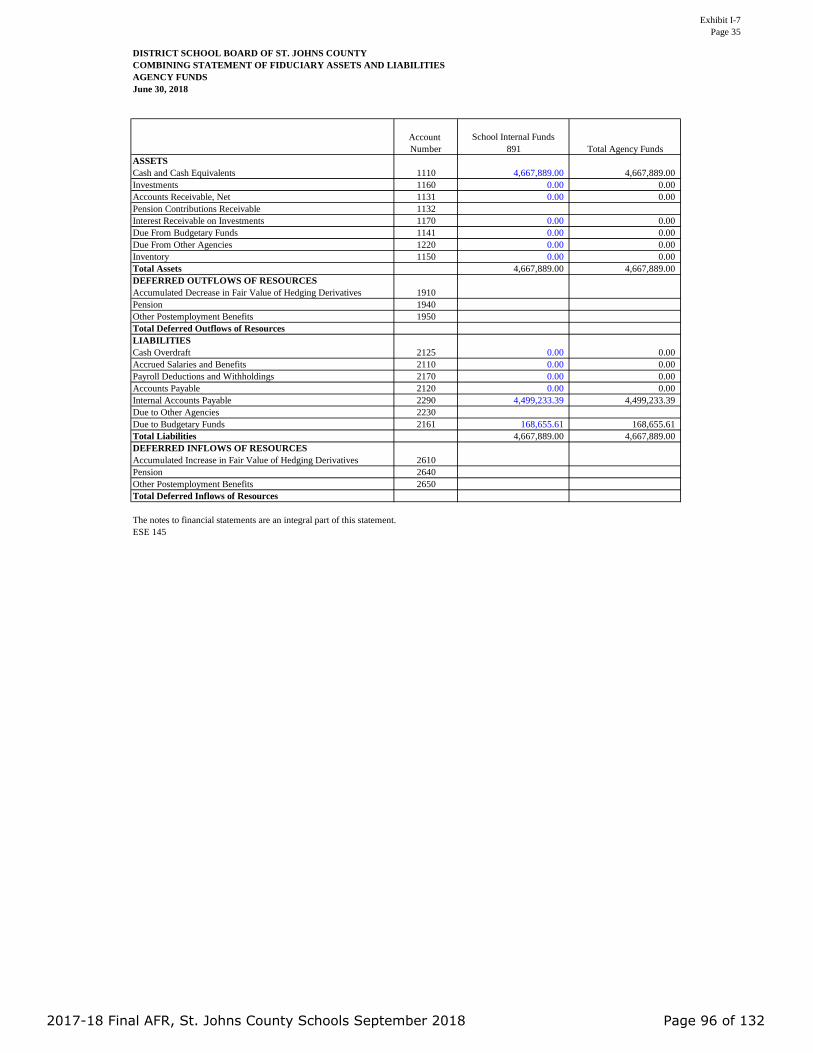
Exhibit I-7Page 35
DISTRICT SCHOOL BOARD OF ST. JOHNS COUNTYCOMBINING STATEMENT OF FIDUCIARY ASSETS AND LIABILITIESAGENCY FUNDSJune 30, 2018
School Internal Funds891
ASSETS Cash and Cash Equivalents 1110 4,667,889.00 4,667,889.00Investments 1160 0.00 0.00Accounts Receivable, Net 1131 0.00 0.00Pension Contributions Receivable 1132Interest Receivable on Investments 1170 0.00 0.00Due From Budgetary Funds 1141 0.00 0.00Due From Other Agencies 1220 0.00 0.00Inventory 1150 0.00 0.00Total Assets 4,667,889.00 4,667,889.00DEFERRED OUTFLOWS OF RESOURCESAccumulated Decrease in Fair Value of Hedging Derivatives 1910Pension 1940Other Postemployment Benefits 1950Total Deferred Outflows of ResourcesLIABILITIES Cash Overdraft 2125 0.00 0.00Accrued Salaries and Benefits 2110 0.00 0.00Payroll Deductions and Withholdings 2170 0.00 0.00Accounts Payable 2120 0.00 0.00Internal Accounts Payable 2290 4,499,233.39 4,499,233.39Due to Other Agencies 2230Due to Budgetary Funds 2161 168,655.61 168,655.61Total Liabilities 4,667,889.00 4,667,889.00DEFERRED INFLOWS OF RESOURCESAccumulated Increase in Fair Value of Hedging Derivatives 2610Pension 2640Other Postemployment Benefits 2650Total Deferred Inflows of Resources
The notes to financial statements are an integral part of this statement.ESE 145
Account Number Total Agency Funds
2017-18 Final AFR, St. Johns County Schools September 2018 Page 96 of 132
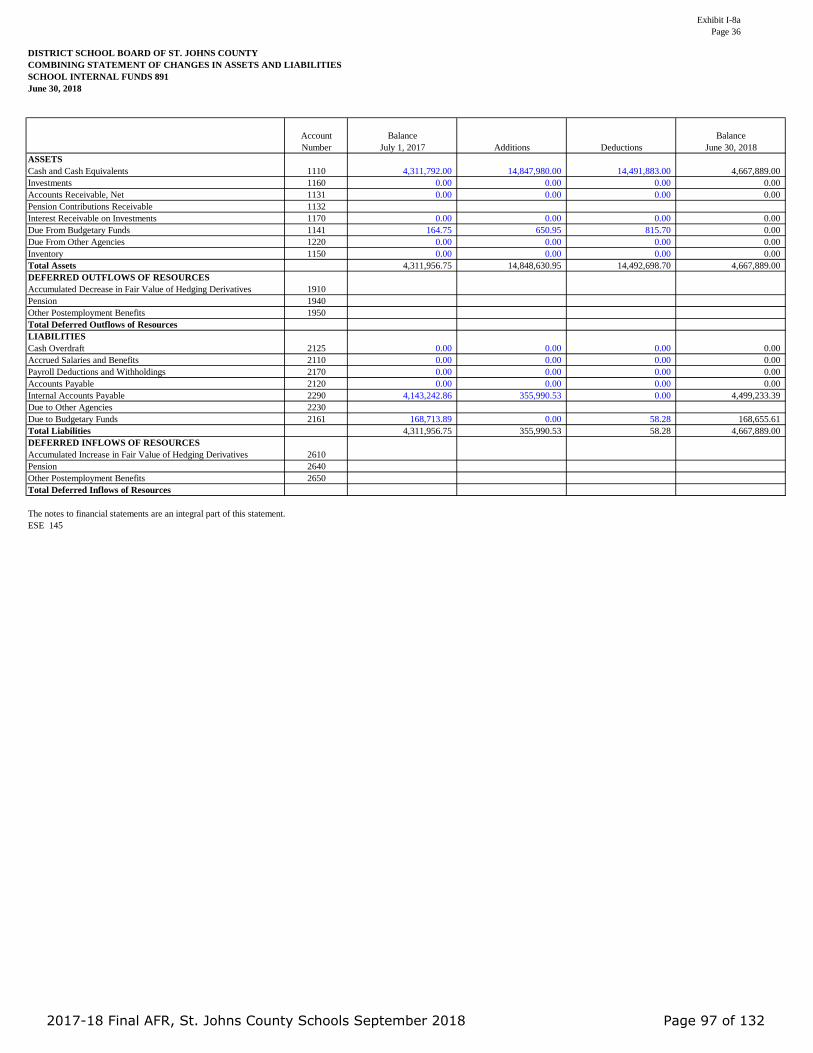
Exhibit I-8aPage 36
DISTRICT SCHOOL BOARD OF ST. JOHNS COUNTYCOMBINING STATEMENT OF CHANGES IN ASSETS AND LIABILITIESSCHOOL INTERNAL FUNDS 891June 30, 2018
Account Balance Balance Number July 1, 2017 Additions Deductions June 30, 2018ASSETS Cash and Cash Equivalents 1110 4,311,792.00 14,847,980.00 14,491,883.00 4,667,889.00Investments 1160 0.00 0.00 0.00 0.00Accounts Receivable, Net 1131 0.00 0.00 0.00 0.00Pension Contributions Receivable 1132Interest Receivable on Investments 1170 0.00 0.00 0.00 0.00Due From Budgetary Funds 1141 164.75 650.95 815.70 0.00Due From Other Agencies 1220 0.00 0.00 0.00 0.00Inventory 1150 0.00 0.00 0.00 0.00Total Assets 4,311,956.75 14,848,630.95 14,492,698.70 4,667,889.00DEFERRED OUTFLOWS OF RESOURCESAccumulated Decrease in Fair Value of Hedging Derivatives 1910Pension 1940Other Postemployment Benefits 1950Total Deferred Outflows of ResourcesLIABILITIESCash Overdraft 2125 0.00 0.00 0.00 0.00Accrued Salaries and Benefits 2110 0.00 0.00 0.00 0.00Payroll Deductions and Withholdings 2170 0.00 0.00 0.00 0.00Accounts Payable 2120 0.00 0.00 0.00 0.00Internal Accounts Payable 2290 4,143,242.86 355,990.53 0.00 4,499,233.39Due to Other Agencies 2230Due to Budgetary Funds 2161 168,713.89 0.00 58.28 168,655.61Total Liabilities 4,311,956.75 355,990.53 58.28 4,667,889.00DEFERRED INFLOWS OF RESOURCESAccumulated Increase in Fair Value of Hedging Derivatives 2610Pension 2640Other Postemployment Benefits 2650Total Deferred Inflows of Resources
The notes to financial statements are an integral part of this statement.ESE 145
2017-18 Final AFR, St. Johns County Schools September 2018 Page 97 of 132

Exhibit I-8dPage 37
DISTRICT SCHOOL BOARD OF ST. JOHNS COUNTYCOMBINING STATEMENT OF CHANGES IN ASSETS AND LIABILITIES (CONTINUED)TOTAL AGENCY FUNDS June 30, 2018
Total Agency Funds Balances
Total Agency Funds Balances
July 1, 2017 June 30, 2018ASSETS Cash and Cash Equivalents 1110 4,311,792.00 14,847,980.00 14,491,883.00 4,667,889.00Investments 1160 0.00 0.00 0.00 0.00Accounts Receivable, Net 1131 0.00 0.00 0.00 0.00Pension Contributions Receivable 1132Interest Receivable on Investments 1170 0.00 0.00 0.00 0.00Due From Budgetary Funds 1141 164.75 650.95 815.70 0.00Due From Other Agencies 1220 0.00 0.00 0.00 0.00Inventory 1150 0.00 0.00 0.00 0.00Total Assets 4,311,956.75 14,848,630.95 14,492,698.70 4,667,889.00DEFERRED OUTFLOWS OF RESOURCESAccumulated Decrease in Fair Value of Hedging Derivatives 1910Pension 1940Other Postemployment Benefits 1950Total Deferred Outflows of ResourcesLIABILITIESCash Overdraft 2125 0.00 0.00 0.00 0.00Accrued Salaries and Benefits 2110 0.00 0.00 0.00 0.00Payroll Deductions and Withholdings 2170 0.00 0.00 0.00 0.00Accounts Payable 2120 0.00 0.00 0.00 0.00Internal Accounts Payable 2290 4,143,242.86 355,990.53 0.00 4,499,233.39Due to Other Agencies 2230Due to Budgetary Funds 2161 168,713.89 0.00 58.28 168,655.61Total Liabilities 4,311,956.75 355,990.53 58.28 4,667,889.00DEFERRED INFLOWS OF RESOURCESAccumulated Increase in Fair Value of Hedging Derivatives 2610Pension 2640Other Postemployment Benefits 2650Total Deferred Inflows of Resources
The notes to financial statements are an integral part of this statement.ESE 145
Account Number
Total Agency Funds Additions
Total Agency Funds Deductions
2017-18 Final AFR, St. Johns County Schools September 2018 Page 98 of 132

Exhibit J-1Page 38
DISTRICT SCHOOL BOARD OF ST. JOHNS COUNTYCOMBINING STATEMENT OF NET POSITIONNONMAJOR COMPONENT UNITSJune 30, 2018
Account Number
St. Augustine Public Montessori
St. Johns County Education Foundation
Therapeutic Learning Center
St. Johns Community Campus
Total Nonmajor Component Units
ASSETS Cash and Cash Equivalents 1110 85,403.00 650,259.00 441,244.00 816,367.00 1,993,273.00Investments 1160 0.00 0.00 0.00 0.00 0.00Due From District 1143 0.00 0.00 0.00 0.00 0.00Accounts Receivable, net 1131 0.00 27,579.00 0.00 0.00 27,579.00Interest Receivable on Investments 1170 0.00 0.00 0.00 0.00 0.00Due From Other Agencies 1220 0.00 0.00 0.00 0.00 0.00Due From Insurer 1180 0.00 0.00 0.00 0.00 0.00Deposits Receivable 1210 0.00 0.00 0.00 0.00 0.00Internal Balances 0.00 0.00 0.00 0.00 0.00Cash with Fiscal/Service Agents 1114 0.00 0.00 0.00 0.00 0.00Section 1011.13, F.S., Loan Proceeds 1420 0.00 0.00 0.00 0.00 0.00Inventory 1150 0.00 0.00 0.00 0.00 0.00Prepaid Items 1230 13,271.00 5,351.00 0.00 1,521.00 20,143.00Long-Term Investments 1460 0.00 699.00 0.00 0.00 699.00Prepaid Insurance Costs 1430 0.00 0.00 0.00 0.00 0.00Other Postemployment Benefits Asset 1410 0.00 0.00 0.00 0.00 0.00Pension Asset 1415 0.00 0.00 0.00 0.00 0.00
Capital Assets:Land 1310 0.00 0.00 0.00 0.00 0.00Land Improvements - Nondepreciable 1315 0.00 0.00 0.00 0.00 0.00Construction in Progress 1360 0.00 0.00 0.00 0.00 0.00
Nondepreciable Capital Assets 0.00 0.00 0.00 0.00 0.00Improvements Other Than Buildings 1320 29,030.00 0.00 114,079.00 0.00 143,109.00
Less Accumulated Depreciation 1329 (29,030.00) 0.00 (47,893.00) 0.00 (76,923.00)Buildings and Fixed Equipment 1330 0.00 0.00 0.00 0.00 0.00
Less Accumulated Depreciation 1339 0.00 0.00 0.00 0.00 0.00Furniture, Fixtures and Equipment 1340 0.00 6,000.00 32,848.00 64,212.00 103,060.00
Less Accumulated Depreciation 1349 0.00 (4,577.00) (30,954.00) (12,335.00) (47,866.00)Motor Vehicles 1350 0.00 0.00 0.00 0.00 0.00
Less Accumulated Depreciation 1359 0.00 0.00 0.00 0.00 0.00Property Under Capital Leases 1370 0.00 0.00 0.00 0.00 0.00
Less Accumulated Depreciation 1379 0.00 0.00 0.00 0.00 0.00Audiovisual Materials 1381 0.00 0.00 0.00 0.00 0.00
Less Accumulated Depreciation 1388 0.00 0.00 0.00 0.00 0.00Computer Software 1382 0.00 0.00 0.00 0.00 0.00
Less Accumulated Amortization 1389 0.00 0.00 0.00 0.00 0.00Depreciable Capital Assets, Net 0.00 1,423.00 68,080.00 51,877.00 121,380.00
Total Capital Assets 0.00 1,423.00 68,080.00 51,877.00 121,380.00Total Assets 98,674.00 685,311.00 509,324.00 869,765.00 2,163,074.00DEFERRED OUTFLOWS OF RESOURCESAccumulated Decrease in Fair Value of Hedging Derivatives 1910 0.00 0.00 0.00 0.00 0.00Net Carrying Amount of Debt Refunding 1920 0.00 0.00 0.00 0.00 0.00Pension 1940 0.00 0.00 0.00 0.00 0.00Other Postemployment Benefits 1950 0.00 0.00 0.00 0.00 0.00Total Deferred Outflows of Resources 0.00 0.00 0.00 0.00 0.00LIABILITIES
Cash Overdraft 2125 0.00 0.00 0.00 0.00 0.00Accrued Salaries and Benefits 2110 25,426.00 22,875.00 11,734.00 25,056.00 85,091.00Payroll Deductions and Withholdings 2170 0.00 0.00 0.00 0.00 0.00Accounts Payable 2120 1,074.00 8,902.00 22,645.00 62,972.00 95,593.00Due to District 2163 0.00 9,636.00 0.00 0.00 9,636.00Current Notes Payable 2250 0.00 0.00 0.00 0.00 0.00Accrued Interest Payable 2210 0.00 0.00 0.00 0.00 0.00Deposits Payable 2220 0.00 0.00 0.00 0.00 0.00Due to Other Agencies 2230 0.00 0.00 0.00 0.00 0.00Due to Fiscal Agent 2240 0.00 0.00 0.00 0.00 0.00Pension Liability 2115 0.00 0.00 0.00 0.00 0.00Other Postemployment Benefits Liability 2116 0.00 0.00 0.00 0.00 0.00Judgments Payable 2130 0.00 0.00 0.00 0.00 0.00Construction Contracts Payable 2140 0.00 0.00 0.00 0.00 0.00Construction Contracts Payable - Retained Percentage 2150 0.00 0.00 0.00 0.00 0.00Estimated Unpaid Claims - Self-Insurance Program 2271 0.00 0.00 0.00 0.00 0.00Estimated Liability for Claims Adjustment 2272 0.00 0.00 0.00 0.00 0.00Estimated Liability for Arbitrage Rebate 2280 0.00 0.00 0.00 0.00 0.00Unearned Revenues 2410 0.00 0.00 0.00 0.00 0.00
Noncurrent Liabilities:Portion Due Within One Year:
Notes Payable 2310 0.00 0.00 0.00 0.00 0.00Obligations Under Capital Leases 2315 0.00 0.00 0.00 0.00 0.00Bonds Payable 2320 0.00 0.00 0.00 0.00 0.00Liability for Compensated Absences 2330 0.00 0.00 0.00 0.00 0.00Lease-Purchase Agreements Payable 2340 0.00 0.00 0.00 0.00 0.00Estimated Liability for Long-Term Claims 2350 0.00 0.00 0.00 0.00 0.00Net Other Postemployment Benefits Obligation 2360 0.00 0.00 0.00 0.00 0.00Net Pension Liability 2365 0.00 0.00 0.00 0.00 0.00Estimated PECO Advance Payable 2370 0.00 0.00 0.00 0.00 0.00Other Long-Term Liabilities 2380 0.00 0.00 0.00 0.00 0.00Derivative Instrument 2390 0.00 0.00 0.00 0.00 0.00Estimated Liability for Arbitrage Rebate 2280 0.00 0.00 0.00 0.00 0.00Due Within One Year 0.00 0.00 0.00 0.00 0.00
Portion Due After One Year:Notes Payable 2310 0.00 0.00 0.00 0.00 0.00Obligations Under Capital Leases 2315 0.00 0.00 0.00 0.00 0.00Bonds Payable 2320 0.00 0.00 0.00 0.00 0.00Liability for Compensated Absences 2330 0.00 0.00 0.00 0.00 0.00Lease-Purchase Agreements Payable 2340 0.00 0.00 0.00 0.00 0.00Estimated Liability for Long-Term Claims 2350 0.00 0.00 0.00 0.00 0.00Net Other Postemployment Benefits Obligation 2360 0.00 0.00 0.00 0.00 0.00Net Pension Liability 2365 0.00 0.00 0.00 0.00 0.00Estimated PECO Advance Payable 2370 0.00 0.00 0.00 0.00 0.00Other Long-Term Liabilities 2380 0.00 0.00 0.00 0.00 0.00Derivative Instrument 2390 0.00 0.00 0.00 0.00 0.00Estimated Liability for Arbitrage Rebate 2280 0.00 0.00 0.00 0.00 0.00Due in More than One Year 0.00 0.00 0.00 0.00 0.00
Total Long-Term Liabilities 0.00 0.00 0.00 0.00 0.00Total Liabilities 26,500.00 41,413.00 34,379.00 88,028.00 190,320.00DEFERRED INFLOWS OF RESOURCESAccumulated Increase in Fair Value of Hedging Derivatives 2610 0.00 0.00 0.00 0.00 0.00Deficit Net Carrying Amount of Debt Refunding 2620 0.00 0.00 0.00 0.00 0.00Deferred Revenue 2630 0.00 0.00 0.00 0.00 0.00Pension 2640 0.00 0.00 0.00 0.00 0.00Other Postemployment Benefits 2650 0.00 0.00 0.00 0.00 0.00Total Deferred Inflows of Resources 0.00 0.00 0.00 0.00 0.00NET POSITIONNet Investment in Capital Assets 2770 0.00 1,423.00 68,080.00 51,877.00 121,380.00Restricted For:
Categorical Carryover Programs 2780 0.00 0.00 0.00 0.00 0.00Food Service 2780 0.00 0.00 0.00 0.00 0.00Debt Service 2780 0.00 0.00 0.00 0.00 0.00Capital Projects 2780 0.00 0.00 0.00 0.00 0.00Other Purposes 2780 0.00 239,693.00 0.00 0.00 239,693.00
Unrestricted 2790 72,174.00 402,782.00 406,865.00 729,860.00 1,611,681.00Total Net Position 72,174.00 643,898.00 474,945.00 781,737.00 1,972,754.00
The notes to financial statements are an integral part of this statement.ESE 145
2017-18 Final AFR, St. Johns County Schools September 2018 Page 99 of 132

Exhibit J-2aPage 39
DISTRICT SCHOOL BOARD OF ST. JOHNS COUNTYCOMBINING STATEMENT OF ACTIVITIESNONMAJOR COMPONENT UNITSSt. Augustine Public MontessoriFor the Fiscal Year Ended June 30, 2018
Charges forServices
OperatingGrants and
Contributions
CapitalGrants and
ContributionsComponent Unit Activities:
Instruction 5000 545,682.00 5,280.00 0.00 0.00 (540,402.00)Student Support Services 6100 14,186.00 0.00 0.00 0.00 (14,186.00)Instructional Media Services 6200 0.00 0.00 0.00 0.00 0.00Instruction and Curriculum Development Services 6300 0.00 0.00 0.00 0.00 0.00Instructional Staff Training Services 6400 0.00 0.00 0.00 0.00 0.00Instruction-Related Technology 6500 0.00 0.00 0.00 0.00 0.00Board 7100 0.00 0.00 0.00 0.00 0.00General Administration 7200 0.00 0.00 0.00 0.00 0.00School Administration 7300 361,778.00 0.00 0.00 80,886.00 (280,892.00)Facilities Acquisition and Construction 7400 0.00 0.00 0.00 0.00 0.00Fiscal Services 7500 0.00 0.00 0.00 0.00 0.00Food Services 7600 0.00 0.00 0.00 0.00 0.00Central Services 7700 0.00 0.00 0.00 0.00 0.00Student Transportation Services 7800 0.00 0.00 0.00 0.00 0.00Operation of Plant 7900 0.00 0.00 0.00 0.00 0.00Maintenance of Plant 8100 26,570.00 0.00 0.00 0.00 (26,570.00)Administrative Technology Services 8200 0.00 0.00 0.00 0.00 0.00Community Services 9100 22,709.00 7,157.00 0.00 0.00 (15,552.00)Interest on Long-Term Debt 9200 0.00 0.00 0.00 0.00 0.00Unallocated Depreciation/Amortization Expense 0.00 0.00
Total Component Unit Activities 970,925.00 12,437.00 0.00 80,886.00 (877,602.00)
General Revenues:Taxes:
Property Taxes, Levied for Operational Purposes 0.00Property Taxes, Levied for Debt Service 0.00Property Taxes, Levied for Capital Projects 0.00Local Sales Taxes 0.00
Grants and Contributions Not Restricted to Specific Programs 912,255.00Investment Earnings 0.00Miscellaneous 0.00Special Items 0.00Extraordinary Items 0.00Transfers 0.00Total General Revenues, Special Items, Extraordinary Items and Transfers 912,255.00Change in Net Position 34,653.00Net Position, July 1, 2017 37,521.00Adjustments to Net Position 0.00Net Position, June 30, 2018 72,174.00
The notes to financial statements are an integral part of this statement.ESE 145
FUNCTIONSAccountNumber Expenses
Program Revenues Net (Expense)Revenue and Changes
in Net PositionComponent Unit
2017-18 Final AFR, St. Johns County Schools September 2018 Page 100 of 132
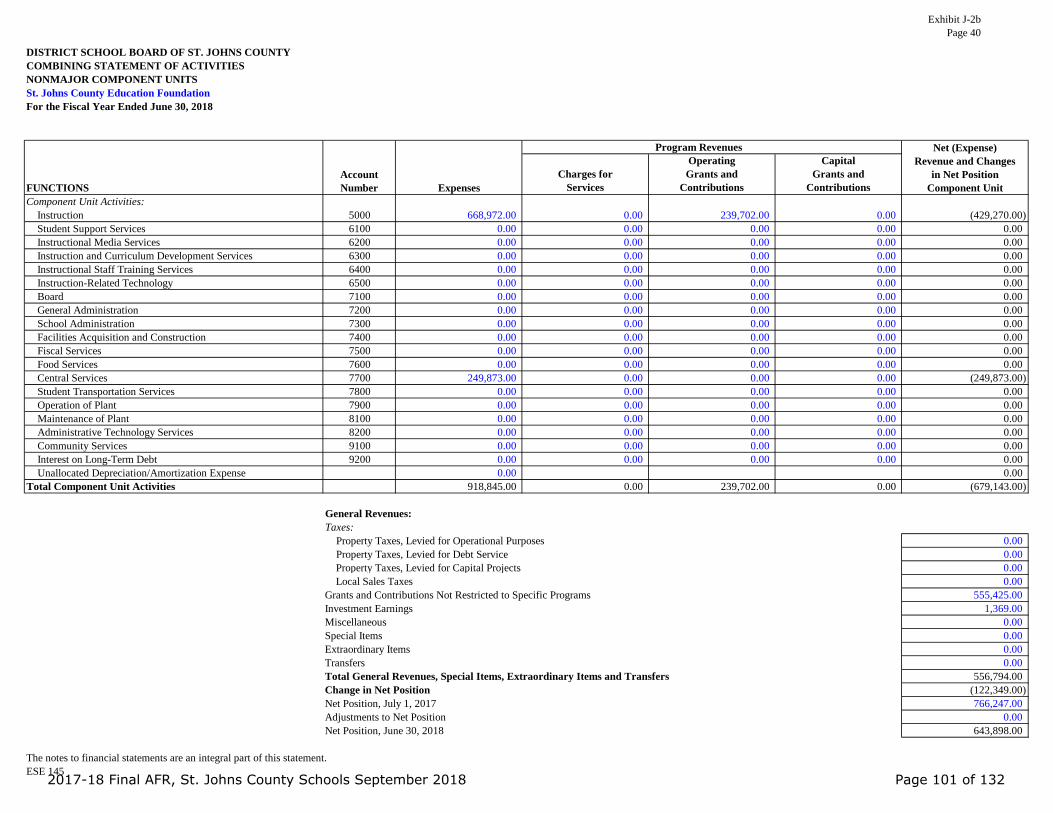
Exhibit J-2bPage 40
DISTRICT SCHOOL BOARD OF ST. JOHNS COUNTYCOMBINING STATEMENT OF ACTIVITIESNONMAJOR COMPONENT UNITSSt. Johns County Education FoundationFor the Fiscal Year Ended June 30, 2018
Charges forServices
OperatingGrants and
Contributions
CapitalGrants and
ContributionsComponent Unit Activities:
Instruction 5000 668,972.00 0.00 239,702.00 0.00 (429,270.00)Student Support Services 6100 0.00 0.00 0.00 0.00 0.00Instructional Media Services 6200 0.00 0.00 0.00 0.00 0.00Instruction and Curriculum Development Services 6300 0.00 0.00 0.00 0.00 0.00Instructional Staff Training Services 6400 0.00 0.00 0.00 0.00 0.00Instruction-Related Technology 6500 0.00 0.00 0.00 0.00 0.00Board 7100 0.00 0.00 0.00 0.00 0.00General Administration 7200 0.00 0.00 0.00 0.00 0.00School Administration 7300 0.00 0.00 0.00 0.00 0.00Facilities Acquisition and Construction 7400 0.00 0.00 0.00 0.00 0.00Fiscal Services 7500 0.00 0.00 0.00 0.00 0.00Food Services 7600 0.00 0.00 0.00 0.00 0.00Central Services 7700 249,873.00 0.00 0.00 0.00 (249,873.00)Student Transportation Services 7800 0.00 0.00 0.00 0.00 0.00Operation of Plant 7900 0.00 0.00 0.00 0.00 0.00Maintenance of Plant 8100 0.00 0.00 0.00 0.00 0.00Administrative Technology Services 8200 0.00 0.00 0.00 0.00 0.00Community Services 9100 0.00 0.00 0.00 0.00 0.00Interest on Long-Term Debt 9200 0.00 0.00 0.00 0.00 0.00Unallocated Depreciation/Amortization Expense 0.00 0.00
Total Component Unit Activities 918,845.00 0.00 239,702.00 0.00 (679,143.00)
General Revenues:Taxes:
Property Taxes, Levied for Operational Purposes 0.00Property Taxes, Levied for Debt Service 0.00Property Taxes, Levied for Capital Projects 0.00Local Sales Taxes 0.00
Grants and Contributions Not Restricted to Specific Programs 555,425.00Investment Earnings 1,369.00Miscellaneous 0.00Special Items 0.00Extraordinary Items 0.00Transfers 0.00Total General Revenues, Special Items, Extraordinary Items and Transfers 556,794.00Change in Net Position (122,349.00)Net Position, July 1, 2017 766,247.00Adjustments to Net Position 0.00Net Position, June 30, 2018 643,898.00
The notes to financial statements are an integral part of this statement.ESE 145
FUNCTIONSAccountNumber Expenses
Program Revenues Net (Expense)Revenue and Changes
in Net PositionComponent Unit
2017-18 Final AFR, St. Johns County Schools September 2018 Page 101 of 132

Exhibit J-2cPage 41
DISTRICT SCHOOL BOARD OF ST. JOHNS COUNTYCOMBINING STATEMENT OF ACTIVITIES (CONTINUED)NONMAJOR COMPONENT UNITSTherapeutic Learning CenterFor the Fiscal Year Ended June 30, 2018
Charges forServices
OperatingGrants and
Contributions
CapitalGrants and
ContributionsComponent Unit Activities:
Instruction 5000 212,212.00 0.00 271,416.00 0.00 59,204.00Student Support Services 6100 0.00 0.00 0.00 0.00 0.00Instructional Media Services 6200 0.00 0.00 0.00 0.00 0.00Instruction and Curriculum Development Services 6300 2,599.00 0.00 0.00 0.00 (2,599.00)Instructional Staff Training Services 6400 0.00 0.00 0.00 0.00 0.00Instruction-Related Technology 6500 0.00 0.00 0.00 0.00 0.00Board 7100 0.00 0.00 0.00 0.00 0.00General Administration 7200 0.00 0.00 0.00 0.00 0.00School Administration 7300 31,918.00 0.00 0.00 0.00 (31,918.00)Facilities Acquisition and Construction 7400 42,000.00 0.00 0.00 2,403.00 (39,597.00)Fiscal Services 7500 0.00 0.00 0.00 0.00 0.00Food Services 7600 0.00 0.00 0.00 0.00 0.00Central Services 7700 0.00 0.00 0.00 0.00 0.00Student Transportation Services 7800 0.00 0.00 0.00 0.00 0.00Operation of Plant 7900 6,433.00 0.00 0.00 0.00 (6,433.00)Maintenance of Plant 8100 20,099.00 0.00 0.00 0.00 (20,099.00)Administrative Technology Services 8200 40.00 0.00 0.00 0.00 (40.00)Community Services 9100 0.00 0.00 0.00 0.00 0.00Interest on Long-Term Debt 9200 0.00 0.00 0.00 0.00 0.00Unallocated Depreciation/Amortization Expense 8,792.00 (8,792.00)
Total Component Unit Activities 324,093.00 0.00 271,416.00 2,403.00 (50,274.00)
General Revenues:Taxes:
Property Taxes, Levied for Operational Purposes 0.00Property Taxes, Levied for Debt Service 0.00Property Taxes, Levied for Capital Projects 0.00Local Sales Taxes 0.00
Grants and Contributions Not Restricted to Specific Programs 0.00Investment Earnings 0.00Miscellaneous 0.00Special Items 0.00Extraordinary Items 0.00Transfers 0.00Total General Revenues, Special Items, Extraordinary Items and Transfers 0.00Change in Net Position (50,274.00)Net Position, July 1, 2017 525,219.00Adjustments to Net Position 0.00Net Position, June 30, 2018 474,945.00
The notes to financial statements are an integral part of this statement.ESE 145
FUNCTIONSAccountNumber Expenses
Program Revenues Net (Expense)Revenue and Changes
in Net PositionComponent Unit
2017-18 Final AFR, St. Johns County Schools September 2018 Page 102 of 132

Exhibit J-2dPage 42
DISTRICT SCHOOL BOARD OF ST. JOHNS COUNTYCOMBINING STATEMENT OF ACTIVITIES (CONTINUED)NONMAJOR COMPONENT UNITSSt. Johns Community CampusFor the Fiscal Year Ended June 30, 2018
Charges forServices
OperatingGrants and
Contributions
CapitalGrants and
ContributionsComponent Unit Activities:
Instruction 5000 398,505.00 0.00 782,719.00 0.00 384,214.00Student Support Services 6100 0.00 0.00 0.00 0.00 0.00Instructional Media Services 6200 0.00 0.00 0.00 0.00 0.00Instruction and Curriculum Development Services 6300 13,642.00 0.00 0.00 0.00 (13,642.00)Instructional Staff Training Services 6400 0.00 0.00 0.00 0.00 0.00Instruction-Related Technology 6500 0.00 0.00 0.00 0.00 0.00Board 7100 0.00 0.00 0.00 0.00 0.00General Administration 7200 0.00 0.00 0.00 0.00 0.00School Administration 7300 81,490.00 0.00 0.00 0.00 (81,490.00)Facilities Acquisition and Construction 7400 82,000.00 0.00 0.00 7,577.00 (74,423.00)Fiscal Services 7500 0.00 0.00 0.00 0.00 0.00Food Services 7600 0.00 0.00 0.00 0.00 0.00Central Services 7700 0.00 0.00 0.00 0.00 0.00Student Transportation Services 7800 34,080.00 0.00 0.00 0.00 (34,080.00)Operation of Plant 7900 10,310.00 0.00 0.00 0.00 (10,310.00)Maintenance of Plant 8100 8,060.00 0.00 0.00 0.00 (8,060.00)Administrative Technology Services 8200 840.00 0.00 0.00 0.00 (840.00)Community Services 9100 0.00 0.00 0.00 0.00 0.00Interest on Long-Term Debt 9200 0.00 0.00 0.00 0.00 0.00Unallocated Depreciation/Amortization Expense 9,939.00 (9,939.00)
Total Component Unit Activities 638,866.00 0.00 782,719.00 7,577.00 151,430.00
General Revenues:Taxes:
Property Taxes, Levied for Operational Purposes 0.00Property Taxes, Levied for Debt Service 0.00Property Taxes, Levied for Capital Projects 0.00Local Sales Taxes 0.00
Grants and Contributions Not Restricted to Specific Programs 0.00Investment Earnings 0.00Miscellaneous 0.00Special Items 0.00Extraordinary Items 0.00Transfers 0.00Total General Revenues, Special Items, Extraordinary Items and Transfers 0.00Change in Net Position 151,430.00Net Position, July 1, 2017 630,307.00Adjustments to Net Position 0.00Net Position, June 30, 2018 781,737.00
The notes to financial statements are an integral part of this statement.ESE 145
FUNCTIONSAccountNumber Expenses
Program Revenues Net (Expense)Revenue and Changes
in Net PositionComponent Unit
2017-18 Final AFR, St. Johns County Schools September 2018 Page 103 of 132

Exhibit J-2ePage 43
DISTRICT SCHOOL BOARD OF ST. JOHNS COUNTYCOMBINING STATEMENT OF ACTIVITIES (CONTINUED)NONMAJOR COMPONENT UNITSTOTAL NONMAJOR COMPONENT UNITSFor the Fiscal Year Ended June 30, 2018
Charges forServices
OperatingGrants and
Contributions
CapitalGrants and
ContributionsComponent Unit Activities:
Instruction 5000 1,825,371.00 5,280.00 1,293,837.00 0.00 (526,254.00)Student Support Services 6100 14,186.00 0.00 0.00 0.00 (14,186.00)Instructional Media Services 6200 0.00 0.00 0.00 0.00 0.00Instruction and Curriculum Development Services 6300 16,241.00 0.00 0.00 0.00 (16,241.00)Instructional Staff Training Services 6400 0.00 0.00 0.00 0.00 0.00Instruction-Related Technology 6500 0.00 0.00 0.00 0.00 0.00Board 7100 0.00 0.00 0.00 0.00 0.00General Administration 7200 0.00 0.00 0.00 0.00 0.00School Administration 7300 475,186.00 0.00 0.00 80,886.00 (394,300.00)Facilities Acquisition and Construction 7400 124,000.00 0.00 0.00 9,980.00 (114,020.00)Fiscal Services 7500 0.00 0.00 0.00 0.00 0.00Food Services 7600 0.00 0.00 0.00 0.00 0.00Central Services 7700 249,873.00 0.00 0.00 0.00 (249,873.00)Student Transportation Services 7800 34,080.00 0.00 0.00 0.00 (34,080.00)Operation of Plant 7900 16,743.00 0.00 0.00 0.00 (16,743.00)Maintenance of Plant 8100 54,729.00 0.00 0.00 0.00 (54,729.00)Administrative Technology Services 8200 880.00 0.00 0.00 0.00 (880.00)Community Services 9100 22,709.00 7,157.00 0.00 0.00 (15,552.00)Interest on Long-Term Debt 9200 0.00 0.00 0.00 0.00 0.00Unallocated Depreciation/Amortization Expense 18,731.00 (18,731.00)
Total Component Unit Activities 2,852,729.00 12,437.00 1,293,837.00 90,866.00 (1,455,589.00)
General Revenues:Taxes:
Property Taxes, Levied for Operational Purposes 0.00Property Taxes, Levied for Debt Service 0.00Property Taxes, Levied for Capital Projects 0.00Local Sales Taxes 0.00
Grants and Contributions Not Restricted to Specific Programs 1,467,680.00Investment Earnings 1,369.00Miscellaneous 0.00Special Items 0.00Extraordinary Items 0.00Transfers 0.00Total General Revenues, Special Items, Extraordinary Items and Transfers 1,469,049.00Change in Net Position 13,460.00Net Position, July 1, 2017 1,959,294.00Adjustments to Net Position 0.00Net Position, June 30, 2018 1,972,754.00
The notes to financial statements are an integral part of this statement.ESE 145
Expenses
Program Revenues Net (Expense)Revenue and Changes
in Net PositionComponent UnitFUNCTIONS
AccountNumber
2017-18 Final AFR, St. Johns County Schools September 2018 Page 104 of 132
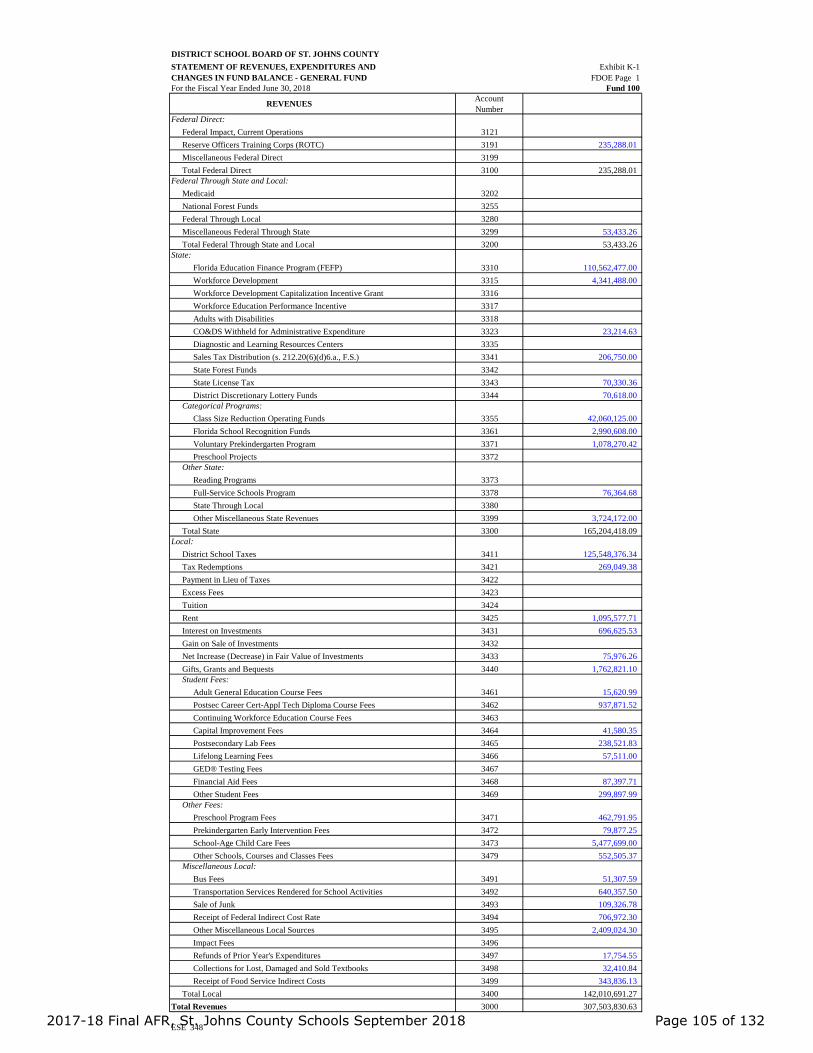
DISTRICT SCHOOL BOARD OF ST. JOHNS COUNTYSTATEMENT OF REVENUES, EXPENDITURES AND Exhibit K-1CHANGES IN FUND BALANCE - GENERAL FUND FDOE Page 1For the Fiscal Year Ended June 30, 2018 Fund 100
REVENUES AccountNumber
Federal Direct:Federal Impact, Current Operations 3121Reserve Officers Training Corps (ROTC) 3191 235,288.01Miscellaneous Federal Direct 3199Total Federal Direct 3100 235,288.01
Federal Through State and Local:Medicaid 3202National Forest Funds 3255Federal Through Local 3280Miscellaneous Federal Through State 3299 53,433.26Total Federal Through State and Local 3200 53,433.26
State:Florida Education Finance Program (FEFP) 3310 110,562,477.00Workforce Development 3315 4,341,488.00Workforce Development Capitalization Incentive Grant 3316Workforce Education Performance Incentive 3317Adults with Disabilities 3318CO&DS Withheld for Administrative Expenditure 3323 23,214.63Diagnostic and Learning Resources Centers 3335Sales Tax Distribution (s. 212.20(6)(d)6.a., F.S.) 3341 206,750.00State Forest Funds 3342State License Tax 3343 70,330.36District Discretionary Lottery Funds 3344 70,618.00
Categorical Programs:Class Size Reduction Operating Funds 3355 42,060,125.00Florida School Recognition Funds 3361 2,990,608.00Voluntary Prekindergarten Program 3371 1,078,270.42Preschool Projects 3372
Other State:Reading Programs 3373Full-Service Schools Program 3378 76,364.68State Through Local 3380Other Miscellaneous State Revenues 3399 3,724,172.00
Total State 3300 165,204,418.09Local:
District School Taxes 3411 125,548,376.34Tax Redemptions 3421 269,049.38Payment in Lieu of Taxes 3422Excess Fees 3423Tuition 3424Rent 3425 1,095,577.71Interest on Investments 3431 696,625.53Gain on Sale of Investments 3432Net Increase (Decrease) in Fair Value of Investments 3433 75,976.26Gifts, Grants and Bequests 3440 1,762,821.10Student Fees:
Adult General Education Course Fees 3461 15,620.99Postsec Career Cert-Appl Tech Diploma Course Fees 3462 937,871.52Continuing Workforce Education Course Fees 3463Capital Improvement Fees 3464 41,580.35Postsecondary Lab Fees 3465 238,521.83Lifelong Learning Fees 3466 57,511.00GED® Testing Fees 3467Financial Aid Fees 3468 87,397.71Other Student Fees 3469 299,897.99
Other Fees:Preschool Program Fees 3471 462,791.95Prekindergarten Early Intervention Fees 3472 79,877.25School-Age Child Care Fees 3473 5,477,699.00Other Schools, Courses and Classes Fees 3479 552,505.37
Miscellaneous Local:Bus Fees 3491 51,307.59Transportation Services Rendered for School Activities 3492 640,357.50Sale of Junk 3493 109,326.78Receipt of Federal Indirect Cost Rate 3494 706,972.30Other Miscellaneous Local Sources 3495 2,409,024.30Impact Fees 3496Refunds of Prior Year's Expenditures 3497 17,754.55Collections for Lost, Damaged and Sold Textbooks 3498 32,410.84Receipt of Food Service Indirect Costs 3499 343,836.13
Total Local 3400 142,010,691.27Total Revenues 3000 307,503,830.63
ESE 3482017-18 Final AFR, St. Johns County Schools September 2018 Page 105 of 132
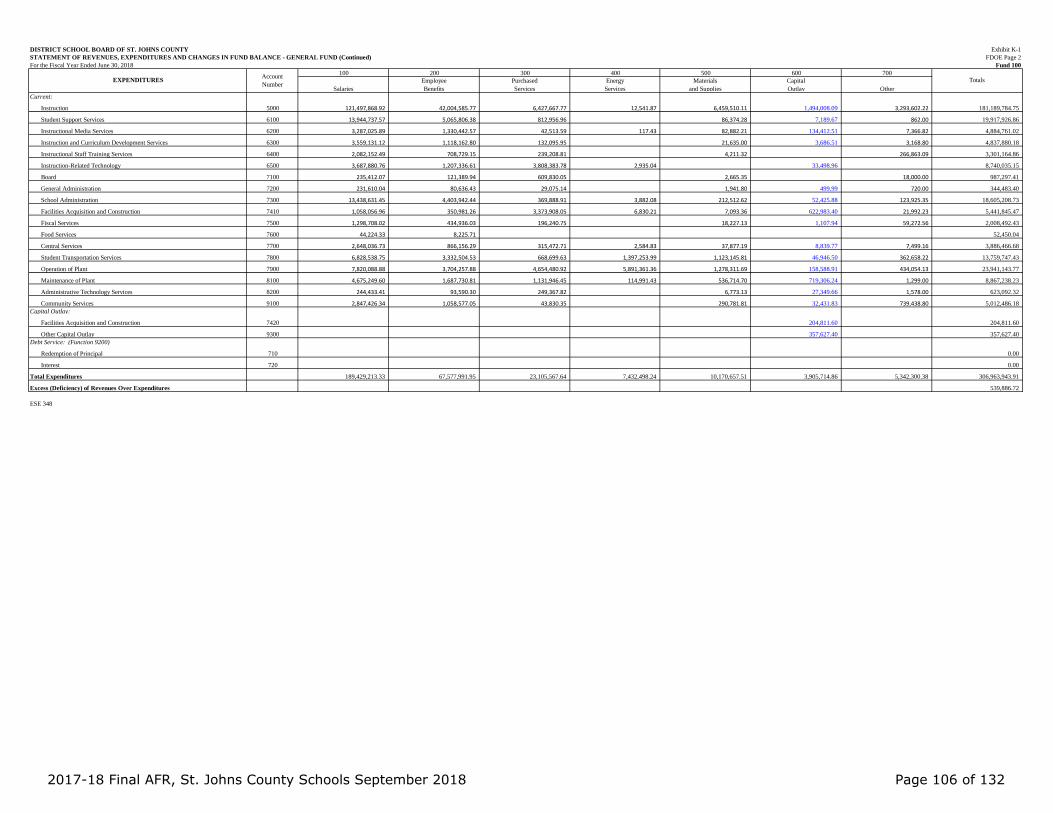
DISTRICT SCHOOL BOARD OF ST. JOHNS COUNTY Exhibit K-1STATEMENT OF REVENUES, EXPENDITURES AND CHANGES IN FUND BALANCE - GENERAL FUND (Continued) FDOE Page 2For the Fiscal Year Ended June 30, 2018 Fund 100
100 200 300 400 500 600 700
SalariesEmployeeBenefits
PurchasedServices
EnergyServices
Materialsand Supplies
CapitalOutlay Other
Current:
Instruction 5000 121,497,868.92 42,004,585.77 6,427,667.77 12,541.87 6,459,510.11 1,494,008.09 3,293,602.22 181,189,784.75
Student Support Services 6100 13,944,737.57 5,065,806.38 812,956.96 86,374.28 7,189.67 862.00 19,917,926.86
Instructional Media Services 6200 3,287,025.89 1,330,442.57 42,513.59 117.43 82,882.21 134,412.51 7,366.82 4,884,761.02
Instruction and Curriculum Development Services 6300 3,559,131.12 1,118,162.80 132,095.95 21,635.00 3,686.51 3,168.80 4,837,880.18
Instructional Staff Training Services 6400 2,082,152.49 708,729.15 239,208.81 4,211.32 266,863.09 3,301,164.86
Instruction-Related Technology 6500 3,687,880.76 1,207,336.61 3,808,383.78 2,935.04 33,498.96 8,740,035.15
Board 7100 235,412.07 121,389.94 609,830.05 2,665.35 18,000.00 987,297.41
General Administration 7200 231,610.04 80,636.43 29,075.14 1,941.80 499.99 720.00 344,483.40
School Administration 7300 13,438,631.45 4,403,942.44 369,888.91 3,882.08 212,512.62 52,425.88 123,925.35 18,605,208.73
Facilities Acquisition and Construction 7410 1,058,056.96 350,981.26 3,373,908.05 6,830.21 7,093.36 622,983.40 21,992.23 5,441,845.47
Fiscal Services 7500 1,298,708.02 434,936.03 196,240.75 18,227.13 1,107.94 59,272.56 2,008,492.43
Food Services 7600 44,224.33 8,225.71 52,450.04
Central Services 7700 2,648,036.73 866,156.29 315,472.71 2,584.83 37,877.19 8,839.77 7,499.16 3,886,466.68
Student Transportation Services 7800 6,828,538.75 3,332,504.53 668,699.63 1,397,253.99 1,123,145.81 46,946.50 362,658.22 13,759,747.43
Operation of Plant 7900 7,820,088.88 3,704,257.88 4,654,480.92 5,891,361.36 1,278,311.69 158,588.91 434,054.13 23,941,143.77
Maintenance of Plant 8100 4,675,249.60 1,687,730.81 1,131,946.45 114,991.43 536,714.70 719,306.24 1,299.00 8,867,238.23
Administrative Technology Services 8200 244,433.41 93,590.30 249,367.82 6,773.13 27,349.66 1,578.00 623,092.32
Community Services 9100 2,847,426.34 1,058,577.05 43,830.35 290,781.81 32,431.83 739,438.80 5,012,486.18Capital Outlay:
Facilities Acquisition and Construction 7420 204,811.60 204,811.60
Other Capital Outlay 9300 357,627.40 357,627.40Debt Service: (Function 9200)
Redemption of Principal 710 0.00
Interest 720 0.00
Total Expenditures 189,429,213.33 67,577,991.95 23,105,567.64 7,432,498.24 10,170,657.51 3,905,714.86 5,342,300.38 306,963,943.91
Excess (Deficiency) of Revenues Over Expenditures 539,886.72
ESE 348
Totals EXPENDITURES AccountNumber
2017-18 Final AFR, St. Johns County Schools September 2018 Page 106 of 132

DISTRICT SCHOOL BOARD OF ST. JOHNS COUNTYSTATEMENT OF REVENUES, EXPENDITURES AND Exhibit K-1CHANGES IN FUND BALANCE - GENERAL FUND (Continued) FDOE Page 3For the Fiscal Year Ended June 30, 2018 Fund 100
OTHER FINANCING SOURCES (USES)and CHANGES IN FUND BALANCES
AccountNumber
Loans 3720
Sale of Capital Assets 3730
Loss Recoveries 3740 182,508.20Transfers In:
From Debt Service Funds 3620
From Capital Projects Funds 3630 6,202,406.00
From Special Revenue Funds 3640 250,000.00
From Permanent Funds 3660
From Internal Service Funds 3670
From Enterprise Funds 3690
Total Transfers In 3600 6,452,406.00Transfers Out: (Function 9700)
To Debt Service Funds 920
To Capital Projects Funds 930 (70,777.17)
To Special Revenue Funds 940
To Permanent Funds 960
To Internal Service Funds 970
To Enterprise Funds 990
Total Transfers Out 9700 (70,777.17)
Total Other Financing Sources (Uses) 6,564,137.03
Net Change In Fund Balance 7,104,023.75
Fund Balance, July 1, 2017 2800 47,827,322.47
Adjustments to Fund Balance 2891Ending Fund Balance:
Nonspendable Fund Balance 2710 691,786.91
Restricted Fund Balance 2720 1,951,080.57
Committed Fund Balance 2730 9,200,723.51
Assigned Fund Balance 2740 27,890,816.47
Unassigned Fund Balance 2750 15,196,938.76
Total Fund Balances, June 30, 2018 2700 54,931,346.22
ESE 348
2017-18 Final AFR, St. Johns County Schools September 2018 Page 107 of 132

DISTRICT SCHOOL BOARD OF ST. JOHNS COUNTYSTATEMENT OF REVENUES, EXPENDITURES ANDCHANGES IN FUND BALANCE - SPECIAL REVENUE Exhibit K-2FUNDS - FOOD SERVICES FDOE Page 4For the Fiscal Year Ended June 30, 2018 Fund 410
REVENUES AccountNumber
Federal :
Miscellaneous Federal Direct 3199Federal Through State and Local:
School Lunch Reimbursement 3261 4,383,224.21
School Breakfast Reimbursement 3262 869,985.19
Afterschool Snack Reimbursement 3263 43,611.92
Child Care Food Program 3264
USDA-Donated Commodities 3265 587,691.39
Cash in Lieu of Donated Foods 3266
Summer Food Service Program 3267 86,802.64
Fresh Fruit and Vegetable Program 3268
Other Food Services 3269
Federal Through Local 3280
Miscellaneous Federal Through State 3299
Total Federal Through State and Local 3200 5,971,315.35State:
School Breakfast Supplement 3337 23,670.00
School Lunch Supplement 3338 38,779.00
State Through Local 3380
Other Miscellaneous State Revenues 3399
Total State 3300 62,449.00Local:
Interest on Investments 3431 19,489.89
Gain on Sale of Investments 3432
Net Increase (Decrease) in Fair Value of Investments 3433
Gifts, Grants and Bequests 3440
Student Lunches 3451 2,186,546.60
Student Breakfasts 3452 65,289.50
Adult Breakfasts/Lunches 3453 383.05
Student and Adult á la Carte Fees 3454 4,747,387.19
Student Snacks 3455
Other Food Sales 3456
Other Miscellaneous Local Sources 3495 201,626.18
Refunds of Prior Year's Expenditures 3497
Total Local 3400 7,220,722.41
Total Revenues 3000 13,254,486.76
ESE 3482017-18 Final AFR, St. Johns County Schools September 2018 Page 108 of 132

DISTRICT SCHOOL BOARD OF ST. JOHNS COUNTYSTATEMENT OF REVENUES, EXPENDITURES AND CHANGES IN FUND BALANCE - SPECIAL REVENUE Exhibit K-2FUNDS - FOOD SERVICES (Continued) FDOE Page 5For the Fiscal Year Ended June 30, 2018 Fund 410
EXPENDITURES (Function 7600/9300) AccountNumber
Salaries 100 4,162,321.93
Employee Benefits 200 2,083,569.66
Purchased Services 300 167,199.35
Energy Services 400 82,527.80
Materials and Supplies 500 4,780,529.12
Capital Outlay 600 155,901.67
Other 700 468,496.67
Other Capital Outlay (Function 9300) 600 155,307.71
Total Expenditures 12,055,853.91
Excess (Deficiency) of Revenues Over Expenditures 1,198,632.85OTHER FINANCING SOURCES (USES)
and CHANGES IN FUND BALANCES
Loans 3720
Sale of Capital Assets 3730
Loss Recoveries 3740Transfers In:
From General Fund 3610
From Debt Service Funds 3620
From Capital Projects Funds 3630
Interfund 3650
From Permanent Funds 3660
From Internal Service Funds 3670
From Enterprise Funds 3690
Total Transfers In 3600 0.00Transfers Out: (Function 9700)
To General Fund 910 (250,000.00)
To Debt Service Funds 920
To Capital Projects Funds 930
Interfund 950
To Permanent Funds 960
To Internal Service Funds 970
To Enterprise Funds 990
Total Transfers Out 9700 (250,000.00)
Total Other Financing Sources (Uses) (250,000.00)
Net Change in Fund Balance 948,632.85
Fund Balance, July 1, 2017 2800 1,176,150.36
Adjustments to Fund Balance 2891Ending Fund Balance:
Nonspendable Fund Balance 2710 373,298.10
Restricted Fund Balance 2720 1,751,485.11
Committed Fund Balance 2730
Assigned Fund Balance 2740
Unassigned Fund Balance 2750
Total Fund Balances, June 30, 2018 2700 2,124,783.21
ESE 348 2017-18 Final AFR, St. Johns County Schools September 2018 Page 109 of 132

DISTRICT SCHOOL BOARD OF ST. JOHNS COUNTYSTATEMENT OF REVENUES, EXPENDITURES AND CHANGES IN FUND BALANCE - SPECIAL REVENUE Exhibit K-3FUNDS - OTHER FEDERAL PROGRAMS FDOE Page 6For the Fiscal Year Ended June 30, 2018 Fund 420
REVENUES AccountNumber
Federal Direct:
Head Start 3130 1,031,068.71
Workforce Innovation and Opportunity Act 3170
Community Action Programs 3180
Reserve Officers Training Corps (ROTC) 3191
Pell Grants 3192 531,569.11
Miscellaneous Federal Direct 3199 53,742.36
Total Federal Direct 3100 1,616,380.18Federal Through State and Local:
Career and Technical Education 3201 367,969.95
Medicaid 3202
Individuals with Disabilities Education Act (IDEA) 3230 6,462,951.67Workforce Innovation and Opportunity Act:
Adult General Education 3221 277,075.60
English Literacy and Civics Education 3222
Adult Migrant Education 3223
Other WIOA Programs 3224 606,670.52ESSA - Elementary and Secondary Education Act:
Elementary and Secondary Education Act - Title I 3240 3,289,210.47
Teacher and Principal Training and Recruiting - Title II, Part A 3225 514,072.79
Math and Science Partnerships - Title II, Part B 3226 42,857.80
Language Instruction - Title III 3241 73,393.27
Twenty-First Century Schools - Title IV 3242 65,903.39
Federal Through Local 3280
Emergency Immigrant Education Program 3293
Miscellaneous Federal Through State 3299 63,905.01
Total Federal Through State and Local 3200 11,764,010.47State:
State Through Local 3380
Other Miscellaneous State Revenues 3399
Total State 3300 0.00Local:
Interest on Investments 3431
Gain on Sale of Investments 3432
Net Increase (Decrease) in Fair Value of Investments 3433
Gifts, Grants and Bequests 3440
Adult General Education Course Fees 3461
Sale of Junk 3493
Other Miscellaneous Local Sources 3495
Refunds of Prior Year's Expenditures 3497
Total Local 3400 0.00
Total Revenues 3000 13,380,390.65
ESE 3482017-18 Final AFR, St. Johns County Schools September 2018 Page 110 of 132

DISTRICT SCHOOL BOARD OF ST. JOHNS COUNTY Exhibit K-3STATEMENT OF REVENUES, EXPENDITURES AND CHANGES IN FUND BALANCE - SPECIAL REVENUE FUNDS - OTHER FEDERAL PROGRAMS (Continued) FDOE Page 7For the Fiscal Year Ended June 30, 2018 Fund 420
100 200 300 400 500 600 700
SalariesEmployeeBenefits
PurchasedServices
EnergyServices
Materialsand Supplies
CapitalOutlay Other
Current:
Instruction 5000 3,194,626.32 1,275,712.04 830,700.54 202,082.57 216,278.11 539,788.52 6,259,188.10
Student Support Services 6100 1,953,533.85 619,055.77 209,824.81 42,421.19 15,135.45 2,839,971.07
Instructional Media Services 6200 0.00
Instruction and Curriculum Development Services 6300 1,387,741.26 410,560.95 114,404.78 13,123.61 4,360.92 690.00 1,930,881.52
Instructional Staff Training Services 6400 413,413.34 89,206.55 207,869.89 3,290.74 214.99 88,796.03 802,791.54
Instruction-Related Technology 6500 0.00
Board 7100 0.00
General Administration 7200 706,972.30 706,972.30
School Administration 7300 0.00
Facilities Acquisition and Construction 7410 0.00
Fiscal Services 7500 0.00
Food Services 7600 0.00
Central Services 7700 17,856.87 17,856.87
Student Transportation Services 7800 107,324.91 107,324.91
Operation of Plant 7900 48.52 116.03 164.55
Maintenance of Plant 8100 0.00
Administrative Technology Services 8200 0.00
Community Services 9100 37,746.03 11,316.06 19,190.37 44,965.96 488,420.40 601,638.82Capital Outlay:
Facilities Acquisition and Construction 7420 0.00
Other Capital Outlay 9300 113,600.97 113,600.97
Total Expenditures 6,987,060.80 2,405,851.37 1,507,220.69 0.00 306,000.10 349,590.44 1,824,667.25 13,380,390.65
Excess (Deficiency) of Revenues over Expenditures 0.00OTHER FINANCING SOURCES (USES)
and CHANGES IN FUND BALANCESAccountNumber
Loans 3720
Sale of Capital Assets 3730
Loss Recoveries 3740Transfers In:
From General Fund 3610
From Debt Service Funds 3620
From Capital Projects Funds 3630
Interfund 3650
From Permanent Funds 3660
From Internal Service Funds 3670
From Enterprise Funds 3690
Total Transfers In 3600 0.00Transfers Out: (Function 9700)
To the General Fund 910
To Debt Service Funds 920
To Capital Projects Funds 930
Interfund 950
To Permanent Funds 960
To Internal Service Funds 970
To Enterprise Funds 990
Total Transfers Out 9700 0.00
Total Other Financing Sources (Uses) 0.00
Net Change in Fund Balance 0.00
Fund Balance, July 1, 2017 2800
Adjustments to Fund Balance 2891Ending Fund Balance:
Nonspendable Fund Balance 2710
Restricted Fund Balance 2720
Committed Fund Balance 2730
Assigned Fund Balance 2740
Unassigned Fund Balance 2750
Total Fund Balances, June 30, 2018 2700 0.00
ESE 348
EXPENDITURES AccountNumber
Totals
2017-18 Final AFR, St. Johns County Schools September 2018 Page 111 of 132

DISTRICT SCHOOL BOARD OF ST. JOHNS COUNTY Exhibit K-4STATEMENT OF REVENUES, EXPENDITURES AND CHANGES IN FUND BALANCE - SPECIAL REVENUE FUNDS - MISCELLANEOUS FDOE Page 8For the Fiscal Year Ended June 30, 2018 Fund 490
REVENUES AccountNumber
Federal Through State and Local:
Federal Through Local 3280
Total Federal Through State and Local 3200 0.00Local:
Interest on Investments 3431
Gain on Sale of Investments 3432
Net Increase (Decrease) in Fair Value of Investments 3433
Gifts, Grants and Bequests 3440
Other Miscellaneous Local Sources 3495
Total Local 3400 0.00
Total Revenues 3000 0.00100 200 300 400 500 600 700
SalariesEmployeeBenefits
PurchasedServices
EnergyServices
Materialsand Supplies
CapitalOutlay Other
Current:
Instruction 5000 0.00
Student Support Services 6100 0.00
Instructional Media Services 6200 0.00
Instruction and Curriculum Development Services 6300 0.00
Instructional Staff Training Services 6400 0.00
Instruction-Related Technology 6500 0.00
Board 7100 0.00
General Administration 7200 0.00
School Administration 7300 0.00
Facilities Acquisition and Construction 7410 0.00
Fiscal Services 7500 0.00
Central Services 7700 0.00
Student Transportation Services 7800 0.00
Operation of Plant 7900 0.00
Maintenance of Plant 8100 0.00
Administrative Technology Services 8200 0.00
Community Services 9100 0.00Capital Outlay:
Facilities Acquisition and Construction 7420 0.00
Other Capital Outlay 9300 0.00
Total Expenditures 0.00 0.00 0.00 0.00 0.00 0.00 0.00 0.00
Excess (Deficiency) of Revenues over Expenditures 0.00OTHER FINANCING SOURCES (USES)
and CHANGES IN FUND BALANCESAccountNumber
Loss Recoveries 3740Transfers In:
From General Fund 3610
From Debt Service Funds 3620
From Capital Projects Funds 3630
Interfund 3650
From Permanent Funds 3660
From Internal Service Funds 3670
From Enterprise Funds 3690
Total Transfers In 3600 0.00Transfers Out: (Function 9700)
To General Fund 910
To Debt Service Funds 920
To Capital Projects Funds 930
Interfund 950
To Permanent Funds 960
To Internal Service Funds 970
To Enterprise Funds 990
Total Transfers Out 9700 0.00
Total Other Financing Sources (Uses) 0.00
Net Change in Fund Balance 0.00
Fund Balance, July 1, 2017 2800
Adjustments to Fund Balance 2891Ending Fund Balance:
Nonspendable Fund Balance 2710
Restricted Fund Balance 2720
Committed Fund Balance 2730
Assigned Fund Balance 2740
Unassigned Fund Balance 2750
Total Fund Balances, June 30, 2018 2700 0.00
ESE 348
Totals EXPENDITURES AccountNumber
2017-18 Final AFR, St. Johns County Schools September 2018 Page 112 of 132

DISTRICT SCHOOL BOARD OF ST. JOHNS COUNTY Exhibit K-5COMBINING STATEMENT OF REVENUES, EXPENDITURES AND CHANGES IN FUND BALANCES - DEBT SERVICE FUNDS FDOE Page 9For the Fiscal Year Ended June 30, 2018 Funds 200
SBE/COBIBonds
Special ActBonds
Sections 1011.14 and1011.15, F.S., Loans
Motor VehicleRevenue Bonds
DistrictBonds
Other DebtService
ARRA Economic Stimulus Debt Service
210 220 230 240 250 290 299Federal:
Miscellaneous Federal Direct 3199 737,048.00 737,048.00
Miscellaneous Federal Through State 3299 0.00State:
CO&DS Withheld for SBE/COBI Bonds 3322 963,774.67 963,774.67SBE/COBI Bond Interest 3326 5,775.89 5,775.89Sales Tax Distribution (s. 212.20(6)(d)6.a., F.S.) 3341 0.00Other Miscellaneous State Revenues 3399 0.00Total State Sources 3300 969,550.56 0.00 0.00 0.00 0.00 0.00 0.00 969,550.56
Local:District Debt Service Taxes 3412 0.00County Local Sales Tax 3418 0.00School District Local Sales Tax 3419 5,698,250.00 5,698,250.00Tax Redemptions 3421 0.00Payment in Lieu of Taxes 3422 0.00Excess Fees 3423 0.00Interest on Investments 3431 9,038.06 105,080.31 114,118.37Gain on Sale of Investments 3432 0.00Net Increase (Decrease) in Fair Value of Investments 3433 0.00Gifts, Grants and Bequests 3440 0.00Other Miscellaneous Local Sources 3495 0.00Impact Fees 3496 0.00Refunds of Prior Year's Expenditures 3497 0.00Total Local Sources 3400 0.00 0.00 0.00 0.00 0.00 5,707,288.06 105,080.31 5,812,368.37
Total Revenues 3000 969,550.56 0.00 0.00 0.00 0.00 5,707,288.06 842,128.31 7,518,966.93EXPENDITURES
Debt Service (Function 9200)Redemption of Principal 710 806,000.00 17,385,000.00 18,191,000.00Interest 720 160,267.19 5,286,231.50 790,400.00 6,236,898.69Dues and Fees 730 695.21 14,375.00 3,000.00 18,070.21Miscellaneous 790 0.00
Total Expenditures 966,962.40 0.00 0.00 0.00 0.00 22,685,606.50 793,400.00 24,445,968.90Excess (Deficiency) of Revenues Over Expenditures 2,588.16 0.00 0.00 0.00 0.00 (16,978,318.44) 48,728.31 (16,927,001.97)
OTHER FINANCING SOURCES (USES)and CHANGES IN FUND BALANCE
AccountNumber
SBE/COBIBonds210
Special ActBonds220
Sections 1011.14 and1011.15, F.S., Loans
230
Motor VehicleRevenue Bonds
240
DistrictBonds250
Other DebtService
290
ARRA Economic Stimulus Debt Service
299Totals
Issuance of Bonds 3710 0.00Premium on Sale of Bonds 3791 0.00
Discount on Sale of Bonds (Function 9299) 891 0.00Proceeds of Lease-Purchase Agreements 3750 0.00Premium on Lease-Purchase Agreements 3793 0.00
Discount on Lease-Purchase Agreements (Function 9299) 893 0.00Loans 3720 0.00Proceeds of Forward Supply Contract 3760 0.00Face Value of Refunding Bonds 3715 0.00Premium on Refunding Bonds 3792 0.00
Discount on Refunding Bonds (Function 9299) 892 0.00Payments to Refunded Bonds Escrow Agent (Function 9299) 761 (1,055,442.78) (1,055,442.78)
Refunding Lease-Purchase Agreements 3755 0.00Premium on Refunding Lease-Purchase Agreements 3794 0.00
Discount on Refunding Lease-Purchase Agmnts (Function 9299) 894 0.00Payments to Refunded Lease-Purchase Escrow Agent (Function 9299) 762 0.00
Transfers In:From General Fund 3610 0.00From Capital Projects Funds 3630 17,041,964.77 945,237.26 17,987,202.03From Special Revenue Funds 3640 0.00Interfund 3650 0.00From Permanent Funds 3660 0.00From Internal Service Funds 3670 0.00From Enterprise Funds 3690 0.00Total Transfers In 3600 0.00 0.00 0.00 0.00 0.00 17,041,964.77 945,237.26 17,987,202.03
Transfers Out: (Function 9700)To General Fund 910 0.00To Capital Projects Funds 930 0.00To Special Revenue Funds 940 0.00Interfund 950 0.00To Permanent Funds 960 0.00To Internal Service Funds 970 0.00To Enterprise Funds 990 0.00Total Transfers Out 9700 0.00 0.00 0.00 0.00 0.00 0.00 0.00 0.00
Total Other Financing Sources (Uses) (1,055,442.78) 0.00 0.00 0.00 0.00 17,041,964.77 945,237.26 16,931,759.25Net Change in Fund Balances (1,052,854.62) 0.00 0.00 0.00 0.00 63,646.33 993,965.57 4,757.28
Fund Balance, July 1, 2017 2800 1,127,341.74 4,722,439.24 5,699,350.03 11,549,131.01
Adjustments to Fund Balances 2891 0.00Ending Fund Balance:
Nonspendable Fund Balance 2710 0.00
Restricted Fund Balance 2720 74,487.12 4,786,085.57 6,693,315.60 11,553,888.29
Committed Fund Balance 2730 0.00
Assigned Fund Balance 2740 0.00
Unassigned Fund Balance 2750 0.00
Total Fund Balances, June 30, 2018 2700 74,487.12 0.00 0.00 0.00 0.00 4,786,085.57 6,693,315.60 11,553,888.29
ESE 348
AccountNumber Totals REVENUES
2017-18 Final AFR, St. Johns County Schools September 2018 Page 113 of 132

DISTRICT SCHOOL BOARD OF ST. JOHNS COUNTY Exhibit K-6COMBINING STATEMENT OF REVENUES, EXPENDITURES AND CHANGES IN FUND BALANCES - CAPITAL PROJECTS FUNDS FDOE Page 10For the Fiscal Year Ended June 30, 2018 Funds 300
Capital Outlay Bond Issues (COBI) Special Act Bonds
Sections 1011.14 and1011.15, F.S., Loans
Public EducationCapital Outlay (PECO)
DistrictBonds
Capital Outlay andDebt Service Program (CO&DS)
Nonvoted Capital Improvement Section 1011.71(2), F.S. Voted Capital Improvement Fund
Other CapitalProjects
ARRA Economic Stimulus Capital Projects
310 320 330 340 350 360 370 380 390 399Federal:
Miscellaneous Federal Direct 3199 0.00
Miscellaneous Federal Through State 3299 0.00State:
CO&DS Distributed 3321 560,652.70 560,652.70
Interest on Undistributed CO&DS 3325 18,906.08 18,906.08
Sales Tax Distribution (s. 212.20(6)(d)6.a., F.S.) 3341 0.00
State Through Local 3380 0.00
Public Education Capital Outlay (PECO) 3391 521,177.00 521,177.00
Classrooms First Program 3392 0.00
SMART Schools Small County Assistance Program 3395 0.00
Class Size Reduction Capital Outlay 3396 0.00
Charter School Capital Outlay Funding 3397 31,916.00 31,916.00
Other Miscellaneous State Revenues 3399 90,379.99 90,379.99
Total State Sources 3300 0.00 0.00 0.00 521,177.00 0.00 579,558.78 0.00 0.00 122,295.99 0.00 1,223,031.77Local:
District Local Capital Improvement Tax 3413 37,343,359.99 37,343,359.99
County Local Sales Tax 3418 0.00
School District Local Sales Tax 3419 13,995,203.50 13,995,203.50
Tax Redemptions 3421 71,224.67 71,224.67
Payment in Lieu of Taxes 3422 0.00
Excess Fees 3423 0.00
Interest on Investments 3431 66,972.75 12,526.41 362,048.93 1,122,811.27 1,564,359.36
Gain on Sale of Investments 3432 0.00
Net Increase (Decrease) in Fair Value of Investments 3433 0.00
Gifts, Grants and Bequests 3440 0.00
Other Miscellaneous Local Sources 3495 5,363.87 114,803.33 12,523,030.07 12,643,197.27
Impact Fees 3496 16,425,242.05 16,425,242.05
Refunds of Prior Year's Expenditures 3497 0.00
Total Local Sources 3400 0.00 0.00 66,972.75 5,363.87 0.00 12,526.41 37,891,436.92 0.00 44,066,286.89 0.00 82,042,586.84
Total Revenues 3000 0.00 0.00 66,972.75 526,540.87 0.00 592,085.19 37,891,436.92 0.00 44,188,582.88 0.00 83,265,618.61EXPENDITURES
Capital Outlay: (Function 7400)
Library Books 610 117,259.79 117,259.79
Audiovisual Materials 620 0.00
Buildings and Fixed Equipment 630 274,051.06 5,683,075.39 47,629,659.36 53,586,785.81
Furniture, Fixtures and Equipment 640 23,995.98 2,410,919.12 2,135,367.92 4,570,283.02
Motor Vehicles (Including Buses) 650 3,230,371.36 3,230,371.36
Land 660 7,946.90 7,946.90
Improvements Other Than Buildings 670 112,742.50 1,128,400.22 559,173.58 1,800,316.30
Remodeling and Renovations 680 740,913.77 8,067,336.62 2,814,042.50 11,622,292.89
Computer Software 690 77,836.90 77,836.90
Charter School Local Capital Improvement 793 78,378.00 78,378.00Debt Service: (Function 9200)
Redemption of Principal 710 0.00
Interest 720 0.00
Dues and Fees 730 32,985.23 1,270.79 34,256.02
Miscellaneous 790 0.00
Total Expenditures 0.00 0.00 331,032.27 853,656.27 0.00 1,270.79 20,606,427.61 0.00 53,333,340.05 0.00 75,125,726.99
Excess (Deficiency) of Revenues Over Expenditures 0.00 0.00 (264,059.52) (327,115.40) 0.00 590,814.40 17,285,009.31 0.00 (9,144,757.17) 0.00 8,139,891.62
ESE 348
TotalsREVENUES AccountNumber
2017-18 Final AFR, St. Johns County Schools September 2018 Page 114 of 132

DISTRICT SCHOOL BOARD OF ST. JOHNS COUNTY Exhibit K-6COMBINING STATEMENT OF REVENUES, EXPENDITURES AND CHANGES IN FUND BALANCES - CAPITAL PROJECTS FUNDS (Continued) FDOE Page 11For the Fiscal Year Ended June 30, 2018 Funds 300
Capital Outlay Bond Issues (COBI) Special Act Bonds
Sections 1011.14 and1011.15, F.S., Loans
Public EducationCapital Outlay (PECO)
DistrictBonds
Capital Outlay andDebt Service Program (CO&DS)
Nonvoted Capital Improvement Section 1011.71(2), F.S. Voted Capital Improvement Fund
Other CapitalProjects
ARRA Economic Stimulus Capital Projects
310 320 330 340 350 360 370 380 390 399
Issuance of Bonds 3710 0.00
Premium on Sale of Bonds 3791 0.00
Discount on Sale of Bonds (Function 9299) 891 0.00
Proceeds of Lease-Purchase Agreements 3750 0.00
Premium on Lease-Purchase Agreements 3793 0.00
Discount on Lease-Purchase Agreements (Function 9299) 893 0.00
Loans 3720 0.00
Sale of Capital Assets 3730 0.00
Loss Recoveries 3740 0.00
Proceeds of Forward Supply Contract 3760 0.00
Proceeds from Special Facility Construction Account 3770 0.00Transfers In:
From General Fund 3610 70,777.17 70,777.17
From Debt Service Funds 3620 0.00
From Special Revenue Funds 3640 0.00
Interfund 3650 0.00
From Permanent Funds 3660 0.00
From Internal Service Funds 3670 0.00
From Enterprise Funds 3690 0.00
Total Transfers In 3600 0.00 0.00 0.00 0.00 0.00 0.00 70,777.17 0.00 0.00 0.00 70,777.17Transfers Out: (Function 9700)
To General Fund 910 (6,170,490.00) (31,916.00) (6,202,406.00)
To Debt Service Funds 920 (11,225,285.00) (6,761,917.03) (17,987,202.03)
To Special Revenue Funds 940 0.00
Interfund 950 0.00
To Permanent Funds 960 0.00
To Internal Service Funds 970 0.00
To Enterprise Funds 990 0.00
Total Transfers Out 9700 0.00 0.00 0.00 0.00 0.00 0.00 (17,395,775.00) 0.00 (6,793,833.03) 0.00 (24,189,608.03)
Total Other Financing Sources (Uses) 0.00 0.00 0.00 0.00 0.00 0.00 (17,324,997.83) 0.00 (6,793,833.03) 0.00 (24,118,830.86)
Net Change in Fund Balances 0.00 0.00 (264,059.52) (327,115.40) 0.00 590,814.40 (39,988.52) 0.00 (15,938,590.20) 0.00 (15,978,939.24)
Fund Balance, July 1, 2017 2800 0.00 694,804.00 1,326,236.48 26,685,434.11 97,054,039.39 125,760,513.98
Adjustments to Fund Balances 2891 0.00Ending Fund Balance:
Nonspendable Fund Balance 2710 0.00
Restricted Fund Balance 2720 367,688.60 1,917,050.88 26,645,445.59 81,115,449.19 110,045,634.26
Committed Fund Balance 2730 0.00
Assigned Fund Balance 2740 0.00
Unassigned Fund Balance 2750 (264,059.52) (264,059.52)
Total Fund Balances, June 30, 2018 2700 0.00 0.00 (264,059.52) 367,688.60 0.00 1,917,050.88 26,645,445.59 0.00 81,115,449.19 0.00 109,781,574.74
ESE 348
AccountNumber TotalsOTHER FINANCING SOURCES (USES)
and CHANGES IN FUND BALANCE
2017-18 Final AFR, St. Johns County Schools September 2018 Page 115 of 132

DISTRICT SCHOOL BOARD OF ST. JOHNS COUNTY Exhibit K-7STATEMENT OF REVENUES, EXPENDITURES AND CHANGES IN FUND BALANCE - PERMANENT FUNDS FDOE Page 12For the Fiscal Year Ended June 30, 2018 Fund 000
REVENUES AccountNumber
Federal Direct 3100
Federal Through State and Local 3200
State Sources 3300
Local Sources 3400
Total Revenues 3000 0.00100 200 300 400 500 600 700
SalariesEmployeeBenefits
PurchasedServices
EnergyServices
Materialsand Supplies
CapitalOutlay Other
Current:
Instruction 5000 0.00
Student Support Services 6100 0.00
Instructional Media Services 6200 0.00
Instruction and Curriculum Development Services 6300 0.00
Instructional Staff Training Services 6400 0.00
Instruction-Related Technology 6500 0.00
Board 7100 0.00
General Administration 7200 0.00
School Administration 7300 0.00
Facilities Acquisition and Construction 7410 0.00
Fiscal Services 7500 0.00
Central Services 7700 0.00
Student Transportation Services 7800 0.00
Operation of Plant 7900 0.00
Maintenance of Plant 8100 0.00
Administrative Technology Services 8200 0.00
Community Services 9100 0.00Capital Outlay:
Facilities Acquisition and Construction 7420 0.00
Other Capital Outlay 9300 0.00Debt Service: (Function 9200)
Redemption of Principal 710 0.00
Interest 720 0.00
Total Expenditures 0.00 0.00 0.00 0.00 0.00 0.00 0.00 0.00
Excess (Deficiency) of Revenues Over Expenditures 0.00OTHER FINANCING SOURCES (USES)
and CHANGES IN FUND BALANCESAccountNumber
Sale of Capital Assets 3730
Loss Recoveries 3740Transfers In:
From General Fund 3610
From Debt Service Funds 3620
From Capital Projects Funds 3630
From Special Revenue Funds 3640
From Internal Service Funds 3670
From Enterprise Funds 3690
Total Transfers In 3600 0.00Transfers Out: (Function 9700)
To General Fund 910
To Debt Service Funds 920
To Capital Projects Funds 930
To Special Revenue Funds 940
To Internal Service Funds 970
To Enterprise Funds 990
Total Transfers Out 9700 0.00
Total Other Financing Sources (Uses) 0.00
Net Change in Fund Balance 0.00
Fund Balance, July 1, 2017 2800
Adjustments to Fund Balance 2891Ending Fund Balance:
Nonspendable Fund Balance 2710
Restricted Fund Balance 2720
Committed Fund Balance 2730
Assigned Fund Balance 2740
Unassigned Fund Balance 2750
Total Fund Balances, June 30, 2018 2700 0.00
ESE 348
EXPENDITURES AccountNumber
Totals
2017-18 Final AFR, St. Johns County Schools September 2018 Page 116 of 132

DISTRICT SCHOOL BOARD OF ST. JOHNS COUNTY Exhibit K-8COMBINING STATEMENT OF REVENUES, EXPENSES AND CHANGES IN FUND NET POSITION - ENTERPRISE FUNDS FDOE Page 13For the Fiscal Year Ended June 30, 2018 Funds 900
Self-Insurance - Consortium Self-Insurance - Consortium Self-Insurance - Consortium Self-Insurance - Consortium ARRA - Consortium Other Enterprise Programs Other Enterprise Programs
911 912 913 914 915 921 922OPERATING REVENUES
Charges for Services 3481 0.00Charges for Sales 3482 0.00Premium Revenue 3484 0.00Other Operating Revenues 3489 0.00Total Operating Revenues 0.00 0.00 0.00 0.00 0.00 0.00 0.00 0.00
OPERATING EXPENSES (Function 9900)Salaries 100 0.00Employee Benefits 200 0.00Purchased Services 300 0.00Energy Services 400 0.00Materials and Supplies 500 0.00Capital Outlay 600 0.00Other 700 0.00Depreciation and Amortization Expense 780 0.00Total Operating Expenses 0.00 0.00 0.00 0.00 0.00 0.00 0.00 0.00Operating Income (Loss) 0.00 0.00 0.00 0.00 0.00 0.00 0.00 0.00
NONOPERATING REVENUES (EXPENSES)Interest on Investments 3431 0.00Gain on Sale of Investments 3432 0.00Net Increase (Decrease) in Fair Value of Investments 3433 0.00Gifts, Grants and Bequests 3440 0.00Other Miscellaneous Local Sources 3495 0.00Loss Recoveries 3740 0.00Gain on Disposition of Assets 3780 0.00Interest (Function 9900) 720 0.00Miscellaneous (Function 9900) 790 0.00Loss on Disposition of Assets (Function 9900) 810 0.00Total Nonoperating Revenues (Expenses) 0.00 0.00 0.00 0.00 0.00 0.00 0.00 0.00
Net Income (Loss) Before Operating Transfers 0.00 0.00 0.00 0.00 0.00 0.00 0.00 0.00TRANSFERS and
CHANGES IN NET POSITIONTransfers In:
From General Fund 3610 0.00From Debt Service Funds 3620 0.00From Capital Projects Funds 3630 0.00From Special Revenue Funds 3640 0.00Interfund 3650 0.00From Permanent Funds 3660 0.00From Internal Service Funds 3670 0.00Total Transfers In 3600 0.00 0.00 0.00 0.00 0.00 0.00 0.00 0.00
Transfers Out: (Function 9700)To General Fund 910 0.00To Debt Service Funds 920 0.00To Capital Projects Funds 930 0.00To Special Revenue Funds 940 0.00Interfund 950 0.00To Permanent Funds 960 0.00To Internal Service Funds 970 0.00Total Transfers Out 9700 0.00 0.00 0.00 0.00 0.00 0.00 0.00 0.00
Change in Net Position 0.00 0.00 0.00 0.00 0.00 0.00 0.00 0.00Net Position, July 1, 2017 2880 0.00Adjustments to Net Position 2896 0.00
Net Position, June 30, 2018 2780 0.00
ESE 348
INCOME OR (LOSS) TotalsAccountNumber
2017-18 Final AFR, St. Johns County Schools September 2018 Page 117 of 132

DISTRICT SCHOOL BOARD OF ST. JOHNS COUNTY Exhibit K-9COMBINING STATEMENT OF REVENUES, EXPENSES AND CHANGES IN FUND NET POSITION - INTERNAL SERVICE FUNDS FDOE Page 14For the Fiscal Year Ended June 30, 2018 Funds 700
Self-Insurance Self-Insurance Self-Insurance Self-Insurance Self-InsuranceConsortiumPrograms
Other InternalService
711 712 713 714 715 731 791OPERATING REVENUES
Charges for Services 3481 0.00Charges for Sales 3482 0.00Premium Revenue 3484 48,279,102.32 2,952,764.92 838,013.75 1,445,051.13 53,514,932.12Other Operating Revenues 3489 2,131,933.49 2,131,933.49Total Operating Revenues 50,411,035.81 2,952,764.92 838,013.75 1,445,051.13 0.00 0.00 0.00 55,646,865.61
OPERATING EXPENSES (Function 9900)Salaries 100 85,095.00 194,871.79 279,966.79Employee Benefits 200 24,246.70 61,868.72 86,115.42Purchased Services 300 2,710,083.15 2,710,083.15Energy Services 400 12,198.18 12,198.18Materials and Supplies 500 1,328.12 1,328.12Capital Outlay 600 0.00Other 700 38,409,117.21 3,168,563.29 611,104.65 1,323,504.48 43,512,289.63Depreciation and Amortization Expense 780 20,453.88 20,453.88Total Operating Expenses 41,262,522.24 3,168,563.29 611,104.65 1,580,244.99 0.00 0.00 0.00 46,622,435.17Operating Income (Loss) 9,148,513.57 (215,798.37) 226,909.10 (135,193.86) 0.00 0.00 0.00 9,024,430.44
NONOPERATING REVENUES (EXPENSES)Interest on Investments 3431 257,969.75 13,438.94 15,004.18 41,970.13 328,383.00Gain on Sale of Investments 3432 0.00Net Increase (Decrease) in Fair Value of Investments 3433 0.00Gifts, Grants and Bequests 3440 0.00Other Miscellaneous Local Sources 3495 0.00Loss Recoveries 3740 0.00Gain on Disposition of Assets 3780 0.00Interest (Function 9900) 720 0.00Miscellaneous (Function 9900) 790 0.00Loss on Disposition of Assets (Function 9900) 810 0.00Total Nonoperating Revenues (Expenses) 257,969.75 13,438.94 15,004.18 41,970.13 0.00 0.00 0.00 328,383.00
Income (Loss) Before Operating Transfers 9,406,483.32 (202,359.43) 241,913.28 (93,223.73) 0.00 0.00 0.00 9,352,813.44TRANSFERS and
CHANGES IN NET POSITIONTransfers In:
From General Fund 3610 0.00From Debt Service Funds 3620 0.00From Capital Projects Funds 3630 0.00From Special Revenue Funds 3640 0.00Interfund 3650 0.00From Permanent Funds 3660 0.00From Enterprise Funds 3690 0.00Total Transfers In 3600 0.00 0.00 0.00 0.00 0.00 0.00 0.00 0.00
Transfers Out: (Function 9700)To General Fund 910 0.00To Debt Service Funds 920 0.00To Capital Projects Funds 930 0.00To Special Revenue Funds 940 0.00Interfund 950 0.00To Permanent Funds 960 0.00To Enterprise Funds 990 0.00Total Transfers Out 9700 0.00 0.00 0.00 0.00 0.00 0.00 0.00 0.00
Change in Net Position 9,406,483.32 (202,359.43) 241,913.28 (93,223.73) 0.00 0.00 0.00 9,352,813.44Net Position, July 1, 2017 2880 19,000,185.38 1,345,672.78 1,392,803.16 4,719,413.32 26,458,074.64Adjustments to Net Position 2896 0.00
Net Position, June 30, 2018 2780 28,406,668.70 1,143,313.35 1,634,716.44 4,626,189.59 35,810,888.08
ESE 348
TotalsINCOME OR (LOSS) AccountNumber
2017-18 Final AFR, St. Johns County Schools September 2018 Page 118 of 132
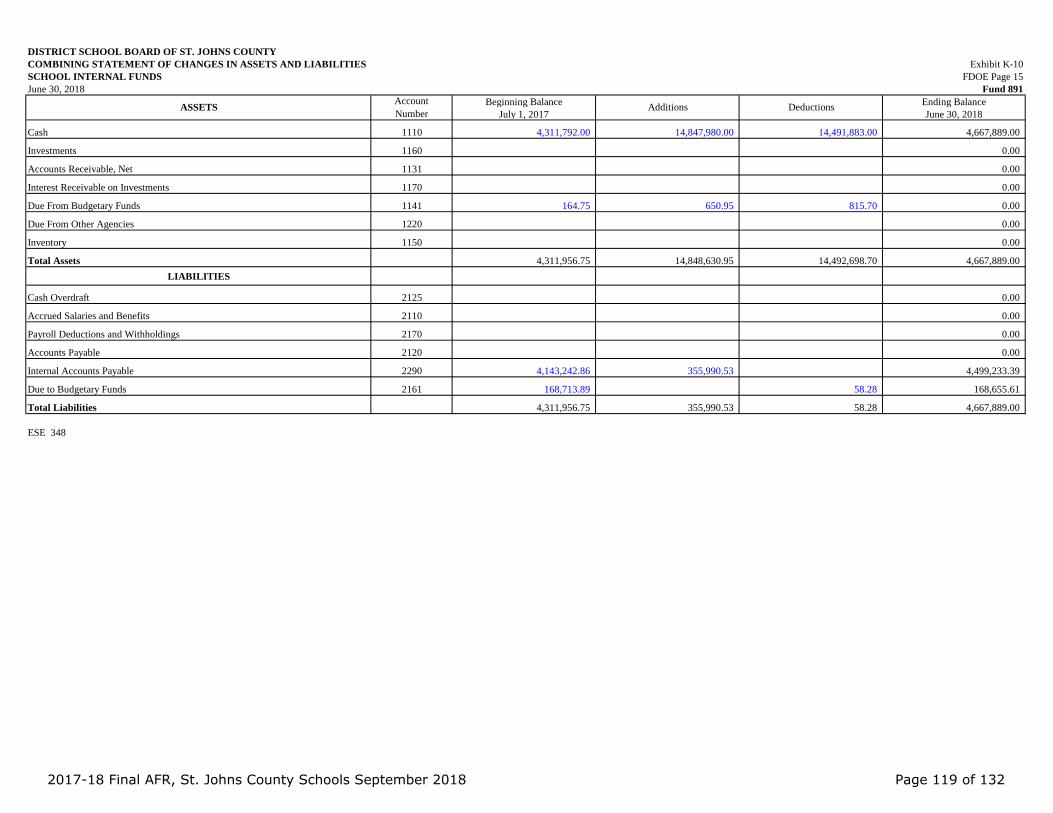
DISTRICT SCHOOL BOARD OF ST. JOHNS COUNTYCOMBINING STATEMENT OF CHANGES IN ASSETS AND LIABILITIES Exhibit K-10SCHOOL INTERNAL FUNDS FDOE Page 15June 30, 2018 Fund 891
Beginning Balance Ending BalanceJuly 1, 2017 June 30, 2018
Cash 1110 4,311,792.00 14,847,980.00 14,491,883.00 4,667,889.00
Investments 1160 0.00
Accounts Receivable, Net 1131 0.00
Interest Receivable on Investments 1170 0.00
Due From Budgetary Funds 1141 164.75 650.95 815.70 0.00
Due From Other Agencies 1220 0.00
Inventory 1150 0.00
Total Assets 4,311,956.75 14,848,630.95 14,492,698.70 4,667,889.00LIABILITIES
Cash Overdraft 2125 0.00
Accrued Salaries and Benefits 2110 0.00
Payroll Deductions and Withholdings 2170 0.00
Accounts Payable 2120 0.00
Internal Accounts Payable 2290 4,143,242.86 355,990.53 4,499,233.39
Due to Budgetary Funds 2161 168,713.89 58.28 168,655.61
Total Liabilities 4,311,956.75 355,990.53 58.28 4,667,889.00
ESE 348
AdditionsASSETS AccountNumber
Deductions
2017-18 Final AFR, St. Johns County Schools September 2018 Page 119 of 132
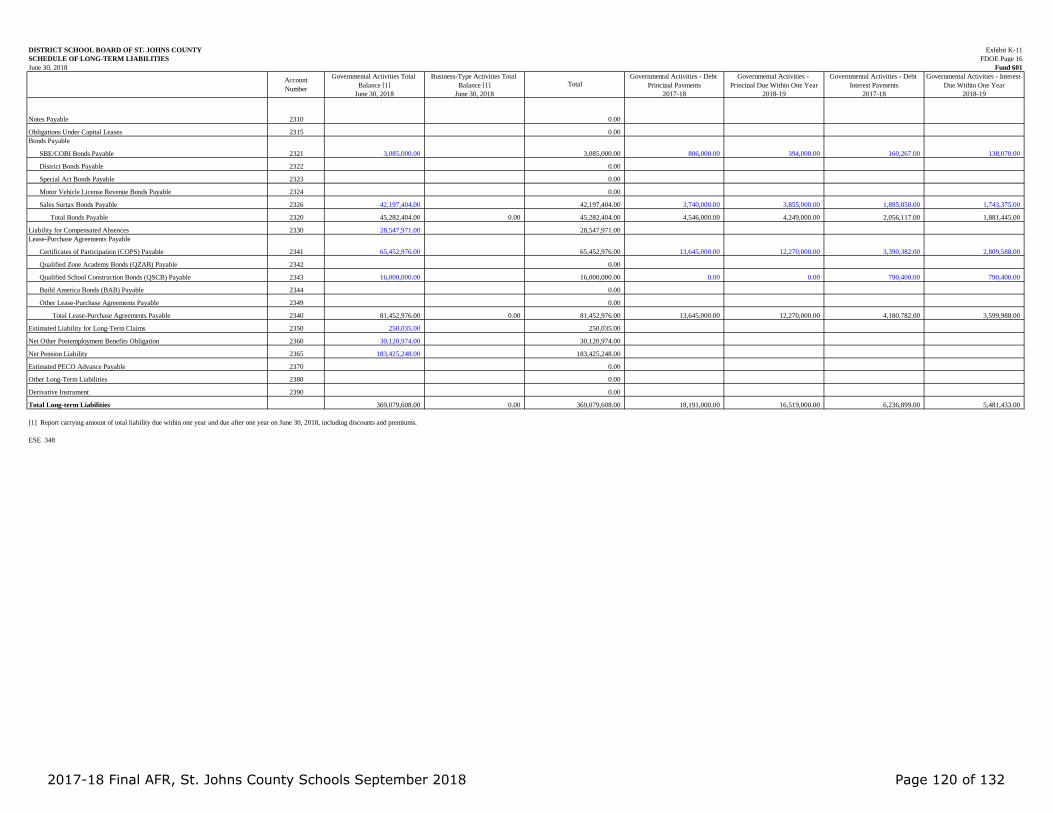
DISTRICT SCHOOL BOARD OF ST. JOHNS COUNTY Exhibit K-11SCHEDULE OF LONG-TERM LIABILITIES FDOE Page 16June 30, 2018 Fund 601
Governmental Activities Total Balance [1]
Business-Type Activities Total Balance [1]
Governmental Activities - Debt Principal Payments
Governmental Activities - Principal Due Within One Year
Governmental Activities - Debt Interest Payments
Governmental Activities - Interest Due Within One Year
June 30, 2018 June 30, 2018 2017-18 2018-19 2017-18 2018-19
Notes Payable 2310 0.00
Obligations Under Capital Leases 2315 0.00Bonds Payable
SBE/COBI Bonds Payable 2321 3,085,000.00 3,085,000.00 806,000.00 394,000.00 160,267.00 138,070.00
District Bonds Payable 2322 0.00
Special Act Bonds Payable 2323 0.00
Motor Vehicle License Revenue Bonds Payable 2324 0.00
Sales Surtax Bonds Payable 2326 42,197,404.00 42,197,404.00 3,740,000.00 3,855,000.00 1,895,850.00 1,743,375.00
Total Bonds Payable 2320 45,282,404.00 0.00 45,282,404.00 4,546,000.00 4,249,000.00 2,056,117.00 1,881,445.00
Liability for Compensated Absences 2330 28,547,971.00 28,547,971.00Lease-Purchase Agreements Payable
Certificates of Participation (COPS) Payable 2341 65,452,976.00 65,452,976.00 13,645,000.00 12,270,000.00 3,390,382.00 2,809,588.00
Qualified Zone Academy Bonds (QZAB) Payable 2342 0.00
Qualified School Construction Bonds (QSCB) Payable 2343 16,000,000.00 16,000,000.00 0.00 0.00 790,400.00 790,400.00
Build America Bonds (BAB) Payable 2344 0.00
Other Lease-Purchase Agreements Payable 2349 0.00
Total Lease-Purchase Agreements Payable 2340 81,452,976.00 0.00 81,452,976.00 13,645,000.00 12,270,000.00 4,180,782.00 3,599,988.00
Estimated Liability for Long-Term Claims 2350 250,035.00 250,035.00
Net Other Postemployment Benefits Obligation 2360 30,120,974.00 30,120,974.00
Net Pension Liability 2365 183,425,248.00 183,425,248.00
Estimated PECO Advance Payable 2370 0.00
Other Long-Term Liabilities 2380 0.00
Derivative Instrument 2390 0.00
Total Long-term Liabilities 369,079,608.00 0.00 369,079,608.00 18,191,000.00 16,519,000.00 6,236,899.00 5,481,433.00
[1] Report carrying amount of total liability due within one year and due after one year on June 30, 2018, including discounts and premiums.
ESE 348
AccountNumber
Total
2017-18 Final AFR, St. Johns County Schools September 2018 Page 120 of 132

DISTRICT SCHOOL BOARD OF ST. JOHNS COUNTY
SCHEDULE OF CATEGORICAL PROGRAMS
REPORT OF EXPENDITURES AND AVAILABLE FUNDS Exhibit K-12
For the Fiscal Year Ended June 30, 2018 FDOE Page 17
CATEGORICAL PROGRAMS Unexpended Returned Revenues [1] Expenditures Flexibility [2] Unexpended
(Revenue Number) [Footnote] June 30, 2017 To FDOE 2017-18 2017-18 2017-18 June 30, 2018
Class Size Reduction Operating Funds (3355) 94740 42,060,125.00 42,060,125.00 0.00
Excellent Teaching Program (3363) 90570 0.00
Florida Digital Classrooms (FEFP Earmark) 98250 19,525.00 1,117,903.00 1,114,418.65 23,009.35
Florida School Recognition Funds (3361) 92040 413,438.21 2,990,608.00 2,904,459.22 499,586.99
Instructional Materials (FEFP Earmark) [3] 90880 3,302,721.00 3,302,721.00 0.00
Library Media (FEFP Earmark) [3] 90881 186,601.00 186,601.00 0.00
Preschool Projects (3372) 97950 0.00
Research-Based Reading Instruction (FEFP Earmark) [4] 90800 1,812,403.00 1,812,403.00 0.00
Safe Schools (FEFP Earmark) [5] 90803 588,431.00 588,431.00 0.00
Salary Bonus Outstanding Teachers in D and F Schools 94030 0.00
Student Transportation (FEFP Earmark) 90830 9,550,553.00 9,550,553.00 0.00
Supplemental Academic Instruction (FEFP Earmark) [4] 91280 7,691,931.00 7,691,931.00 0.00
Teachers Classroom Supply Assistance (FEFP Earmark) 97580 639,159.00 638,352.00 807.00
Voluntary Prekindergarten - School Year Program (3371) 96440 167,839.24 930,835.70 890,689.38 207,985.56
Voluntary Prekindergarten - Summer Program (3371) 96441 147,434.72 147,434.72 0.00
[1] Include both state and local revenue sources.
[2] Report the amount of funds transferred from each program to maintain board-specified academic classroom instruction.
[3] Report the Library Media portion of the Instructional Materials allocation on the line "Library Media."
[4] Expenditures for designated low-performing elementary schools should be included in expenditures.
[5] Combine all programs funded from the Safe Schools allocation on one line, "Safe Schools."
ESE 348
Grant
Number
2017-18 Final AFR, St. Johns County Schools September 2018 Page 121 of 132
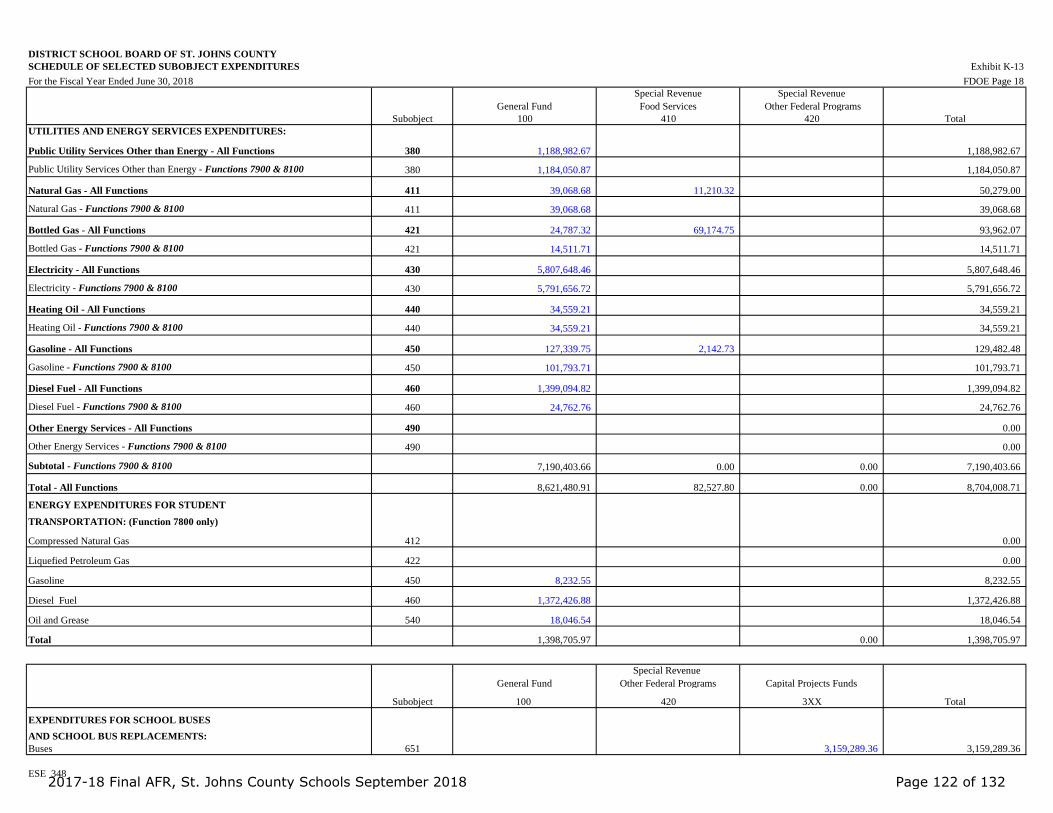
DISTRICT SCHOOL BOARD OF ST. JOHNS COUNTY
SCHEDULE OF SELECTED SUBOBJECT EXPENDITURES Exhibit K-13
For the Fiscal Year Ended June 30, 2018 FDOE Page 18
General Fund
Special Revenue
Food Services
Special Revenue
Other Federal Programs
100 410 420 Total
UTILITIES AND ENERGY SERVICES EXPENDITURES:
Public Utility Services Other than Energy - All Functions 380 1,188,982.67 1,188,982.67
Public Utility Services Other than Energy - Functions 7900 & 8100 380 1,184,050.87 1,184,050.87
Natural Gas - All Functions 411 39,068.68 11,210.32 50,279.00
Natural Gas - Functions 7900 & 8100 411 39,068.68 39,068.68
Bottled Gas - All Functions 421 24,787.32 69,174.75 93,962.07
Bottled Gas - Functions 7900 & 8100 421 14,511.71 14,511.71
Electricity - All Functions 430 5,807,648.46 5,807,648.46
Electricity - Functions 7900 & 8100 430 5,791,656.72 5,791,656.72
Heating Oil - All Functions 440 34,559.21 34,559.21
Heating Oil - Functions 7900 & 8100 440 34,559.21 34,559.21
Gasoline - All Functions 450 127,339.75 2,142.73 129,482.48
Gasoline - Functions 7900 & 8100 450 101,793.71 101,793.71
Diesel Fuel - All Functions 460 1,399,094.82 1,399,094.82
Diesel Fuel - Functions 7900 & 8100 460 24,762.76 24,762.76
Other Energy Services - All Functions 490 0.00
Other Energy Services - Functions 7900 & 8100 490 0.00
Subtotal - Functions 7900 & 8100 7,190,403.66 0.00 0.00 7,190,403.66
Total - All Functions 8,621,480.91 82,527.80 0.00 8,704,008.71
ENERGY EXPENDITURES FOR STUDENT
TRANSPORTATION: (Function 7800 only)
Compressed Natural Gas 412 0.00
Liquefied Petroleum Gas 422 0.00
Gasoline 450 8,232.55 8,232.55
Diesel Fuel 460 1,372,426.88 1,372,426.88
Oil and Grease 540 18,046.54 18,046.54
Total 1,398,705.97 0.00 1,398,705.97
General Fund
Special Revenue
Other Federal Programs Capital Projects Funds
100 420 3XX Total
EXPENDITURES FOR SCHOOL BUSES
AND SCHOOL BUS REPLACEMENTS:
Buses 651 3,159,289.36 3,159,289.36
ESE 348
Subobject
Subobject
2017-18 Final AFR, St. Johns County Schools September 2018 Page 122 of 132

DISTRICT SCHOOL BOARD OF ST. JOHNS COUNTY
SCHEDULE OF SELECTED SUBOBJECT EXPENDITURES Exhibit K-13
FDOE Page 19
Noncapitalized Expenditures:
Technology-Related Professional and Technical Services 319 0.00
Technology-Related Repairs and Maintenance 359 24,170.40 1,730.00 25,900.40
Technology-Related Rentals 369 3,241,780.09 214,939.98 3,456,720.07
Telephone and Other Data Communication Services 379 0.00
Other Technology-Related Purchased Services 399 125,836.96 125,836.96
Technology-Related Materials and Supplies 5X9 45,394.62 262.76 45,657.38
Noncapitalized Computer Hardware 644 1,184,879.93 166,282.22 1,351,162.15
Technology-Related Noncapitalized Fixtures and Equipment 649 36,474.27 804.40 37,278.67
Noncapitalized Software 692 52,980.69 1,203.00 54,183.69
Miscellaneous Technology-Related 799 0.00
Total 4,711,516.96 385,222.36 0.00 5,096,739.32
Capitalized Expenditures:
Capitalized Computer Hardware and Technology-Related
Infrastructure 643 137,658.51 9,215.04 1,097,217.79 1,244,091.34
Technology-Related Capitalized Fixtures and Equipment 648 12,500.00 10,000.00 6,250.00 28,750.00
Capitalized Software 691 0.00
Total 150,158.51 19,215.04 1,103,467.79 1,272,841.34
ESE 348
* Include (1) technology-related hardware: network equipment, servers, PCs, printers, and other peripherals and devices that exceed the district's capitalization threshold; and (2) technology software: purchased software used for educational or
administrative purposes that exceed the district's capitalization threshold.
Subobject Total
SubobjectGeneral Fund
100
TECHNOLOGY-RELATED SUPPLIES AND
PURCHASED SERVICES
TECHNOLOGY-RELATED EQUIPMENT, COMPUTER HARDWARE
AND SOFTWARE*
Special Revenue Funds
4XX
Capital Projects Funds
3XXTotal
Special Revenue Funds
4XX
General Fund
100
Capital Projects Funds
3XX
2017-18 Final AFR, St. Johns County Schools September 2018 Page 123 of 132

DISTRICT SCHOOL BOARD OF ST. JOHNS COUNTYSCHEDULE OF SELECTED SUBOBJECT EXPENDITURES Exhibit K-13For the Fiscal Year Ended June 30, 2018 FDOE Page 20
General FundSpecial Revenue
Food ServicesSpecial Revenue
Other Federal Programs100 410 420 Total
SUBAWARDS FOR INDIRECT COST RATE:
Professional and Technical Services:
Subawards Under Subagreements - First $25,000 311 0.00
Subawards Under Subagreements - In Excess of $25,000 312 0.00
Other Purchased Services:
Subawards Under Subagreements - First $25,000 391 0.00
Subawards Under Subagreements - In Excess of $25,000 392 0.00
Special RevenueFood Services
410
FOOD SERVICE SUPPLIES SUBOBJECT
Supplies 510 374,632.30
Food 570 3,895,322.51
Donated Foods 580 510,484.31
General FundSpecial Revenue
Other Federal Programs
100 420 Total
Teacher Salaries
Basic Programs 101, 102 and 103 (Function 5100) 120 79,555,717.00 600,029.77 80,155,746.77
Basic Programs 101, 102 and 103 (Function 5100) 140 0.00
Basic Programs 101, 102 and 103 (Function 5100) 750 1,794,754.56 98,940.45 1,893,695.01
Total Basic Program Salaries 81,350,471.56 698,970.22 82,049,441.78
Other Programs 130 (ESOL) (Function 5100) 120 583,263.00 21,131.00 604,394.00
Other Programs 130 (ESOL) (Function 5100) 140 0.00
Other Programs 130 (ESOL) (Function 5100) 750 13,064.64 3,503.08 16,567.72
Total Other Program Salaries 596,327.64 24,634.08 620,961.72
ESE Programs 111, 112, 113, 254 and 255 (Function 5200) 120 37,657,812.00 1,685,076.00 39,342,888.00
ESE Programs 111, 112, 113, 254 and 255 (Function 5200) 140 0.00
ESE Programs 111, 112, 113, 254 and 255 (Function 5200) 750 849,473.61 277,853.49 1,127,327.10
Total ESE Program Salaries 38,507,285.61 1,962,929.49 40,470,215.10
Career Program 300 (Function 5300) 120 2,854,396.00 284,313.00 3,138,709.00
Career Program 300 (Function 5300) 140 0.00
Career Program 300 (Function 5300) 750 64,506.65 46,907.00 111,413.65
Total Career Program Salaries 2,918,902.65 331,220.00 3,250,122.65
TOTAL 123,372,987.46 3,017,753.79 126,390,741.25
General Fund Special Revenue
Other Federal ProgramsTextbooks (used for classroom instruction) 100 420 Total
Textbooks (Function 5000) 520 2,256,871.73 2,256,871.73
ESE 348
Subobject
Subobject
Subobject
Subobject
2017-18 Final AFR, St. Johns County Schools September 2018 Page 124 of 132

DISTRICT SCHOOL BOARD OF ST. JOHNS COUNTY
SPECIFIC ACADEMIC CLASSROOM INSTRUCTION AND OTHER DATA COLLECTION Exhibit K-13
For the Fiscal Year Ended June 30, 2018 FDOE Page 21
CATEGORICAL FLEXIBLE SPENDING -
GENERAL FUND EXPENDITURES
Account
Number
Safe
Schools
Student
Transportation
Supplemental
Academic
Instruction
Research-Based Reading
Instruction
Instructional
Materials
Instructional
Materials /
Library Media
Totals
Instruction:
Basic 5100 0.00
Exceptional 5200 0.00
Career Education 5300 0.00
Adult General 5400 0.00
Prekindergarten 5500 0.00
Other Instruction 5900 0.00
Total Flexible Spending Instructional Expenditures 5000 0.00 0.00 0.00 0.00 0.00 0.00 0.00
DISTRIBUTIONS TO CHARTER SCHOOLS
(Charter school information is used in federal reporting)
Fund
Number
Direct Payment
(Subobjects 393 and 793)
Amount Withheld for
Administration
Payments and Services on Behalf
of Charter SchoolsTotal Amount
Expenditures:
General Fund 100 1,881,330.00 54,792.90 1,936,122.90
Special Revenue Funds - Food Service 410 0.00
Special Revenue Funds - Other Federal Programs 420 0.00
Capital Projects Funds 3XX 78,378.00 78,378.00
Total Charter School Distributions 1,959,708.00 54,792.90 0.00 2,014,500.90
LIFELONG LEARNING
(Lifelong Learning expenditures are used in federal reporting) Account NumberAmount
Expenditures:
General Fund 5900 16,165.69
Special Revenue Funds - Other Federal Programs 5900
Total 5900 16,165.69
MEDICAID EXPENDITURE REPORT Unexpended Earnings Expenditures Unexpended
(Medicaid expenditures are used in federal reporting) June 30, 2017 2017-18 2017-18 June 30, 2018
Earnings, Expenditures and Carryforward Amounts: 438,488.50 438,488.50
Expenditure Program or Activity:
438,488.50
School Nurses and Health Care Services
438,488.50
General Fund Balance Sheet Information
(This information is used in state reporting)
Fund
NumberAmount
Balance Sheet Amount, June 30, 2018
Total Assets and Deferred Outflows of Resources 100 61,334,838.50
Total Liabilities and Deferred Inflows of Resources 100 6,403,492.28
ESE 348
Gifted Student Education
Total Expenditures
Medicaid Administration and Billing Services
Student Services
Consultants
Other
Staff Training and Curriculum Development
ESE Professional and Technical Services
Exceptional Student Education
Occupational Therapy, Physical Therapy and Other Therapy Services
2017-18 Final AFR, St. Johns County Schools September 2018 Page 125 of 132

DISTRICT SCHOOL BOARD OF ST. JOHNS COUNTY Exhibit K-14
VOLUNTARY PREKINDERGARTEN (VPK) PROGRAM FDOE Page 22
For the Fiscal Year Ended June 30, 2018 Supplemental Schedule - Fund 100
100 200 300 400 500 600 700
Salaries
Employee
Benefits
Purchased
Services
Energy
Services
Materials
and Supplies
Capital
Outlay Other Totals
Current:
Prekindergarten 5500 594,050.17 236,266.20 10,100.00 723.77 7,375.00 19,851.77 868,366.91
Student Support Services 6100 55,851.32 26,008.10 81,859.42
Instructional Media Services 6200 0.00
Instruction and Curriculum Development Services 6300 67,231.93 20,008.44 657.40 87,897.77
Instructional Staff Training Services 6400 0.00
Instruction-Related Technology 6500 0.00
Board 7100 0.00
General Administration 7200 0.00
School Administration 7300 0.00
Facilities Acquisition and Construction 7410 0.00
Fiscal Services 7500 0.00
Food Services 7600 0.00
Central Services 7700 0.00
Student Transportation Services 7800 0.00
Operation of Plant 7900 0.00
Maintenance of Plant 8100 0.00
Administrative Technology Services 8200 0.00
Community Services 9100 0.00
Capital Outlay:
Facilities Acquisition and Construction 7420 0.00
Other Capital Outlay 9300 0.00
Debt Service: (Function 9200)
Redemption of Principal 710 0.00
Interest 720 0.00
Total Expenditures 717,133.42 282,282.74 10,757.40 0.00 723.77 7,375.00 19,851.77 1,038,124.10
[1] Include expenditures for the summer program (section 1002.61, F.S.) and the school-year program (section 1002.63, F.S.).
ESE 348
Account NumberVOLUNTARY PREKINDERGARTEN PROGRAM [1]
GENERAL FUND EXPENDITURES
2017-18 Final AFR, St. Johns County Schools September 2018 Page 126 of 132

2017-18 Final AFR, St. Johns County Schools September 2018 Page 127 of 132
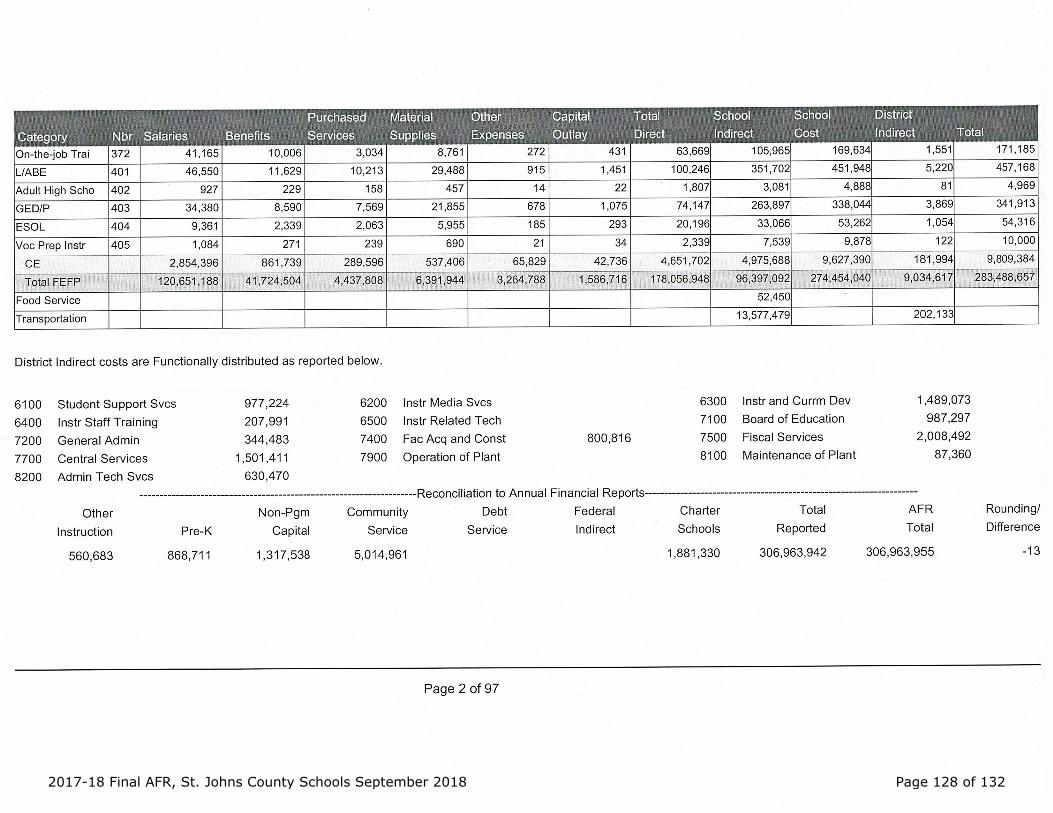
2017-18 Final AFR, St. Johns County Schools September 2018 Page 128 of 132

2017-18 Final AFR, St. Johns County Schools September 2018 Page 129 of 132

2017-18 Final AFR, St. Johns County Schools September 2018 Page 130 of 132

Exhibit K-17Page 25
DISTRICT SCHOOL BOARD OF ST JOHNS COUNTY
Federal CFDA
NumberPass - Through Entity
Identifying NumberTotal
ExpendituresClustered
Child Nutrition Cluster United States Department of Agriculture:
Florida Department of Agriculture and Consumer Services: School Breakfast Program 10.553 17002 869,985$ National School Lunch Program 10.555 17001, 17003 5,014,528 Summer Food Service Program for Children 10.559 17006, 17007 86,803
Total Child Nutrition Cluster 5,971,316
WIOA Cluster United States Department of Labor:
First Coast Workforce Development, Inc.: WIOA Youth Activities 17.259 FCWD 2017-01(O) 606,671
Student Financial Assistance Cluster United States Department of Education: Federal Pell Grant Program 84.063 N/A 531,569
Special Education Cluster United States Department of Education: Special Education - Grants to States: Florida Department of Education 84.027 263 6,337,471 Special Education - Preschool Grants: Florida Department of Education 84.173 267 126,018
Total Special Education Cluster 6,463,489
Not Clustered
United States Department of Defense: Army Junior Reserve Officers Training Corps 12.UNK N/A 68,439 Air Force Junior Reserve Officers Training Corps 12.UNK N/A 72,643 Navy Junior Reserve Officers Training Corps 12.UNK N/A 143,417
Total United States Department of Defense 284,499
United States Department of Education: Florida Department of Education: Adult Education - Basic Grants to States 84.002 191,192,193 277,076 Title I Grants to Local Educational Agencies 84.010 212, 223 3,289,210 Career and Technical Education - Basic Grants to States 84.048 161 367,970 Education for Homeless Children and Youth 84.196 127 63,368 English Language Acquisition State Grants 84.365 102 73,393 Improving Teacher Quality State Grants 84.367 224 556,931 Student Support and Acadmeic Enrichment 84.424 241 65,903
Total United States Department of Education 4,693,851
United States Department of Health and Human Services: Head Start 93.600 N/A 1,031,069
Corporation for National and Community Service: Retired and Senior Volunteer Program 94.002 N/A 53,742
United States Department of Homeland Security: Florida Department of Community Affairs: Federal Emergency Management Agency 97.036 N/A 319,294
Total Expenditures of Federal Awards 19,955,500$
SCHEDULE 5SUPPLEMENTARY SCHEDULE OF
FEDERAL FINANCIAL ASSISTANCE PROGRAM EXPENDITURESFor the Fiscal Year Ended June 30, 2018
Federal Grantor/Pass-Through Grantor/Program or Cluster
The accompanying notes are an integral part of this schedule.
2017-18 Final AFR, St. Johns County Schools September 2018 Page 131 of 132

ST. JOHNS COUNTY SCHOOL DISTRICT Notes to Schedule 5
Supplementary Schedule of Federal Financial Assistance Program Expenditures
For the Fiscal Year Ended June 30, 2018
Notes: (1) Basis of Presentation The accompanying Schedule of Expenditures of Federal Awards
(Schedule) includes the Federal award activity of the St. Johns County School Board under programs of the Federal government for the fiscal year ended June 30, 2017. The information in this Schedule is presented in accordance with the requirements of the Title 2 U.S. Code of Federal Regulations Part 200, Uniform Administrative Requirements, Cost Principles, and Audit Requirements for Federal Awards (Uniform Guidance). Because the Schedule presents only a selected portion of the operations of the District, it is not intended to and does not present the financial position, changes in net position, or cash flows of the District.
(2) Summary of Significant Accounting Policies Expenditures reported on the Schedule are
reported on the modified accrual basis of accounting. Such expenditures are recognized following the cost principles contained in the Uniform Guidance, wherein certain types of expenditures are not allowable or are limited as to reimbursement.
(3) Indirect Cost Rate The District has not elected to use the 10 percent de minimis cost rate
allowed under the Uniform Guidance. (4) Noncash Assistance: National School Lunch Program – Includes $587,691 of donated
food received during the fiscal year. Donated foods are valued at fair value as determined at the time of donation.
(5) Head Start Expenditures include $1,031,069 for grant number/program year 04CH4653-
04-00.
2017-18 Final AFR, St. Johns County Schools September 2018 Page 132 of 132