Embed Size (px)
Citation preview

Skylon Growth & Income Trust
Annual Financial Statements - December 31, 2017

Table of Contents
Management’s Responsibility for Financial Reporting ................................................................................... 1
Independent Auditor’s Report ......................................................................................................................... 2
SKYLON GROWTH & INCOME TRUSTFinancial Statements
Statements of Financial Position ..................................................................................................................... 3
Statements of Comprehensive Income ............................................................................................................ 4
Statements of Changes in Net Assets Attributable to Holders of Redeemable Units .................................. 5
Statements of Cash Flows ............................................................................................................................... 6
Schedule of Investment Portfolio ..................................................................................................................... 7
Trust Specific Notes to Financial Statements ................................................................................................. 22
Notes to the Financial Statements .................................................................................................................. 32
Legal Notice ..................................................................................................................................................... 41
Trust Information .............................................................................................................................................. 42
Annual Financial Statements - December 31, 2017

Annual Financial Statements - December 31, 2017 – 1 –
MANAGEMENT’S RESPONSIBILITY FOR FINANCIAL REPORTING
The accompanying financial statements have been prepared by CI Investments Inc., the Manager of the Skylon Growth & Income Trust (the “Trust”), and approved by the Board of Governors of the Manager. The Trust’s Manager is responsible for the information and representations contained in these financial statements and other sections of this report. CI Investments Inc. maintains appropriate processes to ensure that relevant and reliable financial information is produced. The financial statements have been prepared in accordance with International Financial Reporting Standards and include certain amounts that are based on estimates and judgments. The significant accounting policies which management believes are appropriate for the Trust are described in Note 2 to the financial statements.
PricewaterhouseCoopers LLP is the external auditor of the Trust. They have audited the financial statements in accordance with Canadian generally accepted auditing standards to enable them to express to the unitholders their opinion on the financial statements. Their report is set out on the following page.
Sheila A. Murray Douglas J. JamiesonToronto, Ontario President Chief Financial OfficerMarch 29, 2018 CI Investments Inc. CI Investments Inc.

Annual Financial Statements - December 31, 2017 – 2 –
INDEPENDENT AUDITOR’S REPORT
To the Unitholders and Trustee of:Skylon Growth & Income Trust(the “Trust”)
We have audited the accompanying December 31, 2017 financial statements of the Trust, which comprise the statements of financial position as at December 31, 2017 and 2016 and the statements of comprehensive income, changes in net assets attributable to holders of redeemable units and cash flows for the years then ended and the related notes, which comprise a summary of significant accounting policies and other explanatory information.
Management’s responsibility for the financial statementsManagement is responsible for the preparation and fair presentation of the financial statements in accordance with International Financial Reporting Standards, and for such internal control as management determines is necessary to enable the preparation of financial statements that are free from material misstatement, whether due to fraud or error.
Auditor’s responsibilityOur responsibility is to express an opinion on the financial statements based on our audits. We conducted our audits in accordance with Canadian generally accepted auditing standards. Those standards require that we comply with ethical requirements and plan and perform the audits to obtain reasonable assurance about whether the financial statements are free from material misstatement.
An audit involves performing procedures to obtain audit evidence about the amounts and disclosures in the financial statements. The procedures selected depend on the auditor’s judgment, including the assessment of the risks of material misstatement of the financial statements, whether due to fraud or error. In making those risk assessments, the auditor considers internal control relevant to the entity’s preparation and fair presentation of the financial statements in order to design audit procedures that are appropriate in the circumstances, but not for the purpose of expressing an opinion on the effectiveness of the entity’s internal control. An audit also includes evaluating the appropriateness of accounting policies used and the reasonableness of accounting estimates made by management, as well as evaluating the overall presentation of the financial statements.
We believe that the audit evidence we have obtained in our audits is sufficient and appropriate to provide a basis for our audit opinion.
OpinionIn our opinion, the financial statements of the Trust present fairly, in all material respects, the financial position of the Trust as at December 31, 2017 and 2016 and its financial performance and its cash flows for the years then ended in accordance with International Financial Reporting Standards.
Chartered Professional Accountants, Licensed Public AccountantsToronto, OntarioMarch 29, 2018

– 3 –
Skylon Growth & Income Trust
Annual Financial Statements - December 31, 2017
The accompanying notes are an integral part of these financial statements.
Statements of Financial Position as at December 31 (in $000’s except for per unit amounts and units outstanding)
Assets Current assets Investments* Cash Unrealized gain on futures and foreign currency forward contracts Swaps, swaptions and options Cash collateral received for securities on loan (Note 7) Margin for short salesDividends receivableReceivable for distribution from investmentsInterest receivableSecurities lending revenue receivable (Note 7) Receivable for investments sold Receivable for unit subscriptions
Liabilities Current liabilities Investments sold short** Bank overdraft Unrealized loss on futures and foreign currency forward contractsSwaps, swaptions and optionsDividends payable on investments sold shortInterest payable on investments sold shortPayable for cash collateral under securities lending (Note 7) Payable for investments purchased Payable for unit redemptions Distributions payable to holders of redeemable units Management fees payable Administration fees payable Service fees payable
Net assets attributable to holders of redeemable units
*Investments at cost**Investments sold short at cost
Net assets attributable to holders of redeemable units per unit: Class A
Number of redeemable units outstanding:Class A
2017 2016
40,178 42,509 1,962 3,595 91 50 - - - - - - 46 39 - - 98 161 - - 8 193 - - 42,383 46,547
- - - - 8 106 - 13 - - - - - - 109 315 3,280 4,606 725 325 - - - - 46 49 4,168 5,414 38,215 41,133
35,333 37,639 - -
8.24 8.21
4,635,727 5,009,863
CIG - SKG-6968
Financial Statements

– 4 –
Skylon Growth & Income Trust
Annual Financial Statements - December 31, 2017
The accompanying notes are an integral part of these financial statements.
Income Net gain (loss) on investments and derivatives Dividends Interest for distribution purposes Derivative income (loss) Income distributions from investments Dividends expense on financial assets (liabilities) sold short Interest expense on financial assets (liabilities) sold short Net realized gain (loss) on sale of investments and derivatives Change in unrealized appreciation (depreciation) in value of investments and derivatives Total net gain (loss) on investments and derivativesOther income Commitment fee income Securities lending revenue (Note 7) Foreign exchange gain (loss) on cash Gain (loss) on redemption Total other incomeTotal income
Expenses Management fees (Note 5)Administration fees (Note 5)Commissions and other portfolio transaction costs Commitment feesAudit feesLegal feesService fees (Note 5)Independent review committee feesSecurities borrowing fees (Note 2)Withholding taxesHarmonized sales tax Total expenses
Increase (decrease) in net assets attributable to holders of redeemable units
Increase (decrease) in net assets attributable to holders of redeemable units per unit:Class A
Weighted average number of units:Class A
Statements of Comprehensive Income for the years ended December 31 (in $000’s except for per unit amounts and number of units)
2017 2016
692 662 620 869 2 - 1 4 - - - - 3,663 2,784 114 483 5,092 4,802
- - 6 11 (115) (225) 1 12 (108) (202) 4,984 4,600
455 489 100 107 36 41 - - 3 3 - - 165 178 1 1 6 5 42 59 66 72 874 955
4,110 3,645
0.81 0.66
5,026,455 5,571,088
Financial Statements

– 5 –
Skylon Growth & Income Trust
Annual Financial Statements - December 31, 2017
The accompanying notes are an integral part of these financial statements.
Class A Net assets attributable to holders of redeemable units at the beginning of year Increase (decrease) in net assets attributable to holders of redeemable units
Distributions to holders of redeemable units From net investment income From net realized gains Return of capital Total distributions to holders of redeemable units
Redeemable unit transactions Proceeds from redeemable units issued Reinvestment of distributions to holders of redeemable units Redemption of redeemable units Net increase (decrease) from redeemable unit transactionsNet increase (decrease) in net assets attributable to holders of redeemable unitsNet assets attributable to holders of redeemable units at the end of year
Statements of Changes in Net Assets Attributable to Holders of Redeemable Units for the years ended December 31 (in $000’s)
2017 2016
41,133 46,019 4,110 3,645
(486) (657) (3,461) (1,922) - (1,319) (3,947) (3,898)
- - 194 202 (3,275) (4,835) (3,081) (4,633) (2,918) (4,886) 38,215 41,133
Financial Statements

– 6 –
Skylon Growth & Income Trust
Annual Financial Statements - December 31, 2017
*Dividends and interest received as well as dividends and interest paid relate to operating activities of the Trust. The accompanying notes are an integral part of these financial statements.
Cash flows from (used in) operating activities Increase (decrease) in net assets attributable to holders of redeemable unitsAdjustments for: Net realized (gain) loss on sale of investments and derivatives Unrealized foreign exchange (gain) loss on cash Commissions and other portfolio transaction costs Change in unrealized (appreciation) depreciation in value of investments and derivatives
Proceeds from sale and maturity of investments and derivatives Purchase of investments and derivatives Non-cash distributions from investments (Increase) decrease in margin for short sales (Increase) decrease in dividends receivable (Increase) decrease in interest receivable (Increase) decrease in securities lending revenue receivable Increase (decrease) in management fees payable Increase (decrease) in administration fees payable Change in other accounts receivable and payable Net cash from (used in) operating activities
Cash flows from (used in) financing activities Distributions paid to holders of redeemable units, net of reinvested distributionsProceeds from issuance of redeemable unitsAmounts paid on redemption of redeemable unitsNet cash from (used in) financing activities
Unrealized foreign exchange gain (loss) on cashNet increase (decrease) in cashCash (bank overdraft), beginning of yearCash (bank overdraft), end of year
Supplementary Information: Dividends received, net of withholding tax*Interest received, net of withholding tax*Dividends paid*Interest paid*
Statements of Cash Flowsfor the years ended December 31 (in $000’s)
Financial Statements
2017 2016
4,110 3,645 (3,663) (2,784) 30 47 36 41 (114) (483) 38,753 46,305 (32,853) (38,460) (1) (4) - - (7) 24 63 66 - - - - - - (3) (6) 6,351 8,391
(3,353) (3,717) - - (4,601) (3,144) (7,954) (6,861)
(30) (47) (1,603) 1,530 3,595 2,112 1,962 3,595
646 642 681 921 - - - -

– 7 –
Skylon Growth & Income Trust
Annual Financial Statements - December 31, 2017
COMMON EQUITIES (70.4%) 41,957 Abengoa S.A. 1,198 1,771 433,886 Abengoa S.A., Class B - 6,542 16,600 Advanced Micro Devices Inc.* 266,239 214,455 1,087 Aetna Inc. 221,183 246,420 3,807 Agnico-Eagle Mines Ltd. 215,991 220,958 3,900 Air Canada 67,031 100,932 1,800 Alibaba Group Holding Ltd., ADR* 250,864 390,049 4,691 Alimentation Couche-Tard Inc., Class B 155,117 307,683 110 Amazon.com Inc. 92,296 161,665 1,000 Apple Inc. 202,086 212,673 4,200 ARC Resources Ltd. 65,093 61,950 3,100 Assa Abloy AB 76,252 80,925 26,200 Banco BPM SpA* 90,096 103,501 243,800 Bank Rakyat Indonesia Persero Tbk PT 58,198 82,200 117 Berry Petroleum Company LLC 1,154 1,323 400 Boeing Co. 133,336 148,246 1,700 Bristol-Myers Squibb Co. 139,672 130,919 1,878 British American Tobacco PLC 116,840 159,885 7,035 Brookfield Office Properties Inc. (USD) 115,169 195,915 1,800 Brookfield Property Partners L.P. (USD) 53,989 50,128 1,050 BRP Inc. 32,553 48,836 4,900 Canadian Imperial Bank of Commerce 542,194 600,446 3,500 Canadian National Railway Co. 274,939 362,775 12,329 Canadian Natural Resources Ltd. 480,489 553,819 2,100 Canadian Pacific Railway Ltd. 469,823 482,286 1,100 Celgene Corp. 166,904 144,265 1,002 Chinos Intermediate Holdings Inc., Class A 2,723 1,651 1,600 Compagnie de Saint-Gobain S.A. 112,424 110,925 300 Credicorp Ltd. 62,350 78,204 3,023 CRH PLC (GBP) 135,720 136,274 700 Daikin Industries Ltd. 89,365 104,102 1,127 Danaher Corp. 120,228 131,462 2,200 Denso Corp. 137,683 165,932 4,400 Devon Energy Corp. 249,922 228,922 3,899 Diageo PLC 115,417 180,261 1,800 Discover Financial Services Inc. 140,134 173,999 13,100 Dream Unlimited Corp. 116,903 101,656 13,300 Enbridge Inc. 707,453 653,828 42,550 EnCana Corp. 531,150 713,564 12,301 Enerplus Corp. 141,183 151,425 2,050 EOG Resources Inc. 215,482 278,003 750 Estée Lauder Co., Inc. 67,756 119,928 900 European Aeronautic Defense and Space Co. N.V. 74,961 112,632 12,500 Fiera Sceptre Inc. 162,507 162,500 12,650 First Quantum Minerals Ltd. 190,130 222,766 1,000 FLSmidth & Co. AS 80,580 73,175 300 General Dynamics Corp. 69,764 76,703 54,500 Glencore PLC 307,975 360,615 4,177 Gluskin Sheff + Associates Inc.* 84,826 69,547 850 Home Depot Inc. 96,805 202,456 500 Honeywell International Inc. 78,686 96,364 2,200 Housing Development Finance Corp., Ltd. 74,048 74,073 1,700 Husky Energy Inc. 29,830 30,175 4,650 Hydro One Ltd. 103,651 104,160 11,290 ICICI Bank Ltd. 55,285 69,785 900 Ingersoll-Rand PLC 106,326 100,877 45,000 Intesa Sanpaolo SpA 190,168 187,947
*Denotes all or part of securities on loan. Percentages shown in brackets relate investments at fair value to net assets attributable to holders of redeemable units of the Trust.
Schedule of Investment Portfolio as at December 31, 2017
No. of Shares/ Par Value Description
AverageCost ($)
FairValue ($)

– 8 –
Skylon Growth & Income Trust
Annual Financial Statements - December 31, 2017
COMMON EQUITIES (70.4%) (cont’d) 1,200 JPMorgan Chase & Co. 148,517 161,271 37,182 Kinross Gold Corp. 208,321 201,526 3,800 KOMATSU Ltd. 138,032 172,822 95,900 Lloyds Banking Group PLC 105,315 110,737 4,050 Loblaw Co., Ltd. 193,201 276,291 29,100 Lundin Mining Corp. 208,889 243,276 1,350 Magna International Inc., Class A 79,137 96,174 52,826 Manulife Financial Corp. 1,139,719 1,385,098 510 Martin Marietta Materials Inc. 125,821 141,669 2,000 Medtronic PLC 198,929 202,958 10,600 Micron Technology Inc.* 229,625 547,764 5,150 Mondelez International Inc. 257,439 277,004 4,360 Nestle S.A., Registered Shares 343,191 471,248 2,050 Newell Rubbermaid Inc.* 82,373 79,606 600 NextEra Energy Inc. 100,066 117,771 2,000 NIKE Inc., Class B 139,886 157,214 13,100 Nordea Bank AB 206,879 199,284 2,122 Nucor Corp. 143,581 169,551 6,350 Patterson-UTI Energy Inc.* 160,156 183,622 6,500 Ping An Insurance (Group) Co. of China Ltd., Shares H 69,531 85,054 11,600 Pirelli & C. SpA 111,562 126,806 5,270 Posera Ltd. 10,321 1,476 13,553 Potash Corp. of Saskatchewan Inc. 378,006 349,396 12,860 Power Corp. of Canada 387,204 416,278 4,001 Richelieu Hardware Ltd. 95,721 137,194 3,550 Rio Tinto PLC 153,525 237,426 750 Roche Holding AG 212,719 238,450 5,556 Royal Bank of Canada 465,229 570,323 210 Samsung Electronics Co., Ltd. 332,733 629,993 8,092 Saputo Inc. 228,607 365,597 836 Schneider Electric S.A. 70,599 89,320 750 Sempra Energy 101,971 100,775 700 Siemens AG, Registered Shares 133,465 122,591 88,050 Singapore Telecommunications Ltd. 259,400 295,350 1,949 Sleep Country Canada Holdings Inc. 47,911 65,097 13,400 Snam Rete Gas SpA 72,626 82,434 11,950 Sony Corp. 458,435 677,417 6,798 Sun Life Financial Inc. 327,333 352,680 17,541 Suncor Energy Inc. 721,416 809,517 6,500 Swedbank AB 204,339 197,065 13,518 Synchrony Financial 512,573 655,913 1,690 TD Ameritrade Holding Corp. 100,277 108,592 7,198 Teck Resources Ltd., Class B 196,095 236,598 18,600 The Bank of Nova Scotia 1,250,133 1,508,832 1,800 The Stars Group Inc. 40,623 52,650 950 Thermo Fisher Scientific Inc. 181,690 226,692 18,020 Toronto-Dominion Bank 1,017,348 1,327,173 1,100 UnitedHealth Group Inc. 204,276 304,759 1,400 Valeo S.A. 124,779 131,447 915 Vulcan Materials Co. 129,837 147,611 2,550 Weir Group PLC 71,742 91,849 6,092 Wells Fargo & Co. 388,393 464,481 7,700 Wheaton Precious Metals Corp. 193,495 213,983 22,403,132 26,960,183
*Denotes all or part of securities on loan. Percentages shown in brackets relate investments at fair value to net assets attributable to holders of redeemable units of the Trust.
Schedule of Investment Portfolio as at December 31, 2017 (cont’d)
No. of Shares/ Par Value Description
AverageCost ($)
FairValue ($)

– 9 –
Skylon Growth & Income Trust
Annual Financial Statements - December 31, 2017
CORPORATE BONDS (16.7%) USD 28,000 1011778 BC ULC/New Red Finance Inc., 5% 10/15/2025 34,984 35,452 11,000 407 International Inc., 3.6% 05/21/2047 11,736 11,173 9,000 407 International Inc., 3.65% 09/08/2044 8,986 9,216 USD 3,000 A Schulman Inc., 6.875% 06/01/2023 3,636 3,921 USD 9,850 AAF Holdings LLC/AAF Finance Co., 12% 07/01/2019 11,084 12,750 EUR 21,438 Abengoa Abenewco 1 S.A.U., 14% 03/31/2021 27,916 29,315 USD 34,597 Abengoa Abenewco 2 S.A.U., 1.5% 09/29/2022 4,874 6,430 USD 11,988 ABG Orphan Holdco S.a.r.l., 14% 02/28/2021 15,988 16,037 USD 4,147 ABG Orphan Holdco S.a.r.l., 14% 02/28/2021 5,524 5,378 USD 3,000 Acrisure LLC 7% 11/15/2025 3,830 3,633 USD 3,000 AECOM 5.125% 03/15/2027 3,922 3,840 USD 15,000 AECOM 5.75% 10/15/2022 16,565 19,652 USD 9,000 AECOM 5.875% 10/15/2024 9,852 12,251 USD 7,000 AerCap Global Aviation Trust 6.5% 06/15/2045 9,284 9,611 16,000 Alimentation Couche-Tard Inc., 3.6% 06/02/2025 16,943 16,273 33,000 Alimentation Couche-Tard Inc., 4.214% 08/21/2020 35,654 34,476 USD 7,000 Alliance One International Inc., 9.875% 07/15/2021 7,087 8,093 14,000 Allied Properties Real Estate Investment Trust 3.748% 05/13/2020 14,416 14,246 10,000 AltaLink L.P., 4.872% 11/15/2040 12,363 12,144 USD 12,000 Altice Financing S.A., 6.625% 02/15/2023 15,554 15,791 USD 3,000 Altice Financing S.A., 7.5% 05/15/2026 4,250 4,015 USD 2,000 Altice S.A., 7.625% 02/15/2025 2,542 2,407 USD 36,370 Alvogen Pharma US Inc., Term Loan, Private Placement, variable rate, 04/02/2022 46,940 45,402 USD 25,858 Amaya Holdings B.V., Term Loan, Private Placement, variable rate, 08/01/2021 28,026 32,724 USD 3,000 American Axle & Manufacturing Inc., 6.25% 04/01/2025* 4,052 3,968 8,000 Anheuser-Busch InBev Finance Inc., 2.6% 05/15/2024 7,998 7,815 10,000 Anheuser-Busch InBev Finance Inc., 4.32% 05/15/2047 10,011 10,463 USD 1,000 ARD Finance S.A., 7.125% 09/15/2023 1,290 1,313 USD 5,000 Ardagh Packaging Finance PLC/Ardagh Holdings USA Inc., 4.625% 05/15/2023 6,274 6,411 12,620 Arrow Lakes Power Corp., 5.516% 04/05/2041 15,108 14,950 USD 7,000 Aston Martin Capital Holdings Ltd., 6.5% 04/15/2022 9,339 9,237 USD 7,000 AT&T Inc., 5.15% 02/14/2050 8,689 8,907 16,000 Aviva PLC 4.5% 05/10/2021 16,636 16,792 20,000 Bank of Amercia Corp., 2.604% 03/15/2023 20,000 19,842 21,000 Bank of America Corp., 3.228% 06/22/2022 21,050 21,401 USD 16,000 Bank of America Corp., 6.1% 12/31/2049 20,323 22,068 USD 6,000 Bank of America Corp., FRN, 5.2% 12/31/2049 7,691 7,665 USD 6,000 Bank of America Corp., FRN, 6.5% 12/31/2049 8,587 8,568 18,000 Bank of Montreal 2.27% 07/11/2022 17,998 17,804 20,000 Bank of Montreal 2.7% 09/11/2024 19,997 19,975 23,000 Bank of Montreal 3.32% 06/01/2026 23,040 23,378 16,000 Bank of Montreal 3.34% 12/08/2025 16,487 16,279 23,000 Bank of Montreal Capital Trust II, Callable, 10.221% 12/31/2107 27,041 24,757 15,000 Bank of Montreal, FRN, 3.12% 09/19/2024 15,237 15,150 17,652 Bankers Hall L.P., 4.377% 11/20/2023 18,809 17,956 USD 8,000 Barclays PLC 4.836% 05/09/2028 10,972 10,464 USD 30,000 Barclays PLC 7.875% 12/31/2049 39,671 41,330 USD 11,000 Barclays PLC 8.25% 12/15/2018 14,250 14,491 USD 18,000 Baytex Energy Corp., 5.625% 06/01/2024 17,585 21,066 8,000 Baytex Energy Corp., 6.625% 07/19/2022 8,000 7,773 USD 49,000 Baytex Energy Corp., 6.75% 02/17/2021 48,359 61,425 15,000 Bell Canada Inc., 3% 10/03/2022* 15,140 15,165 13,000 Bell Canada Inc., 4.35% 12/18/2045 13,599 13,162 10,000 Bell Canada Inc., 4.7% 09/11/2023 11,436 10,884 USD 3,000 BlueLine Rental Finance Corp./BlueLine Rental LLC 9.25% 03/15/2024 4,042 4,025 16,275 BP L.P., 3.244% 01/09/2020 16,761 16,322
*Denotes all or part of securities on loan. Percentages shown in brackets relate investments at fair value to net assets attributable to holders of redeemable units of the Trust.
Schedule of Investment Portfolio as at December 31, 2017 (cont’d)
No. of Shares/ Par Value Description
AverageCost ($)
FairValue ($)
– 10 –
Skylon Growth & Income Trust
Annual Financial Statements - December 31, 2017
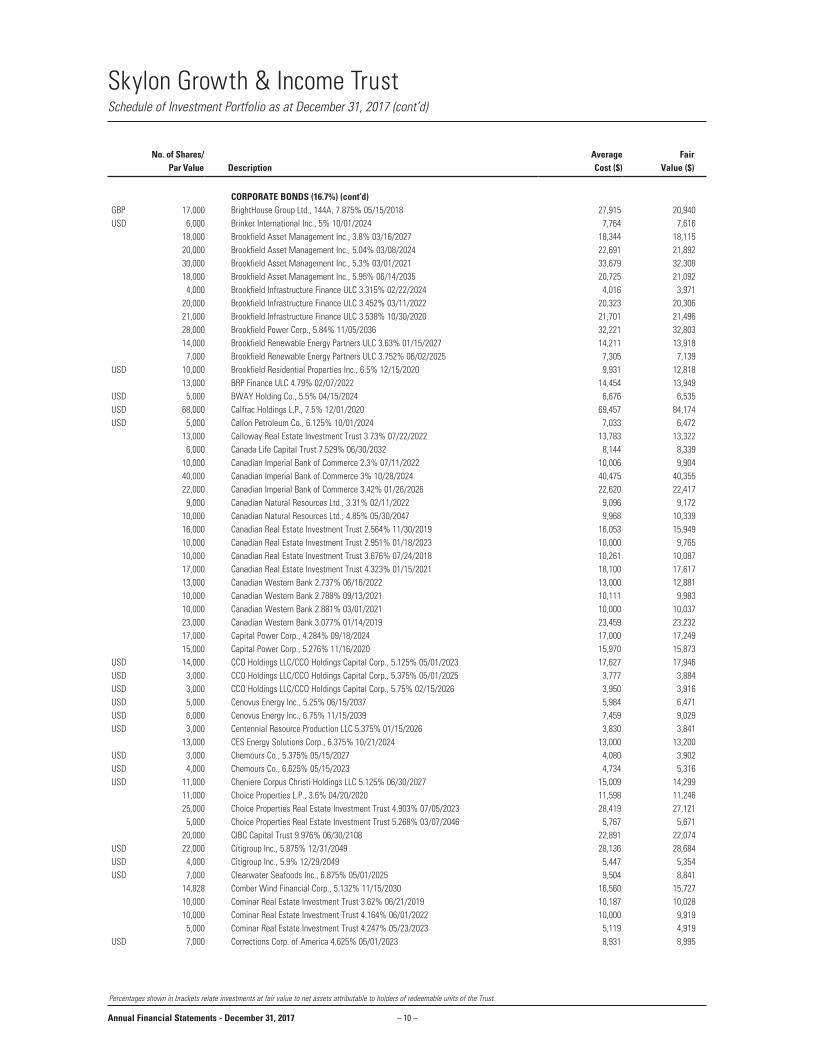
CORPORATE BONDS (16.7%) (cont’d) GBP 17,000 BrightHouse Group Ltd., 144A, 7.875% 05/15/2018 27,915 20,940 USD 6,000 Brinker International Inc., 5% 10/01/2024 7,764 7,616 18,000 Brookfield Asset Management Inc., 3.8% 03/16/2027 18,344 18,115 20,000 Brookfield Asset Management Inc., 5.04% 03/08/2024 22,691 21,892 30,000 Brookfield Asset Management Inc., 5.3% 03/01/2021 33,679 32,308 18,000 Brookfield Asset Management Inc., 5.95% 06/14/2035 20,725 21,092 4,000 Brookfield Infrastructure Finance ULC 3.315% 02/22/2024 4,016 3,971 20,000 Brookfield Infrastructure Finance ULC 3.452% 03/11/2022 20,323 20,306 21,000 Brookfield Infrastructure Finance ULC 3.538% 10/30/2020 21,701 21,496 28,000 Brookfield Power Corp., 5.84% 11/05/2036 32,221 32,803 14,000 Brookfield Renewable Energy Partners ULC 3.63% 01/15/2027 14,211 13,918 7,000 Brookfield Renewable Energy Partners ULC 3.752% 06/02/2025 7,305 7,139 USD 10,000 Brookfield Residential Properties Inc., 6.5% 12/15/2020 9,931 12,818 13,000 BRP Finance ULC 4.79% 02/07/2022 14,454 13,949 USD 5,000 BWAY Holding Co., 5.5% 04/15/2024 6,676 6,535 USD 68,000 Calfrac Holdings L.P., 7.5% 12/01/2020 69,457 84,174 USD 5,000 Callon Petroleum Co., 6.125% 10/01/2024 7,033 6,472 13,000 Calloway Real Estate Investment Trust 3.73% 07/22/2022 13,783 13,322 6,000 Canada Life Capital Trust 7.529% 06/30/2032 8,144 8,339 10,000 Canadian Imperial Bank of Commerce 2.3% 07/11/2022 10,006 9,904 40,000 Canadian Imperial Bank of Commerce 3% 10/28/2024 40,475 40,355 22,000 Canadian Imperial Bank of Commerce 3.42% 01/26/2026 22,620 22,417 9,000 Canadian Natural Resources Ltd., 3.31% 02/11/2022 9,096 9,172 10,000 Canadian Natural Resources Ltd., 4.85% 05/30/2047 9,968 10,339 16,000 Canadian Real Estate Investment Trust 2.564% 11/30/2019 16,053 15,949 10,000 Canadian Real Estate Investment Trust 2.951% 01/18/2023 10,000 9,765 10,000 Canadian Real Estate Investment Trust 3.676% 07/24/2018 10,261 10,087 17,000 Canadian Real Estate Investment Trust 4.323% 01/15/2021 18,100 17,617 13,000 Canadian Western Bank 2.737% 06/16/2022 13,000 12,881 10,000 Canadian Western Bank 2.788% 09/13/2021 10,111 9,983 10,000 Canadian Western Bank 2.881% 03/01/2021 10,000 10,037 23,000 Canadian Western Bank 3.077% 01/14/2019 23,459 23,232 17,000 Capital Power Corp., 4.284% 09/18/2024 17,000 17,249 15,000 Capital Power Corp., 5.276% 11/16/2020 15,970 15,873 USD 14,000 CCO Holdings LLC/CCO Holdings Capital Corp., 5.125% 05/01/2023 17,627 17,946 USD 3,000 CCO Holdings LLC/CCO Holdings Capital Corp., 5.375% 05/01/2025 3,777 3,884 USD 3,000 CCO Holdings LLC/CCO Holdings Capital Corp., 5.75% 02/15/2026 3,950 3,916 USD 5,000 Cenovus Energy Inc., 5.25% 06/15/2037 5,984 6,471 USD 6,000 Cenovus Energy Inc., 6.75% 11/15/2039 7,459 9,029 USD 3,000 Centennial Resource Production LLC 5.375% 01/15/2026 3,830 3,841 13,000 CES Energy Solutions Corp., 6.375% 10/21/2024 13,000 13,200 USD 3,000 Chemours Co., 5.375% 05/15/2027 4,080 3,902 USD 4,000 Chemours Co., 6.625% 05/15/2023 4,734 5,316 USD 11,000 Cheniere Corpus Christi Holdings LLC 5.125% 06/30/2027 15,009 14,299 11,000 Choice Properties L.P., 3.6% 04/20/2020 11,598 11,246 25,000 Choice Properties Real Estate Investment Trust 4.903% 07/05/2023 28,419 27,121 5,000 Choice Properties Real Estate Investment Trust 5.268% 03/07/2046 5,767 5,671 20,000 CIBC Capital Trust 9.976% 06/30/2108 22,891 22,074 USD 22,000 Citigroup Inc., 5.875% 12/31/2049 28,136 28,684 USD 4,000 Citigroup Inc., 5.9% 12/29/2049 5,447 5,354 USD 7,000 Clearwater Seafoods Inc., 6.875% 05/01/2025 9,504 8,841 14,828 Comber Wind Financial Corp., 5.132% 11/15/2030 16,560 15,727 10,000 Cominar Real Estate Investment Trust 3.62% 06/21/2019 10,187 10,028 10,000 Cominar Real Estate Investment Trust 4.164% 06/01/2022 10,000 9,919 5,000 Cominar Real Estate Investment Trust 4.247% 05/23/2023 5,119 4,919 USD 7,000 Corrections Corp. of America 4.625% 05/01/2023 8,931 8,995
Percentages shown in brackets relate investments at fair value to net assets attributable to holders of redeemable units of the Trust.
Schedule of Investment Portfolio as at December 31, 2017 (cont’d)
No. of Shares/ Par Value Description
AverageCost ($)
FairValue ($)

– 11 –
Skylon Growth & Income Trust
Annual Financial Statements - December 31, 2017
CORPORATE BONDS (16.7%) (cont’d) USD 9,000 Corrections Corp. of America 5% 10/15/2022 11,821 11,819 USD 31,000 Credit Suisse Group AG 6.25% 12/31/2049 36,020 42,221 USD 14,000 Credit Suisse Group AG 7.125% 12/31/2049 18,430 19,388 USD 55,000 Credit Suisse Group AG, FRN, 7.5% 12/11/2023 60,882 78,961 21,000 Crew Energy Inc., 6.5% 03/14/2024 20,952 20,495 USD 7,000 CrownRock L.P./CrownRock Finance Inc., 5.625% 10/15/2025 8,751 8,841 16,000 CT Real Estate Investment Trust 3.527% 06/09/2025 16,722 16,043 1,000 CU Inc., 3.964% 07/27/2045 1,069 1,079 17,000 Daimler Canada Finance Inc., 2.23% 12/16/2021 16,983 16,771 USD 1,000 Dana Financing Luxembourg S.a.r.l., 6.5% 06/01/2026 1,378 1,362 19,578 Data & Audio Visual Enterprises Wireless Inc., Private Placement 15% 09/25/2018 - - USD 20,000 DaVita HealthCare Partners Inc., 5.125% 07/15/2024 22,141 25,386 USD 29,000 DCP Midstream LLC, FRN, 5.85% 05/21/2043 28,539 33,893 USD 1,000 Digicel International Finance Ltd., Term Loan B, Private Placement, variable rate, 05/10/2024 1,359 1,264 USD 3,000 Digicel Ltd., 6% 04/15/2021 3,765 3,711 USD 1,000 Digicel Ltd., 8.25% 09/30/2020 1,224 1,236 USD 12,000 Dole Food Co., Inc., 7.25% 06/15/2025 16,076 16,306 15,000 Emera Inc., 2.9% 06/16/2023 15,357 14,952 12,000 Enbridge Gas Distribution Inc., 3.51% 11/29/2047 12,000 11,965 5,000 Enbridge Inc., 3.19% 12/05/2022 5,225 5,045 9,000 Enbridge Inc., 4.24% 08/27/2042 8,475 8,591 13,000 Enbridge Inc., 4.57% 03/11/2044 12,937 13,064 15,000 Enbridge Inc., 5.375% 09/27/2077 15,000 14,910 14,000 Enbridge Income Fund 4.87% 11/21/2044 14,793 14,467 USD 7,000 Endeavor Energy Resources L.P./EER Finance Inc., 5.5% 01/30/2026 8,971 8,951 USD 15,000 Endeavor Energy Resources L.P./EER Finance Inc., 5.75% 01/30/2028 19,223 19,360 12,000 EPCOR Utilities Inc., 4.55% 02/28/2042 14,122 13,966 USD 5,000 ESAL GmbH 6.25% 02/05/2023 6,004 5,969 USD 2,909 Evergreen Skills Lux S.a.r.l., Term Loan 1, Private Placement, variable rate, 04/28/2021 3,601 3,530 USD 15,000 Evergreen Skills Lux S.a.r.l., Term Loan 2, Private Placement, variable rate, 04/28/2022 16,188 16,816 USD 18,000 Evolution Escrow Issuer LLC 7.5% 03/15/2022 21,793 23,639 USD 5,000 Fannie Mae Pool 3% 04/01/2046• 5,897 5,541 USD 5,000 Fannie Mae Pool 3% 07/01/2046• 5,959 5,606 USD 5,000 Fannie Mae Pool 3% 07/01/2046• 5,988 5,624 USD 7,000 Fannie Mae Pool 3% 08/01/2046• 8,556 7,917 USD 7,000 Fannie Mae Pool 3% 08/01/2046• 8,440 7,933 USD 3,000 Fannie Mae Pool 3% 09/01/2046• 3,748 3,441 USD 7,000 Fannie Mae Pool 3% 10/01/2046• 8,910 8,231 USD 7,000 Fannie Mae Pool 3% 10/01/2046• 8,832 8,117 USD 7,000 Fannie Mae Pool 3% 11/01/2046• 8,909 8,183 USD 6,000 Fannie Mae Pool 3.5% 01/01/2046• 6,251 5,916 USD 3,000 Fannie Mae Pool 3.5% 01/01/2046• 3,380 3,062 USD 4,000 Fannie Mae Pool 3.5% 01/01/2046• 4,141 3,954 USD 8,000 Fannie Mae Pool 3.5% 05/01/2046• 9,395 8,618 USD 2,000 Fannie Mae Pool 3.5% 08/01/2045• 2,186 2,066 USD 7,000 Fannie Mae Pool 3.5% 09/01/2045• 6,680 6,316 USD 2,000 Fannie Mae Pool 3.5% 10/01/2045• 1,930 1,785 USD 6,000 Fannie Mae Pool 3.5% 10/01/2045• 6,120 5,639 USD 3,000 Fannie Mae Pool 3.5% 12/01/2045• 3,203 3,002 USD 5,000 Fannie Mae Pool 3.5% 12/01/2045• 5,205 5,011 USD 3,000 Fannie Mae Pool 3.5% 12/01/2045• 3,038 2,888 USD 2,000 Fannie Mae Pool 3.5% 12/01/2045• 2,170 2,059 USD 1,000 Fannie Mae Pool 4% 02/01/2046• 895 834 USD 7,000 Fannie Mae Pool 4% 11/01/2044• 4,425 4,230 29,025 Fifth Avenue L.P., 4.71% 08/05/2021 31,029 29,851 USD 1,000 First Data Corp., 5.75% 01/15/2024 1,317 1,301
•The disclosed par value is the original par value prior to application of pay down factors. Percentages shown in brackets relate investments at fair value to net assets attributable to holders of redeemable units of the Trust.
Schedule of Investment Portfolio as at December 31, 2017 (cont’d)
No. of Shares/ Par Value Description
AverageCost ($)
FairValue ($)

– 12 –
Skylon Growth & Income Trust
Annual Financial Statements - December 31, 2017
CORPORATE BONDS (16.7%) (cont’d) USD 10,000 First Quantum Minerals Ltd., 144A, 7% 02/15/2021 9,900 13,038 USD 13,000 First Quantum Minerals Ltd., 7.25% 05/15/2022 12,014 17,126 USD 3,000 First Quantum Minerals Ltd., 7.5% 04/01/2025 3,761 4,091 USD 4,000 Foot Locker Inc., 8.5% 01/15/2022 4,620 5,881 15,000 Ford Floorplan Auto Securitization Trust 2.397% 07/15/2020 15,000 14,864 14,000 Fortified Trust 1.67% 07/23/2021 14,082 13,636 10,000 Fortified Trust 2.161% 10/23/2020 10,000 9,956 9,000 FortisAlberta Inc., 4.27% 09/22/2045 10,486 10,192 10,000 FortisBC Energy Inc., 5.8% 05/13/2038 13,834 13,280 USD 5,000 Freddie Mac Gold Pool 3% 05/01/2046• 5,813 5,463 USD 7,000 Freddie Mac Gold Pool 3% 06/01/2046• 8,302 7,809 USD 7,000 Freddie Mac Gold Pool 3% 08/01/2046• 8,629 8,027 USD 7,000 Freddie Mac Gold Pool 3% 09/01/2046• 8,767 8,094 USD 4,000 Freddie Mac Gold Pool 3.5% 01/01/2046• 4,093 3,866 USD 6,000 Freddie Mac Gold Pool 3.5% 02/01/2046• 6,118 5,769 USD 5,000 Freddie Mac Gold Pool 3.5% 03/01/2046• 5,256 4,985 USD 8,000 Freddie Mac Gold Pool 3.5% 04/01/2046• 8,872 8,248 USD 8,000 Freddie Mac Gold Pool 3.5% 05/01/2046• 9,060 8,403 USD 7,000 Freddie Mac Gold Pool 3.5% 08/01/2046• 8,330 7,691 USD 5,000 Freddie Mac Gold Pool 3.5% 09/01/2046• 6,040 5,570 USD 4,000 Freddie Mac Gold Pool 3.5% 12/01/2045• 4,076 3,851 USD 7,000 Freddie Mac Gold Pool 4% 01/01/2046• 6,537 6,090 USD 8,000 Freddie Mac Gold Pool 4% 02/01/2046• 7,843 7,209 USD 9,000 Freddie Mac Gold Pool 4% 08/01/2045• 7,540 6,936 USD 10,000 Freeport-McMoRan Inc., 5.4% 11/14/2034 9,501 12,787 USD 5,000 Freeport-McMoRan Inc., 6.75% 02/01/2022 5,516 6,503 USD 6,000 Freeport-McMoRan Inc., 6.875% 02/15/2023 6,353 8,219 USD 2,000 FXI Holdings Inc., 7.875% 11/01/2024 2,565 2,508 USD 10,000 Genworth Holdings Inc., 3.41836% 11/15/2066 9,795 5,781 USD 6,000 Genworth Holdings Inc., 4.8% 02/15/2024 6,130 6,409 USD 12,000 Genworth Holdings Inc., 4.9% 08/15/2023 11,805 12,856 USD 11,000 Genworth Holdings Inc., 7.625% 09/24/2021 12,692 13,513 8,000 George Weston Ltd., 7.1% 02/05/2032 10,698 10,359 USD 22,000 Getty Images Inc., 144A, 7% 10/15/2020 18,165 18,800 USD 6,769 Getty Images Inc., Term Loan B, Private Placement, variable rate, 10/18/2019 7,009 7,776 17,000 Gibson Energy Inc., 5.25% 07/15/2024 17,000 17,113 21,000 Gibson Energy Inc., 5.25% 07/15/2024 21,000 21,105 15,000 Gibson Energy Inc., 5.375% 07/15/2022 15,000 15,244 16,000 Glacier Credit Card Trust 2.568% 09/20/2019 16,505 16,081 22,000 Glacier Credit Card Trust 3.237% 09/20/2020 21,926 21,940 1,931 Golden Credit Card Trust 2.134% 03/15/2019 1,929 1,914 USD 14,000 Goldman Sachs Group Inc., 5.3% 12/31/2049 18,248 18,694 USD 20,000 Goldman Sachs Group Inc., 5.375% 12/31/2049 24,362 25,888 19,000 Golf Town Canada Inc./Golfsmith International Holdings Inc., 10.5% 07/24/2018 19,014 5,703 15,000 Granite REIT Holdings L.P., 3.788% 07/05/2021 15,592 15,183 19,000 Granite REIT Holdings L.P., 3.873% 11/30/2023 19,000 19,022 USD 8,000 H&E Equipment Services Inc., 5.625% 09/01/2025 10,140 10,506 USD 11,459 Hartford Financial Services Group Inc., 3.54086% 02/12/2047 9,668 13,969 GBP 12,000 HBOS Capital Funding L.P., FRN, 6.461% 12/31/2049 17,751 21,180 USD 12,000 HCA Inc., 5% 03/15/2024 16,372 15,684 USD 13,000 HCA Inc., 5.25% 04/15/2025 17,093 17,277 USD 1,000 HCA Inc., 7.58% 09/15/2025 1,449 1,439 15,000 Heathrow Funding Ltd., FRN, 3% 06/17/2023 15,523 15,186 USD 9,000 Hertz Corp., 7.625% 06/01/2022* 12,159 11,848 USD 3,000 Hilton Domestic Operating Co., Inc., 4.25% 09/01/2024 3,949 3,808 USD 29,000 Hockey Merger Sub 2 Inc., 7.875% 10/01/2021 30,607 37,948
*Denotes all or part of securities on loan. •The disclosed par value is the original par value prior to application of pay down factors. Percentages shown in brackets relate investments at fair value to net assets attributable to holders of redeemable units of the Trust.
Schedule of Investment Portfolio as at December 31, 2017 (cont’d)
No. of Shares/ Par Value Description
AverageCost ($)
FairValue ($)
– 13 –
Skylon Growth & Income Trust
Annual Financial Statements - December 31, 2017
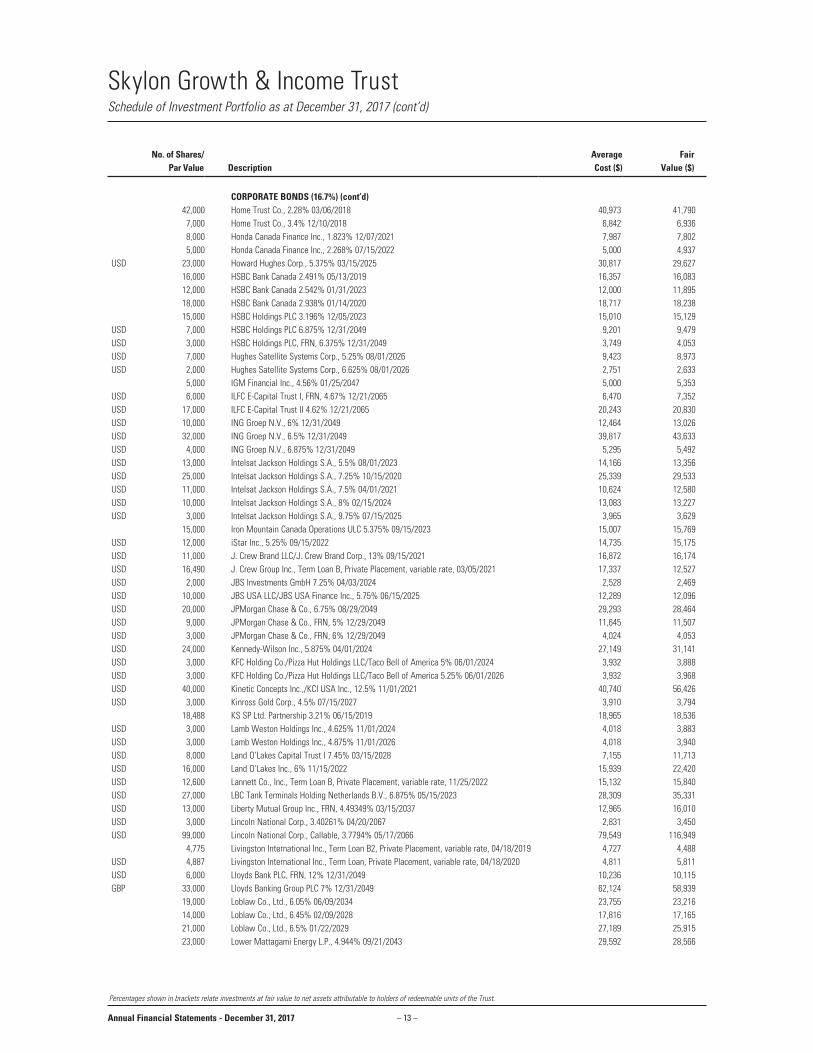
CORPORATE BONDS (16.7%) (cont’d) 42,000 Home Trust Co., 2.28% 03/06/2018 40,973 41,790 7,000 Home Trust Co., 3.4% 12/10/2018 6,842 6,936 8,000 Honda Canada Finance Inc., 1.823% 12/07/2021 7,987 7,802 5,000 Honda Canada Finance Inc., 2.268% 07/15/2022 5,000 4,937 USD 23,000 Howard Hughes Corp., 5.375% 03/15/2025 30,817 29,627 16,000 HSBC Bank Canada 2.491% 05/13/2019 16,357 16,083 12,000 HSBC Bank Canada 2.542% 01/31/2023 12,000 11,895 18,000 HSBC Bank Canada 2.938% 01/14/2020 18,717 18,238 15,000 HSBC Holdings PLC 3.196% 12/05/2023 15,010 15,129 USD 7,000 HSBC Holdings PLC 6.875% 12/31/2049 9,201 9,479 USD 3,000 HSBC Holdings PLC, FRN, 6.375% 12/31/2049 3,749 4,053 USD 7,000 Hughes Satellite Systems Corp., 5.25% 08/01/2026 9,423 8,973 USD 2,000 Hughes Satellite Systems Corp., 6.625% 08/01/2026 2,751 2,633 5,000 IGM Financial Inc., 4.56% 01/25/2047 5,000 5,353 USD 6,000 ILFC E-Capital Trust I, FRN, 4.67% 12/21/2065 6,470 7,352 USD 17,000 ILFC E-Capital Trust II 4.62% 12/21/2065 20,243 20,830 USD 10,000 ING Groep N.V., 6% 12/31/2049 12,464 13,026 USD 32,000 ING Groep N.V., 6.5% 12/31/2049 39,817 43,633 USD 4,000 ING Groep N.V., 6.875% 12/31/2049 5,295 5,492 USD 13,000 Intelsat Jackson Holdings S.A., 5.5% 08/01/2023 14,166 13,356 USD 25,000 Intelsat Jackson Holdings S.A., 7.25% 10/15/2020 25,339 29,533 USD 11,000 Intelsat Jackson Holdings S.A., 7.5% 04/01/2021 10,624 12,580 USD 10,000 Intelsat Jackson Holdings S.A., 8% 02/15/2024 13,083 13,227 USD 3,000 Intelsat Jackson Holdings S.A., 9.75% 07/15/2025 3,965 3,629 15,000 Iron Mountain Canada Operations ULC 5.375% 09/15/2023 15,007 15,769 USD 12,000 iStar Inc., 5.25% 09/15/2022 14,735 15,175 USD 11,000 J. Crew Brand LLC/J. Crew Brand Corp., 13% 09/15/2021 16,872 16,174 USD 16,490 J. Crew Group Inc., Term Loan B, Private Placement, variable rate, 03/05/2021 17,337 12,527 USD 2,000 JBS Investments GmbH 7.25% 04/03/2024 2,528 2,469 USD 10,000 JBS USA LLC/JBS USA Finance Inc., 5.75% 06/15/2025 12,289 12,096 USD 20,000 JPMorgan Chase & Co., 6.75% 08/29/2049 29,293 28,464 USD 9,000 JPMorgan Chase & Co., FRN, 5% 12/29/2049 11,645 11,507 USD 3,000 JPMorgan Chase & Co., FRN, 6% 12/29/2049 4,024 4,053 USD 24,000 Kennedy-Wilson Inc., 5.875% 04/01/2024 27,149 31,141 USD 3,000 KFC Holding Co./Pizza Hut Holdings LLC/Taco Bell of America 5% 06/01/2024 3,932 3,888 USD 3,000 KFC Holding Co./Pizza Hut Holdings LLC/Taco Bell of America 5.25% 06/01/2026 3,932 3,968 USD 40,000 Kinetic Concepts Inc.,/KCI USA Inc., 12.5% 11/01/2021 40,740 56,426 USD 3,000 Kinross Gold Corp., 4.5% 07/15/2027 3,910 3,794 18,488 KS SP Ltd. Partnership 3.21% 06/15/2019 18,965 18,536 USD 3,000 Lamb Weston Holdings Inc., 4.625% 11/01/2024 4,018 3,883 USD 3,000 Lamb Weston Holdings Inc., 4.875% 11/01/2026 4,018 3,940 USD 8,000 Land O’Lakes Capital Trust I 7.45% 03/15/2028 7,155 11,713 USD 16,000 Land O’Lakes Inc., 6% 11/15/2022 15,939 22,420 USD 12,600 Lannett Co., Inc., Term Loan B, Private Placement, variable rate, 11/25/2022 15,132 15,840 USD 27,000 LBC Tank Terminals Holding Netherlands B.V., 6.875% 05/15/2023 28,309 35,331 USD 13,000 Liberty Mutual Group Inc., FRN, 4.49349% 03/15/2037 12,965 16,010 USD 3,000 Lincoln National Corp., 3.40261% 04/20/2067 2,831 3,450 USD 99,000 Lincoln National Corp., Callable, 3.7794% 05/17/2066 79,549 116,949 4,775 Livingston International Inc., Term Loan B2, Private Placement, variable rate, 04/18/2019 4,727 4,488 USD 4,887 Livingston International Inc., Term Loan, Private Placement, variable rate, 04/18/2020 4,811 5,811 USD 6,000 Lloyds Bank PLC, FRN, 12% 12/31/2049 10,236 10,115 GBP 33,000 Lloyds Banking Group PLC 7% 12/31/2049 62,124 58,939 19,000 Loblaw Co., Ltd., 6.05% 06/09/2034 23,755 23,216 14,000 Loblaw Co., Ltd., 6.45% 02/09/2028 17,816 17,165 21,000 Loblaw Co., Ltd., 6.5% 01/22/2029 27,189 25,915 23,000 Lower Mattagami Energy L.P., 4.944% 09/21/2043 29,592 28,566
Percentages shown in brackets relate investments at fair value to net assets attributable to holders of redeemable units of the Trust.
Schedule of Investment Portfolio as at December 31, 2017 (cont’d)
No. of Shares/ Par Value Description
AverageCost ($)
FairValue ($)

– 14 –
Skylon Growth & Income Trust
Annual Financial Statements - December 31, 2017
CORPORATE BONDS (16.7%) (cont’d) 9,000 Manulife Bank of Canada 2.082% 05/26/2022 9,000 8,774 12,000 Master Credit Card Trust II 3.056% 01/21/2022 11,864 11,763 USD 6,000 Mattamy Group Corp., (USD) 6.5% 10/01/2025 7,397 7,974 14,000 Mattamy Group Corp., 6.5% 10/01/2025 14,080 14,573 USD 9,000 Mattamy Group Corp., 6.875% 12/15/2023 11,907 11,961 USD 4,000 MEG Energy Corp., 6.375% 01/30/2023 4,058 4,273 USD 8,000 MEG Energy Corp., 6.5% 01/15/2025 10,495 9,928 23,000 Merrill Lynch & Co., Inc., FRN, 2.328% 05/30/2022 22,732 22,988 5,000 Metro Inc., 3.39% 12/06/2027 4,997 4,956 5,000 Metro Inc., 4.27% 12/04/2047 4,995 4,998 16,000 Metro Inc., 5.03% 12/01/2044 18,331 17,922 USD 14,000 MGM Growth Properties Operating Partnership L.P., 5.625% 05/01/2024 19,098 18,738 USD 9,000 MGM Resorts International 4.625% 09/01/2026 11,567 11,423 USD 1,000 MGM Resorts International 6.625% 12/15/2021 1,413 1,379 USD 3,000 MGM Resorts International 7.75% 03/15/2022 3,741 4,298 USD 6,000 Micron Technology Inc., 5.25% 01/15/2024 7,943 7,832 USD 16,000 Micron Technology Inc., 5.625% 01/15/2026 18,902 21,163 12,000 Molson Coors International L.P., 2.75% 09/18/2020 12,293 12,045 14,000 Molson Coors International L.P., 3.44% 07/15/2026 14,139 13,746 USD 20,000 Morgan Stanley 5.55% 12/31/2049 25,404 26,108 25,000 National Bank of Canada 2.404% 10/28/2019 25,736 25,124 USD 6,000 National Westminster Bank PLC, FRN, 1.75% 08/29/2049 3,892 6,644 USD 10,000 National Westminster Bank PLC, FRN, 1.75% 12/31/2049 6,486 11,070 USD 26,000 Nationstar Mortgage LLC/Nationstar Capital Corp., 6.5% 06/01/2022 31,253 33,001 USD 39,000 Nationstar Mortgage LLC/Nationstar Capital Corp., 6.5% 07/01/2021 47,315 49,686 USD 1,000 Navient Corp., 8% 03/25/2020 1,386 1,359 USD 13,000 Navios Maritime Holdings Inc./Navios Maritime Finance II US Inc., 7.375% 01/15/2022 13,608 13,111 USD 14,000 Navios South American Logistics Inc./Navios Logistics Inc., 7.25% 05/01/2022 15,615 16,846 15,000 NBC Asset Trust 7.235% 06/30/2049 15,533 15,374 USD 9,357 Neovia Logistics Intermediate Holdings LLC 10% 04/01/2020 7,114 4,939 USD 8,000 Netflix Inc., 5.75% 03/01/2024 8,863 10,695 USD 4,000 New Gold Inc., 6.375% 05/15/2025 5,504 5,328 USD 24,000 NGL Energy Partners L.P./NGL Energy Finance Corp., 6.125% 03/01/2025 31,390 29,407 USD 22,000 NGL Energy Partners L.P./NGL Energy Finance Corp., 6.875% 10/15/2021 23,838 28,201 USD 5,000 NGL Energy Partners L.P./NGL Energy Finance Corp., 7.5% 11/01/2023 6,776 6,488 USD 1,000 NGPL PipeCo LLC 4.375% 08/15/2022 1,250 1,278 USD 1,000 NGPL PipeCo LLC 4.875% 08/15/2027 1,250 1,304 10,000 Nissan Canada Financial Services Inc., 1.75% 04/09/2020 10,000 9,871 7,273 NorthWestConnect Group Partnership 5.95% 04/30/2041 9,218 8,679 USD 6,000 NOVA Chemicals Corp., 4.875% 06/01/2024 8,088 7,521 USD 5,000 NOVA Chemicals Corp., 5.25% 06/01/2027 6,740 6,268 USD 13,000 NuStar Logistics L.P., 6.75% 02/01/2021 13,426 17,399 USD 1,000 Ortho-Clinical Diagnostics Inc., 6.625% 05/15/2022 1,050 1,263 USD 14,000 Paramount Resources Ltd., 6.875% 06/30/2023 17,504 18,694 USD 5,000 Park Aerospace Holdings Ltd., 4.5% 03/15/2023 6,092 6,001 USD 7,000 Park Aerospace Holdings Ltd., 5.25% 08/15/2022 9,329 8,742 19,000 Parkland Fuel Corp., 5.625% 05/09/2025 19,000 19,160 19,000 Parkland Fuel Corp., 5.75% 09/16/2024 19,000 19,364 USD 1,000 Parsley Energy LLC/Parsley Finance Corp., 5.25% 08/15/2025 1,315 1,260 USD 8,000 Parsley Energy LLC/Parsley Finance Corp., 5.375% 01/15/2025 10,628 10,154 USD 3,000 Parsley Energy LLC/Parsley Finance Corp., 5.625% 10/15/2027 3,771 3,855 USD 2,000 Parsley Energy LLC/Parsley Finance Corp., 6.25% 06/01/2024 2,622 2,645 15,000 Pembina Pipeline Corp., 4.74% 01/21/2047 14,855 15,122 20,000 Penske Truck Leasing Canada Inc., 2.85% 12/07/2022 20,043 19,954 20,000 Penske Truck Leasing Canada Inc., 2.95% 06/12/2020 20,383 20,159 10,000 PepsiCo Inc., 2.15% 05/06/2024 9,994 9,683 5,000 Power Corp. of Canada 4.81% 01/31/2047 5,000 5,552
Percentages shown in brackets relate investments at fair value to net assets attributable to holders of redeemable units of the Trust.
Schedule of Investment Portfolio as at December 31, 2017 (cont’d)
No. of Shares/ Par Value Description
AverageCost ($)
FairValue ($)

– 15 –
Skylon Growth & Income Trust
Annual Financial Statements - December 31, 2017
CORPORATE BONDS (16.7%) (cont’d) 27,000 Power Corp. of Canada 7.57% 04/22/2019 30,713 28,706 15,000 Power Corp. of Canada 8.57% 04/22/2039 24,451 24,132 USD 5,000 Precision Drilling Corp., 5.25% 11/15/2024 5,418 5,922 USD 4,000 Precision Drilling Corp., 7.75% 12/15/2023 5,357 5,278 USD 22,000 Project Homestake Merger Corp., 8.875% 03/01/2023 27,545 26,092 USD 21,000 Rayonier AM Products Inc., 5.5% 06/01/2024 22,987 26,292 23,000 Real Estate Asset Liquidity Trust, Class C, 3.5% 05/12/2025• 22,433 22,433 37,000 Reliance L.P., 3.813% 09/15/2020 37,487 37,622 15,000 Reliance L.P., 3.836% 03/15/2025 15,031 14,933 5,000 Reliance L.P., 4.075% 08/02/2021 5,240 5,119 32,000 Reliance L.P., 5.187% 03/15/2019 33,583 32,929 USD 5,000 Resolute Energy Corp., 8.5% 05/01/2020 6,934 6,394 USD 6,000 Reynolds Group Issuer Inc./Reynolds Group Issuer LLC 7% 07/15/2024 7,683 8,068 3,000 RioCan Real Estate Investment Trust 3.746% 05/30/2022 3,131 3,097 11,000 RioCan Real Estate Investment Trust 3.85% 06/28/2019 11,591 11,246 USD 29,000 Rite Aid Corp., 6.125% 04/01/2023 35,088 32,891 USD 11,000 Rite Aid Corp., 7.7% 02/15/2027 13,100 11,750 13,000 Rogers Communications Inc., 5.34% 03/22/2021 14,813 14,130 9,000 Rogers Communications Inc., 5.38% 11/04/2019 9,997 9,506 16,000 Rogers Communications Inc., 6.11% 08/25/2040 20,381 20,218 17,000 Royal Bank of Canada 2.03% 03/15/2021 17,137 16,813 29,000 Royal Bank of Canada 2.36% 12/05/2022 28,997 28,698 23,000 Royal Bank of Canada 3.31% 01/20/2026 23,649 23,378 10,000 Royal Bank of Canada, FRN, 2.99% 12/06/2024 10,340 10,127 6,000 Royal Bank of Canada, FRN, 3.04% 07/17/2024 6,068 6,054 USD 11,000 Royal Bank of Scotland Group PLC 8.625% 12/31/2049 14,369 15,569 USD 7,000 RSP Permian Inc., 5.25% 01/15/2025 9,318 9,017 USD 4,000 RSP Permian Inc., 6.625% 10/01/2022 5,194 5,272 USD 2,000 Sabre GLBL Inc., 5.25% 11/15/2023 2,637 2,571 USD 10,000 Sabre GLBL Inc., 5.375% 04/15/2023 12,735 12,944 USD 3,000 Scientific Games Corp., 5% 10/15/2025 3,754 3,780 USD 11,000 Scientific Games International Inc., 10% 12/01/2022 11,148 15,172 USD 24,000 Scientific Games International Inc., 6.25% 09/01/2020 23,736 30,500 USD 15,000 Scientific Games International Inc., 6.625% 05/15/2021 18,005 19,463 21,900 SEC L.P. and Arci Ltd., 5.188% 08/29/2033 24,482 22,954 USD 26,000 Seven Generations Energy Ltd., 5.375% 09/30/2025 32,334 33,001 USD 10,000 Seven Generations Energy Ltd., 6.75% 05/01/2023 12,228 13,353 USD 5,000 SFR Group S.A., 6% 05/15/2022 5,848 6,362 USD 4,000 SFR Group S.A., 6.25% 05/15/2024 4,568 5,039 USD 4,000 SFR Group S.A., 7.375% 05/01/2026 5,534 5,159 10,000 Shaw Communications Inc., 5.65% 10/01/2019 10,985 10,571 4,000 Shaw Communications Inc., 6.75% 11/09/2039 4,899 5,141 USD 3,000 Shea Homes L.P./Shea Homes Funding Corp., 5.875% 04/01/2023 3,828 3,912 USD 5,000 Shea Homes L.P./Shea Homes Funding Corp., 6.125% 04/01/2025 6,374 6,535 15,000 Sherritt International Corp., 7.875% 10/11/2022 14,678 12,150 USD 7,000 Silversea Cruises Ltd., 7.25% 02/01/2025 9,306 9,479 10,000 Smart Real Estate Investment Trust 3.444% 08/28/2026 9,999 9,729 15,000 SmartCentres Real Estate Investment Trust 3.834% 12/21/2027 15,000 14,858 USD 20,000 SPL Logistics Escrow LLC/SPL Logistics Finance Corp., 8.875% 08/01/2020 21,464 20,359 USD 48,000 Sprint Capital Corp., 6.875% 11/15/2028 54,205 60,699 USD 7,000 Sprint Corp., 7.125% 06/15/2024 8,132 8,951 USD 4,000 Starwood Property Trust Inc., 5% 12/15/2021 5,271 5,215 32,172 Strait Crossing Development Inc., 6.17% 09/15/2031 36,344 35,497 USD 19,000 Studio City Finance Ltd., 8.5% 12/01/2020 23,178 24,415 USD 5,000 Summit Materials LLC/Summit Materials Finance Corp., 6.125% 07/15/2023 6,538 6,535
•The disclosed par value is the original par value prior to application of pay down factors. Percentages shown in brackets relate investments at fair value to net assets attributable to holders of redeemable units of the Trust.
Schedule of Investment Portfolio as at December 31, 2017 (cont’d)
No. of Shares/ Par Value Description
AverageCost ($)
FairValue ($)

– 16 –
Skylon Growth & Income Trust
Annual Financial Statements - December 31, 2017
CORPORATE BONDS (16.7%) (cont’d) 15,000 Sun Life Capital Trust 7.093% 06/30/2052 19,669 19,976 14,000 Sun Life Capital Trust II 5.863% 12/31/2108 15,360 14,835 11,000 Sun Life Financial Inc., 3.05% 09/19/2028 11,102 11,030 6,000 Suncor Energy Inc., 4.34% 09/13/2046 6,070 6,353 10,000 TD Capital Trust IV 9.523% 06/30/2049 11,598 10,964 USD 6,000 Teck Resources Ltd., 5.4% 02/01/2043 7,746 7,578 USD 27,000 Teck Resources Ltd., 6% 08/15/2040 38,620 37,991 USD 11,000 Teine Energy Ltd., 6.875% 09/30/2022 12,225 14,273 2,000 TELUS Corp., 4.4% 01/29/2046 2,069 1,985 9,000 TELUS Corp., 4.75% 01/17/2045 9,816 9,427 USD 3,930 Tenaska Alabama Partners L.P., 7% 06/30/2021 4,685 5,068 16,000 Teranet Holdings L.P., 5.754% 12/17/2040 19,317 16,973 USD 4,000 TerraForm Power Operating LLC 4.25% 01/31/2023 5,126 5,002 USD 6,000 TerraForm Power Operating LLC 5% 01/31/2028 7,689 7,485 10,000 The Bank of Nova Scotia 1.83% 04/27/2022 9,876 9,716 9,000 The Bank of Nova Scotia 1.9% 12/02/2021 8,997 8,811 13,000 The Bank of Nova Scotia 2.29% 06/28/2024 12,999 12,665 15,000 The Bank of Nova Scotia 2.36% 11/08/2022 14,998 14,848 USD 1,000 The Royal Bank of Scotland Group PLC 3.655% 12/31/2049 1,202 1,247 USD 16,000 The Royal Bank of Scotland Group PLC 7.5% 12/31/2049 20,405 21,263 9,937 THP Partnership 4.394% 10/31/2046 10,847 10,773 USD 4,000 T-Mobile USA Inc., 6% 03/01/2023 5,329 5,263 USD 26,000 Tops Holding LLC/Tops Markets II Corp., 8% 06/15/2022 32,103 17,644 USD 2,000 Tops Holding LLC/Tops Markets II Corp., 9% 03/15/2021 2,244 2,312 21,000 Toronto-Dominion Bank 2.045% 03/08/2021 21,480 20,812 18,000 Toronto-Dominion Bank 2.447% 04/02/2019 18,510 18,107 29,000 Toronto-Dominion Bank 2.563% 06/24/2020 30,087 29,225 5,000 Toronto-Dominion Bank 3.224% 07/25/2029 5,000 4,991 18,000 Toronto-Dominion Bank 4.859% 03/04/2031 20,339 19,851 5,000 Toyota Credit Canada Inc., 2.2% 02/25/2021 5,125 4,975 8,000 TransCanada PipeLines Ltd., 4.33% 09/16/2047 7,999 8,528 31,000 TransCanada Trust 4.65% 05/18/2077 31,000 30,884 USD 11,000 TransCanada Trust 5.875% 08/15/2076 15,322 14,964 USD 9,000 TransDigm Inc., 6.375% 06/15/2026 11,912 11,423 USD 11,000 TransDigm Inc., 6.5% 05/15/2025 14,717 14,135 USD 4,000 TRI Pointe Holdings Inc., 5.875% 06/15/2024 4,294 5,366 8,873 Trillium Windpower L.P., 5.803% 02/15/2033 10,400 10,059 USD 5,000 Trinidad Drilling Ltd 6.625% 02/15/2025 6,569 5,969 USD 4,000 Tronox Finance PLC 5.75% 10/01/2025 4,947 5,165 USD 3,000 Tutor Perini Corp., 6.875% 05/01/2025 3,982 4,053 USD 11,000 UBS Group AG 6.875% 12/31/2049 14,593 14,807 USD 35,000 UBS Group AG 6.875% 12/31/2049 45,911 48,665 USD 14,000 UBS Group AG 7.125% 12/31/2049 18,301 19,119 USD 10,000 UBS Group AG, FRN, 7% 12/31/2049 12,551 14,232 USD 7,000 Unitymedia Hessen GmbH & Co., KG/Unitymedia NRW GmbH 5% 01/15/2025 9,320 9,017 USD 4,500 Unitymedia Hessen GmbH & Co., KG/Unitymedia NRW GmbH 5.5% 01/15/2023 4,643 5,813 USD 7,000 Unitymedia KabelBW GmbH 6.125% 01/15/2025 7,820 9,281 USD 29,000 UPCB Finance IV Ltd., 5.375% 01/15/2025 35,152 36,696 USD 18,000 USB Realty Corp., FRN, 2.50617% 12/29/2049 18,123 20,387 USD 998 USI Inc., Term Loan B, Private Placement, variable rate, 05/16/2024 1,333 1,254 USD 2,925 Veresen Midstream L.P., Term Loan B, Private Placement, variable rate, 03/21/2022 3,535 3,711 USD 38,000 Vertiv Group Corp., 9.25% 10/15/2024 48,185 50,978 USD 3,000 Virgin Media Finance PLC 6.375% 04/15/2023 2,993 3,888 USD 6,000 Virgin Media Secured Finance PLC 5.25% 01/15/2026 7,666 7,616 USD 1,000 Virgin Media Secured Finance PLC 5.5% 01/15/2025 1,387 1,288 13,000 Walt Disney Co., 2.758% 10/07/2024 13,000 12,984
Percentages shown in brackets relate investments at fair value to net assets attributable to holders of redeemable units of the Trust.
Schedule of Investment Portfolio as at December 31, 2017 (cont’d)
No. of Shares/ Par Value Description
AverageCost ($)
FairValue ($)

– 17 –
Skylon Growth & Income Trust
Annual Financial Statements - December 31, 2017
CORPORATE BONDS (16.7%) (cont’d) USD 10,000 Wells Fargo & Co., 5.875% 12/31/2049 12,392 13,919 20,597 West Edmonton Mall Property Inc., 4.056% 02/13/2024 21,916 20,770 USD 1,000 William Lyon Homes Inc., 5.875% 01/31/2025 1,296 1,283 USD 2,000 WMG Acquisition Corp., 4.875% 11/01/2024 2,641 2,589 USD 2,000 WMG Acquisition Corp., 5% 08/01/2023 2,617 2,601 USD 6,000 Wynn Las Vegas LLC/Wynn Las Vegas Capital Corp., 5.5% 03/01/2025 7,585 7,766 USD 27,000 XLIT Ltd., 3.81667% 12/31/2049 26,194 30,385 USD 14,748 Xplornet Commnunications Inc., 9.625% 06/01/2022 19,709 19,414 USD 4,000 Yum! Brands Inc., 3.875% 11/01/2023 4,816 5,058 6,203,562 6,375,835 PROVINCIAL BONDS (8.2%) 1,000 Province of British Columbia 2.8% 06/18/2048 1,015 986 97,000 Province of British Columbia 3.2% 06/18/2044 102,297 102,666 47,000 Province of British Columbia 6.35% 06/18/2031 69,370 66,020 20,000 Province of Nova Scotia 4.7% 06/01/2041 25,403 25,669 5,000 Province of Nova Scotia 6.6% 06/01/2027 7,082 6,644 322,000 Province of Ontario 2.4% 06/02/2026 327,790 317,898 287,000 Province of Ontario 2.6% 06/02/2025 298,772 288,758 88,000 Province of Ontario 2.6% 06/02/2027 89,369 87,880 216,000 Province of Ontario 2.8% 06/02/2048 207,203 210,037 394,000 Province of Ontario 2.85% 06/02/2023 406,871 404,794 15,000 Province of Ontario 2.9% 12/02/2046 15,114 14,850 322,000 Province of Ontario 3.5% 06/02/2024 348,323 342,621 256,000 Province of Quebec 2.5% 09/01/2026 258,284 254,841 187,000 Province of Quebec 2.75% 09/01/2025 194,168 190,190 129,000 Province of Quebec 2.75% 09/01/2027* 133,331 130,679 245,000 Province of Quebec 3% 09/01/2023 256,123 253,866 107,000 Province of Quebec 3.5% 12/01/2022 114,217 113,257 62,000 Province of Quebec 3.5% 12/01/2048 68,760 69,306 218,000 Province of Quebec 3.75% 09/01/2024 239,800 235,796 3,163,292 3,116,758 PREFERRED SHARES (3.7%) 3 A Schulman Inc., Preferred 6% 3,607 3,506 16 Allergan PLC, Preferred 5.5%, Series A 20,662 11,788 500 AltaGas Ltd., Preferred 4.75%, Series G 11,555 12,290 625 AltaGas Ltd., Preferred 5%, Series K 15,878 16,088 1,100 Bank of Montreal, Non-Cumulative Preferred 23,543 25,058 500 Bank of Montreal, Preferred 4.4%, Series 42 12,500 12,745 1,000 Bank of Montreal, Preferred 4.5%, Series 40 25,000 25,910 200 Bank of Montreal, Preferred 4.85%, Series 38 5,085 5,264 500 Bank of Montreal, Preferred 5%, Series 35 12,852 12,695 200 BCE Inc., Preferred 5.45%, Series AA 3,392 3,888 75 BCE Inc., Preferred 5.54%, Series AC* 1,308 1,532 1,000 BCE Inc., Preferred, Series AE 16,945 20,350 1,000 BCE Inc., Preferred, Series AJ 16,855 20,390 1,200 Brookfield Asset Management Inc., Preferred 4.75%, Series 17 27,563 26,772 1,200 Brookfield Asset Management Inc., Preferred 4.8%, Series 46 30,666 31,584 1,100 Brookfield Asset Management Inc., Preferred, Series 2 13,668 16,632 650 Brookfield Office Properties Inc., Preferred 5.1%, Series EE 16,416 16,438 300 Brookfield Office Properties Inc., Preferred 5.1%, Series R 6,562 6,684 1,550 Brookfield Office Properties Inc., Preferred 5.15%, Series P 31,433 32,318 300 Brookfield Office Properties Inc., Preferred 6%, Series CC 8,018 7,950 400 Brookfield Renewable Power Preferred Equity Inc., Preferred 5%, Series 6 8,762 9,014 1,400 Canadian Imperial Bank of Commerce, Preferred 4.4%, Series 45 35,005 35,700 50 Canadian Utilities Ltd., Preferred 4.5%, Series FF 1,311 1,313 1,350 Canadian Utilities Ltd., Preferred 4.9%, Series BB 32,372 32,616
*Denotes all or part of securities on loan. Percentages shown in brackets relate investments at fair value to net assets attributable to holders of redeemable units of the Trust.
Schedule of Investment Portfolio as at December 31, 2017 (cont’d)
No. of Shares/ Par Value Description
AverageCost ($)
FairValue ($)

– 18 –
Skylon Growth & Income Trust
Annual Financial Statements - December 31, 2017
PREFERRED SHARES (3.7%) (cont’d) 200 Canadian Utilities Ltd., Preferred 5.25%, Series EE 5,095 5,090 500 Capital Power Corp., Preferred 4.5%, Series 5 9,828 10,730 100 Capital Power Corp., Preferred 4.6%, Series 3 2,010 2,196 800 Capital Power Corp., Preferred 5.75%, Series 9 20,000 20,504 600 Capital Power Corp., Preferred 6%, Series 7 15,553 15,540 USD 9,031 Chinos Holdings Inc., Preferred 7%, Series 144A 7% 12/31/2049 4,280 4,540 1,200 Citigroup Capital XIII, Preferred 7.875% 42,301 41,441 575 Citigroup Inc., Preferred 6.875%, Series K 15,814 20,616 3 Countrywide Capital V, Preferred 7% 78 100 400 CU Inc., Preferred 4.6%, Series 1 9,002 8,720 250 E-L Financial Corp., Ltd., Preferred 4.75%, Series 2 5,801 5,631 350 E-L Financial Corp., Ltd., Preferred 5.3%, Series 1 8,745 8,787 500 Enbridge Inc., Cumulative Redeemable Preferred, Series L 15,351 15,030 300 Enbridge Inc., Preferred 4%, Series 1 9,633 9,116 1,000 Enbridge Inc., Preferred 4%, Series 3 19,282 19,750 600 Enbridge Inc., Preferred 4%, Series F 11,944 12,252 300 Enbridge Inc., Preferred 4%, Series N 6,324 6,249 50 Enbridge Inc., Preferred 4.4%, Series 11 1,025 1,052 200 Enbridge Inc., Preferred 4.4%, Series 5 6,090 5,907 800 Enbridge Inc., Preferred 5.15%, Series 17 20,000 20,536 325 Fortis Inc., Preferred 4.9% 7,720 7,816 600 Frontier Communications Corp., Preferred 11.125%, Series A 73,563 8,159 1,000 George Weston Ltd., Preferred 5.8%, Series 1 25,905 25,730 300 GMAC Capital Trust, Preferred 8.125%, Series 2 8,057 9,783 450 Great-West Lifeco Inc., Preferred 4.5%, Series I 9,983 9,932 1,700 Great-West Lifeco Inc., Preferred 5.15%, Series T 42,500 42,075 300 Great-West Lifeco Inc., Preferred 5.25%, Series S 7,592 7,575 500 Industrial Alliance Insurance and Financial Services Inc., Preferred 4.6% 11,332 11,355 500 Intact Financial Corp., Preferred 5.2%, Series 5 12,500 12,550 1,600 Kinder Morgan Canada Ltd., Preferred 5.25%, Series 1 40,000 41,200 400 Loblaw Co., Ltd., Preferred 5.3%, Series B 10,190 10,088 1,000 Manulife Financial Corp., Preferred 4.65%, Series 2, Class A 22,955 22,650 200 Manulife Financial Corp., Preferred, Series 3, Class A 4,411 4,384 2,000 Morgan Stanley, Preferred 6.875% 53,207 71,482 300 National Bank of Canada, Preferred 3.9%, Series 32 6,459 7,020 1,100 National Bank of Canada, Preferred 4.45%, Series 38 27,500 28,413 500 National Bank of Canada, Preferred 5.4%, Series 36 12,984 13,440 100 National Bank of Canada, Preferred 5.6%, Series 34 2,646 2,710 1,967 NuStar Energy L.P., Preferred 7.625%, Series B 63,249 55,990 400 Power Corp. of Canada, Non-Cumulative Preferred 5.6% 10,370 10,180 300 Power Corp. of Canada, Preferred 5%, Series D 7,276 7,250 100 Power Corp. of Canada, Preferred 5.6% 2,562 2,545 400 Power Financial Corp., Preferred 4.8%, Series S 9,442 9,212 225 Power Financial Corp., Preferred 4.95%, Series K 5,435 5,284 400 Power Financial Corp., Preferred 5.1%, Series L 9,966 9,736 2,000 Power Financial Corp., Preferred 5.15%, Series V 50,000 49,600 450 Power Financial Corp., Preferred 5.5%, Series R 11,639 11,565 350 Power Financial Corp., Preferred 5.9%, Series F 9,119 9,058 50 Royal Bank of Canada, Preferred 3.6%, Series BD 1,159 1,246 600 Royal Bank of Canada, Preferred 3.9%, Series BB 13,236 14,196 50 Royal Bank of Canada, Preferred 5%, Series AJ 1,225 1,255 600 Royal Bank of Canada, Preferred 5.25%, Series BJ 15,573 15,480 600 Royal Bank of Canada, Preferred 5.5%, Series BK 15,837 16,212 500 Sun Life Financial Inc., Preferred 3.9%, Series 10R 9,878 10,645 200 Sun Life Financial Inc., Preferred 4.25%, Series 12R 4,551 4,936 950 Sun Life Financial Inc., Preferred 4.45%, Series 4 21,256 20,558
Percentages shown in brackets relate investments at fair value to net assets attributable to holders of redeemable units of the Trust.
Schedule of Investment Portfolio as at December 31, 2017 (cont’d)
No. of Shares/ Par Value Description
AverageCost ($)
FairValue ($)

– 19 –
Skylon Growth & Income Trust
Annual Financial Statements - December 31, 2017
PREFERRED SHARES (3.7%) (cont’d) 1,125 Sun Life Financial Inc., Preferred 4.75%, Series 1, Class A 26,387 25,864 300 Sun Life Financial Inc., Preferred 4.8%, Series 2 7,112 6,975 50 Sun Life Financial Inc., Preferred, Series 8R, Class A 818 920 1,000 The Bank of Nova Scotia, Preferred 1.528%, Series 31 21,889 23,415 800 The Bank of Nova Scotia, Preferred 3.7%, Series 32 17,900 18,416 700 The Bank of Nova Scotia, Preferred 3.85%, Series 30 15,834 16,310 700 The Bank of Nova Scotia, Preferred 4.85%, Series 38 18,012 18,354 50 Toronto-Dominion Bank, Preferred 3.6%, Series 7 1,158 1,245 400 Toronto-Dominion Bank, Preferred, Series 3 8,758 9,380 600 TransAlta Corp., Preferred 5%, Series E 11,982 13,128 200 TransAlta Corp., Preferred, Series C 3,578 3,642 1,700 TransCanada Corp., Preferred 4.9%, Series 15 44,004 44,455 200 TransCanada Corp., Preferred Perpetual 4.4%, Series 5 3,161 3,440 600 Westcoast Energy Inc., Preferred 5.2%, Series 12 15,400 15,690 300 Westcoast Energy Inc., Preferred 5.5% 7,646 7,512 1,454,030 1,422,368 EXCHANGE-TRADED FUND(S) (2.2%) 5,400 SPDR Gold Trust 826,196 839,116 WARRANTS (1.0%) 100 Canadian International Oil Corp., Warrants (31Dec49) - 60 750 Data & Audio Visual Enterprises Wireless Inc., Warrants (25Sep18) - - 555 Sherritt International Corp., Warrants (29Jul21) - 641 10,229 Wells Fargo & Co., Warrants (28Oct18) 207,874 354,794 155 Xplornet Communications Inc., 144A, Warrants (20Dec18) 273 14,733 3 Xplornet Communications Inc., Warrants (20Dec18) - 114 208,147 370,342 CANADIAN GOVERNMENT BONDS (1.0%) 14,000 Government of Canada 1% 06/01/2027 12,967 12,756 91,250 Government of Canada 1% 09/01/2022* 88,056 87,736 40,000 Government of Canada 1.25% 11/01/2019 39,814 39,687 2,000 Government of Canada 1.5% 06/01/2023* 1,977 1,959 5,000 Government of Canada 1.5% 06/01/2026* 4,870 4,797 60,000 Government of Canada 2.75% 12/01/2048 67,104 66,430 136,000 Government of Canada 2.75% 12/01/2064 156,945 156,108 371,733 369,473 FOREIGN GOVERNMENT BONDS (0.9%) USD 12,000 Government of Colombia International Bond 3.875% 04/25/2027 15,215 15,352 USD 4,000 Government of Colombia International Bond 4% 02/26/2024 5,206 5,213 USD 11,000 Government of Colombia International Bond 4.375% 07/12/2021 14,688 14,577 USD 7,000 Government of Colombia International Bond 4.5% 01/28/2026 9,348 9,382 USD 1,000 Government of Hungary International Bond 5.375% 03/25/2024 1,431 1,422 USD 2,000 Government of Hungary International Bond 5.75% 11/22/2023 2,902 2,874 USD 5,000 Government of Hungary International Bond 6.375% 03/29/2021 7,065 6,975 USD 18,000 Government of Indonesia International Bond 3.75% 04/25/2022 23,367 23,299 USD 9,000 Government of Indonesia International Bond 4.35% 01/08/2027* 11,905 11,961 USD 17,000 Government of Indonesia International Bond 4.75% 01/08/2026 23,108 23,201 USD 4,000 Government of Indonesia International Bond 5.875% 01/15/2024 5,730 5,718 USD 4,000 Government of Indonesia International Bond 5.875% 03/13/2020 5,479 5,404 USD 2,000 Government of Mexico International Bond 3.6% 01/30/2025 2,570 2,547 USD 12,000 Government of Mexico International Bond 3.625% 03/15/2022 15,769 15,669 USD 29,000 Government of Mexico International Bond 4.125% 01/21/2026 38,187 37,993 USD 8,000 Government of Mexico International Bond 4.15% 03/28/2027 10,533 10,426 USD 3,000 Government of Philippines 5.5% 03/30/2026 4,510 4,451 USD 1,000 Republic of Panama International Bond 3.75% 03/16/2025 1,310 1,311 USD 2,000 Republic of Panama International Bond 3.875% 03/17/2028 2,636 2,627 USD 7,000 Republic of Panama International Bond 4% 09/22/2024 9,375 9,356
*Denotes all or part of securities on loan. Percentages shown in brackets relate investments at fair value to net assets attributable to holders of redeemable units of the Trust.
Schedule of Investment Portfolio as at December 31, 2017 (cont’d)
No. of Shares/ Par Value Description
AverageCost ($)
FairValue ($)

– 20 –
Skylon Growth & Income Trust
Annual Financial Statements - December 31, 2017
FOREIGN GOVERNMENT BONDS (0.9%) (cont’d) USD 12,000 Republic of Peru International Bond 4.125% 08/25/2027 16,537 16,385 USD 22,000 United States Treasury Inflation Indexed Bonds 0.125% 04/15/2022 28,483 27,453 USD 22,000 United States Treasury Inflation Indexed Bonds 0.12864% 07/15/2026* 29,352 27,801 USD 21,000 United States Treasury Inflation Indexed Bonds 0.1301% 04/15/2021* 28,540 27,355 USD 18,000 United States Treasury Inflation Indexed Bonds 0.375% 07/15/2027 23,104 22,500 USD 7,000 United States Treasury Inflation Indexed Bonds 0.875% 02/15/2047 9,370 9,342 USD 5,000 United States Treasury Inflation Indexed Bonds 1.04108% 02/15/2046* 7,295 6,988 353,015 347,582 REAL ESTATE INVESTMENT TRUSTS (0.1%) 16 Sovereign REIT, Preferred 12%, Series 144A 21,450 25,184 FUND(S) (0.0%) 6 Signature Cash Management Fund (Class C)† 62 62 SHORT-TERM INVESTMENTS (0.9%) 300,000 Canadian Treasury Bill 0.86512% 02/22/2018 299,496 299,496 49,000 Province of Alberta 1.06475% 02/13/2018 48,919 48,919 3,000 Province of Nova Scotia 1.07299% 02/21/2018 2,995 2,995 351,410 351,410
Commissions and Other Portfolio Transaction Costs (23,451)
Total Investment Portfolio before Derivatives Instruments (105.1%) 35,332,578 40,178,313
Foreign Currency Forward Contracts (0.2%) (see Schedule A) 83,257
Total Investments Portfolio (105.3%) 35,332,578 40,261,570
Other Net Assets (Liabilities) (-5.3%) (2,046,736)
Net Assets Attributable to Holders of Redeemable Units (100.0%) 38,214,834
Principal amounts stated in: GBP British Pound EUR European Currency USD U.S. Dollar
*Denotes all or part of securities on loan. †The Trust invests in an Underlying Fund. The Trust and the Underlying Fund are commonly managed by CI Investments Inc. Percentages shown in brackets relate investments at fair value to net assets attributable to holders of redeemable units of the Trust.
Schedule of Investment Portfolio as at December 31, 2017 (cont’d)
No. of Shares/ Par Value Description
AverageCost ($)
FairValue ($)

– 21 –
Skylon Growth & Income Trust
Annual Financial Statements - December 31, 2017
‡ Credit ratings are obtained from S&P Global Ratings, where available, otherwise ratings are obtained from: Moody’s Investors Service or Dominion Bond Rating Service. Percentages shown in brackets relate investments at fair value to net assets attributable to holders of redeemable units of the Trust.
Schedule of Investment Portfolio as at December 31, 2017 (cont’d)
Schedule AForeign Currency Forward Contracts (0.2%)
Contracts CounterpartyCredit Rating of
the Counterparty‡Settlement
DateContracts
Rate Pay ReceiveUnrealized
Gain (Loss) ($)1 Bank of Montreal A-1 26-Mar-18 1.73 (203,892) British Pound 352,609 Canadian $ 6,075 1 Bank of Montreal A-1 26-Mar-18 0.01 (48,035,000) Japanese Yen 547,142 Canadian $ 9,545 1 Bank of Montreal A-1 16-Jan-18 0.80 (129,754) US $ 162,517 Canadian $ (493)1 Bank of Montreal A-1 16-Jan-18 1.29 (130,290) US $ 167,787 Canadian $ 4,100 1 Bank of Montreal A-1 14-Feb-18 1.27 (182,716) US $ 231,449 Canadian $ 1,989 1 Bank of Montreal A-1 14-Feb-18 1.27 (202,474) US $ 258,074 Canadian $ 3,798 1 Canadian Imperial Bank of Commerce A-1 16-Jan-18 0.80 (138,036) US $ 172,876 Canadian $ (539)1 Canadian Imperial Bank of Commerce A-1 14-Feb-18 1.28 (217,286) US $ 277,300 Canadian $ 4,423 1 Canadian Imperial Bank of Commerce A-1 12-Mar-18 1.26 (245,860) US $ 310,578 Canadian $ 1,911 1 Citigroup Inc. A-2 26-Mar-18 1.52 (181,688) Euro 276,019 Canadian $ 943 1 Citigroup Inc. A-2 26-Mar-18 0.95 (157,000) Singaporean $ 149,259 Canadian $ 1,699 1 Citigroup Inc. A-2 16-Jan-18 0.80 (138,036) US $ 172,862 Canadian $ (553)1 Citigroup Inc. A-2 14-Feb-18 1.27 (163,906) US $ 207,621 Canadian $ 1,784 1 Citigroup Inc. A-2 14-Feb-18 1.27 (204,519) US $ 260,541 Canadian $ 3,698 1 Citigroup Inc. A-2 16-Jan-18 1.29 (260,580) US $ 335,750 Canadian $ 8,374 1 HSBC Holdings PLC A-1 16-Jan-18 0.80 (138,036) US $ 173,097 Canadian $ (318)1 HSBC Holdings PLC A-1 12-Mar-18 1.26 (196,688) US $ 248,695 Canadian $ 1,762 1 JPMorgan Chase & Co. A-2 26-Mar-18 1.73 (204,108) British Pound 352,815 Canadian $ 5,915 1 JPMorgan Chase & Co. A-2 16-Jan-18 1.29 (130,290) US $ 167,902 Canadian $ 4,215 1 JPMorgan Chase & Co. A-2 14-Feb-18 1.27 (204,520) US $ 260,621 Canadian $ 3,777 1 JPMorgan Chase & Co. A-2 12-Mar-18 1.26 (245,860) US $ 310,521 Canadian $ 1,855 1 JPMorgan Chase & Co. A-2 16-Jan-18 0.80 (99,867) US $ 124,944 Canadian $ (519)1 Morgan Stanley A-2 16-Jan-18 0.80 (110,494) US $ 138,228 Canadian $ (586)1 Morgan Stanley A-2 14-Feb-18 1.27 (204,520) US $ 260,618 Canadian $ 3,773 1 Morgan Stanley A-2 12-Mar-18 1.26 (245,860) US $ 310,533 Canadian $ 1,867 1 Morgan Stanley A-2 16-Jan-18 1.29 (34,744) US $ 44,694 Canadian $ 1,044 1 Royal Bank of Canada A-1+ 26-Mar-18 1.30 (20,761) Canadian $ 16,000 Swiss Franc (14)1 Royal Bank of Canada A-1+ 14-Feb-18 1.27 (379,755) Canadian $ 299,000 US $ (4,261)1 Royal Bank of Canada A-1+ 26-Mar-18 0.16 (260,000) Hong Kong Dollars 42,818 Canadian $ 968 1 Royal Bank of Canada A-1+ 26-Mar-18 1.31 (288,000) Swiss Franc 376,094 Canadian $ 2,639 1 Royal Bank of Canada A-1+ 16-Jan-18 0.80 (165,741) US $ 207,441 Canadian $ (779)1 Royal Bank of Canada A-1+ 16-Jan-18 1.29 (129,518) US $ 166,738 Canadian $ 4,020 1 Royal Bank of Canada A-1+ 14-Feb-18 1.27 (204,520) US $ 260,558 Canadian $ 3,714 1 Royal Bank of Canada A-1+ 12-Mar-18 1.26 (291,324) US $ 368,521 Canadian $ 2,775 1 The Bank of Nova Scotia A-1 26-Mar-18 1.52 (177,312) Euro 269,380 Canadian $ 930 1 The Bank of Nova Scotia A-1 16-Jan-18 0.80 (138,036) US $ 172,998 Canadian $ (417)1 The Bank of Nova Scotia A-1 14-Feb-18 1.28 (204,520) US $ 260,988 Canadian $ 4,143Total Foreign Currency Forward Contracts Value 83,257

– 22 –
Skylon Growth & Income Trust
Annual Financial Statements - December 31, 2017
Financial Instruments by Category (Note 2)
The following tables present the carrying amounts of the Trust’s financial instruments by category:
as at December 31, 2017
Held forTrading
Financial Assets/Liabilities as FVTPL
Designated at Inception Total
Financial Assets/Liabilities at
Amortized Cost Total
(in $000’s) (in $000’s) (in $000’s) (in $000’s) (in $000’s)
370 39,808 40,178 - 40,178 - - - 1,962 1,962
91 - 91 - 91 - - - - - - - - - - - - - - - - - - 46 46 - - - - - - - - 98 98 - - - - - - - - 8 8 - - - - - 461 39,808 40,269 2,114 42,383 - - - - - - - - - -
8 - 8 - 8 - - - - - - - - - - - - - - - - - - - - - - - 109 109 - - - 3,280 3,280 - - - 725 725 - - - - - - - - - - - - - 46 46 8 - 8 4,160 4,168
The accompanying notes are an integral part of these financial statements.
AssetsInvestmentsCashUnrealized gain on futures and foreign currency forward contractsSwaps, swaptions and optionsCash collateral received for securities on loanMargin for short salesDividends receivableReceivable for distribution from investmentsInterest receivableSecurities lending revenue receivableReceivable for investments soldReceivable for unit subscriptions LiabilitiesInvestments sold shortBank overdraftUnrealized loss on futures and foreign currency forward contractsSwaps, swaptions and optionsDividends payable on investments sold shortInterest payable on investments sold shortPayable for cash collateral under securities lending Payable for investments purchasedPayable for unit redemptionsDistributions payable to holders of redeemable unitsManagement fees payableAdministration fees payable Service fees payable
Trust Specific Notes to Financial Statements

– 23 –
Skylon Growth & Income Trust
Annual Financial Statements - December 31, 2017
as at December 31, 2016
Held forTrading
Financial Assets/Liabilities as FVTPL
Designated at Inception Total
Financial Assets/Liabilities at
Amortized Cost Total
(in $000’s) (in $000’s) (in $000’s) (in $000’s) (in $000’s)
371 42,138 42,509 - 42,509 - - - 3,595 3,595
50 - 50 - 50 - - - - - - - - - - - - - - - - - - 39 39 - - - - - - - - 161 161 - - - - - - - - 193 193 - - - - - 421 42,138 42,559 3,988 46,547 - - - - - - - - - -
106 - 106 - 106 13 - 13 - 13 - - - - - - - - - - - - - - - - - - 315 315 - - - 4,606 4,606 - - - 325 325 - - - - - - - - - - - - - 49 49 119 - 119 5,295 5,414
The accompanying notes are an integral part of these financial statements.
AssetsInvestmentsCashUnrealized gain on futures and foreign currency forward contractsSwaps, swaptions and optionsCash collateral received for securities on loanMargin for short salesDividends receivableReceivable for distribution from investments Interest receivableSecurities lending revenue receivableReceivable for investments soldReceivable for unit subscriptions LiabilitiesInvestments sold shortBank overdraftUnrealized loss on futures and foreign currency forward contractsSwaps, swaptions and optionsDividends payable on investments sold shortInterest payable on investments sold shortPayable for cash collateral under securities lending Payable for investments purchasedPayable for unit redemptionsDistributions payable to holders of redeemable unitsManagement fees payableAdministration fees payable Service fees payable
Financial Instruments by Category (Note 2) (cont’d)
Trust Specific Notes to Financial Statements

– 24 –
Skylon Growth & Income Trust
Annual Financial Statements - December 31, 2017
Net Gain (Loss) on Financial Instruments (Note 2) for the years ended December 31 (in $000’s)
The following table presents the net gain (loss) on financial instruments at FVTPL by category.
2017 2016Financial Instruments at FVTPLHeld for trading 366 92 Designated at fair value through profit or loss 4,726 4,710 Total 5,092 4,802
Offsetting of Financial Instruments (Note 2)
The following tables show the net impact on the Trust’s Statements of Financial Position if all rights to offset were exercised.
as at December 31, 2017
Amounts Eligible for Offset
Gross Assets/(Liabilities)
FinancialInstruments
CollateralReceived/(Paid)
NetExposure
(in $000’s) (in $000’s) (in $000’s) (in $000’s)Derivative assets - Foreign currency forward contracts 91 (8) - 83 Derivative assets - Swaps and swaptions - - - - Total 91 (8) - 83 Derivative liabilities - Foreign currency forward contracts (8) 8 - - Derivative liabilities - Swaps and swaptions - - - - Total (8) 8 - -
as at December 31, 2016
Amounts Eligible for Offset
Gross Assets/(Liabilities)
FinancialInstruments
CollateralReceived/(Paid)
NetExposure
(in $000’s) (in $000’s) (in $000’s) (in $000’s)Derivative assets - Foreign currency forward contracts 50 (42) - 8 Derivative assets - Swaps and swaptions - - - - Total 50 (42) - 8 Derivative liabilities - Foreign currency forward contracts (106) 42 - (64) Derivative liabilities - Swaps and swaptions - - - - Total (106) 42 - (64)
The accompanying notes are an integral part of these financial statements.
Trust Specific Notes to Financial Statements

– 25 –
Skylon Growth & Income Trust
Annual Financial Statements - December 31, 2017
Commissions (Note 2) for the years ended December 31 (in $000’s)
2017 2016Brokerage commissions 34 38Soft dollar commissions† 6 8
Redeemable Unit Transactions (Note 4)for the years ended December 31
2017 2016Class A Number of redeemable units at the beginning of year 5,009,863 5,573,555Redeemable units issued for cash - - Redeemable units issued for reinvested distributions 24,036 26,303 Redeemable units redeemed (398,172) (561,775) Redeemable units purchased for cancellation (Note 6) - (28,220) Number of redeemable units at the end of year 4,635,727 5,009,863
Securities Lending (Note 7) as at December 31 (in $000’s)
2017 2016Loaned 1,872 1,800Collateral (non-cash) 1,910 1,893
†A portion of brokerage commissions paid was used to cover research and market data services, termed soft dollar commissions. This amount has been estimated by the Manager of the Trust. The accompanying notes are an integral part of these financial statements.
Trust Specific Notes to Financial Statements
Interest in Non-Consolidated Structured Entities (Note 2)
The following tables present the Trust’s interest in Non-Consolidated Structured Entities.
as at December 31, 2017
Fair Value ofthe Underlying Funds / ETFs
Fair Value of the Trust’s Investmentin the Underlying Funds / ETFs
Ownership in theUnderlying Funds / ETFs
Non-Consolidated Structured Entities (in $000’s) (in $000’s) (%)SPDR Gold Trust 43,991,727 839 -Signature Cash Management Fund (Class C) 4,309 - -
as at December 31, 2016
Fair Value ofthe Underlying Funds / ETFs
Fair Value of the Trust’s Investmentin the Underlying Funds / ETFs
Ownership in theUnderlying Funds / ETFs
Non-Consolidated Structured Entities (in $000’s) (in $000’s) (%)Signature Cash Management Fund (Class C) 10,127 - -

– 26 –
Skylon Growth & Income Trust
Annual Financial Statements - December 31, 2017
Related Party Investments (Note 9) as at December 31, 2017
Fair ValueInvestments (in $000’s)Signature Cash Management Fund (Class C) -
as at December 31, 2016
Fair ValueInvestments (in $000’s)Signature Cash Management Fund (Class C) -
The accompanying notes are an integral part of these financial statements.
Trust Specific Notes to Financial Statements
Securities Lending Revenue Reconciliation (Note 7)for the years ended December 31 (in $000’s)
2017 2016Gross securities lending revenue 7 14 Charges (1) (3) Securities lending revenue 6 11 % of gross securities lending revenue 14.3 21.4
Loss Carry Forwards (Note 8) as at December 31 (in $000’s)
2017Net capital loss carried forward: -Non-capital losses expiring:2027 -2028 -2029 -2030 -2031 -2032 -2033 -2034 -2035 -2036 -2037 -Total -

– 27 –
Skylon Growth & Income Trust
Annual Financial Statements - December 31, 2017
Financial Instruments Risks (Note 11)
Concentration RiskFor Concentration Risk as at December 31, 2017, refer to the Schedule of Investment Portfolio.
The Trust’s investments were concentrated in the following segments:
as at December 31, 2016
Categories Net Assets (%)LONG POSITIONS:Common Equities 63.3 Corporate Bonds 24.1 Provincial Bonds 8.6 Foreign Government Bonds 2.1 Preferred Shares 2.0 REITS 1.3 Canadian Government Bonds 1.0 Warrants 0.9 Funds 0.0 Foreign Currency Forward Contracts (0.1)Other Net Assets (Liabilities) (3.2)Total Long Positions 100.0
SHORT POSITIONS:Option Contracts 0.0Total Short Positions 0.0
Credit Risk The Trust was invested in fixed income securities, preferred securities and derivative instruments, if any, with the following credit ratings, as per the tables below.
as at December 31, 2017
Credit Rating^* Net Assets (%)AAA/Aaa/A++ 2.8 AA/Aa/A+ 3.9 A 7.7 BBB/Baa/B++ 6.3 BB/Ba/B+ 5.3 B 3.3 CCC/Caa/C++ 1.3 CC/Ca/C+ 0.1 Not Rated 0.9 Total 31.6
The accompanying notes are an integral part of these financial statements.
Trust Specific Notes to Financial Statements

– 28 –
Skylon Growth & Income Trust
Annual Financial Statements - December 31, 2017
Credit Risk (cont’d)
as at December 31, 2016
Credit Rating^* Net Assets (%)AAA/Aaa/A++ 3.1 AA/Aa/A+ 1.3 A 10.4 BBB/Baa/B++ 6.8 BB/Ba/B+ 8.2 B 5.9 CCC/Caa/C++ 1.9 Not Rated 1.3 Total 38.9
^Credit ratings are obtained from S&P Global Ratings, where available, otherwise ratings are obtained from: Moody’s Investors Service or Dominion Bond Rating Service, respectively.*Refer to Note 11 for Credit Rating Chart reference.
Other Price RiskAs at December 31, 2017 and 2016, the Trust was exposed to other price risk as its holdings were sensitive to changes in general economic conditions across the world. The Trust’s portfolio consisted of international stocks and fixed income securities, thus an overall downturn in economic conditions across the world could have led to a widening in credit spreads and a decrease in equity prices which could have then led to a decrease in the value of the Trust’s holdings.
As at December 31, 2017, had the equities in the investment portfolio increased or decreased by 10% (December 31, 2016 - 10%), with all other variables held constant, net assets attributable to holders of redeemable units of the Trust would have increased or decreased, respectively, by approximately $2,961,000 (December 31, 2016 - $2,741,000). In practice, actual results may differ from this analysis and the difference may be material.
Currency RiskThe tables below summarize the Trust’s exposure to currency risk.
as at December 31, 2017~
Currency
Financial Instruments Exposure Derivatives Net Exposure Net Assets
(in $000’s) (in $000’s) (in $000’s) (%)U.S. Dollar 14,533 (5,604) 8,929 23.4 British Pound 1,379 (692) 687 1.8 Korean Won 630 - 630 1.6 Japanese Yen 1,120 (536) 584 1.5 Euro 1,095 (541) 554 1.4 Swedish Krona 457 - 457 1.2 Swiss Franc 710 (351) 359 0.9 Singapore Dollar 303 (148) 155 0.4 Indian Rupee 144 - 144 0.4 Indonesian Rupiah 84 - 84 0.2 Danish Krone 73 - 73 0.2 Hong Kong Dollar 85 (42) 43 0.1 Total 20,613 (7,914) 12,699 33.1
The accompanying notes are an integral part of these financial statements.
Trust Specific Notes to Financial Statements

– 29 –
Skylon Growth & Income Trust
Annual Financial Statements - December 31, 2017
Currency Risk (cont’d)
as at December 31, 2016~
Currency
Financial Instruments Exposure Derivatives Net Exposure Net Assets
(in $000’s) (in $000’s) (in $000’s) (%)U.S. Dollar 20,504 (7,013) 13,491 32.8 British Pound 1,025 (516) 509 1.2 Swiss Franc 886 (436) 450 1.1 Korean Won 421 - 421 1.0 Japanese Yen 787 (381) 406 1.0 Euro 624 (315) 309 0.8 Swedish Krona 140 - 140 0.3 Singapore Dollar 282 (145) 137 0.3 Hong Kong Dollar 117 - 117 0.3 Indian Rupee 71 - 71 0.2 Australian Dollar 162 (92) 70 0.2 Indonesian Rupiah 48 - 48 0.1 Total 25,067 (8,898) 16,169 39.3
~Includes monetary and non-monetary instruments.
As at December 31, 2017, had the Canadian dollar strengthened or weakened by 10% (December 31, 2016 - 10%) in relation to all other foreign currencies held in the Trust, with all other variables held constant, net assets attributable to holders of redeemable units of the Trust would have decreased or increased, respectively, by approximately $1,270,000 (December 31, 2016 - $1,617,000). In practice, the actual results may differ from this analysis and the difference may be material.
Interest Rate Risk The tables below summarize the Trust’s exposure to interest rate risk, categorized by the contractual maturity date.
as at December 31, 2017
Less than1 Year
1 - 3Years
3 - 5Years
Greaterthan
5 Years Total
(in $000’s) (in $000’s) (in $000’s) (in $000’s) (in $000’s)Interest Rate Exposure 2,413 836 1,705 7,573 12,527
as at December 31, 2016
Less than1 Year
1 - 3Years
3 - 5Years
Greaterthan
5 Years Total
(in $000’s) (in $000’s) (in $000’s) (in $000’s) (in $000’s)Interest Rate Exposure 3,752 1,163 3,540 10,238 18,693
As at December 31, 2017, had the prevailing interest rates increased or decreased by 0.25% (December 31, 2016 - 0.25%), with all other variables held constant, net assets attributable to holders of redeemable units of the Trust would have indirectly decreased or increased, respectively, by approximately $167,000 (December 31, 2016 - $218,000). In practice, the actual results may differ from this analysis and the difference may be material.
Trust Specific Notes to Financial Statements
The accompanying notes are an integral part of these financial statements.

– 30 –
Skylon Growth & Income Trust
Annual Financial Statements - December 31, 2017
Fair Value Hierarchy
The tables below summarize the inputs used by the Trust in valuing the Trust’s investments and derivatives carried at fair value.
Long Positions at fair value as at December 31, 2017
Level 1 Level 2 Level 3 Total
(in $000’s) (in $000’s) (in $000’s) (in $000’s)Equities 28,183 221 - 28,404 Bonds - 10,214 - 10,214 Exchange-traded Fund(s) 839 - - 839 Fund(s) - - - - Short-term investments - 351 - 351 Warrants 355 - 15 370 Foreign currency forward contracts, net - 83 - 83 Total 29,377 10,869 15 40,261
There were no transfers between Level 1 and Lavel 2 and Level 1 and Level 3 during the years ended December 31, 2017.
Long Positions at fair value as at December 31, 2016
Level 1 Level 2 Level 3 Total
(in $000’s) (in $000’s) (in $000’s) (in $000’s)Equities 26,805 235 - 27,040 Bonds - 15,019 79 15,098 Fund(s) - - - -Warrants 359 - 12 371 Foreign currency forward contracts, net - (56) - (56)Total 27,164 15,198 91 42,453
Short Positions at fair value as at December 31, 2016
Level 1 Level 2 Level 3 Total
(in $000’s) (in $000’s) (in $000’s) (in $000’s)Options (13) - - (13)Total (13) - - (13)
There were no transfers between Level 1, 2 and 3 during the year ended December 31, 2016.
Level 3 ReconciliationThe tables below summarize the movement in Level 3 financial instruments at fair value using unobservable inputs.
for the year ended December 31, 2017
Balance atDec. 31, 2016 Purchases Sales
TransfersIn
Transfers(Out)
Realized Gain(Loss)
Unrealized Gain(Loss)*
Balance atDec. 31, 2017
(in $000’s) (in $000’s) (in $000’s) (in $000’s) (in $000’s) (in $000’s) (in $000’s) (in $000’s)Long Positions/Assets:Bonds 79 - (2) - (81) - 4 - Warrants 12 - - - - - 3 15 Total 91 - (2) - (81) - 7 15
*Change in unrealized gain (loss) related to investments held at December 31, 2017 was $2,851.
During the year ended December 31, 2017, investments with a fair value of $81,000 were transferred out of Level 3 into Level 2 as observable market inputs became available for these investments.
Trust Specific Notes to Financial Statements
The accompanying notes are an integral part of these financial statements.

– 31 –
Skylon Growth & Income Trust
Annual Financial Statements - December 31, 2017
Level 3 Reconciliation (cont’d)
for the year ended December 31, 2016
Balance atDec. 31, 2015 Purchases Sales
TransfersIn
Transfers(Out)
Realized Gain(Loss)
Unrealized Gain(Loss)**
Balance atDec. 31, 2016
(in $000’s) (in $000’s) (in $000’s) (in $000’s) (in $000’s) (in $000’s) (in $000’s) (in $000’s)Long Positions/Assets:Bonds 90 48 (79) - - 1 19 79 Warrants - - - - - - 12 12 Total 90 48 (79) - - 1 31 91
**Change in unrealized gain (loss) related to investments held at December 31, 2016 was $26,508.
Investments classified as Level 3 are valued at fair value based on unobservable inputs and assumptions, which may include credit spreads, industry multipliers, and discount rates. Management has assessed that the effect of changing these inputs to reasonably possible alternatives would not have a significant impact on the net assets attributable to holders of redeemable units of the Trust in as at December 31, 2017 and 2016.
Trust Specific Notes to Financial Statements
The accompanying notes are an integral part of these financial statements.

– 32 –
Skylon Growth & Income Trust
Annual Financial Statements - December 31, 2017
1. THE TRUST Skylon Growth & Income Trust (the “Trust”) is a closed-end investment trust established under the laws of the Province of Ontario pursuant to a Declaration of Trust dated as of January 30, 2004. On February 18, 2004, the Trust completed an initial public offering of 19,500,000 units at $10 per unit. The Trust is listed on The Toronto Stock Exchange (“TSX”), under the symbol SKG.UN. On March 3, 2004, an over-allotment option granted to agents was exercised for further issuance of 1,030,000 units at $10 per unit. The Trust is managed by CI Investments Inc. (the “Manager” and the “Trustee”). Signature Global Asset Management, a division of CI Investments Inc. is the investment advisor (the “Investment Advisor”) to the Trust.
The Trust’s investment objectives are to: i. provide unitholders with monthly distributions; ii. endeavour to preserve capital throughout the life of the Trust; and iii. enhance the long-term total return of the Trust’s portfolio.
The address of the Trust’s registered office is 2 Queen Street East, Twentieth Floor, Toronto, Ontario, M5C 3G7. These financial statements are authorized for issue by the Manager on March 29, 2018. CI Investments Inc. is a subsidiary of CI Financial Corp. RBC Investor Services Trust is the custodian (the “Custodian”) of the Trust.
2. SUMMARY OF SIGNIFICANT ACCOUNTING POLICIESThese financial statements have been prepared in accordance with International Financial Reporting Standards (“IFRS”) as published by the International Accounting Standards Board (“IASB”). The following is a summary of the significant accounting policies of the Trust:
a. Classification and recognition of financial instrumentsThe Trust recognizes financial instruments at fair value upon initial recognition, inclusive of transaction costs in the case of financial instruments measured at amortized cost. Purchases and sales of financial assets are recognized at their trade date. The Trust’s investments and derivative assets and liabilities are measured at fair value through profit or loss (“FVTPL”). The Trust’s obligations for net assets attributable to holders of redeemable units are presented at the redemption amount, which approximates their fair value. All other financial assets and liabilities are measured at amortized cost, which approximates their fair value. Under this method, financial assets and liabilities reflect the amount required to be received or paid, discounted, when appropriate, at the effective rate of interest.
Financial assets and liabilities are offset and the net amount is presented in the Statements of Financial Position when, and only when, the Trust has a legal right to offset the amounts and intend either to settle on a net basis or to realize the asset and settle the liability simultaneously. In the normal course of business, the Trust enters into various master netting agreements or similar agreements that do not meet the criteria for offsetting in the Statements of Financial Position, but still allow for the related amounts to be offset in certain circumstances, such as bankruptcy or termination of the contracts.
b. Fair valuation of financial investmentsAt the financial reporting date, listed securities are valued based on the last traded market price for financial assets and financial liabilities where the last traded price falls within the day’s bid-ask spread. In circumstances where the last traded price is not within the bid-ask spread, the Manager determines the point within the bid-ask spread that is most representative of fair value based on the existing market conditions. Unlisted securities are valued based on price quotations from recognized investment dealers, or failing that, their fair value is determined by the Manager on the basis of the latest reported information available. Unlisted warrants, if any, are valued based on a pricing model which considers factors such as the market value of the underlying security, strike price, and terms of the warrant. Fixed income securities, debentures and other debt instruments, including short-term investments, are valued at the quotation from recognized investment dealers. Underlying funds are valued on each business day at their net asset value as reported by the underlying funds’ manager.
The fair value of private placements and other securities where there are significant unobservable inputs is determined by using valuation models that may be based, in part, on assumptions that are not supported by observable market inputs. These methods and procedures may include, but are not limited to, performing comparisons with prices of comparable or similar securities, obtaining valuation related information from issuers and/or other analytical data relating to the investment and using other available indications of value. These values are independently assessed by the Manager to ensure that they are reasonable. However, because of the inherent uncertainty of valuation, the estimated fair values for these securities may be materially different from the values that would have been used had a ready market for the investment existed. The fair values of private placements are affected by the perceived credit risks of the issuer, predictability of cash flows and the length of time to maturity.
Notes to the Financial Statements

– 33 –
Skylon Growth & Income Trust
Annual Financial Statements - December 31, 2017
c. Financial assets and liabilities at fair valueThe Trust classifies its investments in equity, fixed income securities and derivatives as financial assets or financial liabilities at fair value through profit or loss.
This category has two sub-categories: financial assets or financial liabilities held for trading and those designated at fair value through profit or loss at inception.
Financial assets or financial liabilities held for trading A financial asset or financial liability is classified as held for trading (“HFT”) if it is acquired or incurred principally for the purpose of selling or
repurchasing in the near term or if on initial recognition is part of a portfolio of identifiable financial investments that are managed together and for which there is evidence of a recent actual pattern of short-term profit taking. The Trust’s derivative instruments, warrants and securities sold short are categorized as HFT.
Financial assets or financial liabilities designated at fair value through profit or loss at inception Financial assets and financial liabilities designated at fair value through profit or loss at inception are financial instruments that are not classified as HFT
but are managed, and their performance is evaluated on a fair value basis in accordance with the Trust’s documented investment strategy. The Trust’s investments excluding derivative instruments, warrants and securities sold short are designated as FVTPL.
d. CashCash is comprised of cash on deposit.
e. Cost of investmentsCost of investments represents the amount paid for each security and is determined on an average cost basis excluding commissions and transaction costs. Average cost does not include amortization of premiums or discounts on fixed income securities with the exception of zero coupon bonds.
f. Investment transactions and income recognitionInvestment transactions are recorded on the trade date – the date on which the Trust commits to purchase or sell the investment. The “Interest for distribution purposes” shown on the Statements of Comprehensive Income represents the coupon interest received by the Trust and is accounted for on an accrual basis. The Trust does not amortize premiums paid or discounts received on the purchase of fixed income securities except for zero coupon bonds, which are amortized on a straight line basis.
Dividends and distributions from investments are recognized on the ex-dividend/ex-distribution date.
Distributions received from income trusts and underlying funds holdings are recorded as income, capital gains or a return of capital, based on the best information available to the Manager. Due to the nature of these investments, actual allocations could vary from this information. Distributions from income trusts or underlying funds that are treated as a return of capital for income tax purposes reduce the average cost of the income trusts and underlying funds.
Commitment fee income is accounted for on an accrual basis on the term of the commitment.
g. Foreign exchangeThe Trust’s functional and presentation currency is Canadian dollar. Foreign currency amounts are translated into the functional currency as follows: fair value of investments, foreign currency forward contracts and other assets and liabilities at the closing rate of exchange on each business day; income and expenses, purchases and sales and settlements of investments at the rate of exchange prevailing on the respective dates of such transactions. Foreign exchange gains (losses) relating to cash are presented as “Foreign exchange gain (loss) on cash” and those relating to other financial assets and liabilities are presented within “Net realized gain (loss) on sale of investments and derivatives” and “Change in unrealized appreciation (depreciation) in value of investments and derivatives” in the Statements of Comprehensive Income.
h. Unit valuationNet asset value (“NAV”) per unit is calculated at the end of each day on which the Toronto Stock Exchange is open for business by dividing the total NAV by outstanding units.
Notes to the Financial Statements (cont’d)

– 34 –
Skylon Growth & Income Trust
Annual Financial Statements - December 31, 2017
As at December 31, 2017 and 2016, there were no differences between the NAV used for transactions with unitholders and the net assets attributable to holders of redeemable units used for reporting purposes under IFRS.
i. Classification of unitsThe units of the Trust have been classified as liabilities, because the Trust has a fixed termination date. On April 13, 2009, the Declaration of Trust was amended to extend the termination date of the Trust to June 30, 2019 (“Termination Date”), and provide the Trustee the discretion to terminate the Trust if it believes the net asset value (“NAV”) of the Trust falls to a level that is not beneficial to unitholders.
j. Commissions and other portfolio transaction costsTransaction costs, such as brokerage commissions, incurred in the purchase and sale of securities, are included in “Commissions and other portfolio transaction costs” in the Statements of Comprehensive Income.
k. Increase (decrease) in net assets attributable to holders of redeemable units per unit“Increase (decrease) in net assets attributable to holders of redeemable units per unit” in the Statements of Comprehensive Income is calculated by dividing the increase (decrease) in net assets attributable to holders of redeemable units by the weighted average number of units outstanding during the year.
l. Foreign currency forward contractsThe Trust may, from time to time, enter into foreign currency forward contracts. Foreign currency forward contracts are valued on each valuation day, based on the difference between the contract rate and the current forward rate at the measurement date applied to the contract’s notional amount and adjusted for counterparty risk. All unrealized gains (losses) arising from foreign currency forward contracts are recorded as part of “Change in unrealized appreciation (depreciation) in value of investments and derivatives” in the Statements of Comprehensive Income and “Unrealized gain (loss) on futures and foreign currency forward contracts” in the Statements of Financial Position until the contracts are closed out or expire, at which time the gains (losses) are realized and reported as “Net realized gain (loss) on sale of investments and derivatives” in the Statements of Comprehensive Income.
m. Options contractsOver-the-counter (“OTC”) options are valued using the Black Scholes model, whereas, exchange traded options are valued at last traded price taken from the exchange. Options contracts are valued each valuation day according to the gain or loss that would be realized if the contracts were closed out. All unrealized gains (losses) arising from option contracts are recorded as part of “Change in unrealized appreciation (depreciation) in value of investments and derivatives” in the Statements of Comprehensive Income until the contracts are closed out or expire, at which time the gains (losses) are realized and reflected in the Statements of Comprehensive Income in “Net realized gain (loss) on sale of investments and derivatives”.
n. Offsetting of financial instrumentsThe disclosures set out in the Offsetting of Financial Instruments tables in the Trust Specific Notes to Financial Statements include foreign currency forward contracts assets and liabilities that are subject to an enforceable master netting arrangement. Transactions with individual counterparties are governed by separate master netting agreements. Each agreement allows for net settlement of certain open contracts where the Trust and respective counterparty both elect to settle on a net basis. In the absence of such an election, contracts will be settled on a gross basis. However, each party to the master netting agreement will have the option to settle all open contracts on a net basis in the event of default of the other party.
International Swaps and Derivatives Association Inc. Master Agreements (“ISDA Master Agreements”) govern over-the-counter (“OTC”) financial derivative transactions entered into by the Trust and select counterparties. The ISDA Master Agreements maintain provisions for general obligations, representations, agreements, collateral and events of default or termination. Events of termination include conditions that may entitle counterparties to elect to terminate early and cause settlement of all outstanding transactions under the applicable ISDA Master Agreement. Any election to terminate early could be material to the financial statements. The fair value of OTC financial derivative transactions net of collateral received in or pledged by a counterparty as at year end is disclosed in the Trust Specific Notes to Financial Statements.
The Trust may be subject to various Master Agreements or netting arrangements, with select counterparties. These Master Agreements reduce the counterparty risk associated with relevant transactions by specifying credit protection mechanisms and providing standardization that improves legal certainty. Since different types of transactions have different mechanics and are sometimes traded out to different legal entities of a particular counterparty organization, each type of transaction may be covered by a different Master Agreement resulting in the need for multiple agreements with a single counterparty. As the Master Agreements are specific to unique operations of different asset types, they allow the Trust to close out and net its total exposure to a counterparty in the event of a default with respect to the transactions governed under a single agreement with a counterparty.
Notes to the Financial Statements (cont’d)
– 35 –
Skylon Growth & Income Trust
Annual Financial Statements - December 31, 2017
o. Investments in associates, joint ventures, subsidiaries and structured entitiesSubsidiaries are entities, including investments in other investment entities, over which a Trust has control. A Trust controls an entity when it is exposed to, or has rights to, variable returns from its involvement with the entity, and has the ability to affect those returns through its power over the entity. Associates and joint ventures are investments over which a Trust has significant influence or joint control. A structured entity is an entity that has been designed so that voting or similar rights are not the dominant factors in deciding, who controls the entity, or when voting rights relate to administrative tasks only and the relevant activities are directed by means of contractual arrangements.
The Manager has determined that underlying funds held typically by the Trust meet the definition of structured entities. The Trust accounts for its investments in unconsolidated structured entities at fair value through profit or loss.
The Trust may, from time to time, invest in underlying funds and as a result the Trust maybe subject to the terms and conditions of the respective underlying funds’ offering documents and are susceptible to market price risk arising from uncertainties about future values of those underlying funds. All of the underlying funds in the investment portfolio are managed by portfolio managers who are compensated by the respective underlying funds for their services. Such compensation generally consists of an asset-based fee and is reflected in the valuation of each of the underlying funds, except when the Trust invests in certain classes of the underlying funds where the compensation to portfolio managers is negotiated and paid outside each of the underlying funds. The underlying funds finance their operations by issuing redeemable units that entitle the holders to an equal beneficial interest in the underlying funds. The Trust can redeem its investments in the underlying funds on a daily basis. These investments are included in “Investments” at fair value through profit or loss in the Statements of Financial Position. The Trust’s maximum exposure to loss from its interest in underlying funds is equal to the total fair value of its investments in underlying funds.
Information related to Interest in Non-Consolidated Structured Entities for the Trust appears under the Trust Specific Notes to Financial Statements.
p. Withholding taxesThe Trust may, from time to time, incur withholding taxes imposed by certain countries on investment income and capital gains. Such income and gains are recorded on a gross basis and the related withholding taxes are shown separately in the Statements of Comprehensive Income.
q. Harmonized sales taxCertain provinces including Ontario, Prince Edward Island, Nova Scotia, New Brunswick and Newfoundland and Labrador (each a Participating Tax Jurisdiction) have harmonized their provincial sales tax (“PST”) with the federal goods and services tax (“GST”). The Harmonized Sales Tax (“HST”) combines the federal GST rate of 5% with the PST rate of the participating province. The province of Quebec also applies the Quebec sales tax (“QST”) of 9.975%. The Provincial HST liability or refund is calculated using the residency of unitholders and the value of their interest in the Trust as at specific times, rather than the physical location of the Trust. The effective sales tax rate charged to the Trust is based on the unitholders’ proportionate investments by province, using each province’s HST rate, GST rate in the case of non-participating provinces and/or QST rate. All amounts are presented as “Harmonized sales tax” in the Statements of Comprehensive Income.
r. Accounting standards issued but not yet adoptedIFRS 9, Financial InstrumentsThe final version of IFRS 9, Financial Instruments, was issued by the IASB in July 2014 and will replace IAS 39 Financial Instruments: Recognition and Measurement. IFRS 9 introduces a model for classification and measurement, a single, forward-looking ‘expected loss’ impairment model and a substantially reformed approach to hedge accounting. The new single, principle based approach for determining the classification of financial assets is driven by cash flow characteristics and the business model in which an asset is held. The new model also results in a single impairment model being applied to all financial instruments, which will require more timely recognition of expected credit losses. It also includes changes in respect of the entity’s own credit risk in measuring liabilities elected to be measured at fair value, so that gains caused by the deterioration of an entity’s own credit risk on such liabilities are no longer recognized in profit or loss. The new standard is effective for the Trust for its fiscal year beginning January 1, 2018. The Manager has currently determined that the impact to the Trust may require additional disclosures related to changes to the classification of certain financial instruments to align with the classifications under IFRS 9. Adoption of the standard will not impact net assets attributable to holders of redeemable units.
Notes to the Financial Statements (cont’d)

– 36 –
Skylon Growth & Income Trust
Annual Financial Statements - December 31, 2017
3. CRITICAL ACCOUNTING JUDGMENTS AND ESTIMATESThe preparation of financial statements in accordance with IFRS requires management to make judgments, estimates and assumptions that affect the application of accounting policies and reported amounts of assets and liabilities at the reporting date and the reported amounts of income and expenses during the reporting year. The following discusses the most significant accounting judgments and estimates that the Trust has made in preparing its financial statements:
Fair value measurement of investments and derivatives not quoted in active market The Trust may, from time to time, hold financial instruments that are not quoted in active markets, such as unlisted securities, private securities or
derivatives. Unlisted securities are valued based on price quotations from recognized investment dealers, or failing that, their fair value is determined by the Manager on the basis of the latest reported information available. The fair value of private securities is determined by using valuation models that may be based, in part, on assumptions that are not supported by observable market inputs. These methods and procedures may include, but are not limited to, performing comparisons with prices of comparable or similar securities, obtaining valuation related information from issuers and/or other analytical data relating to the investment and using other available indications of value. These values are independently assessed by the Manager to ensure that they are reasonable. However, because of the inherent uncertainty of valuation, the estimated fair values for these securities may be materially different from the values that would have been used had a ready market for the investment existed. The fair values of private securities are affected by the perceived credit risks of the issuer, predictability of cash flows and the length of time to maturity.
Valuation models use observable data, to the extent practicable. However, areas such as credit risk (both own and counterparty); volatilities and correlations require the Manager to make estimates. Changes in assumptions about these factors could affect the reported fair values of financial instruments.
The Trust considers observable data to be market data that is readily available, regularly distributed and updated, reliable and verifiable, not proprietary, and provided by independent sources that are actively involved in the relevant market.
The fair value of investments in underlying funds that are not quoted in active markets is determined primarily by reference to the latest available net asset value of such units for each underlying fund, as determined by the underlying funds’ managers.
Classification and measurement of investments and application of the fair value option In classifying and measuring financial instruments held by the Trust, the Manager is required to make significant judgments about whether or not the
business of the Trust is to invest on a total return basis for the purpose of applying the fair value option for the financial assets under IAS 39 Financial Instruments: Recognition and Measurement. The most significant judgment made includes the determination that the fair value option can be applied to those investments that are not HFT.
4. REDEEMABLE UNITSRedeemable units issued and outstanding represent the capital of the Trust.
The relevant changes pertaining to subscription and redemption of the Trust units are disclosed in the Statements of Changes in Net Assets Attributable to Holders of Redeemable Units. In accordance with the objectives and risk management policies outlined in Note 1 and 11, the Trust endeavors to invest subscriptions received in appropriate investments while maintaining sufficient liquidity to meet redemptions through utilizing a short-term borrowing facility or disposal of investments when necessary.
The Trust is authorized to issue an unlimited number of transferable units of one class, each of which represents an equal, undivided interest in the net assets of the Trust. Commencing April 30, 2008, unitholders are entitled to redeem their units outstanding monthly (the “Monthly Redemption”). Monthly redemption price per unit is equal to the lesser of: (a) 94% of the market price per unit on the applicable monthly valuation date (10 day average trading price); and (b) the “closing market price” per unit on the applicable monthly valuation date.
On April 14, 2009, the Trust received approval of the unitholders to add an annual right of unitholders to redeem their units (the “Annual Redemption”). As a result of these changes, commencing December 31, 2010, the unitholders have the right to redeem their units on December 31 of each year at the NAV.
The Trust endeavours to provide unitholders with monthly distributions which were initially targeted to total $0.70 per unit per annum representing a yield of 7.0% based on the $10.00 per unit issue price. Distributions commenced on March 31, 2004 and are expected to continue until termination of the Trust.
Units are listed for trading on the TSX under the symbol SKG.UN. Unitholders can purchase or sell units at any time the TSX is open for business.
Notes to the Financial Statements (cont’d)

– 37 –
Skylon Growth & Income Trust
Annual Financial Statements - December 31, 2017
As at December 31, 2017, the fair value of the Trust’s net assets attributable to holders of redeemable units based on the TSX closing market price was $38,383,820 (December 31, 2016 - $39,828,411).
Redeemable unit transactions information appears in the Trust Specific Notes to Financial Statements.
The Trust did not file a notice of intention to make a Normal Course Issuer Bid for 2016.
When units of the Trust are redeemed at a price per unit which is (greater) or lower than the net asset value per unit, the difference is included in “Gain (loss) on redemption” in the Statements of Comprehensive Income.
5. FEES AND OTHER EXPENSESManagement feesThe Trust pays to the Manager an annual fee equal to 1.10% of the NAV of the Trust calculated and payable monthly, plus applicable taxes, and an amount equal to the Service Fee payable by the Manager to registered dealers.
Administrative feesThe Trust is also responsible for all of its expenses, plus applicable taxes, incurred in connection with its operations and administration (fees shown as administration fees include: trustee fees, transfer agency, custody and accounting fees). Audit fees, legal fees and independent review committee fees are disclosed separately.
Service feesThe Manager will pay to registered dealers of the Trust an annual service fee (the “Service Fee”) of 0.40% of the NAV per unit for units held by clients of the sales representatives of the registered dealers, calculated and payable quarterly in arrears, plus applicable taxes.
6. MARKET PURCHASE PROGRAMIn accordance with the Trust’s prospectus, and to enhance liquidity and to provide support to the units, the Trust has a mandatory market purchase program under which the Trust, subject to exceptions contained in the Trust Agreement and in compliance with any regulatory requirements, is obligated to purchase its own units for cancellation. If, on any business day, the closing market price of the Trust’s units (the “Reference Closing Price”) is less than 95% of the NAV per unit determined on that date, the Trust will offer to purchase for cancellation any units offered in the market at or below the Reference Closing Price on the following business day. The maximum number of units to be purchased in any three-month period will not be over 1.25% of the number of units outstanding at the beginning of such period. During the year ended December 31, 2017, the Trust did not purchase any units for cancellation under the market purchase program (2016 – 28,200 units at a cost of $211,769).
7. SECURITIES LENDINGThe Trust may engage in securities lending. Under a Securities Lending Agreement: (i) the borrower will pay to the Trust a negotiated securities lending fee and will make compensation payments to the Trust equal to any distributions received by the borrower on the securities borrowed; (ii) the securities loan must qualify as “securities lending arrangements” for the purposes of the Tax Act; and (iii) the securities loan must be fully collateralized. The minimum level of collateralization will be 102%. The amounts for securities loaned and the collateral as well as reconciliation between gross securities lending revenue and securities lending revenue received by the Trust appear on the Trust Specific Notes to Financial Statements, if applicable. Revenue from securities lending is included in “Securities lending revenue” in the Statements of Comprehensive Income and any cash collateral received or cash collateral payable is included in the Statements of Financial Position in “Cash collateral received for securities on loan” or “Payable for cash collateral under securities lending”.
For more information relating to securities loaned and the collateral received refer to the Trust Specific Notes to Financial Statements.
8. TAXATIONThe Trust qualifies as a mutual fund trust under the Income Tax Act (Canada). All of the Trust’s net income for tax purposes and sufficient net capital gains realized in any year are required to be distributed to unitholders such that no income tax is payable by the Trust. As a result, the Trust does not record income taxes. Since the Trust does not record income taxes, the tax benefit of capital and non-capital losses has not been reflected in the Statements of Financial Position as a deferred income tax asset. Income tax on net realized capital gains not paid or payable will generally be recoverable by virtue of refunding provisions contained in the Income Tax Act (Canada) and provincial income tax legislation, as redemptions occur. Occasionally, the Trust may distribute more than it earns. This excess distribution is a return of capital and is not taxable to unitholders.
Notes to the Financial Statements (cont’d)
– 38 –
Skylon Growth & Income Trust
Annual Financial Statements - December 31, 2017
Refer to Trust Specific Notes to Financial Statements for further information relating to Loss Carry Forwards.
9. REINVESTMENT OF DISTRIBUTIONSThe Trust has adopted a Distribution Reinvestment Plan (“DRIP”) therefore at the election of each unitholder distributions are automatically reinvested in additional units of the Trust, without charge, at a price equal to the average trading price of the units on the TSX for the five trading days immediately preceding the relevant Distribution Date. The Manager may terminate the DRIP in its sole discretion, upon not less than thirty days’ written notice to the DRIP participants.
10. RELATED PARTY TRANSACTIONSThe Trust may have direct or indirect holdings in CI Financial Corp. or its affiliates or other funds managed by the Manager as identified in the Schedule of Investment Portfolio and the Trust Specific Notes to Financial Statements.
Inter-Fund TradingInter-fund trading occurs when a Fund purchases or sells a security of any issuer from or to another Fund managed by the Manager. These transactions are executed through market intermediaries and under prevailing market terms and conditions. The Independent Review Committee reviews such transactions during scheduled meetings. During the years ended December 31, 2017 and 2016, the Trust executed inter-fund trades.
11. FINANCIAL INSTRUMENTS RISKRisk ManagementThe Trust is exposed to a variety of financial instruments risks: credit risk, liquidity risk and market risk (including other price risk, currency risk and interest rate risk). The level of risk to which the Trust is exposed to depends on the investment objective and the type of investments held by the Trust. The value of the investments within the portfolio can fluctuate daily as a result of changes in prevailing interest rates, economic and market conditions and company specific news related to investments held by the Trust. The Manager of the Trust may minimize potential adverse effects of these risks on the Trust’s performance by, but not limited to, regular monitoring of the Trust’s positions and market events, diversification of the investment portfolio by asset type, country, sector, term to maturity within the constraints of the stated objectives, and through the usage of derivatives to hedge certain risk exposures.
Concentration RiskConcentration risk arises as a result of the concentration of exposures within the same category, whether it is a geographical allocation, product type, industry sector or counterparty.
Credit RiskCredit risk is the risk that a security issuer or counterparty to a financial instrument will fail to meet its financial obligations. The fair value of debt instruments includes consideration of the credit worthiness of the debt issuer. The fair value of debt instruments as shown on the Schedule of Investment Portfolio represents the credit risk exposure of the Trust. Credit risk exposure for derivative instruments, if applicable, is based on the Trust’s unrealized gain of the contractual obligations with the counterparty as at the reporting date. The credit rating of a counterparty to a derivative instrument is disclosed in the Schedule of Investment Portfolio or in the Trust Specific Notes to Financial Statements. The credit risk exposure of the Trust’s other assets is represented by their carrying amount as disclosed in the Statements of Financial Position.
Credit ratings for fixed income securities, preferred securities and derivative instruments are obtained from S&P Global Ratings, where available, otherwise ratings are obtained from: Moody’s Investors Service or Dominion Bond Rating Service, respectively. Credit ratings can be either long-term or short-term. Short-term credit ratings are generally assigned to those obligations and derivative instruments considered short-term in nature.
Notes to the Financial Statements (cont’d)

– 39 –
Skylon Growth & Income Trust
Annual Financial Statements - December 31, 2017
The table below provides a cross-reference between the long-term credit ratings disclosed in the Credit Rating table inclusive of the short-term credit ratings disclosed in the derivatives schedule in the Schedule of Investment Portfolio.
Credit Rating as per Credit Risk Table Credit Rating as per Derivatives SchedulesAAA/Aaa/A++ A-1+AA/Aa/A+ A-1, A-2, A-3A B, B-1BBB/Baa/B++ B-2BB/Ba/B+ B-3B CCCC/Caa/C++ -CC/Ca/C+ -C and Lower DNot Rated WR
Cash balances as disclosed in the Statements of Financial Position are maintained by the Custodian. The Manager monitors the credit worthiness of the Custodian on a regular basis. The credit rating of the Custodian as at December 31, 2017 was AA- (December 31, 2016 – AA-).
All transactions executed by the Trust in listed securities are settled / paid for upon delivery using approved brokers. The risk of default is considered minimal, as delivery of securities sold is only made once the broker has received payment. Payment is made on a purchase once the securities have been received by the broker. The trade will fail if either party fails to meet its obligation.
Liquidity RiskLiquidity risk is the risk that the Trust may not be able to settle or meet its obligations, on time or at a reasonable price. The Trust is exposed to monthly and annual cash redemptions of redeemable units. Therefore, the Trust aims to invest the majority of its assets in investments that are traded in active markets and can be readily disposed of. In addition, the Trust aims to retain sufficient cash and cash equivalent positions to maintain liquidity. From time to time, the Trust may enter into derivative contracts or invest in unlisted securities that may not trade in an organized market and may be illiquid. All financial liabilities are due within three months.
Market RiskThe Trust’s investments are subject to market risk which is the risk that the fair value of future cash flows of a financial instrument will fluctuate due to changes in market conditions.
Other Price Risk Other price risk is the risk that the value of financial instruments will fluctuate as a result of changes in market prices (other than those arising from
currency risk or interest rate risk). The value of each investment is influenced by the outlook of the issuer and by general economic and political conditions, as well as industry and market trends. All securities present a risk of loss of capital. Except for options written, future contracts sold short and investments sold short, the maximum risk resulting from financial instruments is equivalent to their fair value.
Other assets and liabilities are monetary items that are short-term in nature and therefore are not subject to significant other price risk.
Currency Risk Currency risk arises from financial instruments that are denominated in a currency other than the Canadian dollar, the functional currency of the Trust.
As a result, the Trust may be exposed to the risk that the value of securities denominated in other currencies will fluctuate due to changes in exchange rates. The Schedule of Investment Portfolio identifies all bonds and derivative instruments denominated in foreign currencies. Equities traded in foreign markets are exposed to currency risk as the prices denominated in foreign currencies are converted to the Trust’s functional currency to determine their fair value.
Notes to the Financial Statements (cont’d)
– 40 –
Skylon Growth & Income Trust
Annual Financial Statements - December 31, 2017
Interest Rate Risk Interest rate risk is the risk that the fair value of interest-bearing investments and interest rate derivative instruments will fluctuate due to changes in
prevailing levels of market interest rates. As a result, the value of the Trust will be affected by changes in applicable interest rates as it invests in debt securities and income trusts. If interest rates fall, the fair value of existing debt securities may increase due to increase in yield. Alternatively, if interest rates rise, the yield of existing debt securities may decrease which may then lead to a decrease in their fair value. The magnitude of the decline will generally be greater for long-term debt securities than for short-term debt securities.
Interest rate risk also applies if the Trust invests in convertible securities. The fair value of these securities varies inversely with interest rates, similar to other debt securities. However, since they may be converted into common shares, convertible securities are generally less affected by interest rate fluctuations than other debt securities.
Fair Value HierarchyThe Trust is required to classify financial instruments measured at fair value using a fair value hierarchy. Investments whose values are based on quoted market prices in active markets are classified as Level 1. This level may include publicly traded equities, exchange traded and retail mutual funds, exchange traded warrants, futures contracts, traded options, American depositary receipts (“ADRs”) and Global depositary receipts (“GDRs”).
Financial instruments that trade in markets that are not considered to be active but are valued based on quoted market prices, dealer quotations or alternative pricing sources supported by observable inputs are classified as Level 2. These may include fixed income securities, mortgage backed securities (“MBS”), short-term instruments, non-traded warrants, over-the-counter options, structured notes of indexed securities, foreign currency forward contracts and swap instruments.
Investments classified as Level 3 have significant unobservable inputs. Level 3 instruments may include private equities, private term loans, private equity funds and certain derivatives. As observable prices are not available for these securities, the Trust may use a variety of valuation techniques to derive their fair value.
The Trust’s policy is to recognize transfers into and out of the fair value hierarchy levels as of the date of the event or change in circumstances giving rise to the transfer.
Details of the Trust’s exposure to concentration risk are available in the Trust Specific Notes to Financial Statements.
Details of the Trust’s exposure to financial instruments risks including the fair value hierarchy classification are available in the Trust Specific Notes to Financial Statements section of the financial statements.
Notes to the Financial Statements (cont’d)

– 41 –
Skylon Growth & Income Trust
Annual Financial Statements - December 31, 2017
Certain names, words, phrases, graphics or designs in this document may constitute trade names, registered or unregistered trademarks or service marks of CI Investments Inc. ®CI Financial, CI Investments, the CI Investments design and Skylon are registered trademarks of CI Investments Inc. You can get additional copies of these Financial Statements at your request, and at no cost, by calling 1-800-792-9374, by emailing [email protected], or by asking your representative. This document, and other information about the Trust, is available at the CI Investments Inc. website at www.ci.com, or at www.sedar.com.
Legal Notice

– 42 –Annual Financial Statements - December 31, 2017
Manager and TrusteeCI Investments Inc.2 Queen Street East, Twentieth Floor
Toronto, Ontario
M5C 3G7
Phone: (416) 364-1145
Fax: (416) 364-6299
Toll Free: 1-800-268-9374
www.ci.com
Custodian RBC Investor Services Trust155 Wellington Street West
5th Floor
Toronto, Ontario
M5V 3L3
AuditorPricewaterhouseCoopers LLP18 York Street
Suite 2600
Toronto, Ontario
M5J 0B2
Registrar & Transfer AgentComputershare Investor Services Inc.100 University Avenue
8th Floor
Toronto, Ontario
M5J 2Y1
ListedThe Toronto Stock Exchange
Ticker SymbolSKG.UN
For more information on the Trust, visit us online at www.ci.com.
Trust Information

2 Queen Street East, Twentieth Floor, Toronto, Ontario M5C 3G7 I www.ci.comHead Office / Toronto416-364-1145 1-800-268-9374 Skylon_6968_AR_03/18
Client ServicesEnglish: 1-800-563-5181 French: 1-800-668-3528


![REGULATIONS - IAS Plus — IFRS, global financial ...statements or separate financial statements, as defined in IAS 27 Consolidated and separate financial statements. 4 [Deleted] 5](https://img.pdfslide.net/doc/110x75/5f0e79fb7e708231d43f6eed/regulations-ias-plus-a-ifrs-global-financial-statements-or-separate-financial.jpg)